Embed Size (px)
Citation preview
An Early Assessment of Residential Mortgage Performance in China
Yongheng Deng*
University of Southern California School of Policy, Planning and Development
650 Childs Way, RGL 201A Los Angeles, CA 90089-0626, USA
Della Zheng University of Southern California
School of Policy, Planning and Development 650 Childs Way
Los Angeles, CA 90089-0626, USA [email protected]
and
Changfeng Ling Tsinghua University
Real Estate Research Institute Heshanheng Building #201 Beijing, 100084, P.R. China
February 2004
* Yongheng Deng gratefully acknowledges financial support from the Lusk Center for Real Estate at USC.
Abstract
The residential mortgage market becomes a financial engine for the booming residential housing development and sustained economic growth in China. Our study provides the first rigorous empirical analysis on the earlier performance of residential mortgage market in China based on a unique micro dataset of mortgage loan history collected from a major residential mortgage lender in China. We found that while the option theory fails to explain prepayment and default behavior in the residential mortgage market in China, other non-option theory related financial economic factors play major roles in determining the prepayment and default risks in China. We also found that borrower’s characteristics are significant in determining prepayment behavior, hence may be used as an effective tool for screening potential high risk borrowers in the loan origination process. Adopting a risk-based pricing in residential mortgage lending in China can improve the efficiency of the market, and enhance the credit availability to the most needed households, i.e., the younger households, blue-collar workers, lower income households, and help them become homeowners.
JEL Codes: G21, R2, D12, C41 Keywords: Chinese Mortgage Market, Prepayment and Default, Empirical Hazard Model, Econometric Analysis
1. Introduction
The first residential mortgage loan in China was issued by the China Construction Bank
(CCB) in 1986. During the next twelve-year period, mortgage market in China grew very slowly.
By the end of 1997, total outstanding mortgage balance in China was only around RMB Yuan 22
billion. 2 In 1998, the State Council of the People’s Republic of China published several
administrative laws to extend housing reform and expedite housing construction. Residential
mortgage lending began to expand at an accelerating rate since 1998 in line with reforms aiming
to end state-controlled welfare housing system.3 In 1999, China's residential mortgage loans to
individual households exceeded RMB Yuan 126 billion, doubled the previous year’s level. By
August 2002, the total outstanding balance of the residential mortgages reached RMB Yuan 763
billion, increased by 27 percent compared to the balance at the beginning of 2002, 34 times
compared to the balance at the end of 1997. More than half of the newly issued real estate loans
during 2002 are residential mortgage loans.4 The residential mortgage market becomes a financial
engine for the booming residential housing development and sustained economic growth in China.
Recently, there are active debates among policy makers, scholars and experts in the
banking industry about the necessity and feasibility of developing mortgage-backed security
(MBS) market in China. One of the key feasibility conditions for setting up a MBS market is the
ability to manage the duration risks of mortgage instruments. It is well known that mortgage
instruments are exposed to prepayment and default risks, which in turn create uncertainty about
the duration of the securities backed-up by these mortgage instruments, and hence create
difficulty in pricing MBS.
Despite the rapid growth of the residential mortgage market and potential of developing
2 One US dollar exchanges for about eight RMB Yuan. 3 Prior to 1998, over ninety percent of the urban residential housing units in China were developed and owned by state-owned enterprises (Dan Wei). These housing units were leased to the employees at very low rent as part of welfare for the state-run enterprises’ employees and collective owned enterprises’ employees. Under the PRC State Council 1998 Administrative Law, state-owned enterprises will no longer be allowed to allocate welfare housing to their employees after December 31, 1999. 4 See People’s Daily, 11/22/2002, http://www.smxfdc.com/news/list.asp?id=282.
2
MBS market in China, there have been virtually no empirical studies on the performance of this
newly developed important sector of the financial market in China, largely attributing to the
immature regulatory environment and sparse mortgage data. To our best knowledge, this is the
first rigorous empirical study of the residential mortgage performance in China based on a unique
micro dataset of residential mortgage loan history collected by a major residential mortgage
lender in China.
In this paper, we analyze the risks of residential mortgage prepayment and default in
China in a competing risks proportional hazard framework. We focus our study on following
three areas:
1. What are major determinants to Chinese borrowers’ prepayment or default decision?
2. Who are high risk borrowers in the Chinese residential mortgage market?
3. To what extent efficiency and/or equity of the current residential mortgage market in
China may be improved?
We find that:
1. while the “option theory” 5 does not play significant role in determining mortgage
prepayment and default in China, other financial factors, macroeconomic environment,
and risk sharing mechanism are crucial to borrowers’ decision. For example, equity
position, stock market investment opportunities, household income, consumers’
confidence, and the possible construction period risks are among the major determinants
driving mortgage prepayments in China;
2. borrowers’ characteristics, such as borrower’s age, occupation, job position and education
can serve as important indicators to separate high risk borrowers from the low risk
population; and
3. introducing a risk-based pricing to the residential mortgage market can improve the
5 The “option theory” developed by Black and Scholes (1973) and Merton (1973) has been adopted widely to explain mortgage prepayment and default risks in the United States and other developed countries. A detailed discussion of the option theory and its application to mortgage valuation will be discussed in the following section.
3
efficiency of the mortgage market and enhance the mortgage credit availability to the
much needed population, such as young and lower-income households and blue-collar
workers in China.
The remaining of the paper is organized as following: section 2 discusses the institutional
background of the current residential mortgage market in China, section 3 reviews related
literatures and discusses the econometric model used in this analysis; section 4 describes the
mortgage loan dataset whereas section 5 discusses estimation results. Conclusions and policy
implications are discussed in section 6.
2. Current Residential Mortgage Market in China
The current residential mortgage market in China is dominated by four major lenders –
Industrial and Commercial Bank of China (ICBC), China Construction Bank (CCB), Bank of
China, and Agricultural Bank of China. By the end of 2002, ICBC’s total outstanding mortgage
balance was RMB Yuan 258 billion, which accounted for about 36% of the market share in China.
Currently there are three categories of residential mortgages in China – individual
account housing loans, authorized housing loans, and combined housing loans. Individual account
housing loans refer to loans funded by bank’s consumer credit funds to individual households to
facilitate their housing purchases. Authorized housing loans refer to loans granted by the bank
with the authorization of the public reserve fund management department, using the public
reserve deposits as the source of funding. Combined housing loans refer to loans granted to
individual home buyers, using both public reserve deposits and bank’s consumer credit funds as
sources of funding.6
Basic requirements. The loan amount shall not exceed 80 percent of the appraisal value or
the purchase price of the house, whichever is smaller, and payment to income ratio should not
exceed 70%. Applicants should provide documents for other assets including tax return, bank 6 See http://www.bank-of-china.com/english/a1personal/a1_2_1.shtml for a more detailed discussion.
4
statements on saving account, proof of vehicle ownership and its value, proof of stock market
investment, and proof of value of other property. The ratio of total other assets to mortgage loan
should be greater than or equal to 25 percent. The mortgage term shall not exceed 30 years for
RMB mortgage loans, and borrower’s age plus mortgage term should not exceed 65 years.
Guarantees. The lender determines the types of guarantee required for a housing loan.
Types of guarantees include holding property of the borrower or property of a third party (co-
borrower) as collateral; using joint asset account with a third party (co-borrower) as collateral;
and commercial credit insurance purchased by the borrower.
Mortgage interest rate and payment. Mortgage interest rates shall be determined by the
People’s Bank of China. Starting from June 19, 1999, mortgage rates for all long term mortgages
(loan term is greater than 5 years) should follow 6-month bank legal lending rate set by the
People’s Bank of China without fluctuation band. The spread between the long term (more than 5
years) and short term (5 years or less) mortgage rates is 27 basis points. If new bank legal lending
rates are published by the People’s Bank of China, the mortgage rates will be adjusted
accordingly starting from the first of January in the following year. Mortgage principal and
interest payments may be made by equal installments or by progressive installments.
Loan Application Procedure. After receiving application form filled by the applicant
together with relevant documents, the bank carries out eligibility investigation. Upon approval,
the bank and the borrower sign a mortgage contract. The borrower then opens a mortgage account
at the bank for making mortgage payment.
Most Chinese households are reluctant to have a debt. According to a survey reported by
Beijing City Survey Organization, more than 75 percent of Beijing residents are aware of the
availability of personal loans, but less than 10 percent of them have ever applied for loans.
Among the 48 applicants selected by the survey, 30 have applied for mortgage loans, 16 have
5
applied for credit card loans, and 8 have applied for car loans.7 The reasons of applying for a loan
include: convenience of life or work (56.5%); personal loan is one type of investment (34.8%);
having confidence about future financial status and enjoying life on consuming credit (26.1%);
accepting this new lifestyle (34.8%); need for credit (21.7%).8
The borrowers’ motivation of prepayment in China is quite different from what observed
in the United States or other developed countries. All residential mortgages in China are
adjustable rate mortgages (ARMs). Once the Central Bank (the People’s Bank of China)
announces a rate adjustment, this new rate will be applied to all existing mortgage loans (with
term longer than one year) starting from the beginning of the following year. Virtually all
prepayments observed in the sample are earlier payoff rather than refinance.
Presale is a popular practice in the housing market in China. Home buyers therefore may
take some risks if developers fail to deliver the properties according to the presale contracts.
Many Chinese mortgage borrowers use mortgage as an instrument to share the presale risks with
the bank. If the home buyers (mortgage borrowers) are satisfied with the properties delivered by
the developers, some of them might choose to pay off the debts as soon as they can. In case the
developer fails to satisfy the home buyer on the date of delivery, the borrowers have the option to
default the mortgage loan. In other words, the mortgage borrower has a put option to sell the
poorly constructed house to the bank at a price set by the remaining balance of the loan.
The number of default cases in China is quite small. Most of the default cases occurred in
the residential mortgage market in China are related to presale properties where the developers
fail to deliver the housing units meeting the presale contracts. In such cases, the lender takes the
loss if the net value of the housing units recovered is less than the outstanding loan balance.
7 See www.csdcw.com, September 2002. 8 See http://www.bjstats.gov.cn/gcfx/tjbgjzl/czjr/200209020010.htm.
6
3. The Option Theory and the Proportional Hazard Model
There are a large volume of literatures studying risks and performance of mortgage
lending in the United States. The existing literatures on economic behavior of residential
mortgage borrowers have reached consensus at least in the following two areas: first, the option
theory developed in the finance literature (Black and Scholes, 1973, and Merton, 1973) provides
an important theoretical framework to analyze mortgage borrowers’ prepayment and default
behavior in the US market; second, the proportional hazard model developed by Cox (Cox, 1972)
provides an important analytic tool for analyzing the dynamics of competing risks of mortgage
terminations by prepayment and default.
The Option Theory
Findley and Capozza (1977), Dunn and McConnell (1981), Buser and Hendershott (1984)
and Brennan and Schwartz (1985) are among the first to apply option theory to the mortgage
valuation. Since then, the option theory has become the predominant theoretical framework in
analyzing mortgage borrower’s prepayment and default behavior in the US market. According to
the option theory, in the absence of transaction costs, a rational borrower can maximize her
welfare by refinancing her mortgage when the call (prepayment) option is “in-the-money” (that is
when the prevailing market rate of mortgage drops below the existing mortgage coupon rate).
Similarly, a borrower should default the mortgage loan if the put (default) option is “in-the-
money” (that is when the current market value of the house, serving as collateral of the mortgage
debt, drops below the current market value of the remaining mortgage balance). Hendershott and
Van Order (1987) and Kau and Keenan (1995) provided comprehensive surveys on these
theoretical literatures.
Schwartz and Torous (1989), Deng (1997) and Stanton and Wallace (1999) among others
demonstrated empirically the importance of the financial option values to borrowers’ exercising
of prepayment or default options based on historical pool or loan level mortgage data in the US
7
market. These empirical literatures found strong evidence that the market value of the call
(prepayment) option is statistically significant and positively associated with mortgage
termination by refinance; and the market value of the put (default) option is statistically
significant and positively associated with mortgage default risk.
The empirical literature also found that mortgage borrowers may not ruthlessly exercise
the prepayment or default options as predicted by the option theory. In other words, other non-
financial option related factors, such as transaction costs of refinance, borrower’s credit
worthiness, household’s income and wealth, unemployment risks, divorce rates, etc., also serve as
important determinants to trigger or deter the borrowers’ decision on prepayment and default.
(See Stanton, 1995, Quigley and Van Order, 1995, for discussions on impacts of transaction costs
and trigger events in mortgage prepayment exercise.)
The Proportional Hazard Model
Green and Shoven (1986) are among the first to apply the Cox proportional hazard model
to study mortgage prepayments due to interest rate movements. Since then, researchers have
developed more sophisticated and realistic applications of the Cox proportional hazard model to
study mortgage termination behaviors (See Schwartz and Torous, 1989, Deng, Quigley and Van
Order, 2000, and Deng and Quigley, 2002, for more recent applications.)
The hazard function of the Cox model is defined as the product of a baseline hazard
function and a set of proportional factors such that
( )( ) ( ) ( )( )0; expi j j i j j i j j ij jh t z t h t z t ' ,β= j = 1, 2, (1)
where is a baseline hazard function that describes the overall shape of the mortgage
termination risks by borrowers’ prepayment or default decision;
( )0 j i jh t
( )j ijz t is a vector of
proportional factors capturing time-varying or time-invariant covariates. These covariates reflect
8
market values of the financial options as well as other financial/economic market variations and
mortgage borrowers’ characteristics; j indicates prepayment (if j=1) or default (if j=2) event.
In this paper, we adopt the Cox proportional hazard model to test the extend to which the
option theory can explain the mortgage borrowers’ behavior in China, as well as to identify major
determinants of the mortgage prepayment and default risks in Chinese residential mortgage
market. We control for over 20 time-varying and time-invariant covariates including major
financial economic determinants as well as other indicators of borrower characteristics and loan
risks.
4. The Data
The empirical analysis is based upon a unique micro mortgage dataset with loan history
information collected by a major residential mortgage lender in Beijing, China. The original
dataset includes 75,536 single-family mortgage loans issued between March 1998 and October
2002. All loans are adjustable rate mortgages. Most of them are constant payment mortgage loans.
The data collecting period ends in October 2002. For each loan, the available information
includes the year and month of origination and termination (if a loan has been terminated),
appraisal value of the property at origination, original loan amount, initial loan-to-value ratio,
mortgage contract interest rate, term to maturity, and indicators of prepayment or default event.
The dataset also provides valuable information about the borrowers’ characteristics, including
household monthly income, borrower’s age, gender, marital status, education, occupation, and job
position.
Following Deng, Quigley and Van Order (2000), we compute a time-varying path of
current equity to market value ratio (i.e. the ratio between the contemporaneous equity value and
the market value of the property) for each loan starting from its origination till termination (or
censored point), by using Beijing real estate indices together with property value at loan
origination and contemporaneous market value of the remaining mortgage balance.
9
More specifically, the ratio of equity to market value, E of the property i in the kth month
since purchase is
( )
, , ,,
,
,
, ,1
,
,
,1
i i i
i
i
i i
i
i
i i
i i
i i
i k i m ki k
i k
ki k i
TM ki
i m k tt k
M VE
M
IM C
I
PVm
τ
τ
τ
τ
τ
+
+
−
+= +
−=
⎛ ⎞= ⎜ ⎟⎜ ⎟
⎝ ⎠
=+
∑
(2)
where M is the current market value of the property, C is the original purchasing value of the
property (at time τ), Iτ and Iτ+k are house price indexes at time τ and k month thereafter,
respectively, V is the current value of the mortgage, TM is the mortgage contract term, P is the
monthly mortgage principal and interest payment, and m is the current market rate of the
mortgage.
We also compute a time-varying covariate of call (prepayment) option (i.e., the present
value of the differences in remaining monthly payments calculated using the mortgage note rate
and the contemporaneous market rate) for each loan observation. 9 However, since all residential
mortgage loans issued in Beijing are adjustable rate mortgages (ARM) without cap, our data
analysis indicates that financial call option virtually has no economic value to Chinese mortgage
borrowers. So far, there has been no refinance-driven prepayment reported in Chinese mortgage
market. Therefore, at least for now, the financial option theory cannot explain the observed
prepayment behavior in Chinese residential mortgage market. We opt to drop the call option
covariate from our empirical analysis.
In addition, we match macroeconomic variables including slope of yield curve, Shanghai
Stock Exchange Index, and local unemployment rates to the loan history data. The first two
variables serve as proxies of alternative investment opportunities for homeowners. The third
9 See Deng, Quigley and Van Order (2000) for a discussion of computing the time-varying covariates of call option value for each loan.
10
variable, local unemployment rates, has been used as “trigger event” variable in previous
mortgage literature reflecting financial hardship of the borrower due to unexpected event (see
Deng, Quigley and Van Order, 1996, for a discussion). It may also serve to reflect borrowers’
confidence toward general economic condition and household financial security.
Our analysis is confined to mortgage loans with level-payment, and five-year, ten-year,
fifteen-year or twenty-year term. There are only 313 loans originated in 1998, among which 29
were defaulted due to a development project dispute. Such abnormally high default rates caused
by a project dispute will bias our estimation of borrower’s behavior. Therefore we decide to
exclude the 313 loans originated in 1998 from our analysis. The final sample contains 65,457
loan records, among which, 4,621 loans (about 7 percent) were prepaid during the sampling
period, 262 loans (about 0.4 percent) were defaulted during the sampling period, and 60,574
(about 92.5 percent) were still active at the end of data collecting period.
Table 1 presents means and standard deviations of the continuous covariates measured at
origination and termination of the mortgage loans. As we expected that current equity to market
value ratios are lower at origination and higher at termination for all loans due to mortgage
amortization process. However, the statistics indicate that loans that were eventually defaulted are
associated with the lowest equity ratios at origination, which suggests that borrowers with higher
loan to value (LTV) ratios at origination may carry higher default risks. On the other hand, those
loans that are eventually prepaid have higher equity to market value ratio than the rest of the
loans in the pool. Such observation may suggest that borrowers with less liquidity constrain in
China are likely to payoff their mortgage earlier. The statistics also reveal a positive term
structure scenario (increasing in slopes of yield curve) and increasing in unemployment rates
during the sampling period. On the other hand, the Stock Index is declining during the sampling
period. The statistics further show that those loans eventually prepaid are associated with smaller
loan amount at origination, while those loans eventually defaulted are associated with larger loan
amount at origination. Finally, the analysis reveals that older borrowers have higher propensity to
11
prepay or default the mortgage.
Table 2 presents the number of loans in the sample stratified by major categorical
covariates (in seven separate panels) and by loan status (in three columns). It also presents
percentage of loans by prepayment, default and other (censored) within each sub-categories
(these percentage figures are reported in the parentheses in columns 1 to 3), as well as percentage
of loans for each sub-categories (these percentage figures are reported in the parentheses in
column 4).
Panel 1 of Table 2 reports the frequency statistics separated by loan origination years. The
residential mortgage market in China took off rapidly since the 1998 administrative laws to
extend housing reform and expedite housing construction issued by the State Council of the
People’s Republic of China. Only 4,423 loans (less than 7 percent) in the final sample were
originated in 1999. Newly issued residential mortgage loans were more than quadruple to 19,175
(about 29 percent) in 2000, almost 6 times to 25,497 (39 percent) in 2001.
The frequency statistics also indicate that loans originated in 1999 have much higher
prepayment rates (12.16 percent) than loans originated after 1999 (9.9 percent for loans
originated in 2000, 7.59 percent for 2001, and 1.52 percent for 2002). Default risk in residential
mortgage lending in China is quite low. For all groups, the default risk is less than one percent.
Loans originated in 2000 have the highest default rate (0.9 percent) which is more than 3 times
compared to the loans originated in 2001 and 22.5 times compare to those originated in 2002.
Panel 2 indicates that about 69 percent of the borrowers are from the high income
households. The low income borrowers, who only account for 5.45 percent, have the highest
prepayment rate at 7.68 percent; whereas the median income households are the most reluctant to
prepay. The default risk is generally less than one percent for all of the sub-categories, while the
rate associated with high-income households is about 18 times higher than the low and median-
low income groups, and 5 times higher than the median and median-high income groups.
Over three-quarters of the borrowers belong to age cohort under 40. Panel 3 indicates
12
that borrowers over 40 years old are more likely to pay off their loans earlier than those under 40.
Almost 10 percent of the borrowers over 40 years old cohort prepaid, while only 6 percent of
borrowers under 40 prepaid. The default risk associated with borrowers over 40 is about 1.7 times
higher than borrowers under 40.
About 55 percent of borrowers are single, who have both higher prepayment and default
risks. The default risk associated with single borrowers is more than quadrupled compared to
married couples.
Borrowers with higher education are more likely to take advantage of mortgages. Over 60
percent of borrowers have college education, and only 3.5 percent of borrowers never go beyond
primary schools. Borrowers with only primary educations have the highest default risk among all
borrowers’ categories.
About 40 percent of the borrowers are self-employees, 22 percent are in business and
trade, 10 percent are in education and research, 9 percent are in social service and the remaining
19 percent belong to others10. Among these groups, self employees have both higher prepayment
and default risks. For example, self-employed borrowers have about 4.1 times the default risks
compared to those in education and science.
Finally, white-collar workers are the majority of the borrowers. Over 60 percent of the
borrowers are managers who have relatively higher default rate (0.58 percent) than clerks and
technicians (0.13 percent and 0.07 percent, respectively).11
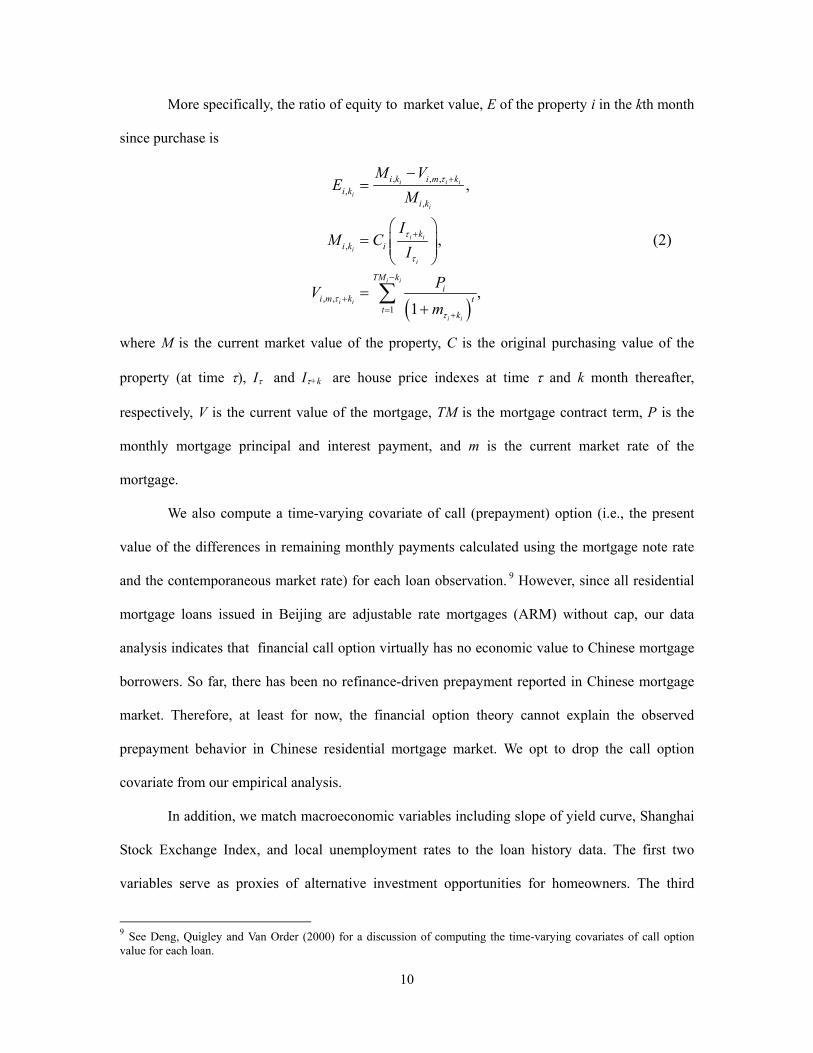
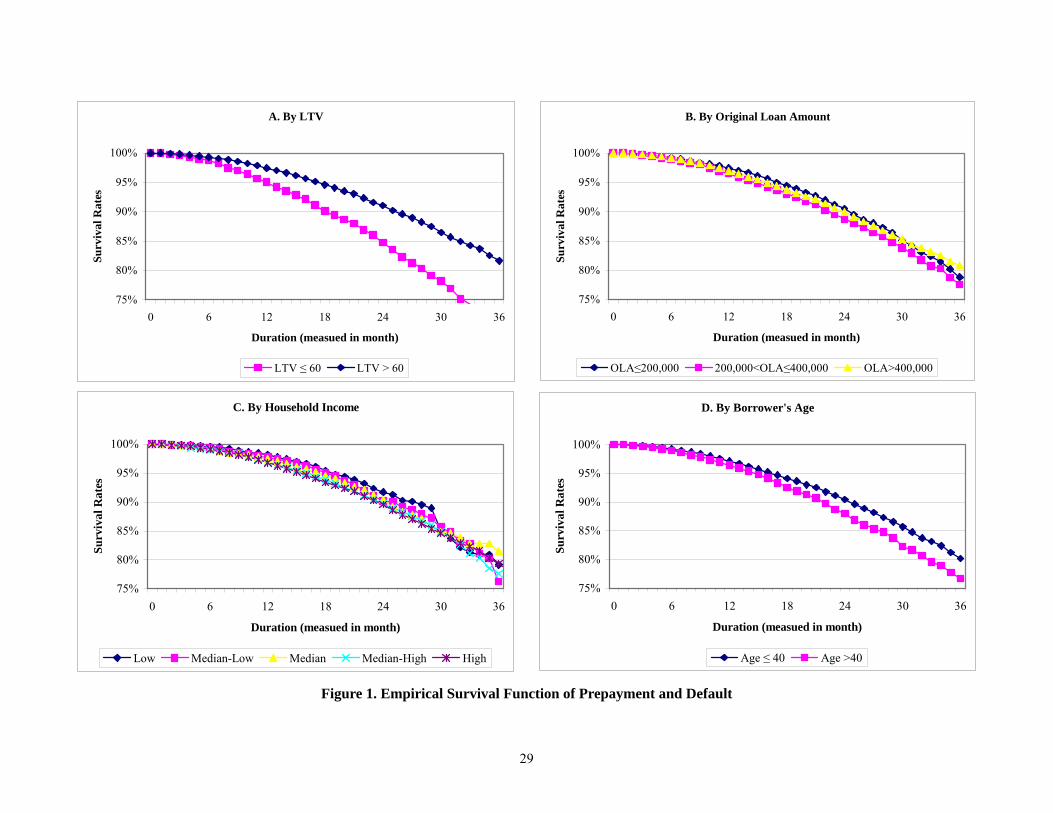
Figure 1 presents survival analysis based on the raw data by plotting joint survival curves
of prepayment and default, separated by selected loan and borrower characteristics. Panel A
presents joint survival curves of two sub-samples separated by different loan-to-value ratio (LTV)
at origination. The lower LTV group (LTV less than or equal to 60 percent) is associated with
10 The ‘others’ category in occupation includes employees working for government, finance and insurance, postal service and telecommunications, army, real estate and construction, agriculture, industry, and water, etc. 11 The ‘other’ category in job position includes military service personnel, farmer, and freelance worker, etc.
13
higher survival rates (i.e., lower termination risk) compared to the higher LTV group. Penal D
presents survival curves separated by two borrower’s age cohorts. These plots are consistent with
the descriptive statistics reported in Table 2 that elder borrowers (age over 40 years old) tend to
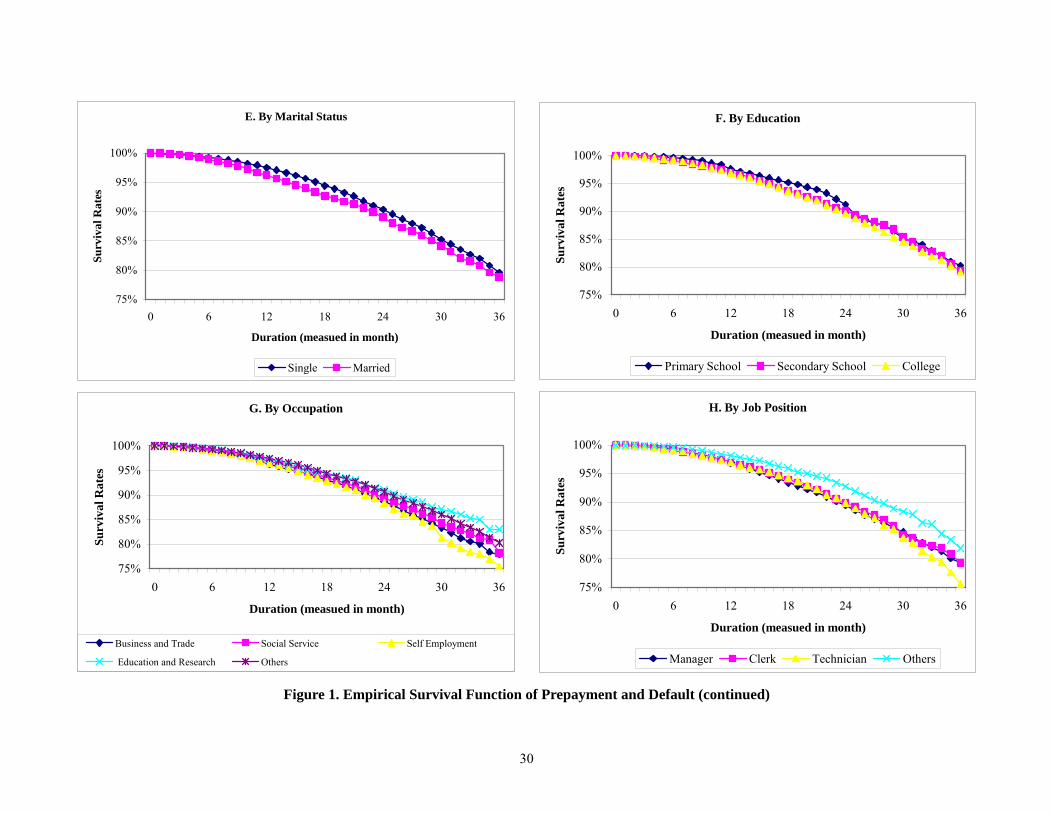
pay off their loans earlier. The other six panels present survival curves separated by original loan
amount, household income, marital status, borrower’s education, occupation and job position.
The plots of these additional raw data survival analyses suggest potential impacts of these
borrower/loan characteristics to the prepayment risk which are consistent with the descriptive
statistics reported in Table 2.
5. Empirical Results
Our empirical models are estimated based on the Cox Partial Likelihood approach (Cox,
1975). Table 3 presents estimates of two basic models of mortgage prepayment and default. As
we have discussed in previous section, currently all residential mortgages in China are adjustable
rate mortgages (ARMs). Once the Central Bank (The People’s Bank of China) announces a rate
adjustment, this new rate will be applied to all existing mortgage loans on the market without
caps starting from the beginning of the following year. As a result, the financial “call option” has
virtually no value to Chinese mortgage borrowers. This contradicts to the conventional wisdom in
the existing mortgage literature where the “call option” value is considered as a dominant factor
driving prepayments in the U.S. residential mortgage market. (See, for example, Kau, Keenan,
Muller and Epperson, 1990, for a theoretical analysis on the adjustable rate mortgages in option
theory framework. Quigley, 1987, and Stanton and Wallace, 1995, analyze the impacts of interest
rate on adjustable rate mortgage termination and valuation. Cunningham and Capone, 1990, and
Calhoun and Deng, 2002, provide empirical evidence of the association between the “call option”
value and the ARMs prepayment behavior in the U.S. market.) In fact, all prepayments observed
in the sample are earlier payoff rather than refinance. Therefore, we exclude the “call option”
value from the determinants of prepayment in our model.
14
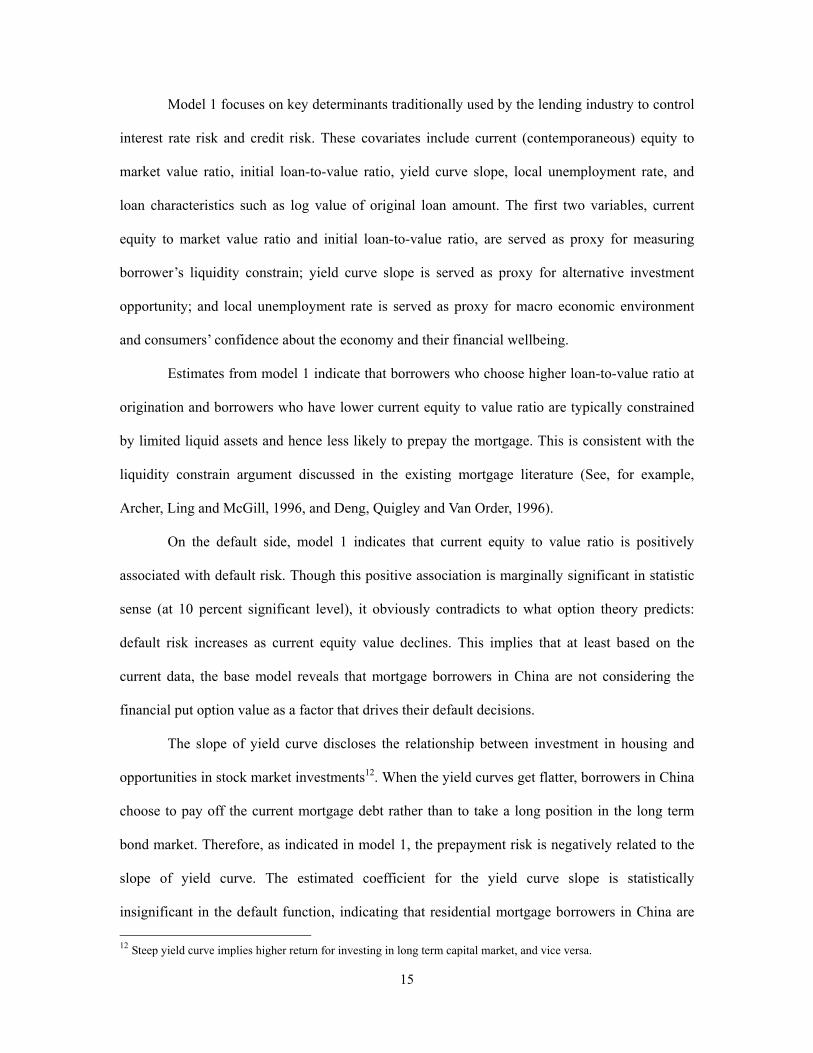
Model 1 focuses on key determinants traditionally used by the lending industry to control
interest rate risk and credit risk. These covariates include current (contemporaneous) equity to
market value ratio, initial loan-to-value ratio, yield curve slope, local unemployment rate, and
loan characteristics such as log value of original loan amount. The first two variables, current
equity to market value ratio and initial loan-to-value ratio, are served as proxy for measuring
borrower’s liquidity constrain; yield curve slope is served as proxy for alternative investment
opportunity; and local unemployment rate is served as proxy for macro economic environment
and consumers’ confidence about the economy and their financial wellbeing.
Estimates from model 1 indicate that borrowers who choose higher loan-to-value ratio at
origination and borrowers who have lower current equity to value ratio are typically constrained
by limited liquid assets and hence less likely to prepay the mortgage. This is consistent with the
liquidity constrain argument discussed in the existing mortgage literature (See, for example,
Archer, Ling and McGill, 1996, and Deng, Quigley and Van Order, 1996).
On the default side, model 1 indicates that current equity to value ratio is positively
associated with default risk. Though this positive association is marginally significant in statistic
sense (at 10 percent significant level), it obviously contradicts to what option theory predicts:
default risk increases as current equity value declines. This implies that at least based on the
current data, the base model reveals that mortgage borrowers in China are not considering the
financial put option value as a factor that drives their default decisions.
The slope of yield curve discloses the relationship between investment in housing and
opportunities in stock market investments12. When the yield curves get flatter, borrowers in China
choose to pay off the current mortgage debt rather than to take a long position in the long term
bond market. Therefore, as indicated in model 1, the prepayment risk is negatively related to the
slope of yield curve. The estimated coefficient for the yield curve slope is statistically
insignificant in the default function, indicating that residential mortgage borrowers in China are 12 Steep yield curve implies higher return for investing in long term capital market, and vice versa.
15
not considering the financial market factor as part of their default decision making process.
The initial loan to value ratio is statistically significant and positively associated with
default risk and statistically insignificant in our prepayment model. This is consistent with the
existing literature. By seeking for higher LTV ratio at origination, borrowers may reveal
important information about their potential liquidity constraint problem, which may lead to higher
default risk down the road.
On the other hand, log value of original loan amount is significant and positively
associated with both default and prepayment risks. These findings suggest that jumbo loan
borrowers are more likely to consider housing as a luxury good or investment instrument rather
than necessity of living. Jumbo loan borrowers in China are high-risk borrowers and lenders
should take precaution when they approve jumbo loans.
Unemployment rate is highly significant in determining prepayment risk and less so for
default risk. In contrast to previous findings on the residential mortgage borrowers’ behavior in
the United States,13 the empirical estimates from model 1 indicate that prepayment risk increases
as unemployment rate rises. Unemployment rate is a macro variable indicating the strength of the
macro economic environment. It also reflects Chinese borrowers’ confidence towards their future
income and financial safety and soundness. To most Chinese households, housing is a basic
necessity of living rather than luxury goods. Hence Chinese borrowers tend to pay off their
mortgage debt when they feel uncertain about future financial safety. In other words, when
Chinese households feel uncertain about their future wealth, they will choose to invest in safe
assets (housing) rather than risky assets (such as stocks and bonds). This is quite different to what
we have learnt in the U.S. mortgage market that in general unemployment rate is negatively
associated with prepayment risk.
Model 2 extends model 1 by controlling for the loan origination year, which contributes
13 Deng, Quigley and Van Order (1996) (2000), among others, found that prepayment risk declines as unemployment risk increases. This is due to liquidity constrains faced by many borrowers during the weak economy.
16
to the notable improvement of model fitness, especially in the prepayment hazard function.14
Mortgage loans originated after 2000 tend to have much higher prepayment risk compared to
those originated in 1999. Such trend continues in 2001, and then slightly declines in 200215.
During the period from 1998 to 2001, there have been several major regulations16 published
reflecting new policy of Beijing housing reform and development of residential mortgage system.
These policy changes led to swift shifts in the practice of mortgage origination process and hence
the performance of the mortgage loans originated thereafter. Other key determinants reported in
model 1 are quite robust, and most of them with improved statistical significance in model 2.
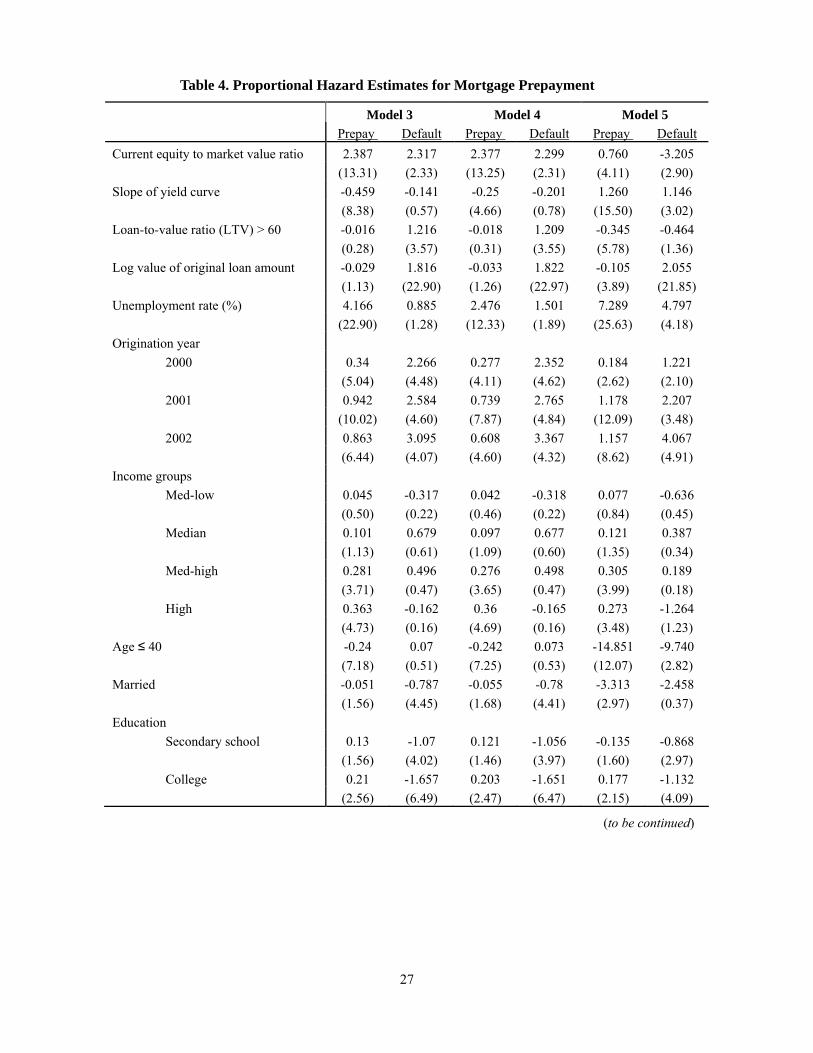
Model 3 extends model 2 by controlling for additional borrowers’ characteristics,
including borrower’s household income, age, marital status, education, occupation, and job
position. These categorical variables have different effects on prepayment and default risks. In
prepayment model, the original loan amount is no longer a significant factor after the inclusion of
borrowers’ characteristics. Such a change indicates the size of initial mortgage loan amount is
highly correlated to the borrower’s characteristics in analyzing the prepayment risks.
The results from model 3 suggest that borrower’s household income is significant and
positively associated with the prepayment risk, especially among the median-high and high
income groups. Households with higher income have more liquid assets, and consequently, have
more capability of paying off their loans earlier.
Borrower’s age is an important factor in determining prepayment risk but insignificant in
the default function. Younger borrowers have relatively lower prepayment risk as they have
longer horizon before retirement. Moreover, the younger generation prefers consumption on
14 Schwarz SBC information criteria reported in the bottom of the table provide comparison of the goodness of fit among alternative models. The smaller the value of SBC, the better fit of the model. 15 Our loan history dataset is censored in October 2002. Therefore the mortgage pool originated in 2002 in our sample has not yet reached its prepayment peak compared to the loans originated earlier with longer span of duration. 16 For example: The People’s Bank of China Bulletin on Expanding Credit Available to Residential Mortgage Lending and Supporting Residential Housing Construction and Consumption, April 7, 1998; The Office of Beijing Housing System Reform Bulletin (98) No. 265 on Policies Regarding Sales and Pricing of Public Housing Units to Employees in 1999; Bulletin on Further Improving Sales of Public Housing Units, Feb. 10, 1999; Beijing Housing Financing Center Bulletin (99) No. 117 on Adjusting Policies Regarding Residential Insured Mortgage Lending in 1999; etc.
17
credit, reflecting a generation gap in lifestyle preference in China.
Single borrowers have higher default risk (which is marginally significant in statistical
sense) compared to the married couples. In general, family is a more stable social unit than
singles, and generally, married borrowers have relatively more stable monthly income and
expense streams therefore have lower default risk compared to singles.
Borrowers with college degree have higher prepayment risk but lower default risk. Job
positions and occupations are significantly associated with prepayment decision while none of
them is significant to default. White-collar workers, such as managers and clerks tend to prepay
loan faster than blue-collar workers such as technicians, while others (which include freelance
workers, military service personnel, and farmers) is the borrower group associated with least
prepayment risk. Educators and researchers have lower propensity to prepay their mortgage loans,
due to their relatively stable income during their entire career.
Model 4 extends Model 3 with the additional control of Shanghai Stock Exchange Index
(SSEI). The inclusion of SSEI results in a notable improvement in model fitness as judged by the
Schwarz criterion (SBC). SSEI is significant in both the prepayment and default models. As the
fast growing alternative investment opportunity to the traditional deposit, investment in stock
market has been attached more and more importance in Chinese people’s financial considerations.
The effect of SSEI indicates that borrowers’ decision on earlier termination of mortgage is
basically a financial decision on investment portfolio choice. SSEI is negative and highly
significant in the prepayment function – indicating that bear market drives Chinese households to
reallocate their assets from stock market to payoff their mortgage debts. One the other hand, SSEI
is positive and significant in the default function, namely bull market is associated with higher
default risk, implying that households who stop paying their mortgage may choose to reallocate
their assets from housing to stock market.
Model 5 extends model 4 to test whether different borrowers groups may respond
differently to the macro economic shocks. We include interaction of borrower age group to the
18

slope of yield curve, unemployment rate, and stock index, as well as interactions of these macro
economic variables with borrower’s marital status and job positions.
The results of model 5 suggest that, in prepayment behavior, younger borrowers, married
borrowers and office managers and workers are less sensitive to the change in the slope of yield
curve, as well as to the change in the stock exchange index. These borrower groups have more
stable income and limited liquid asset, which limit their ability to respond the market shock. On
the other hand, younger borrowers and married borrowers are more sensitive to the
unemployment risk. In other words, when unemployment rate increase, these two groups of
borrowers are more likely to pay off their mortgage debt in an effort to avoid uncertainty and
minimize additional risks.
In terms of default behavior, younger borrowers, office workers are less sensitive to the
changes in the stock exchange index; married borrowers and office workers are less sensitive to
the changes in the slope of yield curve; but married borrowers are more sensitive to the increase
in unemployment rate.
6. Conclusion
The residential mortgage market in China is a newly emerging sector of the capital
market. It is evolving rapidly with the swift housing system reform recently carried out in China.
The fast growth and the accelerating importance of the residential mortgage sector becomes a
financial engine for the booming residential housing development and sustained economic growth
in China.
The distinctive features of Chinese residential mortgage market make real estate finance a
very attractive research topic. Financial call option is currently unavailable to Chinese mortgage
borrowers due to imperfect market conditions; while the financial put option measured by
contemporaneous equity to market value of the property is in general “out-of-money” to the
borrowers because of the steady increases of the property values in the housing market during the
19
sampling period. Option theory apparently fails to explain the prepayment and default behavior in
current Chinese residential mortgage market.
On the other hand, other non-financial-option related social-economic factors, borrower
characteristics play major roles in explaining the prepayment and default behavior in China.
Borrowers choose to pay off mortgage debts in the bear market and when the yield curve is flat.
The current extremely low deposit rate in China makes saving no longer a rational option for long
term investment to many Chinese. Stock market provides Chinese households a viable locale to
benefit from the higher return investment in the capital market. Therefore, stock market’s
fluctuations have significant impact on mortgage borrowers’ prepayment and default decisions.
Many Chinese borrowers tend to be “uncertainty averse”, i.e. when unemployment rate
rises, borrowers tend to reallocate their investment portfolio to safe assets by paying off their
mortgage debts. This contradicts to the borrowers’ behaviors observed in the residential mortgage
markets in the United States and other countries.
The reform of housing and housing finance system in China bring along swift changes in
many housing and finance related policies and regulations, which influence households’ decisions.
Changes of policy have proved to be one of the critical determents in our model for mortgage
prepayment risk.
Finally, borrower’s characteristics are found to be significant in determining borrower’s
prepayment behaviors, hence may be used as an effective tool for screening across loan applicants
and for determining who the potential high risk borrowers are. These findings have important
policy implications. Median-high to high income borrowers as well as white-collar workers are
more likely to prepay their mortgage debts. On the other hand, younger households, blue-collar
workers are less likely to prepay. Therefore, adopting a risk-based pricing in residential mortgage
lending in China will not only improve the efficiency of the market, but also enhance the credit
availability to the most needed households, i.e., the younger households, blue-collar workers,
lower income households, and help them become homeowners.
20
Reference
Archer, W. R., D. C. Ling, and G. A. McGill. (1996). “The Effect of Income and Collateral Constraints on Residential Mortgage Terminations,” Regional Science and Urban Economics, 26(3-4) 235-261.
Black, F. and M. S. Scholes. (1973). “The Pricing of Options and Corporate Liabilities,” Journal of Political Economy 81, 637-654.
Brennan, M. J., and E. S. Schwartz. (1985). “Determinants of GNMA Mortgage Prices,” Journal of the American Real Estate and Urban Economics Association 13, 209-228.
Buser, S. A., and P. H. Hendershott (1984). “Pricing Default Free Mortgage,” Housing Finance Review, 3, 405-429.
Calhoun, A. C., and Y. Deng. (2002). “A Dynamic Analysis of Fixed- and Adjustable-Rate Mortgage Terminations,” Journal of Real Estate finance and Economics 24(1-2), 9-33.
Cox, D. R. (1972). “Regression Models and Life-Tables,” Journal of the Royal Statistical Society B 34(2), 187-220.
Cox, D. R. (1975). “Partial Likelihood,” Biometrika 62, 269-276.
Cunningham, D., and C. Capone. (1990). “The Relative Termination Experience of Adjustable to Fixed-Rate Mortgage,” Journal of Finance 45(5), 1687-1703.
Deng, Y. (1997). “Mortgage Termination: An Empirical Hazard Model with Stochastic Term Structure,” Journal of Real Estate Finance and Economics 14(3), 309-331.
Deng, Y., and J. M. Quigley. (2002). “Woodhead Behavior and the Pricing of Residential Mortgage,” USC Lusk Center working paper 2003-1005.
Deng, Y., J. M. Quigley, and R. Van Order. (1996). “Mortgage Default and Low Downpayment Loans: The Cost of Public Subsidy,” Regional Science and Urban Economics, 26(3-4) 263-285.
Deng, Y., J. M. Quigley, and R. Van Order. (2000). “Mortgage Terminations, Heterogeneity and the Exercise of Mortgage Options,” Econometrica 68(2), 275-307.
Dunn, K. B., and J. J. McConnell. (1981). “Valuation of Mortgage-Backed Securities,” The Journal of Finance 36, 599-617.
Findley, M. C., and D. R. Capozza. (1977). “The Variable Rate Mortgage: An Option Theory Perspective,” Journal of Money, Credit and Banking 9, 356-364.
Green, J., and J. B. Shoven. (1986). “The Effect of Interest Rates on Mortgage Prepayment,” Journal of Money, Credit and Banking 18, 41-50.
Hendershott, P. and R. Van Order. (1987). “Pricing Mortgages: An Interpretation of Models and Results,” Journal of Financial Services Research 1, 77-111.
Kau, J. B., and D. C. Keenan. (1995). “An Overview of the Option-Theoretic Pricing of Mortgages,” Journal of Housing Research 6(2), 217-244.
Kau, J. B., D. C. Keenan, W. J. Muller, and J. F. Epperson. (1990). “The Valuation and Analysis of Adjustable Rate Mortgages,” Management Science 36(12), 1417-1431.
Merton, R. C. (1973). “Theory of Rational Option Pricing,” Bell Journal of Economics and Management Science 4, 141-183.
21
Quigley, J. M. (1987). “Interest Rate Variations, Mortgage Prepayments and Household Mobility,” Review of Economics and Statistics, 69, 636-643.
Quigley, J., and R. Van Order. (1995). “Efficiency in the Mortgage Market: The Borrower’s Perspective,” Journal of the American Real Estate and Urban Economics Association 18(3), 237-252.
Schwartz, E. S., and W. N. Torous. (1989). “Prepayment and the Valuation of Mortgage-Backed Securities,” Journal of Finance 44, 375-392.
Stanton, R. (1995). “Rational Prepayment and the Valuation of Mortgage-Backed Securities,” The Review of Financial Studies 8(3), 677-708.
Stanton, R. and N. Wallace. (1999). “Anatomy of an ARM: The Interests-Rate Risk of Adjustable-Rate Mortgages,” Journal of Real Estate Finance and Economics 19(1), 49-67.
22
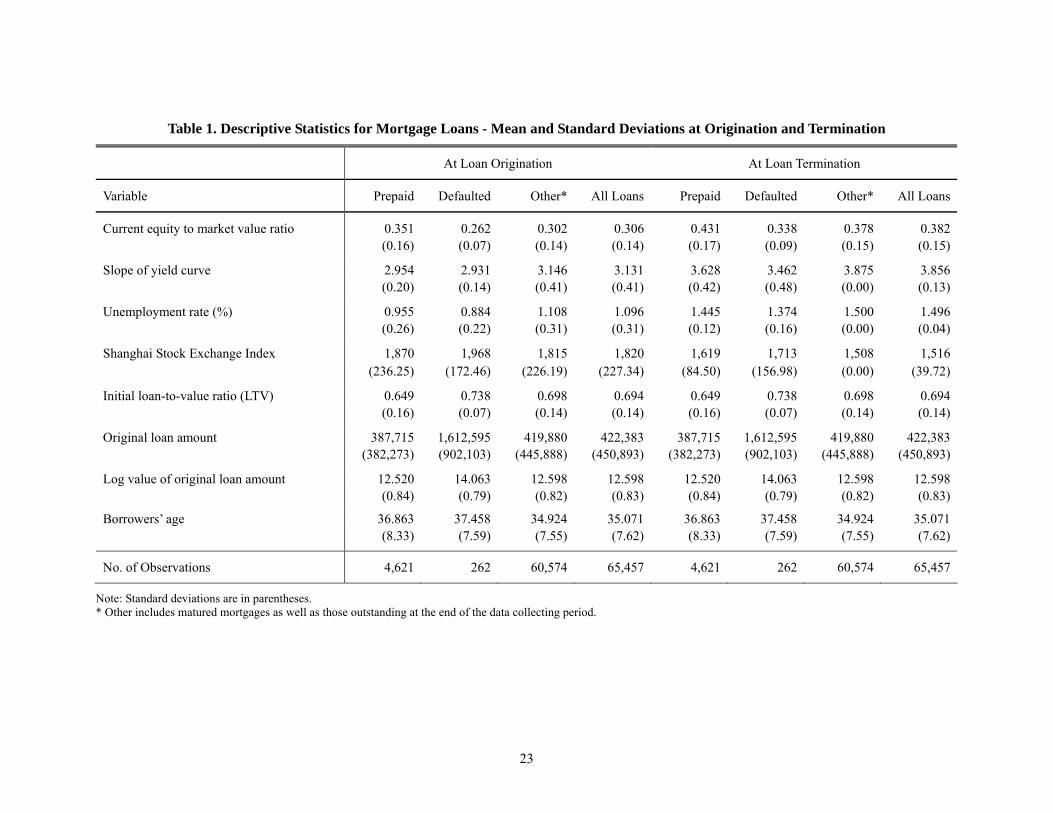
Table 1. Descriptive Statistics for Mortgage Loans - Mean and Standard Deviations at Origination and Termination
At Loan Origination At Loan Termination
Variable Prepaid Defaulted Other* All Loans Prepaid Defaulted Other* All Loans
Current equity to market value ratio 0.351 0.262 0.302 0.306 0.431 0.338 0.378 0.382 (0.16) (0.07) (0.14) (0.14) (0.17) (0.09) (0.15) (0.15)
Slope of yield curve 2.954 2.931 3.146 3.131 3.628 3.462 3.875 3.856 (0.20) (0.14) (0.41) (0.41) (0.42) (0.48) (0.00) (0.13)
Unemployment rate (%) 0.955 0.884 1.108 1.096 1.445 1.374 1.500 1.496 (0.26) (0.22) (0.31) (0.31) (0.12) (0.16) (0.00) (0.04)
Shanghai Stock Exchange Index 1,870 1,968 1,815 1,820 1,619 1,713 1,508 1,516 (236.25) (172.46) (226.19) (227.34) (84.50) (156.98) (0.00) (39.72)
Initial loan-to-value ratio (LTV) 0.649 0.738 0.698 0.694 0.649 0.738 0.698 0.694 (0.16) (0.07) (0.14) (0.14) (0.16) (0.07) (0.14) (0.14)
Original loan amount 387,715 1,612,595 419,880 422,383 387,715 1,612,595 419,880 422,383 (382,273) (902,103) (445,888) (450,893) (382,273) (902,103) (445,888) (450,893)
Log value of original loan amount 12.520 14.063 12.598 12.598 12.520 14.063 12.598 12.598 (0.84) (0.79) (0.82) (0.83) (0.84) (0.79) (0.82) (0.83)
Borrowers’ age 36.863 37.458 34.924 35.071 36.863 37.458 34.924 35.071 (8.33) (7.59) (7.55) (7.62) (8.33) (7.59) (7.55) (7.62)
No. of Observations 4,621 262 60,574 65,457 4,621 262 60,574 65,457
Note: Standard deviations are in parentheses. * Other includes matured mortgages as well as those outstanding at the end of the data collecting period.
23
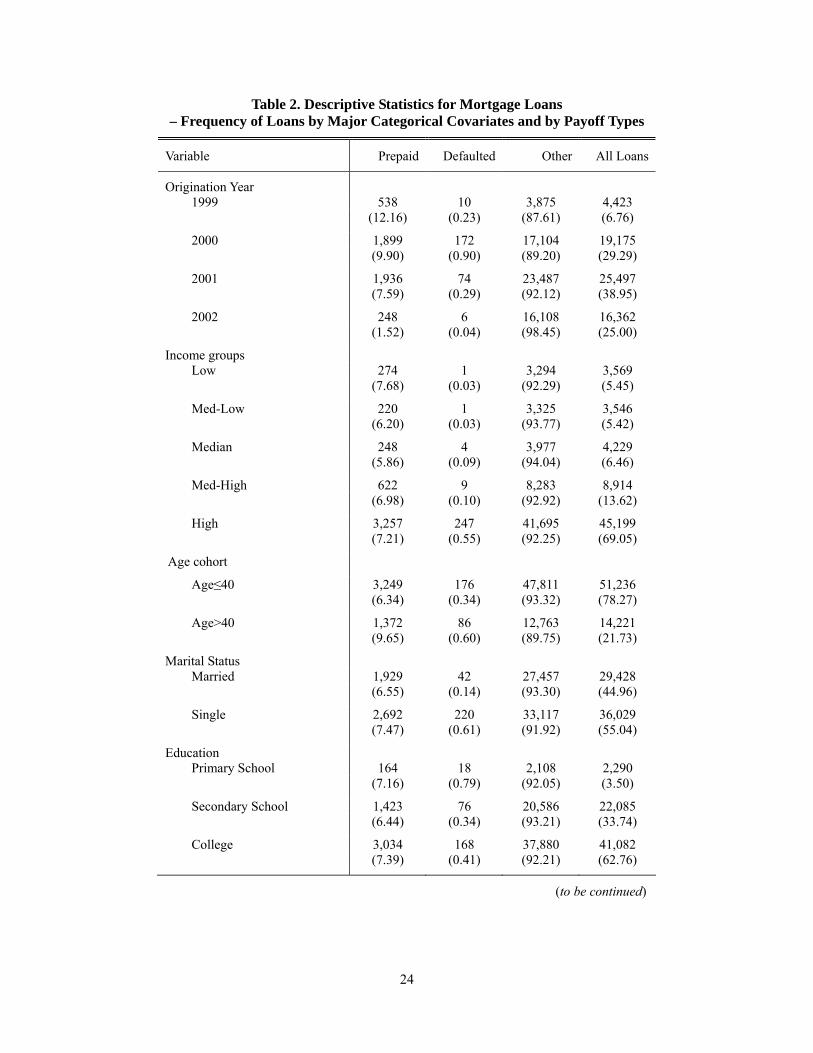
Table 2. Descriptive Statistics for Mortgage Loans – Frequency of Loans by Major Categorical Covariates and by Payoff Types
Variable Prepaid Defaulted Other All Loans
Origination Year 1999 538 10 3,875 4,423 (12.16) (0.23) (87.61) (6.76)
2000 1,899 172 17,104 19,175 (9.90) (0.90) (89.20) (29.29)
2001 1,936 74 23,487 25,497 (7.59) (0.29) (92.12) (38.95)
2002 248 6 16,108 16,362 (1.52) (0.04) (98.45) (25.00)
Income groups Low 274 1 3,294 3,569 (7.68) (0.03) (92.29) (5.45)
Med-Low 220 1 3,325 3,546 (6.20) (0.03) (93.77) (5.42)
Median 248 4 3,977 4,229 (5.86) (0.09) (94.04) (6.46)
Med-High 622 9 8,283 8,914 (6.98) (0.10) (92.92) (13.62)
High 3,257 247 41,695 45,199 (7.21) (0.55) (92.25) (69.05)
Age cohort
Age≤40 3,249 176 47,811 51,236 (6.34) (0.34) (93.32) (78.27)
Age>40 1,372 86 12,763 14,221 (9.65) (0.60) (89.75) (21.73)
Marital Status Married 1,929 42 27,457 29,428 (6.55) (0.14) (93.30) (44.96)
Single 2,692 220 33,117 36,029 (7.47) (0.61) (91.92) (55.04)
Education Primary School 164 18 2,108 2,290 (7.16) (0.79) (92.05) (3.50)
Secondary School 1,423 76 20,586 22,085 (6.44) (0.34) (93.21) (33.74)
College 3,034 168 37,880 41,082 (7.39) (0.41) (92.21) (62.76)
(to be continued)
24
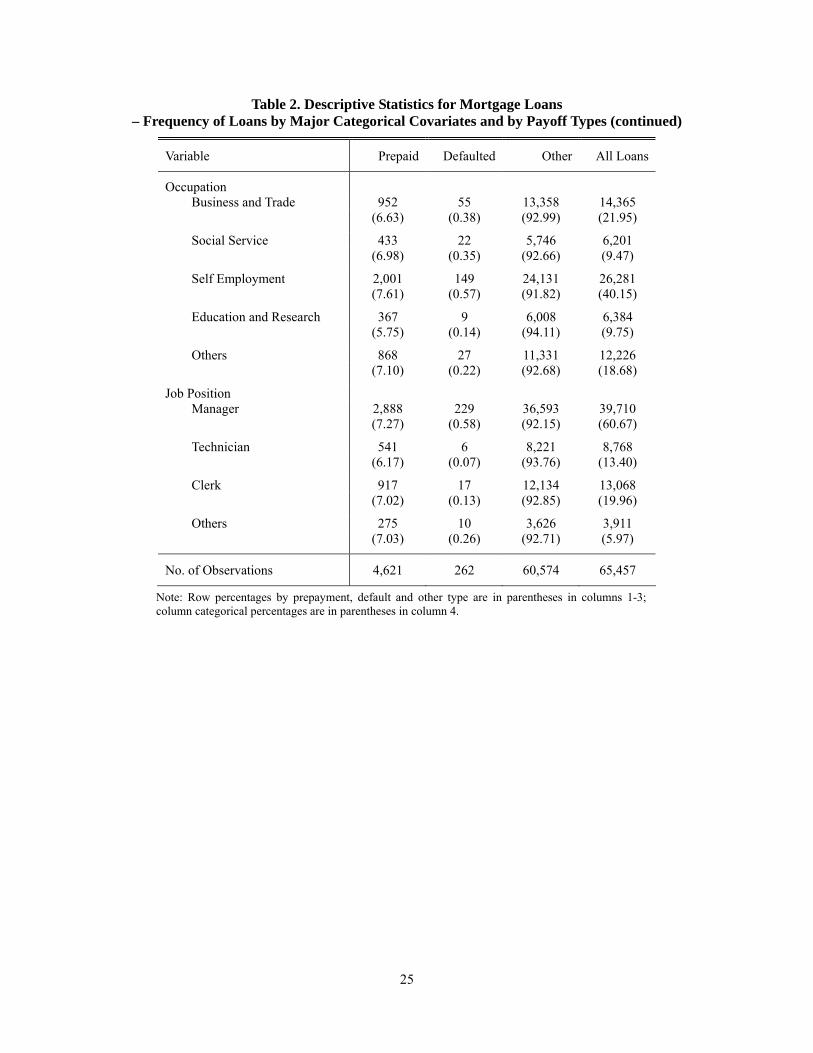
Table 2. Descriptive Statistics for Mortgage Loans – Frequency of Loans by Major Categorical Covariates and by Payoff Types (continued)
Variable Prepaid Defaulted Other All Loans
Occupation Business and Trade 952 55 13,358 14,365 (6.63) (0.38) (92.99) (21.95)
Social Service 433 22 5,746 6,201 (6.98) (0.35) (92.66) (9.47)
Self Employment 2,001 149 24,131 26,281 (7.61) (0.57) (91.82) (40.15)
Education and Research 367 9 6,008 6,384 (5.75) (0.14) (94.11) (9.75)
Others 868 27 11,331 12,226 (7.10) (0.22) (92.68) (18.68)
Job Position Manager 2,888 229 36,593 39,710 (7.27) (0.58) (92.15) (60.67)
Technician 541 6 8,221 8,768 (6.17) (0.07) (93.76) (13.40)
Clerk 917 17 12,134 13,068 (7.02) (0.13) (92.85) (19.96)
Others 275 10 3,626 3,911 (7.03) (0.26) (92.71) (5.97)
No. of Observations 4,621 262 60,574 65,457
Note: Row percentages by prepayment, default and other type are in parentheses in columns 1-3; column categorical percentages are in parentheses in column 4.
25
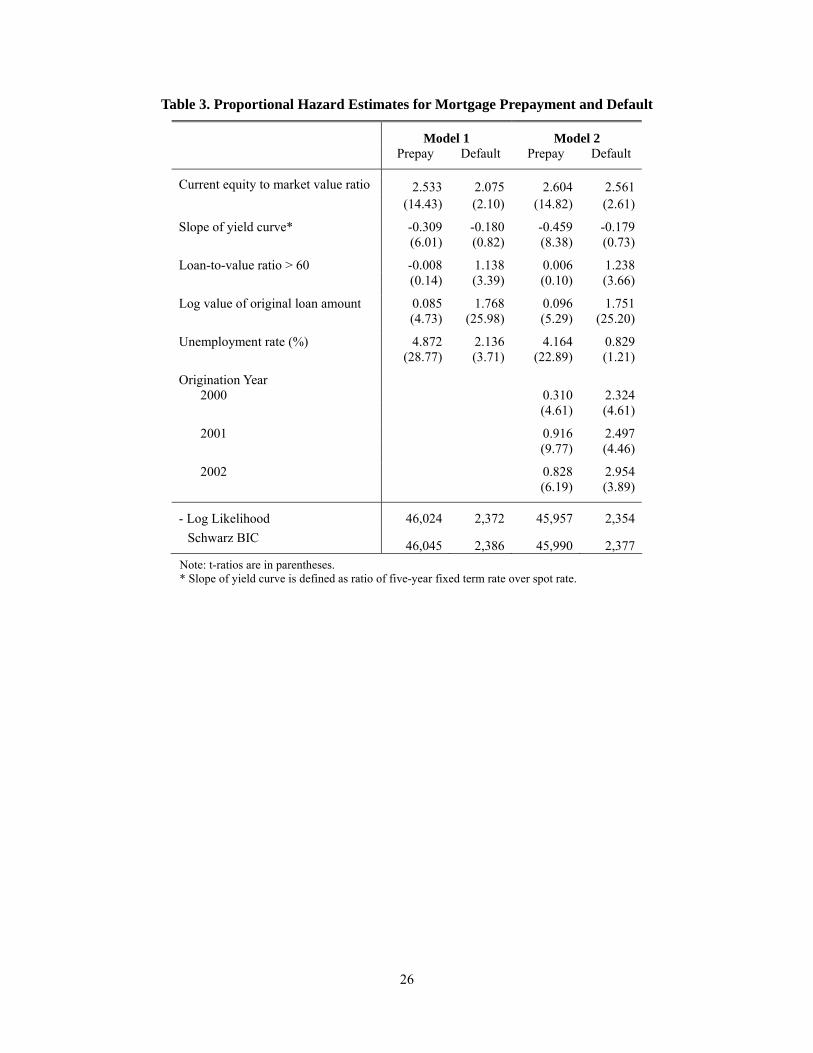
Table 3. Proportional Hazard Estimates for Mortgage Prepayment and Default
Model 1 . Model 2 . Prepay Default Prepay Default
2.533 2.075 2.604 2.561 Current equity to market value ratio (14.43) (2.10) (14.82) (2.61)
-0.309 -0.180 -0.459 -0.179 Slope of yield curve* (6.01) (0.82) (8.38) (0.73)
-0.008 1.138 0.006 1.238 Loan-to-value ratio > 60 (0.14) (3.39) (0.10) (3.66)
0.085 1.768 0.096 1.751 Log value of original loan amount (4.73) (25.98) (5.29) (25.20)
4.872 2.136 4.164 0.829 Unemployment rate (%) (28.77) (3.71) (22.89) (1.21)
Origination Year 0.310 2.324 2000
(4.61) (4.61)
0.916 2.497 2001 (9.77) (4.46)
0.828 2.954 2002 (6.19) (3.89)
- Log Likelihood 46,024 2,372 45,957 2,354 Schwarz BIC 46,045 2,386 45,990 2,377
Note: t-ratios are in parentheses. * Slope of yield curve is defined as ratio of five-year fixed term rate over spot rate.
26
27
Table 4. Proportional Hazard Estimates for Mortgage Prepayment
Model 3 Model 4 Model 5 Prepay Default Prepay Default Prepay DefaultCurrent equity to market value ratio 2.387 2.317 2.377 2.299 0.760 -3.205 (13.31) (2.33) (13.25) (2.31) (4.11) (2.90) Slope of yield curve -0.459 -0.141 -0.25 -0.201 1.260 1.146 (8.38) (0.57) (4.66) (0.78) (15.50) (3.02) Loan-to-value ratio (LTV) > 60 -0.016 1.216 -0.018 1.209 -0.345 -0.464 (0.28) (3.57) (0.31) (3.55) (5.78) (1.36) Log value of original loan amount -0.029 1.816 -0.033 1.822 -0.105 2.055 (1.13) (22.90) (1.26) (22.97) (3.89) (21.85) Unemployment rate (%) 4.166 0.885 2.476 1.501 7.289 4.797 (22.90) (1.28) (12.33) (1.89) (25.63) (4.18) Origination year
2000 0.34 2.266 0.277 2.352 0.184 1.221 (5.04) (4.48) (4.11) (4.62) (2.62) (2.10) 2001 0.942 2.584 0.739 2.765 1.178 2.207 (10.02) (4.60) (7.87) (4.84) (12.09) (3.48) 2002 0.863 3.095 0.608 3.367 1.157 4.067
(6.44) (4.07) (4.60) (4.32) (8.62) (4.91) Income groups
Med-low 0.045 -0.317 0.042 -0.318 0.077 -0.636 (0.50) (0.22) (0.46) (0.22) (0.84) (0.45) Median 0.101 0.679 0.097 0.677 0.121 0.387 (1.13) (0.61) (1.09) (0.60) (1.35) (0.34) Med-high 0.281 0.496 0.276 0.498 0.305 0.189 (3.71) (0.47) (3.65) (0.47) (3.99) (0.18) High 0.363 -0.162 0.36 -0.165 0.273 -1.264 (4.73) (0.16) (4.69) (0.16) (3.48) (1.23)
Age ≤ 40 -0.24 0.07 -0.242 0.073 -14.851 -9.740 (7.18) (0.51) (7.25) (0.53) (12.07) (2.82) Married -0.051 -0.787 -0.055 -0.78 -3.313 -2.458 (1.56) (4.45) (1.68) (4.41) (2.97) (0.37) Education
Secondary school 0.13 -1.07 0.121 -1.056 -0.135 -0.868 (1.56) (4.02) (1.46) (3.97) (1.60) (2.97) College 0.21 -1.657 0.203 -1.651 0.177 -1.132
(2.56) (6.49) (2.47) (6.47) (2.15) (4.09)
(to be continued)
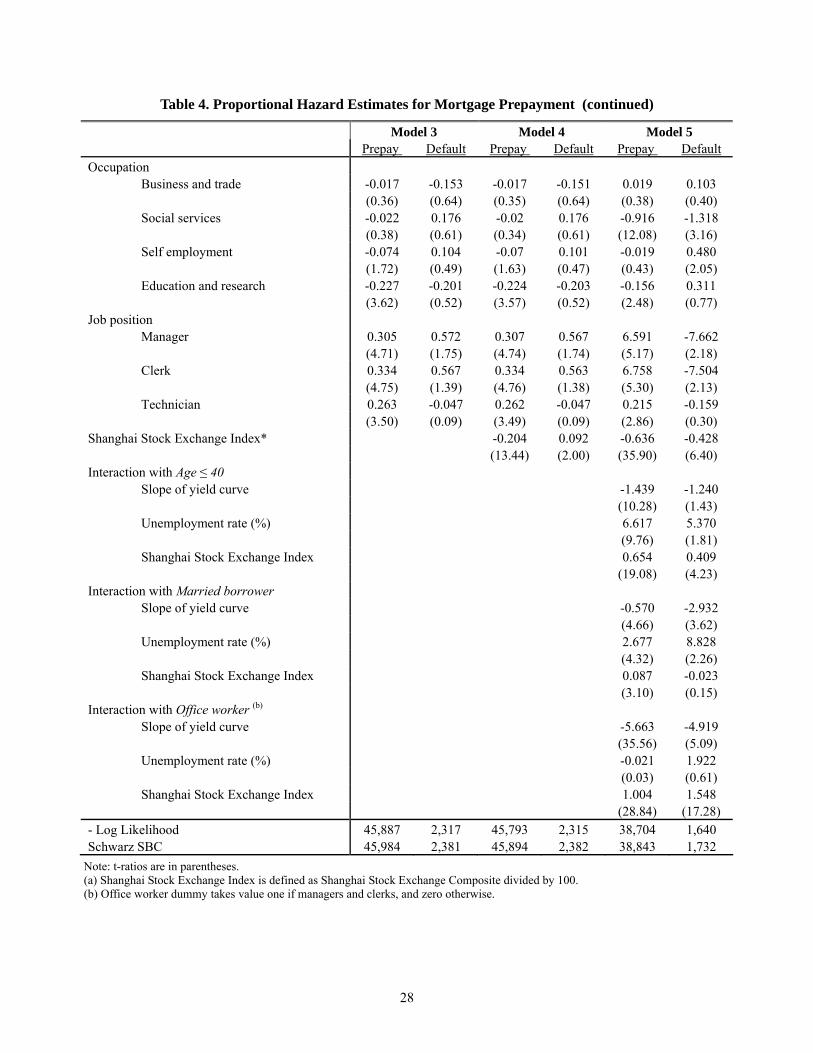
Table 4. Proportional Hazard Estimates for Mortgage Prepayment (continued)
Model 3 Model 4 Model 5 Prepay Default Prepay Default Prepay DefaultOccupation
Business and trade -0.017 -0.153 -0.017 -0.151 0.019 0.103 (0.36) (0.64) (0.35) (0.64) (0.38) (0.40) Social services -0.022 0.176 -0.02 0.176 -0.916 -1.318 (0.38) (0.61) (0.34) (0.61) (12.08) (3.16) Self employment -0.074 0.104 -0.07 0.101 -0.019 0.480 (1.72) (0.49) (1.63) (0.47) (0.43) (2.05) Education and research -0.227 -0.201 -0.224 -0.203 -0.156 0.311
(3.62) (0.52) (3.57) (0.52) (2.48) (0.77) Job position
Manager 0.305 0.572 0.307 0.567 6.591 -7.662 (4.71) (1.75) (4.74) (1.74) (5.17) (2.18) Clerk 0.334 0.567 0.334 0.563 6.758 -7.504
(4.75) (1.39) (4.76) (1.38) (5.30) (2.13) Technician 0.263 -0.047 0.262 -0.047 0.215 -0.159 (3.50) (0.09) (3.49) (0.09) (2.86) (0.30)
Shanghai Stock Exchange Index* -0.204 0.092 -0.636 -0.428 (13.44) (2.00) (35.90) (6.40) Interaction with Age ≤ 40
Slope of yield curve -1.439 -1.240 (10.28) (1.43) Unemployment rate (%) 6.617 5.370 (9.76) (1.81) Shanghai Stock Exchange Index 0.654 0.409 (19.08) (4.23)
Interaction with Married borrower Slope of yield curve -0.570 -2.932 (4.66) (3.62) Unemployment rate (%) 2.677 8.828 (4.32) (2.26) Shanghai Stock Exchange Index 0.087 -0.023
(3.10) (0.15) Interaction with Office worker (b)
Slope of yield curve -5.663 -4.919 (35.56) (5.09) Unemployment rate (%) -0.021 1.922 (0.03) (0.61) Shanghai Stock Exchange Index 1.004 1.548
(28.84) (17.28) - Log Likelihood 45,887 2,317 45,793 2,315 38,704 1,640 Schwarz SBC 45,984 2,381 45,894 2,382 38,843 1,732
Note: t-ratios are in parentheses. (a) Shanghai Stock Exchange Index is defined as Shanghai Stock Exchange Composite divided by 100. (b) Office worker dummy takes value one if managers and clerks, and zero otherwise.
28
A. By LTV
75%
80%
85%
90%
95%
100%
0 6 12 18 24 30 36
Duration (measued in month)
Surv
ival
Rat
es
LTV ≤ 60 LTV > 60
B. By Original Loan Amount
75%
80%
85%
90%
95%
100%
0 6 12 18 24 30 36
Duration (measued in month)
Surv
ival
Rat
es
OLA≤200,000 200,000<OLA≤400,000 OLA>400,000
C. By Household Income
75%
80%
85%
90%
95%
100%
0 6 12 18 24 30 36
Duration (measued in month)
Surv
ival
Rat
es
Low Median-Low Median Median-High High
D. By Borrower's Age
75%
80%
85%
90%
95%
100%
0 6 12 18 24 30 36
Duration (measued in month)
Surv
ival
Rat
es
Age ≤ 40 Age >40
Figure 1. Empirical Survival Function of Prepayment and Default
29
E. By Marital Status
75%
80%
85%
90%
95%
100%
0 6 12 18 24 30 36
Duration (measued in month)
Surv
ival
Rat
es
Single Married
F. By Education
75%
80%
85%
90%
95%
100%
0 6 12 18 24 30 36
Duration (measued in month)
Surv
ival
Rat
es
Primary School Secondary School College
G. By Occupation
75%
80%
85%
90%
95%
100%
0 6 12 18 24 30 36
Duration (measued in month)
Surv
ival
Rat
es
Business and Trade Social Service Self Employment
Education and Research Others
H. By Job Position
75%
80%
85%
90%
95%
100%
0 6 12 18 24 30 36
Duration (measued in month)
Surv
ival
Rat
es
Manager Clerk Technician Others
Figure 1. Empirical Survival Function of Prepayment and Default (continued)
30