Embed Size (px)
Citation preview
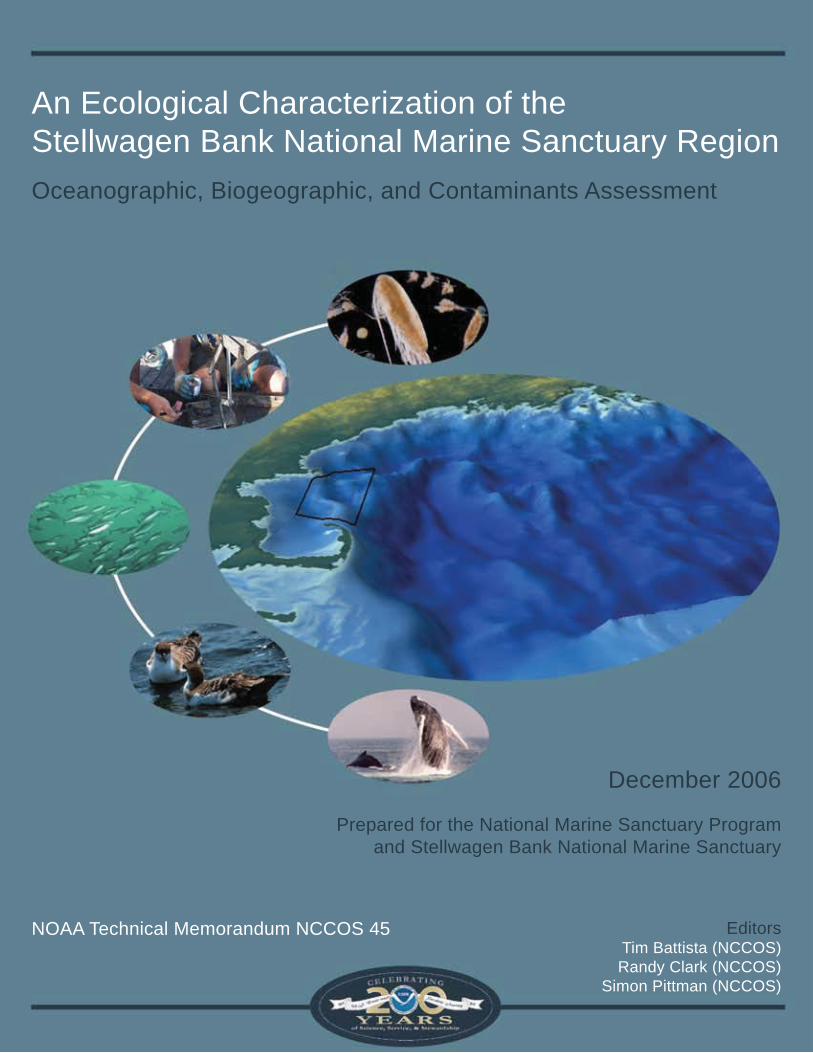
An Ecological Characterization of the Stellwagen Bank National Marine Sanctuary Region Oceanographic, Biogeographic, and Contaminants Assessment
December 2006
Prepared for the National Marine Sanctuary Program and Stellwagen Bank National Marine Sanctuary
NOAA Technical Memorandum NCCOS 45 Editors Tim Battista (NCCOS) Randy Clark (NCCOS)
Simon Pittman (NCCOS)
Mention of trade names or commercial products does not constitute endorsement or recommendation for their use by the United States Government.
Citation:
NOAA National Centers for Coastal Ocean Science (NCCOS) 2006. An Ecological Characterization of the Stell-wagen Bank National Marine Sanctuary Region: Oceanographic, Biogeographic, and Contaminants Assess-ment. Prepared by NCCOS’s Biogeography Team in cooperation with the National Marine Sanctuary Program. Silver Spring, MD. NOAA Technical Memorandum NOS NCCOS 45. 356 pp.
An Ecological Characterization of the Stellwagen Bank National Marine Sanctuary Region
Oceanographic, Biogeographic, and Contaminants Assessment
Center for Coastal Monitoring and Assessment (CCMA) NOAA/NOS/NCCOS 1305 East West Highway (SSMC-IV, N/SCI-1) Silver Spring, MD 20910
NOAA Technical Memorandum NOS NCCOS 45
December 2006
Editors: Tim Battista (NCCOS) Randy Clark (NCCOS) Simon Pittman (NCCOS)
United States Department of National Oceanic and National Ocean Service Commerce Atmospheric Administration
Carlos M. Gutierrez Conrad C. Lautenbacher, Jr. John H. Dunnigan Secretary Administrator Assistant Administrator

An Ecological Characterization of the Stellwagen Bank National Marine Sanctuary Region
ABOUT THIS DOCUMENT
This ecological characterization represents the continuation of an ongoing partnership between the National Marine Sanctuary Program (NMSP) and the National Centers for Coastal Ocean Science (NCCOS), Center for Coastal Monitoring and Assessment (CCMA). The purpose of this collaboration is to apply a biogeographical approach to the management of marine resources within the National Marine Sanctuaries. This particular work, conducted in collaboration with the Stellwagen Bank National Marine Sanctuary (SBNMS) and scientists con-ducting research within the Gulf of Maine region, builds on and advances biogeographic techniques developed by CCMA’s Biogeography Team for other National Marine Sanctuaries including Channel Islands, Cordell Bank, Gulf of Farallones, Monterey Bay, and Gray’s Reef. At the onset of the project, CCMA, SBNMS, and NMSP staff identified a set of targeted research topics to fill existing gaps in baseline environmental data, and enhance the understanding of key ecological patterns and processes to support the Management Plan Review process. Four objectives were addressed in the ecological characterization of SBNMS: 1) conduct analysis of geospatial distributions of selected fishes, seabirds, marine mammals, and contaminants within the Sanctuary and Gulf of Maine region, 2) identify biological and physical datasets that can be used to augment existing Sanctuary data for a comprehensive biogeographic assessment in a GIS environment, 3) identify ecologically important areas within the Sanctuary and surrounding region, and 4) model the physical and biological dependencies that may explain the temporal and spatial dynamics of the ecosystem represented within the Sanctuary and Gulf of Maine region.
The ecological characterization consists of three complementary components: a text report; a suite of quantita-tive spatial and statistical analyses that characterize physical, contaminant, and biological patterns of the Stell-wagen Bank NMS region; and an extensive geodatabase of all spatial, temporal, derived, and primary datasets acquired, assimilated, and analyzed to conduct the characterization. The ecological characterization report pro-vides essential information on the distribution of modeled and observed species needed to support the develop-ment of monitoring and scientific studies, the development of educational material, and support of other spatially-explicit management decisions. The results of this ecological characterization are available via hard copy and website. For more information on this effort please visit the NCCOS Biogeography Team webpage dedicated to this project at http://ccma.nos.noaa.gov/ecosystems/sanctuaries/stellwagen_nms.html or direct questions and comments to:
Mark E. Monaco, Ph.D. Biogeography Team Lead National Oceanic and Atmospheric Administration 1305 East West Highway SSMC 4, N/SCI-1 Silver Spring, MD 20910 Phone: (301) 713-3028 x 160 Email: [email protected]
Or
Craig D. MacDonald, Ph.D. Stellwagen Bank National Marine Sanctuary Superintendent National Oceanic and Atmospheric Administration 175 Edward Foster Road Scituate, MA 02066 Phone: (781) 545-8026 Email: [email protected]
page i
page ii
An Ecological Characterization of the Stellwagen Bank National Marine Sanctuary Region
PROJECT TEAM
Dennis Apeti – NOAA National Centers for Coastal Ocean Science Peter Auster – NOAA National Undersea Research Center, University of Connecticut Tim Battista – NOAA National Centers for Coastal Ocean Science Randy Clark – NOAA National Centers for Coastal Ocean Science Bryan Costa – NOAA National Centers for Coastal Ocean Science Arthur Desch – NOAA National Centers for Coastal Ocean Science Ian Hartwell – NOAA National Centers for Coastal Ocean Science Ben Haskell – NOAA Stellwagen Bank National Marine Sanctuary Jamie Higgins – NOAA National Centers for Coastal Ocean Science Sarah Davidison Hile – NOAA National Centers for Coastal Ocean Science Falk Huetmann – University of Alaska, Fairbanks Robert Kenney – University of Rhode Island Craig MacDonald – Stellwagen Bank National Marine Sanctuary Jim Manning – NOAA Northeast Fisheries Science Center Andrew Mason – NOAA National Centers for Coastal Ocean Science Kevin McMahon – NOAA National Centers for Coastal Ocean Science Mark Meyers – NOAA Northwest Fisheries Science Center Mark Monaco – NOAA National Centers for Coastal Ocean Science Connie Moy – NOAA National Centers for Coastal Ocean Science Simon Pittman – NOAA National Centers for Coastal Ocean Science Rachael Reed – Calvin College Dave Wiley – NOAA Stellwagen Bank National Marine Sanctuary
An Ecological Characterization of the Stellwagen Bank National Marine Sanctuary Region
EXECUTIVE SUMMARY
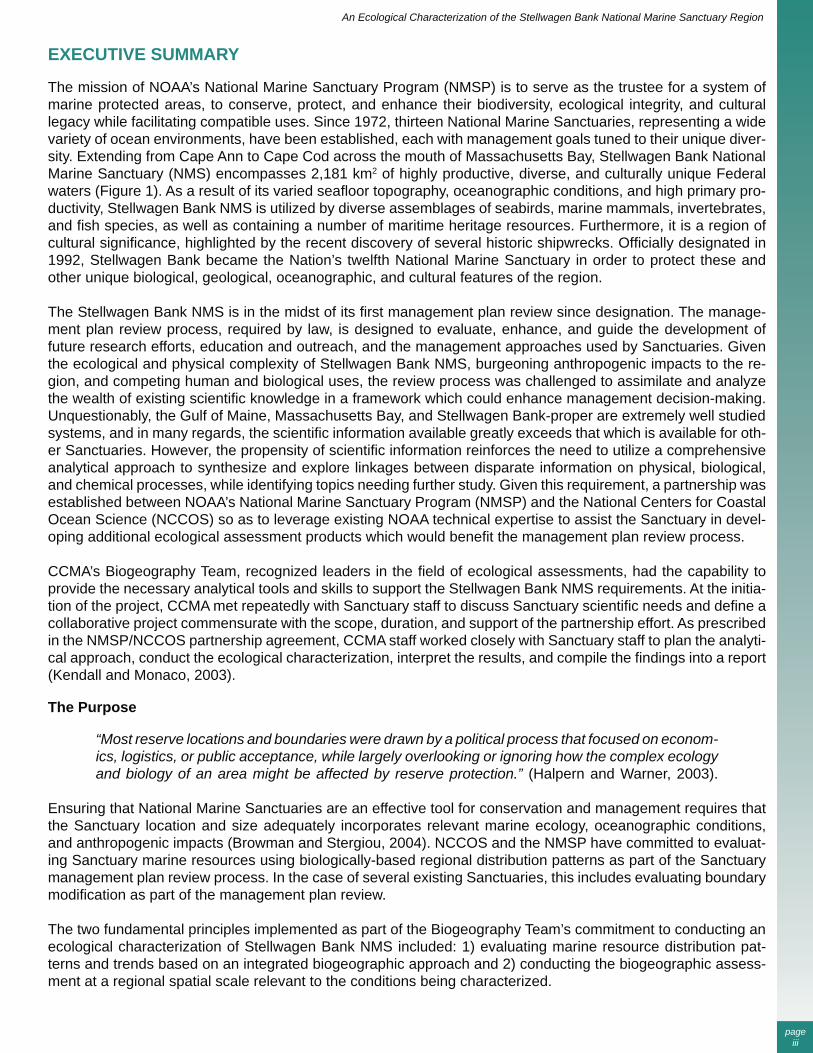
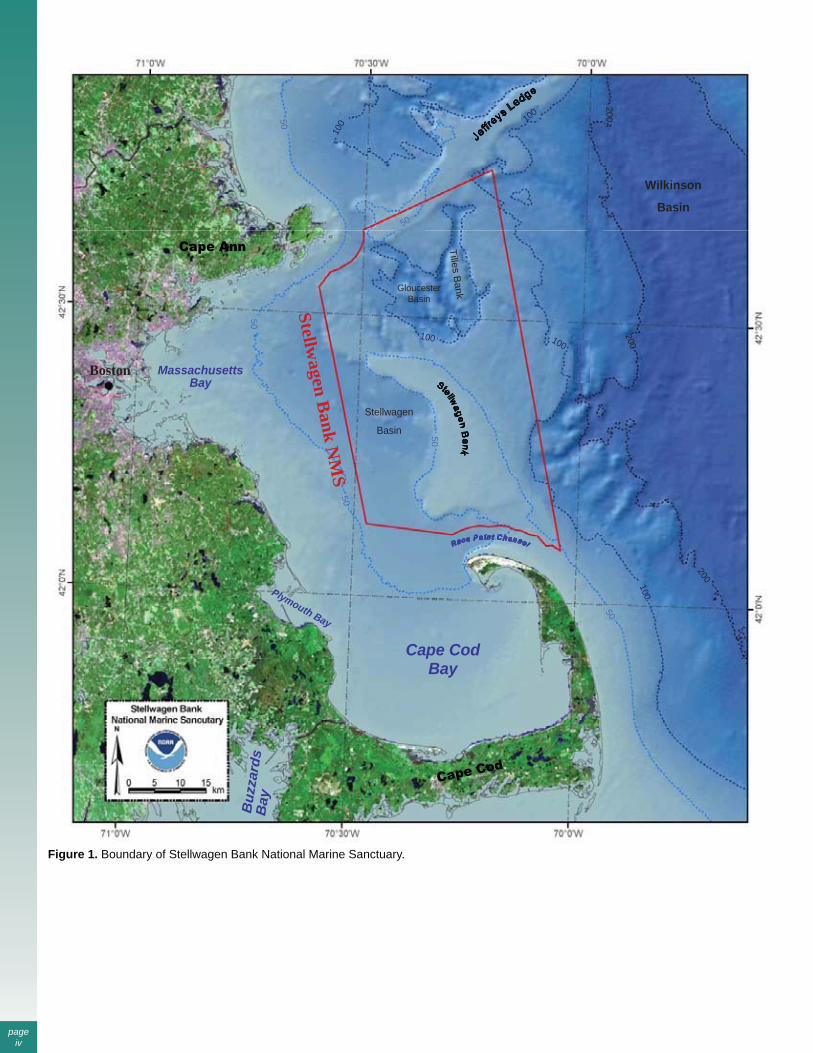
The mission of NOAA’s National Marine Sanctuary Program (NMSP) is to serve as the trustee for a system of marine protected areas, to conserve, protect, and enhance their biodiversity, ecological integrity, and cultural legacy while facilitating compatible uses. Since 1972, thirteen National Marine Sanctuaries, representing a wide variety of ocean environments, have been established, each with management goals tuned to their unique diver-sity. Extending from Cape Ann to Cape Cod across the mouth of Massachusetts Bay, Stellwagen Bank National Marine Sanctuary (NMS) encompasses 2,181 km2 of highly productive, diverse, and culturally unique Federal waters (Figure 1). As a result of its varied seafloor topography, oceanographic conditions, and high primary pro-ductivity, Stellwagen Bank NMS is utilized by diverse assemblages of seabirds, marine mammals, invertebrates, and fish species, as well as containing a number of maritime heritage resources. Furthermore, it is a region of cultural significance, highlighted by the recent discovery of several historic shipwrecks. Officially designated in 1992, Stellwagen Bank became the Nation’s twelfth National Marine Sanctuary in order to protect these and other unique biological, geological, oceanographic, and cultural features of the region.
The Stellwagen Bank NMS is in the midst of its first management plan review since designation. The manage-ment plan review process, required by law, is designed to evaluate, enhance, and guide the development of future research efforts, education and outreach, and the management approaches used by Sanctuaries. Given the ecological and physical complexity of Stellwagen Bank NMS, burgeoning anthropogenic impacts to the re-gion, and competing human and biological uses, the review process was challenged to assimilate and analyze the wealth of existing scientific knowledge in a framework which could enhance management decision-making. Unquestionably, the Gulf of Maine, Massachusetts Bay, and Stellwagen Bank-proper are extremely well studied systems, and in many regards, the scientific information available greatly exceeds that which is available for oth-er Sanctuaries. However, the propensity of scientific information reinforces the need to utilize a comprehensive analytical approach to synthesize and explore linkages between disparate information on physical, biological, and chemical processes, while identifying topics needing further study. Given this requirement, a partnership was established between NOAA’s National Marine Sanctuary Program (NMSP) and the National Centers for Coastal Ocean Science (NCCOS) so as to leverage existing NOAA technical expertise to assist the Sanctuary in devel-oping additional ecological assessment products which would benefit the management plan review process.
CCMA’s Biogeography Team, recognized leaders in the field of ecological assessments, had the capability to provide the necessary analytical tools and skills to support the Stellwagen Bank NMS requirements. At the initia-tion of the project, CCMA met repeatedly with Sanctuary staff to discuss Sanctuary scientific needs and define a collaborative project commensurate with the scope, duration, and support of the partnership effort. As prescribed in the NMSP/NCCOS partnership agreement, CCMA staff worked closely with Sanctuary staff to plan the analyti-cal approach, conduct the ecological characterization, interpret the results, and compile the findings into a report (Kendall and Monaco, 2003).
The Purpose
“Most reserve locations and boundaries were drawn by a political process that focused on econom-ics, logistics, or public acceptance, while largely overlooking or ignoring how the complex ecology and biology of an area might be affected by reserve protection.” (Halpern and Warner, 2003).
Ensuring that National Marine Sanctuaries are an effective tool for conservation and management requires that the Sanctuary location and size adequately incorporates relevant marine ecology, oceanographic conditions, and anthropogenic impacts (Browman and Stergiou, 2004). NCCOS and the NMSP have committed to evaluat-ing Sanctuary marine resources using biologically-based regional distribution patterns as part of the Sanctuary management plan review process. In the case of several existing Sanctuaries, this includes evaluating boundary modification as part of the management plan review.
The two fundamental principles implemented as part of the Biogeography Team’s commitment to conducting an ecological characterization of Stellwagen Bank NMS included: 1) evaluating marine resource distribution pat-terns and trends based on an integrated biogeographic approach and 2) conducting the biogeographic assess-ment at a regional spatial scale relevant to the conditions being characterized.
page iii
page iv
Wilkinson
Basin
Tilles Bank
Stellwagen
Basin
Boston
Gloucester Basin Stellw
agenB
ankN
MS
50
50
50
50 100
50
100
50
200
100
200
100 200
100
Buz
zard
s B
ay
Plymouth Bay
Massachusetts Bay
Cape Cod Bay
Figure 1. Boundary of Stellwagen Bank National Marine Sanctuary.
An Ecological Characterization of the Stellwagen Bank National Marine Sanctuary Region
Biogeographic Analysis
Biogeographic analysis is an ideal tool for scientists and Sanctuary managers to evaluate biodiversity conserva-tion and ecosystem integrity across the continuum of spatial and temporal scales. Completing a biogeographic assessment of the distribution of such resources within, across, and beyond the Sanctuary boundary is critical for understanding the Sanctuary within the wider ecological context and understanding how the ecosystem com-position changes through time. Using the biogeographic approach, managers can explore potential changes in resource distribution that result from alternative management practices. For example, in Stellwagen Bank NMS this includes considering a relocation of the Boston Harbor shipping channel to reduce marine mammal vessel strikes, expansion of the Sanctuary boundary to encompass additional biological hotspots, and the refinement of monitoring efforts to overcome existing gaps in understanding and data coverage.
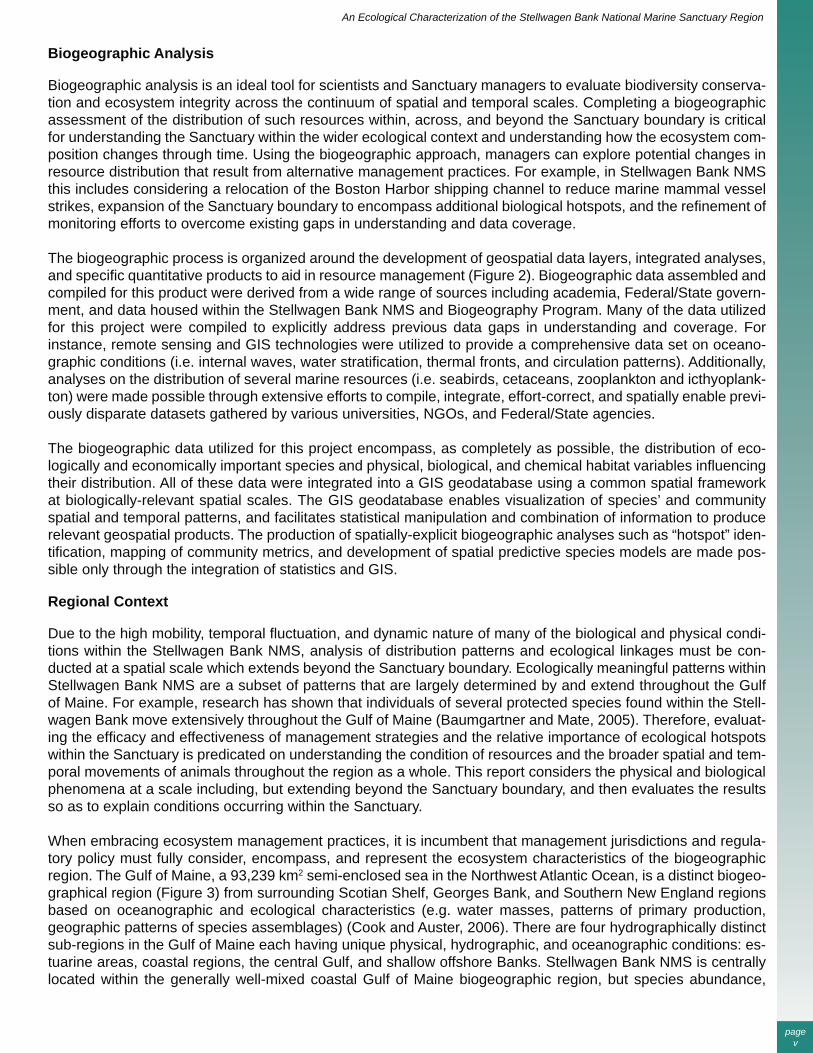
The biogeographic process is organized around the development of geospatial data layers, integrated analyses, and specific quantitative products to aid in resource management (Figure 2). Biogeographic data assembled and compiled for this product were derived from a wide range of sources including academia, Federal/State govern-ment, and data housed within the Stellwagen Bank NMS and Biogeography Program. Many of the data utilized for this project were compiled to explicitly address previous data gaps in understanding and coverage. For instance, remote sensing and GIS technologies were utilized to provide a comprehensive data set on oceano-graphic conditions (i.e. internal waves, water stratification, thermal fronts, and circulation patterns). Additionally, analyses on the distribution of several marine resources (i.e. seabirds, cetaceans, zooplankton and icthyoplank-ton) were made possible through extensive efforts to compile, integrate, effort-correct, and spatially enable previ-ously disparate datasets gathered by various universities, NGOs, and Federal/State agencies.
The biogeographic data utilized for this project encompass, as completely as possible, the distribution of eco-logically and economically important species and physical, biological, and chemical habitat variables influencing their distribution. All of these data were integrated into a GIS geodatabase using a common spatial framework at biologically-relevant spatial scales. The GIS geodatabase enables visualization of species’ and community spatial and temporal patterns, and facilitates statistical manipulation and combination of information to produce relevant geospatial products. The production of spatially-explicit biogeographic analyses such as “hotspot” iden-tification, mapping of community metrics, and development of spatial predictive species models are made pos-sible only through the integration of statistics and GIS.
Regional Context
Due to the high mobility, temporal fluctuation, and dynamic nature of many of the biological and physical condi-tions within the Stellwagen Bank NMS, analysis of distribution patterns and ecological linkages must be con-ducted at a spatial scale which extends beyond the Sanctuary boundary. Ecologically meaningful patterns within Stellwagen Bank NMS are a subset of patterns that are largely determined by and extend throughout the Gulf of Maine. For example, research has shown that individuals of several protected species found within the Stell-wagen Bank move extensively throughout the Gulf of Maine (Baumgartner and Mate, 2005). Therefore, evaluat-ing the efficacy and effectiveness of management strategies and the relative importance of ecological hotspots within the Sanctuary is predicated on understanding the condition of resources and the broader spatial and tem-poral movements of animals throughout the region as a whole. This report considers the physical and biological phenomena at a scale including, but extending beyond the Sanctuary boundary, and then evaluates the results so as to explain conditions occurring within the Sanctuary.
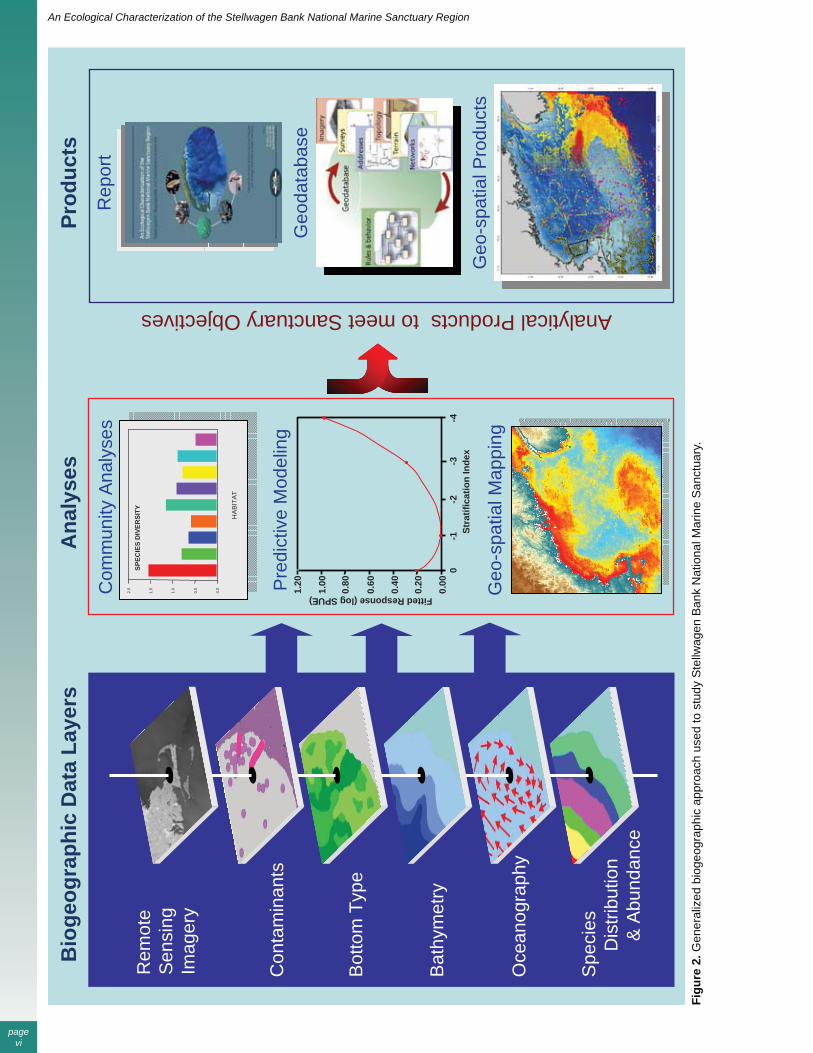
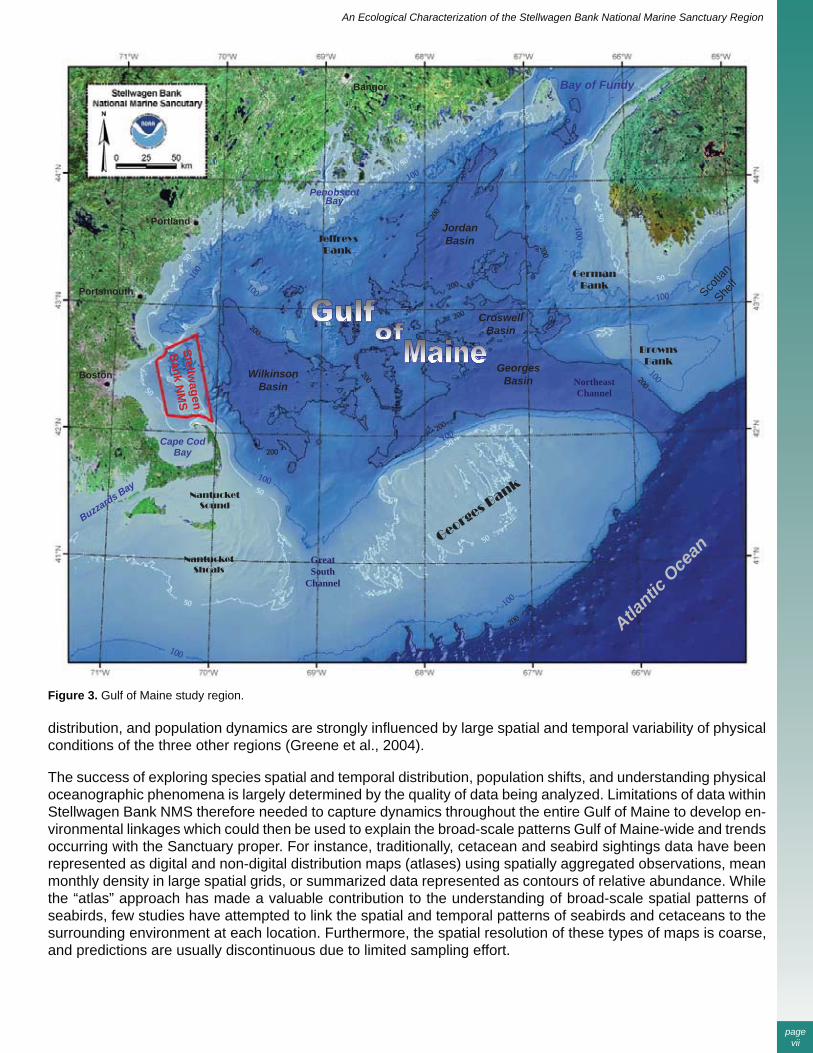
When embracing ecosystem management practices, it is incumbent that management jurisdictions and regula-tory policy must fully consider, encompass, and represent the ecosystem characteristics of the biogeographic region. The Gulf of Maine, a 93,239 km2 semi-enclosed sea in the Northwest Atlantic Ocean, is a distinct biogeo-graphical region (Figure 3) from surrounding Scotian Shelf, Georges Bank, and Southern New England regions based on oceanographic and ecological characteristics (e.g. water masses, patterns of primary production, geographic patterns of species assemblages) (Cook and Auster, 2006). There are four hydrographically distinct sub-regions in the Gulf of Maine each having unique physical, hydrographic, and oceanographic conditions: es-tuarine areas, coastal regions, the central Gulf, and shallow offshore Banks. Stellwagen Bank NMS is centrally located within the generally well-mixed coastal Gulf of Maine biogeographic region, but species abundance,
page v
An Ecological Characterization of the Stellwagen Bank National Marine Sanctuary Region
page vi
Spe
cies
Dis
tribu
tion
& A
bund
ance
Oce
anog
raph
y
Bat
hym
etry
Bot
tom
Typ
e
Prod
ucts
Geo
data
base
Rep
ort
Analytical Products to meet Sanctuary O bjectives
Geo
-spa
tial P
rodu
cts
Ana
lyse
s
Geo
-spa
tial M
appi
ng
Com
mun
ity A
naly
ses
0.0
0.5
1.0
1.5
2.0
HA
BITA
T
SPEC
IES
DIV
ERSI
TY
Pre
dict
ive
Mod
elin
g
Fitted Response (log SPUE) 0.00
0.20
0.40
0.60
0.80
1.00
1.20
0 -1
-2
-3
-4
St
ratif
icat
ion
Inde
x
Bio
geog
raph
ic D
ata
Laye
rs
Con
tam
inan
ts
Rem
ote
Sen
sing
Imag
ery
Figu
re 2
. Gen
eral
ized
bio
geog
raph
ic a
ppro
ach
used
to s
tudy
Ste
llwag
en B
ank
Nat
iona
l Mar
ine
San
ctua
ry.
pagevii
An Ecological Characterization of the Stellwagen Bank National Marine Sanctuary Region
WilkinsonBasin
JordanBasin
Stellwagen
Bank
NM
S
GeorgesBasin
BrownsBank
Boston
Cape Cod Bay
Buzzards Bay
Penobscot Bay
Bay of Fundy
Great South
Channel
Nantucket Sound
Portsmouth
Portland
Bangor
Nantucket Shoals
Atlantic
Ocean
German Bank
Croswell Basin
Jeffreys Bank
Scotia
nShe
lf
50
100
50
100
100
200
Northeast Channel
Georges Bank
50
200
200
100
50
100
200 200100
100
50
100
200
50200
10050
50
200
200
200
50100
Figure 3. Gulf of Maine study region.
distribution, and population dynamics are strongly influenced by large spatial and temporal variability of physical conditions of the three other regions (Greene et al., 2004).
The success of exploring species spatial and temporal distribution, population shifts, and understanding physical oceanographic phenomena is largely determined by the quality of data being analyzed. Limitations of data within Stellwagen Bank NMS therefore needed to capture dynamics throughout the entire Gulf of Maine to develop en-vironmental linkages which could then be used to explain the broad-scale patterns Gulf of Maine-wide and trends occurring with the Sanctuary proper. For instance, traditionally, cetacean and seabird sightings data have been represented as digital and non-digital distribution maps (atlases) using spatially aggregated observations, mean monthly density in large spatial grids, or summarized data represented as contours of relative abundance. While the “atlas” approach has made a valuable contribution to the understanding of broad-scale spatial patterns of seabirds, few studies have attempted to link the spatial and temporal patterns of seabirds and cetaceans to the surrounding environment at each location. Furthermore, the spatial resolution of these types of maps is coarse, and predictions are usually discontinuous due to limited sampling effort.
page viii
An Ecological Characterization of the Stellwagen Bank National Marine Sanctuary Region
Natural and anthropogenically induced variability in environmental condition is an important component in deter-mining the resilience and productivity of marine ecosystems. Long-term re-structuring of species assemblages are controlled by broad scale trends in environmental condition occurring at decadal or greater temporal scales (e.g. water stratification, North Atlantic Oscillation), whereas high amplitude shorter frequency variations (e.g. food availability, recruitment) induce local instabilities or distribution shifts of biological components (Sissenwine and Murawski, 2004). Understanding how well Stellwagen Bank NMS represent the diversity of species present within and among the Gulf of Maine biogeographic region is critical for assessing the conservation value of ma-rine resources and identifying gaps in the protection of biological diversity (Auster and Shackell, 2000). Through the development of sophisticated modeling techniques, it is now possible to link the distribution and abundance of biota quantitatively and temporally with the multi-dimensional environment at specific locations. This ap-proach has the additional desired benefit of being able to analyze natural and anthropogenic changes occurring outside Stellwagen Bank NMS which will ultimately affect distributions found within the Sanctuary.
This Document
The scientific team for this project represents an unparalleled depth and breadth of expertise. CCMA’s collabora-tion with Stellwagen Bank NMS and academic experts offered a previously uncapitalized opportunity to integrate a wide range of expertise both within the Center, as well as outside experts. The project provided an opportunity to integrate the capabilities of CCMA’s Biogeography an Coastal and Oceanographic Assessment Status and Trends teams into a unified, interdisciplinary product. The extent of the teaming approach is reflected in the di-versity of topics, size, and scope of the products. The report, map products, and geodatabase provide managers and scientists with a suite of analyses and information that, when coupled with pre-existing Sanctuary geospatial information, enables improved research, monitoring, and analysis activities within the Stellwagen Bank NMS region.
This report provides a series of science-based ecological studies that together offer a regional characterization of the Gulf of Maine based on the coupling of physical-chemical-biological processes. The modeling of ecological linkages implemented for this project has been demonstrated to be a valuable tool in advancing our knowledge and identifying the gaps in understanding of the many complex processes that dictate the overall ecosystem dynamics of the Gulf of Maine. This product would not have been possible without the critical step of peer review and contributions from a number of experts.
The following is an abbreviated executive summary of each of the five detailed chapters contained in the Ecologi-cal Characterization of Stellwagen Bank National Marine Sanctuary region:
Physical and Oceanographic Setting Stellwagen Bank is a partial boundary between Massachusetts Bay and the Gulf of Maine. As such it affects the conditions within Massachusetts Bay, and to a lesser extent, conditions in adjacent waters in the Gulf of Maine. The water properties in the vicinity of Stellwagen Bank are determined in part by the large scale counter-clock-wise circulation pattern and seasonal density layers within the Gulf of Maine. Oceanographic features on the Bank itself are primarily related to the strong tidal currents driven by an approximately three meter tidal range. These tidal currents interact directly with the sediments on the Bank, limiting accumulation of fine sediments. Tidal flows over the shallow Bank generate relatively large currents and during stratified periods internal waves (both stationary lee waves and propagating waves) result from these currents. All of these physical phenomena have the potential to enhance the flux of nutrients into the upper layer during periods of stratification, and thereby contribute to the high levels of productivity found in the region of the Bank. Additional nutrients may be supplied to the surface layers in the vicinity of the Bank by the tidal flow of water up the slopes of the Bank. In conjunction with the shallow depth, these currents may generate sufficient turbulence to mix nutrient rich water into the sur-face layer. The water column is generally stratified during the period from late spring through early fall, when light is maximum. Seasonal stratification suppresses water column mixing, contributing to the depletion of nutrients in the upper layer of the water column. Energetic tidal currents at the Bank overcome stratification, and thus lead to enhanced productivity. Strong primary productivity during the spring and fall promote rich secondary production which in turn fuels the ecologically diverse pelagic and benthic ecosystems. From a management and ecological perspective, it is necessary to understand the large-scale oceanographic patterns and how they influence the smaller-scale management unit of the Sanctuary. The Physical and Oceanographic Setting chapter contained

An Ecological Characterization of the Stellwagen Bank National Marine Sanctuary Region
within this report synthesizes and summarizes the wealth of scientific information for the large-scale ecosystem and its implications to the oceanographic patterns observed within the Sanctuary.
Characterization of Chemical Contaminants The status and trends of trace elements and organic contaminants in Massachusetts Bay as whole were as-sessed with the objective of investigating export of contaminants to the system. The foregoing assessment was conducted using contaminant concentrations in both sediment and tissue (mussels and fish). The current status of chemical contaminants in the shallow portions of Stellwagen Bank is significantly lower than those of the other region of Massachusetts Bay including Cape Cod Bay. Boston Harbor is the most polluted zone of the Massa-chusetts Bay/Cape Cod system. Sediments in the deep areas in Stellwagen Basin are accumulating contami-nants from a variety of sources. The temporal assessment revealed no statistically significant trends for trace metals and PAHs, while banned, but persistent organic contaminants (DDTs and chlordanes) show very slow decreasing trends over the monitoring years. The persistence of some organic compounds at relatively high con-centrations in Boston Harbor, implies that the Harbor may be a continuing source of contaminants to other areas of Massachusetts Bay. However, data in the current study indicates that pollution impacts in the Stellwagen Bank National Marine Sanctuary appear minimal. There is no indication that relocation of the Publicly Owned Treat-ment Works (POTW) effluent has had short term consequences on the magnitude of export of contaminants from Boston to Stellwagen Bank NMS. That is not to say that contaminant export from Boston is not occurring, only that it does not appear to have accelerated. Discharge reductions from improved sewage treatment efficiencies implemented by the Massachusetts Water Resources Authority have definitely aided in this regard.
Marine Fishes The Gulf of Maine has 652 documented species. The large diversity of marine fishes is attributed to the proximity of the region situated between the Acadian and Virginian biogeographic regions. Seasonal shifts in tempera-ture and productivity facilitate the mixing of northern and southern migrants, as well as on-shelf movements of slope and deep sea species. Stellwagen Bank NMS (and the Gulf of Maine) is dominated by resident species and species composition is seasonally affected. Additionally, a wide diversity of habitats and oceanographic conditions promote a diverse assemblage of species within the Sanctuary. Species diversity metrics were highly variable throughout the region and show that areas of ecological significance are not consistent spatially and/or temporally and are indicative of dynamic continental shelf fish communities. The Sanctuary’s high productivity is depicted as an area of high larval fish abundance, which is directly influenced by the oceanography of the region which facilitates high primary productivity. The wide diversity of habitats supports many species within a variety of trophic guilds of commercial or recreational relevance, such as cod and haddock. Several species within the Sanctuary are listed as a species of concern under the Endangered Species Act. Lastly, several species are abundant within the Sanctuary, but have limited distribution within the Gulf of Maine, (i.e. alligatorfish and snake blenny). The Sanctuary is also an important spawning ground for sand lance, an important prey item for many bird and mammals species.
Seabirds Distribution and Diversity Seabirds form an important ecological component of the Gulf of Maine ecosystem and their broad-ranging move-ments, longevity and sensitive dependence on fish prey make them useful bioindicators of ecosystem condition and change. The Gulf of Maine region including Stellwagen Bank has been recognized locally and internation-ally as an important area for seabirds, some of which have traveled many thousands of kilometers to utilize the rich food resources of the region. Areas with a high abundance and richness of seabirds are often considered of special interest in marine resource management strategies and in the design of marine protected areas (MPAs) or networks of MPAs. Determining which areas of the open ocean are most important to seabirds requires quantitative information on the spatial and temporal distribution of seabird species. This report describes the summer and winter distributions of several seabird species across the Gulf of Maine, with special emphasis on Stellwagen Bank. Novel regression tree techniques were applied to develop predictive spatial models and to quantitatively link the presence of seabirds with their environment, including data on sea surface conditions and bathymetry. We produced both effort-corrected presence maps and predictive maps of species occurrence for selected seabird species. Of the birds included in this study, sightings data indicated that non-breeding summer migrants (Greater Shearwater and Wilson’s Storm-petrel) were most prevalent within Sanctuary waters. At the scale of the Gulf of Maine, bathymetric features such as the coastline, the nearshore slopes along the northern sections of the Gulf of Maine, as well as bathymetric features such as Georges Bank, the Great South Channel, the Northeast Channel, and the waters offshore from the southern tip of Nova Scotia appear to represent distinct
page ix
page x
An Ecological Characterization of the Stellwagen Bank National Marine Sanctuary Region
features supporting a high diversity and abundance of seabirds. Overall, depth and sea surface temperature were the most important predictors. This information can be used to identify potential ecological hotspots and coldspots of occurrence both inside and outside the Sanctuary for both summer months and winter months.
Cetacean Distribution and Diversity The southern Gulf of Maine provides essential resources for approximately 13 species of whale and dolphin, several of which are endangered species. Stellwagen Bank represents a high-use area for many of the endan-gered large whales, yet relatively few studies have attempted to explain quantitatively the spatial and temporal distribution patterns for these populations over such a broad geographical area. For this report we first quantified and described seasonal spatial patterns of relative abundance for individual species of cetaceans, and for all large whales combined and all dolphins/porpoises combined. We then developed a spatially-explicit modeling approach for exploring cetacean-environment linkages using a wide range of environmental data with varying spatio-temporal resolutions. We incorporated both relatively static features, such as derivatives of bathymetric structure and relatively dynamic variables, such as prey abundance, sea surface conditions and water column structure (stratification).
Patterns of abundance revealed that some geographic areas consistently exhibited high abundance of multiple cetacean species, but that individual species exhibited distinctive spatio-temporal patterns across seasons. Our methods allowed us to rank the importance of individual environmental variables and in general, we found that static features, most notably the 100 m isobath, were better predictors of cetacean distribution patterns than were dynamic features, such as sea surface temperature and chlorophyll a concentration. The shoals and slope waters adjacent to the 100 m isobath including Stellwagen Bank and Jeffreys Ledge were identified as key high-use areas for all abundant cetacean species in the southern Gulf of Maine. Information on the specific environ-mental characteristics of high-use areas combined with maps of relative abundance provide useful ecological insights and essential baseline information to support individual species management and ecosystem-based management.
REFERENCES Auster, P. and N. Shackell. 2000. Marine protected areas for the temperate and boreal North Atlantic: the potential for sus-tainable fisheries and conservation of biodiversity. Northeastern Naturalist. 7:419-434.
Baumgartner, M.F. and B.R. Mate. 2005. Summer and fall habitat of North Atlantic right whales (Eubalaena glacialis) inferred from satellite telemetry. Canadian Journal of Fisheries and Aquatic Sciences 62:527-543.
Browman, H. and K. Stergiou. 2004. Marine protected areas as a central element of ecosystem-based management: defin-ing their location, size, and number. Marine Ecology Progress Series. 274:271-272.
Cook, R. and P. Auster. 2006. A bioregional classification for the continental shelf of the northeastern North America for con-servation analysis and planning based on representation. Marine Sanctuaries Conservation Series NMSP-06-09. National Oceanic and Atmospheric Administration, National Marine Sanctuary Program. Silver Spring, MD. 12 pp.
Greene, C., A. Pershing, B. Monger, M. Benfield, E. Durbin, and M. Casas. 2004. Supply-sided responses of climate-driven changes in North Atlantic Ocean. Oceanography. 17:60-71
Halpern, B. and R. Warner. 2003. Matching marine reserve design to reserve objectives. Proceedings of the Royal Society of London. Series B, Biological Science. 270:1871-1878.
Kendall, M. and M. Monaco. 2003. Biogeography of the National Marine Sanctuaries. NCCOS Technical Report. National Oceanic and Atmospheric Administration, National Centers for Coastal Ocean Science. Silver Spring, MD. 15 pp.
Sissenwine, M. and S. Murawski. 2004. Moving beyond ‘intelligent tinkering’: advancing an Ecosystem Approach to Fisher-ies. Marine Ecological Progress Series. 274:291-295.
An Ecological Characterization of the Stellwagen Bank National Marine Sanctuary Region
TABLE OF CONTENTS CHAPTER 1 - PHYSICAL AND OCEANOGRAPHIC SETTING .....................................................................1
1.1 INTRODUCTION ...............................................................................................................................1 1.2 CLIMATE AND WEATHER ...............................................................................................................3
Air Temperature ............................................................................................................................3 Precipitation..................................................................................................................................3 Wind...............................................................................................................................................3 Storms and Hurricanes................................................................................................................3 Long Term Climatic Phenomenon ..............................................................................................4
1.3 BATHYMETRY ..................................................................................................................................5 Bathymetric Complexity ..............................................................................................................6
1.4 BENTHIC SUBSTRATE....................................................................................................................8 Geologic History...........................................................................................................................8 Sediments .....................................................................................................................................8
1.5 SEA SURFACE TEMPERATURE ...................................................................................................12 Thermal Fronts ...........................................................................................................................14
1.6 CIRCULATION AND CURRENTS...................................................................................................15 Currents.......................................................................................................................................15 Stratification................................................................................................................................21
1.7 BIOTA..............................................................................................................................................32 Phytoplankton.............................................................................................................................32 Zooplankton................................................................................................................................36
1.8 SUMMARY ......................................................................................................................................40 LITERATURE CITED ............................................................................................................................50
CHAPTER 2 - CHARACTERIZATION OF CHEMICAL CONTAMINANTS ...................................................59 2.1 INTRODUCTION .............................................................................................................................59 2.2 METHODS.......................................................................................................................................59
Field Sampling............................................................................................................................59 Chemical Analyses.....................................................................................................................62 Benthic Community Analyses...................................................................................................63 Statistical Contrasts...................................................................................................................65
2.3 RESULTS AND DISCUSSION ........................................................................................................67 Sediment Texture........................................................................................................................67 Spatial Contaminant Assessment.............................................................................................67 Temporal Contaminant Assessment.........................................................................................71 Benthic Community Assessment .............................................................................................74 Fish Histopathology...................................................................................................................77 Contaminant Conditions in Stellwagen Bank National Marine Sanctuary............................82
2.4 SUMMARY AND APPLICATION TO WATER QUALITY MONITORING........................................85 LITERATURE CITED ............................................................................................................................87
CHAPTER 3 - MARINE FISHES....................................................................................................................89 3.0 INTRODUCTION .............................................................................................................................89 3.1 FISH DIVERSITY.............................................................................................................................89
Methods.......................................................................................................................................90 Site Description ..........................................................................................................................90 Regional Scale Analyses ...........................................................................................................90 Local Scale Analyses .................................................................................................................92 Results.........................................................................................................................................92 Patterns across region in relation to SBNMS..........................................................................93 Patterns of dominance and rarity ........................................................................................... 110 SBNMS/Strata comparison...................................................................................................... 110 Patterns in species regional and local accumulation curves .............................................. 110 Patterns at the scale of habitat patches.................................................................................122 Discussion ................................................................................................................................123
page xi

page xii
An Ecological Characterization of the Stellwagen Bank National Marine Sanctuary Region
3.2 ICHTHYOPLANKTON ...........................................................................................................................126 Data............................................................................................................................................126 Methods.....................................................................................................................................126 Results.......................................................................................................................................126 Conclusions..............................................................................................................................136
3.3 SELECT SPECIES SPATIAL AND TEMPORAL DISTRIBUTION ...............................................137 Redfish (Sebastes spp.) ............................................................................................................137 Barndoor skate (Dipturus laevis) ..............................................................................................143 Atlantic cod (Gadus morhua)....................................................................................................146 Atlantic herring (Clupea harengus) ..........................................................................................154 Atlantic mackerel (Scomber scombrus) ...................................................................................161 Haddock (Melanogrammus aeglefinus).....................................................................................168 Ocean pout (Macrozoarces americanus) ..................................................................................174 Pollock (Pollachius virens) ........................................................................................................180 Silver hake (Merluccius bilinearis).............................................................................................186 Spiny dogfish (Squalus acanthias) ...........................................................................................192 Thorny skate (Amblyraja radiata)..............................................................................................198 Yellowtail flounder (Limanda ferruginea) .................................................................................203 Alligatorfish (Aspidophoroides monopterygius)........................................................................209 Cusk (Brosme brosme) ..............................................................................................................212 Daubed Shanny (Leptoclinus maculatus) .................................................................................217 Northern sandlance (Ammodytes dubius)................................................................................220 Snakeblenny (Lumpenus lumpretaeformis) ..............................................................................224
LITERATURE CITED ..........................................................................................................................227 CHAPTER 4 - SEABIRD DISTRIBUTION AND DIVERSITY.......................................................................231
4.1 INTRODUCTION ...........................................................................................................................231 Seabirds and the Gulf of Maine...............................................................................................231 Conservation Status.................................................................................................................232 Threats to Seabirds..................................................................................................................232 Seabird-Environment Linkages...............................................................................................233 The Challenge of Understanding Seabird Distribution and Abundance.............................234 Main Objectives ........................................................................................................................235
4.2 METHODS.....................................................................................................................................235 Seabird data..............................................................................................................................235 Seabird sampling techniques..................................................................................................235 Survey Effort .............................................................................................................................236 Data selection ..........................................................................................................................236 Environmental data ..................................................................................................................238 Modeling technique..................................................................................................................238
4.3 RESULTS ......................................................................................................................................240 Summary information ..............................................................................................................240 Temporal patterns of total abundance ...................................................................................240 Seabird distributions ...............................................................................................................240 Patterns of Multi-Species Occurrence ...................................................................................249 Patterns of mean number of species......................................................................................253 Seabird utilization of Stellwagen Bank National Marine Sanctuary ....................................255
4.4 DISCUSSION ................................................................................................................................255 Model Interpretation, Limitations and Research and Management Implications...............257
LITERATURE CITED ..........................................................................................................................259 CHAPTER 5 - CETACEAN DISTRIBUTION AND DIVERSITY...................................................................265
5.0 OBJECTIVES................................................................................................................................265 5.1 INTRODUCTION ...........................................................................................................................265
Cetaceans in the Gulf of Maine ...............................................................................................265 Threats to cetaceans................................................................................................................267

An Ecological Characterization of the Stellwagen Bank National Marine Sanctuary Region
Cetacean-prey linkages ...........................................................................................................269 5.2 METHODS.....................................................................................................................................270
Cetacean sightings data ..........................................................................................................270 Calculating diversity indices...................................................................................................274 Interpolating grid cell data ......................................................................................................277 Environmental Data..................................................................................................................277 Predictive modeling .................................................................................................................279
5.3 RESULTS ......................................................................................................................................280 Cetacean-environment modeling............................................................................................287
5.4 DISCUSSION ................................................................................................................................308 Bathymetric features................................................................................................................308 Species-environment relationships........................................................................................313 Applications and limitations....................................................................................................316
LITERATURE CITED ..........................................................................................................................318 APPENDIX ...................................................................................................................................................327 ACKNOWLEDGEMENTS............................................................................................................................356
page xiii
page xiv
An Ecological Characterization of the Stellwagen Bank National Marine Sanctuary Region
List of Tables
Table 1.4.1. Benthic sediment type in the Gulf of Maine.................................................................................10 Table 1.4.2. Benthic sediment type within Stellwagen Bank NMS..................................................................10 Table 1.6.1. Characteristic Scales for internal waves along the New England shelf and the Gulf of Maine. ..26 Table 1.7.1. Summary statistics for NEFSC MARMAP zooplankton ordinary and indicator kriging. ..............37 Table 2.2.1. Location of Bioeffects sample sites and strata within Boston Harbor and Massachusetts Bay...62 Table 2.2.2. Summary of Bioeffects contaminant parameters and analytical methods. .................................63 Table 2.2.3. Chemical and chemical groups for which ERLs and ERMs have been derived .........................64 Table 2.3.1. Metal and organic contaminant concentrations among strata, 2004 bioeffects ..........................68 Table 2.3.2. Metal and organic contaminant concentrations among strata, Benthic Surveillance (1984-91) .69 Table 2.3.3. Metal and organic contaminant concentrations among strata, Mussel Watch ............................70 Table 2.3.4. List of numerically dominant species in each node identified in the cluster analyses.................77 Table 2.3.5. Benthic community parameters in sediment samples from Boston Harbor
and Massachusetts Bay. .............................................................................................................78 Table 2.3.6. Histological lesions assessed in winter flounder (Pleuronectes americanus)
from Boston Harbor and Massachusetts Bay. .............................................................................79 Table 2.3.7. Histopathology assessment results from winter flounder (Pleuronectes americanus)
captured within Boston Harbor and Massachusetts Bay, 1988-2004..........................................80 Table 2.3.8. Number of contaminants exceeding ERL and ERM thresholds in sediment
samples from Boston Harbor and Massachusetts Bay................................................................84 Table 3.1.1. Dominant species within SBNMS and the Gulf of Maine trawl samples, spring 1975-2005 ..... 111 Table 3.1.2. Dominant species within SBNMS and the Gulf of Maine trawl samples, fall 1975-2005 .......... 112 Table 3.1.3. Rare species captured in NMFS trawl samples within SBNMS, spring 1975-2005 .................. 115 Table 3.1.4. Rare species captured in NMFS trawl samples within SBNMS, fall 1975-2004 ....................... 116 Table 3.1.5. Rare species captured in NMFS trawl samples within the Gulf of Maine, spring 1975-2005.... 117 Table 3.1.6. Rare species captured in NMFS trawl samples within the Gulf of Maine, fall 1975-2004......... 119 Table 3.1.7. Residency status of fishes collected at SBNMS compared with all species
in the GOM sub-region. ............................................................................................................124 Table 3.2.1. Summary kriging statistics for NEFSC ichthyoplankton abundance. ........................................127 Table 3.2.2. Dominant species taken in ichthyoplankton samples within the
Gulf of Maine, spring 1977-1988. .............................................................................................128 Table 3.2.3. Dominant species taken in ichthyoplankton samples within the Gulf of Maine,
summer 1977-1987. .................................................................................................................130 Table 3.2.4. Dominant species taken in ichthyoplankton samples within the Gulf of Maine,
fall 1977-1987 ...........................................................................................................................132 Table 3.2.5. Dominant species taken in ichthyoplankton samples within the Gulf of Maine,
winter 1977-1987 ......................................................................................................................134 Table 3.3.1. Frequency of occurrence and abundance for all redfish captured in NMFS
trawl surveys within Stellwagen Bank NMS ..............................................................................138 Table 3.3.2. Frequency of occurrence and abundance for all barndoor skate captured in
NMFS trawl surveys within Stellwagen Bank NMS ...................................................................146 Table 3.3.3. Frequency of occurrence and abundance for all Atlantic cod captured in NMFS
trawl surveys within Stellwagen Bank NMS ..............................................................................154 Table 3.3.4. Frequency of occurrence and abundance for all Atlantic herring captured in
NMFS trawl surveys within Stellwagen Bank NMS ...................................................................156 Table 3.3.5. Frequency of occurrence and abundance for all Atlantic mackerel captured in
NMFS trawl surveys within Stellwagen Bank NMS ...................................................................163 Table 3.3.6. Frequency of occurrence and abundance for all haddock captured in NMFS
trawl surveys within Stellwagen Bank NMS ..............................................................................169 Table 3.3.7. Frequency of occurrence and abundance for all ocean pout captured in
NMFS trawl surveys within Stellwagen Bank NMS ...................................................................175 Table 3.3.8. Frequency of occurrence and abundance for all pollock captured in NMFS
trawl surveys within Stellwagen Bank NMS ..............................................................................181

An Ecological Characterization of the Stellwagen Bank National Marine Sanctuary Region
Table 3.3.9. Frequency of occurrence and abundance for all silver hake captured in NMFS trawl surveys within Stellwagen Bank NMS...........................................................................192
Table 3.3.10. Frequency of occurrence and abundance for all spiny dogfish captured in NMFS trawl surveys within Stellwagen Bank NMS............................................................................193
Table 3.3.11. Frequency of occurrence and abundance for all thorny skate captured in NMFS trawl surveys within Stellwagen Bank NMS............................................................................203
Table 3.3.12. Frequency of occurrence and abundance for all yellowtail flounder captured in NMFS trawl surveys within Stellwagen Bank NMS.................................................................204
Table 3.3.13. Frequency of occurrence and abundance for all alligatorfish captured in NMFS trawl surveys within Stellwagen Bank NMS............................................................................209
Table 3.3.14. Frequency of occurrence and abundance for all cusk captured in NMFS trawl surveys within Stellwagen Bank NMS. ..................................................................................217
Table 3.3.15. Frequency of occurrence and abundance for all daubed shanny captured in NMFS trawl surveys within Stellwagen Bank NMS. .........................................................................220
Table 3.3.16. Frequency of occurrence and abundance for all northern sandlance captured in NMFS trawl surveys within Stellwagen Bank NMS. ..............................................................221
Table 3.3.17. Frequency of occurrence and abundance for all snakeblenny captured in NMFS trawl surveys within Stellwagen Bank NMS. .........................................................................224
Table 4.2.1. Allocation of seabird survey effort by month for the Gulf of Maine study area based on MBO and PIROP combined (1965-1988). .........................................................................236
Table 4.2.2. Attributes and source of environmental variables used to predict habitat preferences based on seabird occurrence in the Gulf of Maine .................................................................236
Table 4.3.1. Predictors and their relative contribution (%) to the explained variation in the response variable as computed by TreeNet™........................................................................242
Table 4.4.1. Hotspots and coldspots of prevalence for selected seabird species/group for the Gulf of Maine study area based on effort corrected presence data for both summer and winter seasons ...................................................................................................258
Table 5.2.1. Dataset and logical error summary for the cetacean component of the Manomet Bird Observatory Database (Manometc.txt)............................................................273
Table 5.2.2. Total track length (km) surveyed with the southern Gulf of Maine study area by season (MBO and NARWC data combined 1970-2005)....................................................277
Table 5.2.3. Environmental variables used to explain spatial patterns in cetacean densities in the southern Gulf of Maine study area................................................................................277
Table 5.2.4. Log transformed cetacean sightings-per-unit-effort (SPUE) grouped by season using combined MBO and NARWC data (1997-2005) ...........................................................279
Table 5.3.1. Total cetacean sightings-per-unit-effort (SPUE) grouped by season using combined MBO and NARWC data (1970-2005). ....................................................................280
Table 5.3.2. Comparison between model performance (measured by r2) using linear and non-linear regression techniques within MARS™ software ....................................................293
Table 5.3.3. Summary of MARS model results showing model performance (r2) and the most influential environmental variables determined by calculating the change in model performance when each variable is excluded from the model .................................293
Table 5.3.4 List of the most influential variables determining spatial patterns in Humpback whale abundance in the southern Gulf of Maine for a) spring and b) summer based on the cost of omission calculated by MARS™ software.............................................294
Table 5.3.5. List of the most influential variables determining spatial patterns in Fin whale abundance in the southern Gulf of Maine for a) spring and b) summer based on the cost of omission calculated by MARS™ software.............................................................296
Table 5.3.6. List of the most influential variables determining spatial patterns in Minke whale abundance in the southern Gulf of Maine for a) spring and b) summer based on the cost of omission calculated by MARS™ software...................................................................298
Table 5.3.7. List of the most influential variables determining spatial patterns in North Atlantic right whale abundance in the southern Gulf of Maine for a) spring and b) summer based on the cost of omission calculated by MARS™ software............................................300
page xv
page xvi
An Ecological Characterization of the Stellwagen Bank National Marine Sanctuary Region
Table 5.3.8. List of the most influential variables determining spatial patterns in Sei whale abundance in the southern Gulf of Maine for a) spring and b) summer based on the cost of omission calculated by MARS™ software............................................................303
Table 5.3.9. List of the most influential variables determining spatial patterns in Atlantic white-sided dolphin abundance in the southern Gulf of Maine for a) spring and b) summer based on the cost of omission calculated by MARS™ software............................................................305
List of Figures
Figure 1. Boundary of Stellwagen Bank National Marine Sanctuary ....................................................... iv Figure 2. Generalized biogeographic approach used to study Stellwagen Bank National
Marine Sanctuary......................................................................................................................vi Figure 3. Gulf of Maine study region .......................................................................................................vii Figure 1.1.1. Major features within the Gulf of Maine .....................................................................................1 Figure 1.1.2. Geologic features within Stellwagen Bank National Marine Sanctuary .....................................2 Figure 1.3.1. Gulf of Maine bathymetry with contour lines to 100 m...............................................................5 Figure 1.3.2. Bathymetry within Stellwagen Bank National Marine Sanctuary ...............................................6 Figure 1.3.3. Bathymetric complexity within the Gulf of Maine .......................................................................7 Figure 1.3.4. Bathymetric complexity within the Stellwagen Bank National Marine Sanctuary.......................8 Figure 1.4.1. Broad-scale sediment composition with the Gulf of Maine ........................................................9 Figure 1.4.2. Backscatter intensity and shaded relief topography of Stellwagen Bank NMS........................ 11 Figure 1.4.3. Percent area (km2) of substrate composition within Stellwagen Bank NMS............................ 11 Figure 1.5.1. Spring and summer mean sea surface temperature within the Gulf of Maine, 1985-2004......13 Figure 1.5.2. Fall and winter mean sea surface temperature within the Gulf of Maine, 1985-2004..............14 Figure 1.5.3. Sea surface temperature analysis within Stellwagen Bank NMS: top-monthly mean;
middle-seasonal mean; bottom-temperature anomaly.............................................................15 Figure 1.6.1. General pattern of non-tidal surface circulation within the Gulf of Maine.................................16 Figure 1.6.2. Mean monthly current speed and standard deviation for in-situ measurements
(2002-2006) taken at GoMOOS Buoy A0116 within Massachusetts Bay. ...............................18 Figure 1.6.3. Simulated seasonal mean surface current magnitude and direction, 1998-2003....................19 Figure 1.6.4. Simulated seasonal mean sub-surface (25 m) current magnitude and direction, 1998-2003..20 Figure 1.6.5. NOAA drifter tracks in southwestern Gulf of Maine..................................................................21 Figure 1.6.6. NOAA drifter tracks in Boston Harbor and Massachusetts Bay. ..............................................21 Figure 1.6.7. Water stratification index for the Gulf of Maine, 1912-2004.....................................................23 Figure 1.6.8. Water stratification index for the Gulf of Maine, 1994-2004.....................................................24 Figure 1.6.9. Water stratification index for the Gulf of Maine, 2004 ..............................................................24 Figure 1.6.10. Internal wave profile along a survey transect between Scituate, MA
and Stellwagen Bank, August 14-15, 1999..............................................................................27 Figure 1.6.11. SAR image (August 22, 2003 6:51 am EST) of shoreward propagating internal
wave packets off the tip of Cape Cod in Massachusetts Bay ..................................................27 Figure 1.6.12. SAR image (August 8, 2002 6:23 pm EST) of shoreward propagating internal wave
packets east of Stellwagen Bank in Massachusetts Bay .........................................................27 Figure 1.6.13. Internal wave packet density (km2) May-September 1997, 1998, 2001, 2002,
2003 in Massachusetts Bay. ...................................................................................................28 Figure 1.6.14. SAR image (August 8, 1997 5:24 pm EST) of biogenic slicks north of Cape Cod...................28 Figure 1.6.15. Tidal zones in Massachusetts Bay as delineated by NOAA’s COOPS ....................................29 Figure 1.6.16. Mean frequency of internal wave packets by month and year .................................................30 Figure 1.6.17. Mean frequency of internal wave packets (±1 SE) propagating west, east and
both directions in Synthetic Aperture Radar (SAR) imagery 1997-2003..................................30 Figure 1.6.18. Mean internal wave packet area (km2 ±1 SE) by month (top) and year (bottom)
delineated from Synthetic Aperture Radar (SAR) imagery May-September, 1997-2003.........31 Figure 1.6.19.Mean internal wave packet area (km2 ±1 SE) by propagation direction for month
and year delineated from Synthetic Aperture Radar (SAR) imagery May-September, 1997-2003 ....................................................................................................31
Figure 1.7.1. Spring and summer mean chlorophyll concentration within the Gulf of Maine, 1998-2005.....34
An Ecological Characterization of the Stellwagen Bank National Marine Sanctuary Region
Figure 1.7.2. Fall (1997-2005) and winter (1998-2005) mean chlorophyll concentration within the Gulf of Maine......................................................................................................................35
Figure 1.7.3. Chlorophyll concentration within Stellwagen Bank NMS: top-monthly mean; middle-seasonal mean; bottom-chlorophyll anomaly. ..............................................................36
Figure 1.7.4. Location of NEFSC MARMAP zooplankton surveys, 1977-1988. ...........................................37 Figure 1.7.5. Predicted zooplankton abundance during spring (1977-1998) within the Gulf of Maine..........41 Figure 1.7.6. Probability of zooplankton abundance greater than the mean for the study area,
spring 1977-1988 .....................................................................................................................42 Figure 1.7.7. Seasonal relative abundance of dominant zooplankton captured in NEFSC MARMAP
zooplankton surveys, 1977-1988.............................................................................................43 Figure 1.7.8. Predicted zooplankton abundance during summer (1977-1998) within the Gulf of Maine ......44 Figure 1.7.9. Probability of zooplankton abundance greater than the Gulf of Maine mean,
summer 1977-1988..................................................................................................................45 Figure 1.7.10. Predicted zooplankton abundance during fall (1977-1998) within the Gulf of Maine ..............46 Figure 1.7.11. Probability of zooplankton abundance greater than the Gulf of Maine mean, fall 1977-1988.47 Figure 1.7.12. Predicted zooplankton abundance during winter (1977-1998) within the Gulf of Maine .........48 Figure 1.7.13. Probability of zooplankton abundance greater than the Gulf of Maine mean
winter 1977-1988 .....................................................................................................................49 Figure 2.2.1. Study area with six sampling strata within Massachusetts Bay and the
Stellwagen Bank NMS. ............................................................................................................60 Figure 2.2.2. Location of NS&T Bioeffects sampling sites within the Massachusetts Bay
sampling strata, 2004...............................................................................................................61 Figure 2.2.3. Location of National Benthic Surveillance sites within Massachusetts Bay. ............................61 Figure 2.2.4. Schematic of nodal analysis illustrating the intersection of species abundance
and site cluster analysis...........................................................................................................65 Figure 2.2.5. Location of NS7T Mussel Watch sites within Massachusetts Bay. ..........................................66 Figure 2.2.6. Location of MWRA sampling sites and statistical grouping areas within Massachusetts Bay .66 Figure 2.3.1a.Mean percent sand, silt, and clay content in sediments within sampling strata, 2004.............67 Figure 2.3.1b.Mean percent organic carbon in sediments within sampling strata, 2004. ..............................67 Figure 2.3.2. Correlation of log10 normalized cadmium, total DDT, and PAHs with percent sand and
percent organic carbon in sediment within Boston Harbor and Massachusetts Bay ...............68 Figure 2.3.3. Concentration of select metals (Cd and Pb) and organics (total PCBs and DDT) in
sediments within Massachusetts Bay ......................................................................................69 Figure 2.3.4. Sediment contaminants within strata .......................................................................................70 Figure 2.3.5. Variability among contaminant concentration of paired strata .................................................71 Figure 2.3.6. Tissue contaminant concentration in blue mussels (Mytilus edulis) at Mussel Watch
sample sites (1988-2003). .......................................................................................................72 Figure 2.3.7. Concentration of organic contaminants found in winter flounder (Pleuronectes americanus)
liver samples from Deer Island (DI) in Boston Harbor and the new sewage outfall (OF) in Massachusetts Bay. .............................................................................................................72
Figure 2.3.8. Temporal variation of select contaminant (Cr, Cu, Chlordanes, and PAHs) concentrations in Boston Harbor sediments ............................................................................73
Figure 2.3.9. Temporal variation of selected metal concentrations (Cd, Hg, Pb and Se) found in blue mussel (Mytilus edulis) tissue collected in Massachusetts Bay .......................................73
Figure 2.3.10.Temporal variation of select organic concentration (DDT, PAHs, and PCBs) found in blue mussel (Mytilus edulis) tissue collected in Massachusetts Bay .......................................74
Figure 2.3.11.Temporal variation of lead, zinc, total Chlordanes, and DDT concentrations in winter flounder (Pleuronectes americanus) liver samples .......................................................75
Figure 2.3.12.Location of sites representative of three major habitat nodes in the Boston Harbor/Massachusetts Bay region...........................................................................................75
Figure 2.3.13.Nodal analysis displaying species clusters and site clusters for benthic community assessment in Massachusetts Bay and vicinity. Color indicates species specific relative abundance in 25% increments ....................................................................................76
Figure 2.3.14.Mean ERM quotients for sampling stations in the Boston Harbor/Massachusetts
page xvii
An Ecological Characterization of the Stellwagen Bank National Marine Sanctuary Region
page xviii
Bay vicinity. ..............................................................................................................................83 Figure 3.3.1. NMFS sampling strata for the Gulf of Maine sub-region..........................................................91 Figure 3.3.2. Formulas for diversity indices used to examine fish diversity within the Gulf
of Maine sub-region .................................................................................................................92 Figure 3.1.3. Species richness time-series (five year increments) within NMFS sampling
strata, Spring 1975-2005 .........................................................................................................94 Figure 3.1.4. Species richness time-series (five year increments) within NMFS sampling
strata, Fall 1975-2004..............................................................................................................95 Figure 3.1.5. Seasonal mean diversity for sampling strata across all years .................................................96 Figure 3.1.6. Margalef’s diversity index time-series (five year increments) within NMFS
sampling strata, Spring 1975-2005..........................................................................................98 Figure 3.1.7. Margalef’s diversity index time-series (five year increments) within NMFS
sampling strata, Fall 1975-2004...............................................................................................99 Figure 3.1.8. Mean number of rare species captured by NMFS trawls within seasonal year-bins
regressed on mean values for Margalef’s diversity index ......................................................100 Figure 3.1.9. Shannon’s diversity index time-series (five year increments) within NMFS sampling
strata, Spring 1975-2005 .......................................................................................................101 Figure 3.1.10. Shannon’s diversity index time-series (five year increments) within NMFS sampling
strata, Fall 1975-2004............................................................................................................102 Figure 3.1.11. Mean number of rare species captured by NMFS trawls within seasonal year-bins
regressed on mean values for Shannon’s diversity index......................................................105 Figure 3.1.12.Simpson’s diversity index time-series (five year increments) within NMFS sampling
strata, Spring 1975-2005 .......................................................................................................103 Figure 3.1.13. Simpson’s diversity index time-series (five year increments) within NMFS sampling
strata, Fall 1975-2004............................................................................................................104 Figure 3.1.14.a) Number of abundant species (> 5% of total abundance) and b) Simpson diversity ..........105 Figure 3.1.15.Taxonomic diversity time-series (five year increments) within NMFS sampling
strata, Spring 1975-2005 .......................................................................................................106 Figure 3.1.16.Taxonomic diversity time-series (five year increments) within NMFS sampling
strata, Fall 1975-2004............................................................................................................107 Figure 3.1.17.Taxonomic distinctness time-series (five year increments) within NMFS sampling
strata, Spring 1975-2005 .......................................................................................................108 Figure 3.1.18.Taxonomic distinctness time-series (five year increments) within NMFS sampling
strata, Fall 1975-2004............................................................................................................109 Figure 3.1.19.Strata used to compare diversity indices with SBNMS (strata 1260)..................................... 110 Figure 3.1.20.Species accumulation curves for trawl samples collected within SBNMS compared
with the Gulf of Maine region, spring 1975-2005 ................................................................... 113 Figure 3.1.21.Species accumulation curves for trawl samples collected within SBNMS compared
with the Gulf of Maine region, fall 1975-2004 ........................................................................ 114 Figure 3.1.22.Diversity comparisons (species richness, Margalef and Shannon’s Index) between
SBNMS and other strata within the region with similar bathymetric profiles..........................121 Figure 3.1.23.Diversity comparisons (Simpson’s Index, taxonomic diversity and distinctness)
between SBNMS and other strata within the region with similar bathymetric profiles ...........122 Figure 3.1.24.Species-area and species-individual regressions from video transects across a range
of habitat types at SBNMS in 2000........................................................................................123 Figure 3.1.25.Species-area and species-individual regressions from video transects on boulder
reefs inside and outside the Western Gulf of Maine closure in 2002.....................................124 Figure 3.2.1. Ichthyoplankton samples within the Gulf of Maine, 1977-1988..............................................126 Figure 3.2.2. Overall ichthyoplankton abundance and standard error within study area by season-year...127 Figure 3.2.3. Predicted ichthyoplankton abundance during spring (1977-1988) within the Gulf of Maine..129 Figure 3.2.4. Predicted ichthyoplankton abundance during summer (1977-1987) within the Gulf of Maine131 Figure 3.2.5. Predicted ichthyoplankton abundance during fall (1977-1987) within the Gulf of Maine .......133 Figure 3.2.6. Predicted ichthyoplankton abundance during winter (1977-1987) within the Gulf of Maine ..135 Figure 3.3.1. Abundance and distribution of adult redfish (Sebastes spp.) within the Gulf of Maine,

An Ecological Characterization of the Stellwagen Bank National Marine Sanctuary Region
Spring 1975-2005. .................................................................................................................139 Figure 3.3.2. Abundance and distribution of juvenile redfish (Sebastes spp.) within the Gulf of Maine,
Spring 1975-2005. .................................................................................................................140 Figure 3.3.3. Abundance and distribution of adult redfish (Sebastes spp.) within the Gulf of Maine,
Fall 1975-2004. ......................................................................................................................141 Figure 3.3.4. Abundance and distribution of juvenile redfish (Sebastes spp.) within the Gulf of Maine,
Fall 1975-2004. ......................................................................................................................142 Figure 3.3.5. Abundance and distribution of adult barndoor skate (Dipturus laevis) within the
Gulf of Maine, Spring 1975-2005...........................................................................................144 Figure 3.3.6. Abundance and distribution of juvenile barndoor skate (Dipturus laevis) within the
Gulf of Maine, Spring 1975-2005. ..........................................................................................145 Figure 3.3.7. Abundance and distribution of adult barndoor skate (Dipturus laevis) within the
Gulf of Maine, Fall 1975-2004................................................................................................147 Figure 3.3.8. Abundance and distribution of juvenile barndoor skate (Dipturus laevis) within the
Gulf of Maine, Fall 1975-2004................................................................................................148 Figure 3.3.9. Abundance and distribution of adult Atlantic cod (Gadus morhua) within the
Gulf of Maine, Spring 1975-2005. ..........................................................................................150 Figure 3.3.10.Abundance and distribution of juvenile Atlantic cod (Gadus morhua) within the
Gulf of Maine, Spring 1975-2005...........................................................................................151 Figure 3.3.11.Abundance and distribution of adult Atlantic cod (Gadus morhua) within the
Gulf of Maine, Fall 1975-2004................................................................................................152 Figure 3.3.12.Abundance and distribution of juvenile Atlantic cod (Gadus morhua) within the
Gulf of Maine, Fall 1975-2004................................................................................................153 Figure 3.3.13.Abundance and distribution of adult Atlantic herring (Clupea harengus) within the
Gulf of Maine, Spring 1975-2005...........................................................................................157 Figure 3.3.14.Abundance and distribution of juvenile Atlantic herring (Clupea harengus)
within the Gulf of Maine, Spring 1975-2005...........................................................................158 Figure 3.3.15.Abundance and distribution of adult Atlantic herring (Clupea harengus)
within the Gulf of Maine, Fall 1975-2004 ...............................................................................159 Figure 3.3.16.Abundance and distribution of juvenile Atlantic herring (Clupea harengus)
within the Gulf of Maine, Fall 1975-2004 ...............................................................................160 Figure 3.3.17.Abundance and distribution of adult Atlantic mackerel (Scomber scombrus)
within the Gulf of Maine, Spring 1975-2005...........................................................................164 Figure 3.3.18.Abundance and distribution of juvenile Atlantic mackerel (Scomber scombrus)
within the Gulf of Maine, Spring 1975-2005...........................................................................165 Figure 3.3.19.Abundance and distribution of adult Atlantic mackerel (Scomber scombrus)
within the Gulf of Maine, Fall 1975-2004 ...............................................................................166 Figure 3.3.20.Abundance and distribution of juvenile Atlantic mackerel (Scomber scombrus)
within the Gulf of Maine, Fall 1975-2004 ...............................................................................167 Figure 3.3.21.Abundance and distribution of adult haddock (Melanogrammus aeglefinus)
within the Gulf of Maine, Spring 1975-2005...........................................................................170 Figure 3.3.22.Abundance and distribution of juvenile haddock (Melanogrammus aeglefinus)
within the Gulf of Maine, Spring 1975-2005...........................................................................171 Figure 3.3.23.Abundance and distribution of adult haddock (Melanogrammus aeglefinus)
within the Gulf of Maine, Fall 1975-2004 ...............................................................................172 Figure 3.3.24.Abundance and distribution of juvenile haddock (Melanogrammus aeglefinus)
within the Gulf of Maine, Fall 1975-2004 ...............................................................................173 Figure 3.3.25.Abundance and distribution of adult ocean pout (Macrozoarces americanus)
within the Gulf of Maine, Spring 1975-2005...........................................................................176 Figure 3.3.26.Abundance and distribution of juvenile ocean pout (Macrozoarces americanus)
within the Gulf of Maine, Spring 1975-2005...........................................................................177 Figure 3.3.27.Abundance and distribution of adult ocean pout (Macrozoarces americanus)
within the Gulf of Maine, Fall 1975-2004 ...............................................................................178 Figure 3.3.28.Abundance and distribution of juvenile ocean pout (Macrozoarces americanus)
page xix
An Ecological Characterization of the Stellwagen Bank National Marine Sanctuary Region
page xx
within the Gulf of Maine, Fall 1975-2004. ..............................................................................179 Figure 3.3.29.Abundance and distribution of adult pollock (Pollachius virens)
within the Gulf of Maine, Spring 1975-2005...........................................................................182 Figure 3.3.30.Abundance and distribution of juvenile pollock (Pollachius virens)
within the Gulf of Maine, Spring 1975-2005...........................................................................183 Figure 3.3.31.Abundance and distribution of adult pollock (Pollachius virens)
within the Gulf of Maine, Fall 1975-2004. ..............................................................................184 Figure 3.3.32.Abundance and distribution of juvenile pollock (Pollachius virens)
within the Gulf of Maine, Fall 1975-2004. ..............................................................................185 Figure 3.3.33. Abundance and distribution of adult silver hake (Merluccius bilinearis)
within the Gulf of Maine, Spring 1975-2005...........................................................................188 Figure 3.3.34.Abundance and distribution of juvenile silver hake (Merluccius bilinearis)
within the Gulf of Maine, Spring 1975-2005...........................................................................189 Figure 3.3.35.Abundance and distribution of adult silver hake (Merluccius bilinearis)
within the Gulf of Maine, Fall 1975-2004 ...............................................................................190 Figure 3.3.36.Abundance and distribution of juvenile silver hake (Merluccius bilinearis)
within the Gulf of Maine, Fall 1975-2004 ...............................................................................191 Figure 3.3.37.Abundance and distribution of adult spiny dogfish (Squalus acanthias)
within the Gulf of Maine, Spring 1975-2005...........................................................................194 Figure 3.3.38.Abundance and distribution of juvenile spiny dogfish (Squalus acanthias)
within the Gulf of Maine, Spring 1975-2005...........................................................................195 Figure 3.3.39.Abundance and distribution of adult spiny dogfish (Squalus acanthias)
within the Gulf of Maine, Fall 1975-2004 ...............................................................................196 Figure 3.3.40.Abundance and distribution of juvenile spiny dogfish (Squalus acanthias)
within the Gulf of Maine, Fall 1975-2004 ...............................................................................197 Figure 3.3.41.Abundance and distribution of adult thorny skate (Amblyraja radiata)
within the Gulf of Maine, Spring 1975-2005...........................................................................199 Figure 3.3.42.Abundance and distribution of juvenile thorny skate (Amblyraja radiata)
within the Gulf of Maine, Spring 1975-2005...........................................................................200 Figure 3.3.43.Abundance and distribution of adult thorny skate (Amblyraja radiata)
within the Gulf of Maine, Fall 1975-2004 ...............................................................................201 Figure 3.3.44.Abundance and distribution of juvenile thorny skate (Amblyraja radiata)
within the Gulf of Maine, Fall 1975-2004 ...............................................................................202 Figure 3.3.45.Abundance and distribution of adult yellowtail flounder (Limanda ferruginea)
within the Gulf of Maine, Spring 1975-2005...........................................................................205 Figure 3.3.46.Abundance and distribution of juvenile yellowtail flounder (Limanda ferruginea)
within the Gulf of Maine, Spring 1975-2005...........................................................................206 Figure 3.3.47.Abundance and distribution of adult yellowtail flounder (Limanda ferruginea)
within the Gulf of Maine, Fall 1975-2004 ...............................................................................207 Figure 3.3.48.Abundance and distribution of juvenile yellowtail flounder (Limanda ferruginea)
within the Gulf of Maine, Fall 1975-2004 ...............................................................................208 Figure 3.3.49.Abundance and distribution of adult and juvenile alligatorfish
(Aspidophoroides monopterygius) within the Gulf of Maine, Spring 1975-2005....................210 Figure 3.3.50.Abundance and distribution of adult and juvenile alligatorfish
(Aspidophoroides monopterygius.) within the Gulf of Maine, Fall 1975-2004........................ 211 Figure 3.3.51.Abundance and distribution of adult cusk (Brosme brosme) within the
Gulf of Maine, Spring 1975-2005...........................................................................................213 Figure 3.3.52.Abundance and distribution of juvenile cusk (Brosme brosme) within the
Gulf of Maine, Spring 1975-2005...........................................................................................214 Figure 3.3.53.Abundance and distribution of adult cusk (Brosme brosme) within the
Gulf of Maine, Fall 1975-2004................................................................................................215 Figure 3.3.54.Abundance and distribution of juvenile cusk (Brosme brosme) within the
Gulf of Maine, Fall 1975-2004................................................................................................216 Figure 3.3.55.Abundance and distribution of adult and juvenile daubed shanny
An Ecological Characterization of the Stellwagen Bank National Marine Sanctuary Region
(Leptoclinus maculatus) within the Gulf of Maine, Spring 1975-2005....................................218 Figure 3.3.56.Abundance and distribution of adult and juvenile daubed shanny
(Leptoclinus maculatus) within the Gulf of Maine, Fall 1975-2004. .......................................219 Figure 3.3.57.Abundance and distribution of Northern sand lance (Ammodytes dubius)
within the Gulf of Maine, Spring 1975-2005...........................................................................222 Figure 3.3.58.Abundance and distribution of Northern sand lance (Ammodytes dubius)
within the Gulf of Maine, Fall 1975-2004. ..............................................................................223 Figure 3.3.59.Abundance and distribution of snakeblenny (Lumpenus lumpretaeformis)
within the Gulf of Maine, Spring 1975-2005...........................................................................225 Figure 3.3.60.Abundance and distribution of snakeblenny (Lumpenus lumpretaeformis)
within the Gulf of Maine, Fall 1975-2004. ..............................................................................226 Figure 4.1.1. Watercolor painting of the extinct Great Auk (Pinguinus impennis) painted
in 1839 from a preserved specimen belonging to J.J. Audubon Esq. ....................................233 Figure 4.2.1. Sampling effort for the Gulf of Maine study area calculated in 5 minute bins
for (a) summer (Apr 15 – Oct 15) and (b) winter (Oct 16 – Apr 14) seasons .........................237 Figure 4.2.2. Distance from MBO transect point to the nearest coastline (both mainland and islands)......238 Figure 4.2.3. Mean chlorophyll a concentration, mean SST and mean turbidity for
July (summer) and December (winter)...................................................................................239 Figure 4.3.1. Percent frequency of occurrence for the most widely sighted species in the Gulf of
Maine using Manomet Bird Observatory survey data for all seasons combined (1980-88)...241 Figure 4.3.2. Percent frequency of occurrence for the most widely sighted species in Stellwagen
Bank National Marine Sanctuary using Manomet Bird Observatory survey data for all seasons combined (1980-88).......................................................................................241
Figure 4.3.3. Monthly seabird abundance corrected for effort using Manomet Bird Observatory data (1980-1988) ...................................................................................................................242
Figure 4.3.4. Seasonal auk (Alcidae) distribution patterns in the Gulf of Maine based on effort corrected presence data for (a) summer, and (b) winter seasons .........................................243
Figure 4.3.5. Seasonal auk (Alcidae) predictions of relative prevalence in the Gulf of Maine for summer and winter ...........................................................................................................244
Figure 4.3.6. Seasonal Razorbill distribution patterns in the Gulf of Maine based on effort corrected presence data for summer, and winter seasons ....................................................246
Figure 4.3.7. Seasonal Greater Shearwater distribution patterns in the Gulf of Maine based on effort corrected presence data for summer, and winter seasons. .....................................247
Figure 4.3.8. Seasonal Greater Shearwater predictions of relative prevalence in the Gulf of Maine for summer and winter.................................................................................................248
Figure 4.3.9. Seasonal Northern Gannet distribution patterns in the Gulf of Maine based on effort corrected presence data for summer, and winter seasons ......................................250
Figure 4.3.10.Seasonal Northern Gannet predictions of relative prevalence in the Gulf of Maine for summer and winter ...........................................................................................................251
Figure 4.3.11.Seasonal Wilson’s Storm Petrel distribution patterns in the Gulf of Maine based on effort corrected presence data for summer, and winter seasons ......................................252
Figure 4.3.12.Seasonal Wilson’s Storm Petrel predictions of relative prevalence in the Gulf of Maine for summer ..............................................................................................................253
Figure 4.3.13.Seasonal effort corrected number of seabird species using the eight focal seabirds for summer, and winter seasons .............................................................................254
Figure 4.3.14.Mean number of seabird species using all 60 species calculated in 5 minute bins for summer, and winter seasons ....................................................................................256
Figure 5.1.1. Critical habitat designations for North Atlantic right whale established in 1994 in the southern Gulf of Maine.................................................................................................266
Figure 5.1.2. Relative ship traffic density representing data from the first three years (1999–2002) of the northeast Mandatory Ship Reporting System ..............................................................268
Figure 5.2.1. Southern Gulf of Maine study area showing the spatial extent of the sightings-per-unit-effort data (SPUE).....................................................................................271
Figure 5.2.2. Sequence of procedures used to select records and process effort to integrate
page xxi
An Ecological Characterization of the Stellwagen Bank National Marine Sanctuary Region
page xxii
the MBO and NARWC datasets.............................................................................................272 Figure 5.2.3. Assigning marine mammal sightings to transect centroids ....................................................273 Figure 5.2.4. Spatial patterns of survey effort (1970 – 2005) for large cetaceans in the southern
Gulf of Maine derived from the integration of NARWC and MBO data ..................................275 Figure 5.2.5. Spatial patterns of survey effort (1970 – 2005) for small cetaceans in the southern
Gulf of Maine derived from the integration of NARWC and MBO data ..................................276 Figure 5.3.1. Seasonal patterns of interpolated sightings-per-unit-effort (SPUE) data for
Humpback whale in spring, summer, fall, winter and all seasons combined for the southern Gulf of Maine (1970-2005)...........................................................................282
Figure 5.3.2. Seasonal patterns of interpolated sightings-per-unit-effort (SPUE) data for Fin whale in spring, summer, fall, winter and all seasons combined for the southern Gulf of Maine (1970-2005) ......................................................................................283
Figure 5.3.3. Seasonal patterns of interpolated sightings-per-unit-effort (SPUE) data for Minke whale in spring, summer, fall, winter and all seasons combined for the southern Gulf of Maine (1970-2005). ....................................................................................284
Figure 5.3.4. Seasonal patterns of interpolated sightings-per-unit-effort (SPUE) data for North Atlantic right whale in spring, summer, fall, winter and all seasons combined for the southern Gulf of Maine (1970-2005)...........................................................................285
Figure 5.3.5. Seasonal patterns of interpolated sightings-per-unit-effort (SPUE) data for Sei whale in spring, summer, fall, winter and all seasons combined for the southern Gulf of Maine (1970-2005) ......................................................................................286
Figure 5.3.6. Seasonal patterns of interpolated sightings-per-unit-effort (SPUE) data for Pilot whale in spring, summer, fall, winter and all seasons combined for the southern Gulf of Maine (1970-2005) ......................................................................................288
Figure 5.3.7. Seasonal patterns of interpolated sightings-per-unit-effort (SPUE) data for Atlantic white-sided dolphin in spring, summer, fall, winter and all seasons combined for the southern Gulf of Maine (1970-2005) ..........................................................289
Figure 5.3.8. Seasonal patterns of interpolated sightings-per-unit-effort (SPUE) data for all Baleen whales (Mysteceti) in spring, summer, fall, winter and all seasons combined for the southern Gulf of Maine (1970-2005) ..........................................................290
Figure 5.3.9. Seasonal patterns of interpolated sightings-per-unit-effort (SPUE) data for all dolphins and porpoise in spring, summer, fall, winter and all seasons combined for the southern Gulf of Maine (1970-2005)...........................................................................291
Figure 5.3.10.Seasonal patterns of cetacean species richness (number of species) in spring, summer, fall, winter and all seasons combined for the southern Gulf of Maine (1970-2005) ...............292
Figure 5.3.11.Plots showing the MARS™ model fit between Humpback whale and several key environmental variables for a) spring b) summer ............................................................295
Figure 5.3.12.Plots showing the MARS™ model fit between Fin whale and several key environmental variables for a) spring b) summer...................................................................297
Figure 5.3.13.Plots showing the MARS™ model fit between Minke whale and several key environmental variables for a) spring b) summer...................................................................299
Figure 5.3.14.Plots showing the MARS™ model fit between North Atlantic right whale and several key environmental variables for a) spring b) summer ............................................................301
Figure 5.3.15.Plots showing the MARS™ model fit between Sei whale and several key environmental variables for a) spring b) summer..................................................................304
Figure 5.3.16.Plots showing the MARS™ model fit between Atlantic white-sided dolphin and several key environmental variables for a) spring b) summer ...............................................306
Figure 5.4.1. Environmental characterization of an ecotone along the 100m isobath of the flank of Georges Bank. ..........................................................................................................309
Figure 5.4.2. Distribution of key prey species for piscivorous cetaceans in the southern Gulf of Maine .... 311 Figure 5.4.3. Spatial patterns of cetacean relative abundance (SPUE) along the 100m isobath
of the northern flank of Georges Bank ...................................................................................312 Figure 5.4.4. Overlay of spatial distribution of North Atlantic right whale relative abundance (SPUE)
over the spatial distribution of Calanus abundance for the southern Gulf of Maine...............315