Embed Size (px)
Citation preview
Défense
nationale
National
Defence
Defence R&D CanadaCentre for Operational Research and Analysis
Materiel Group Operational ResearchAssistant Deputy Minister (Materiel)
DRDC CORA TM 2009-027July 2009
An Economic Evaluation for CP-140Aircraft Replacement
A. SokriMateriel Group Operational Research

An Economic Evaluation for CP-140 AircraftReplacement
A. SokriMateriel Group Operational Research
DRDC – Centre for Operational Research and AnalysisTechnical Memorandum
DRDC CORA TM 2009-027
July 2009
AuthorOriginal signed by
A. Sokri
Approved byOriginal signed by
Charles MorriseyDRDC CORA Acting S/H (Joint & Common)
Approved for release byOriginal signed by
D. RedingDRDC CORA Chief Scientist
The information contained herein has been derived and determined through best practiceand adherence to the highest levels of ethical, scientific and engineering investigativeprinciples. The reported results, their interpretation, and any opinions expressed therein,remain those of the authors and do not represent, or otherwise reflect, any official opinionor position of DND or the Government of Canada.
Her Majesty the Queen as represented by the Minister of National Defence, 2009
Sa majesté la reine, représentée par le ministre de la Défense nationale, 2009
Abstract
The purpose of this report is to identify the optimal replacement strategy for the CanadianForces (CF) Long-Range Patrol CP-140 fleet. The adopted mathematical formulation isa fusion between an intergenerational model and an approach which uses the notion ofoperational availability of aircraft. In this resulting model, operating and maintenance costsper available year are estimated as a function of aircraft age during its life cycle. Afterdetermining the optimal age of replacement, a sensitivity analysis was carried out to assessthe impact of some key model parameters on the result. This repair or replace model hasthe huge advantage of being applicable to any kind of heavy equipment. For example, itmay be used to determine, in the same manner, the optimal age of replacing several typesof fleets such as helicopters, ships, tanks, trucks, etc.
Résumé
Ce travail fournit un modèle intergénérationnel hybride permettant l’identification de lastratégie optimale de remplacement de la flotte des aéronefs militaires de surveillance ter-ritoriale CP-140. La formulation mathématique adoptée est un croisement entre un modèleintergénérationnel qui cherche à minimiser le coût de l’appareil durant son cycle de vie, etune approche qui tient compte de la disponibilité opérationnelle des aéronefs. Après avoirdéterminé l’âge optimal de retraite de la flotte, une analyse de sensibilité a été accomplieafin d’estimer l’impact d’une variation dans les paramètres du modèle sur le résultat. Cemodèle présente l’énorme avantage d’être applicable à toute sorte d’équipement lourd. Ilpeut servir, en effet, à déterminer d’une manière similaire l’âge optimal de remplacementde plusieurs flottes comme les hélicoptères les navires, les chars, les camions ou autres.
DRDC CORA TM 2009-027 i

This page intentionally left blank.
ii DRDC CORA TM 2009-027
Executive summary
The CP-140 fleet of long-range patrol aircraft includes the two maritime surveillance air-craft Aurora (CP-140) and Arcturus (CP-140A). The fleet is aging and requires increasingoperating and maintenance (O&M) costs. In 2005, for example, operating an Aurora air-craft cost $11,758 per flying hour, compared to $5,087 in 1996 [1]. Replacing the fleetwould involve an investment of billions of dollars accrued over the operational life. There-fore, a central question arises: Is it more economical to replace the fleet or continue itsmaintenance?
While the question of replacing or repairing equipment is a classic case of dynamic op-timization, few papers deal with the optimal age to replace military aircraft. The reasonbehind this rarity is that the sevices generated by the equipment are not quantifiable andtherefore not easily treated using conventional cost-benefit analysis.
This paper complements the few existing papers on this subject by providing an intergen-erational hybrid model to identify the optimal strategy for replacing the fleet of CP-140aircraft. The adopted mathematical framework is a fusion between the Greenfield and Pers-selin intergenerational model ([2, 3]), which seeks to minimize the total cost of the aircraftduring its life cycle, and the Keating and Dixon approach which takes into account the Op-erational Availability (Ao) of the fleet ([4, 5]). These two models were prepared by TheRAND Corporation for the United States Air Force under Project Air Force ([3, 5]).
To determine the optimal replacement age (ORA) of the aircraft, it is assumed, as in ref-erences ([2, 3]), that each generation of aircraft will be replaced by a similar generation interms of constant dollar cost. A cyclic model of the fleet’s life cycle is employed.
The model would gain in reliability if the data used were exhaustive and covered the wholelifetime of each aircraft. For want of better data, only 13 average annual observationswere taken from the Cost Factors Manual [1] for costs, and the Director General AerospaceEquipment Program Management (DGAEPM) PERFORMA database for Ao [6].
The adopted approach consists of estimating the growth rate of O&M costs for each avail-able year and using this information to trace the curve of the total cost. A sensitivity analysiswas performed to assess the impact of some key model factors on the result and to evaluatethe robustness of the model.
The ORA is 15 years for the Aurora and 13 years for the Arcturus. Each additional yearproduces an added cost due to the rise in O&M costs. This cost is relatively low for the firstyears, but it becomes exponential if the replacement is delayed too long. If the Arcturus isto be retired in 2009 ( which corresponds to an age of 16 years), the loss is approximately$1.7M per aircraft. If the Aurora is to be retired in 2015 (which corresponds to an age of35 years), the loss is approximately $63M per aircraft.
A. Sokri; 2009; An Economic Evaluation for CP-140 Aircraft Replacement; DRDCCORA TM 2009-027; DRDC – Centre for Operational Research and Analysis.
DRDC CORA TM 2009-027 iii
Sommaire
La flotte canadienne d’avions militaires CP-140 regroupe les deux aéronefs de surveillanceterritoriale Aurora (CP-140) et Arcturus (CP-140A) .
Âgée en moyenne de plus de 25 ans en septembre 2007, cette flotte, requiert des frais crois-sant de fonctionnement et de maintenance. En 2005, par exemple, le fonctionnement d’unaéronef Aurora a coûté $11,758 par heure de vol, soit une augmentation de 131.14% parrapport à l’année précédente [1]. Remplacer cet appareil nécessiterait un investissement deplusieurs millions de dollars. Dès lors une question centrale se pose : Est-t-il économique-ment plus efficient de remplacer cette flotte ou de continuer sa maintenance ? L’objectif dece rapport est justement de répondre à cette grande question.
Le remplacement ou la réparation d’une machine est un sujet classique en optimisationdynamique. Cependant peu de papier ont traité de l’âge optimal de remplacement d’unavion militaire. La raison derrière cette rareté est que cet appareil ne génère pas de profitsquantifiables et ne s’apprête donc pas aisément aux analyses coûts-avantages classiques.
Ce travail complète les quelques écrits existants en fournissant un modèle intergénération-nel hybride permettant l’identification de la stratégie optimale de remplacement de la flottedes avions militaires CP-140. La formulation mathématique adoptée est un croisement entrele modèle intergénérationnel de Greenfield et Persselin ([2, 3]), qui cherche à minimiser lecoût total de l’aéronef durant son cycle de vie, et l’approche de Keating et Dixon ([4, 5])qui tient compte de la Disponibilité Opérationnelle des appareils.
Pour pouvoir déterminer l’âge optimal de remplacement de la flotte, nous supposons commedans les références ([2, 3]) que chaque génération d’avions sera remplacée par une généra-tion qui lui est semblable en termes de coût. Notre objectif étant de minimiser le coût del’appareil durant son cycle de vie. La prise en considération d’une infinité de générationsdans ce modèle n’est qu’un moyen mathématique pour déterminer l’âge optimal de retraitede la génération courante.
Ce modèle gagnerait en qualité si les données utilisées étaient désagrégées et portaient surla durée de vie de chaque aéronef. Mais faute de mieux, on s’est contenté de 13 observationsannuelles moyennes en provenance du Manuel des Coûts Standard [1] pour ce qui est descoûts. La Disponibilité Opérationnelle des aéronefs est fournie, quant à elle, par la base dedonnée PERFORMA [6] de la Direction Générale - Gestion du Programme d’ÉquipementAérospatial (DGGPEA).
Notre approche consiste d’abord à estimer le taux de croissance des frais de fonctionnementet de maintenance par année de disponibilité en fonction de l’âge de l’appareil. Ensuite,cette information est exploitée pour tracer la courbe du coût total. Une analyse de sensibilitéest effectuée afin de détecter l’impact des fluctuations dans les paramètres sur le résultat etde juger par la même de la robustesse du modèle.
L’âge optimal de remplacement est de 15 ans pour Aurora et de 13 pour Arcturus. Après cet
iv DRDC CORA TM 2009-027
âge optimal, chaque année additionnelle engendrerait un coût supplémentaire dû à l’aug-mentation des frais d’opération et de maintenance. Le coût est relativement faible durant lestoutes premières années, mais il deviendra exponentiel si le remplacement est différé pourune longue durée. Si l’aéronef Arcturus devait être substitué en 2009 (ce qui correspond àun âge de 16 ans), la perte marginale serait de l’ordre de $1.7M par appareil. Si l’aéronefAurora devait être renouvelé en 2015 (ce qui coïncide avec un âge de 35 ans), cette perteunitaire est d’environ $63M.
A. Sokri; 2009; An Economic Evaluation for CP-140 Aircraft Replacement; DRDCCORA TM 2009-027; RDDC – Centre pour la recherche et l’analyseopérationnelles.
DRDC CORA TM 2009-027 v

This page intentionally left blank.
vi DRDC CORA TM 2009-027
Table of contents
Abstract . . . . . . . . . . . . . . . . . . . . . . . . . . . . . . . . . . . . . . . . . i
Résumé . . . . . . . . . . . . . . . . . . . . . . . . . . . . . . . . . . . . . . . . . i
Executive summary . . . . . . . . . . . . . . . . . . . . . . . . . . . . . . . . . . . iii
Sommaire . . . . . . . . . . . . . . . . . . . . . . . . . . . . . . . . . . . . . . . . iv
Table of contents . . . . . . . . . . . . . . . . . . . . . . . . . . . . . . . . . . . . vii
Figures . . . . . . . . . . . . . . . . . . . . . . . . . . . . . . . . . . . . . . . . . ix
Tables . . . . . . . . . . . . . . . . . . . . . . . . . . . . . . . . . . . . . . . . . . x
Acknowledgements . . . . . . . . . . . . . . . . . . . . . . . . . . . . . . . . . . . xi
1 Introduction . . . . . . . . . . . . . . . . . . . . . . . . . . . . . . . . . . 1
1.1 Background . . . . . . . . . . . . . . . . . . . . . . . . . . . . . . 1
1.2 Scope . . . . . . . . . . . . . . . . . . . . . . . . . . . . . . . . . 3
2 Data . . . . . . . . . . . . . . . . . . . . . . . . . . . . . . . . . . . . . . . 4
2.1 Data Structure . . . . . . . . . . . . . . . . . . . . . . . . . . . . . 4
2.1.1 Average Age of the Fleet . . . . . . . . . . . . . . . . . . . 4
2.1.2 Average Acquisition Cost of One Aircraft . . . . . . . . . . 4
2.1.3 The Trend in Operational Availability . . . . . . . . . . . . 5
2.1.4 The Evolution of O&M Costs . . . . . . . . . . . . . . . . 5
2.1.5 O&M Costs at Acquisition and Their Growth Rate . . . . . 6
2.1.6 Discounting . . . . . . . . . . . . . . . . . . . . . . . . . . 6
2.2 Data and Model Assumptions . . . . . . . . . . . . . . . . . . . . . 6
3 The Model . . . . . . . . . . . . . . . . . . . . . . . . . . . . . . . . . . . 7
3.1 The Economic Model . . . . . . . . . . . . . . . . . . . . . . . . . 8
3.2 The Availability Model . . . . . . . . . . . . . . . . . . . . . . . . 10
3.3 The Hybrid Model . . . . . . . . . . . . . . . . . . . . . . . . . . . 11
DRDC CORA TM 2009-027 vii
4 The Optimal Retirement Calculation . . . . . . . . . . . . . . . . . . . . . . 11
4.1 Estimation . . . . . . . . . . . . . . . . . . . . . . . . . . . . . . . 11
4.2 Basic Result . . . . . . . . . . . . . . . . . . . . . . . . . . . . . . 12
4.3 Deferment Costs . . . . . . . . . . . . . . . . . . . . . . . . . . . . 13
5 Sensitivity Analysis . . . . . . . . . . . . . . . . . . . . . . . . . . . . . . 13
5.1 Effect of the Number of Maintainers . . . . . . . . . . . . . . . . . 14
5.2 Effect of the Aurora Incremental Modernization Project . . . . . . . 16
5.3 Effect of Operational Availability . . . . . . . . . . . . . . . . . . . 17
5.4 Effect of Varying the Parameters . . . . . . . . . . . . . . . . . . . 17
6 Summary . . . . . . . . . . . . . . . . . . . . . . . . . . . . . . . . . . . . 20
6.1 Recommendations . . . . . . . . . . . . . . . . . . . . . . . . . . . 20
References . . . . . . . . . . . . . . . . . . . . . . . . . . . . . . . . . . . . . . . . 21
List of symbols/abbreviations/acronyms/initialisms . . . . . . . . . . . . . . . . . . 23
viii DRDC CORA TM 2009-027
Figures
1 CP-140A Arcturus . . . . . . . . . . . . . . . . . . . . . . . . . . . . . . . 1
2 Evolution of On Aircraft Workload Ratio . . . . . . . . . . . . . . . . . . . 2
3 O&M Cost Per Aircraft . . . . . . . . . . . . . . . . . . . . . . . . . . . . 7
4 ORA for the Average Fleet . . . . . . . . . . . . . . . . . . . . . . . . . . . 13
5 Annual Additional Costs Beyond the ORA . . . . . . . . . . . . . . . . . . 14
6 Numbers of Maintainers and Fleet Availability . . . . . . . . . . . . . . . . 15
7 AIMP Unit Costs . . . . . . . . . . . . . . . . . . . . . . . . . . . . . . . . 16
8 Effect of Operational Availability . . . . . . . . . . . . . . . . . . . . . . . 17
9 Impact of Key Model Parameters on the ORA: (a) Effect of the AcquisitionCost. (b) Effect of the Discounting Rate. (c) Effect of the Growth Rate ofO&M Costs. (d) Effect of Initial O&M Cost. . . . . . . . . . . . . . . . . . 19
DRDC CORA TM 2009-027 ix
Tables
1 The CP-140 fleet . . . . . . . . . . . . . . . . . . . . . . . . . . . . . . . . 4
2 CP-140 O&M Costs per Aircraft (in current dollars) . . . . . . . . . . . . . 6
3 Effect of the Number of Maintainers on the Aurora Ao . . . . . . . . . . . . 15
4 Sensitivity Analysis . . . . . . . . . . . . . . . . . . . . . . . . . . . . . . 18
x DRDC CORA TM 2009-027
Acknowledgements
I would like to acknowledge the valuable insights and observations contributed by the fol-lowing Professors: Michèle Breton of HEC-Montreal and Hassan Benchekroun of McGillUniversity. I received constructive reviews of this report from my colleagues Dr. AhmedGhanmi, Mr. Raman Pall and Maj. Sylvain Raymond. I owe very much to all the mem-bers of the Repair or Replace working group formed to evaluate and improve this study. Ithank Jenille Prince and Parker Beals who assisted me in the data collection. Finally, I amdeeply indebted to Dr. Paul Desmier: This work would not have been possible without hisleadership, patience and support.
DRDC CORA TM 2009-027 xi

This page intentionally left blank.
xii DRDC CORA TM 2009-027
1 Introduction1.1 Background
The longer equipment stays in service, the higher are its maintenance costs, and the lowerare its productivity. When equipment reaches a certain age, it may be more economical toreplace it rather than continue its operation. The problem thus reduces to determining themost economical age for replacement [7].
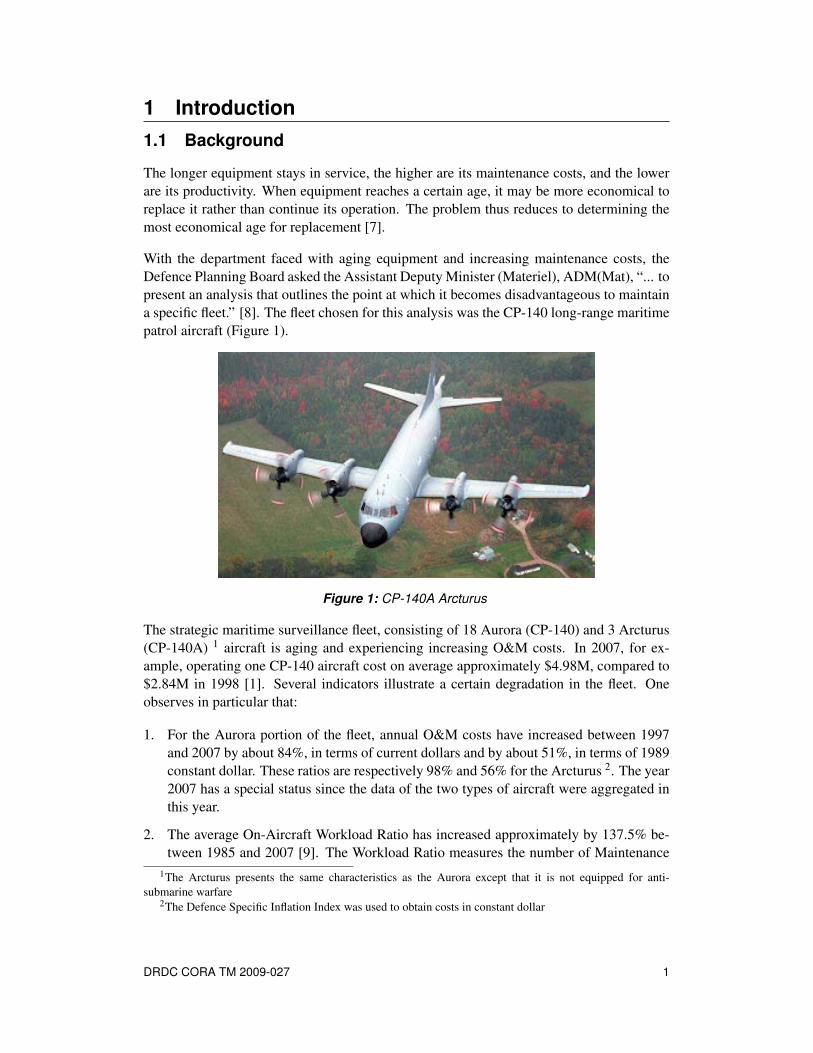
With the department faced with aging equipment and increasing maintenance costs, theDefence Planning Board asked the Assistant Deputy Minister (Materiel), ADM(Mat), “... topresent an analysis that outlines the point at which it becomes disadvantageous to maintaina specific fleet.” [8]. The fleet chosen for this analysis was the CP-140 long-range maritimepatrol aircraft (Figure 1).
Figure 1: CP-140A Arcturus
The strategic maritime surveillance fleet, consisting of 18 Aurora (CP-140) and 3 Arcturus(CP-140A) 1 aircraft is aging and experiencing increasing O&M costs. In 2007, for ex-ample, operating one CP-140 aircraft cost on average approximately $4.98M, compared to$2.84M in 1998 [1]. Several indicators illustrate a certain degradation in the fleet. Oneobserves in particular that:
1. For the Aurora portion of the fleet, annual O&M costs have increased between 1997and 2007 by about 84%, in terms of current dollars and by about 51%, in terms of 1989constant dollar. These ratios are respectively 98% and 56% for the Arcturus 2. The year2007 has a special status since the data of the two types of aircraft were aggregated inthis year.
2. The average On-Aircraft Workload Ratio has increased approximately by 137.5% be-tween 1985 and 2007 [9]. The Workload Ratio measures the number of Maintenance
1The Arcturus presents the same characteristics as the Aurora except that it is not equipped for anti-submarine warfare
2The Defence Specific Inflation Index was used to obtain costs in constant dollar
DRDC CORA TM 2009-027 1
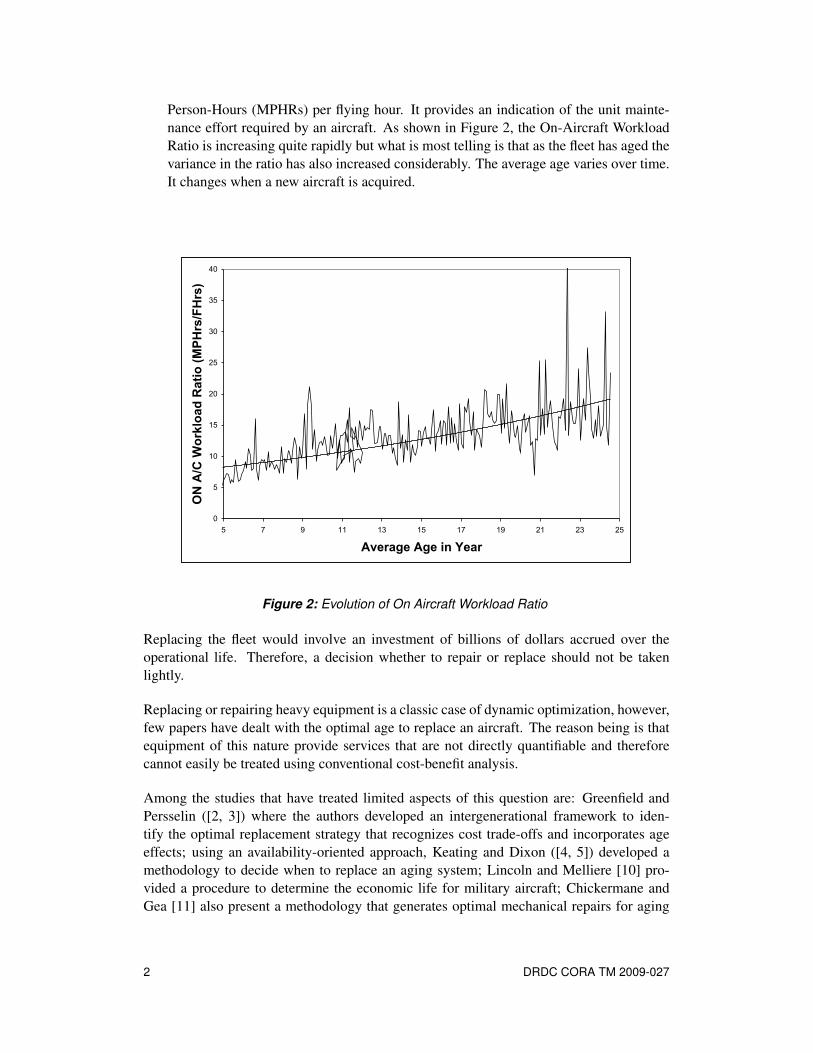
Person-Hours (MPHRs) per flying hour. It provides an indication of the unit mainte-nance effort required by an aircraft. As shown in Figure 2, the On-Aircraft WorkloadRatio is increasing quite rapidly but what is most telling is that as the fleet has aged thevariance in the ratio has also increased considerably. The average age varies over time.It changes when a new aircraft is acquired.
0
5
10
15
20
25
30
35
40
5 7 9 11 13 15 17 19 21 23 25
Average Age in Year
ON
A/C
Wor
kloa
d R
atio
(MPH
rs/F
Hrs
)
Figure 2: Evolution of On Aircraft Workload Ratio
Replacing the fleet would involve an investment of billions of dollars accrued over theoperational life. Therefore, a decision whether to repair or replace should not be takenlightly.
Replacing or repairing heavy equipment is a classic case of dynamic optimization, however,few papers have dealt with the optimal age to replace an aircraft. The reason being is thatequipment of this nature provide services that are not directly quantifiable and thereforecannot easily be treated using conventional cost-benefit analysis.
Among the studies that have treated limited aspects of this question are: Greenfield andPersselin ([2, 3]) where the authors developed an intergenerational framework to iden-tify the optimal replacement strategy that recognizes cost trade-offs and incorporates ageeffects; using an availability-oriented approach, Keating and Dixon ([4, 5]) developed amethodology to decide when to replace an aging system; Lincoln and Melliere [10] pro-vided a procedure to determine the economic life for military aircraft; Chickermane andGea [11] also present a methodology that generates optimal mechanical repairs for aging
2 DRDC CORA TM 2009-027
aircraft; Schwartz et al. [12] presented a dynamic program to determine optimal repairand replacement policies for an aircraft; and, more recently, Castro and Sanjuán [13] deter-mined an optimal repair policy for a system with a limited number of repairs. For a reviewof literature related to the effect of aircraft age on maintenance costs see Dixon (2005) [14].
1.2 Scope
The objective of this study is to provide an answer to the following central question: "Is iteconomically efficient to replace the CP-140 fleet or continue its maintenance?"
Taking acquisition, O&M costs, and operational availability (Ao) into account, a procedureis developed to determine the optimal replacement age (ORA) for the fleet. This work com-plements the existing literature by providing a hybrid intergenerational model to identifythe optimal replacement strategy for the CP-140 fleet. The adopted mathematical formula-tion is a fusion between the Greenfield and Persselin ([2, 3]) intergenerational model andthe Keating and Dixon ([4, 5]) approach where Ao of the fleet is taken into consideration. Inthis model, O&M costs of one aircraft is estimated during its life cycle. The resulting curveis a convex parabola where the minimum coincides with the optimal age of replacement.
This report is organized into six sections. Following the introduction, section 2 describesthe CP-140 fleet profile and presents the data used in the analysis.
Section 3 sets up the two used mathematical models and describes their derivations. Itdescribes the complete derivation of the Greenfield and Persselin intergenerational modelwhich seeks to minimize the total cost of the aircraft during its life cycle. It also describesthe optimality condition of Keating and Dixon based on the Ao of the fleet.
Section 4 contains the full estimation of the model. It provides the ORA of the fleet andshows the marginal loss incurred by deferring the replacement beyond the ORA.
Section 5 demonstrates the impact of certain structural or institutional factors - such as thenumber of aircraft maintainers, the Aurora Incremental Modernization Project (AIMP) andthe Ao of the fleet - on the optimal retirement age. More importantly, a sensitivity analysisis performed in this section to assess the impact of some key model parameters on theresults and to evaluate the robustness of the model.
The report concludes in section 6 with a summary of the results concerning the optimalreplacement strategy for the CP-140 fleet.
DRDC CORA TM 2009-027 3

2 Data2.1 Data Structure
The CP-140 fleet of aircraft includes 18 Aurora and 3 Arcturus3. The Aurora was acquiredin 1980 with a unit acquisition cost of approximately $37M [15] and an Estimated LifeExpectancy of 30 years. It has the ability to fly more than 9000 km without refueling; and its9266 km range and 7-hour endurance make it a multi-purpose aircraft ideal for performinga multitude of missions [16]. The Arcturus was accepted into service in 1993 with a unit
Table 1: The CP-140 fleet
Aurora Arcturus
Average age 27 years (1980) 14 years (1993)Acquisition cost 37.3 $M 79.6 $M or 47.48 $M in 1980 dollarsQuantity 18 3Estimated Life Expectancy 30 years (2010) 13 years (2006)Possible extension 2016 2009Current Net Book value per A/C 7.35 $M 0
cost of $79.6$M [15] 4 and an Estimated Life Expectancy of 13 years. It presents thesame characteristics as the Aurora except that it is not equipped for anti-submarine warfare,making it a lighter and more fuel-efficient aircraft [16].
In order to estimate the optimal retirement age of the fleet, the following information isrequired:
2.1.1 Average Age of the Fleet
Since aircraft do not all enter service at the same time, the age of each fleet will be repre-sented by an average. As of September 2007, the CP-140 fleet (as a whole) has reached anaverage age of approximately 25 years. However, this average conceals a large differencebetween the two types of aircraft. The average age of the Aurora fleet, acquired in 1980, is27 years5, whereas that of the Arcturus fleet, acquired in 1991 and accepted into service in1993, is only 14 years6.
2.1.2 Average Acquisition Cost of One Aircraft
Analyzing the Aurora and Arcturus according to their acquisition costs shows that the twoaircraft respectively cost $37.3M and $79.7M each when they were accepted into service.The acquisition costs include the purchase price itself and the various improvements on each
3From hereon we use the designation CP-140 to refer to the entire fleet (common usage), although weacknowledge that it more accurately refers to the Aurora portion of the 21 aircraft fleet.
4Using a discount rate of 4.4%, 79.6$M in 1993, has a value of 47.48$M in 19805The first/last Auroras entered service May 1980/July 19816The first/last Arcturus entered service Dec. 1992/Apr. 1993.
4 DRDC CORA TM 2009-027
aircraft. These improvements represent approximately 6% (or $2.18M) of the acquisitioncost for the Aurora and 0.32% (or $.25M) for the Arcturus. When dealing with the entirefleet, a weighted average price was used.
2.1.3 The Trend in Operational Availability
According to the Director General Aerospace Equipment Program Management (DGAEPM)PERFORMA database [6], Ao is defined as the proportion of observed time that a groupof aircraft is in an operable state (not undergoing maintenance) in relation to the total op-erational time available during a stated period. For the whole fleet, Ao has substantiallydeteriorated during the last decade, reaching its lowest level in 2005 (17.30%), over 6 per-centage points less than the previous year (23.51%). Analyzing O&M costs of an aircraftwill be more significant if the Ao is taken into account as it corrects the annual costs toobtain costs per available year. For example, expending $5M to operate an aircraft that iscontinuously available is not the same as spending $5M to operate an aircraft that is readyonly half the time. It is this argument which justifies, in our view, the use of Ao to correctthe deficiencies of the Greenfield and Persselin model ([2, 3]).
2.1.4 The Evolution of O&M Costs
The costs used in this study were drawn from Chapter 3 of the Cost Factors Manual (AircraftCosts) [1]. Chapter 3 presents the national average cost per flying hour of every aircraft usedby the Canadian Forces (CF). O&M costs considered in this study include:
• Petroleum, oil and lubricants;
• Engineering services;
• Repairs and overhaul; and
• Spares.
The total of these costs without Ao is used by the Department of National Defence (DND) todetermine the costs to be recovered from other governmental departments. It can thereforebe seen as an economic opportunity cost for aircraft [1].
Totaling about $5.20M in 2007, the yearly cost of operating and maintaining the fleet showsan annual increase of 7.87% since 1998. The year 2005 is clearly distinguishable fromthe others, since at the end of this year, yearly operating costs were valued at $6.42M,registering an increase of over 26.13% compared to the previous year.
Due to its young age, the Arcturus costs far less to operate and maintain. In 2006, forexample, O&M costs totaled only $3.5M per Arcturus compared to $5.24M per Aurora.The year 2007 has a special status since it coincides with data aggregation of the two typesof aircraft. During this year, the cost of operating and maintaining the whole fleet reached$5.20M per aircraft, largely due to the cost of operating the Aurora.
DRDC CORA TM 2009-027 5
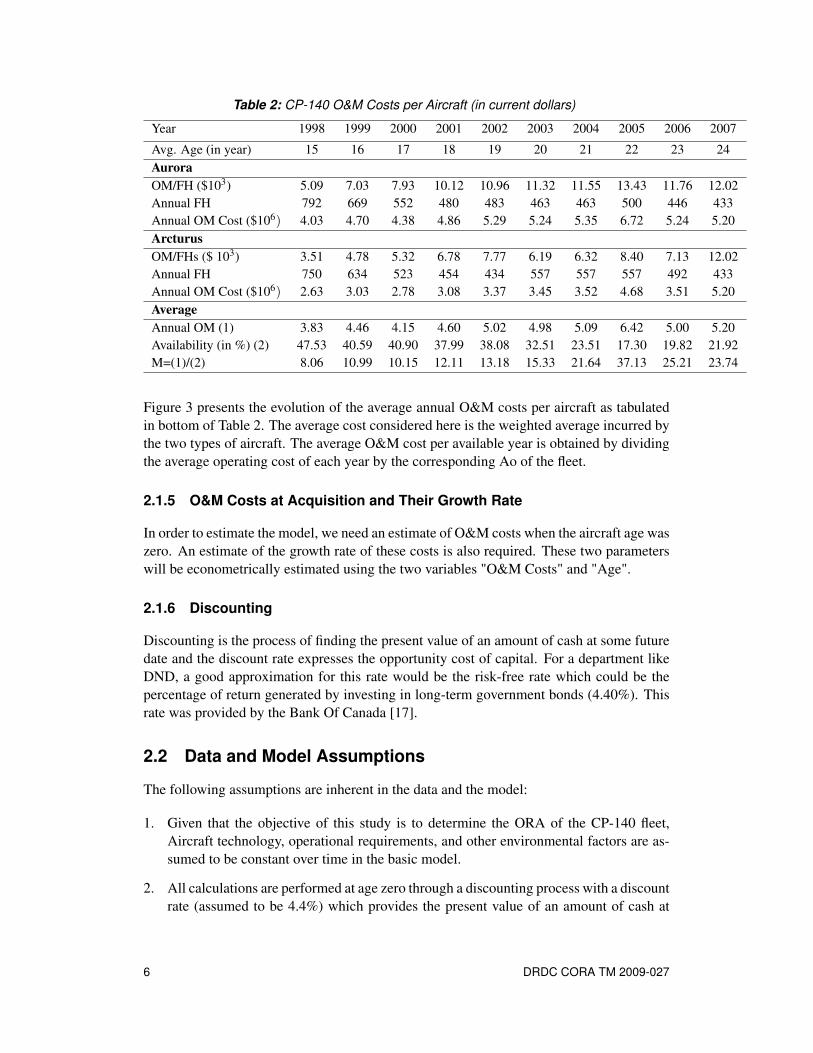
Table 2: CP-140 O&M Costs per Aircraft (in current dollars)
Year 1998 1999 2000 2001 2002 2003 2004 2005 2006 2007
Avg. Age (in year) 15 16 17 18 19 20 21 22 23 24AuroraOM/FH ($103) 5.09 7.03 7.93 10.12 10.96 11.32 11.55 13.43 11.76 12.02Annual FH 792 669 552 480 483 463 463 500 446 433Annual OM Cost ($106) 4.03 4.70 4.38 4.86 5.29 5.24 5.35 6.72 5.24 5.20ArcturusOM/FHs ($ 103) 3.51 4.78 5.32 6.78 7.77 6.19 6.32 8.40 7.13 12.02Annual FH 750 634 523 454 434 557 557 557 492 433Annual OM Cost ($106) 2.63 3.03 2.78 3.08 3.37 3.45 3.52 4.68 3.51 5.20AverageAnnual OM (1) 3.83 4.46 4.15 4.60 5.02 4.98 5.09 6.42 5.00 5.20Availability (in %) (2) 47.53 40.59 40.90 37.99 38.08 32.51 23.51 17.30 19.82 21.92M=(1)/(2) 8.06 10.99 10.15 12.11 13.18 15.33 21.64 37.13 25.21 23.74
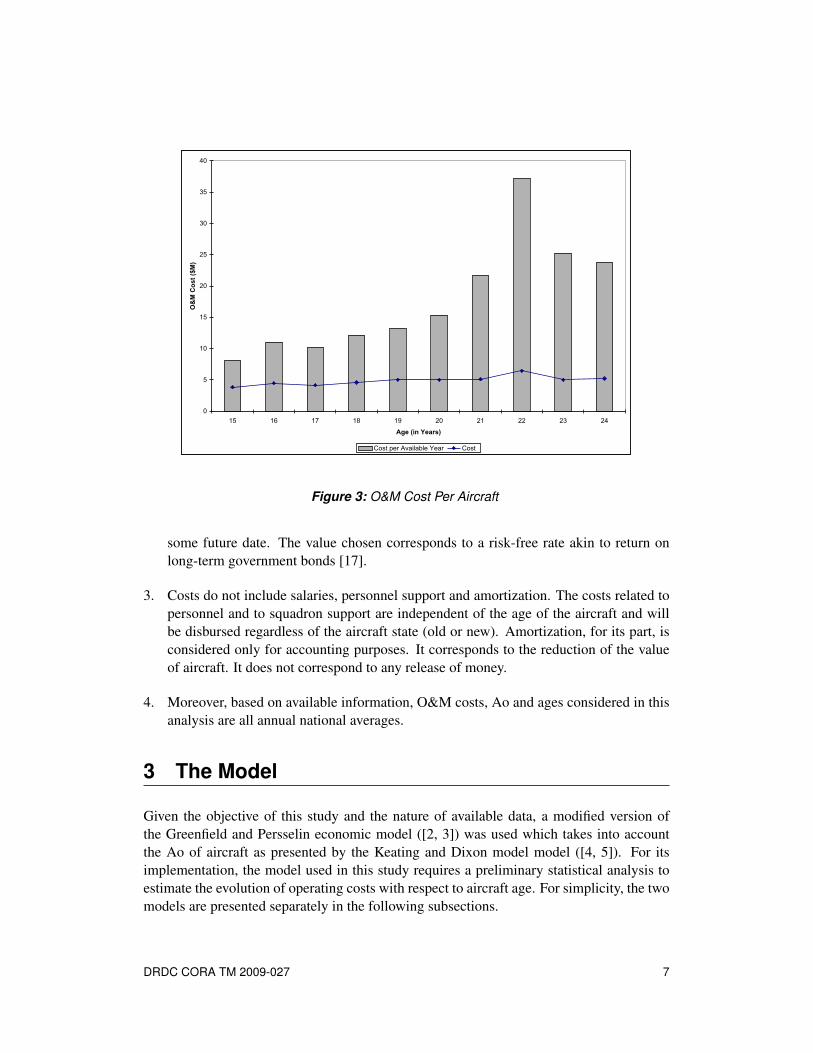
Figure 3 presents the evolution of the average annual O&M costs per aircraft as tabulatedin bottom of Table 2. The average cost considered here is the weighted average incurred bythe two types of aircraft. The average O&M cost per available year is obtained by dividingthe average operating cost of each year by the corresponding Ao of the fleet.
2.1.5 O&M Costs at Acquisition and Their Growth Rate
In order to estimate the model, we need an estimate of O&M costs when the aircraft age waszero. An estimate of the growth rate of these costs is also required. These two parameterswill be econometrically estimated using the two variables "O&M Costs" and "Age".
2.1.6 Discounting
Discounting is the process of finding the present value of an amount of cash at some futuredate and the discount rate expresses the opportunity cost of capital. For a department likeDND, a good approximation for this rate would be the risk-free rate which could be thepercentage of return generated by investing in long-term government bonds (4.40%). Thisrate was provided by the Bank Of Canada [17].
2.2 Data and Model Assumptions
The following assumptions are inherent in the data and the model:
1. Given that the objective of this study is to determine the ORA of the CP-140 fleet,Aircraft technology, operational requirements, and other environmental factors are as-sumed to be constant over time in the basic model.
2. All calculations are performed at age zero through a discounting process with a discountrate (assumed to be 4.4%) which provides the present value of an amount of cash at
6 DRDC CORA TM 2009-027
0
5
10
15
20
25
30
35
40
15 16 17 18 19 20 21 22 23 24
Age (in Years)
O&
M C
ost (
$M)
Cost per Available Year Cost
Figure 3: O&M Cost Per Aircraft
some future date. The value chosen corresponds to a risk-free rate akin to return onlong-term government bonds [17].
3. Costs do not include salaries, personnel support and amortization. The costs related topersonnel and to squadron support are independent of the age of the aircraft and willbe disbursed regardless of the aircraft state (old or new). Amortization, for its part, isconsidered only for accounting purposes. It corresponds to the reduction of the valueof aircraft. It does not correspond to any release of money.
4. Moreover, based on available information, O&M costs, Ao and ages considered in thisanalysis are all annual national averages.
3 The Model
Given the objective of this study and the nature of available data, a modified version ofthe Greenfield and Persselin economic model ([2, 3]) was used which takes into accountthe Ao of aircraft as presented by the Keating and Dixon model model ([4, 5]). For itsimplementation, the model used in this study requires a preliminary statistical analysis toestimate the evolution of operating costs with respect to aircraft age. For simplicity, the twomodels are presented separately in the following subsections.
DRDC CORA TM 2009-027 7
3.1 The Economic Model
It is assumed that the CF initially acquires an aircraft at price p and disburses O&M costs, m,until the aircraft is withdrawn from service. Taking operational availability, A, into accountthe O&M cost per available year is given by
M =mA
It is also assumed that O&M costs per available year, M, depend on aircraft age, a, throughan increasing continuous function, i.e., M′(a) > 0. In the adopted framework age is definedbroadly to include other related factors affecting the O&M costs per available year, suchas engine cycles, sorties and flying hours. The objective is to minimize the total cost ofacquiring, operating, and maintaining the aircraft during its life cycle. To determine theoptimal age of replacement, we assume, as in references [2] and [3] that each generation ofaircraft will be replaced by a new generation presenting the same costs in terms of constantdollars. With these conditions, the lifecycle cost of a given generation can be presented by:
p+∫ s
0e−raM (a)da , (1)
where r is the discount rate and s is the replacement interval. In this expression, the costhas two components:
(a) the initial acquisition cost p which includes the purchase price and all improvements(Betterments) made initially on the aircraft; and
(b) the cost equation: ∫ s
0e−raM (a)da , (2)
which is the sum of all expenses generated by operating and maintaining the aircraftsince its acquisition until its retirement at age s.
The integral assumes a continuous time scale, which is a reasonable approximation to thediscrete fiscal year based methods. Indexing each replacement by i, the total cost of nreplacements is simply given by:
c(s) =n
∑i=0
(p+
∫ s
0e−raM (a)da
)e−rsi . (3)
This expression is the sum of the first n terms of a geometric series where the first term isp +
∫ s0 e−ram(a)da and the ratio is e−rs. Using the well-known formula for the sum of an
infinite geometric series, this is equivalent to
c(s) =(
p+∫ s
0e−raM (a)da
)1− e−rs(n+1)
1− e−rs . (4)
Since e−rs < 1 and r > 0,lim
n−→∞e−rs(n+1) = 0 , (5)
8 DRDC CORA TM 2009-027
and one can rewrite the total present value of acquiring, operating and maintaining all gen-erations of the fleet as7
c(s) =p+
∫ s0 e−raM (a)da1− e−rs . (6)
Considering an infinite series of replacements is a mathematical way of determining the op-timal age of retirement for the current generation. This procedure is necessary to determinethe optimal age of the fleet. This model draws heavily from Preinreich’s framework [18]which is an extension of Faustmann’s model on forest management [19].
After dividing a yearly cost by the availability percentage, the cost per availability is ob-tained. Even if this change may seem minor, its impact on the results can be very important.
The derivative of function (6) with respect to s is given by
c′ (s) =e−rs
(1− e−rs)2
(M (s)−M (s)e−rs− pr− r
∫ s
0e−ar m(a)da
). (7)
Equating this derivative to zero, one obtains the following optimality condition:
M (s∗) = rp+
∫ s∗0 e−raM (a)da1− e−rs∗ . (8)
Assuming an interior solution, equation (8) provides the first order condition of the problem,where s∗ is the ORA. This condition establishes equality between the marginal cost offurther retention - on the left-hand side, and the corresponding marginal benefit - on theright-hand side. The benefit appears as a present value savings for an additional period. Ifthe O&M costs evolve exponentially over time, namely
M (a) = beαa , (9)
then Equation (6) becomes
c(s) =p+
b(1−e−(r−α)s)r−α
1− e−rs , (10)
and the first order condition will be
M (s∗) = rp+b
∫ s∗0 e(α−r)ada
1− e−rs∗ = rp+ b
α−r
(e(α−r)s∗−1
)1− e−rs∗ . (11)
Note that the parameter b coincides with O&M costs when a = 0, (i.e. M(0) = b). Further-more, noticing that
ln(M (a)) = ln(b)+αa , (12)
we conclude also thatM′ (a)M (a)
=dM/da
M= α , (13)
which implies that the parameter α is nothing more than the growth rate of the O&M costs.This could directly be seen from (9).
7The sum a+ar +ar2 + ... converges to a1−r , when |r|< 1
DRDC CORA TM 2009-027 9
The two parameters (α and b) are estimated by applying an Ordinary Least Squares (OLS)regression to Equation (14) below, where the dependent variable is ln(m), the independentvariable is the aircraft age a, and ε is the error term.
ln(M) = αa+ ln(b)+ ε . (14)
3.2 The Availability Model
By assuming a Keating and Dixon ([4, 5]) approach, we consider that the CF have anexisting aircraft, I, and envision having in the foreseeable future a replacement aircraft, R.Following the notation of [4, 5], the replacement aircraft would have a discrete series ofdiscounted future expenses
x =∞
∑t=1
ExpendRt
(1+Discount)t−1 , (15)
and would provide the following expression as the future availability sum
y =∞
∑t=1
AvailabilityRt
(1+Discount)t−1 . (16)
Not sure it makes sense to discount availability as it is not monetary in nature. That iswhy all we have adopted from this model is only the idea of cost per available year. Ifthe existing aircraft is kept only one more year, the discounted infinite sum of expenditureswould be
ExpendI1+
x1+Discount
, (17)
and the sum of availability would be
AvailabilityI1+
y1+Discount
. (18)
If the CF’s objective is to minimize the expenditures, then it would keep the existing aircraftone more year if and only if
ExpendI1+
x1+Discount
≤ x . (19)
If Ao is taken into account, retaining the aging aircraft for one more year results in anaverage cost per availability of
ExpendI1+ x
1+DiscountAvailabilityI1
+ y1+Discount
. (20)
Thus, the CF should repair, rather than replace, a current aircraft for one more year if andonly if
ExpendI1+ x
1+DiscountAvailabilityI1
+ y1+Discount
≤ xy
, (21)
or after simplificationExpendI1
AvailabilityI1
≤ xy
. (22)
10 DRDC CORA TM 2009-027
Controlling for aircraft availability levels, this rule explains that it would be optimal tocontinue to repair an aircraft if the annual cost of doing so is less than the annualized totalcost of a new aircraft. For application purposes, this optimality condition should be usedprospectively several years before the optimal retirement year.
3.3 The Hybrid Model
The hybrid model is a fusion between the Greenfield and Persselin intergenerational model([2, 3]), which seeks to minimize the total cost of the aircraft during its life cycle, and theKeating and Dixon approach which takes into account the Operational Availability (Ao)of the fleet ([4, 5]). These two models were prepared by The RAND Corporation for theUnited States Air Force under Project Air Force ([3, 5]). The hybrid model is presented insection 3. It differs from that of Greenfield and Persselin ([2, 3]) by considering the O&Mcost per available year is given by
M =mA
instead of O&M costs, m. The adopted mathematical framework retains the full rigor of thefirst model while the main idea of the second model is incorporated to it. This change mayseem simple, but its impact on the results can be significant.
4 The Optimal Retirement Calculation
In this section, all the estimation results are presented. A sensitivity analysis is carried outin the next section to assess the impact of some key model parameters and factors on thebasic result.
4.1 Estimation
OLS regression is an explanatory method (i.e. It attempts to explain the evolution of theresponse (or dependent variable) using one or more explanatory variables (also regressorsor independent variables)), which can serve as a predictive method. The goal is to measurein a linear form the relationship between the response variable ln(M) and the explanatoryvariable a. The following assumptions are generally accepted as standard for this type ofanalysis::
1. All errors are uncorrelated with constant variance and zero mean; and,
2. The error is assumed to be normally distributed [20, 21].
The O&M costs per available year are statistically estimated as a function of age. A linearregression equation was built giving the natural logarithm of O&M costs per year (depen-dent variable) as a function of aircraft age (independent variable). Applying an OLS re-gression on the data in Row 10 of Table 2 provides the following linear model for equation
DRDC CORA TM 2009-027 11
(14), i.e.,
ln(m) = αa+ ln(b) (23)
= 0.145a+13.683 , (24)
where the results show a strong linear correlation between the dependent variable (ln (m))and the explanatory variable age, a, with coefficient of determination R2 = 0.826; Ljung-Box test proves the absence of any autocorrelation between errors. These results show thatthe exponential specification between M and a provides an acceptable and reasonable fit.Equation (24) provides the value of the growth rate of operating costs per year, α , and theinitial O&M cost per available year, b.
b = e13.683 = $8.75893× 10⁵. (25)
Given that the total cost of an infinite series of replacements is provided by equation (10),replacing all the parameters by their respective values namely p = 38.75 (the average price),b = 0.876 (equation (25)), α = 0.145 (equation (24)) and and r = 4.40 (the assumed dis-count rate), the following equation is obtained:
c(s) =1
1− e−0.044s
(7.9636e0.11s +11.411
). (26)
The average unit price is calculated by weighting the unit purchase price of each type ofaircraft by the corresponding number of aircraft after discounting the two prices to the samecalculation year (1980).
Although the minimum of this expression can not easily be derived in closed form, a mini-mum can be established both graphically and numerically by plotting the total cost equationas a function of the replacement age.
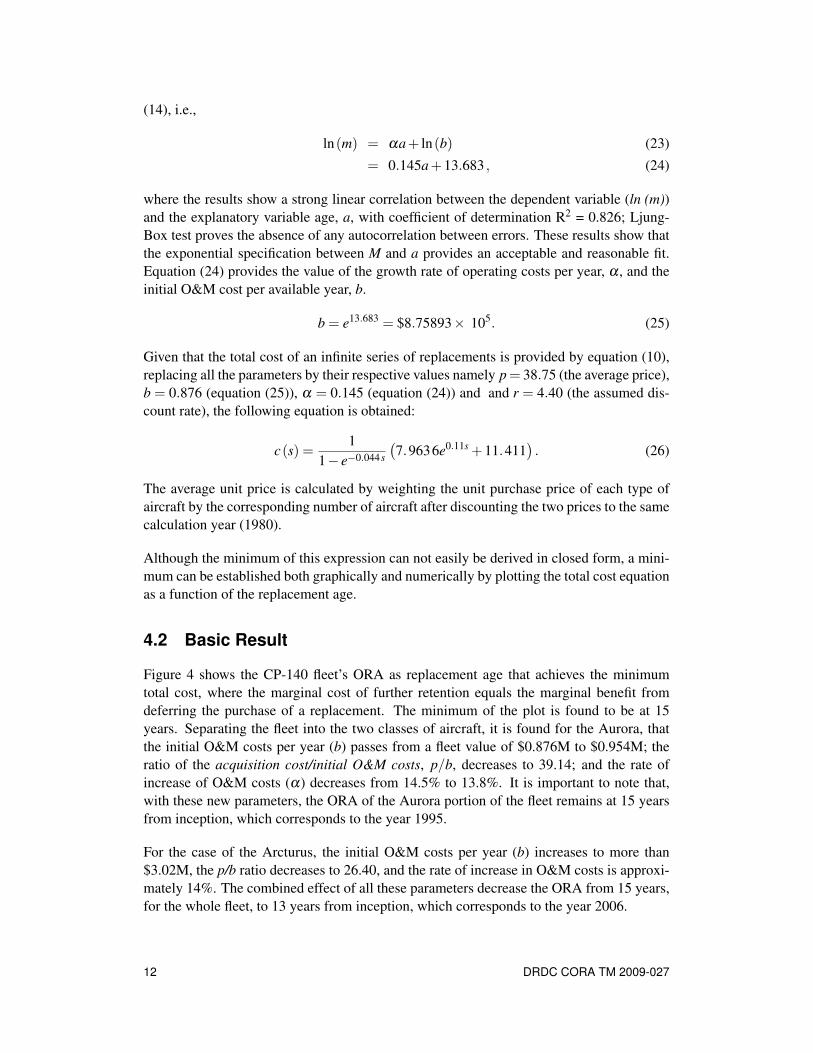
4.2 Basic Result
Figure 4 shows the CP-140 fleet’s ORA as replacement age that achieves the minimumtotal cost, where the marginal cost of further retention equals the marginal benefit fromdeferring the purchase of a replacement. The minimum of the plot is found to be at 15years. Separating the fleet into the two classes of aircraft, it is found for the Aurora, thatthe initial O&M costs per year (b) passes from a fleet value of $0.876M to $0.954M; theratio of the acquisition cost/initial O&M costs, p/b, decreases to 39.14; and the rate ofincrease of O&M costs (α) decreases from 14.5% to 13.8%. It is important to note that,with these new parameters, the ORA of the Aurora portion of the fleet remains at 15 yearsfrom inception, which corresponds to the year 1995.
For the case of the Arcturus, the initial O&M costs per year (b) increases to more than$3.02M, the p/b ratio decreases to 26.40, and the rate of increase in O&M costs is approxi-mately 14%. The combined effect of all these parameters decrease the ORA from 15 years,for the whole fleet, to 13 years from inception, which corresponds to the year 2006.
12 DRDC CORA TM 2009-027
0
200
400
600
800
1000
1200
1 5 9 13 17 21 25 29 33 37 41 45
Replacement Age (in years)
Tota
l Cos
t ($M
)
ORA
Figure 4: ORA for the Average Fleet
4.3 Deferment Costs
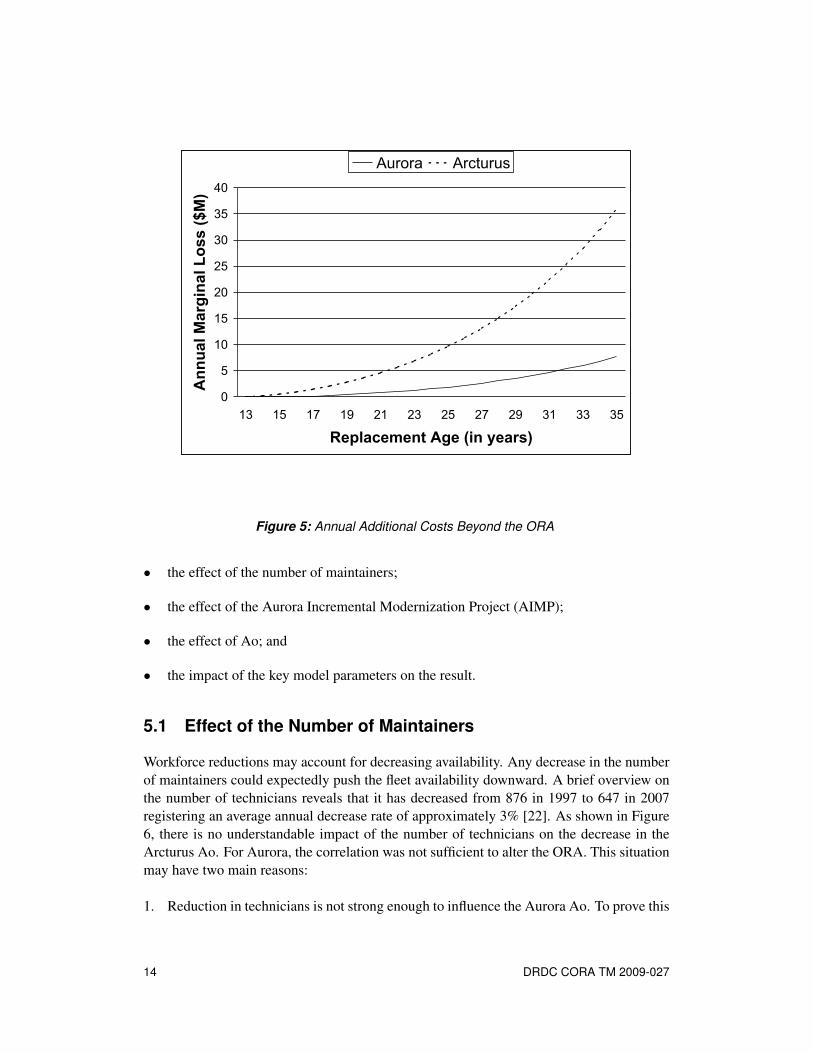
As stated, the ORA is 15 years for the Aurora and 13 years for the Arcturus. Each additionalyear produces an added cost due to the rise in O&M costs. Figure 5 shows the marginalloss incurred by deferring the replacement beyond the ORA. This cost is relatively low forthe first few years, but it becomes exponential if the replacement is delayed too long. Ifthe Arcturus is to be retired in 2009 (which corresponds to an age of 16 years), the loss isapproximately $1.7M per aircraft. If the Aurora is to be retired in 2015 (which correspondsto an age of 35 years), the loss is about $63M per aircraft for a total loss of $1.14B for an18 aircraft fleet.
5 Sensitivity Analysis
In the adopted framework, age is defined broadly to include other related factors affectingthe O&M cost per year, such as engine cycles, sorties, and flying hours. Actually, even ifchronological age can be considered as a rough proxy for engine cycles, sorties, and flyinghours, other relevant factors, such as workforce reductions or modernization projects mayaccount for higher O&M costs. These kinds of structural and institutional factors can affectthe unit cost per available year and therefore the ORA. A complete discussion of theseresults will be given in the following subsections. We assess, in particular,
DRDC CORA TM 2009-027 13
0
5
10
15
20
25
30
35
40
13 15 17 19 21 23 25 27 29 31 33 35
Replacement Age (in years)
Ann
ual M
argi
nal L
oss
($M
)
Aurora Arcturus
Figure 5: Annual Additional Costs Beyond the ORA
• the effect of the number of maintainers;
• the effect of the Aurora Incremental Modernization Project (AIMP);
• the effect of Ao; and
• the impact of the key model parameters on the result.
5.1 Effect of the Number of Maintainers
Workforce reductions may account for decreasing availability. Any decrease in the numberof maintainers could expectedly push the fleet availability downward. A brief overview onthe number of technicians reveals that it has decreased from 876 in 1997 to 647 in 2007registering an average annual decrease rate of approximately 3% [22]. As shown in Figure6, there is no understandable impact of the number of technicians on the decrease in theArcturus Ao. For Aurora, the correlation was not sufficient to alter the ORA. This situationmay have two main reasons:
1. Reduction in technicians is not strong enough to influence the Aurora Ao. To prove this
14 DRDC CORA TM 2009-027
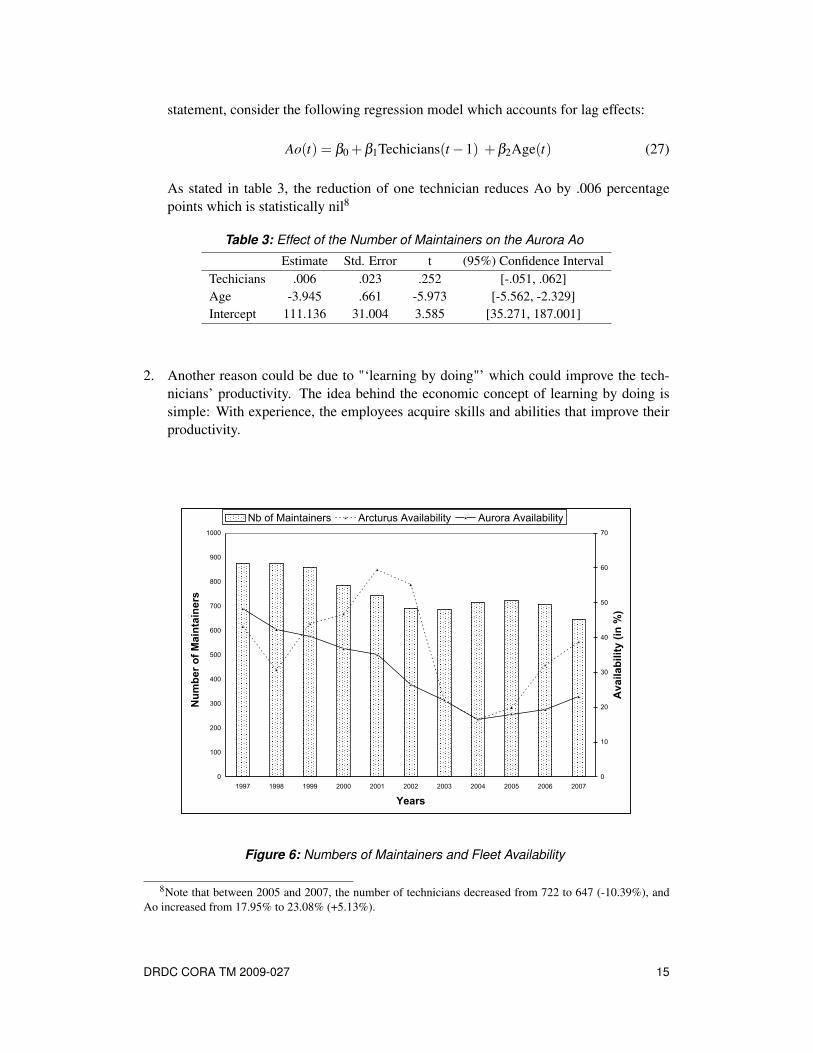
statement, consider the following regression model which accounts for lag effects:
Ao(t) = β0 +β1Techicians(t−1) +β2Age(t) (27)
As stated in table 3, the reduction of one technician reduces Ao by .006 percentagepoints which is statistically nil8
Table 3: Effect of the Number of Maintainers on the Aurora Ao
Estimate Std. Error t (95%) Confidence IntervalTechicians .006 .023 .252 [-.051, .062]Age -3.945 .661 -5.973 [-5.562, -2.329]Intercept 111.136 31.004 3.585 [35.271, 187.001]
2. Another reason could be due to "‘learning by doing"’ which could improve the tech-nicians’ productivity. The idea behind the economic concept of learning by doing issimple: With experience, the employees acquire skills and abilities that improve theirproductivity.
0
100
200
300
400
500
600
700
800
900
1000
1997 1998 1999 2000 2001 2002 2003 2004 2005 2006 2007
Years
Num
ber o
f Mai
ntai
ners
0
10
20
30
40
50
60
70
Ava
ilabi
lity
(in %
)
Nb of Maintainers Arcturus Availability Aurora Availability
Figure 6: Numbers of Maintainers and Fleet Availability
8Note that between 2005 and 2007, the number of technicians decreased from 722 to 647 (-10.39%), andAo increased from 17.95% to 23.08% (+5.13%).
DRDC CORA TM 2009-027 15
5.2 Effect of the Aurora Incremental Modernization Project
The AIMP was implemented in the late 1990’s to restore the Aurora’s operational capabil-ity ([23, 24]). Since the Aurora’s systems are based on 1960’s technology, the AIMP wasindispensable to upgrade Canada’s surveillance needs at home and abroad. In this subsec-tion, this modernization is seen as a repair. This program should improve the Aurora flightsafety, supportability and reliability of its tactical systems.
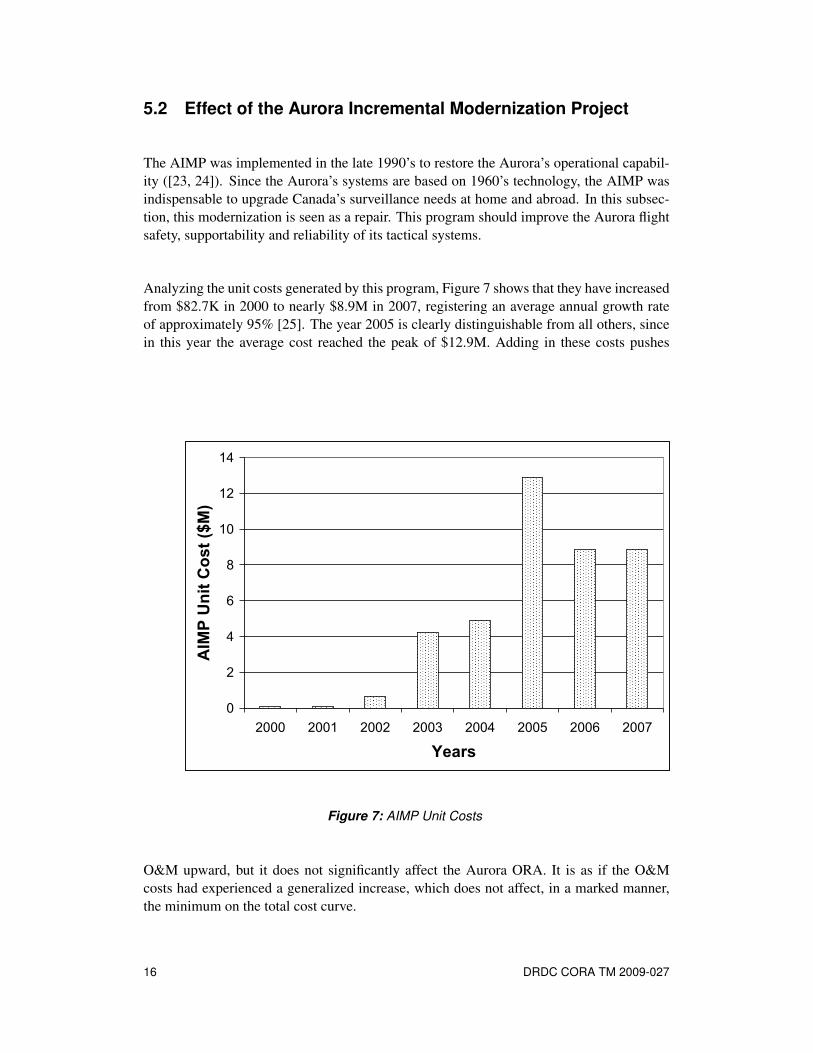
Analyzing the unit costs generated by this program, Figure 7 shows that they have increasedfrom $82.7K in 2000 to nearly $8.9M in 2007, registering an average annual growth rateof approximately 95% [25]. The year 2005 is clearly distinguishable from all others, sincein this year the average cost reached the peak of $12.9M. Adding in these costs pushes
0
2
4
6
8
10
12
14
2000 2001 2002 2003 2004 2005 2006 2007
Years
AIM
P U
nit C
ost (
$M)
Figure 7: AIMP Unit Costs
O&M upward, but it does not significantly affect the Aurora ORA. It is as if the O&Mcosts had experienced a generalized increase, which does not affect, in a marked manner,the minimum on the total cost curve.
16 DRDC CORA TM 2009-027
5.3 Effect of Operational Availability
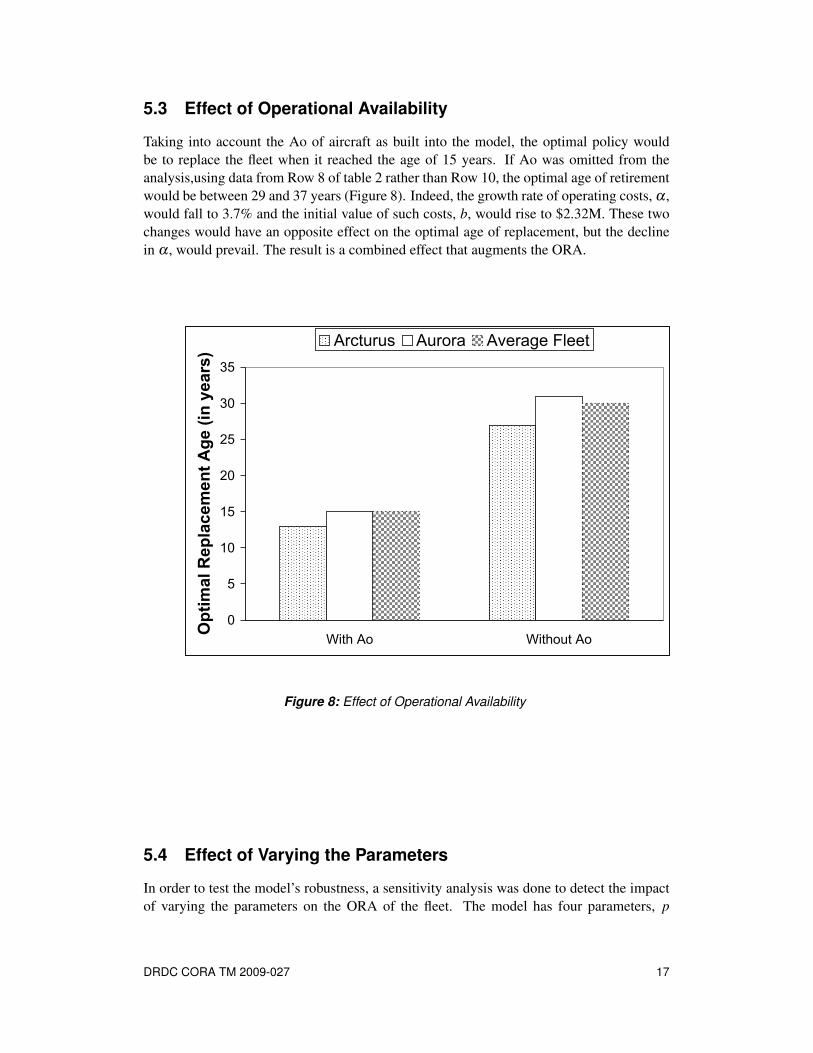
Taking into account the Ao of aircraft as built into the model, the optimal policy wouldbe to replace the fleet when it reached the age of 15 years. If Ao was omitted from theanalysis,using data from Row 8 of table 2 rather than Row 10, the optimal age of retirementwould be between 29 and 37 years (Figure 8). Indeed, the growth rate of operating costs, α ,would fall to 3.7% and the initial value of such costs, b, would rise to $2.32M. These twochanges would have an opposite effect on the optimal age of replacement, but the declinein α , would prevail. The result is a combined effect that augments the ORA.
0
5
10
15
20
25
30
35
With Ao Without AoOpt
imal
Rep
lace
men
t Age
(in
year
s)
Arcturus Aurora Average Fleet
Figure 8: Effect of Operational Availability
5.4 Effect of Varying the Parameters
In order to test the model’s robustness, a sensitivity analysis was done to detect the impactof varying the parameters on the ORA of the fleet. The model has four parameters, p
DRDC CORA TM 2009-027 17
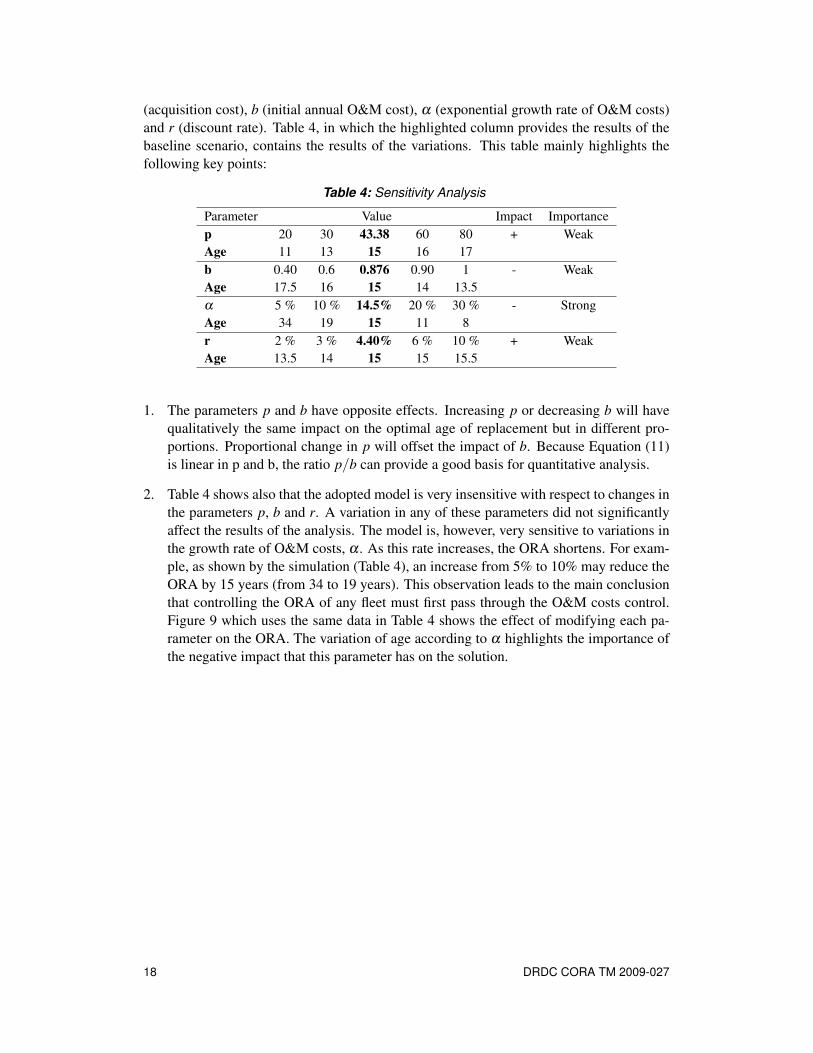
(acquisition cost), b (initial annual O&M cost), α (exponential growth rate of O&M costs)and r (discount rate). Table 4, in which the highlighted column provides the results of thebaseline scenario, contains the results of the variations. This table mainly highlights thefollowing key points:
Table 4: Sensitivity Analysis
Parameter Value Impact Importancep 20 30 43.38 60 80 + WeakAge 11 13 15 16 17b 0.40 0.6 0.876 0.90 1 - WeakAge 17.5 16 15 14 13.5α 5 % 10 % 14.5% 20 % 30 % - StrongAge 34 19 15 11 8r 2 % 3 % 4.40% 6 % 10 % + WeakAge 13.5 14 15 15 15.5
1. The parameters p and b have opposite effects. Increasing p or decreasing b will havequalitatively the same impact on the optimal age of replacement but in different pro-portions. Proportional change in p will offset the impact of b. Because Equation (11)is linear in p and b, the ratio p/b can provide a good basis for quantitative analysis.
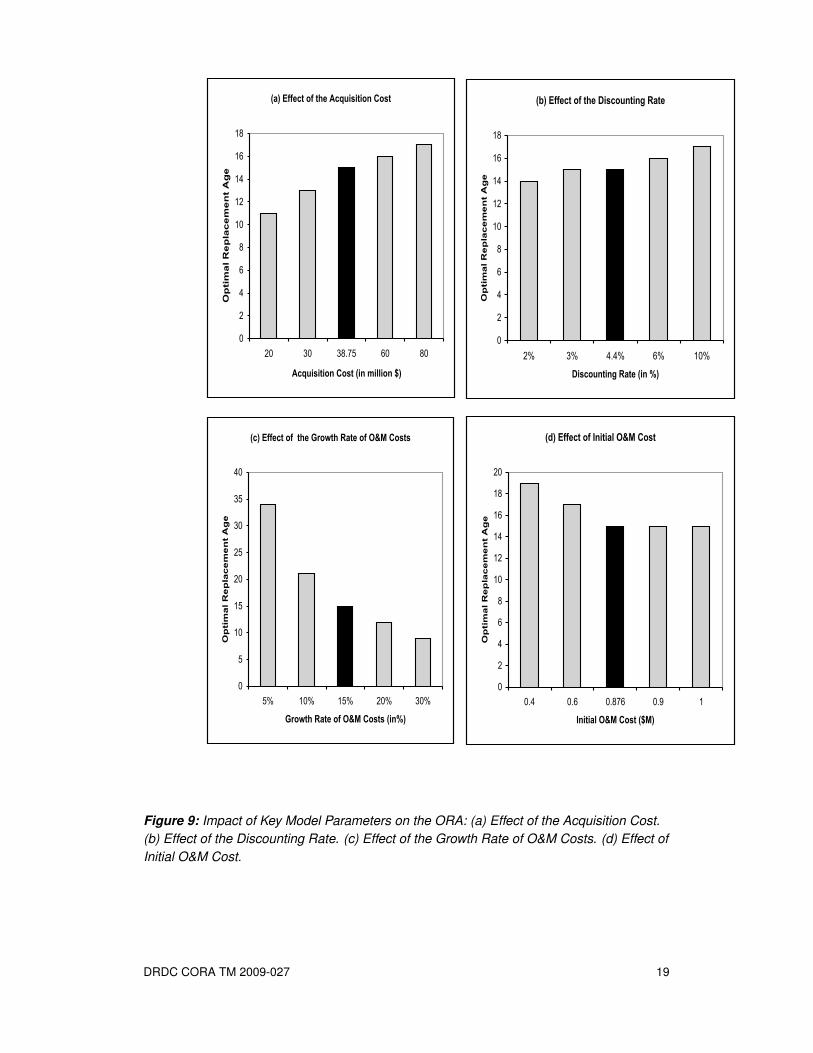
2. Table 4 shows also that the adopted model is very insensitive with respect to changes inthe parameters p, b and r. A variation in any of these parameters did not significantlyaffect the results of the analysis. The model is, however, very sensitive to variations inthe growth rate of O&M costs, α . As this rate increases, the ORA shortens. For exam-ple, as shown by the simulation (Table 4), an increase from 5% to 10% may reduce theORA by 15 years (from 34 to 19 years). This observation leads to the main conclusionthat controlling the ORA of any fleet must first pass through the O&M costs control.Figure 9 which uses the same data in Table 4 shows the effect of modifying each pa-rameter on the ORA. The variation of age according to α highlights the importance ofthe negative impact that this parameter has on the solution.
18 DRDC CORA TM 2009-027
(a) Effect of the Acquisition Cost
0
2
4
6
8
10
12
14
16
18
20 30 38.75 60 80
Acquisition Cost (in million $)
Op
tim
al R
ep
lac
em
en
t A
ge
(d) Effect of Initial O&M Cost
0
2
4
6
8
10
12
14
16
18
20
0.4 0.6 0.876 0.9 1
Initial O&M Cost ($M)
Op
tim
al R
ep
lac
em
en
t A
ge
(c) Effect of the Growth Rate of O&M Costs
0
5
10
15
20
25
30
35
40
5% 10% 15% 20% 30%
Growth Rate of O&M Costs (in%)
Op
tim
al R
ep
lac
em
en
t A
ge
(b) Effect of the Discounting Rate
0
2
4
6
8
10
12
14
16
18
2% 3% 4.4% 6% 10%
Discounting Rate (in %)
Op
tim
al R
ep
lac
em
en
t A
ge
Figure 9: Impact of Key Model Parameters on the ORA: (a) Effect of the Acquisition Cost.(b) Effect of the Discounting Rate. (c) Effect of the Growth Rate of O&M Costs. (d) Effect ofInitial O&M Cost.
DRDC CORA TM 2009-027 19
6 Summary
The longer a fleet stays in service, the higher will be its O&M costs and the lower itsoperational availability, and hence its overall capability. For this reason, the CF would liketo determine the ORA for their CP-140 fleet.
The CP140 fleet is over 25 years old and consists of 18 Aurora and 3 Arcturus aircraft,which require increasing O&M costs. For the Aurora, Annual O&M costs have increasedbetween 1997 and 2007 by approximately 84%, in terms of current dollars and by approx-imately 51%, in terms of 1989 constant dollar. These ratios are respectively 98% and 56%for the Arcturus. The Workload Ratio, which measures the number of Maintenance Person-Hours (MPHRs) per flying hour, have increased by 137.5% between 1985 and 2007.
Analysis shows that factors, such as workforce reductions and the Aurora Incremental Mod-ernization Project, may account for higher O&M costs but they are not strong enough toinfluence the ORA of the fleet.
A sensitivity analysis was carried out to assess the impact of key model parameters, suchas the acquisition cost and the growth rate of O&M costs, on the result. The numericalsimulation shows that the basic results are relatively insensitive to changes in the acquisitioncost and the discount rate. The simulation emphasizes, however, that the key parameter inthis model remains the exponential growth rate parameter of O&M costs. This result revealsthat to control the optimal replacement interval of the fleet requires a serious control of theO&M costs trend.
6.1 Recommendations
This study provides a strategy for determining the ORA for this fleet. Taking Ao intoaccount, results show that the ORA was 15 years for the Aurora which corresponds tothe year 1995 and 13 years for the Arcturus, which corresponds to the year 2006. Eachadditional year beyond the ORA produces an added cost. This cost is relatively low for thefirst few years, but becomes very significant if the replacement is delayed too long.
20 DRDC CORA TM 2009-027
References
1. National Defence (1994-2007). Cost Factors Manual, Government of Canada.Ottawa.
2. Greenfield, V. and Persselin, D. (2003), How Old is too Old?: an Economic Approachto Replacing Military Aircraft, Defence and Peace Economics, 14(5), 357–368.
3. Greenfield, V. and Persselin, D. (2002), An Economic Framework for ValuatingMilitary Aircraft Replacement, Santa Monica, CA: RAND Corporation, MR-1489-AF.
4. Keating, E. G. and Dixon, M. (2004), Investigating optimal replacement of aging airforce systems, Defence and Peace Economics, 15(5), 421–431.
5. Keating, E. G. and Dixon, M. (2003), Investigating optimal replacement of aging airforce systems, Santa Monica, CA: RAND Corporation, MR-1763-AF.
6. InnoVision Consulting INc. AEPM PERFORMA DV6000.4000.6052.
7. Taha, H. A. (2007), Operations Research: an Introduction, Eighth ed, New Jersey,USA: Prentice Hall.
8. Defense Planning Board Meeting (12 June 2007). Record of Decisions.
9. Email, P.E. Desmier, ADM(Mat)/DMGOR (23 November 2007, 1239 EST), FinalCP-140 Briefing for NPOC.
10. Lincoln, J. W. and Melliere, R. A. (1999), Economic life determination for militaryaircraft, Journal of Aircraft, 36(5), 737–742.
11. Chickermane, H. and Gea, H.C. (1996), A systematic design methodology forgenerating the optimal repairs of aging aircraft, Finite Elements in Analysis andDesign, 23(2-4), 365–379.
12. A. N. Schwartz, J. A. Sheler and Cooper, C. R. (1971), Dynamic programmingapproach to the optimization of naval aircraft rework and replacement strategies,Naval Research Logistics Quarterly, 18(3), 395–414.
13. Castro, I. T. and Sanjuán, E. L. (2008), An optimal repair policy for systems with alimited number of repairs, European Journal of Operational Research, 187(1), 84–97.
14. Dixon, M. (2005), The Costs of Aging Aircraft: Insights from Commercial Aviation,Santa Monica, CA: RAND Corporation, 90407-2138.
15. Email, J.H. Prince, ADM(Fin CS)/DMG Compt (08 August 2007, 0212 EST),Purchase Costs.
16. Defence National. Air Force: Aircraft (2007) (online),http://www.airforce.forces.gc.ca/site/equip/index_e.asp.
17. Bank of Canada (2007), Rates and Statistics: Interest Rates (online),http://www.bankofcanada.ca/en/rates/index.html.
DRDC CORA TM 2009-027 21
18. Preinreich, G. A. D. (1940), The Economic Life of Industrial Equipment,Econometrica, 8(1), 12–44.
19. Faustmann, M. (1849), On the Determination of the Value which Forest Land andImmature Stands Possess for Forestry, Allegmeine Forst, 15, 425–435.
20. Greene, W. H. (2003), Econometric Analysis, Sixth ed, New Jersey, USA: PrenticeHall.
21. Wooldridge, J. M. (2002), Econometric Analysis of Cross Section and Panel Data,Massachussetts, USA: MIT Press.
22. Email, A. Berthiaume, Workforce Modelling & Analysis / DGMPRA (02 Junuary2008, 1014 EST), CP-140 Maintainers.
23. Email, P.A. Cullen, ADM(Mat) (26 October 2007, 0959 EST), AIMP BN.
24. D.J. Bercuson, A.P. Plamondon and Szeto, R. (2006), An Opaque Window: AnOverview of Some Commitments Made by the Government of Canada Regarding theDepartment of National Defence and the Canadian Forces, Technical Report CanadianDefence and Foreign Affairs Institute, Calgary, Canada.
25. Email, G. Kelso, Project Management Office (18 December 2007, 1218 EST), AIMP.
22 DRDC CORA TM 2009-027
List of symbols/abbreviations/acronyms/initialisms
ADM(Mat) Assistant Deputy Minister(Materiel)Ao Operational AvailabilityAIMP Aurora Incremental Modernization ProjectB BillionCF Canadian ForcesDGAEPM Director General Aerospace Equipment Program ManagementFH flying hourK ThousandM MillionMPHRs Maintenance Person-HoursOLS Ordinary Least SquaresO&M Operating and MaintenanceORA Optimal Replacement Age
DRDC CORA TM 2009-027 23
Distribution List
Internal
Author (2)DRDC CORA // DG / CS / SH J&C /SH Air (1 copy on circ)DRDC CORA Library (2)
External
CDN Air Div HQ // ORADCOS ADM(MAT)DCOS ADM(MAT)CAS // CAS / DG Air FD /DASORDGAEPMDGLEPMDGMEPMNDHQ LibraryRepair or Replace Working Group: Attn:- DAR 3-5 (Maj. S. Chouinard)- CLS Exerc (Maj. S. Funk)- DAEBM 2-4 (Maj. DR Black)- DMSS-7 (Mr. RD Gauthier)- DLEPS 2-3 (Maj. R. Dubé)- DLEPS 4-4C3 (Mr. SS. Katynski)- CRS (Mr. Chris Currie )- DSFC 7-4 (Mr. J. Kasongo)- DMG Compt 5-3 (Maj. SJ Raymond)- DFPPC 4-4 (Maj. MIN Tremblay)- DLEPS 8-3-3 (Mr. BA Lecheminant)- D Air SP 3-2 (LCol P. Thauberger)
24 DRDC CORA TM 2009-027
DOCUMENT CONTROL DATA(Security classification of title, body of abstract and indexing annotation must be entered when document is classified)
1. ORIGINATOR (the name and address of the organization preparing the document.Organizations for whom the document was prepared, e.g. Centre sponsoring acontractor’s report, or tasking agency, are entered in section 8.)
DRDC – Centre for Operational Research and AnalysisNDHQ, 101 Col By Drive, Ottawa ON K1A 0K2
2. SECURITY CLASSIFICATION(overall security classification of the documentincluding special warning terms if applicable).
UNCLASSIFIED
3. TITLE (the complete document title as indicated on the title page. Its classification should be indicated by the appropriateabbreviation (S,C,R or U) in parentheses after the title).
An Economic Evaluation for CP-140 Aircraft Replacement
4. AUTHORS(Last name, first name, middle initial. If military, show rank, e.g. Doe, Maj. John E.)
Sokri, A.
5. DATE OF PUBLICATION (month and year of publication of document)
July 2009
6a. NO. OF PAGES (totalcontaining information. IncludeAnnexes, Appendices, etc).
38
6b. NO. OF REFS (total cited indocument)
25
7. DESCRIPTIVE NOTES (the category of the document, e.g. technical report, technical note or memorandum. If appropriate, enter the type of report,e.g. interim, progress, summary, annual or final. Give the inclusive dates when a specific reporting period is covered).
Technical Memorandum
8. SPONSORING ACTIVITY (the name of the department project office or laboratory sponsoring the research and development. Include address).
DRDC – Centre for Operational Research and AnalysisNDHQ, 101 Col By Drive, Ottawa ON K1A 0K2
9a. PROJECT OR GRANT NO. (if appropriate, the applicable research anddevelopment project or grant number under which the document waswritten. Specify whether project or grant).
9b. CONTRACT NO. (if appropriate, the applicable number under whichthe document was written).
10a. ORIGINATOR’S DOCUMENT NUMBER (the official document numberby which the document is identified by the originating activity. Thisnumber must be unique.)
DRDC CORA TM 2009-027
10b. OTHER DOCUMENT NOs. (Any other numbers which may beassigned this document either by the originator or by the sponsor.)
11. DOCUMENT AVAILABILITY (any limitations on further dissemination of the document, other than those imposed by security classification)
( X ) Unlimited distribution( ) Defence departments and defence contractors; further distribution only as approved( ) Defence departments and Canadian defence contractors; further distribution only as approved( ) Government departments and agencies; further distribution only as approved( ) Defence departments; further distribution only as approved( ) Other (please specify):
12. DOCUMENT ANNOUNCEMENT (any limitation to the bibliographic announcement of this document. This will normally correspond to the DocumentAvailability (11). However, where further distribution beyond the audience specified in (11) is possible, a wider announcement audience may beselected).
13. ABSTRACT (a brief and factual summary of the document. It may also appear elsewhere in the body of the document itself. It is highly desirable that theabstract of classified documents be unclassified. Each paragraph of the abstract shall begin with an indication of the security classification of theinformation in the paragraph (unless the document itself is unclassified) represented as (S), (C), (R), or (U). It is not necessary to include here abstracts inboth official languages unless the text is bilingual).
The purpose of this report is to identify the optimal replacement strategy for the Canadian Forces (CF) Long-Range Patrol CP-140 fleet. The adopted mathematical formulation is a fusion between an intergenerationalmodel and an approach which uses the notion of operational availability of aircraft. In this resulting model,operating and maintenance costs per available year are estimated as a function of aircraft age during its lifecycle. After determining the optimal age of replacement, a sensitivity analysis was carried out to assess theimpact of some key model parameters on the result. This repair or replace model has the huge advantageof being applicable to any kind of heavy equipment. For example, it may be used to determine, in the samemanner, the optimal age of replacing several types of fleets such as helicopters, ships, tanks, trucks, etc.
14. KEYWORDS, DESCRIPTORS or IDENTIFIERS (technically meaningful terms or short phrases that characterize a document and could be helpful incataloguing the document. They should be selected so that no security classification is required. Identifiers, such as equipment model designation, tradename, military project code name, geographic location may also be included. If possible keywords should be selected from a published thesaurus. e.g.Thesaurus of Engineering and Scientific Terms (TEST) and that thesaurus-identified. If it not possible to select indexing terms which are Unclassified, theclassification of each should be indicated as with the title).
Defense EconomicsMilitary AircraftOptimal Replacement StrategyRepairOperational AvailabilityGeometric SeriesRegression.

DRDC CORA
www.drdc-rddc.gc.ca


![[XLS] · Web view1 140 2 140 3 140 4 140 5 140 6 140 7 140 8 140 9 140 10 140 11 140 12 140 13 140 14 140 15 140 16 140 17 140 18 140 19 140 20 140 21 140 22 140 23 140 24 140 25](https://img.pdfslide.net/doc/110x75/5b0e34b97f8b9a96478b4bbf/xls-view1-140-2-140-3-140-4-140-5-140-6-140-7-140-8-140-9-140-10-140-11-140-12.jpg)