Embed Size (px)
Citation preview

Old Dominion UniversityODU Digital Commons
School of Public Service Theses & Dissertations School of Public Service
Spring 2008
An Empirical Analysis of Macroeconomic andPolitical Determinants of Private Investment inSub-Saharan AfricaRalph Cann-TamakloeOld Dominion University
Follow this and additional works at: https://digitalcommons.odu.edu/publicservice_etds
Part of the Finance Commons, Macroeconomics Commons, and the Political Science Commons
This Dissertation is brought to you for free and open access by the School of Public Service at ODU Digital Commons. It has been accepted forinclusion in School of Public Service Theses & Dissertations by an authorized administrator of ODU Digital Commons. For more information, pleasecontact [email protected].
Recommended CitationCann-Tamakloe, Ralph. "An Empirical Analysis of Macroeconomic and Political Determinants of Private Investment in Sub-SaharanAfrica" (2008). Doctor of Philosophy (PhD), dissertation, , Old Dominion University, DOI: 10.25777/rk6e-mh59https://digitalcommons.odu.edu/publicservice_etds/23

AN EMPIRICAL ANALYSIS OF MACROECONOMIC AND POLITICAL DETERMINANTS OF PRIVATE
INVESTMENT IN SUB-SAHARAN AFRICA
By
RALPH CANN-TAMAKLOE
Dissertation submitted to the Faulty of Old Dominion University in partial fulfilment of the requiement for the Degree of
DOCTOR OF PHILOSOPHY
PUBLIC ADMINISTRATION AND URBAN POLICY
OLD DOMINION UNIVERSITY May 2008
Reviewed by:
Nancy A. Bajjranoff. Ph.D, DeanCollege of Business and Public Administration
/Shn\ Morris, Ph.D. fooetoral Program Director
Approved by:
Berhanu Menglstu, Ph.D., (Chair)
JoKn Lombard, Ph.D., (Member)
David Selover, Ph.D., (Member)

DISSERTATION: AN EMPIRICAL ANALYSIS OF MACROECONOMIC AND POLITICAL DETERMINANTS OF PRIVATE INVESTMENT IN SUB-SAHARAN AFRICA
by
RALPH CANN-TAMAKLOE
B.Sc. Land Economy October 1992, University of Science and Technology, Kumasi MA Economic Policy Management, March 2001, University of Ghana, Legon
A Dissertation submitted to the Faculty of Old Dominion University in partial fulfillment of the requirement for the degree of
DOCTOR OF PHDLOSOPHY
PUBLIC ADMINISTRATION AND URBAN POLICY
OLD DOMINION UNIVERSITY

ACKNOWLEDGEMENT
I am indeed grateful to my professors of Department of Urban Studies and Public
Administration, family members, and friends for their support to complete this dissertation. I
am very grateful to Dr Berhanu Mengistu, the chair of my dissertation committee who tutored
me through the rudimentary stages of developing a topic, turning the topic into a concept
paper, testing the concept paper at a peer review conferences, and the expansion of the
concept paper to a complete dissertation. His patience, endurance, and courage to always get
the best out of the student deserve commendation. My special gratitude also goes to Dr John
Lombard and Dr David Selover who willingly agreed to serve on my committee despite their
tight work schedules. I appreciate the suggestions and comments of Dr Larry Filer who could
not serve fully on the committee because of other engagements.
Besides, I am indeed thankful to the entire faculty and staff of the Economics
Department, especially Dr Vinod Agarwal and Dr Christopher Colburn for providing me
with the platform to launch my teaching career in the United States. I admire the friendships
and support of Samuel Adams, Tassaw Gisaw, and Getachew Melkie my fellow doctoral
students.
I acknowledge the contribution of my uncle Professor EKA Tamakloe towards my
graduate studies. To my mother Esther Adzo Osabutey, I thank you for giving me the
opportunity to live and wish you God's blessing among women.
Finally, I express my special love and appreciation to my wife Vera and, children
Paul, Comfort, Joshua, Joseph, Ralph, Rachel, Benjamin, Michael, and Evangeline for their
endurance to cope with life in the absence of daddy.

DEDICATION
I dedicate this dissertation first to my late father Prince Kofi Drah Tamakloe, and second, to my late brothers Dennis, Ben and Michael. May their souls rest in perfect peace.

ABSTRACT
The general macroeconomic and political difficulties experienced by many Sub-
Saharan African countries in the late 1980s has led to economic and political reforms to
improve private investment performance. It has been estimated that Sub-Saharan African
countries needed to boost private investment in gross domestic product some 25% in the
1990s to achieve sustainable growth and development (Pfefferman and Madarassy,
1989). However, private investment performance has fallen short of the estimated 25%,
and remained stagnant between 12.4% and 14.1% per annum from 1993 to 2002.
The purpose of this study therefore is to examine the influence of macroeconomic
factors and democracy, proxied by political rights and civil liberties scores, on gross
private investment in Sub-Saharan Africa from 1993 to 2002. The study uses the
neoclassical investment model which suggests that output, the real interest rate, the price
of capital, the rate of depreciation of capital, and public sector investment are the main
determinants of private investment. Also, the study examines the effects of other
variables such as the per capita income, the credit availability to the private sector, the
general price level, the external shock, the currency depreciation or devaluation, and the
debt overhang, on private investment. The study utilizes panel data from 1993 to 2002 for
43 Sub-Saharan African countries and employs the panel least squares, the fixed effects
and the random effects techniques to estimate the model. Following the Hausman test
statistics, the study placed more weight on the fixed effects model and found that the
growth rate of real output, the per capita income, and the past level of private investment
are the significant factors affecting private investment in Sub-Saharan Africa. Democracy
exerts the expected positive impact albeit insignificantly.
l

TABLE OF CONTENTS
ABSTRACT i
TABLE OF CONTENTS ii
LIST OF TABLES iv
LIST OF FIGURES v
LIST OF APPENDICES vi
CHAPTER 1 1
Introduction 1 Background 2 Problem Statement 5 Theoretical Framework 7 Purpose Statement 7 Research Questions 9 Methodology 10 Research Design 10 Data Analysis 10 Significance of the Study 10 Definition of terms 11 Limitations 12 Study Overview 12
CHAPTER 2 15
Literature Review 15 Theoretical Review 15 Foreign Direct Investment 22 Democracy and Investment Performance 28 Empirical Literature 31 Summary of Empirical Literature 36
CHAPTER 3 40
Methodology 40 Research Design 40 Economic Model of Investment 41 Model Specification 42 Data 43 Data Description 49
ii

CHAPTER 4 54
Results 54 Panel Least Squares 55 The Fixed Effects Model 65 The Random Effects Model 67 The Hausman Test 70
CHAPTER 5 71
Findings, Discussions and Conclusion 71 Discussion 72 Policy Implications 76 Contribution to Theory 78 Limitations and Directions for Future Research 78 Conclusion 79
REFERENCES 81
APPENDIX 88
iii

LIST OF TABLES
TABLE
1. Variables, Symbols and Sources of Data Collection 48
2. Summary Statistics 52
3. Correlation Matrix 53
4. Neoclassical - Political rights model of private investment: Panel Least Squares. ...56
5. Neoclassical - Civl liberties model of private investment: Panel Least Squares 58
6. McKinnon - Political rights model of private investment: Panel Least Squares 62
7. McKinnon - Civil liberties model of private investment: Panel Least Squares 63
8. Macroeconomic - Political model of private investment: Panel Least Squares 64
9. Macroeconomic - Political model of private investment: Fixed Effects Method .. ..68
10. Macroeconomic - Political model of private investment: Random Effects
Method 69
11. Correlated Random Effects - Hausman Test 70
iv

LIST OF FIGURES
FIGURE
1. Gross Domestic Private Investment Performance in Sub-Sharan
Africa from 1993 to 2002
2. Regional distribution of foreign direct investment inflows
to Africa in 2005
3. Foreign direct investment performance in Sub-Sharan Africa
from 1993 to 2004

LIST OF APPENDICES
APPENDIX
1. List of major economic and political events in Sub-Sahran
Africa from 1990-2002 88
2. Basic Indicators: Size and growth rates 97
3. Data Treatment 99
4. Eviews Original Regression Results 102
vi

CHAPTER 1
INTRODUCTION
The public sector, in the form of local, state, and federal or national governmental
offices, organizations, and institutions, performs very important functions. Although the
proper role of the government in economic development is subject to considerable
debate, public sector economic literature suggests that government should provide public
goods, correct for externalities induced by market transactions, and promote competition.
In addition, government has a responsibility to stabilize the economy through the use of
fiscal and monetary policies to control unemployment and inflation that may result from
aggregate failure of the market. Most importantly, government also has the responsibility
to redistribute income to reduce unequal distribution of income by market forces.
However, in recent times, due to budgetary constraints and efficiency considerations,
governments over the world have resorted to privatization and public-private partnerships
arrangements to deliver public goods and services. This shift in emphasis from the public
sector to the private sector demands increases in private sector investment in order to
cope with the challenges of economic development and growth.
The role of total domestic investment in promoting economic development in
post-independent Sub-Saharan Africa had been recognized by development planners. But
there had been considerable debate and disagreement as to whether the public or the
private sector should provide the leading role in promoting investment. In the presence of
massive poverty and colossal market failures, many Sub-Saharan African countries opted
for centralized development planning in which the state or the public sector assumed the
commanding role in investment initiatives. Besides market failures and poverty, Sub-
1

Saharan African countries were heavily influenced by the examples of the former Union
of Soviet Socialist Republics (U.S.S.R) and India that industrialized at a fast pace with
centralized planning (Collier and Gunning, 1999; Hope, 1997; 1999). Sub-Saharan
African countries not only adopted the Soviet Union's style of economic development but
also its political governance model of one party or no party regimes without tolerance for
political dissent and the suppression of political freedoms and civil liberties.
In the late 1980s and early 1990s, however, due mainly to economic stagnation
and poor governance outcomes, there had been a re-thinking and re-conceptualization of
economic development policy and political governance in Sub- Saharan Africa. As a
result, many Sub-Saharan Africa countries implemented structural adjustment policies
and democratic constitutional reforms in which the private sector was recognized as the
main engine of growth. This study therefore examines the macroeconomic and political
factors affecting private investment in Sub-Saharan Africa from 1993 to 2002 within the
context of neoclassical investment theory and the McKinnon-Shaw hypothesis.
This chapter presents the background, the statement of the problem, the purpose
of the study, the theoretical framework, the methodology, the significance of the study,
and its limitations.
Background
Development strategy in many post-independent Sub-Saharan African countries
in the early 1960s was shaped by centralized economic planning systems, various forms
of socialist organizations and emphasis on Keynesian economics. Also, there were
government administered price controls and regulated labor, commodity, and financial
markets. Again, the share of the public sector in the economy was increased through the
2

appropriation and nationalization of private enterprises and financial institutions, and the
creation of public monopolies responsible for the marketing of agriculture products.
Furthermore, governments administratively allocated foreign exchange, and credit and,
pursued restrictive trade policy and an inward-looking import-substitution industrial
strategy (Hope, 1999).
These interventionist anti-market policies were adopted in the face of the stark
realities of colossal market failures, poverty, illiteracy and disease and the need for rapid
economic development to combat these problems. The positive outcomes of these
policies made Collier and Gunning (1999) remark that in the 1960s Africa's economic
future looked very prosperous. Despite the positive gains made in the 1960s, these
interventionist anti-market measures overextended Sub- Saharan African governments in
the 1970s, and overwhelmed their administrative capacity leading to disappointing
outcomes such as poverty and social inequality, an external debt burden, a brain drain,
capital flight, a huge balance of payments disequilibrium, a deteriorated physical
infrastructure, unemployment and high crime rates. In addition, famine and malnutrition
became severe, budget deficits expanded, agriculture productivity declined, and there was
rapid urbanization coupled with scanty urban services such as water, electricity,
telecommunication and transportation. Besides that, environmental degradation, political
and civil strife increased, and corruption became pervasive (Hope, 1999; Jaycox, 1992).
The macroeconomic landscape was the exact replica of the political performance
of many Sub-Saharan African countries in the 1970s and 80s because there were about 60
successful coups culminating in forceful change of regimes, 70 abortive coups, and 125
officially reported coup plots. Ghana represents one extreme case of 5 successful coups, 6
3
abortive coups and 13 formally reported coup plots, to the other extreme are cases like
Botswana and a few others which experienced no coups at all (McGowan and Johnson,
1984; Fosu, 2003). Common to these irregular regime changes were abolition of national
constitutions, a curtailment of political and civil liberties and the establishment of
unresponsive military dictatorships. Again, these forceful overthrow of governments
generated political instability and displacement of large segment of the population in
many Sub-Saharan African countries. The displacement of the population was generally
accompanied by a loss of jobs and property, thus reducing drastically the marginal
propensity to save and invest. The political instability induced by military coups could
further deter investment in fixed capital stocks such as factories, plant and machinery and
land because investors would prefer to keep their assets in liquid forms such as in gold
and foreign currencies. Thus in times of political instability the supply of investment
capital by households and demand of investment funds by businesses would decline
(Feng, 2002; Alesina and Perrotti, 1996; Alesina et al, 1996). In light of these
developments, an institution of democratic governance and a large increase in private
investment are suggested as a prescription for Sub Saharan Africa's dismal economic and
political performance (World Bank, 1989; Khan and Reinhart, 1990; Hope, 1997).
Private investments are justified on the ground that they respond to market signals which
implies that society's resources are deployed to sectors that are most needed thus
ensuring productive and allocative efficiency. Democracy on the other hand promotes the
rule of law, independent and impartial judiciary, separation of governmental powers and
checks and balances, periodic and competitive elections, press freedom and peaceful
4

regime change. These factors protect private capital and tend to decrease the appearance
irregular regime change and political instability.
Problem Statement
In order to make the policy environment more friendly and conducive to private
investment activities, most Sub-Saharan African countries implemented policies such as
trade liberalization, privatization and financial market liberalization and democratization
of governance, all being part of a general structural adjustment policies package.
Appendix 1 gives the chronological list of major economic and political reforms and
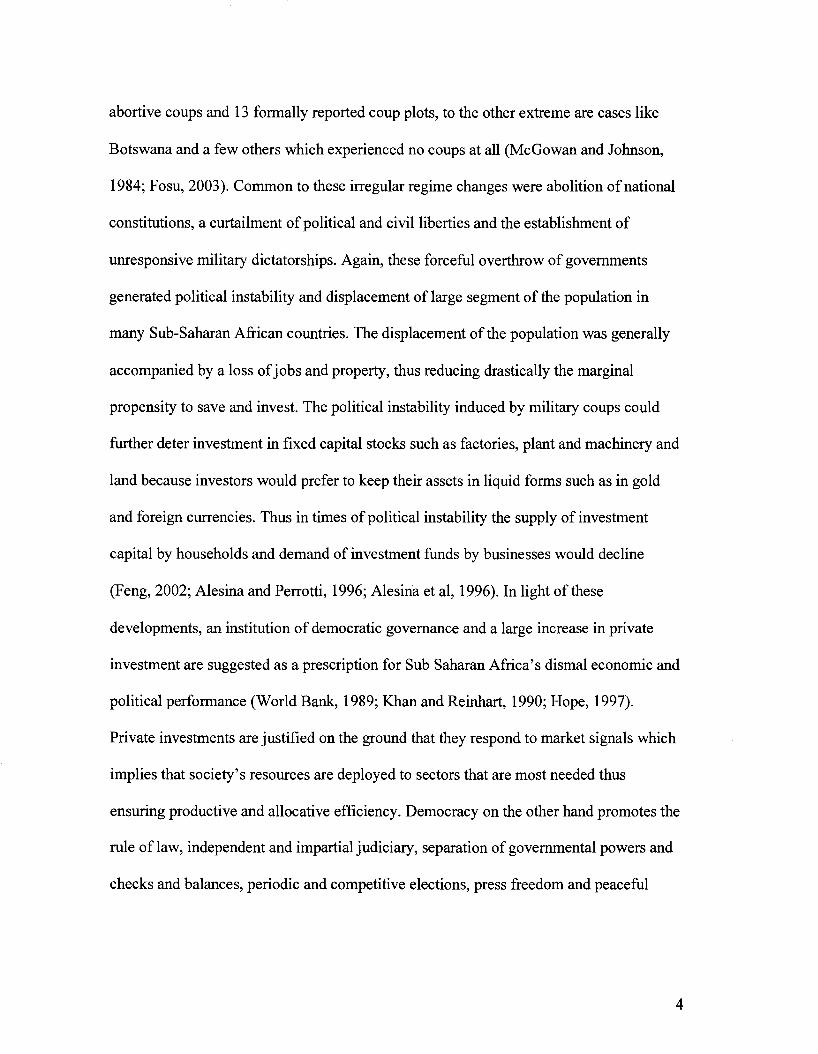
events in Sub-Saharan African countries. According to Pfefferman and Madarassy
(1989), Sub-Saharan African countries needed to boost private sector investment to 25%
of Gross Domestic Product (GDP) in the 1990s for sustainable growth and development.
However, private investment performance has fallen short of the estimated 25% and
remained stagnant between 12.4% and 14.1% from 1993 to 2002. This performance is
even more disappointing and gloomy if its two giant's economies, Nigeria and South
Africa are excluded. When only South Africa is excluded private- sector investment
declined to 11.3% and 13.6% but if both South Africa and Nigeria are removed from the
computation, the figures dropped to 11.1% and 13.9% between 1993 and 2002 (World
Bank, 2004). Figure 1 depicts the trend in private investment performance below
graphically.
5
FIGURE 1
GROSS DOMESTIC PRIVATE INVESTMENT PERFORMANCE IN SUB-SAHARAN AFRICA FROM 1993-
2002
14.2 14
13.8 13.6 13.4 13.2
13 12.8 12.6 12.4 12.2
PIGDP
1992 1994 1996 1998 2000 2002 2004
Source: World Bank (2004)
This dismal performance of private investment deserves even stronger criticism if one
considers the fact that in Africa, the minimum level of investment required per annum to
replace the depreciated capital stock is estimated at 13% of GDP (World Bank, 1991;
Serven and Solimano, 1991). It is imperative to study systematically the forces that
promote private investment because private sector contributions to economic
development have taken center stage in policy deliberations in Sub- Saharan Africa, and
in bilateral and multilateral agencies such as the United States Agency for International
Development, the World Bank, and the International Monetary Fund.
6

Theoretical framework
Several economic theories have been developed to explain investment behavior,
including the accelerator model, the adjustment-cost model, and models based on credit
rationing. Although each of these models only picks up a little bit of the complex reality
of aggregate investment behavior, they still form the core of most empirical
investigations of investment spending. The study of the determinants of private
investment is further warranted because, as argued by Keynes in his classic work, the
General Theory of Employment, Interest and Money, fluctuations in private investment
play a significant role in determining the level of output and unemployment in an
economy.
Furthermore, investment spending is a major determinant of long-term economic
growth. Oshikoya (1994) undertook a pioneering research on the determinants of private
investment for eight African countries and focused on macroeconomic factors, utilizing
data from 1970 to 1988. The selection of the eight countries was based on data
availability rather than on any scientific sampling technique thus affecting the
generalizability of the results. Besides economic factors, political factors also influenced
domestic private investment decisions (Serven and Solimano, 1993) but were excluded in
Oshikoya's empirical work.
Purpose Statement
The purpose of this study is to examine the influence of macroeconomic factors
and democracy (proxied by political rights and civil liberties scores) on gross private
investment in Sub Saharan Africa from 1993 to 2002. The objective of the study is to test
neoclassical investment theory which suggests that output, real interest rate, price of
7

capital, rate of depreciation, public sector investment are determinants of private
investment and other effects such as per capita income, credit availability to the private
sector, general price level, external shock, real depreciation or devaluation, debt overhang
and democracy on private investment. The study also controls for the effects of
geography and war.
Income per person (per capita income) has been identified as a factor affecting
private investment because high income countries have the ability to save and investment
more than low income countries (Greene and Villanueva, 1991). McKinnon (1973) and
Shaw (1973) suggest that in the presence of large financial repression and lack of
efficient capital markets in developing countries, credit availability could be an important
factor affecting the level of private investment activity. Again real depreciation or
devaluation has been postulated as a factor affecting private investment specifically in the
export sector as devaluation tends to increase the domestic price of exports thus serving
as an incentive for more private investment (Khan and Knight, 1985; Buffie, 1986).
Besides, it has been argued that the existence of huge external debt is a disincentive to
private investment as economic agents construe large external debt stock as a signal of
high expected tax rates in the future (Borenzstein, 1989; Corden, 1988; Krugman, 1988).
Pindyck (1991) posits that investment is irreversible and fraught with uncertainties, and
therefore the inflation rate and the terms of trade may be factors that will affect private
investment activity as rapid changes in these factors constitute uncertainties to private
investors. Finally, democracy is postulated to institutionalize the redistributive system,
and it is also established on a more support base than autocracy, therefore a democratic
8

environment is expected to be more conducive to private investment activity than
autocratic political environment (Feng, 2001).
Research Questions
Sub-Saharan African countries implemented market oriented policy reforms in the
late 1980s and early 1990s to promote private investment activity. In spite of this, private
investment performance has remained far below the estimated 25% of GDP for
sustainable development. However, private investment activity takes place in a political
environment and, as Nyong'o (1997) suggests the top heavy bureaucracies created by
one-party regimes in Sub-Saharan Africa were generally wasteful, corrupt, inefficient,
repressive and detrimental to Africa's development. Although private sector initiatives
and market reforms are essential for sustainable development, they are not sufficient
conditions because they must go hand-in-hand with democratic governance (World Bank,
1989; Globerman and Shapiro, 2003). Therefore in an attempt to examine the factors that
determine private investment activity in an economy, the research question must
encompass both macroeconomic and political environment. In view of this assertion, the
study seeks to answer the following two research questions:
1. What are the effects of macroeconomic variables on gross private investment in
Sub-Saharan Africa?
2. What is the influence of democracy as measured by political rights and civil
liberties scores on gross private investment?
9

Methodology
Research Design
The study uses a longitudinal panel of macroeconomic and political data of Sub-
Saharan African countries over 1993 to 2002 to examine the influence of macroeconomic
and political factors on private investment. Panel design is preferred over cross-section
and time series design because panel data controls for heterogeneity among individual
countries (Baltagi, 1995). Cross-section and time series studies do not control for
heterogeneity thus leading to biased results. However, the use of panel data is not without
cost. The disadvantage is that it involves annual data covering a short span of time for
each country. This implies that asymptotic arguments depend largely on the number of
countries tending to infinity. Increasing the time span will lead to higher costs, an
upsurge in attrition rates, and increases in the computational difficulty for limited
dependent variable panel data models (Green, 2000; Baltagi, 1995).
Data Analysis
Using quantitative data from African Development Indicators (2004),
International Financial Statistics (2004) and Freedom House (2003), the study employs
panel least squares, and fixed and random effects estimation techniques to estimate the
private investment model. EXCEL, SPSS and EVIEWS computer programs are used to
compute summary descriptive statistics, correlation and coefficients of the variables.
Significance of the Study
The significance of the study is justified by its important contributions to the
literature and policy in several ways. First, the inclusion of two political variables,
political rights and civil liberties as a proxy for democracy in the investment model
10

estimated. Second, an increase in the sample size by including all of the entire 48 Sub-
Saharan African countries in the study. Third, the results of the study have implications
for country level economic development policy and the impact of monetary, fiscal,
structural adjustment, and stabilization policies on private investment. Finally, the study
utilizes the latest annual time series data from 1993 to 2002 using both the fixed effects
and the random effects estimation techniques to estimate the data. These panel estimation
techniques capture the cultural, geographic and institutional differences on the estimated
coefficients of the variables. The time period of the study coincides with major political,
institutional, and economic reforms in many Sub- Saharan African countries.
Definition of terms
Sub-Saharan Africa is the term used to describe those countries of Africa that
are not part of North Africa. It comprises 48 independent countries sharing similar socio-
cultural and economic features. Appendix 2 gives a list and basic indicators of these
countries. However, because of missing data Djibouti, Eritrea, Liberia, Namibia, and
Somalia are not used.
Investment is defined to mean the flow of output in any given period that is used
to maintain or increase the capital stock in an economy. The national accounts measure
three main kinds of physical investment: investment in residential structures, fixed
business investment, and inventory investment.
Capital in this context refers to the accumulated stocks of machinery, factories,
and other durable factors of production.
Democracy in this research focuses on liberal democracy and it is used
interchangeably with political freedom. It is defined to mean the degree to which a
11

political system facilitates political liberties and democratic rule. Political liberties exist
when citizens of a political jurisdiction have the freedom to express different political
views in any media and enjoy the freedom to establish or belong to any political party or
group. When the national government of a country is accountable or answerable to its
citizens and citizens are entitled to participate in the government directly or through their
elected representatives, democratic rule is said to exist (Bolden 1993, 1990, 1986).
Democracy or political freedom is operationalized by political rights and civil liberties
scores according to Freedom House measures.
Political rights depend on elections being held freely and fairly and
competitively in democratic countries, and opposition parties play an important role in
checks and balances.
Civil liberties are a function of freedom of association, assembly, demonstration,
speech, and religion, as well as free and independent media and court systems, freedom
to do business on an equitable basis without excessive government corruption, and
freedom to organize unions and other private groups (Feng, 2003; Freedom House, 2003,
1998). The Freedom House Survey rates political and civil liberties separately on a
seven-point category scale in which 1 represents the most free and 7 the least free. The
average ratings of both scores ranging from 1.0-2.5 are generally considered free, 3.0-5.5
partly free, and 5.5-7.0 not free.
Depreciation is an increase in the domestic price of a foreign currency largely by
market forces.
Devaluation is an official action undertaken by the central bank to raise the
domestic price of a foreign currency.
12

External shock refers to unexpected changes in major commodity prices with
either favorable or adverse consequences.
Debt overhang refers to the external burden of developing countries that is so
large that there can be no full repayment without destabilizing the debtor country.
Creditor banks and governments would end up with less repayment than if they agreed to
an orderly reduction of the debt through negotiation.
Limitations
The findings of the study should be interpreted with caution because the data set
contains much missing information that was estimated using different methods and
measures. The regression diagnostic tests show evidence of serial correlation in the data
which might make the estimated coefficients less significant than they actually are.
Attempts to correct for serial correlation turn the results in some cases into directions
contrary to expectations. Again, the study aggregated private investment and assumed
that the various types of private investment respond in the same way. Future research that
disaggregates investment into its various components would go a long way to enhance
our understanding of investment behavior. Despite these limitations, most of the findings
of the study are consistent with both theoretical and empirical literature.
Study Overview
The study will be divided into five main chapters. The first chapter provides an
introduction and background to the study and introduces the research problem and
questions. The second part reviews both theory and the empirical literature on investment
behavior in general. Chapter three details the data sources, model specification, and the
estimation techniques, and the fourth chapter presents the estimated results of the
13

investment model. The fifth section discuses the results and the implications of the results
for policy and future research.
In the next chapter, both the theoretical and empirical literature relating private
investment to macroeconomics variables and democracy are reviewed in order to show
the gaps in the political economy literature of private investment that the study attempts
to fill.
14

CHAPTER II
LITERATURE REVIEW
Theoretical Review
Generally, the basic theory of investment begins by taking into account the fact
that investment spending or expenditure is an option to financial saving for allocation
consumption over time. The implication of this proposition is that for any additional or
extra investment, the return to investment should be equal to the return on saving. Put
differently, the marginal productivity of capital (MPK) should be equal to the real rate
interest adjusted for depreciation (Sachs and Larrain, 1993). However, several empirical
models such as the accelerator model, the adjustment- cost approach, Tobin's q theory of
investment, and other theories based on credit rationing have been used to describe and
estimate the investment function.
Early empirical investigations of aggregate investment spending by firms noted a
close association between output and investment spending, and this observation was very
important to the development of the accelerator model, the earliest theory of investment
still in empirical use. The accelerator theory of investment, according to Clark, (1917)
states that investment varies with output and that an increase in the demand for finished
goods tends to increase investment in inventories more than proportional to increase in
sales, except when the firm is constrained by: (1) lack of access to additional credit to
undertake the extra investment, (2) an abnormal increase in supply prices, (3) the anxiety
that the prosperity is of a temporary nature and (4) the inability of producers to make
timely deliveries. In quantitative terms, the model assumes that there is a stable
relationship between the capital stock the firm desires and the firm's level of output. To
15

be more precise, the accelerator theory suggests that the desired amount of capital is a
constant fraction of output. However, this relationship is postulated rather than proved, so
in its simplest form the model predicts that investment increases when output accelerates.
The model has been found to be weak in three respects according to Jorgensen (1967),
and Hall and Jorgensen (1971). First, the ratio of desired capital to the level of output (h)
is assumed to be constant and this only holds if the cost of capital is fixed. In reality the
cost of capital is not fixed because of changes in market interest rates or amendments of
the laws governing investment. This means that h cannot be fixed because of changes in
the market interest rates and investment laws. Second, the model assumes that investment
is always enough to maintain the actual capital stock to be equal to the desired capital
stock in every period. This assumption is untenable because of the costs of adjusting the
capital stock and the unavoidable lags in the installation of capital. Third, since future
output may not be known with certainty, it means that investment must be based on
expectations of next period's desired level but these expectations may turn out to be
inaccurate. Despite the limitations of the accelerator model, it actually explains much of
the variation in investment and in most cases outperforms other more complicated models
such as the real-business-cycle model and the imperfect information model in explaining
and predicting investment behavior (Clark, 1979).
In response to the limitations and restrictive nature of the accelerator theory of
investment, Chenery (1952) and Koyck (1954) formulated the flexible accelerator model.
The flexible accelerator model focused on the time structure of the investment process
and the determination of the desired level of capital by long-run considerations.
Accordingly, changes in the desired capital are transformed into actual expenditure by a
16

geometrically distributed lag structure. In this model capital is adjusted toward its desired
level by a constant proportion of the difference between desired and actual capital.
Within the framework provided by the flexible accelerator model, output, internal funds
and the cost of external finance are main the determinants of investment (Jorgenson,
1971). However, in the accelerator model of Clark (1917), expectations, profitability, and
capital costs play no role in investment behavior and given an incremental capital-output
ratio, it is easy to compute the investment requirements associated with a given target for
output growth.
The neoclassical approach to investment was formulated by Jorgensen (1967) and
Hall and Jorgensen (1971) to overcome the restrictive assumptions of the accelerator
theory. The neoclassical approach states that the desired capital stock depends on the
level of output and the user cost of capital which in turn is a function of price of capital,
the real interest rate and the depreciation rate. The model also recognizes lags in
decision-making and delivery which in turn result in a gap between actual and the desired
capital stocks. The investment function within this model is thus an equation for the
change in the capital stock. However, the assumptions of perfect competition,
exogenously given output, static expectations about future prices, output and interest
rates are implausible in the sense that investment is a future facing process that looks
forward into the future. In addition, the lags in the investment decision-making and
delivery processes are introduced in the model in an ad hoc manner (Serven and
Solimano, 1992).
17

Adjustment cost models of Investment
Early theoretical formulations of the adjustment cost models of investment were
undertaken by Eisner and Strotz (1963) and Lucas (1967). Essentially, the model posits
that actual and desired levels of capital are not always equal because firms need a
reasonable amount of time to estimate and install the desired level of capital. Investment
proposals are always accompanied by feasibility studies, marketing analyses and
financial negotiations. Investment decisions take time to implement because they involve
considerable effort to build new factories, install new machines, and to hire and train
employees. In addition, the overall cost of investment tends to rise if the firm rushes to
complete the investment project quickly. Therefore, the objective of profit maximization
tends to make firms make only gradual changes in the levels of their capital stock. The
adjustment cost model adds a partial adjustment mechanism into the accelerator model,
allowing a gradual adjustment of capital to the desired capital stock. The coefficient of
partial adjustment ranges in value from 0 to 1, and if the coefficient is equal to 1, then we
have the accelerator model. If it is less than 1, it implies that the actual capital adjusts
only gradually from the actual to the desired capital stock. Generally, a lower value of the
coefficient of adjustment indicates a lower speed of adjustment. However, according to
Clark (1979), the adjustment cost model is an incomplete model because it is very
difficult to determine the rate at which the actual capital approaches the desired or
optimal capital stock.
Tobin's Q Theory
A related investment theory based on the adjustment cost model is the Tobin q
Theory. The q theory, Tobin (1967), states that the rate of speed at which the capital
18

stock adjusts to its desired level is related to the ratio of the value of capital to its
replacement cost. The variable q is defined as the stock market value of the firm divided
by the replacement cost of the capital of the firm. In this way the stock market value of
the firm helps to estimate the difference between the actual capital and the desired level
of capital. The replacement cost of the capital of the firm is the cost that one must bear to
purchase the plant and equipment of the firm in the open market. Specifically, when q is
greater than 1, it implies that the desired level of capital is greater than the actual capital
stock, so investment should be high. Conversely, if q is less than 1, the desired capital is
less than the actual capital therefore investment must be low. The stock market therefore
makes available information about the investment incentives facing firms. The q theory
of investment is very easy to test in developed economies because of the existence of
efficient capital and financial markets but difficult to test in developing countries due to
the nonexistence of capital markets and the suppression of financial markets.
Credit Rationing
Investment theories based on credit- rationing imply that firms cannot easily
borrow at market interest rate to finance investment projects. If firms are credit- rationed,
the rate of investment will not depend only on the market interest rate and the
profitability of investment, but also on the availability of investment funds, which in turn
is determined by the cash flow of the firm that wants to undertake the investment. When
government monetary authorities place interest rate ceilings on lending institutions below
the market equilibrium interest rate, the available credit is rationed among firms that want
to undertake investment. McKinnon (1973) documents the serious economic
inefficiencies that may emanate from credit- rationing caused by governments setting
19
interests rates. The problem associated with the phenomenon of credit- rationing is more
acute in developing countries especially in Sub- Saharan Africa during the period of state
control and command of the national economy. Credit- rationing may also arise when
lenders are unable to assess the risk of lending to a borrower. The important implication
of credit- rationing is that it constraints firms to finance investment projects, and thus,
constraining the actual capital stock to adjust to its optimal level as determined by market
interest rates and the marginal productivity of capital. The theory of credit- rationing
together with the adjustment cost model explain the gradual movement of the capital
stock to its desired level. In addition to the formal theories and models of investment,
several hypotheses had been suggested in the literature to explain investment behavior in
developing countries.
Hypotheses of Investment Behavior in Developing Countries
First, McKinnon (1973), and Shaw (1973), hypothesized that changes in the
volume of bank credit are directly related to private investment undertakings in
developing countries. This is because financing through retained earnings and equity is
totally unavailable in developing countries, and therefore bank credits tend to be the most
important source of financing for private investment activities in developing countries
(World Bank, 1990). The positive impact of the availability of bank credits on private
investment in developing countries has been confirmed by studies undertaken by Blejer
and Khan (1984), Wai and Wong (1982) and Fry (1980).
Second, it has been suggested that public sector investment has an impact on
private investment although the exact effect is ambiguous. Public investment financed by
domestic borrowing is likely to reduce the amount of credit available for private
20

investment, and the obvious result is a crowding out effect on the private sector (Balassa,
1988; Feng, 2001). On the other hand, the public investment may enhance private
investment if public expenditure is directed towards the provision of transportation,
health, educational and irrigational infrastructure. In this case public and private
investments are complementary (Blejer and Khan, 1984; Greene and Villanueva, 1991;
Oshikoya, 1994).
Thirdly, it has been hypothesized that a real devaluation affects private
investment because, as an expenditure reducing and expenditure switching policy,
devaluation impacts both domestic demand and, supply and ultimately private
investment. The increase in the overall price level induced by devaluation reduces
domestic demand, and, as a result of the slump in economic activity firms are likely to
reduce investment spending (Khan and Knight, 1985). On the supply-side, since
devaluation increases the price of exports as measured in domestic currency, investment
in the export sector will increase while investment activity in the non-export sector will
be depressed. However, devaluation raises the domestic price of imports, including
capital and intermediate goods, and therefore devaluation may negatively affect private
investment as a result of an increase in the real cost of imported capital goods (Buffie,
1986).
Fourthly, the irreversible nature of investment has been stressed in the literature.
Pindyck (1991) argues that a major drawback of current investment models is that they
overlook the fact that investment expenditures are irreversible, and therefore may be
delayed. The irreversible nature of investment implies that investment spending
represents sunk and irrecoverable costs. The ability to delay the implementation of
21

investment projects affords the firm the opportunity to access more information about
prices, costs and other market factors before deploying its resources. The irreversibility of
investment means that investment spending by firms is highly sensitive to uncertainties
about future product prices, interest rates, and the cost and timing of investments in
general. For macroeconomic policy implications, Pindyck argues that stability and
credibility are much more important determinants of investment than tax incentives or
interest rates. Therefore policies that stabilize exchange rates and prices may effectively
promote private investment. Furthermore, it has been suggested that a large debt
overhang may inhibit private investment activities (Borenzstein, 1989; Corden, 1988;
Krugman, 1988). Higher debt service payments will squeeze funds available for
investment, and developing countries may face credit constraints in the international
capital markets where there are large debt service payments. Again, the geographical
location of a country is posited to impact on private investment. Countries located close
to the sea or navigable rivers benefit from reduced transportation costs for exports, and
imports. Apart from distance, political barriers could constitute insurmountable obstacles
to trade even if good relations with neighbors exist (Collier and Gunning, 1999). Finally,
it has been suggested that civil war may have a negative effect on the stock of physical
capital, investment and savings. Also, civil war may increase uncertainty, and this is
likely to reduce the inflow of foreign direct investment, and perhaps promote capital
flight (Gyimah-Brempong and Corley, 2005).
Foreign Direct Investment
Although the focus of this dissertation is on gross private domestic investment,
this section of the literature review singles out private foreign direct investment because
22

of its important contribution to the development of Sub-Saharan African economies. The
definition of foreign direct investment can differ depending upon the legal instrument
being used and whether it is viewed from the home or host country perspective. Capital
exporting countries favor a broader definition of foreign direct investment in order to
maintain management and control, while capital importing countries favor a narrower
definition so that they can retain autonomy over policies specific to the needs of their
nation. The World Trade Organization (WTO) and International Monetary Fund (IMF)
definitions of foreign direct investment favor management and control of the investment
by the home country. The World Trade Organization maintains that foreign direct
investment "occurs when an investor in one country (the home country) acquires an asset
in another country (the host country) with the intent to manage that asset. The
management dimension is what distinguishes foreign direct investment from portfolio
investment in foreign stocks, bonds, or other financial instruments" (1996: 6). The
International Monetary Fund defines foreign direct investment to as "investment that is
made to acquire a lasting interest in an enterprise operating in an economy other than that
of an investor, the investor's purpose being to have an effective choice in the
management of the enterprise" (1980: 408). The definition of foreign direct investment
thus shows that the locus of management and control are in the hands of the home
country. Host nations favor a narrower definition so that they can maintain their
sovereignty and limit their obligations in international agreements.
The Two-Gap model has been the theoretical model which illustrates the crucial
role of foreign direct investment in developing economies (Chenery and Strout, 1966;
McKinnon, 1964). An extension of the Harrod-Domar model of economic growth, the
23

model postulates that developing countries face a fixed import capacity because of the
complete inelasticity of export earnings. As a result incremental savings could not be
transformed into investment because of the difficulty of obtaining the complementary
imported inputs that are required for domestic investment. Stated differently, the model
purports to show that developing countries in general are constrained by independent
savings, and foreign exchange and therefore foreign capital inflows will be required as a
matter of necessity to overcome the foreign exchange constraint in order to achieve any
desired or warranted rate of growth for the economy. Foreign capital or investment has
been shown to be doubly productive according to the "Two- Gap Model" because not
only does it supplement domestic savings, but even more importantly, it allows the
foreign exchange bottleneck to be broken. However, Lai (1970), has shown that the
assumptions required to generate a foreign exchange constraint to growth independent of
the savings constraint are extremely unrealistic. Hence the "Two-Gap Model" with its
mechanistic projections of necessary foreign capital requirements, is likely to be
misleading. It is further argued that the massive debt burden facing most Sub-Saharan
African countries makes the attraction of long term capital flows critical to help augment
the total domestic savings required for high growth rate. The attainment of high economic
growth will ease the debt burden so that funds can be focused on social programs that
could help sustain development in the long term (Nyikuli, 1999; Trent, 2002).
The Two-Gap Model and the massive debt burden facing many Sub-Saharan
African economies suggest that foreign investment could play a positive role in the
development of these countries, but there is no consensus on the positive impact of
foreign investment on growth in the literature. In one instance, Walden and Rosenfeld,
24

1990; Chowdhury and Islam, 1993; Rodan, 1997; Gries, 2002; Borensztein et al., 1998
argue that foreign investment enhances economic growth through the provision of capital,
technical and marketing expertise. On the other hand Razin et al., 1999 contends that
foreign investment may have an adverse influence on employment, income distribution,
and national sovereignty and autonomy. It may also worsen the balance of payments
position if inputs require importation and profits eventually repatriated. The potential
negative effects of foreign investment led to nationalization of foreign firms in many
Sub-Saharan African countries and the adoption of inward-looking import substitution
policies during early post-independence period. There has been reversal of these policies
however, through the adoption of structural adjustment policies. Musila et al., 2006
disaggregated foreign investment into extractive, market seeking and export oriented
types and suggested that export oriented investment is not likely to cause any divergence
between private benefits to the investor and social benefits to the host nation. Extractive
and market seeking types of investment could result in high social costs such as the
exploitation of economic rents, pollution, and the worsening of income inequality
through the establishment of dualistic economic structures.
According to World Investment Report (2006), surging corporate profits
combined with commodity prices helped boost African FDI inflows in 2005 to a historic
record of $31 billion from $17 billion the previous year. The composition of FDI in total
capital formation also increased, to 19% in 2005. Despite this unprecedented
performance, Africa's share of global FDI remains at about 3%. It is interesting to note
that a large proportion of the 2005 inflows were concentrated in mining, especially oil
and gas, thus validating the argument that natural resource availability is a key player in
25

FDI attraction and destination. The report further shows that five countries: South Africa,
Egypt, Nigeria, Morocco and Sudan received about 66% of the region's inflows. Since
FDI in Africa is usually concentrated geographically and industrially, this pattern of
distribution in 2005 is not surprising. The regional distributions of FDI among Africa's
five sub-regions also showed significant variations. As shown in Figure 2, North Africa
obtained the lion's share in 2005 accounting for 42% of the total inflows to Africa,
followed by Southern Africa, which received 23% of African inflows. This sub-region
experienced the most impressive inflows in terms of growth and sectorial diversity, in
2005. Inflows rose to $7.1 billion from $1.5 billion in 2004, with investment taking place
particularly in banking, telecommunications and mining industries. This increase explains
the sub-regions second highest rankings from the lowest in 2004. West Africa and
Central Africa are the third largest recipients of African inflows accounting for 15% each.
As usual Nigeria received 70% of West Africa's inflow thus dominating the region. East
Africa attracted the least inflows to Africa, obtaining only 5% of the inflows to Africa.
The region consists of resource poor countries, and majority of which have recently
experienced political instability. Sub-Saharan Africa received just 58% of the total
inflows to Africa in 2005, which is quite small relative to its size and population. Figure 2
shows trends in foreign direst investment performance in Sub-Saharan Africa from 1993
to 2002.
26

FIGURE 2
Source: World Investment Report UNCTAD (2006)
According to Fig 2, the year 1993 recorded the lowest inflow; about 1% of GDP and
2001 witnessed the highest inflow, 4.5% though not quite impressive. The overall trend
indicates that foreign direct investment as a proportion of gross domestic investment is
very small as compared to Latin America and the Caribbean which recorded an average
of 9.3% over the same period. Sub-Saharan African countries need to attract more FDI in
order to close the savings gap and break the foreign exchange constraint as suggested by
the two-gap model. FDI inflows can help African economies to achieve and sustain an
average GDP growth rate of 7% suggested by the Economic Commission for Africa as
sufficient to help reduce the percentage of people in poverty by half by 2015. Empirical
studies have shown that market size, labor costs, openness of the economy, taxes and
tariffs, political instability, corruption, poor infrastructure and inflation are the key
determinants of direct investment (Morriset, 2001; Asiedu, 2002; Reinhart and Rogoff,
2002). Thus policies and strategies that significantly increase market size, enhances labor
skill acquisition, minimizes political instability, reduces corruption among public
27

officials to the barest minimum, improves infrastructure and, increases macroeconomic
stability would at least improve the attractiveness of the investment climate in Sub-
Saharan Africa.
FIGURE 3
Foreign Direct Investment Performance in Sub-Sharan Africa from 1993 to 2004
5.00E+00
4.00E+00
3.00E+00
2.00E+00
1.00E+00
0.00E+00
1992 1994 1996 1998 2000 2002 2004 2006
-•— Foreign Direct Investment
SOURCE: World Development Indicators (2006)
Democracy and Investment performance
There are three schools of thought on the impact of democracy on private
investment; the compatibility school, the conflict school and the skeptics school
according to Feng (2003). The compatibility school argues that democracy enhances
private investment because a lack of government repression and the presence of freedom
may reduce capital flight resulting in an increase in private capital formation (Kormendi
and Meguire, 1985; Pastor and Hilt, 1993; Pastor and Sung, 1995; Helliwell, 1994). On
the other hand the conflict school contends that the authoritarian system of government
28

with a strong political base is more likely to attract private investment than democracy
especially in developing countries (Gerschenkron, 1992; O'Donnell, 1978; O'Donnell
and Schmitter, 1986; Root, 1996). The negative impact of democracy on capitalist
development according to Pastor and Sung (1995) was a major issue for classical
thinkers. Democracy is generally thought to be a disincentive to investment in two ways.
First, Huntington and Dominique (1975) suggest that democracy increases the national
propensity to consume thereby depleting the available resources for savings which is a
major determinant of investment expenditure. Przeworski and Limongi (1993) expressed
a similar sentiment that the channel through which democracy impedes economic growth
is the increased demand for immediate consumption, which reduces the availability of
capital for investment investment. Second, the median voter theorem suggests that
democracy allows the median voter to redistribute resources from the capital owner
towards the poor thus reducing work effort, savings, and investment It is generally
contended that democracy substitutes the "one dollar one vote" system of the market
place with "one man one vote" regime of the ballot box. Since the median voter is the one
that casts the deciding vote in the majoritarian system of governance is not likely an
owner of capital, the median voter will vote to redistribute wealth in favor of the poor.
Some economists also echo the concern that the extensive political rights the poor voter
enjoyed under democracy may create an avenue for capital expropriation (Dornbusch and
Edwards, 1991; Persson and Tabellini, 1990; Alesina and Rodrik, 1994). The
disconnection between the "person rights" and "property rights" explains the reason why
leading democracy such as Britain and the United States initially restricted the franchise
to property owners. However, Feng (2001) discounted this view and argues that
29

democratic system is generally established on a wider support base and involves
compromises which to some extent guarantee the efficiency and security of the political
process more than autocracy. Autocratic regimes generally pose a false semblance of
government stability but lack legitimacy which is a fundamental requirement for regime
stability. Besides, political adjustment under a democratic system of government
minimizes long-term radical political change while the prospect of a peaceful regime
change under autocracy is doubtful. Private investors caught between the two political
systems will prefer democracy because democracy institutionalizes the redistribution
system and reduces income inequality. Therefore democracy promotes a strong middle-
class and reduces the probability of the poor expropriating the assets of the rich (Feng,
2003; 2001; Pastor and Sung, 1995). Finally, the skeptics school also known as the
coalition thesis holds that political institutions have no effect on private investment but
rather domestic coalitions of bankers, government bureaucracies, and labor influence
private investment. Maxfield (1990), the main exemplar of this school, argues that the
institutional and organizational capacity of banks leads to particular economic policy
patterns that have an impact on the integration of financial markets. In the presence of a
strong connection between bankers and industry and the relationship between the banks
and the state is dictated by autonomous monetary authorities, the strong connection
between banks and industry is likely to result in economic policy pattern that favors free
capital mobility. Therefore when an economy experiences high inflation and high
taxation there is likely to be a capital flight and a resultant shortage of domestic industrial
capital. Using Argentina, Brazil and Mexico as examples, Maxfield rejects the view that
political-regime type has a fundamental impact on capital flight and domestic investment.
30

The coalition thesis may not apply to many Sub-Saharan African countries because the
key assumption of central bank autonomy is nonexistent.
Empirical Literature
It is very difficult to organize the empirical literature on the determinants of
private investment around major themes. However, the empirical literature can be
broadly classified into two. First those that address only macroeconomic variables and
policies and second, those that focus on the influence of the political environment on
private investment activities in addition to macroeconomic issues. With respect to space
or place, some of the studies focus on developing countries in general or regions for
instance Africa or Latin America and country specific studies. The commonality among
these studies is the agreement on the measurement of the dependent variable; private
investment as the ratio of gross private investment to GDP. The independent variables
differ among the studies depending upon the model being estimated or the hypothesis
being tested. The independent variables identified in the literature include the growth rate
of GDP, per capita income, real exchange rate, credit to the private sector, public
investment as a percentage of GDP, inflation rate, real interest rate, the debt burden
measured as the ratio of external debt service payments to the export of goods and
services and the ratio of the country's stock of external debt to its nominal GDP. The
political variables are political freedom computed from political rights and civil liberties
scores (used to operationalize democracy), political instability also constructed from the
standard deviation of political freedom and policy uncertainty measured by the standard
deviation of relative political extraction (Feng, 2001).
31

Wai and Wong (1982) explore the determinants of private investment based on a
modified version of the flexible accelerator theory of investment for five developing
countries using time series data from 1960 to 1974. The independent variables included
in the model are private sector output, change in bank credit to the private sector,
government investment, net capital inflow to the private sector and private capital stock
The results of the study show that government investment, change in bank credit to the
private sector and net capital inflow to the private sector are significant in explaining
private investment in these countries although the relative significance of these variables
differ across countries.
Blejer and Khan (1984) examine the influence of macroeconomic policies on
private investment for 24 developing countries using a least squares dummy variable
estimation technique (LSDV) over the period 1971 to 1979. The results of the study
indicate that change in credit to the private sector and change in output exert a significant
positive impact on private investment. However, the level of public investment shows a
positive relationship while the change in public investment exerts a negative impact.
Musalem (1989) estimates time series data for Mexico from 1960 to 1987 and
finds that private investment is positively related to public investment and real exchange
rate especially for new capital equipment but negatively related to real interest rate. The
results confirm the complementarity between private investment and public investment
and expansionary effect of devaluation on private investment.
Balassa (1988) estimates cross-sectional data for 21 developed and 94 developing
countries for the 1973-84 periods and finds that public and private investments are
negatively related, with an increase in public investment resulting in a decrease in private
32

investment. The estimates further indicate a negative correlation between the share of
public investment in total investment and the size of the incremental output-capital ratios,
which shows a lower efficiency of public capital as compared to private capital.
Serven and Solimano (1991) analyzed the effects of macroeconomic adjustment
and reform efforts on private investment in 29 developing countries using annual time
series data from 1970 to 1988. The econometric results show that the real growth of
output has a significant positive impact on private investment, and public investment has
a positive effect on private investment after one-year. In addition, the foreign debt-burden
measured as the ratio of external debt stock to gross domestic product exerts a strong and
negative impact on private investment.
Greene and Villanueva (1991) analyzed the effects of macroeconomic variables
on private investment for 23 developing countries from 1975 to 1987 using pooled time
series and cross section approach. The results of the study indicate that private investment
is positively related to real GDP growth, level of per capita GDP, and the rate of public
sector investment. The real interest rates, domestic inflation, the debt service ratio, and
the ratio of debt to GDP were found to be negatively related to private investment.
Faini et al (1990) analyzed the effects of real exchange rate, debt and foreign
exchange availability on private investment for 83 developing countries using annual data
from 1978 to 1988. The results of the study indicate that the debt burden and real
exchange rate have a negative impact on private investment while the availability of
foreign exchange enhances investment. A further implication of the results is that real
exchange rate appreciation has a promotional impact on the private investment while
exchange rate depreciation has a negative impact on private investment.
33
Oshikoya (1994) focuses on the determinants of private investment in Africa
using data on eight African countries from 1970 to 1988 on combined, and separate
pooled data for middle, and low income countries. The study implies that increases in real
output (GDP) have a positive impact on private investment for both group of countries
although at different significant levels. Public investment appears to be positively related
to private investment for both groups significantly. This result fails to reject the
hypothesis that public investment crowds out the private sector. The impacts of real
exchange rates, domestic inflation rates and change in terms of trade on private
investment behavior differ between the middle and low income countries in terms of
magnitude and levels of significance. The real exchange rate has a positive effect on
investment in middle income countries, but negative, small and insignificant for low
income countries. Inflation rates have a negative and significant impact on investment for
low income countries but a positive effect for middle income countries. Changes in the
terms of trade are weak because of the insignificant negative coefficients. Credit
availability, debt service ratio and lagged private investment have similar effects on
private investment in both country groupings. The large or higher significant coefficient
of the lagged dependent variables suggest that there is a strong inertia in private
investment in both country groups. The standardized coefficients however suggest that
the lagged debt service ratio, domestic inflation, public investments and the real exchange
rate had the most impact on private investment in middle income countries. Credit to the
private sector, the domestic inflation rate, the GDP growth rate and the debt-service ratio
had the largest impact on private investment rates in low-income countries.
34

Pastor and Sung (1995) examine the influence of democracy , political and
operations risk2 ,and worker share of income measured as employee earnings as
percentage of value added in manufacturing on private investment for 15 developing
countries from 1973 to 1986. Following Blejer and Khan (1984) and Greene and
Villanueva (1991), the expected growth rate of GDP, change in credit to the private
sector, growth rate of public sector investment, inflation rate, coefficient of variation of
the inflation rate, debt to GDP ratio, and per capita income are introduced into the
investment model as control variables, and country specific dummies are added to
capture inter-country differences. The model is estimated using an ordinary least squares-
dummy variable (OLS-DV) approach and, the random effects (RE) regression technique.
For the OLS-DV results, all the economic control variables are significant except per
capita income and change in credit to the private sector, which are weakly significant. In
addition the pro-democracy hypothesis of the study is confirmed. The random effects
estimation of the full model further reinforced the finding that democracy can indeed
exert a positive influence on private investment decision making. However, the findings
of the study should be accepted with caution because only one country from Africa
(Kenya) was included in the sample, an important control variable, the real exchange rate,
was also excluded. Finally, there were many missing observations some of which were
estimated. The consequence was a reduction in the sample size from 30 to 15. Feng
(2001) on the other hand examined the impact of political freedom, political instability
and policy uncertainty on private investment for forty developing countries using average
1 Pastor and Sung (1995) employed Gurr (1990) measure of democracy which is a composite index derived by adding together measures of the competitiveness of political participation, competitiveness of executive recruitment, openness of executive recruitment and constraints on the executive among others. 2 The risk measure is a composite of quantitative assessments of political, economic and policy characteristics developed by the Business Environment Risk Intelligence, S.A. (BERI).
35

data from 1978 to 1988. The study used expected growth rate, inflation, variability of
inflation, primarily school enrollments, and public investment as economic control
variables. The results of the study indicated that political freedom promotes private
investment, while political instability and policy uncertainty adversely affect private
investment. The signs of all economic control variables are consistent with a priori
expectations except for public investment, which indicates a negative relationship with
private investment, thus supporting the crowding out hypothesis.
Summary of empirical literature
The review of the empirical literature has shown first that, the growth of real
output exerts a positive impact on private investment. This positive effect has been
confirmed by studies undertaken by Green and Villanueva (1991), Serven and Solimano
(1991), Oshikoya (1994), Wai and Wong (1982) and Blejer and Khan (1984). Second, the
effect of public investment on private investment had been found to be of mixed
consistency with the theoretical literature. Wai and Wong (1982), Musalem (1989),
Greene and Villanueva (1991), Blejer and Khan (1984) find a positive impact of public
investment on private investment while Balassa (1988) and Feng (2001), find a negative
effect of public investment on private investment. Third, credit availability exerts a
positive impact on private investment. This has been confirmed by studies undertaken by
Fry (1981), Blejer and Khan (1994), Wai and Wong (1982) and Oshikoya (1994).
However, Pastor and Sung (1995) find no significance effect. Fourth, the real interest
rate has been identified as a factor affecting private investment, and Greene and
Villanueva (1991) and Musalem (1989) found a negative impact of real interest rate on
private investment. Fifth, inflation rate as a measure of uncertainty has been found to
36

exert a negative impact on private investment. This negative impact has been confirmed
by Greene and Villanueva (1991), but Oshikoya (1994) finds a positive effect of inflation
for a group of middle income African countries. The level of per capita income has been
found to be a factor affecting private investment positively. Greene and Villanueva
(1991) find a positive effect while Pastor and Sung (1995) finds only a weakly significant
positive effect. Furthermore, according to the empirical literature, the real exchange rate
is a factor affecting private investment. Musalem (1988) finds a positive impact of the
real exchange rate on new capital equipment for Mexico, while Faini et al (1990) find a
negative effect for a group of 83 developing countries. Oshikoya (1994) finds a positive
effect of the real exchange rates for middle income countries, but a negative and
insignificant effect for low income countries in Africa. Again the external debt burden
has been found as a determinant of private investment in the empirical literature. Serven
and Solimano (1991) find a negative impact of the external debt burden on private
investment for 29 developing countries while Greene and Villanueva (1991), also find a
similar effect for 23 developed countries. Oshikoya (1994) finds a similar effect for eight
African countries. In addition, the terms of trade as another indicator of uncertainty
affects private investment. Oshikoya (1994) finds a negative but insignificant effect for
the terms of trade on private investment for a group of middle income and low income
countries in Africa. Finally, for a group of 15 developing countries and 42 developing
and OECD countries, Pastor and Sung (1995) and Feng (2001) confirmed the positive
impact of democracy on private investment, albeit using different measures of
democracy.
37

The review of the literature has shown that private investment is a complex
phenomenon to explain. This assertion is supported by the ambiguity in the theoretical
literature especially with respect to the impact of real exchange rate, public investment
and democracy on private investment. For instance while one strand of the literature
suggests that public sector investment may impact negatively on private investment
because of the crowding out effect, another strand implies a positive effect of public
investment on private investment Furthermore, empirical results are mixed on the impact
of public investment and real exchange rate on private investment. According to Serven
and Solimano (1991) a significant drawback of most of the studies that find mixed results
with respect to the impact of public investment on private is that they failed to consider
the separate effects of infrastructure projects such as roads, bridges, hydroelectric dams,
and irrigation on private investment. Also, exchange rates are overvalued in most
developing countries with its distortionary effects on domestic price of inputs and output,
thereby making it very difficult to capture the true effects of the exchange rate on private
investment. Again the choice of explanatory variables is not consistent across studies but
largely depends on the theoretical and hypothetical assumptions of the study in question.
Besides, the literature has demonstrated that there is dearth of studies on Sub-Saharan
Africa except for Oshikoya (1994). The study of private investment performance in Sub-
Saharan Africa warrants more examination because the region lags behind other regions
such as Latin America and Asia in private investment performance (Bouton and
Sumlinski, 1997). Furthermore, Serven and Solimano (1993: 25) suggest that the
relationship between political regime and private investment is one of the issues for
further research, therefore political reforms such as democratization, political,
38

administrative, and fiscal decentralization and civil service reorganization deserve
empirical analysis. However, no empirical work has been undertaken to examine the
impact of these reforms, especially the effect of democratization on private investment in
Sub-Saharan Africa. This study attempts to fill some of the gaps in the literature by
examining the macroeconomic determinants of private investment including the influence
of democracy, focusing on Sub-Saharan Africa from 1993 to 2002 in response to Serven
and Solimano (1993). In the next chapter the economic model of private investment is
described and specified and data sources and the limitations of construction of some of
the variables are stated.
39

CHAPTER III
METHODOLOGY
Research Design
The study uses panel data to examine the influence of macroeconomic and
political variables on private investment from 1993 to 2002. The panel design is preferred
over cross-section and time series designs because panel data controls for heterogeneity
among individual countries. Cross-section and time series studies do not control for
heterogeneity thus leading to biased results. Second, panel design provides more
informative data, more variability, less collinearity among variables, and more degrees of
freedom and efficiency while time series and cross-section data are afflicted by
collinearity. Third, panel data are better able to study the dynamics of adjustment while
cross-section distributions that appear to be relatively stable mask a multitude of changes.
Panel data are useful for studying the duration of economic phenomena if the panels are
long enough. Fourth, panel data identify and measure effects that are simply not
detectable in pure cross-section or pure time series. Finally, panel data allows data to be
collected on individual countries over time thus reducing the biases resulting from
aggregation. However, the use of panel data is not without problems. An obvious
problem is that it involves annual data covering a short span of time for each country.
Increasing the time span will lead to higher cost, an upsurge in attrition rates and
increases the computational difficulty for limited dependent variable panel data models
(Green, 2000; Baltagi, 1995).
40

Economic Model of Investment
The neoclassical investment theory formulated by Jorgensen (1967) and Hall and
Jorgensen (1973) despite the limitations of its applicability to developing countries has
been the starting point for early econometric studies of private investment behavior in
developing countries (Wai and Wong, 1982; Blejer and Khan, 1984; Greene and
Villanueva, 1991). The neoclassical economic theory of investment suggests that private
investment rate is a negative function of real interest rate as a measure of user cost of
capital and a positive function of the growth of real output (GDP) per capita. However,
the relationship between private investment and growth of real output can readily be
obtained from the flexible accelerator model where there is a fixed relationship between
the desired stock of capital and the level of real output. Within the context of developing
countries, the neoclassical model implies that the rate of public investment is a factor
affecting private investment even though the exact relationship is ambiguous (Blejer and
Khan, 1984). In addition to the variables derived from the neoclassical investment theory,
McKinnon (1973) and Shaw (1973) hypothesized that in less developed countries private
investment is a positive function of accumulation of real money balances due to limited
access to credit and equity markets. Therefore one expects a positive relationship
between private investment and real interest rate contrary to what the neoclassical model
suggests.
41

Model Specification
Based on neoclassical investment theory and other hypotheses discussed in the
literature and following Wai and Wong (1982), Blejer and Khan (1984), Greene and
Villanueva (1991), Oshikoya (1994) and Feng ( 2001), the private investment function is
generally specified as follows:
PIGDpu =fi0+fi1RGDPtt+fi2PCAPll + p,PUIGDPit + J34CCPS„ + p5RIRtl + p6PCCPIit + fi7TOTu +
PJRERit + fi9EDPEu + 0wLPIGDPh + pnPORITlt + puCILIBit + pnSEADUM + puWDUM + fiu
The dependent variable is PI GDP, measured as the ratio of gross private investment to
gross domestic product (GDP). The macroeconomic variables in the model are the
growth rate of real GDP (RGDP), the per capita income (PCAP), the proportion of
public investment in gross domestic product (PUIGDP), the change in credit to the
private sector (CCPS), the real interest rate (RIR), the percentage change in the consumer
price index (PCCPI), the index of the terms of trade (TOT), the index of real effective
exchange rate (IRER), the ratio of external debt service payments to export of goods and
services (EDPE), and the lagged ratio of private investment in gross domestic product.
The political variables are political rights (PORIT), and civil liberties (CILIB). The
control variables are availability and presence of seaport (SEADUM) and war (WDUM)
respectively. The random error term is ju with all the classical assumptions, i, country, t,
time and the/fc are parameters or coefficients to be estimated. Various versions of the
general model are estimated and the results presented in Chapter Four.
42

Data
The study analyzes the effects of macroeconomic and political variables on
private investment in Sub-Saharan African countries using panel data from 1993 to 2002.
Data on private investment, the dependent variable measured as a percentage of Gross
Domestic Product (GDP) is readily available in the 2004 Edition of the African
Development Indicators extracted from the World Bank Africa Database. RGDP is the
growth rate of real GDP suggested by both neoclassical and accelerator theory to exert a
positive impact on investment. Gross Domestic Product measures the total output of all
final goods and services produced by residents and nonresidents. Growth rate of gross
domestic product provides annual growth rates calculated from GDP at constant 1995
prices. PCAP is real gross product per capita based on the hypothesis that high income
countries should save more and invest more rapidly than low income countries. Per capita
GDP is obtained by dividing the final value of all goods and services produced in a
country by a country's population. It also controls for country size in terms of population
and level of economic development. PUIGDP is the ratio of public sector investment to
GDP as a measure of crowding out or crowding in and its exact impact on private
investment may be negative or positive depending on the quality of investment.
Change in credit to the private sector (CCPS) is an increase or decrease in credit
to the private sector in millions of U.S. dollar. In consonance with McKinnon-Shaw
hypothesis, its expected sign should be positive. RIR is the real interest rate as a measure
of user cost of capital suggested by the neoclassical investment theory and in accordance
with the neoclassical model this should exert a negative influence on private investment.
However, in this study because of multiplicity of interest rates in Sub-Saharan Africa and
43

the existence of large financial repression real, the real discount rate is employed. The
real discount rate in each year is the nominal discount rate deflated by the annual change
in inflation as reflected by the consumer price index (CPI). The two variables capture the
effects of monetary policy on private investment
The inflation rate (PCCCPI) is the annual rate of increase in the consumer price
index. The CPI is the weighted average price of goods and services in the consumption
basket selected according consumption patterns in the base year. High rates of inflation
indicate macroeconomic instability which creates uncertainty in the investment climate
and thus, discouraging private investment. TOT is the index of the terms of trade
calculated as the ratio of a country's export unit values or prices to its import unit values
or prices and it captures the impact of external shock on private investment. Unfavorable
movements in the terms of trade will increase the cost of imports in terms of exports and
ultimately the worsening of the current account deficits thus inducing macroeconomic
instability which may negatively affect private investment. According to the expectation
of the irreversibility theory of investment an increase in the terms of trade should exert a
positive influence on private investment because adverse movements in the terms of trade
create uncertainty in the minds of private investors which increases the rewards for
waiting or delaying investment.
The index of real effective exchange rate (IRER) is a measure of real
depreciation or devaluation and it is a combined measure of real exchange rate and
effective exchange rate. The real exchange rate is the nominal exchange rate adjusted for
relative prices between the countries under consideration while the effective exchange
rate captures the movement of the exchange rate against a weighted basket of foreign
44

currencies. A real devaluation or depreciation increases the level of foreign prices
measured in domestic currency and this results in the rise in the price of traded goods
relative to non-traded goods in the domestic country. Investment in traded goods will
increase as a result of devaluation whilst investment in non-traded goods will decrease.
However, if domestic factor prices rise less than proportionately to the domestic currency
price of final goods, devaluation or depreciation should have a stimulative effect on
private investment. A decrease in the index indicates real depreciation or devaluation
whilst a rise in the index shows real appreciation or revaluation. Oshikoya (1994) finds a
positive and significant impact of real exchange rate for middle income countries in
Africa but negative and insignificant effect of real exchange rate on private investment
for low income African countries.
The ratio of external debt service payments to exports of goods and services or
the debt service ratio (EDPE) is the measure of the external debt burden. It has been
postulated that a heavy debt overhang decreases the incentive to invest as private
investors construe it as a higher expected tax rate on future income and profits. Greene
and Villanueva, 1991 and Oshikoya, 1994 find a negative and significant effect of large
external debt on private investment. LRPIGDP is the lagged ratio of private sector
investment to GDP (lagged dependent variable) as a test for inertia in private investment.
Democracy is measured as political rights (PORIT) and civil liberties (CILIB)
scores. They are computed by the Freedom House. Political rights are ranked from 1 to 7;
1 representing the highest degree of freedom and 7 representing the lowest degree of
freedom. The computation is based on national elections being held freely, fairly, and
competitively in democratic countries, and opposition parties play an important role in
45

checks and balances. The civil liberties score also ranked from 1 to 7; 1 representing the
highest degree of liberties and 7 representing the lowest degree of liberties. It is based on
freedom of association, assembly, demonstration, speech, and religion, free and
independent media and court system and the freedom to do businesses on an equitable
basis without excessive government corruption, and freedom to organize unions and other
private groups (Feng, 2001: 277-278; 2003: 44-48). Because both the political rights and
civil liberties scores are measured in reverse, a negative relationship is expected between
these variables and private investment. Feng (2001) combined these variables to construct
political freedom but this dissertation deviates sharply from Feng's empirical work and
rather follows Ghura and Hadjimichael (1996) by testing the individual effects of these
variables on private investment. Pastor and Sung (1995) and Feng (2001) find a
significant and positive impact of democracy on private investment performance in
developing countries albeit using different measures of democracy. SEADUM is a
dummy variable to capture the effects of availability and presence of seaport on private
investment and it adopts a value of zero for landlocked countries and a unit value for
countries located along the coast. WDUM is also a dummy variable meant to capture the
effect of wars generally on private investment in Sub-Saharan Africa and a country that
experiences some form of armed conflict on its territory or with its neighbor from 1993 to
2002 receives a unit value while a country that experiences no armed conflict from 1993
to 2002 obtains zero. The macroeconomic variables, the percentage change in real GDP,
the ratio of public-sector investment to GDP, the change in credit to the private sector,
the percentage change in the consumer price index, the index of the terms of trade, the
index of real exchange rate, and the ratio of external debt service payments to export of
46

goods and services are extracted from the World Bank Africa Development Indicators
Database 2004 and 2006 CD-ROM version and International Finance Statistics
published by the International Monetary Fund.
Political rights and civil liberties scores, the only two political measures included in the
model are available in the Freedom House database various issues in time series. The
variables, symbols, and sources of data are summarized in Table 1.
47

Table 1 Variables, Symbols and Sources of Data Collection
Variable
Ratio of private investment in GDP
Growth rate of real GDP
Per capita income
Public Investment in GDP
Change in credit to the Private sector
Real interest rate
Percentage change in the Consumer price index
Index the terms of trade
Index of real effective Exchange rate
Symbol
PIGDP
RGDP
PCAP
PUIGDP
CCPS
RIR
PCCPI
TOT
IRER
Source of Data
World Bank African Development Indicators (ADI) 2004
African Development Indicators
African Development Indicators
African Development Indicators
ADI (2004) and IFS, IMF 2004
ADI (2004) and WDI CD-Rom 2006
WDI (2006) CD-ROM VERSION
ADI (2004)
ADI (2004)
External debt service payment to export of goods and services
Private investment in real GDP lagged one year
Political rights
Civil liberties
Seaport
War
EDPE WDI (2006) CD-ROM VERSION
LPIGDP ADI (2004)
PORIT Freedom House, 2003
CILIB Freedom House, 2003
SEADUM
WDUM
48

Data Description
The analysis of the data starts with the computation of the mean, the range and the
standard deviation, (summary statistics) and the association among the variables. Tables
2 and 3 present the summary statistics and the correlation matrix respectively. The
summary statistics show that the ratio of private investment to GDP, the dependent
variable averaged 13.3% but ranges from .4% to 112% with a standard deviation of 5.2%
from 1993 to 2002. The highest value of 112% was recorded in Equatorial Guinea in
1996 mainly due to investment in the oil and gas industry. The mean of the growth rate of
real GDP is 3.6% and varies from a low of -50.2% to a high of 71.2% with a standard
deviation of 7.4%. Rwanda experienced the lowest negative growth rate in 1994 probably
due to the outbreak of the civil war, while Equatorial Guinea recorded the highest growth
rate in 1997 as a result of unprecedented growth in the oil and natural gas sectors. The
average per capita income is $836.9 and ranges from $60 to $7330 with a standard
deviation of $1342. Seychelles recorded the highest per capita income in 1997, while
Democratic Republic of the Congo registered the lowest per capita income in 1997.
Public investment activity in gross domestic product according to the summary statistics
varies among Sub-Saharan African countries. Its annual average is 7.4% and ranges from
-7.8% to 33.1% with standard deviation of 5.2%. The change in credit to the private
sector shows a positive average of $221.lm, but ranges from -$83.00m to $22,432m with
standard deviation of $1477.lm. The real interest rate shows a positive mean of 1.79%
over the study period but varies widely from -131% to 91% with a standard deviation of
19.51%. The percentage change in the consumer price index shows a wide variation in
Sub-Saharan Africa from 1993 to 2002. Its mean is 100.63% and ranges from -9.62% in
49

Lesotho in 2001 to 23,773.13 in the Democratic Republic of the Congo in 1994 reflecting
the economic mismanagement of the Mobutu regime with a standard deviation of
1181.48. With an average value of 44.1, the terms of trade varies from 44.1 to 1242.0
with a standard deviation of 59.87. The index of real effective exchange rate has a mean
of 282.88 with a standard deviation of 3770.9. The debt-service ratio indicates that on
average Sub-Saharan African countries devote 17.14% of their export earnings to service
their external debts. However, this figure could be as high as 104.55% and as low as
4.5% in some cases. Political rights and civil liberties scores show an average
performance of 4.54 and 4.44 respectively. These imply that on average Sub-Saharan
African countries are classified as partly free. Seaport and war dummy variables are 0.65
and 0.21 on the average respectively. According to Table 3, there is a positive association
among private investment, public investment, and credit to the private sector, real
effective exchange rate, per capita income, political rights, civil liberties, real growth of
gross domestic product, seaport, and terms of trade but a negative association with debt-
ratio, inflation, real discount rate, and war. The correlation matrix does not show any
serious multicollinearity among the independent variables except perhaps between credit
availability and inflation (0.7) and between political rights and civil liberties (0.87).
In a preliminary estimation, the study first employs ordinary least squares (OLS)
estimation technique to estimate the panel data from 1993 to 2002 for 48 Sub-Saharan
African countries in order to examine the influence of the various independent variables
on private investment. Ordinary least squares estimation technique is justified on the
grounds of the Gauss-Markov Theorem. According to this theorem, in the class of all
estimators ordinary least squares yield the best linear unbiased estimators (Pindyck and
50

Rubinfield, 1991). Then, fixed and random effects estimation techniques are utilized to
capture country and time specific effects on the estimated coefficients as panel data lends
itself easily to estimate these two models. The fixed effects approach takes the intercept
term to be a group specific constant term in the regression model and that differences
across units can be captured in the constant term. The random effects approach on the
other hand specifies that the intercept term is a group specific disturbance similar to the
error term (Greene, 2002). However, if the intercept term is assumed to be the same
across all units, then ordinary least squares should yield efficient and consistent
estimates. The ordinary least squares estimation technique assumes a constant variance of
the error term (homoscedasticity), independence or an uncorrelated error term (no serial
correlation), normality and stationarity. However, these assumptions are often times
violated in time series and cross-sectional data yielding unbiased and consistent but
inefficient estimates. These violations could render hypothesis tests unreliable and may
also result in spurious regression with respect to the non-stationarity problem (Pindyck
and Rubinfield, 1991; Gujarati, 1992; Greene, 2000).
The results of the panel least squares regressions, and both the fixed and the
random effects models, are presented in the next chapter. Because of missing
observations Djibouti, Eritrea, Liberia, Namibia and Somalia are not used, thus the final
results are based on 43 instead of 48 countries. Time trend and averages are computed to
obtain some estimates missing data, and Appendix 3 gives a detailed method of how the
estimated data were obtained or generated.
51

Table 2. Summary Statistics Variable Mean
Ratio of private 13.30 investment in GDP
Growth rate of real GDP 3.61
Per capita income 836.9
Public Investment in GDP 7.4
Change in credit to the 22.1 Private sector
Real interest rate 1.79
Percentage change in the 102.63 Consumer price index
Index of the terms of trade 100.53
Index of real effective 282.88 Exchange rate
External debt service 17.14 Payment to export of
goods and services
Political rights 4.54
Civil liberties 4.44
Seaport 0.65
War 0.211
Max Min Std. Dev.
112.4 0.400 5.212
71.2 -50.20 7.435
7330 60.00 1342
33.1 -7.8 5.2
22,432 -83.0 1477.1
91.5 -131.8 19.51
23773.13 -9.62 1181.48
1242.0 44.1 59.87
77622.0 0.00 3770.9
104.55 0.4514 15.15
7.0 1.0 1.92
7.0 2.0 1.37
1.0 0.0 0.48
1.0 0.0 0.41

Tab
le 3
Cor
rela
tion
Mat
rix
PIG
DP
PUIG
DP
CC
PS
CIL
1B
ED
PE
IRE
R
PCA
P PC
CPI
PO
RIT
R
GD
P R
IR
SEA
DU
M
TO
T
WD
UM
PIG
DP
PUIG
DP
CC
PS
CIL
IB
ED
PE
IRE
R
PCA
P
PCC
PI
POR
IT
RG
DP
RIR
1.00
0.01
64
0.00
5
0.05
7
-0.2
10
0.03
3
0.23
-0.0
17
0.04
43
0.29
3
-0.0
81
SEA
DU
M 0
.144
5
TO
T
WD
UM
0.11
5
-0.1
42
1.00
-0.1
72
-0.4
12
-0.0
89
-0.1
52
0.00
5
-0.0
75
-041
5
0.07
7
0.12
1
-0.0
35
0.00
2
-0.2
31
1.00
0.16
1
0.46
3
0.09
1
-0.0
72
0.76
8
0.16
8
-0.1
24
-0.4
98
0.09
9
0.00
2
0.26
7
1.00
0.25
8
0.06
3
-0.3
82
0.09
0
0.87
2
0.04
4
-0.1
63
-0.0
80
0.04
8
0.47
3
1.00
-0.0
41
-0.2
55
0.21
9
0.19
8
-0.1
66
-0.2
46
0.08
2
-0.0
248
0.40
65
1.00
-0.0
200
0.05
52
0.04
2
-0.1
86
-0.3
63
0.04
0
-0.0
21
0.10
0
1.00
-0.0
379
-0.3
10
0.04
0
0.04
3
0.19
9
0.01
6
-0.2
18
1.00
0.08
89
-0.0
58
-0.3
88
0.05
5
-0.0
01
0.14
8
1.00
0.02
23
-0.1
08
-0.0
52
0.02
9
0.43
1
1.00
0.01
0
0.02
49
0.02
76
-0.0
83
1.00
-0.1
30
-0.1
13
-0.2
16
1.00
0.13
4
-0.2
20
1.00
0.05
03
1.0
53

CHAPTER IV
RESULTS
The purpose of the empirical investigation is to estimate the effects of
macroeconomic and political factors on gross private investment from 1993 to 2002 using
panel least squares, fixed and random effects estimation techniques for 43 Sub-Saharan
Africa countries. Panel least squares results are first presented, followed by the fixed
effects results and finally the random effect results. Diagnostic results show evidence of
serial correlation in the data so the study employs the lagged dependent variables
approach (Pindyck and Rubinfield, 1991; Wooldridge, 2000). The lags of the dependent
variable are included in the various specifications of the model to correct for serial
correlation, and the results shows significant improvements in the Durbin Watson (DW)
statistics. The various specifications of the general investment model estimated include
the neoclassical-political rights model, neoclassical-civil liberties model, McKinnon-
Shaw-political rights model, McKinnon-Shaw-civil liberties model, macroeconomic-
political rights model, and macroeconomic-civil liberties model. In the neoclassical
models the emphasis is on the impact of the real interest rate on private investment. The
McKinnon- Shaw models posit credit availability to the private sector as (measured by
the change in the dollar amount of credit to the private sector) the main determinant of
private investment. The macroeconomic-political rights and civil liberties models
combine both the neoclassical and McKinnon-Shaw models to analyze the joint influence
of real interest rate and credit availability to the private sector on private investment. The
dependent variable in all the models is the amount of gross private investment in real
gross domestic product (PIGDP). The figures in parentheses are standard errors of the
54

parameter estimates; ***, **, and * indicate that the estimated value is significantly
different from zero in a one tail-test at the 1%, 5%, and 10% error levels, respectively.
Adjusted R-square and Durbin Watson statistics are reported at the bottom of each table.
Panel Least Squares
This section presents the results of the panel least squares regressions and the
separate effects of geography and wars in general are analyzed in each model. The panel
least squares estimation technique assumes differences among cross-sectional units can
be captured in a single constant term. Table 4 presents interesting results of the
neoclassical-political rights model. First, the coefficient of the growth rate of real
domestic product (RGDP) is positive and significant at the 5% and 1% levels when
regressed with sea (SEADUM) and war dummies (WDUM) respectively. The results
confirm association between output and investment identified in early econometric
studies. Second, per capita income (PCAP) which is a proxy for stage of economic
development and the propensity to save and invest is positive according to expectations
but its level of significance varies in the models. It is significant at the 11% level with the
sea dummy but significant at the 10% level when the effect of war is controlled for.
Third, public investment in gross domestic product (PUIGDP) is positively related to
private investment but insignificant. The results show that an increase in public
investment may complement private investment. Fourth, the real interest rate (RIR), the
variable of interest in the neoclassical investment function is negative according to
expectations. It is significant at the 10% level when analyzed with the influence of war
but insignificant at conventional levels (10.5%) in the seaport model. Fifth, the
55

Table 4 Neoclassical -Political rights model of private investment: Panel Least Squares Variables 1
RGDP
PCAP
PUIGDP
RIR
PCCPI
TOT
IRER
EDPE
LPIGDP
SEADUM
WDUM
PORIT
Adj R-sq
F-stat DW N
1.339487
(1.574089)
0.100926**
(0.046853)
0.000335
(0.000279)
0.000279
(0.073171)
-0.027790 (0.022181)
9.19E-05
(0.000295)
-0.005828 (0.005423)
0.000689 (0.001032)
-0.030753
(0.024647)
0.775453*** (0.033537)
0.602649
(0.725529)
0.326464** (0.203511) 0.665449
70.61772 2.227246 386
1.584404
(1.565349)
0.102458***
(0.046874)
0.000378*
(0.000274)
0.057239
(0.073212)
-0.028677*
(0.022246)
9.46E-05
(0.000295)
-0.005293 (0.005411)
0.000725
(0.001033)
-0.027394
(0.025709)
0.778268** (0.033758)
-0.014808 (0.987925)
0.320338** (0.216442) 0.664832
70.42514 2.229832 386
* Significant at the 10% level; ** Significant at the 5% level; *** Significant at the 1% level. Standard errors are in parentheses.
56

coefficient of the percentage change in the consumer price index (PCCPI) is positive
contrary to expectations but insignificant. Sixth, the terms of trade (TOT) is negatively
related to private investment contrary to expectations but, its coefficient is not
statistically significant. Seventh, the real and effective exchange rate (IRER) is positively
related to private investment but the relationship is not statistically significant. The
implication is that currency appreciation may have a promotional effect on private
investment while devaluation or depreciation exerts the opposite effect. Eighth, the
external debt burden (EDPE) is negatively related to private investment according to
expectations but the estimated coefficient is statistically significant at the 10% level only
in the sea dummy (SEADUM) model. Ninth, the lag of private investment is positive and
highly significant at the 1% level. Tenth, the availability of seaport (SEADUM) is
positive but insignificant. Furthermore, the war dummy (WDUM) carries the expected
negative sign but the estimated coefficient is insignificant. Finally, political rights
(PORIT) are negative and significant at the 5% and 10 % levels.
In the neoclassical-civil liberties model, democracy is proxied by civil liberties
and the individual effects of availability of seaport and war are analyzed in each model
and the results are summarized in Table 5. First, interestingly, the coefficients of the real
growth of gross domestic product (RGDP) remain significant at the 5% level. Second, the
per capita income (PCAP) is positive and significant at the 10% level. Third, public
investment in gross domestic product (PUIGDP) is positive but insignificant. Fourth, the
real interest rate (RIR) is negative and is only significant at 13% and 14% levels. Fifth,
the percentage change in the consumer price index (CCPS) is positive but insignificant.
57

Table 5 Neoclassical -Civil liberties model of private investment: Panel Least Squares Variables 3 4
RGDP
PCAP
PUIGDP
RIR
PCCPI
TOT
IRER
EDPE
LPIGDP
SEADUM
WDUM
CILIB
Adj R-sq
F-stat
DW
N
* Significant at the 10% level; ** Significant at the 5% level; *** Significant at the 1% level. Standard errors are in parentheses.
-0.130975 (1.907281)
0.099929**
(0.046746)
0.000439*
(0.000289)
0.078590
(0.073692)
-0.024860
(0.022188)
0.000109
(0.000294)
-0.006024 (0.005412)
0.000678
(0.001029)
-0.036054*
(0.024869)
0.769196*** (0.033774)
0.677733 (0.725545)
0.643276** (0.306333) 0.667072
71.12788
2.219720
386
0.098584 (1.927873)
0.101938**
(0.046768)
0.000486**
(0.000286)
0.074792
(0.073659)
-0.026267
(0.022216)
0.000113
(0.000295)
-0.005303 (0.005398)
0.000732
(0.001030)
-0.030184
(0.025676)
0.771183*** (0.034112)
-0.266403 (1.001243)
0.653070** (0.330184) 0.666359
70.90304
2.219000
386
58

Sixth, the index of the terms of trade (TOT) is negative and insignificant. Seventh, the
real and effective exchange rate (IRER) is positive but insignificant. Eighth, the
coefficient of the ratio of external debt repayment to export of goods and services
(EDPE) is negative and significant at the 10% level in sea dummy equation but
insignificant in the war dummy equation. Ninth, the availability of seaport (SEADUM)
exerts positive but insignificant effect on private investment. Tenth, the war dummy
(WDUM) is negative according to expectations but exerts an insignificant impact on
private investment. Finally, civil liberties scores exert a positive impact on private
investment and it is significant at the 5% levels.
A clear consensus has emerged in recent years that, in contrast to developed
countries one of the principal constraints on investment in developing countries is the
quantity rather the cost of financial resources. McKinnon (1973) and Shaw (1973) are the
proponents of this argument. Tables 6 and 7 present the empirical results of this model of
private investment in which the main variable of interest is changed from the real interest
rate to credit to the private sector. First, in the political rights, sea, and war model, the
growth rate of real gross domestic product capita income (RGDP) is positive and
significant at the 5% and 1% levels. Second, the per capita income (PCAP) is positive
and significant at the 10% level in the war equation. Third, public investment in gross
domestic product (PUIGDP) is positive but insignificant. Fourth, change in credit to the
private sector (CCPS), the variable of interest is positive according to expectations but
statistically insignificant. Fifth, interestingly, the percentage change in the consumer
price index (CCPS) is negative according to uncertainty and irreversibility of private
investment hypotheses. Sixth, the index of the terms of trade (TOT) is negative and
59

insignificant. Seventh, the index of real and effective exchange rate is positive and
insignificant. Eighth, the ratio of external debt repayments to export of goods and
services (EDPE) is negative and significant at the 10% level in the sea dummy equation.
Ninth, the coefficient of the lagged private investment (LPIGDP) is positive and
statistically significant at the 1% level. Tenth, the availability of seaport (SEADUM) is
positive but insignificant. Also, political rights (PORIT) are positive and significant at the
5% and 10% error levels. Furthermore, the effect of war (WDUM) in the political rights
model is positive but insignificant. Perhaps, a possible explanation is that the threat or
escalation of wars in general may cause a marginal increase in investment in inventories
and plant and machinery by private businesses in the military sector in Sub-Saharan
African countries and this may partially offset the fall of investment in other parts of the
economy.
The results of the civil liberties model as summarized in Table 7, first, indicate
that the real growth of real gross domestic product (RGDP) is significant at the 5% and
1% levels. Second, the per capita income (PCAP) is positive and significant at the 10%
and 5% levels. Third, interestingly, public investment in gross domestic product
(PUIGDP) is positive and its coefficient approaches the 10% significant level. Fourth, the
coefficient of change in credit to the private sector (CCPS) exerts a positive but
insignificant impact on private investment. Fifth, the percentage change in consumer
price index (PCCPS) retains its negative coefficient but insignificant. Fifth, the
coefficient of the index of the terms of trade is negative but insignificant. Sixth, the real
and effective exchange rate is positive but insignificant at the 5% level. Seventh, the debt
service ratio (EDPE) maintains its negative coefficient and significant at the 10% level.
60
Eighth, the lagged of private investment in gross domestic product (LPIGDP) is
significant at the 1% level. Ninth, the coefficients of seaport (SEADUM) and war dummy
(WDUM) are positive and negative respectively but insignificant at 5% levels. Finally,
civil liberties exert a negative impact on private investment and its coefficient is
significant at the 1% level.
The final version of the panel least squares regression in Table 8 is the
macroeconomic-political model where the impact of both real interest rate and credit to
the private sector on private investment are analyzed in addition to other macroeconomic
variables and democracy. Democracy is proxied by the political rights and civil liberties
scores, and the results are presented in Table 8.
First, the results of the macroeconomic-political model of private investment
suggest that the coefficient of the rate of growth of gross domestic product (RGDP) is
positive and statistically significant at the 5% level. Second, the per capita income
(PCAP) is positive and significant at the 5% level. Third, public investment in gross
domestic product (PUIGDP) is positive but insignificant. Fourth, real interest rate (RIR)
is negative but insignificant. Fifth, the change in credit to the private sector (CCPS) is
positive but insignificant. Sixth, the coefficient of percentage change in consumer price
index (PCCPI) is negative but insignificant. Seventh, the index of the terms of trade is
(TOT) negative but insignificant. Eighth, the real and effective exchange rate (IRER) is
positive but insignificant. Ninth, the ratio of external debt repayment to export of goods
and services (EDPE) is negative and significant at the 10% level. The lagged ratio of
private investment in gross domestic product (LPIGDP) is positive and significant at the
61

Table 6 McKinnon -political rights model of private investment: Panel Least Squares Variables 5 6
1.084606 (1.559614)
1.354721 (1.555948)
RGDP 0.102070** (0.047096)
0.103620** (0.047123)
PCAP 0.000327 (0.000280)
0.000373* (0.000276)
PUIGDP 0.067671 (0.074076)
0.065418 (0.074120)
CCPS 0.000323 (0.000398)
0.000328 (0.000399)
PCCPI -4.71 E-05 (0.000438)
-4.45E-05 (0.000438)
TOT -0.004884 (0.005395)
-0.004314 (0.005384)
IRER 0.001064 (0.000976)
0.001112 (0.000978)
EDPE -0.035697* (0.027865)
-0.032656 (0.028804)
LPIGDP 0.775178*** (0.033891)
0.778572*" (0.034097)
SEADUM 0.642124 (0.729035)
WDUM 0.051146 (0.991869)
PORIT 0.329397** (0.204664)
0.317271* (0.217939)
Adj R-sq 0.664604 0.663907
F-stat DW N
69.99388 2.212828 384
69.77858 2.216058 384
* Significant at the 10% level; ** Significant at the 5% level; *** Significant at the 1% level. Standard errors are in parentheses.
62
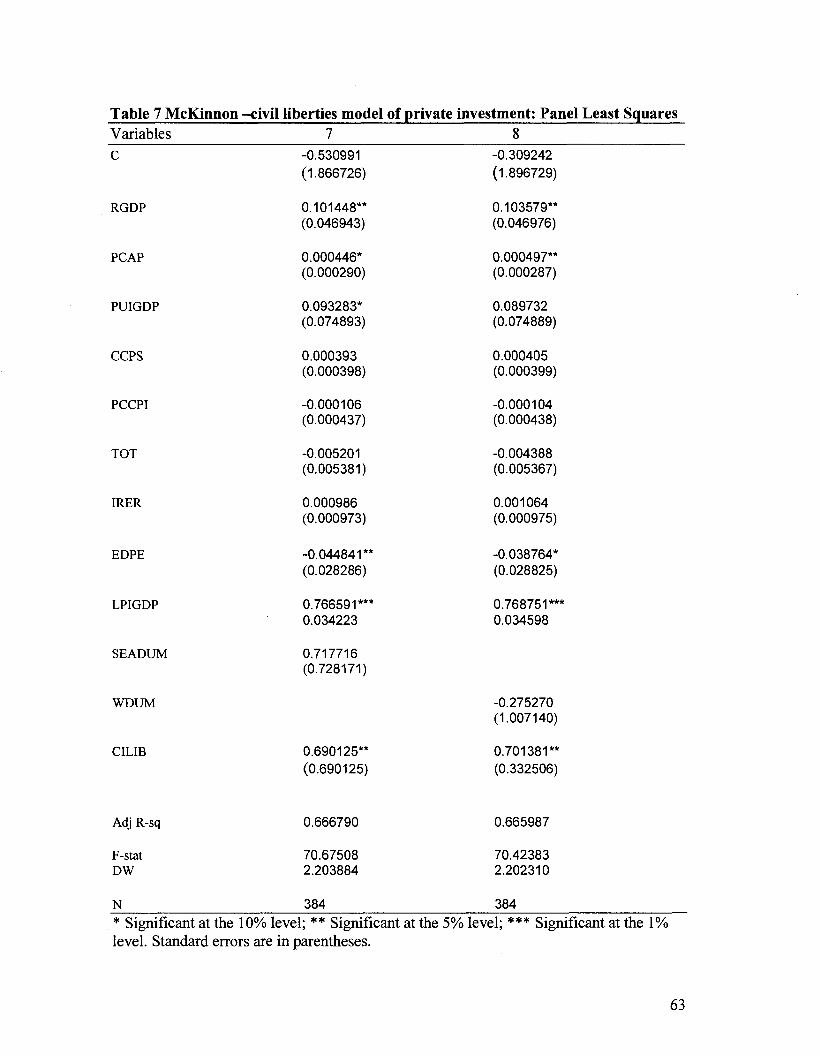
Table 7 McKinnon -civil liberties model of private investment: Panel Least Squares Variables 7 8
RGDP
PCAP
PUIGDP
CCPS
PCCPI
TOT
IRER
-0.530991 (1.866726)
0.101448** (0.046943)
0.000446* (0.000290)
0.093283* (0.074893)
0.000393 (0.000398)
-0.000106 (0.000437)
-0.005201 (0.005381)
0.000986 (0.000973)
-0.309242 (1.896729)
0.103579** (0.046976)
0.000497** (0.000287)
0.089732 (0.074889)
0.000405 (0.000399)
-0.000104 (0.000438)
-0.004388 (0.005367)
0.001064 (0.000975)
EDPE
LPIGDP
-0.044841** (0.028286)
0.766591*** 0.034223
-0.038764* (0.028825)
0.768751*** 0.034598
SEADUM 0.717716 (0.728171)
WDUM
CILIB 0.690125** (0.690125)
-0.275270 (1.007140)
0.701381** (0.332506)
Adj R-sq
F-stat DW
0.666790
70.67508 2.203884
0.665987
70.42383 2.202310
N 384 384 * Significant at the 10% level; ** Significant at the 5% level; *** Significant at the 1% level. Standard errors are in parentheses.
63

Table 8 Macroeconomic -political model of private investment: Panel Least Squares VARIABLES 10
RGDP
PCAP
PUIGDP
RIR
CCPS
PCCPI
TOT
IRER
EDPE
LPIGDP
PORIT
CILIB
Adj R-sq
F-stat
DW
N
1.641216 (1.555338)
0.103622** (0.047033)
0.000373* (0.000275)
0.062193 (0.074041)
-0.025479 (0.023151)
0.000202 0.000414
-6.25E-05 (0.000438)
-0.005177 (0.005410)
0.000732 (0.001034)
-0.033787* (0.027607)
0.776275*** (0.033734)
0.318589** (0.204342)
0.664995
70.11517
2.228862
384
0.193532 (1.876039)
0.103281** (0.046914)
0.000483** (0.000286)
0.084152 (0.075027)
-0.021318 (0.023195)
0.000289 0.000415
-0.000113 (0.000438)
-0.005254 (0.005397)
0.000728 (0.001032)
-0.041471* (0.027982)
0.769320** (0.034027)
0.639387** (0.307628)
0.666677
70.63955
2.217942
384
* Significant at the 10% level; ** Significant at the 5% level; *** Significant at the 1% level. Standard errors are in parentheses.
64

1% level. Finally, the coefficients of political rights and civil liberties are positive and
significant at the 5% level.
The results of the panel least squares indicated that the growth rate of real output,
per capita income, real interest rate, debt service ratio, past level of private investment in
gross domestic product, political rights and civil liberties are the significant factors
affecting private investment in Sub-Saharan Africa. The adjusted R-Squares which are
statistically significant at the 1% level indicate that on average the general investment
model explains about sixty-six percent (66%) of the variation in private investment.
The Fixed Effects Model
This section presents the results of the fixed effects model. The fixed effects
model assumes that differences across cross-sectional units are a country specific term
which can be captured in the constant term. The estimation is based on macroeconomic
and political rights-civil liberties model and to prevent the model from being near
singular, time invariant variables of sea port availability and war are deleted from the
model. Again, to minimize the problem of exogeneity between amount of private
investment in gross domestic product and the growth rate of real gross domestic product,
the effect of growth rate of real gross domestic product is lagged one year. Table 9 shows
interesting results of the effects of macroeconomic variables and democracy measured as
political rights and civil liberties scores on private investment.
The results of the fixed effects model suggest that first, the effect of growth rate
of real gross domestic product (RGDP) is significant at the 10% level in both models.
Second, surprisingly and contrary to expectations, per capita income (PCAP) is negative
and significant at the 5% level. Third, public investment in gross domestic product
65

(PUIGDP) is positive but insignificant at the 5% level. Fourth, real interest rate (RIR) is
positive but insignificant at the 5% level contrary to expectations of neoclassical
investment theory but consistent with McKinnon-Shaw hypothesis. McKinnon (1973)
and Shaw (1973) contended that in the presence of huge financial repression in
developing countries firms would not equate the marginal product of capital to real
interest rate hence one should expect a positive relationship between private investment
and real interest rate. Fifth, the change in credit to the private sector (CCPS) is positive
according to expectation but its coefficient is not significant at the 5% level. Sixth, the
percentage change in consumer price index (PCCPI) carries the expected negative sign
but its coefficient is not significant at the 5% level. Seventh, the index of the terms of
trade exerts a negative impact on private investment contrary to expectations and its
coefficient approximates the 10% significant level. Eighth, the index of real and effective
exchange rate (IRER) is positive but its coefficient is not significant at the 5% level.
Ninth, the external debt-service burden (EDPE) exerts negative but insignificant impact
on private investment. Tenth, the effect of private investment after one year is positive
and statistically significant at the 1% level indicating a strong inertia in private
investment. Finally, the impact of political rights (PORIT) and civil liberties (CILIB) are
negative according to expectations implying that improvement in political rights and civil
liberties has a promotional effect on private investment albeit not statistically significant
at the 5% level.
66
The Random Effects Model
The random effects estimation technique is based on the assumption that cross-
section sample countries are drawn randomly from a much larger population, and thus
there is no correlation between the explanatory variables and the error term. Table 10
presents the interesting results of the random effect estimation technique. First, the
random effects results suggest that the effect of the growth rate of real gross domestic
product (RGDP) on private investment is significant at the 1% level. Second, the level of
per capita income (PCAP) is positively related to private investment and the estimated
the coefficients are significant at the 10% and 5% levels respectively. Third, the effect of
public investment in gross domestic product (PUIGDP) is positive but insignificant at the
5% level. This result supports the complementarity between the private and public
investments hypothesis because public investment in roads, bridges and irrigation dams
enhances the productivity of private capital. Fourth, the coefficient of the real interest rate
(RIR) is negative according to expectations of the neoclassical investment theory but its
effect is not statistically significant at the 5% levels. Fifth, the change in credit to the
private sector (CCPS) is positive according to expectations but lacks statistical
significance at the 5% level. Sixth, the percentage change in the consumer price index
(PCCPI) is negatively related to private investment but insignificant at the 5% level.
Seventh, the terms of trade exert a negative but insignificant effect on private investment.
Eighth, the coefficient of real and effective exchange rate (IRER) is positive but
insignificant at the 5% level. Ninth, the ratio of external debt service repayment to the
export of goods and services (EDPE) is negative and significant at the 10% level.
67
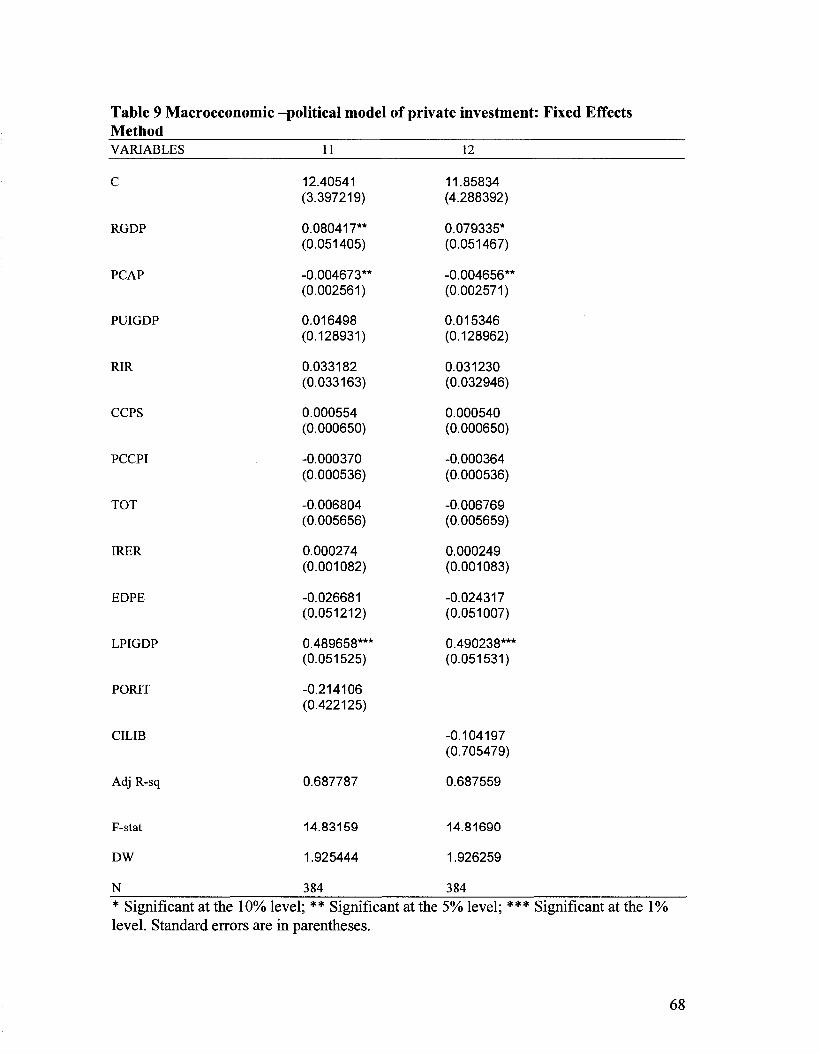
Table 9 Macroeconomic -political model of private investment: Fixed Effects Method VARIABLES 11 12
RGDP
PCAP
PUIGDP
RIR
CCPS
PCCPI
TOT
IRER
EDPE
LPIGDP
PORIT
CILIB
Adj R-sq
F-stat
DW
N
12.40541 (3.397219)
0.080417** (0.051405)
-0.004673** (0.002561)
0.016498 (0.128931)
0.033182 (0.033163)
0.000554 (0.000650)
-0.000370 (0.000536)
-0.006804 (0.005656)
0.000274 (0.001082)
-0.026681 (0.051212)
0.489658*** (0.051525)
-0.214106 (0.422125)
0.687787
14.83159
1.925444
384
11.85834 (4.288392)
0.079335* (0.051467)
-0.004656** (0.002571)
0.015346 (0.128962)
0.031230 (0.032946)
0.000540 (0.000650)
-0.000364 (0.000536)
-0.006769 (0.005659)
0.000249 (0.001083)
-0.024317 (0.051007)
0.490238*** (0.051531)
-0.104197 (0.705479)
0.687559
14.81690
1.926259
384
* Significant at the 10% level; ** Significant at the 5% level; *** Significant at the 1% level. Standard errors are in parentheses.
68
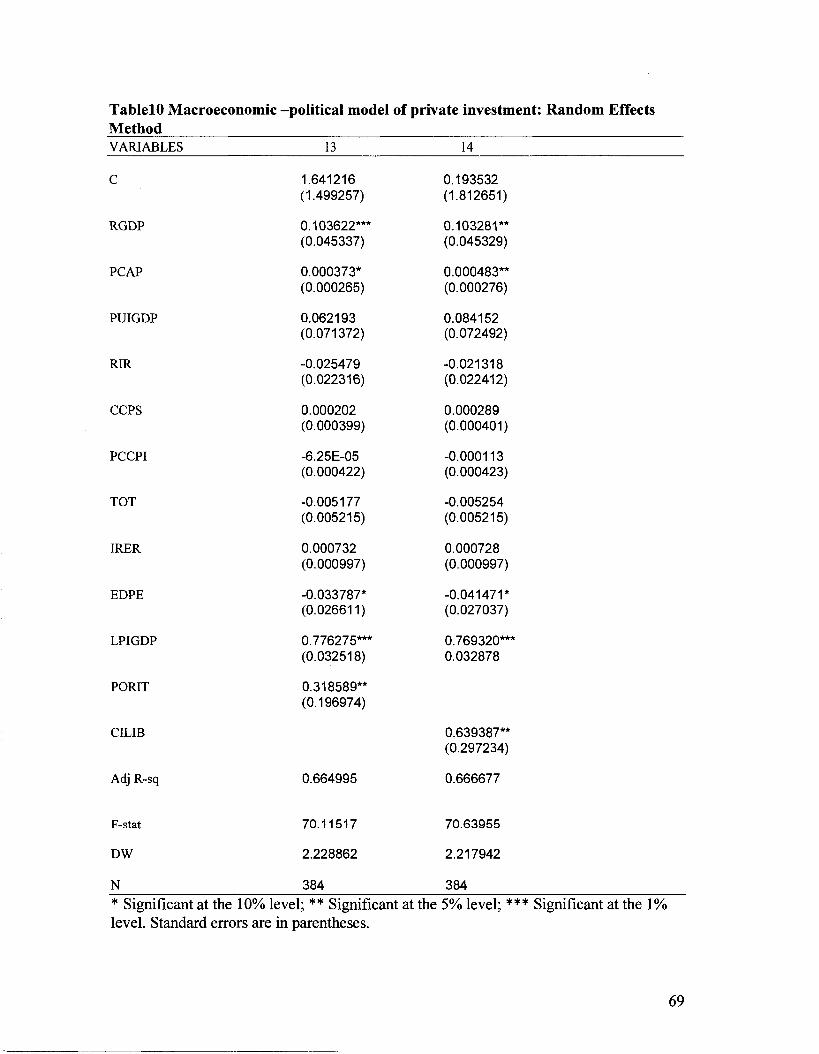
TablelO Macroeconomic -political model of private investment: Random Effects Method VARIABLES 13 14
RGDP
PCAP
PUIGDP
RIR
CCPS
PCCPI
TOT
IRER
EDPE
LPIGDP
PORIT
CILIB
Adj R-sq
F-stat
DW
N
1.641216 (1.499257)
0.103622*** (0.045337)
0.000373* (0.000265)
0.062193 (0.071372)
-0.025479 (0.022316)
0.000202 (0.000399)
-6.25E-05 (0.000422)
-0.005177 (0.005215)
0.000732 (0.000997)
-0.033787* (0.026611)
0.776275*** (0.032518)
0.318589** (0.196974)
0.664995
70.11517
2.228862
384
0.193532 (1.812651)
0.103281** (0.045329)
0.000483** (0.000276)
0.084152 (0.072492)
-0.021318 (0.022412)
0.000289 (0.000401)
-0.000113 (0.000423)
-0.005254 (0.005215)
0.000728 (0.000997)
-0.041471* (0.027037)
0.769320*** 0.032878
0.639387** (0.297234)
0.666677
70.63955
2.217942
384
* Significant at the 10% level; ** Significant at the 5% level; *** Significant at the 1% level. Standard errors are in parentheses.
69

Tenth, the coefficients of the political rights and civil liberties are positively related to
private investment and significant at the 5% level. Finally, the effect of private
investment after one year is positive and highly significant at the 1% level.
The Hausman Test
The analyses so far have shown that the fixed effects and random effects
estimation techniques have provided different results. Therefore, the inevitable question
is which should be used? Hausman (1978) provided the correlated random effects test.
The Hausman Test has a Chi-square distribution with degrees of freedom corresponding
to the number of explanatory variables. The test excludes the constant term(s) in the
model. The null hypothesis is that the individual effects are uncorrelated with the
regressors in the model. The alternative hypothesis is that the individual effects are
correlated with the regressors in the model. Therefore, the rejection of the null hypothesis
implies that the fixed effects should be estimated. Table 11 provides a summary of the
Hausman Test, the test statistics and the corresponding p-values.
Table 11: Correlated Random Effects- Hausman Test Test Summary Cross- section (PORIT)
Cross-section (CILIB)
Chi-Sq Statistics 61.695031
59.73006
Chi-sq. d.f. 11
11
Prob. 0.000
0.000
The foregoing has presented the results of the panel least squares, fixed and random
effects estimation techniques of the private investment model and the Hausman Test. The
original regression results of all the models can be referenced under Appendix 4. The
next chapter discusses the results within the context of both theoretical and empirical
literature, and the policy implications of the results are highlighted. In addition the
chapter provides limitations of the study, directions for future research and conclusion.
70

CHAPTER V
FINDINGS, DISCUSSIONS AND CONCLUSION
An empirical analysis of macroeconomic and political determinants of private
investment in Sub-Saharan Africa demands systematic study because the region lags
behind the rest of the world in promoting private investment and improving democratic
governance. This study is grounded in neoclassical investment theory, and investigates
the McKinnon-Shaw hypothesis and other hypotheses which emphasize the influence of
macroeconomic, political and geographical factors in explaining private investment
behavior. The literature review demonstrates a dearth of studies focusing on Sub-
Saharan Africa and little understanding of the determinants of private investment. The
research problem for the study is the fact that the factors influencing private investment
promotion in a region implementing structural adjustment policies (SAPs) and political
reforms are not known. Therefore the study seeks to answer the question: What are the
macroeconomic and political determinants of private investment in Sub-Saharan Africa
from 1993 to 2002? The answers to the research question are indicated in the discussion
of the findings.
Data for the study are obtained from the World Bank African Development
Indicators (ADI) 2004, the World Development Indicators (WDI) 2006 CD-ROM
Version, the International Financial Statistics, 2004 and Freedom House, 2003. Because
of missing values, the investment function is estimated only for 43 out of 48 Sub-Saharan
African countries. The estimation techniques used to estimate the data are panel least
squares, the fixed effects and random effects methods.
3 EXCELL, SPSS, and EVIEWS are the computer software programs employed to analyze the data.
71

Discussions
Private Investment and Macroeconomic Factors
First, the study's result indicate that growth rate of real output exerts positive and
significant impact on private investment in all the estimation techniques. This finding
supports the accelerator theory of investment and neoclassical investment theory. At the
empirical level this finding is consistent with Green and Villanueva (1991), Oshikoya
(1994), Wai and Wong (1982) and Blejer and Khan (1984).
Second, per capita income as a measure of country size in terms of income and
population, propensity to save, and the level of economic development is positive and
significantly related to private investment except in the fixed effects model where it is
negative and significantly related with private investment. The negative effect contradicts
Green and Villanueva (1991) and Pastor and Sung (1995). One possible explanation is
that high income countries tend to consume more and save less, thus drive interest rates
up which may reduce private investment.
Third, public investment in gross domestic product exerts a positive but
insignificant impact on private investment in all the models thus implying that there is
complementarity between private and public sectors. Public investment in roads, health,
education, irrigation and hydro electric dams and other infrastructure projects enhances
the efficiency of private capital although insignificantly. This positive effect is weaker
than the findings of Wai and Wong (1982), Musalem (1989) and Blejer and Khan (1984).
Fourth, the impact of the real interest rate on private investment has been found
to have mixed effects with respect to the estimation techniques. The panel least squares
and random effects estimation techniques indicate that real interest rate is negatively
72

correlated with private investment according to the expectations of the neoclassical
investment theory. This finding supports the results of Greene and Villanueva (1991) and
Musalem (1989). On the other hand the fixed effects estimation technique indicates a
positive relationship between real interest rate and private investment. A possible
explanation is that in many Sub-Saharan African countries, bank credits tend to be a
reliable source of financing private investment. Thus, an increase in real interest rates
tends to boost savings and eventually private investment because of the positive
association between savings and private investment.
Fifth, the study finds that credit availability to the private sector is positively
related to private investment, although statistically insignificant. At the theoretical level
this finding is consistent with the McKinnon (1973) and Shaw (1973) hypothesis which
posits that in the developing countries what matters is the quantity of credit not the cost,
because firms would not equate the marginal product of capital to real interest rate due to
financial repression. This finding is consistent with studies undertaken by Fry (1981),
Blejer and Khan (1994), Wai and Wong (1982) and Oshikoya (1994) all of whom find
similar and significance impact of bank credit on private investment. Pastor and Sung
(1995) found a positive but not significant effect for a group of 15 developing countries
from 1973 to 1986.
In addition, the results indicate that inflation (the percentage change in the
consumer price index) as measure of macroeconomic instability and uncertainty exerts a
positive impact on private investment in the neoclassical investment function but
negative in the McKinnon-Shaw and the fixed effects and random effects models. The
estimated coefficients however, do not indicate any significant impact on private
73

investment. This negative impact is consistent with similar finding by Greene and
Villanueva (1991). Oshikoya (1994) on the other hand found positive effect for a group
of middle income African countries. The positive association between private investment
and inflation may explained by the fact that an increase in the price level tend to reduce
real interest rate, thus the cost of borrowing. This may boost investment as firms may
borrow at a cheaper cost to expand their plant capacity.
Furthermore, the results indicate that the terms trade as a measure of external
shock is negatively related to private investment contrary to expectations. A significant
aspect of the changes in the terms of trade is the resultant income effects because an
increase in the terms of trade implies that the price of exports has gone up relative to the
price of imports. With the same amount of physical quantity of exports, the country can
now import more goods. Therefore, an increase in terms of trade may boost income,
savings, and private investment. This finding corroborates Oshikoya (1994) which found
similar negative but insignificant effects for a group of middle and low income African
countries.
Again, the real and effective exchange rate is insignificant but positively related
to private investment in all the estimated models, indicating that currency appreciation or
revaluation promotes private investment. The study's finding confirms Musalem (1988)
which found similar positive impact of the exchange rate on new capital import for
Mexico. It also confirms Oshikoya (1994) which found a positive but insignificant effect
for middle income African countries. This finding implies that currency devaluations
undertaken by many Sub-Saharan African countries had no positive impact on private
investment.
74

Finally, the results of the study indicate that the external debt burden measured as
the ratio of external debt repayments to export of goods and services is negatively and
significantly related to private investment. Thus, the finding confirms the debt-overhang
hypothesis and empirical studies undertaken by Greene and Villanueva (1991) for 23
developing countries, Serven and Solimano (1991) and Oshikoya (1994).
Private Investment, Geography and War
The results of the study indicate that the effect of geography proxied as the
availability of a seaport is positively correlated with private investment but insignificant.
This negative correlation between private investment and seaport availability deserves
public action because forty percent of the Sub-Saharan Africa's population lives in
landlocked countries with high transportation costs and poor trade facilities (Ndulu,
2006). The effect of war in general is negative on private investment except in the
McKinnon-political rights model where the coefficient becomes positive. A possible
explanation for the positive effect of war on private investment is that the threat or
escalation of wars in general may cause a marginal increase in investment in inventories
and plant and machinery by private businesses in the military sector in Sub-Saharan
African countries and this may partially offset the fall of investment in other parts of the
economy.
Private Investment and Democracy
The effect of democracy proxied by political rights scores and civil liberties
scores on private investment is mixed with respect to the estimation techniques.
75

Democracy exerts a negative and significant impact on private investment in the panel
least squares and the random effects estimation techniques thus, supporting the conflict
school which suggests that extensive political rights and civil liberties may be inimical to
private capital formation (Gerschenkron, 1992; Root, 1996). The implication of the
finding is that democratic governance reforms may significantly deter private capital
formation in Sub-Saharan Africa. This finding is not surprising because the
institutionalization of democratic governance has led to periodic pre-post election
violence in many Sub-African countries. On the other hand the fixed effects results
indicate a positive association between private investment and democracy albeit
insignificantly. The positive correlation between private investment and democracy is
consistent with the compatibility school which suggests that democracy promotes private
investment (Pastor and Sung, 1995; Helliwell, 1994). The positive impact is consistent
with studies undertaken by Pastor and Sung (1995) for 15 developing countries and Feng
(2001) for 42 developing countries although using different measures of democracy.
Pastor and Sung (1995) and Feng (2001), however found significant positive impact of
democracy on private investment.
Policy Implications
The findings of the study have important implications for macroeconomic,
democratic governance, and country level economic development policies. First growth
promotes private investment according to the findings of the study. Therefore policies
that directly enhance growth would promote private investment and economic
development simultaneously. Second, expansionary fiscal policy that reduces credit to the
private sector may reduce private investment because of the positive correlation between
76

credit availability and private investment. Similarly, tight monetary policy that restricts
credit to the private sector and puts an upward pressure on interest rates may have the
potential of contracting private investment. Third, the findings of the study have
implications for exchange rate devaluation and the reduction in government deficits
which are important components of structural adjustment measures. Exchange rate
devaluations are likely to have adverse repercussions for investment since many Sub-
Saharan African countries rely heavily on imported capital goods. Reduction in
government deficits that are achieved through cuts in public investment may have
adverse consequences for private investment because public investment in health,
education and physical infrastructure is complementary to private investment. Fourth,
debt reduction strategies should be pursued vigorously to levels that are sustainable since
private investors construe high external debt levels as a future tax on capital. The present
levels of debt for many Sub-Saharan African countries cannot be reconciled with the
present levels of growth, thus discouraging investment, which in turn reduces the ability
of the government to pay and ultimately adds to the pressures of repayment. Again,
democratic governance policies should focus on empowering institutions such as the
electoral commissions and the judiciary to be independent of executive influence and
manipulation to reduce many pre-post election tension and violence. Finally, for country
level economic development policy that aims at the attraction of new businesses and the
retention and the expansion of existing businesses, the policy implication is that public
investment, the growth of real output and the past level of investment attracts news
businesses and the expansion of existing ones.
77

Contribution to Theory
The study has expanded the neoclassical investment function by adding a political
dimension for Sub-Saharan African countries. The original model focuses on interest
rates and macroeconomic economic factors as the main drivers of private investment.
Democracy, the political variable of interest is proxied by political rights scores and civil
liberties scores. Although democracy's impact on private investment is mixed, the
research nevertheless provides insights into the political context in which private
investment takes place.
Limitations and Directions for Future Research
The first limitation of the study is missing data and this has led to the deletion of
five countries resulting in a final sample of 43. In some cases missing values are
forecasted or the means are computed and used in the analysis. Second, the findings with
respect to democracy in the panel least squares and random effects estimation methods
should be interpreted with caution because more comprehensive measures of democracy
are being developed by Kaufmann et al (2005) but the limitations are that they are not
available in annual time series and only cover a short span of time. Future research could
explore these measures when they become available in time series. Third, the study
aggregates private investment and assumes that the various forms of investment respond
in the same way. Future research that disaggregates investment into its various
components would go a long way to enhance our understanding of investment behavior.
Fourth, the study does not account for the effects of taxes and subsidies on private
investment due to the lack of data. Finally, common to all time series data, regression
78

diagnostics show evidence of serial correlation. Although this has been corrected for
there is no perfect method for eliminating serial correlation. The presence of serial
correlation might make the estimated coefficients less significant than they actually are.
Despite, these limitations, most of the findings of the study are consistent with both the
theoretical and empirical literature.
Conclusion
This study examines macroeconomic and political factors affecting private
investment in Sub-Saharan African countries from 1993 to 2002. This time period
witnessed many economic and political events in Africa such as the implementation of
structural adjustment polices and the introduction of multi-party democracy. The study
utilized three estimation techniques to analyze the data: panel least squares, fixed effects
and random effects. The Hausman Test statistics indicates that Sub-Saharan Africa
countries are not randomly drawn from a larger population of developing countries and
there is correlation between the explanatory variables and the error term. Therefore, the
greatest weight is placed on the results of fixed effects estimation technique. According
to the fixed effects estimation results, this study finds that the growth rate of real output,
real per capita income, and the past levels of private investment are significant factors
affecting private investment. Public investment, real interest rates, credit to the private
sector, inflation, terms of trade and real and effective exchange rate are not statistically
significant in promoting private investment in Sub-Saharan Africa. Democracy exerts the
expected positive impact on private investment albeit insignificantly. This implies that in
Sub-Saharan African countries where elections are held freely and fairly and in
competitive environment may experience a better private investment performance than in
79

countries that lack basic political rights. Besides, countries that guarantee freedom of
association, speech, religion, free independence of the media and court system and
freedom to do business on an equitable basis without excessive government corruption
would experience superior private investment outcomes. Despite, the statistical
significance of the fixed effects model, the random effects model has some intuitive
appeal (Greene, 2000). Therefore, in discussing the findings and the policy implications
of the study, the results of the random effects model are also taken into consideration.

References
Alesina, A. & Rodrik, D. (1996). Distributive politics and economic growth. Quarterly Journal of Economics 109: 465-490
Alesina, A. & Perotti, R. (1996). Income distribution, political instability and investment. European Economic Review, 40: 1203-1228
Alesina, A., Ozler, S. & Swagel, P. (1999). Political instability and economic growth. Journal of Economic Growth, 1: 189-211
Balassa, B. (1988). Public finance and economic development. Preliminary Working Paper 31: The World Bank; Washington D. C.
Baltagi, B. H. (1995). Econometric analysis of panel data. John Willy & Sons: New York
Blejer, M. I. & Khan, M. S. (1984). Government policy and private investment in developing countries. IMF Staff Papers 31: 379-403
Bollen, K. (1986). Political rights and political liberties in nations: An evaluation of human rights measures, 1950 to 1984. Human Rights Quarterly 8: 567-591
Bollen, K. (1990). Political democracy: Conceptual and measurement of political democracy. American Sociological Review 45: 567-591
Bollen, K. (1993). Liberal Democracy: Validity and method factors in cross-national measures. American Journal of Political Science 37: 1207-1230
Borenzstein, E. (1989). Debt overhang, credit rationing and investments. Journal of Development Economics 32: 315-350
Borensztein, E. R., De Gregorio, J. & Lee, J.- W. (1998). How does foreign direct investment affect economic growth? Journal of International Economics, 45(1): 115-135
Bouton, L. & Sumlinski, M. A. (1997). Trends in private investment in developing countries: Statistics for 1970-95. IMF Discussion Paper #31. Washington, DC: International Monetary Fund.
Buffie, E. (1986). Devaluation, investment and growth in LDCs. Journal of Development Economics, 20: 361-379
Chenery, H. B. (1952). Overcapacity and the acceleration principle. Econometrica 20(l):l-28
81

Chenery, H. B. & Strout, A. M. (1966). Foreign Assistance and economic development. American Economic Review, 56(4): 679-733
Chowdhury, A. & Islam, I. (1993). The newly industrializing economies of East Asia. Routledge: London
Clark, J. M. (1917). Business acceleration and the law of demand: A technical factor in Economic Cycles. The Journal of Political Economy, 25(3), 217-235
Clark, P. (1979). Investment in the 1970s: Theory, performance and prediction. Brookings Papers on Economic Activity No 1, Brookings Institution, Washington: DC
Collier, P. & Gunning, J. W. (1999). Why has Africa grown slowly? Journal of Economic Perspectives 13(3): 2-22
Corden, W. M. (1988). Debt relief and adjustment incentives. IMF Staff Papers 35: 628-648
Dornbusch, R. & Edwards, S. (1991). The macroeconomics of populism in Latin America. Chicago: University of Chicago Press
Faini, R. & Jaime, M. (1990). Adjustment, investment, and the real interest rate in developing countries. Economic Policy 5(11): 492-519
Feng, Y. (2001). Political freedom, political instability, and policy uncertainty: A study of political institutions and private investment in developing countries. International Studies Quarterly, 45(2): 271-294
Feng, Y. (2003). Democracy, governance and economic performance. Cambridge, Massachusetts: MIT Press
Fosu, A. K. (2003). Political instability and export performance in Sub-Saharan Africa. Journal of Development Studies, 39(4): 68-82
Freedom House. (2003). Freedom in the World: Annual survey of political rights and civil liberties. New York: Freedom House
Freedom House. (1998). Freedom in the World: The annual survey of political rights and civil liberties 1997-1998. New York: Freedom House
Fry, M. J. (1980). Saving, investment, growth and the cost of financial repression. World Development, 8:731-750
Gerschenkron, A. (1962). Economic backwardness in historical perspective: A book of essays: Cambridge: Cambridge University Press
82
Ghura, D. & Hadjimichael, M. T. (1996). Growth in Sub-Saharan Africa. IMF Staff Papers 43(3): 605-634
Globerman, S. & Shapiro, D. (2003). Governance infrastructure and US foreign direct investment. Journal of International Business Studies, 34(1): 19-39
Gries, T. (2002). Catching-up, falling-behind and the role of FDI: A model of endogeneous growth and development. The South African Journal of Economics, 70(4): 273-281
Greene, J. & Villanueva, D. (1991). Private Investment in developing countries. An empirical analysis. International Monetary Fund Staff Papers, 38(1): 33-58
Greene, W.H. (2000). Econometric analysis. London: Prentice-Hall
Gujarati, D. (1992). Essentials of econometrics. New York: Mc-Graw Hill, Inc
Gyimah-Brempong, K. & Corley, M. E. (2005). Civil wars and economic growth in Sub-Saharan Africa. Journal of African Economies 14(2): 270-311
Hausman, J. (1978). Specification tests in Econometrics. Econometrica, 46: 1251-1271
Hall, R. & Jorgensen, D. W. (1971). "Application of the theory of optimum capital accumulation." In Gary Fromm, ed., Tax incentives and capital spending. Washington, D.C:, Brookings Institution.
Helliwell, J. F. (1994). Empirical linkages between democracy and economic growth. British Journal of Political Science 24(2): 225-248
Hope, K. R. (1997). Development solutions for Africa: The need for policy reforms and good governance. A Journal of Opinion, 25(1): 35-38
Hope, K. R. (1999). Development prospects and policy for Africa: Structural adjustment and beyond. Review of Black Political Economy, 26(4), 75-92
Huntington, S. P. & Dominguez, J. I. (1975). Political Development. In Greenstein, F. I., & Polsby, N. W. (eds). Handbook of Political Science, Vol 3, Macropolitical Theory. Reading, MA: Addison-Wesley.
International Monetary Fund. (2004). International Financial Statistics. Washington D C : IMF
International Monetary Fund. (1980). Balance of Payments Manual. Washington DC: IMF
Jaycox, E.V. (1992). Sub-Saharan Africa: Development performance and prospects. Journal of International Affairs, 46(1): 81-95
83

Jorgensen, D. W. (1967). "The theory of investment behavior." In Robert Ferber, ed., Determinants of investment behavior. Cambridge, Mass.: National Bureau of Economic Research.
Jorgenson, D. W. (1971). Econometric studies of investment behavior: A survey. Journal of Economic Literature, 9(4): 1111-1147.
Kaufmann, D., Kraay, A., & Mastruzzi, M. (2005). Governance Matters IV: Governance Indicators for 1996-2004. Washington, D.C.: Policy Research Working Paper Series No.3630
Keynes, J. M. (1936). The general theory of employment, interest and money. New York: Harcourt, Brace
Khan, M. & Knight, M. (1985). Fund-supported adjustment programmes and economic growth. IMF Occasional Paper 41, Washington, D.C., International Monetary Fund.
Khan, M. S. & Reinhart, C. M. (1990). Private investment and economic growth in developing countries. World Development 18 (1): 19-27
Koyck, L. M. (1954). Distributed lags and investment analysis. Amsterdam: North-Holland
Kormendi, R. C. & Meguire, P. G. (1985). Macroeconomic determinants of growth: Cross-country evidence. Journal of Monetary Economics 16: 141-163
Krugman, P. (1988). Market- based debt reduction schemes. National Bureau of Economic Research Working Paper 2587. Cambridge, Massachusetts, NBER
Lai. D. (1972). The foreign- exchange constraint bottleneck revisited: A geometric note. Economic Development and Cultural Change, 20(4): 722-730
Maxfield, S. (1990). Governing capital: International finance and Mexican Politics. Ithaca: Cornell University Press
McGowan, P.& Johnson, T. H. (1984). African military coups d'etat and underdevelopment: A quantitative historical analysis. The Journal of Modern African Studies, 22(4): 633-666
McKinnon, R. I. (1966). Foreign exchange constraints in economic development and effective aid allocation. Economic Journal, 74(294): 388-409
McKinnon, R. I. (1973). Money and capital in economic development. Washington, DC: The Brookings Institution

Musalem, A. R. (1989). Private investment in Mexico: An empirical analysis. Working Paper Series 183: The World Bank: Washington; D.C.
Musila, J. W. & Sigue, S. P. (2006). Accelerating foreign direct investment flow to Africa: From policy statements to successful strategies. Managerial Finance, 32(7): 577-592
Ndulu, J. N. (2006). Infrastructure, regional integration and growth in Sub-Saharan Africa: Dealing with the disadvantages of geography and sovereign fragmentation. Journal of African Economies, 15(2) 212-244.
Nyikuli, P. K. (1999). Unlocking Africa's potential: Some factors affecting economic development and investment in Sub-Saharan Africa. Law and Policy in International Business, 30(4): 623-636
Nyong'o, A. P. (1997). Institutionalization of democratic governance in Sub-Saharan Africa. European Center for Development Policy Management. Working Paper No. 36. Maastricht: ECDPM.
O'Donnell, G. (1978). Reflections on the patterns of change in the bureaucratic authoritarian state. Latin American Research Review 13: 3-38
O'Donnell, G. & Schmitter, P. C. (1986). Tentative conclusions about uncertain democracies. In O'Donnell, G., Schmitter, P. G., & White, L. eds. Transitions from authoritarian rule. Baltimore: Johns Hopkins University Press
Oshikoya, T. W. (1994). Macroeconomic determinants of domestic private investment in Africa: An empirical analysis. Economic Development and Cultural Change, 42(3): 573-596
Pastor, M. Jr., & Hilt, E. (1993). Private investment in Latin America. World Development, 21: 489-507
Pastor, M. Jr. & Sung, J. H. (1995). Private Investment and democracy in the developing world. Journal of Economic Issues, 29(1): 223-244
Pendergast, S. & Pendergast, T. (2002). Encyclopedia of National Economies. Vol. 1 Africa. Gale Group: New York
Persson, T. & Tabellini, G. (1994). Is inequality harmful for growth? Theory and evidence. American Economic Review 84: 600-621
Pfeffermann, G. & Madarassy, A. (1989). Trends in private investment in thirty developing countries. International Finance Corporation Discussion Paper 6: Washington D.C, World Bank.
85
Pindyck, R. S. (1991). Irreversibility, uncertainty, and investment. Journal of Economic Literature, 29: 1110-1148
Pindyck, R. S. & Rubinfield, D. L. (1991). Econometric models and economic forecasts. New York: McGraw-Hill, Inc
Przeworski, A. & Limongi, F. (1993). Political regimes and Economic Growth. Journal of Economic Perspectives, 7(3): 51-69
Razin, A., Sadka, E., & Yuen, C. (1999). Excessive FDI under asymmetric information. NBER Working Paper No. 7400. National Bureau of Economic Research, Cambridge: MA
Reinhart, C. M. & Rogoff, K.S. (2002). FDI to Africa: the role of price stability and currency instability. Paper presented at the Annual World Bank Conference on Development Economics, Washington, D.C. 29-20 April
Rodan, G. (1997). Singapore: Economic diversification and social divisions. In Rodan, G., Hewison, K., & Robinson, R. (eds). The political economy of Southeast Asia: An introduction. Oxford University Press: Melbourne.
Root, H. L. (1996). Small countries, big lessons: Governance, and the rise of East Asia. New York: Oxford University Press
Sachs, J. D. & Larrain, F. B. (1993). Macroeconomics in the global economy. Prentice-Hall, Inc. Englewood Cliffs: New Jersey
Serven, L. & Solimano, A. (1991). Adjustment policies and investment performance in development countries: Theory, country experiences, and policy implications. Working Papers Series, 606. Washington, D.C, The World Bank
Serven, L & Solimano, A (1992). Private investment and macroeconomic adjustment: A survey. The World Bank Research Observer, 7(1): 95-105
Serven, L & Solimano, A. (1993). Private investment and macroeconomic adjustment: A survey. In L. Serven & A. Solimano (eds). Striving for growth after adjustment: The role of private capital formation (pp. 11-30). Washington DC: International Bank for Reconstruction and Development.
Shaw, E. S. (1973). Financial deepening in economic development. New York: Oxford University Press
Tobin, J. (1969). A general equilibrium approach to monetary theory. Journal of Money, Credit and Banking, 1(1), 15-29
86

Trent, R. (2002). Implications for foreign direct investment in Sub-Saharan Africa under the African Growth Opportunity Act. Northwestern Journal of International Law & Business 23(1): 213-237
United Nations Conference on Trade and Development; UNCTAD. (2006). World
Investment Report. New York & Geneva: United Nations
Wai, T. U. & Wong, C. (1982). Determinants of private investment in developing countries. Journal of Development Studies, 19: 19-36
Walden, B.& Rosenfeld, S. (1990). Dragons in distress: Asia's miracle economies in crisis. Penguin: Harmondsworth
Wooldridge, J. M. (2000). Introductory econometrics: A modern approach. Southwestern College Publishing: United States
World Bank. (2006). Africa Development Indicators. Washington, DC: The World Bank
World Bank. (2004). Africa Development Indicators. Washington, DC; The World Bank
World Bank. (1990). Adjustment lending policies for sustainable growth. Policy and Research Series 14, Washington, D.C., World Bank.
World Bank. (1989). Sub-Saharan Africa: From crises to sustainable growth: A long term perspective study. Washington, DC: World Bank
World Trade Organization. (1996). Trade and Foreign Direct Investment. Press/57, Oct, 9
87
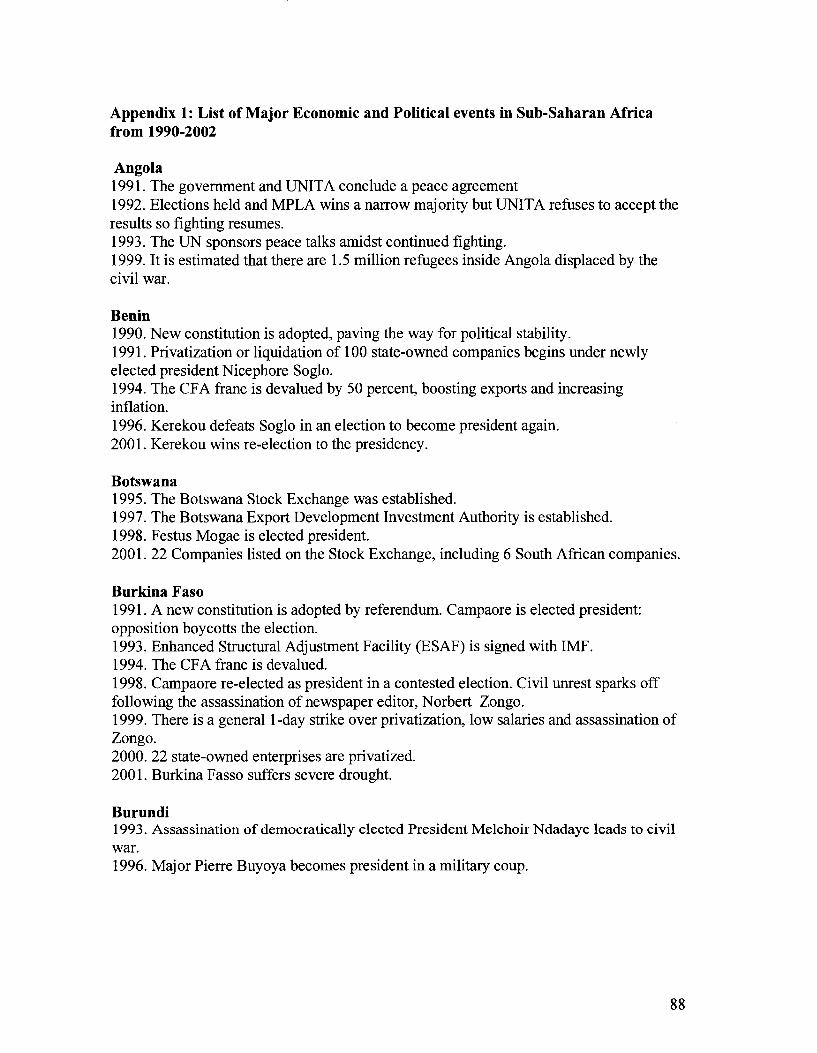
Appendix 1: List of Major Economic and Political events in Sub-Saharan Africa from 1990-2002
Angola 1991. The government and UNITA conclude a peace agreement 1992. Elections held and MPLA wins a narrow majority but UNITA refuses to accept the results so fighting resumes. 1993. The UN sponsors peace talks amidst continued fighting. 1999. It is estimated that there are 1.5 million refugees inside Angola displaced by the civil war.
Benin 1990. New constitution is adopted, paving the way for political stability. 1991. Privatization or liquidation of 100 state-owned companies begins under newly elected president Nicephore Soglo. 1994. The CFA franc is devalued by 50 percent, boosting exports and increasing inflation. 1996. Kerekou defeats Soglo in an election to become president again. 2001. Kerekou wins re-election to the presidency.
Botswana 1995. The Botswana Stock Exchange was established. 1997. The Botswana Export Development Investment Authority is established. 1998. Festus Mogae is elected president. 2001. 22 Companies listed on the Stock Exchange, including 6 South African companies.
Burkina Faso 1991. A new constitution is adopted by referendum. Campaore is elected president: opposition boycotts the election. 1993. Enhanced Structural Adjustment Facility (ESAF) is signed with IMF. 1994. The CFA franc is devalued. 1998. Campaore re-elected as president in a contested election. Civil unrest sparks off following the assassination of newspaper editor, Norbert Zongo. 1999. There is a general 1-day strike over privatization, low salaries and assassination of Zongo. 2000. 22 state-owned enterprises are privatized. 2001. Burkina Fasso suffers severe drought.
Burundi 1993. Assassination of democratically elected President Melchoir Ndadaye leads to civil war. 1996. Major Pierre Buyoya becomes president in a military coup.
88

Cameroon 1993. Opposition political parties are legalized. 1994. Cameroon's currency, the CFA franc, is devalued by 50 percent. 1997. The government embarks on a program of structural reform in collaboration with the IMF and the World Bank, aimed at increased privatization. 2000. Work begins on the Chad-Cameroon Oil Production and Pipeline project.
Cape Verde 1990. Opposition political groups form the Movement for Democracy (MPD) In April and campaign to take part in elections. 1991. MPD wins the first multi-party election in January with majority in the National Assembly and electing Antonio Monteiro as president. 1992. A new constitution is adopted. 1996. Monteiro is reelected president. 2001. Pedro Pires, of the African Party for the Independence of Cape Verde (PAICV), is elected president by a narrow margin of 12 votes.
Central African Republic 1993. Ange-Felix Patasse is elected president. 1996-97. Several army mutinies break out over unpaid salaries and quickly degenerates into violence and widespread looting of the capital city of Bangui. Patase flees. 1997. Bangui accords are signed to reconcile of all political factions; France withdraws its troops in October. 1998. The UN sends a peacekeeping force to help maintain order throughout the legislative and presidential elections. 1999. Patasse is reelected president. 2001. More mutinies disrupt the political and economic stability of the country.
Chad 1990. Iddriss Beby takes power by military force. 1996. Constitution is voted on by referendum. Presidential elections are held. 2000. The Chad-Cameroon oil production and pipeline project begins.
Comoros 1990. Djoha is elected president. 1995. Djohar is ousted by a coup. 1996. Elections conducted and is won by Taki Abdoukarim' National Union for Democracy in Comoros (NUDC) but opposition boycotted the elections. 1997. In August, a secessionist movement headed by Abdallah Ibrahim calls for the independence of Anjouan Island. 1998. In March, over 99 percent of Anjouan citizens vote for independence in a referendum. Moheli Island declares independence. Troops are sent to restore order. 1998. President Taki dies amid rumors of a political assassination. An interim government is formed under Tadjine Ben Siad Massoude. 1999. Colonel Azali Assoumani takes power through a coup and imposes military rule. 2001. Anew constitution and new national government are established.
89

Congo, Democratic Republic of the 1990. The United States ends its economic and military support to Mobutu because of corruption and human rights abuses. 1991. Domestic and international pressure mounts and Mobutu agrees to form coalition government with UDPS leader Etienne Tshisekedi. 1992. The multiparty constitutional conference resumes amid squabbling and continued unrest. 1994. Approximately 500,000 Rwandan ethnic Tutsi's killed by Rwandan ethnic Hutus. About 1.3 million Rwandan ethnic Hutus flee into eastern Zaire to escape retribution from the new Tutsi government. Among the refugees are Hutus responsible for the massacre. 1996. Revolt in Eastern Zaire because Zairean Tutsi's threatened by Hutus. Uganda and Rwanda seize the opportunity to select veteran guerrilla fighter Laurent Kabila to invade eastern Zaire. 1997. Kabila's army, composed mainly of Rwandans and Ugandans, takes Kinshasa and Mobutu flees into exile and Kabila appoints himself as the president and changes the country's name back to Democratic Republic of Congo. 1998. Kabila ejects his Rwandan followers which starts a war backed by Rwanda and Uganda against him. Rebel activity unofficially divides the Congo into three regions. 2001. President Laurent Kabila is assassinated and his son Major General Joseph Kabila appointed as interim president.
Congo, Republic of the 1991. Congo return to multiparty democracy under a new constitution and the country's name changed back to the Republic of the Congo. 1992. Sassou-Nguesso is defeated in the presidential elections by Pascal Lisouba. Later, Lissouba is accused of ethnic favoritism and armed factions loyal to Sassou-Nguesso rise against him. 1997. Civil war breaks out in Brazzaville, which results in Brazzaville's destruction. Later that year, Sassou-Ngueso overthrows Lissouba with assistance from Angola.
Cote d'lvoire 1990. Opposition parties are legalized. Houphouet-Boiney is re-elected under first multiparty elections. 1993. Houphouet-Boiney president since independence in 1960 dies and Henry Konan Bedie, president of the national assembly succeeds him. 1994. The CFA franc was devalued in January by 50 percent to prepare the grounds for economic reforms and sustained period of economic growth. 1995. In October, Konan Bedie wins 95 percent of the presidential votes in the face of widespread opposition boycott. 1998. The constitution is amended in August strengthening the powers of the president and barring the Quattara from standing in the 2000 presidential election. 1999. Bedie is ousted in a coup, and a military government under Robert Guei is installed. 2000. Laurent Gbagbo declared himself president after attempt by Robert Guei to declared himself the winner.
90

Djibouti 1991. Civil war with the Afars commences in the North and the rebel group FRUD is formed. 1992. Multiparty elections under new constitution return Ghouled and his PRP party to power. 1994. Peace accord is signed, ending the 3-year uprising by Afar rebels. 1996. Proposed budget cuts cause a general strike and civil unrest. 1997. Multiparty elections return FRUD-RPP alliance with Ghouled as president. 1998. A border dispute between Ethiopia and Eritrea leads to an increase in trade though Djibouti. 1999. Successor to Ghouled, Ismael Guelleh, wins the presidential elections.
Equatorial Guinea 1991. Large oil and natural gas deposits are discovered. 1994. Investment by Mobil in the oil sector is followed by a large multinationals over the next couple of years. 1996. Multiparty won by Obiang with 98 percent of the vote but the election is widely contested as unfair. 1997. French becomes the second official language and the government claims attempted coup in May and doubles the size of the military to 2,000. 1998. Attacks on government installations in January. 1999. The ruling party increases its majority in parliament. 1999. The border dispute with Sao Tome and Principe is settled by negotiation. 1999. First university established.
Ethiopia 1991. Ethnic insurrection, a collapsed economy and the final collapse of the Derg regime. The Ethiopian Peoples Revolutionary Democratic Front (EPRDF) is democratically voted into office. 1993. Eritrea establishes its independence under a UN-monitored referendum. Ethiopia and Eritrea commence a border war that continues to restrain the development of both countries.
Gabon 1990. After much social unrest, President Bongo introduces multiparty democracy into the country. 1994. Devaluation of the CFA franc by 50 percent 1998. Bongo is reelected President with 67 percent of the vote.
Gambia 1994. A military coup overthrows Jawara. Captian Yahya Jammeh assumes presidency. 1996. Elections return Yahya Jammeh as president. 1998. IMF approves 3-year Enhanced Structural Adjustment Facility of US$27 million. 1999. Poverty Reduction and Growth Facility US$4.5 million loan from IMF is approved.
91

2000. Gambia receives US$91 million in debt relief under the Highly Indebted Poor Countries scheme.
Ghana 1990. Mass protest led by the Movement for Freedom and Justice, demands a national referendum to establish a multiparty system. 1992. Draft constitution approved in a referendum which allows political associations to exist. In November presidential elections return with 58.3 percent of the vote and the December Parliamentary elections return the NDC with 189 out of 200 seats. 1995. Riots in Accra in February over the introduction of the value added tax (VAT) lead to four deaths and the withdrawal of the tax. 1996. Rawlings wins re-election and the NDC retains a majority in parliament. 1999. Fall in gold prices upsets Ghana's economic recovery. 2000. John Agyekum of the New Patriotic Party gains a majority in parliament.
Guinea 1991 Multiparty politics are introduced under a new constitution. 1996. A group of army officers attempt a military coup but are unsuccessful. 1998. Conte is re-elected as president.
Guinea Bissau 1997. Guinea Bissau joins UEMOA. 1998. Civil war breaks out after Veira dismisses the army chief. 1999. Governement of national unity installed and Guinean and Segalese troops who had come to the aid of Veira withdraws. 1999. Veira is ousted. Multiparty elections are held. 2000. Kumba Iala is elected president.
Kenya 1992. The Kenyan government re-introduces multiparty politics. 2000. Kenya signs a long awaited 3-year Poverty Reduction and Growth Facility (PRGF) with the IMF and World Bank.
Lesotho 1986-97. A period of political unrest, coups, and skirmishes between rebel troops and government loyalists. Moshoeshoe II eventually gains power then dies in a car accident. 1994. Lesotho joins the Southern African Development Community (SADC). 1998. Elections held under alleged cheating and to prevent violence the government invites troops from Botswana, South Africa and Zimbabwe to help restore order. Heavy fighting ensues resulting in 80 percent of shops and businesses damaged severely. 2000. Government promises to call new elections and privatize more enterprise.
92

Madagascar 1992. New Constitution enacted; Ratsiraka defeated in elections by Albert Zafy. 1996. Zafy impeached by parliament; Ratsiraka returns to office. 1999. Madagascar becomes eligible for U.S. debt relief.
Mali 1992. First multiparty elections held. 1994. In January CFA franc is devalued by 50 percent, raising the prices of imports in local currency and reducing import quantity. 2000. Mali is granted debt-relief under Highly-Indebted Poor Nations program. Railway from Bamako to the coast of Dakar re-opens. Dam at central Mali to improve rice cultivation is opposed by local and environmental groups.
Mauritania 1991. A new constitution is adopted, and opposition parties are legalized. 1997. President Taya is reelected president in a landslide victory.
Mauritius 1991. A coalition MSM and MMM wins elections. 1992. The constitution is amended to make Mauritius a republic with the British Commonwealth. 2000. Anerood Jugnauth is elected president as head of a coalition between the MSM and MMM.
Mozambique 1992. A truce between RENAMO and FRELIMO signed after much destruction after much destruction and complete dissolution of the economy. FRELIMO became a legalized political party and was integrated into a newly created multiparty democratic system. 1992-1999. The World Bank and the IMF fully imposed structural adjustment programs emphasizing mass privatization, currency devaluation, foreign investment, and stabilization policies.
Niger 1991. Multiparty constitution introduced. 1993. Mahamane Ousmane is elected president. 1994. CFA franc devalued. 1996. Col. Mainassara seizes power. 1999. Mainassara is shot and Major Dauda Wanke becomes president. Wanke steps down later and Mamadou Tandja is elected president.
Nigeria 1993. Presidential election won by Abiola but annulled by Babanginda (June 23) who retires and appoints businessman Shonekan as interim ruler. 1993. Abacha outs Shonekan (November, 17) and inaugurates a brutal regime. 1998. Gen Abacha dies and his succesoor inaugurates plans for return to civilian rule.
93

1999. The Third Republic inaugurated with Obansajo as the elected president after gubernatorial and local assembly elections.
Rwanda 1990. Attack from a rebel group of Tutsi exiles based in Uganda and Cenatral African nations and Belgium send troops to help the Habyarimana regime defends itself. 1991. A new constitution is ratified that states that Rwanda is a multiparty democracy. 1992. Commodity price shock (coffee) continues. The World Bank imposes more privatization with proceeds going to service Rwanda's external debt. 1992. Ethnic tensions between Hutus and Tutsi's rise. 1994. President Habyarimana dies after his plane is shot down and Hutus set out to massacre all Tutsi within the country. 1994. An external rebel group (Rwanda Patriotic Front) takes control of Rwanda and forms a transitional government of national unity to oversee return to normalcy. 1996. The Rwandan government tacitly backs Kabila's efforts to overthrow the government of the Congo. 1996. Huge numbers of refugees who had fled during 1994 return to the country. 1998. President Kabila expels Rwanda's forces from the Congo and Rwanda in turn supports rebel groups in the Congo seeking Kabila's ouster. 2000. Paul Kagame a Tutsi is elected president of Rwanda in special parliamentary vote, but the government is still considered to be in transition.
Sao Tome and Principe 1990. A new constitution is approved by referendum by and allows multiparty politics. 1991. First multiparty elections 1994. Principe is granted political and administrative autonomy.
Senegal 1994. The West African Economic and Monatary Union (UEMOA) is established to replace the CEAO. 1994. The CFA franc, common currency of UEMOA, is devalued by nearly 100 percent. 2000. Abdoulaye Wade, from the Democratic Party is elected president, making him the country's first non-socialist president since the country gained independence in 1960.
Seychelles 1991. Return to multiparty political system. 1993. Third constitution is adopted. 1995. The Economic Development Act passed in attempt to attract offshore financial services; establishment of the Seychelles International Trade Zone (SITZ). 1997. Abandonment of the fixed link between the Seychelles rupee and the IMF'S special drawing rights (SDR). 1998. Rene and his supporters win in legislative elections.
94

Sierra Leone 1991. Massive unemployment and high inflation, coupled with the spillover of the Liberian civil war, plunges Sierra Leone into civil strive perpetuated by the Revolutionary United Front (RUF) rebels. 1999. Lome peace accord between the RUF and the government of Sierra Leone that allows the deployment of over 12,000 UN peacekeeping troops in the country. 2000. Despite the peace accord, internal fighting continues.
South Africa 1990. Following years of mounting black protest and increasing sanctions against South Africa because of apartheid, President F.W. De Klerk announces the unconditional release of Nelson Mandela from prison and the legalization of the ANC, PAC, and other anti-apartheid groups. 1991. The Group Areas Act, Land Acts, and the Population Registration Act are officially rescinded. 1994. First democratic elections take place under a new constitution. The ANC wins a majority in parliament and elects Nelson Mandela as president. 1996. National Party pulls out of government of national unity and first official census occurs in post-apartheid South Africa. 1999. Second democratic elections held and ANC increases its majority in parliament and selects Thabo Mbeki as president.
Sudan 1989-99. Umar al-Bashir overthrows al-Mahdi's regime and institutes a dictatorship. Sudan supports terrorism and civil war rages in the south and Sudan is practically isolated. 1996. Bashir popularly elected as president. 2000. Bashir is popularly elected for a second term as president.
Swaziland 1992. People's United Democratic Movement (PUDEMO) declares itself an opposition party, which is illegal. 1992. Crackdown on opposition activities and more than 50 opposition activists arrested. 1996. PUDEMO spearheads campaign of protests and disobedience. 1997. The trade union calls for strikes nationwide.
Tanzania 1995. The first multi-party lections are held, resulting in Chama Cha Mapinduzi (CCM) victory. 1995. Enhanced Structural Adjustment Facility is negotiated with the IMF, emphasizing rapid privatization of parastatals.
95

Togo 1991. Pro-democracy pressures mount and Eyadema agrees to transitional government leading to free elections. 1992. Opposition parties launch a general strike, which lasts for 9 months and decimated Togo's economy. 1994. Eyadema wins presidential elections under fraudulent conditions that keep opposition parties and voters away. 1994. Multi-party legislative election are held and won by opposition parties. 1994. The CFA franc is devalued, leading to a surge in exports in Togo. 1998. Presidential elections are again boycotted by the opposition and deemed flawed by outside observers. 1999. CFA franc becomes tied to the euro. Legislative elections are won by Eyadema's RPT.
Uganda 1998. Uganda starts involvement with in the war in the Democratic Republic of Congo. 2000. A flawed national referendum maintains the no-party political system. 2001. Presidential elections held in March.
Zambia 1991. Multi-party elections are won by the Movement for Multi-party Democracy (MMD) led by Frederick Chiluba. The MMD embarks on a program of IMF-sponsored free market reform. 1996. The MMD wins a second round of elections. 2000. Copper mines fully privatized.
Zimbabwe 1991. The Enhanced Structural Adjustment Program (ESAP) is adopted and the constitution is amended to deny recourse to the courts in cases of seizure land by the government. 1994. Economic recession leads to widespread industrial unrest. 1996. Mugabe is returned to the office with 96 percent of the votes with 32 percent voter turnout. 1997. Corruption becomes an issue with allegations of official contracts being unfairly awarded and embezzlement of public funds by civil servants and ministers. 1998. Unprecedented food riots in most of the country's urban centers in response to rises in the price of the staple food, maize meal. 1998. Opposition protests government's decision to send troops to the Democratic Republic of Congo. 2000. Government encourages war veterans to occupy farms, and considerable violence erupts. 2000. Legislative elections are conducted in which the ZANU-PF wins a narrow majority.
Source: Encyclopedia of National Economies 2002 Volume 1

Appendix 2: Basic Indicators: Size and Growth Rates
Country
Angola Benin Botswana Burkina Faso Burundi Cameroon Cape Verde Central Africa Rep Chad Comoros Congo, Dem.Rep Congo, Rep Cote d'lvoire Djibouti Equatorial Guinea Eritrea Ethiopia Gabon Gambia Ghana Guinea Guinea-Bissau Kenya Lesotho Liberia Madagascar Malawi Mali Mauritania Mauritius Mozambique Namibia Niger Nigeria Rwanda
Population (millions) 2004
15.5 8.2 1.8
12.8 7.3
16.0 0.5 4.0 9.4 0.6
55.9 3.9
17.9 0.8 0.5 4.2 70.0
1.4 1.5
21.7 9.2 1.5
33.5 1.8 3.2 18.1 12.6 13.1 3.0 1.2
19.4 2.0
13.5 128.7
8.9 Sao Tome and Principe 0.2 Senegal Seychelles Sierra Leone
11.4 0.1 5.3
Land area thousands of sqkm
1,247 111 567 274
26 465
4 623
1,259 2
2,267 342 318
23 28 101
1,000 258
10 228 246
28 569
30 96 582 94
1,220 1,025
2 784 823
1,267 911
25 1
193 0
72
Average annual growth (%) 2000-04
4.6 1.2 5.7 0.3 0.0 2.7
40.0 0.3 3.6
-0.1 0.0 -0.5 -2.4 0.0 0.0 -3.4 1.3 0.3 0.8 2.4 1.0 3.8 0.3 1.8 -2.8 -1.5 -0.3
2.3 4.0 2.9 6.2 3.2 0.0 2.7 0.3 2.3 1.6
-2.3 5.3

Appendix 1 Cont'd Basic Indicators: Size and Growth Rates
Country
Somalia South Africa Sudan Swaziland Tanzania Togo Uganda Zambia Zimbabwe
Population (millions) 2004
8.0 45.5 35.5
1.1 37.6
6.0 27.8 11.5 12.9
Land area thousands of sqkm
627 1,214 2,376
17 884
54 197 743 387
Average annual growth (%) 2000-04
0.0 2.2 7.5 -0.7 4.6 -0.7 -0.7 0.3 -6.2
Source: Africa Development Indicators, 2006 Note: Djibouti, Eritrea, Liberia, Namibia, and Somalia are excluded from the study.
98

Dat
a T
reat
men
t A
ppen
dix
3 C
ount
ry
Ang
ola
Bur
kina
Fas
o
Cam
eroo
n C
ape
Ver
de
Cen
tral
Afr
ican
Rep
C
had
Com
oros
Con
go D
em. R
ep
Con
go R
epub
lic
Equ
ator
ial
Gui
nea
Eth
iopi
a G
abon
G
ambi
a G
uine
a
Gui
nea
Bis
sau
Ken
ya
Var
iabl
es w
ith m
issi
ng o
bser
vatio
ns
PUIG
DP
CC
PS
RIR
IR
ER
IR
ER
E
DPE
E
DPE
R
IR
ED
PE
ED
PE
PCC
PI
IRE
R
ED
PE
RIR
E
DPE
PC
CPI
R
IR
PCC
PI
ED
PE
PCA
P R
IR
RIR
E
DPE
C
CPS
PC
CPI
R
IR
ED
PE
IRE
R
RIR
Peri
od
1993
-199
6 19
93-1
995
1993
-199
5 19
93-2
002
1993
-200
2 19
95-9
9-02
19
96-2
002
1993
-200
2 19
95-2
002
1995
-200
2 19
93-2
002
1994
-200
2 19
96-2
002
1993
-200
2 19
93-2
002
1997
-199
8 19
97-1
998
1995
-200
2 19
96-2
002
2002
19
93-2
002
2001
19
98-2
002
1999
-200
0 19
93-2
002
2001
-200
2 19
98-2
000
2002
20
00-2
002
Mod
e of
cor
rect
ion
Com
pute
d fr
om G
ross
Dom
esti
c In
vest
men
t T
ime
tren
d T
ime
tren
d SD
R I
ndex
SD
R I
ndex
A
vera
ge
Ave
rage
C
omm
erci
al B
ank
lend
ing
rate
A
vera
ge
Ave
rage
C
ompu
ted
from
CPI
SD
R
Ave
rage
C
omm
erci
al B
ank
lend
ing
rate
U
sed
2002
Est
imat
es
Com
pute
d fr
om C
PI
Tim
e T
rend
C
ompu
ted
from
CPI
A
vera
ge
Tim
e T
rend
C
omm
erci
al l
endi
ng r
ate
Tim
e tr
end
Tim
e tr
end
Tim
e tr
end
Com
pute
d fr
om C
PI
Tim
e tr
end
Tim
e tr
end
SDR
T
ime
tren
d

Dat
a T
reat
men
t A
ppen
dix
Con
t'd
Cou
ntry
L
esot
ho
Mad
agas
car
Mal
i M
auri
tani
a
Mau
ritiu
s
Moz
ambi
que
Nam
ibia
Nig
er
Rw
anda
Sao
Tom
e
Sier
ra L
eone
So
uth
Afr
ica
Suda
n
Var
iabl
es w
ith m
issi
ng o
bser
vatio
ns
PCC
PI
RIR
R
IR
IRE
R
IRE
R
ED
PE
RIR
IR
ER
R
IR
RIR
PC
AP
PCC
PI
IRE
R
ED
PE
TO
T
IRE
R
PCC
PI
RIR
C
CPS
PC
CPI
IR
ER
E
DPE
R
IR
PUIG
DP
ED
PE
PIG
DP
PUIG
DP
RIR
Peri
od
Mod
e of
cor
rect
ion
1997
-199
9 T
ime
tren
d 19
97-1
999
Com
mer
cial
Ban
k L
endi
ng r
ate
2000
-200
2 T
ime
tren
d 19
93-2
002
SDR
Ind
ex
1998
-200
2 SD
R
1999
-200
2 T
ime
tren
d 19
93 -2
002
Com
mer
cial
Ban
k le
ndin
g ra
te
1993
-200
2 SD
R
1999
-200
2 T
ime
tren
d 19
93
Tim
e tr
end
1993
-199
6 N
atio
nal
sour
ces
and
time
tren
d 19
99-2
000
1993
-200
2 C
ompu
ted
from
CPI
19
93-2
002
SDR
19
93-2
002
2000
-200
2 T
ime
tren
d 20
01-2
002
SDR
Ind
ex
1994
-199
5 19
84-9
4 pe
riod
ave
rage
and
mid
199
5 19
94-1
995
Tim
e tr
end
1993
-199
5 T
ime
tren
d 19
93-2
002
Com
pute
d fr
om C
PI
1993
-200
2 SD
R I
ndex
19
93-1
997
Tim
e tr
end
1993
-200
2 C
omm
erci
al B
ank
lend
ing
rate
19
93-1
997
Com
pute
d fr
om g
ross
dom
estic
inv
estm
ent
1993
T
ime
tren
d 19
93-1
996
Tim
e T
rend
19
93-1
998
Tim
e tr
end
1993
-200
2 C
omm
erci
al b
ank
depo
sit
rate

Dat
a T
reat
men
t A
ppen
dix
Con
t'd
Cou
ntry
Sw
azila
nd
Zam
bia
Zim
babw
e
Var
iabl
es w
ith m
issi
ng o
bser
vatio
ns
IRE
R
RIR
E
DPE
C
CPS
R
IR
PCA
P IR
ER
E
DPE
R
IR
PC
AP
Peri
od
1993
-200
2 20
02
1993
-199
6 19
93
1998
-200
2 19
99-2
002
1999
-200
2 19
95-2
002
2002
20
00-2
002
Mod
e of
Cor
rect
ion
SDR
Ind
ex
Tim
e tr
end
Tim
e tr
end
Tim
e tr
end
Tim
e tr
end
Tim
e tr
end
Tim
e tr
end
Ave
rage
T
ime
tren
d T
ime
tren
d
101

APPENDIX 4: EVIEWS ORIGINAL REGRESSION RESULTS
Equation 1 Neoclassical-civil liberties-seaport model
Dependent Variable: PIGDP Method: Panel Least Squares Date: 12/19/07 Time: 22:57 Sample (adjusted): 1994 2002 Cross-sections included: 43 Total panel (unbalanced) observations: 386
Variable
C RGDP(-1)
PCAP PUIGDP
RIR PCCPI TOT IRER EDPE
PIGDP(-1) SEADUM
CILIB
R-squared Adjusted R-squared S.E. of regression Sum squared resid Log likelihood Durbin-Watson stat
Coefficient
-0.130975 0.099929 0.000439 0.078590
-0.024860 0.000109
-0.006024 0.000678
-0.036054 0.769196 0.677733 0.643276
0.676584 0.667072 6.430481 15465.30
-1259.980 2.219720
Std. Error
1.907281 0.046746 0.000289 0.073692 0.022188 0.000294 0.005412 0.001029 0.024869 0.033774 0.725545 0.306333
t-Statistic
-0.068671 2.137714 1.518901 1.066461
-1.120417 0.370348
-1.113065 0.659229
-1.449756 22.77483 0.934102 2.099921
Mean dependent var S.D.dependentvar Akaike info criterion Schwarz criterion F-statistic Prob(F-statistic)
Prob.
0.9453 0.0332 0.1296 0.2869 0.2633 0.7113 0.2664 0.5102 0.1480 0.0000 0.3509 0.0364
13.52720 11.14470 6.590570 6.713550 71.12788 0.000000

APPENDIX 4: EVIEWS ORIGINAL REGRESSION RESULTS Equation 2 Neoclassical-political rights-war model
Dependent Variable: PIGDP Method: Panel Least Squares Date: 12/19/07 Time: 22:54 Sample (adjusted): 1994 2002 Cross-sections included: 43 Total panel (unbalanced) observations: 386
Variable
C RGDP(-1)
PCAP PUIGDP
RIR PCCPI TOT IRER EDPE
PIGDP(-1) WDUM PORIT
R-squared Adjusted R-squared S.E. of regression Sum squared resid Log likelihood Durbin-Watson stat
Coefficient
1.584404 0.102458 0.000378 0.057239
-0.028677 9.46E-05
-0.005293 0.000725
-0.027394 0.778268
-0.014808 0.320338
0.674408 0.664832 6.452082 15569.38
-1261.275 2.229832
Std. Error
1.565349 0.046874 0.000274 0.073212 0.022246 0.000295 0.005411 0.001033 0.025709 0.033758 0.987925 0.216442
t-Statistic
1.012173 2.185833 1.376949 0.781822
-1.289106 0.320110
-0.978122 0.702445
-1.065510 23.05466
-0.014989 1.480019
Mean dependent var S.D.dependentvar Akaike info criterion Schwarz criterion F-statistic Prob(F-statistic)
Prob.
0.3121 0.0294 0.1694 0.4348 0.1982 0.7491 0.3286 0.4828 0.2873 0.0000 0.9880 0.1397
13.52720 11.14470 6.597277 6.720257 70.42514 0.000000

APPENDIX 4: EVIEWS ORIGINAL REGRESSION RESULTS Equation 3 Neoclassical-civil liberties-seaport model
Dependent Variable: PIGDP Method: Panel Least Squares Date: 12/19/07 Time: 22:57 Sample (adjusted): 1994 2002 Cross-sections included: 43 Total panel (unbalanced) observations: 386
Variable
C RGDP(-1)
PCAP PUIGDP
RIR PCCPI TOT IRER EDPE
PIGDP(-1) SEADUM
CILIB
Coefficient
-0.130975 0.099929 0.000439 0.078590
-0.024860 0.000109
-0.006024 0.000678
-0.036054 0.769196 0.677733 0.643276
Std. Error
1.907281 0.046746 0.000289 0.073692 0.022188 0.000294 0.005412 0.001029 0.024869 0.033774 0.725545 0.306333
t-Statistic
-0.068671 2.137714 1.518901 1.066461
-1.120417 0.370348
-1.113065 0.659229
-1.449756 22.77483 0.934102 2.099921
Prob.
0.9453 0.0332 0.1296 0.2869 0.2633 0.7113 0.2664 0.5102 0.1480 0.0000 0.3509 0.0364
R-squared Adjusted R-squared S.E. of regression Sum squared resid Log likelihood Durbin-Watson stat
0.676584 Mean dependent var 13.52720 0.667072 S.D. dependentvar 11.14470 6.430481 Akaike info criterion 6.590570 15465.30 Schwarz criterion 6.713550
-1259.980 F-statistic 71.12788 2.219720 Prob(F-statistic) 0.000000

APPENDIX 4: EVIEWS ORIGINAL REGRESSION RESULTS Equation 4 Neoclassical-civil liberties-war model
Dependent Variable: PIGDP Method: Panel Least Squares Date: 12/19/07 Time: 22:45 Sample (adjusted): 1994 2002 Cross-sections included: 43 Total panel (unbalanced) observations: 386
Variable
C RGDP(-1)
PCAP PUIGDP
RIR PCCPI TOT IRER EDPE
PIGDP(-1) WDUM CILIB
R-squared Adjusted R-squared S.E. of regression Sum squared resid Log likelihood Durbin-Watson stat
Coefficient
0.098584 0.101938 0.000486 0.074792
-0.026267 0.000113
-0.005303 0.000732
-0.030184 0.771183
-0.266403 0.653070
0.675891 0.666359 6.437368 15498.45
-1260.393 2.219000
Std. Error
1.927873 0.046768 0.000286 0.073659 0.022216 0.000295 0.005398 0.001030 0.025676 0.034112 1.001243 0.330184
t-Statistic
0.051136 2.179637 1.699215 1.015385
-1.182343 0.384336
-0.982357 0.710252
-1.175551 22.60725
-0.266072 1.977898
Mean dependent var S.D.dependentvar Akaike info criterion Schwarz criterion F-statistic Prob(F-statistic)
Prob.
0.9592 0.0299 0.0901 0.3106 0.2378 0.7009 0.3266 0.4780 0.2405 0.0000 0.7903 0.0487
13.52720 11.14470 6.592711 6.715691 70.90304 0.000000

APPENDIX 4: EVIEWS ORIGINAL REGRESSION RESULTS Equation 5 McKinnon-political rights-seaport model
Dependent Variable: PIGDP Method: Panel Least Squares Date: 12/19/07 Time: 22:31 Sample (adjusted): 1994 2002 Cross-sections included: 43 Total panel (unbalanced) observations: 384
Variable
C RGDP(-1)
PCAP PUIGDP CCPS PCCPI TOT IRER EDPE
PIGDP(-1) SEADUM
PORIT
R-squared Adjusted R-squared S.E. of regression Sum squared resid Log likelihood Durbin-Watson stat
Coefficient
1.084606 0.102070 0.000327 0.067671 0.000323 -4.71 E-05 -0.004884 0.001064
-0.035697 0.775178 0.642124 0.329397
0.674237 0.664604 6.471075 15577.43
-1255.836 2.212828
Std. Error
1.559614 0.047096 0.000280 0.074076 0.000398 0.000438 0.005395 0.000976 0.027865 0.033891 0.729035 0.204664
t-Statistic
0.695432 2.167286 1.166250 0.913530 0.810914
-0.107584 -0.905196 1.089804
-1.281039 22.87285 0.880787 1.609452
Mean dependent var S.D. dependentvar Akaike info criterion Schwarz criterion F-statistic Prob(F-statistic)
Prob.
0.4872 0.0308 0.2443 0.3616 0.4179 0.9144 0.3659 0.2765 0.2010 0.0000 0.3790 0.1084
13.52474 11.17371 6.603313 6.726770 69.99388 0.000000
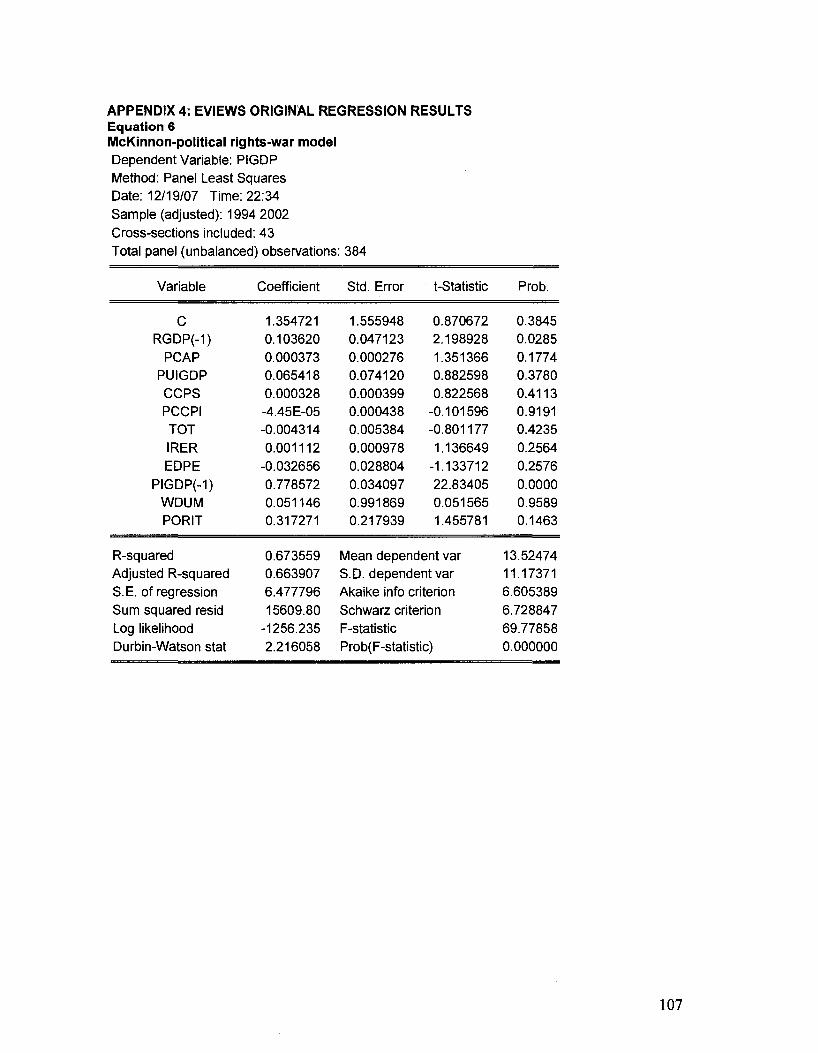
APPENDIX 4: EVIEWS ORIGINAL REGRESSION RESULTS Equation 6 McKinnon-political rights-war model Dependent Variable: PIGDP Method: Panel Least Squares Date: 12/19/07 Time: 22:34 Sample (adjusted): 1994 2002 Cross-sections included: 43 Total panel (unbalanced) observations: 384
Variable
C RGDP(-1)
PCAP PUIGDP CCPS PCCPI TOT IRER EDPE
PIGDP(-1) WDUM PORIT
R-squared Adjusted R-squared S.E. of regression Sum squared resid Log likelihood Durbin-Watson stat
Coefficient
1.354721 0.103620 0.000373 0.065418 0.000328 -4.45E-05 -0.004314 0.001112
-0.032656 0.778572 0.051146 0.317271
0.673559 0.663907 6.477796 15609.80
-1256.235 2.216058
Std. Error
1.555948 0.047123 0.000276 0.074120 0.000399 0.000438 0.005384 0.000978 0.028804 0.034097 0.991869 0.217939
t-Statistic
0.870672 2.198928 1.351366 0.882598 0.822568
-0.101596 -0.801177 1.136649
-1.133712 22.83405 0.051565 1.455781
Mean dependent var S.D. dependentvar Akaike info criterion Schwarz criterion F-statistic Prob(F-statistic)
Prob.
0.3845 0.0285 0.1774 0.3780 0.4113 0.9191 0.4235 0.2564 0.2576 0.0000 0.9589 0.1463
13.52474 11.17371 6.605389 6.728847 69.77858 0.000000

APPENDIX 4: EVIEWS ORIGINAL REGRESSION RESULTS Equation 7 McKinnon-civil liberties- seadum model Dependent Variable: PIGDP Method: Panel Least Squares Date: 12/19/07 Time: 22:38 Sample (adjusted): 1994 2002 Cross-sections included: 43 Total panel (unbalanced) observations: 384
Variable
C RGDP(-1)
PCAP PUIGDP CCPS PCCPI TOT IRER EDPE
PIGDP(-1) SEADUM
CILIB
R-squared Adjusted R-squared S.E. of regression Sum squared resid Log likelihood Durbin-Watson stat
Coefficient
-0.530991 0.101448 0.000446 0.093283 0.000393
-0.000106 -0.005201 0.000986
-0.044841 0.766591 0.717716 0.690125
0.676360 0.666790 6.449948 15475.88
-1254.580 2.203884
Std. Error
1.866726 0.046943 0.000290 0.074893 0.000398 0.000437 0.005381 0.000973 0.028286 0.034223 0.728171 0.307153
t-Statistic
-0.284450 2.161101 1.541095 1.245553 0.989285
-0.241798 -0.966447 1.013315
-1.585276 22.39976 0.985643 2.246846
Mean dependent var S.D. dependentvar Akaike info criterion Schwarz criterion F-statistic Prob(F-statistic)
Prob.
0.7762 0.0313 0.1241 0.2137 0.3232 0.8091 0.3344 0.3116 0.1138 0.0000 0.3249 0.0252
13.52474 11.17371 6.596772 6.720230 70.67508 0.000000

APPENDIX 4: EVIEWS ORIGINAL REGRESSION RESULTS Equation 8 MCKINNON CILIB AND WDUM MODEL Dependent Variable: PIGDP Method: Panel Least Squares Date: 12/19/07 Time: 22:40 Sample (adjusted): 1994 2002 Cross-sections included: 43 Total panel (unbalanced) observations: 384
Variable Coefficient Std. Error t-Statistic Prob.
c RGDP(-1)
PCAP PUIGDP CCPS PCCPI TOT IRER EDPE
PIGDP(-1) WDUM CILIB
-0.309242 0.103579 0.000497 0.089732 0.000405
-0.000104 -0.004388 0.001064
-0.038764 0.768751
-0.275270 0.701381
1.896729 0.046976 0.000287 0.074889 0.000399 0.000438 0.005367 0.000975 0.028825 0.034598 1.007140 0.332506
-0.163040 2.204921 1.733360 1.198193 1.015079
-0.237183 -0.817589 1.091710
-1.344821 22.21983
-0.273318 2.109379
0.8706 0.0281 0.0839 0.2316 0.3107 0.8126 0.4141 0.2757 0.1795 0.0000 0.7848 0.0356
R-squared 0.675580 Mean dependent var 13.52474 Adjusted R-squared 0.665987 S.D. dependent var 11.17371 S.E. of regression 6.457716 Akaike info criterion 6.599180 Sum squared resid 15513.18 Schwarz criterion 6.722637 Log likelihood -1255.043 F-statistic 70.42383 Durbin-Watson stat 2.202310 Prob(F-statistic) 0.000000

APPENDIX 4: EVIEWS ORIGINAL REGRESSION RESULTS Equation 9 Macroeconomic-political rights model of private investment Dependent Variable: PIGDP Method: Panel Least Squares Date: 12/28/07 Time: 20:35 Sample (adjusted): 1994 2002 Cross-sections included: 43 Total panel (unbalanced) observations: 384
Variable
C RGDP(-1)
PCAP PUIGDP
RIR CCPS PCCPI TOT IRER EDPE
PIGDP(-1) PORIT
R-squared Adjusted R-squared S.E. of regression Sum squared resid Log likelihood Durbin-Watson stat
Coefficient
1.641216 0.103622 0.000373 0.062193
-0.025479 0.000202 -6.25E-05 -0.005177 0.000732
-0.033787 0.776275 0.318589
0.674617 0.664995 6.467298 15559.25
-1255.612 2.228862
Std. Error
1.555338 0.047033 0.000275 0.074041 0.023151 0.000414 0.000438 0.005410 0.001034 0.027607 0.033734 0.204342
t-Statistic
1.055215 2.203178 1.354423 0.839973
-1.100589 0.486832
-0.142709 -0.956854 0.707377
-1.223880 23.01148 1.559093
Mean dependent var S.D. dependentvar Akaike info criterion Schwarz criterion F-statistic Prob(F-statistic)
Prob.
0.2920 0.0282 0.1764 0.4015 0.2718 0.6267 0.8866 0.3393 0.4798 0.2218 0.0000 0.1198
13.52474 11.17371 6.602145 6.725603 70.11517 0.000000

APPENDIX 4: EVIEWS ORIGINAL REGRESSION RESULTS Equation 10 Macroeconomic-civil liberties model of private investment Dependent Variable: PIGDP Method: Panel Least Squares Date: 12/28/07 Time: 20:40 Sample (adjusted): 1994 2002 Cross-sections included: 43 Total panel (unbalanced) observations: 384
Variable
C RGDP(-1)
PCAP PUIGDP
RIR CCPS PCCPI TOT IRER EDPE
PIGDP(-1) CILIB
R-squared Adjusted R-squared S.E. of regression Sum squared resid Log likelihood Durbin-Watson stat
Coefficient
0.193532 0.103281 0.000483 0.084152
-0.021318 0.000289
-0.000113 -0.005254 0.000728
-0.041471 0.769320 0.639387
0.676250 0.666677 6.451045 15481.14
-1254.646 2.217942
Std. Error
1.876039 0.046914 0.000286 0.075027 0.023195 0.000415 0.000438 0.005397 0.001032 0.027982 0.769320 0.307628
t-Statistic
0.103160 2.201474 1.687141 1.121620
-0.919070 0.696219
-0.258959 -0.973543 0.706118
-1.482044 22.60894 2.078441
Mean dependent var S.D.dependentvar Akaike info criterion Schwarz criterion F-statistic Prob(F-statistic)
Prob.
0.9179 0.0283 0.0924 0.2627 0.3587 0.4867 0.7958 0.3309 0.4806 0.1392 0.0000 0.0384
13.52474 11.17371 6.597112 6.720570 70.63955 0.000000

APPENDIX 4: EVIEWS ORIGINAL REGRESSION RESULTS Equation 11 Macroeconomic-political rights model of private investment-Fixed effects estimation Dependent Variable: PIGDP Method: Panel Least Squares Date: 12/28/07 Time: 20:44 Sample (adjusted): 1994 2002 Cross-sections included: 43 Total panel (unbalanced) observations: 384
Variable
C RGDP(-1)
PCAP PUIGDP
RIR CCPS PCCPI TOT IRER EDPE
PIGDP(-1) PORIT
Coefficient
12.40541 0.080417
-0.004673 0.016498 0.033182 0.000554
-0.000370 -0.006804 0.000274
-0.026681 0.489658
-0.214106
Std. Error
3.397219 0.051405 0.002561 0.128931 0.033163 0.000650 0.000536 0.005656 0.001082 0.051212 0.051525 0.422125
t-Statistic
3.651636 1.564383
-1.825059 0.127962 1.000564 0.852485
-0.690704 -1.203005 0.252822
-0.520985 9.503234
-0.507211
Prob.
0.0003 0.1187 0.0689 0.8983 0.3178 0.3946 0.4902 0.2299 0.8006 0.6027 0.0000 0.6124
Effects Specification
Cross-section fixed (dummy variables) Period fixed (dummy
R-squared Adjusted R-squared S.E. of regression Sum squared resid Log likelihood Durbin-Watson stat
variables)
0.737513 0.687787 6.243423 12551.66
-1214.370 1.925444
Mean dependent var S.D.dependentvar Akaike info criterion Schwarz criterion F-statistic Prob(F-statistic)
13.52474 11.17371 6.647760 7.285624 14.83159 0.000000

APPENDIX 4: EVIEWS ORIGINAL REGRESSION RESULTS Equation 12 Macroeconomic and civil rights model of private investment: Fixed effects estimation Dependent Variable: PIGDP Method: Panel Least Squares Date: 12/28/07 Time: 20:50 Sample (adjusted): 1994 2002 Cross-sections included: 43 Total panel (unbalanced) observations: 384
Variable
C RGDP(-1)
PCAP PUIGDP
RIR CCPS PCCPI TOT IRER EDPE
PIGDP(-1) CILIB
Coefficient
11.85834 0.079335
-0.004656 0.015346 0.031230 0.000540
-0.000364 -0.006769 0.000249
-0.024317 0.490238
-0.104197
Std. Error
4.288392 0.051467 0.002571 0.128962 0.032946 0.000650 0.000536 0.005659 0.001083 0.051007 0.051531 0.705479
t-Statistic
2.765218 1.541479
-1.811299 0.118993 0.947898 0.831191
-0.680132 -1.196171 0.230133
-0.476744 9.513406
-0.147697
Prob.
0.0060 0.1242 0.0710 0.9054 0.3439 0.4065 0.4969 0.2325 0.8181 0.6339 0.0000 0.8827
Effects Specification
Cross-section fixed (dummy variables) Period fixed (dummy variables)
R-squared Adjusted R-squared S.E. of regression Sum squared resid Log likelihood Durbin-Watson stat
0.737321 0.687559 6.245705 12560.84
-1214.510 1.926259
Mean dependent var S.D.dependentvar Akaike info criterion Schwarz criterion F-statistic Prob(F-statistic)
13.52474 11.17371 6.648491 7.286355 14.81690 0.000000

APPENDIX 4: EVIEWS ORIGINAL REGRESSION RESULTS Equation 13 Macroeconomic-political rights model of private investment: Random effects estimation Dependent Variable: PIGDP Method: Panel EGLS (Cross-section random effects) Date: 12/28/07 Time: 20:54 Sample (adjusted): 1994 2002 Cross-sections included: 43 Total panel (unbalanced) observations: 384 Swamy and Arora estimator of component variances
Variable Coefficient Std. Error t-Statistic Prob.
c RGDP(-1)
PCAP PUIGDP
RIR CCPS PCCPI TOT IRER EDPE
PIGDP(-1) PORIT
1.641216 0.103622 0.000373 0.062193
-0.025479 0.000202 -6.25E-05 -0.005177 0.000732
-0.033787 0.776275 0.318589
1.499257 0.045337 0.000265 0.071372 0.022316 0.000399 0.000422 0.005215 0.000997 0.026611 0.032518 0.196974
1.094686 2.285589 1.405086 0.871392
-1.141757 0.505042
-0.148047 -0.992646 0.733836
-1.269660 23.87223 1.617412
0.2744 0.0228 0.1608 0.3841 0.2543 0.6138 0.8824 0.3215 0.4635 0.2050 0.0000 0.1066
Cross-section random Idiosyncratic random
Effects Specification S.D.
0.000000 6.234108
Rho
0.0000 1.0000
Weighted Statistics
R-squared 0.674617 Mean dependent var 13.52474 Adjusted R-squared 0.664995 S.D. dependent var 11.17371 S.E. of regression 6.467298 Sum squared resid 15559.25 F-statistic 70.11517 Durbin-Watson stat 2.228862 Prob(F-statistic) 0.000000
Unweighted Statistics
R-squared 0.674617 Mean dependent var 13.52474 Sum squared resid 15559.25 Durbin-Watson stat 2.228862

APPENDIX 4: EVIEWS ORIGINAL REGRESSION RESULTS Equation 14 Macroeconomic-civil liberties model of private investment-Random effects estimation Dependent Variable: PIGDP Method: Panel EGLS (Cross-section random effects) Date: 12/28/07 Time: 20:58 Sample (adjusted): 1994 2002 Cross-sections included: 43 Total panel (unbalanced) observations: 384 Swamy and Arora estimator of component variances
Variable Coefficient Std. Error t-Statistic Prob.
c RGDP(-1)
PCAP PUIGDP
RIR CCPS PCCPI TOT IRER EDPE
PIGDP(-1) CILIB
0.193532 0.103281 0.000483 0.084152
-0.021318 0.000289
-0.000113 -0.005254 0.000728
-0.041471 0.769320 0.639387
1.812651 0.045329 0.000276 0.072492 0.022412 0.000401 0.000423 0.005215 0.000997 0.027037 0.032878 0.297234
0.106767 2.278459 1.746140 1.160843
-0.951209 0.720566
-0.268015 -1.007588 0.730811
-1.533871 23.39957 2.151124
0.9150 0.0233 0.0816 0.2465 0.3421 0.4716 0.7888 0.3143 0.4654 0.1259 0.0000 0.0321
Cross-section random Idiosyncratic random
Effects Specification S.D.
0.000000 6.233075
Rho
0.0000 1.0000
Weighted Statistics
R-squared 0.676250 Mean dependent var 13.52474 Adjusted R-squared 0.666677 S.D. dependent var 11.17371 S.E. of regression 6.451045 Sum squared resid 15481.14 F-statistic 70.63955 Durbin-Watson stat 2.217942 Prob(F-statistic) 0.000000
Unweighted Statistics
R-squared 0.676250 Mean dependent var 13.52474 Sum squared resid 15481.14 Durbin-Watson stat 2.217942

116