Embed Size (px)
Citation preview
125
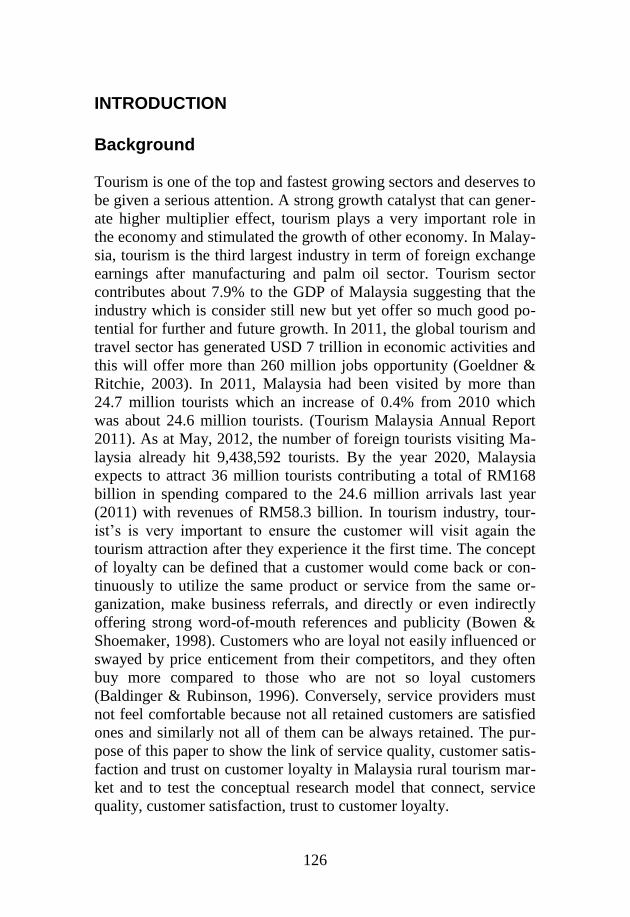
AN EMPIRICAL STUDY OF DIRECT RELATIONSHIP OF SERVICE QUALITY, CUSTOMER SATISFACTION AND CUSTOMER TRUST ON CUSTOMER LOYALTY
IN MALAYSIAN RURAL TOURISM
Zahir Osman
Faculty of Business Management & Globalization
Limkokwing University of Creative Technology
MALAYSIA
Corresponding email: [email protected]
ABSTRACT
The purpose of this study is to develop a direct effect understanding
of service quality, customer satisfaction and trust on customer loy-
alty in Malaysia rural tourism. The Structural Equation Model
(SEM) used to analyze the casual relationships between independent
variables and dependent variable. The model was developed and
later tested by adopting the Partial Least Square (PLS) procedure
on data collected from a survey that yielded 295 usable question-
naires. The findings showed that service quality, customer satisfac-
tion and trust have significant and positive influence on customer
loyalty in Malaysia rural tourism. It is important to do the study uti-
lizing experimental design by capturing longitudinal data in Malay-
sia rural tourism industry using robust measures. The findings im-
ply that the relationship of service quality, satisfaction and trust on
customer loyalty will lead to rural tourism operators’ profitability.
This research is one of the first known attempts to use PLS to test a
direct effect.
Keywords: rural tourism, service quality, customer satisfaction,
customer trust, customer loyalty
Journal of Tourism, Hospitality & Culinary Arts Vol. 5 Issue 1
ISSN 1985-8914
©2013 Faculty of Hotel and Tourism Management, Universiti Teknologi MARA (UiTM),
Malaysia
126
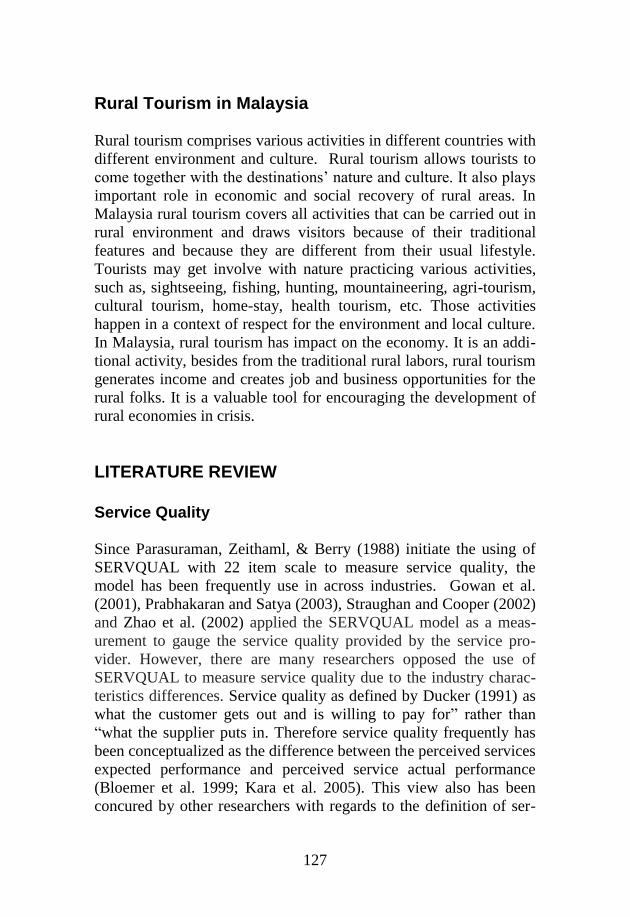
INTRODUCTION
Background
Tourism is one of the top and fastest growing sectors and deserves to
be given a serious attention. A strong growth catalyst that can gener-
ate higher multiplier effect, tourism plays a very important role in
the economy and stimulated the growth of other economy. In Malay-
sia, tourism is the third largest industry in term of foreign exchange
earnings after manufacturing and palm oil sector. Tourism sector
contributes about 7.9% to the GDP of Malaysia suggesting that the
industry which is consider still new but yet offer so much good po-
tential for further and future growth. In 2011, the global tourism and
travel sector has generated USD 7 trillion in economic activities and
this will offer more than 260 million jobs opportunity (Goeldner &
Ritchie, 2003). In 2011, Malaysia had been visited by more than
24.7 million tourists which an increase of 0.4% from 2010 which
was about 24.6 million tourists. (Tourism Malaysia Annual Report
2011). As at May, 2012, the number of foreign tourists visiting Ma-
laysia already hit 9,438,592 tourists. By the year 2020, Malaysia
expects to attract 36 million tourists contributing a total of RM168
billion in spending compared to the 24.6 million arrivals last year
(2011) with revenues of RM58.3 billion. In tourism industry, tour-
ist’s is very important to ensure the customer will visit again the
tourism attraction after they experience it the first time. The concept
of loyalty can be defined that a customer would come back or con-
tinuously to utilize the same product or service from the same or-
ganization, make business referrals, and directly or even indirectly
offering strong word-of-mouth references and publicity (Bowen &
Shoemaker, 1998). Customers who are loyal not easily influenced or
swayed by price enticement from their competitors, and they often
buy more compared to those who are not so loyal customers
(Baldinger & Rubinson, 1996). Conversely, service providers must
not feel comfortable because not all retained customers are satisfied
ones and similarly not all of them can be always retained. The pur-
pose of this paper to show the link of service quality, customer satis-
faction and trust on customer loyalty in Malaysia rural tourism mar-
ket and to test the conceptual research model that connect, service
quality, customer satisfaction, trust to customer loyalty.
127
Rural Tourism in Malaysia
Rural tourism comprises various activities in different countries with
different environment and culture. Rural tourism allows tourists to
come together with the destinations’ nature and culture. It also plays
important role in economic and social recovery of rural areas. In
Malaysia rural tourism covers all activities that can be carried out in
rural environment and draws visitors because of their traditional
features and because they are different from their usual lifestyle.
Tourists may get involve with nature practicing various activities,
such as, sightseeing, fishing, hunting, mountaineering, agri-tourism,
cultural tourism, home-stay, health tourism, etc. Those activities
happen in a context of respect for the environment and local culture.
In Malaysia, rural tourism has impact on the economy. It is an addi-
tional activity, besides from the traditional rural labors, rural tourism
generates income and creates job and business opportunities for the
rural folks. It is a valuable tool for encouraging the development of
rural economies in crisis.
LITERATURE REVIEW
Service Quality
Since Parasuraman, Zeithaml, & Berry (1988) initiate the using of
SERVQUAL with 22 item scale to measure service quality, the
model has been frequently use in across industries. Gowan et al.
(2001), Prabhakaran and Satya (2003), Straughan and Cooper (2002)
and Zhao et al. (2002) applied the SERVQUAL model as a meas-
urement to gauge the service quality provided by the service pro-
vider. However, there are many researchers opposed the use of
SERVQUAL to measure service quality due to the industry charac-
teristics differences. Service quality as defined by Ducker (1991) as
what the customer gets out and is willing to pay for” rather than
“what the supplier puts in. Therefore service quality frequently has
been conceptualized as the difference between the perceived services
expected performance and perceived service actual performance
(Bloemer et al. 1999; Kara et al. 2005). This view also has been
concured by other researchers with regards to the definition of ser-
128
vice quality (Grönroos, 2001; Parasuraman et al., 1988). In some
earlier studies, service quality has been defined to the extent where
the service fulfills the needs or expectation of the customers (Lewis
& Mitchell, 1990; Dotchin & Oakland, 1994). Zeithaml et al. (1996)
has conceptualized service quality as the overall impression of cus-
tomers towards the service weakness or supremacy. Service quality
frequently relies on SERVQUAL instrument to gauge the service
quality provided to the customers. The SERVQUAL scale was de-
veloped in the marketing context and this was supported by the
Marketing Science Institute (Parasuraman, Zeithaml et al. 1986).
Previous research confirms that SERVQUAL instruments is appli-
cable in tourism industry (Yuan et. al, 2005; Sohail et al, 2007).
Parasuraman et. al (1988) stated the five dimensions of service qual-
ity are reliability, responsiveness, tangible, assurance and empathy.
These dimensions have specific service characteristic link to the ex-
pectation of customers
Customer Satisfaction
Customer satisfaction is one the most areas being researched in
many tourism studies due to its importance in determining the suc-
cess and the continued existence of the tourism business (Gursoy,
Mc Cleary and Lepsito, 2007). Customer satisfaction conceptually
has been defined as feeling of the post utilization that the consumers
experience from their purchase (Westbrook and Oliver, 1991; Um et
al., 2006). Opposite to cognitive focus of perceptions, customer sat-
isfaction is deemed as affective response to a products or services
(Yuan and Jang, 2008). In tourism studies, customer satisfaction is
the visitor’s state of emotion after they experiencing their tour
(Baker and Crompton, 2000; Sanchez et al., 2006). Destination holi-
day’s customer satisfaction is the extent of overall enjoyment that
the tourists feel, the result that the tour experience able to fulfill the
tourists’ desires, expectation, needs and wants from the tour (Chen
and Tsai, 2007). Kotler, (2008) describes customer satisfaction is the
feeling of happiness or unhappiness as a result of comparing the per-
ceived performance of services or products with the expected per-
formance. If the perceived performance does not meet the expected
performance, then the customer will feel disappointed or dissatisfied.
Homburg et al. (2008) suggested that customer satisfaction has been
129
a crucial issue in marketing field in the past decades since satisfied
customers are able to offer to the company such as customer loyalty
and continuous profitability.
Trust
In the current study, trust has been defined as a tourists’ willingness
to rely on tourist attraction operator’s ability to deliver what has
been promised and meet or exceed the expectation of the tourists
which has been built around of the knowledge about the tourist at-
traction. A trusted tourist attraction has a strong advantage over the
other tourist attraction which is an alternative in the tourist’s deci-
sion making process. In tourism studies, Loureiro and Gonzalez
(2008) showed empirical evidence that tourists’ trust has a strong
influence on their loyalty toward rural lodging.
According to Lau & Lee, (1999) if one party has trust in another
party, it will produce positive behavioral intentions towards the other
party. Trust has influence on credibility and credibility will eventu-
ally has impact on the customer’s long-term orientation by decreas-
ing the risk perception linked to the opportunistic behavior of the
business (Erdem et al., 2002; Ganesan, 1994). To be specific, trust
minimizes customer’s uncertainty feelings where customer feels at
risk because they know that they can rely on the service provider
(Chaudhuri and Holbrook, 2001). San Martin Gutierrez (2000) de-
scribes trust the emotional security that made one party to think that
another party is responsible and concern about it. This gives the un-
derstanding that the former is ready to be at risk to the actions of the
second party regardless its ability to control the later.
Customer Loyalty
The concept of customer loyalty has been researched for the past
decades in business industries. Loyalty is a commitment of current
customer in respect to a particular store, brand and service provider,
when there are other alternatives that the current customer can
choose for (Shankar, Smith & Rangaswamy, 2003). It forms positive
attitudes by producing repetitive purchasing behavior from time to
time. There is a strong connection customer loyalty and firm’s profit.
130
Zeithaml, (2000), states that previous researches look at customer
loyalty as being either attitudinal or behavioral. The behavioral per-
spective the customer is loyal as long as they continue to purchase
and use the goods or services (Woodside et al., 1989; Parasuraman
et al., 1988; Zeithaml et al., 1996). Reicheld (2003) suggested that
the most superior evidence of the customer loyalty is the proportion
amount in percentage of current customers who are having lots of
enthusiasm to recommend a specific good or service to their friends.
Whereas the attitudinal perspective, the current customers have a
feeling of belongings to a specific product or service or commitment
of the current customers towards a specific good or service. Bau-
mann, Burton & Elliot, (2005) found that Day (1969) had introduced
the concept of customer loyalty covering both behavioral and attitu-
dinal dimensions forty years ago.
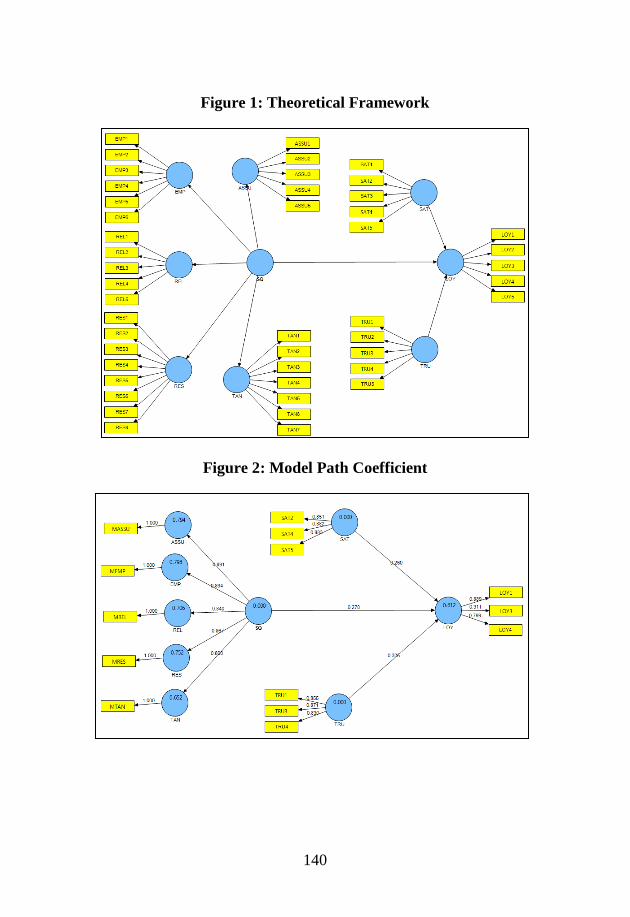
RESEARCH MODEL AND HYPOTHESES
Research Model
Tourist attraction operators are keen to know how customer satis-
faction can lead to customer trust and eventually create customer
loyalty for the tourists. The research applies the research model by a
few authors mostly Parasuraman et. al (1985), Bitner & Zeithaml
(2003) and Morgan & Hunt (1994). The conceptual model of this
study is illustrated in Figure 1.
Hypothesis
Relationship between Service Quality and Customer Loyalty
Many researchers in various studies have studied the relationship
between service quality and customer loyalty. Rousan, Ramzi &
Mohamed, (2010) in their study on 322 hotel guests of hotel industry
in Jordon, they found that empathy, reliability, responsiveness, tan-
gible and assurance significantly predict customer loyalty. The sim-
ilar result also found in Chen & Lee (2008) study when the revealed
that service quality has strong and significant relationship with cus-
131
tomer loyalty in their International Logistic provider industry. Liang
(2008) study on 308 hotel guests of hotel industry in United Stated
revealed that service quail has a positive influence and significant
relationship with customer loyalty. Clottey, Collier & Collier, (2008)
in their study of 972 retail customers of United States retail industry
have found the strong statistical evidence that service quality has a
great influence where it positively and significantly correlated with
customer loyalty. Jamal & Anatassiadou (2007) besides studying the
relationship between service quality and customer satisfaction in
banking industry in Greece, they also study the relationship between
service quality and customer loyalty and they found their study that
service quality has a strong impact and positively and significantly
related to customer loyalty in banking industry in Greece. Rizan
(2010) has conducted a study on 160 airline passengers of airline
industry in Indonesia and has found that service quality has a strong
impact and positively and significantly related to service quality.
Kheng, Mahamad, Ramayah & Mosahab, (2010) in their study on
238 bank customers in Malaysia have found that among the five di-
mensions used in service quality, tangible has no significant impact
on loyalty. Reliability is found to have positive relationship with
customer loyalty. Relationship between responsiveness and cus-
tomer loyalty is insignificant. Empathy has significant positive rela-
tionship with customer loyalty. There is significant relationship be-
tween assurance and customer loyalty.. In view of that we hypothe-
size:
H1: There is a positive relationship between service quality and
customer loyalty
Relationship between Customer Satisfaction and Customer Loyalty
The survival and sustainability of any business organization is
largely depends on the customer satisfaction and customer loyalty.
Faullant, Matzler, & Ller (2008) in their study on 6172 ski resort
customers in Australia have found that customer satisfaction is posi-
tively and significantly correlated to customer loyalty. Pantouvakis
& Lymperopoulos (2008) have done the study on 388 ferry passen-
gers in Creece and revealed that customer satisfaction has great im-
132
pact on customer loyalty and positively and significantly correlated
with customer loyalty. Akhbar & Parvez (2009) in their study on 302
Telecommunication customers in Bangladesh have found that cus-
tomer satisfaction is significantly and positively related to customer.
Hume & Mort (2010) conducted a study on 250 performing arts
members and audience and have found that customer satisfaction
very much has impact on customer loyalty and positively and sig-
nificantly related. Chen & Lee (2008) in their study on 261 non Ves-
sel Owners and shippers in Taiwan’s International Logistic Provider
industry has revealed that customer satisfaction is very critical to
customer loyalty and both are positively and significant correlated.
Rizan (2010) studied on customer satisfaction and customer loyalty
relationship on 160 passengers in airline industry in Indonesia and
have found that customer satisfaction has a great impact on customer
loyalty and positively and significantly influence customer loyalty.
The same result found by Liang (2008) in her study on 308 Hotel
guests in United States where she found that customer satisfaction is
the determining factor and positively and significant correlated to
customer loyalty. Therefore, we hypothesize:
H2: There is a positive relationship between customer satisfaction
and customer loyalty
Relationship between Trust and Customer Loyalty
There are quite a number of researches have been done and found
the importance of trust as an antecedent to customer loyalty. Akhbar
& Parvez (2009) in their study on 302 Telecommunication custom-
ers in Bangladesh telecommunication industry have revealed that
trust has a strong impact and significantly and positively correlated
with customer loyalty. Liang (2008) has done a research on 308
Hotel guests in hotel industry in United States has revealed the im-
portance of trust in determining customer loyalty in hotel industry.
She found there is a strong impact of trust on customer loyalty where
trust is significantly and positively correlated. Luarn & Lin (2003)
has revealed the importance of trust as an antecedent to customer
loyalty in their study on 180 Tourists in Taiwan tourism industry.
They found that trust has a stronger relationship after commitment
and customer satisfaction. The relationship is also positively and
133
significantly correlated. Horppu et. al (2008) in their study on 867
Website magazine consumer in Finland have found that trust on the
web site level are determinant of web site loyalty where the relation-
ship is positively and significantly correlated. Kassim & Abdullah
(2010) in their study on 357 E-services customer in Malaysia and
Qatar e-commerce industry have revealed that trust has a strong in-
fluence on customer loyalty where it is positively and significantly
correlated. Ribbink Riel, Veronica Liljander and Streukens, (2004)
in their study on 350 Online customers in Europe e-commerce in-
dustry have also found the importance and strong impact of trust on
customer loyalty. The relationship also shows the positive and sig-
nificant relationship of both. Therefore, we hypothesize:
H3: There is a positive relationship between trust and customer
loyalty
METHODOLOGY
Survey Instrument
A total of 46 observed variables constitute the measurement of ex-
ogenous independent variable of service quality dimensions of re-
sponsiveness (8 items), tangible (7 items), empathy (6 items), as-
surance (5 items) and reliability (5 items) adapted and altered from
Parasuraman et al. (1985), customer satisfaction (5 items) and trust
(5 items). The endogenous variable of customer loyalty consists of 5
items. The scaling applied in this study is the 5-point Likert scale of
1-strongly agree, 2-agree, 3-meutral, 4-disagree and 5-strongly disa-
gree. The demographics variables questioned are gender, age, status,
place of origin, race, occupation, annual income, and education
background of the respondents.
Sample
Local and foreign tourists who have visited the rural tourism spot in
Malaysia at least once were the main respondents. A total of 410
rural tourism spot tourists were requested to complete a question-
naire that contained measures of the construct. The questionnaires
134
were distributed to the respondents in Klang Valley through email
and on the spot by using convenient sampling technique. Out of the
410 distributed questionnaires, 329 were returned. This made up the
response rate of 80.24%. In view of that, the rate of response is suf-
ficient for SEM analysis. The Mahalanobis distance was determined
based on a total of 31 observed variables. The criterion of p<0.01
and critical value of χ2= 86.40 is applied. The test conducted identi-
fied 34 cases with Mahalanobis value (D2) above 86.40. The
mahalanobis analysis successfully in indentifying the multivariate
outliers which were deleted permanently, leaving 295 datasets to be
used for further analysis
Data Analysis
Partial Least Squares (PLS) (Chin, 1998a, b, 2001) was adopted to
assess the models. PLS is a second generation structural equation
modeling (SEM) technique developed by Wold (1982). It works fine
with structural equation models that have latent variables and a se-
ries of cause-and-effect relationships (Gustafsson and Johnson,
2004). PLS has three main advantages over other SEM techniques
that make it suitable to this study. First, in PLS, constructs may be
gauged by only one item whereas in covariance-based techniques,
minimum of four questions per construct are required. Second, in
many marketing studies, data tend to be distributed non- normally (it
is noted that mostly ten-item scales were employed to reduce a neg-
ative impact of non-normality), and PLS does not need any normal-
ity assumptions and handles non-normal distributions relatively
well.
The partial least square (PLS) technique was utilized to study the
results in order to evaluate the influence of all constructs in the
framework at the same time, inclusive the second order construct
(service quality). Gudergan et al. (2008) depict PLS as being a sus-
tainable technique to evaluate cause and effect relationships in intri-
cate business research. Hwang et al. (2007) describe that the PLS
technique is specifically applicable in the contect where there is in-
sufficiently robust and well structured theories. The PLS approach is
capable to assist in obtaining values for latent variables for predic-
tive reasons. PLS never attempt to use the model to explain the co-
135
variance of all indicators, but it reduces the variance of all dependent
variables, based on the obtained estimated parameters which are
based on the ability to reduce the dependent variables residual vari-
ance (Chin, 1988). Lastly, the software utilized was the SmartPLS
2.0 (Ringle et al., 2005).
RESULTS
Model Measurement
Partial least squares (PLS), SmartPLS to be précised, were adopted
to evaluate the measurement sufficiency models and the inner model
predictive relevance, and thus test the three hypotheses. PLS empha-
sizes on the variance explanation using ordinal least squares, a tech-
nique appropriate for relationship such as mentioned in this study
(Gudergan et al., 2008). The sufficiency and reflective outer-meas-
urement models significance for the other constructs were evaluated
through a range of indices test comprising of individual indicator
weights and loadings, composite reliability, average variance ex-
plained (AVE), bootstrap t-statistic (critical ratio), discriminant va-
lidity and convergent validity. In addition to that, the significance of
reflective outer-measurement model was evaluated by calculating
bootstrapped critical ratio of t-values. The sampling with replace-
ment bootstrapping technique was utilized to gauge the reflective
outer-measurement models accuracy. For this study purpose, boot-
strap t-values were calculated on the basis of 500 bootstrapping runs,
with sub-samples set at 70 per cent of the number of cases in each
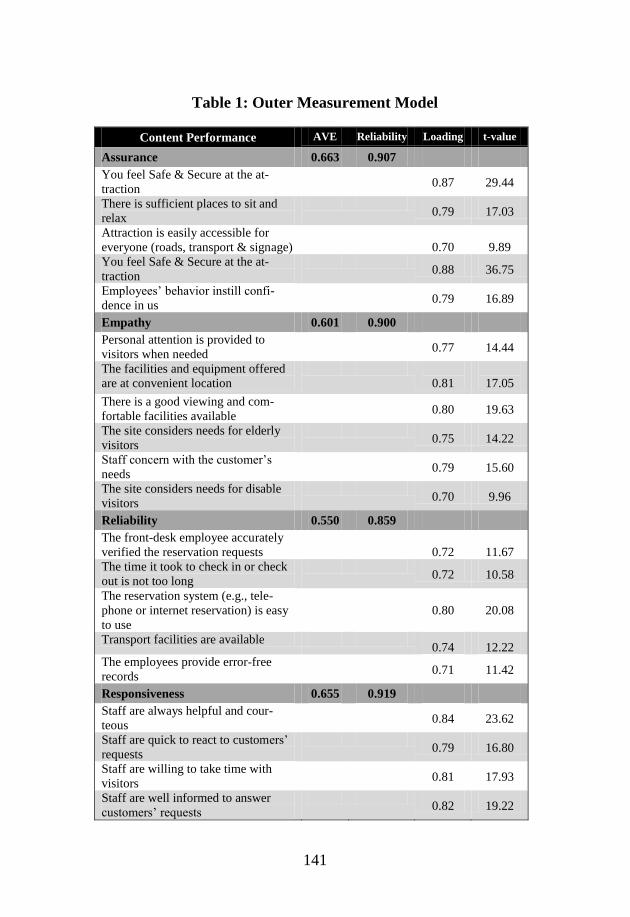
data set. As revealed in Table I, the reflective outer-measurement
models established acceptable bootstrap critical ratios complying
with the recommended benchmarks of 1.96.
Convergent validity
The adequacy of outer-measurement models convergent validity was
evaluated by computing composite reliability (Hulland, 1999). The
analysis for convergent validity results confirmed that the outer-
mesurement models and their first-order factors in line with
Nunnally’s (1978) reliability criteria, 0.70. As shown in Table 1, the
136
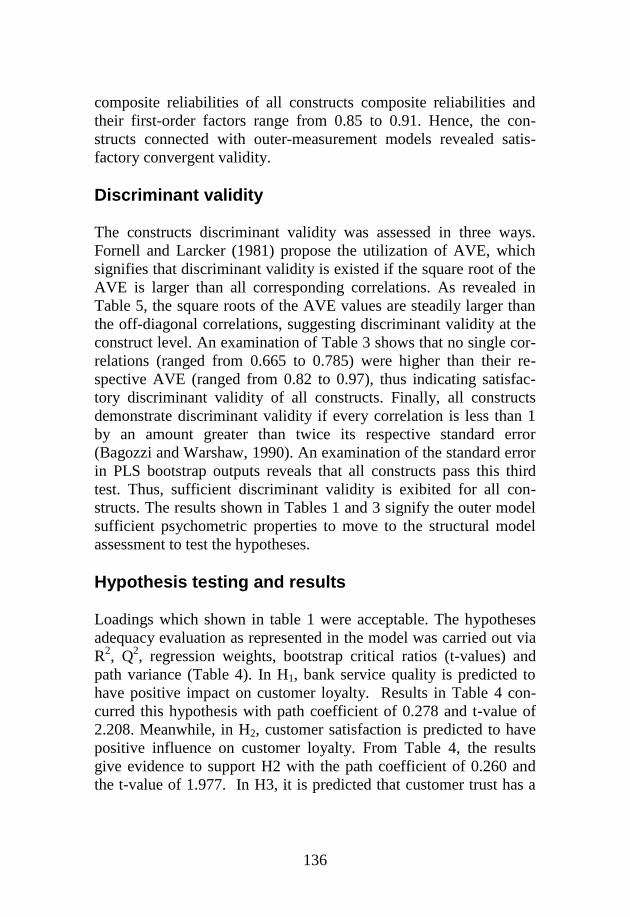
composite reliabilities of all constructs composite reliabilities and
their first-order factors range from 0.85 to 0.91. Hence, the con-
structs connected with outer-measurement models revealed satis-
factory convergent validity.
Discriminant validity
The constructs discriminant validity was assessed in three ways.
Fornell and Larcker (1981) propose the utilization of AVE, which
signifies that discriminant validity is existed if the square root of the
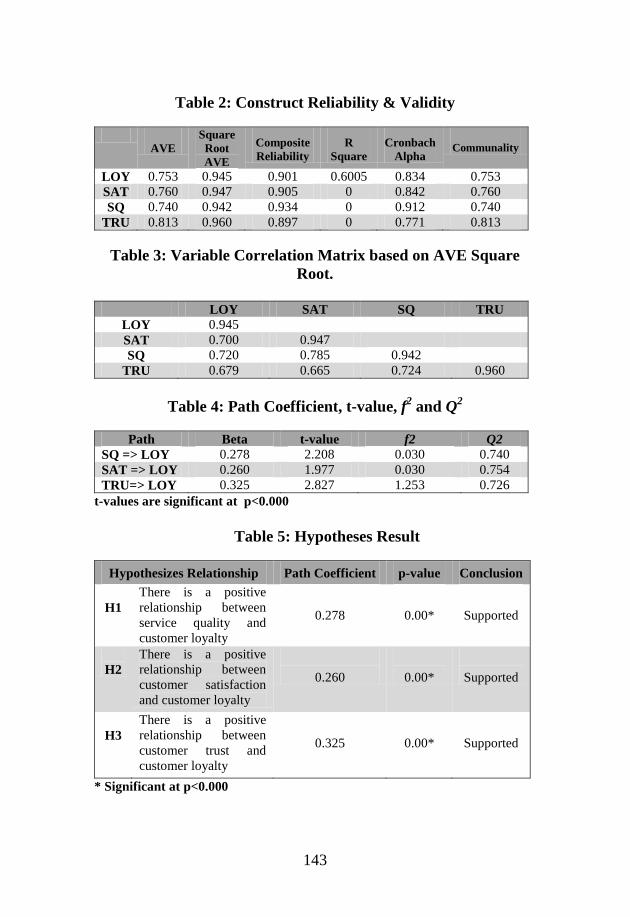
AVE is larger than all corresponding correlations. As revealed in
Table 5, the square roots of the AVE values are steadily larger than
the off-diagonal correlations, suggesting discriminant validity at the
construct level. An examination of Table 3 shows that no single cor-
relations (ranged from 0.665 to 0.785) were higher than their re-
spective AVE (ranged from 0.82 to 0.97), thus indicating satisfac-
tory discriminant validity of all constructs. Finally, all constructs
demonstrate discriminant validity if every correlation is less than 1
by an amount greater than twice its respective standard error
(Bagozzi and Warshaw, 1990). An examination of the standard error
in PLS bootstrap outputs reveals that all constructs pass this third
test. Thus, sufficient discriminant validity is exibited for all con-
structs. The results shown in Tables 1 and 3 signify the outer model
sufficient psychometric properties to move to the structural model
assessment to test the hypotheses.
Hypothesis testing and results
Loadings which shown in table 1 were acceptable. The hypotheses
adequacy evaluation as represented in the model was carried out via
R2, Q
2, regression weights, bootstrap critical ratios (t-values) and
path variance (Table 4). In H1, bank service quality is predicted to
have positive impact on customer loyalty. Results in Table 4 con-
curred this hypothesis with path coefficient of 0.278 and t-value of
2.208. Meanwhile, in H2, customer satisfaction is predicted to have
positive influence on customer loyalty. From Table 4, the results
give evidence to support H2 with the path coefficient of 0.260 and
the t-value of 1.977. In H3, it is predicted that customer trust has a
137
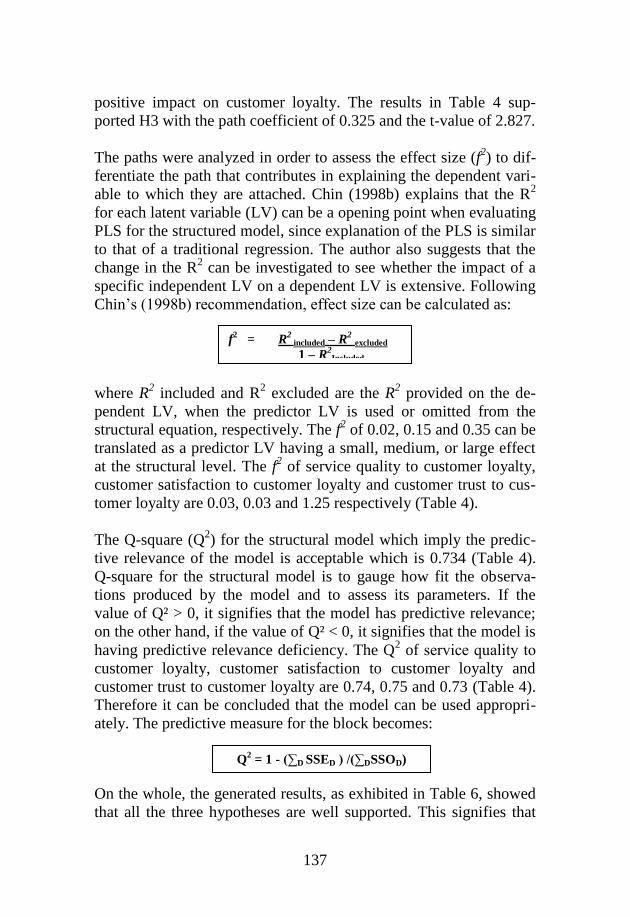
positive impact on customer loyalty. The results in Table 4 sup-
ported H3 with the path coefficient of 0.325 and the t-value of 2.827.
The paths were analyzed in order to assess the effect size (f2) to dif-
ferentiate the path that contributes in explaining the dependent vari-
able to which they are attached. Chin (1998b) explains that the R2
for each latent variable (LV) can be a opening point when evaluating
PLS for the structured model, since explanation of the PLS is similar
to that of a traditional regression. The author also suggests that the
change in the R2 can be investigated to see whether the impact of a
specific independent LV on a dependent LV is extensive. Following
Chin’s (1998b) recommendation, effect size can be calculated as:
where R2 included and R
2 excluded are the R
2 provided on the de-
pendent LV, when the predictor LV is used or omitted from the
structural equation, respectively. The f2 of 0.02, 0.15 and 0.35 can be
translated as a predictor LV having a small, medium, or large effect
at the structural level. The f2 of service quality to customer loyalty,
customer satisfaction to customer loyalty and customer trust to cus-
tomer loyalty are 0.03, 0.03 and 1.25 respectively (Table 4).
The Q-square (Q2) for the structural model which imply the predic-
tive relevance of the model is acceptable which is 0.734 (Table 4).
Q-square for the structural model is to gauge how fit the observa-
tions produced by the model and to assess its parameters. If the
value of Q² > 0, it signifies that the model has predictive relevance;
on the other hand, if the value of Q² < 0, it signifies that the model is
having predictive relevance deficiency. The Q2 of service quality to
customer loyalty, customer satisfaction to customer loyalty and
customer trust to customer loyalty are 0.74, 0.75 and 0.73 (Table 4).
Therefore it can be concluded that the model can be used appropri-
ately. The predictive measure for the block becomes:
On the whole, the generated results, as exhibited in Table 6, showed
that all the three hypotheses are well supported. This signifies that
f2 = R
2 included – R
2 excluded
1 – R2Included
Q2 = 1 - (∑D SSED ) /(∑DSSOD)
138
the positive impact of bank service quality, customer satisfaction and
customer trust on customer loyalty.
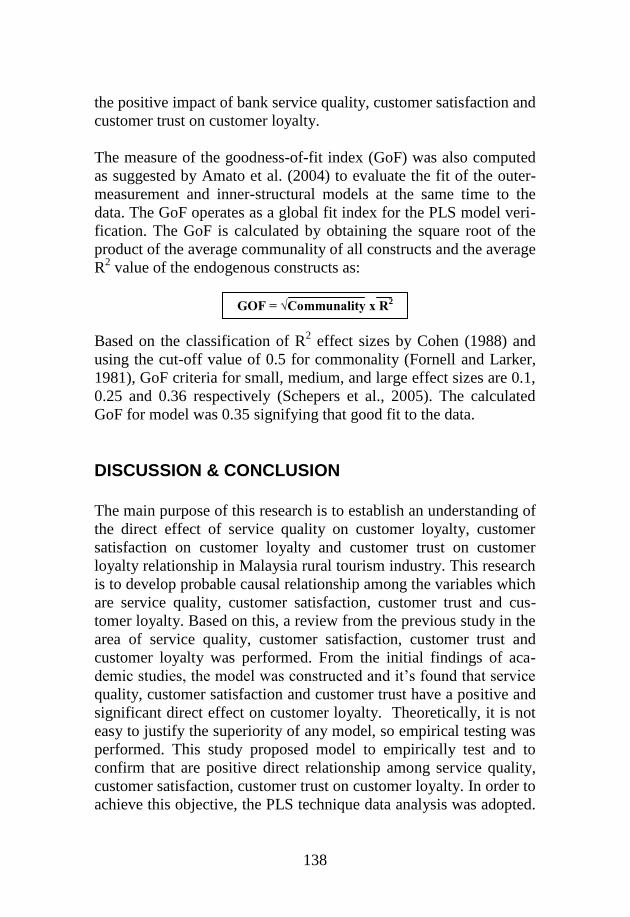
The measure of the goodness-of-fit index (GoF) was also computed
as suggested by Amato et al. (2004) to evaluate the fit of the outer-
measurement and inner-structural models at the same time to the
data. The GoF operates as a global fit index for the PLS model veri-
fication. The GoF is calculated by obtaining the square root of the
product of the average communality of all constructs and the average
R2 value of the endogenous constructs as:
Based on the classification of R2 effect sizes by Cohen (1988) and
using the cut-off value of 0.5 for commonality (Fornell and Larker,
1981), GoF criteria for small, medium, and large effect sizes are 0.1,
0.25 and 0.36 respectively (Schepers et al., 2005). The calculated
GoF for model was 0.35 signifying that good fit to the data.
DISCUSSION & CONCLUSION
The main purpose of this research is to establish an understanding of
the direct effect of service quality on customer loyalty, customer
satisfaction on customer loyalty and customer trust on customer
loyalty relationship in Malaysia rural tourism industry. This research
is to develop probable causal relationship among the variables which
are service quality, customer satisfaction, customer trust and cus-
tomer loyalty. Based on this, a review from the previous study in the
area of service quality, customer satisfaction, customer trust and
customer loyalty was performed. From the initial findings of aca-
demic studies, the model was constructed and it’s found that service
quality, customer satisfaction and customer trust have a positive and
significant direct effect on customer loyalty. Theoretically, it is not
easy to justify the superiority of any model, so empirical testing was
performed. This study proposed model to empirically test and to
confirm that are positive direct relationship among service quality,
customer satisfaction, customer trust on customer loyalty. In order to
achieve this objective, the PLS technique data analysis was adopted.
GOF = √Communality x R2
139
Firstly the most accepted relationship between service quality and
customer loyalty is authenticated. The path coefficient of direct rela-
tionship between the service quality and customer loyalty is 0.278
and and the critical ratio t-value is 2.208 which is significant. Sec-
ondly, the most accepted theory that link customer satisfaction and
customer loyalty also well supported with the path coefficient of
direct relationship between customer satisfaction and customer loy-
alty is 0.260 and the critical ratio t-value is 1.977 which is signifi-
cant. Lastly, relationship between customer trust and customer loy-
alty is authenticated. The path coefficient of direct relationship be-
tween the customer trust and customer loyalty is 0.325 and the criti-
cal ratio t-value is 2.827 which is significant. In view of that, it is
concluded that service quality, customer satisfaction and customer
trust have positive influence and impact on customer loyalty in
Malaysia rural tourism industry.
The research findings suggest that customer loyalty among rural
tourism tourists can be improved and enhanced by focusing on fac-
tors that can enhance service quality, customer satisfaction and cus-
tomer trust. On the other hand, rural tourism tourists’ loyalty can be
strengthened and enhanced by raising the level of service quality,
satisfaction and trust among rural tourism tourists. Eventually, cus-
tomer loyalty among rural tourism tourists should play an important
element to raise rural tourism operators’ profit. This research high-
lights the belief that customer loyalty plays a crucial role in Malay-
sia rural tourism industry. It puts frontward one probable the elusive
link causal explanation between customer loyalty and profitability of
the business.
140
Figure 1: Theoretical Framework
Figure 2: Model Path Coefficient
141
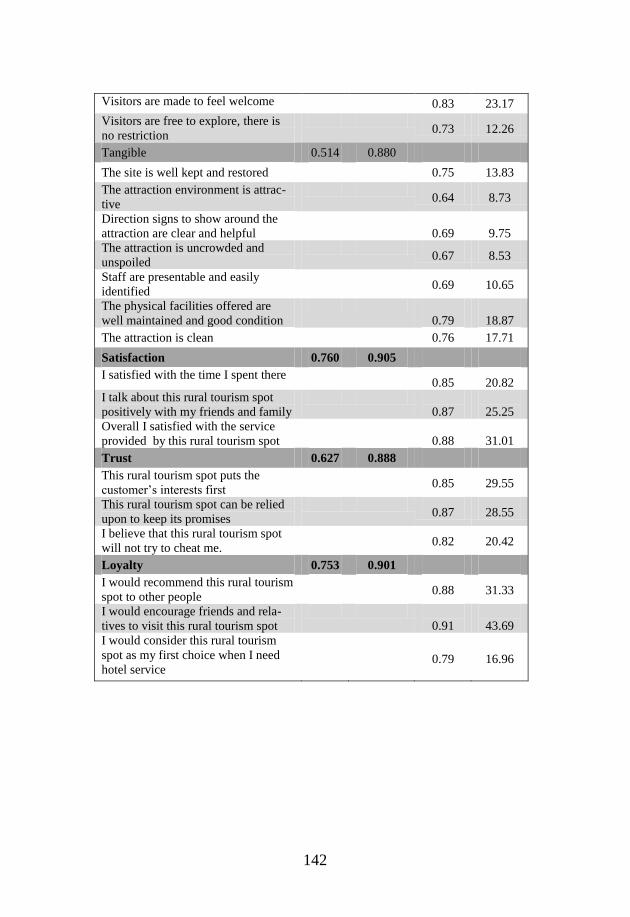
Table 1: Outer Measurement Model
Content Performance AVE Reliability Loading t-value
Assurance 0.663 0.907
You feel Safe & Secure at the at-
traction
0.87 29.44
There is sufficient places to sit and
relax
0.79 17.03
Attraction is easily accessible for
everyone (roads, transport & signage)
0.70
9.89
You feel Safe & Secure at the at-
traction
0.88 36.75
Employees’ behavior instill confi-
dence in us
0.79 16.89
Empathy 0.601 0.900
Personal attention is provided to
visitors when needed
0.77 14.44
The facilities and equipment offered
are at convenient location
0.81
17.05
There is a good viewing and com-
fortable facilities available
0.80 19.63
The site considers needs for elderly
visitors
0.75 14.22
Staff concern with the customer’s
needs
0.79 15.60
The site considers needs for disable
visitors
0.70 9.96
Reliability 0.550 0.859
The front-desk employee accurately
verified the reservation requests
0.72
11.67
The time it took to check in or check
out is not too long
0.72 10.58
The reservation system (e.g., tele-
phone or internet reservation) is easy
to use
0.80
20.08
Transport facilities are available 0.74 12.22
The employees provide error-free
records
0.71 11.42
Responsiveness 0.655 0.919
Staff are always helpful and cour-
teous
0.84 23.62
Staff are quick to react to customers’
requests
0.79 16.80
Staff are willing to take time with
visitors
0.81 17.93
Staff are well informed to answer
customers’ requests
0.82 19.22
142
Visitors are made to feel welcome 0.83 23.17
Visitors are free to explore, there is
no restriction
0.73 12.26
Tangible 0.514 0.880
The site is well kept and restored 0.75 13.83
The attraction environment is attrac-
tive
0.64 8.73
Direction signs to show around the
attraction are clear and helpful
0.69
9.75
The attraction is uncrowded and
unspoiled
0.67 8.53
Staff are presentable and easily
identified
0.69 10.65
The physical facilities offered are
well maintained and good condition
0.79
18.87
The attraction is clean 0.76 17.71
Satisfaction 0.760 0.905
I satisfied with the time I spent there 0.85 20.82
I talk about this rural tourism spot
positively with my friends and family
0.87
25.25
Overall I satisfied with the service
provided by this rural tourism spot
0.88
31.01
Trust 0.627 0.888
This rural tourism spot puts the
customer’s interests first
0.85 29.55
This rural tourism spot can be relied
upon to keep its promises
0.87 28.55
I believe that this rural tourism spot
will not try to cheat me.
0.82 20.42
Loyalty 0.753 0.901
I would recommend this rural tourism
spot to other people
0.88 31.33
I would encourage friends and rela-
tives to visit this rural tourism spot
0.91
43.69
I would consider this rural tourism
spot as my first choice when I need
hotel service
0.79
16.96
143
Table 2: Construct Reliability & Validity
AVE
Square
Root
AVE
Composite
Reliability
R
Square
Cronbach
Alpha
Communality
LOY 0.753 0.945 0.901 0.6005 0.834 0.753
SAT 0.760 0.947 0.905 0 0.842 0.760
SQ 0.740 0.942 0.934 0 0.912 0.740
TRU 0.813 0.960 0.897 0 0.771 0.813
Table 3: Variable Correlation Matrix based on AVE Square
Root.
LOY SAT SQ TRU
LOY 0.945
SAT 0.700 0.947
SQ 0.720 0.785 0.942
TRU 0.679 0.665 0.724 0.960
Table 4: Path Coefficient, t-value, f2 and Q
2
Path Beta t-value f2 Q2
SQ => LOY 0.278 2.208 0.030 0.740
SAT => LOY 0.260 1.977 0.030 0.754
TRU=> LOY 0.325 2.827 1.253 0.726
t-values are significant at p<0.000
Table 5: Hypotheses Result
Hypothesizes Relationship Path Coefficient p-value Conclusion
H1
There is a positive
relationship between
service quality and
customer loyalty
0.278
0.00*
Supported
H2
There is a positive
relationship between
customer satisfaction
and customer loyalty
0.260
0.00*
Supported
H3
There is a positive
relationship between
customer trust and
customer loyalty
0.325
0.00*
Supported
* Significant at p<0.000
144
REFERENCES
Akbar, M. M., & Parvez, N. (2009). Impact of service quality, trust,
and customer satisfaction on customers loyalty. ABAC Jour-
nal, 29(1), 24-38.
Al-Rousan, M. Ramzi, & Mohamed, B. (2010). Customer loyalty
and the impacts of service quality: The case of five star ho-
tels in Jordan. International Journal of Business, Economics,
Finance and Management Sciences, 2(3), 202-208.
Bagozzi, R. P., & Warshaw, P. R. (1990). Trying to consume. Jour-
nal of consumer research, 17, 127-140.
Baker, D. A., & Crompton, J. L. (2000). Quality, satisfaction and
behavioral intentions. Annals of Tourism Research, 27(3),
785-804.
Baldinger, A. L., & Rubinson, J. (1996). Brand loyalty: the link
between attitude and behavior. Journal of Advertising Re-
search, 36, 22-36.
Baumann, C., Burton, S., & Elliott, G. (2005). Determinants of cus-
tomer loyalty and share of wallet in retail banking. Journal of
Financial Services Marketing, 9(3), 231-248.
Bloemer, J., De Ruyter, K., & Wetzels, M. (1999). Linking per-
ceived service quality and service loyalty: a multi-dimen-
sional perspective. European Journal of Marketing,
33(11/12), 1082-1106.
Bowen, J. T., & Shoemaker, S. (1998). Loyalty: A strategic com-
mitment. Cornell Hotel and Restaurant Administration
Quarterly, 39(1), 12-25.
Chaudhuri, A., & Holbrook, M. B. (2001). The chain of effects from
brand trust and brand affect to brand performance: the role of
brand loyalty. The Journal of Marketing, 65, 81-93.
145
Chen, C.-F., & Tsai, D. (2007). How destination image and evalua-
tive factors affect behavioral intentions? Tourism manage-
ment, 28(4), 1115-1122.
Chen, C.-H., & Lee, H.-Y. (2008). Empirical analysis of the cus-
tomer loyalty problem in the international logistics market.
WSEAS Transactions on business and economics, 5(4), 107-
117.
Chin, W. W. (1998). The partial least squares approach for structural
equation modeling In G. A. E. Marcoulides (Ed.), Modern
methods for business research, Methodology for business
and management (pp. 295-336). Mahwah, NJ, US: Lawrence
Erlbaum Associates Publishers.
Chin, W. W. (2001). PLS-Graph user’s guide version 3.0, from
http://carma.wayne.edu/documents/oct1405/plsgraph3.0man
ual.hubona.pdf
Clottey, T. A., Collier, D. A., & Stodnick, M. (2011). Drivers of
customer loyalty in a retail store environment. Journal of
Service Science (JSS), 1(1), 35-48.
Cohen, J. (1988). Statistical Power Analysis for the Behavioral Sci-
ences. New York, NY: Lawrence ErlbaumAssociates.
Day, G. (1969). A two-dimensional concept of brand loyalty. Jour-
nal of Advertising Research, 9(3), 29-35.
Dotchin, J. A., & Oakland, J. S. (1994). Total quality management in
services: Part 2: Service quality. International Journal of
Quality & Reliability Management, 11(3), 27-42.
Erdem, T., Swait, J., & Louviere, J. (2002). The impact of brand
credibility on consumer price sensitivity. International Jour-
nal of Research in Marketing, 19(1), 1-19.
Faullant, R., Matzler, K., & Füller, J. (2008). The impact of satisfac-
tion and image on loyalty: the case of Alpine ski resorts.
Managing Service Quality, 18(2), 163-178.
146
Fornell, C., & Bookstein, F. L. (1982) A comparative analysis of two
structural equation models: LISREL and PLS applied to
market data (pp. 289-384). in Fornell. C. (Ed.): A Second
Generation of Multivariate Analysis, Praeger, New York,
NY.
Ganesan, S. (1994). Determinants of long-term orientation in buyer-
seller relationships. The Journal of Marketing, 58, 1-19.
Goeldner, C. R., & Ritchie, J. R. B. (2003). Tourism principles,
practices, philosophies
Gowan, M., Seymour, J., Ibarreche, S., & Lackey, C. (2001). Service
quality in a public agency: same expectations but different
perceptions by employees, managers, and customers. Journal
of Quality Management, 6(2), 275-291.
Grönroos, C. (2001). The perceived service quality concept–a mis-
take? Managing Service Quality, 11(3), 150-152.
Gudergan, S. P., Ringle, C. M., Wende, S., & Will, A. (2008). Con-
firmatory tetrad analysis in PLS path modeling. Journal of
Business Research, 61(12), 1238-1249.
Gursoy, D., McCleary, K. W., & Lepsito, L. R. (2007). Propensity to
complain: effects of personality and behavioral factors. Jour-
nal of Hospitality & Tourism Research, 31(3), 358-386.
Gustafsson, A., & Johnson, M. D. (2004). Determining attribute
importance in a service satisfaction model. Journal of Ser-
vice Research, 7(2), 124-141.
Homburg, C., Jensen, O., & Krohmer, H. (2008). Configurations of
marketing and sales: a taxonomy. Journal of Marketing,
72(2), 133-154.
Horppu, M., Kuivalainen, O., Tarkiainen, A., & Ellonen, H.-K.
(2008). Online satisfaction, trust and loyalty, and the impact
of the offline parent brand. Journal of Product & Brand
Management, 17(6), 403-413.
147
Hulland, J. (1999). Use of partial least squares (PLS) in strategic
management research: a review of four recent studies. Stra-
tegic management journal, 20(2), 195-204.
Hume, M., & Mort, G. S. (2010). The consequence of appraisal
emotion, service quality, perceived value and customer satis-
faction on repurchase intent in the performing arts. Journal
of Services Marketing, 24(2), 170-182.
Hwang, H., Malhotra, N. K., Kim, Y., Tomiuk, M. A., & Hong, S.
(2010). A comparative study on parameter recovery of three
approaches to structural equation modeling. Journal of Mar-
keting research, 47(4), 699-712.
Jamal, A., & Anastasiadou, K. (2009). Investigating the effects of
service quality dimensions and expertise on loyalty. Euro-
pean Journal of Marketing, 43(3/4), 398-420.
Kara, A., Lonial, S., Tarim, M., & Zaim, S. (2005). A paradox of
service quality in Turkey: The seemingly contradictory rela-
tive importance of tangible and intangible determinants of
service quality. European Business Review, 17(1), 5-20.
Kassim, N., & Abdullah, N. A. (2010). The effect of perceived ser-
vice quality dimensions on customer satisfaction, trust, and
loyalty in e-commerce settings: a cross cultural analysis. Asia
Pacific Journal of Marketing and Logistics, 22(3), 351-371.
Kheng, L. L., Mahamad, O., Ramayah, T., & Mosahab, R. (2010).
The impact of service quality on customer loyalty: A study of
banks in Penang, Malaysia. International Journal of Mar-
keting Studies, 2(2), 57-66.
Kotler, P. (2008). Marketing Management. (13th edition ed.). Upper
Saddle River, NJ.: Prentice-Hall.
Lau, G. T., & Lee, S. H. (1999). Consumers' trust in a brand and the
link to brand loyalty. Journal of Market-Focused Manage-
ment, 4(4), 341-370.
148
Lewis, B. R., & Mitchell, V. W. (1990). Defining and measuring the
quality of customer service. Marketing Intelligence & Plan-
ning, 8(6), 11-17.
Liang, D. (2008). The determining factors of customer loyalty for
luxury hotels in US. The Journal of International Manage-
ment Studies, 3, 167-175.
Loureiro, S. M. C., & González, F. J. M. (2008). The importance of
quality, satisfaction, trust, and image in relation to rural
tourist loyalty. Journal of Travel & Tourism Marketing,
25(2), 117-136.
Luarn, P., & Lin, H.-H. (2003). A Customer Loyalty Model for E-
Service Context. Journal of Electronic Commerce Research,
4(4), 156-167.
Morgan, R. M., & Hunt, S. D. (1994). The Commitment-Trust The-
ory of Relationship Marketing. Journal of Marketing, 58, 20-
38.
Nunnally, J. C. (1978). Psychometric theory. New York: McGraw-
Hill
Pantouvakis, A., & Lymperopoulos, K. (2008). Customer satisfac-
tion and loyalty in the eyes of new and repeat customers:
Evidence from the transport sector. Managing Service Qual-
ity, 18(6), 623-643.
Parasuraman, A., Zeithaml, V., & Berry, L. (1986). Servqual: a
multiple-item scale for measuring customer perceptions of
service quality. Working paper/Marketing Science Insti-
tute(86-108).
Parasuraman, A., Zeithaml, V. A., & Berry, L. L. (1985). A con-
ceptual model of service quality and its implications for fu-
ture research. The Journal of Marketing, 49, 41-50.
Parasuraman, A., Zeithaml, V. A., & Berry, L. L. (1988).
SERVQUAL: A multiple-item scale for measuring consumer
149
perceptions of service quality. Journal of retailing, 64(1), 12-
40.
Prabhakaran, S., & Satya, S. (2003). An insight into service attrib-
utes in banking sector. Journal of Services Research, 3(1),
157-169.
Reichheld, F. F. (2003). The one number you need to grow. Harvard
business review, 81(12), 46-55.
Ribbink, D., Van Riel, A. C., Liljander, V., & Streukens, S. (2004).
Comfort your online customer: quality, trust and loyalty on
the internet. Managing Service Quality, 14(6), 446-456.
Ringle, C., Wende, S., & Will, A. (2005). SmartPLS–Version 2.0.
University of Hamburg, Hamburg.
Rizan, M. (2010). Analysis of service quality and customer satisfac-
tion and its influence on customer loyalty. Paper presented at
the Oxford Business & Economics Conference.
San Martín Gutiérrez, S. (2000). La relacion confianza-compromiso.
Propuesta de un modelo explicativo. Unpublished thesis,
University of Burgos.
Sanchez, J., Callarisa, L., Rodriguez, R. M., & Moliner, M. A.
(2006). Perceived value of the purchase of a tourism product.
Tourism management, 27(3), 394-409.
Shankar, V., Smith, A. K., & Rangaswamy, A. (2003). Customer
satisfaction and loyalty in online and offline environments.
International Journal of Research in Marketing, 20(2), 153-
175.
Sohail, M., Roy, M., Saeed, M., & Ahmed, Z. (2007). Determinants
of service quality in the hospitality industry: The case of
Malaysian hotels. Journal of Accounting, Business & Man-
agement, 14, 64-74.
150
Straughan, R. D., & Cooper, M. J. (2001). Managing internal mar-
kets: a conceptual framework adapted from SERVQUAL.
The marketing review, 2(3), 253-265.
Tourism Malaysia. (2011). Annual report. Retrieved from
http://corporate.tourism.gov.my/trade.asp?page=marketing_t
raining&subpage=annual_report.
Um, S., Chon, K., & Ro, Y. (2006). Antecedents of revisit intention.
Annals of Tourism Research, 33(4), 1141-1158.
Westbrook, R. A., & Oliver, R. L. (1991). The dimensionality of
consumption emotion patterns and consumer satisfaction.
Journal of consumer research, 18, 84-91.
Wold, H. (1982). Soft modelling: the basic design and some exten-
sions. Systems Under Indirect Observation, PartII, 36-37.
Yuan, J. J., Cai, L. A., Morrison, A. M., & Linton, S. (2005). An
analysis of wine festival attendees’ motivations: a synergy of
wine, travel and special events? Journal of Vacation Mar-
keting, 11(1), 41-58.
Zeithaml, V. A. (2000). Service quality, profitability, and the eco-
nomic worth of customers: what we know and what we need
to learn. Journal of the Academy of Marketing Science,
28(1), 67-85.
Zeithaml, V. A., Berry, L. L., & Parasuraman, A. (1996). The be-
havioral consequences of service quality. The Journal of
Marketing, 60, 31-46.
Zhao, X., Bai, C., & Hui, Y. (2002). An empirical assessment and
application of SERVQUAL in a mainland Chinese depart-
ment store. Total Quality Management, 13(2), 241-254.