Embed Size (px)
Citation preview
Vol-4 Issue-2 2018 IJARIIE-ISSN(O)-2395-4396
7436 www.ijariie.com 81
An empirical study on responses of ULIP
Investors, with regard to switching between
the ULIP funds
Dr. O.P Jain1, Hitesh Nasa
2, Dr. Poonam Talreja Nasa
3
1 (Retd. Assistant Professor, Department of Accountancy and Statistics, UCCMS, Mohanlal Sukhadia
University, Udaipur) 2 (Research Scholar and Guest Faculty, Department of Accountancy and Statistics, UCCMS,
Mohanlal Sukhadia University, Udaipur) 3 (Post Doctoral Fellow, Department of Banking and Business Economics, UCCMS, Mohanlal
Sukhadia University, Udaipur)
ABSTRACT
ULIPs since its inception have been a matter of controversy, which has paved a way for multiple types of
research through which spectacular results have come out. Through our present research work, we attempt to
sketch ULIPs clearly, bring out it's true & unbiased picture which will help the readers to unfold various shades
of this insurance plan, help them to come up with worthy decisions. The study has incorporated only primary
data for concluding the research. The prime conclusion of the research was that ULIPs are capable of bringing
good returns to the investors with only one condition & that is patience. We have associated performance of the
plan with hard-earned human value patience. The marketers must explain this peculiar nature of the plan before
selling it to build up customer retention in this regard. The proposed research study was undertaken with the
aim of critically analyzing the responses of ULIP investors with regard to their knowledge of market
fluctuations - - BSE Sensex, BSE All Cap, BSE 500, NIFTY etc. and using the unique feature of ULIP- switching
between the funds as per the market fluctuations. Primary data was collected from only those respondents how
have either invested in ULIP policies across the insurance industry. Three hypotheses were created and
analyzed on the basis of tables and figures to reach the conclusion that investor’s age group and income are two
identified independent variable for the purpose of study ULIP investment and although 48 % ULIP investors
have knowledge of market fluctuation but 92% investors do not switch between the ULIP funds.
Keywords: ULIP, Switch Option, Market Fluctuations
INTRODUCTION
ULIPs are the most innovative plan of the era which has successfully incorporated investments into the
monotonous & old concept of insurance. A Unit Linked Insurance Plan (ULIP) is a product offered by
insurance companies that provide combo offer of insurance and investment bundle in one plan, wherein
Investors get the benefit of life insurance cover and their investment in the market under the close observation
of qualified fund manager with variety of features as easy liquidity, switching between the funds, option to
choose fund with different percentage of equity, riders, Tax benefit under section 80 C etc. which makes them
more attractive than other investment options available in the market.
OBJECTIVES
The study is undertaken with an aim to discover the awareness level of investors with regard to stock market &
its association with their expectations of returns, their reliability on the fund managers of the company or their
own interests in understanding & dealing with stock market fluctuations. The key objectives of the study are:
1. To identify the level of awareness among investors, also enquiring about their interest in knowing
about the activities of the market.
2. To know what makes the investors invest in ULIPs, its investment cum insurance benefits or returns
from the market.
Vol-4 Issue-2 2018 IJARIIE-ISSN(O)-2395-4396
7436 www.ijariie.com 82
3. To identify if there is an association between gender-based awareness or any awareness with regard to
education qualification & knowledge of ULIPs & related variables,
4. Can ULIPs be considered as a sit & relax option or an option of investment that needs a continuous
treatment & attention?
5. Last but not the least, awareness of investors can do something good to their basic idea of the stock
market, or lack of knowledge about switching option & many other in-depth activities makes no big
difference to their attitude towards the stock market.
REVIEW OF LITERATURE
(Lakhani, 2014)1 Unit Linked Insurance Plans (ULIP) had emerged as a major player in savings
mobilization. Investors had shown keen interest by subscribing to ULIP schemes anticipating higher returns.
Key objectives of research paper were To study the risk-adjusted return on equity, balanced and debt funds of
ULIP of top five life insurance companies and to recommend which fund is giving better returns to its
policyholders.The study scrutinizes examined the risk-adjusted returns that have accrued to funds of top five
life insurance companies over a period of four years. From the various funds examined, it can be said that an
investor who is ready to take risks should invest in equity fund of SBI Life Insurance Co. Ltd. The investor
who balanced his investment between equity and debt should opt for asset allocation fund of Bajaj Allianz Life
Insurance Co. Ltd. Lastly, the risk-averse investor should invest in money market fund of ICICI Prudential Life
Insurance Co. Ltd.
(Samajpati, 2013)2 in his research paper "Performance appraisal of unit-linked insurance plans
(ULIPS) in India: a case study" has analyzed the performance evaluation of ULIPs through Risk-Return
Analysis, Treynor’s Ratio, Sharpe’s Ratio, and Jensen’s Measures. The schemes selected for study were ICICI
Life Stage RP-Maxi miser (Growth) Fund, Bajaj Allianz. New Family Gain-Equity Index Fund II and ING
High Life Plus-Growth Fund. The results of performance measures suggested that all the three ULIPs schemes
have outperformed the market. Among the three schemes, ING Vysya ULIP was the best performer.
(Kumar, Murali, & Bharath, 2011)3 undertook a survey to understand the customer’s perception about
ULIP and the factors in favor of the acquisition of ULIP. 25 factors were identified and a factor analysis test
revealed that factors like Tax benefits are high, Transmission, Switching of Options within the fund, Risk
coverage, Life Coverage plays a prominent role in bringing customer preference towards ULIP. Application of
chi-square test showed that there is significant association between age group and rate of return, age group and
tax benefits, qualification and compulsory investment, qualification and gaining an enriching investment
knowledge and occupation and tax benefits
(Seranmadevi, Saravanaraj, & Natarajan, 2011)4 found out the consumer awareness and preference for
ULIP. A structured questionnaire was administered to 200 respondents and the data was analyzed through
simple percentage analysis, weighted average method, ranking method, ANOVA, chi-square, F-test, and
correlation. It was observed that mutual fund is the first choice of Investment Avenue. ICICI Prudential is the
preferred private life insurance company in ULIPs. Investors find switch fund to be an attractive feature in
ULIP. They concluded by stating that good advertising and better recruitment of agents can help a company to
get a good market share
(Kumar, Murali, & Bharath, 2011)5 undertook a survey to understand the customer’s perception about
ULIP and the factors in favor of the acquisition of ULIP. 25 factors were identified and a factor analysis test
revealed that factors like Tax benefits are high, Transmission, Switching of Options within the fund, Risk
coverage, Life Coverage plays a prominent role in bringing customer preference towards ULIP. Application of
chi-square test showed that there is a significant association between age group and rate of return, age group
and tax benefits, qualification and compulsory investment, qualification and gaining an enriching investment
knowledge and occupation and tax benefits.
(Karuna, 2009)6 observed that traditional life insurance plans offered by LIC took care of only the insurance
needs of people. However, with the ever-changing demands of customers, a new product called ULIP was
launched which combines the benefits of insurance, investment, and tax benefits. The key findings of this
article were: The ULIP expenses are categorized as annual expenses and fund management charges out of
which a major share goes towards agents’ commission. On account of this, the agents push ahead the sale of
ULIPs. To curb such malpractices, IRDA has made it mandatory for a policyholder to sign a document stating
that they have fully understood the terms of the policy and the costs associated with it. ULIPs are better suited
to investors who have 15-20 years as their time horizon. This helps to spread the expense over the longer
period and reap the benefits. When the stock markets tumbled below ₹10000 mark many people who had
directly invested in the stock market and also the ULIPs faced a fall in the value of their holding. This led to
Vol-4 Issue-2 2018 IJARIIE-ISSN(O)-2395-4396
7436 www.ijariie.com 83
falling in demand for ULIPs. However, she pointed out that this was the right time to purchase the ULIP as low
NAV will help to acquire a high number of units. Hence ULIP is a good investment vehicle for those people
who try to understand its features and are ready to wait patiently to take advantage of the market situation by
opting for switch option.
RESEARCH METHODOLOGY
Structured Opinion questionnaire was collected with help of Google forms. Total 178 responses were collected
from only those investors who have purchased ULIP policies from either of 24 insurance companies. Primary
data were collected using structured questionnaire using Google forms. Due to inadequate response through
Google forms, few life insurance offices were visited & investors who have purchased ULIPs were enquired
off with the aim to achieve worthy responses for the research study.
HYPOTHESES
H01: There is no significant difference between age group and investment in Unit linked insurance plans
H02: There is no significant difference between occupation and income of investors and investment in Unit
linked insurance plans.
H03: Common investors do not have knowledge about market fluctuations and switching option in Unit
linked insurance plans
ANALYSIS OF DATA
On the basis of responses, tables and figure were prepared, to extract result out of the sample population.
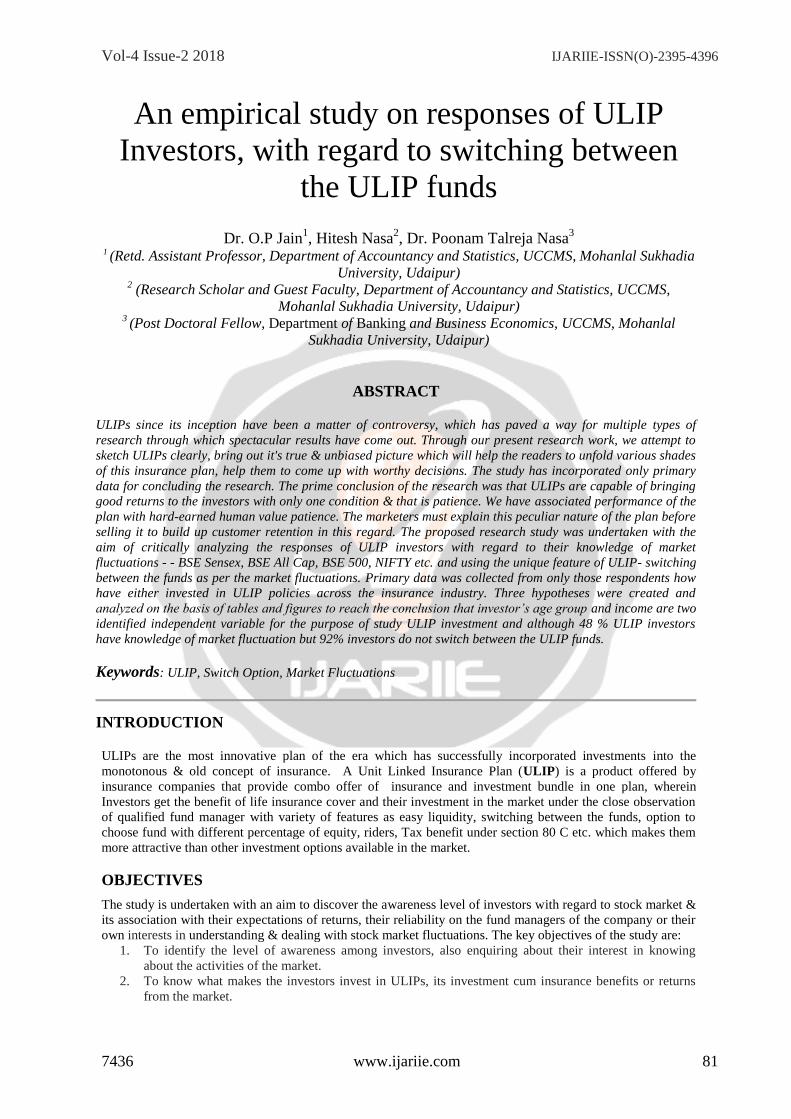
Figure 1.1: Gender of Respondents
Interpretation: Figure 1.1, with the aim of knowing whether common investors have knowledge
about the relationship of BSE Sensex and ULIP net asset value, primary data was collected through
questionnaire via google forms. A total of 178 respondents taken ULIP policy were interviewed, of which 32
were females and 146 were males.
Female 18%
Male 82%
Gender of Respondents
Vol-4 Issue-2 2018 IJARIIE-ISSN(O)-2395-4396
7436 www.ijariie.com 84
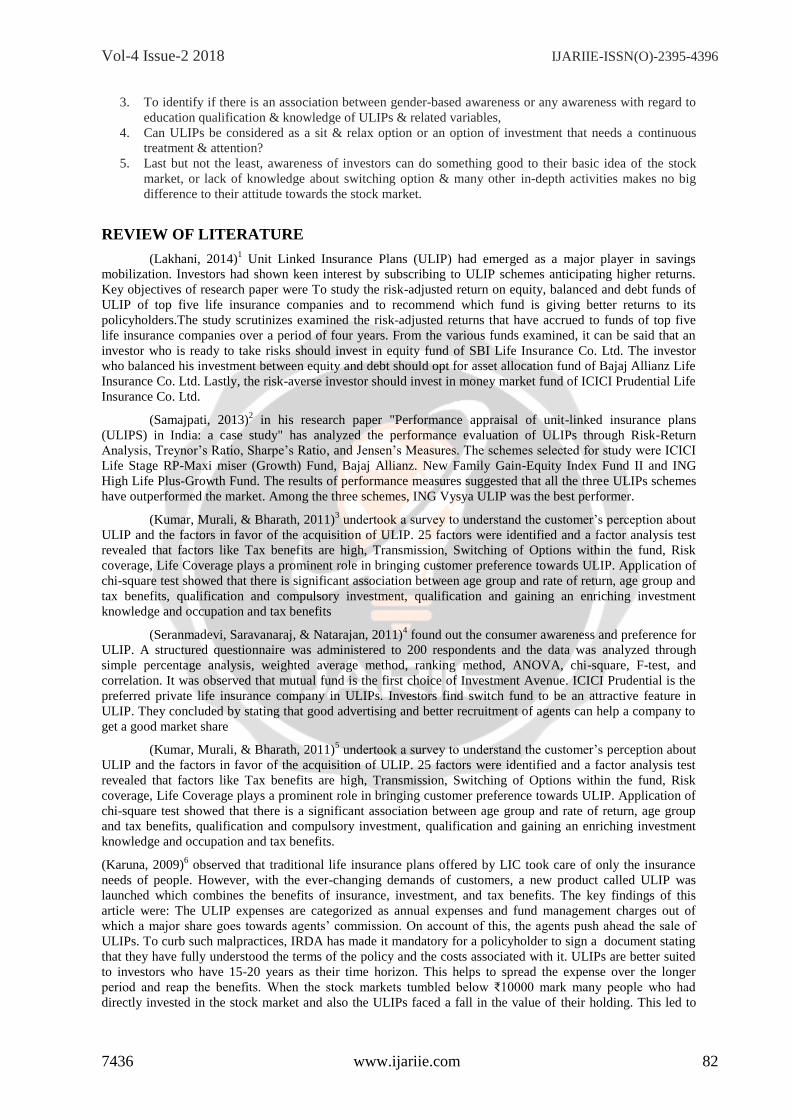
Figure 1.2: Education Qualification of Respondents
Interpretation: Figure1.2 reveals the level of education of respondents, both male and female
respondents were classified on the basis of their educational qualifications out of 178 respondents, 75 acquired
education qualification from SSC to Graduation and were 42% of total sample size.
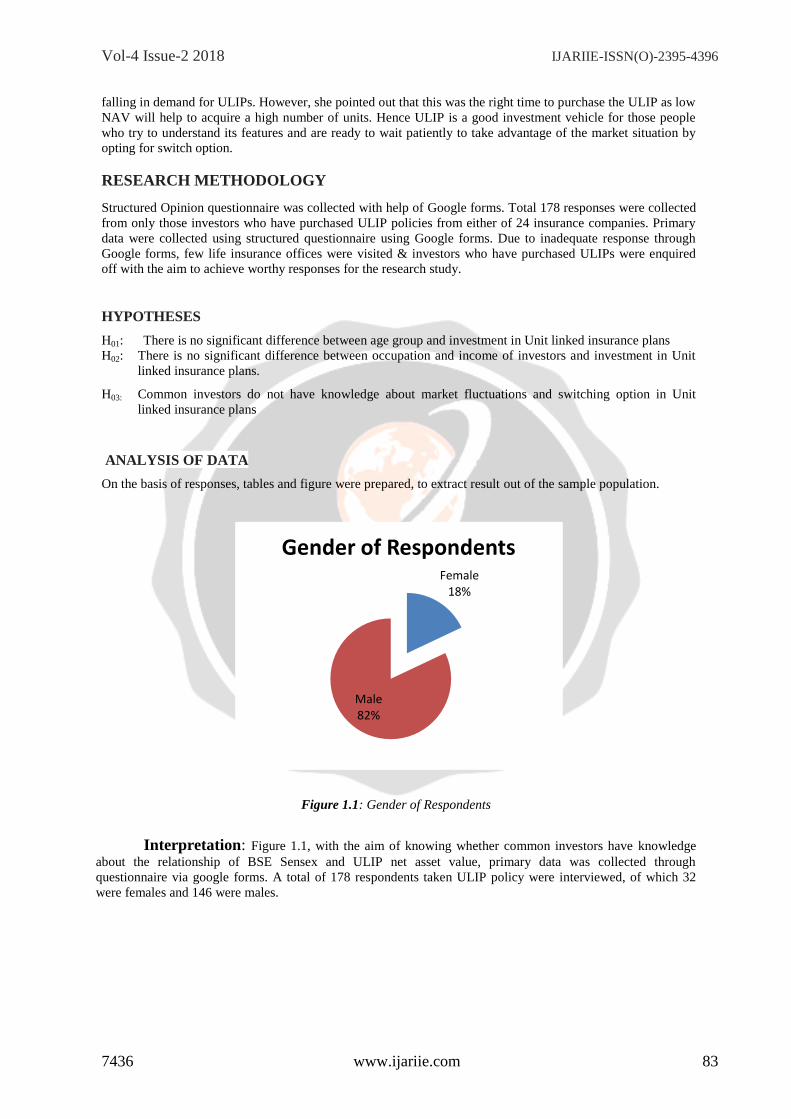
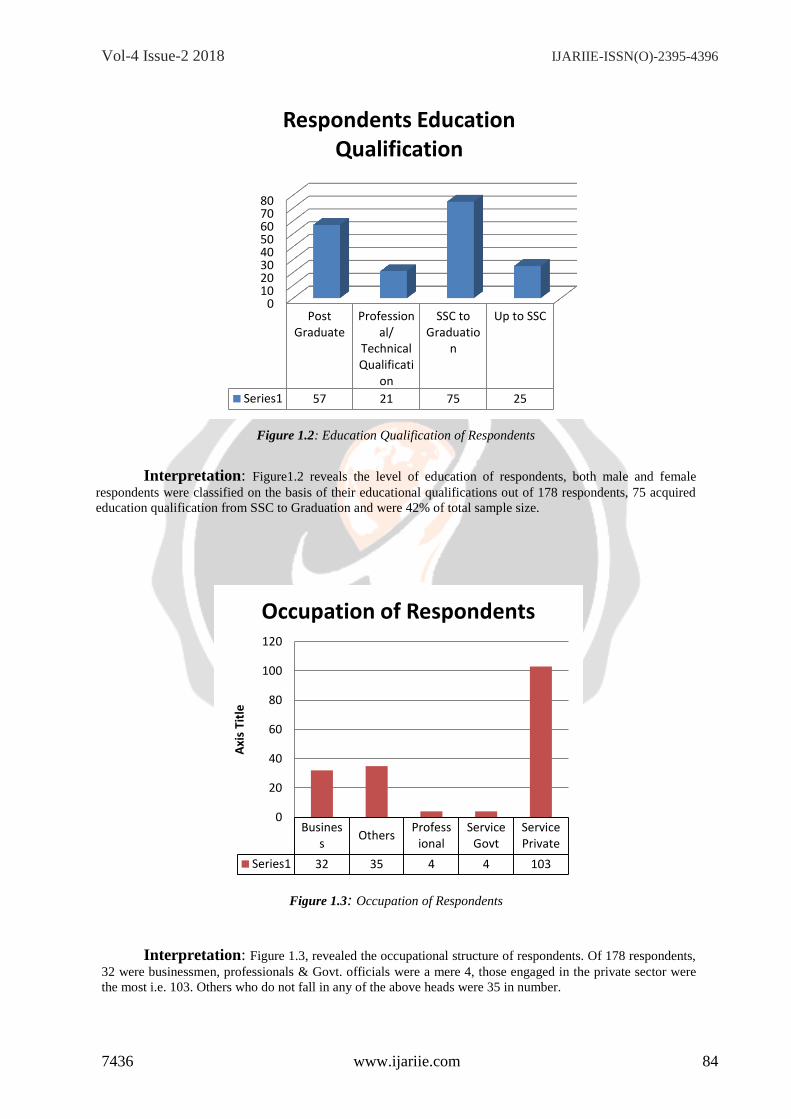
Figure 1.3: Occupation of Respondents
Interpretation: Figure 1.3, revealed the occupational structure of respondents. Of 178 respondents,
32 were businessmen, professionals & Govt. officials were a mere 4, those engaged in the private sector were
the most i.e. 103. Others who do not fall in any of the above heads were 35 in number.
01020304050607080
PostGraduate
Professional/
TechnicalQualificati
on
SSC toGraduatio
n
Up to SSC
Series1 57 21 75 25
Respondents Education Qualification
Business
OthersProfess
ionalService
GovtServicePrivate
Series1 32 35 4 4 103
0
20
40
60
80
100
120
Axi
s Ti
tle
Occupation of Respondents
Vol-4 Issue-2 2018 IJARIIE-ISSN(O)-2395-4396
7436 www.ijariie.com 85
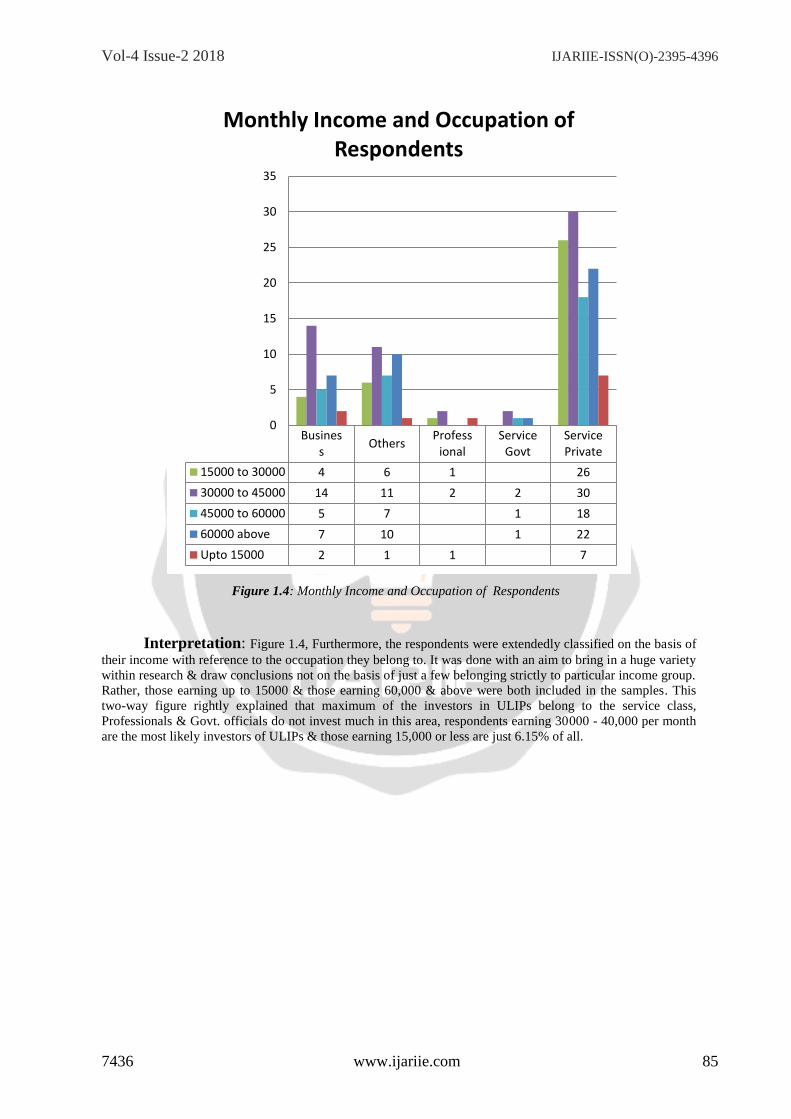
Figure 1.4: Monthly Income and Occupation of Respondents
Interpretation: Figure 1.4, Furthermore, the respondents were extendedly classified on the basis of
their income with reference to the occupation they belong to. It was done with an aim to bring in a huge variety
within research & draw conclusions not on the basis of just a few belonging strictly to particular income group.
Rather, those earning up to 15000 & those earning 60,000 & above were both included in the samples. This
two-way figure rightly explained that maximum of the investors in ULIPs belong to the service class,
Professionals & Govt. officials do not invest much in this area, respondents earning 30000 - 40,000 per month
are the most likely investors of ULIPs & those earning 15,000 or less are just 6.15% of all.
Business
OthersProfess
ionalService
GovtServicePrivate
15000 to 30000 4 6 1 26
30000 to 45000 14 11 2 2 30
45000 to 60000 5 7 1 18
60000 above 7 10 1 22
Upto 15000 2 1 1 7
0
5
10
15
20
25
30
35
Monthly Income and Occupation of Respondents
Vol-4 Issue-2 2018 IJARIIE-ISSN(O)-2395-4396
7436 www.ijariie.com 86
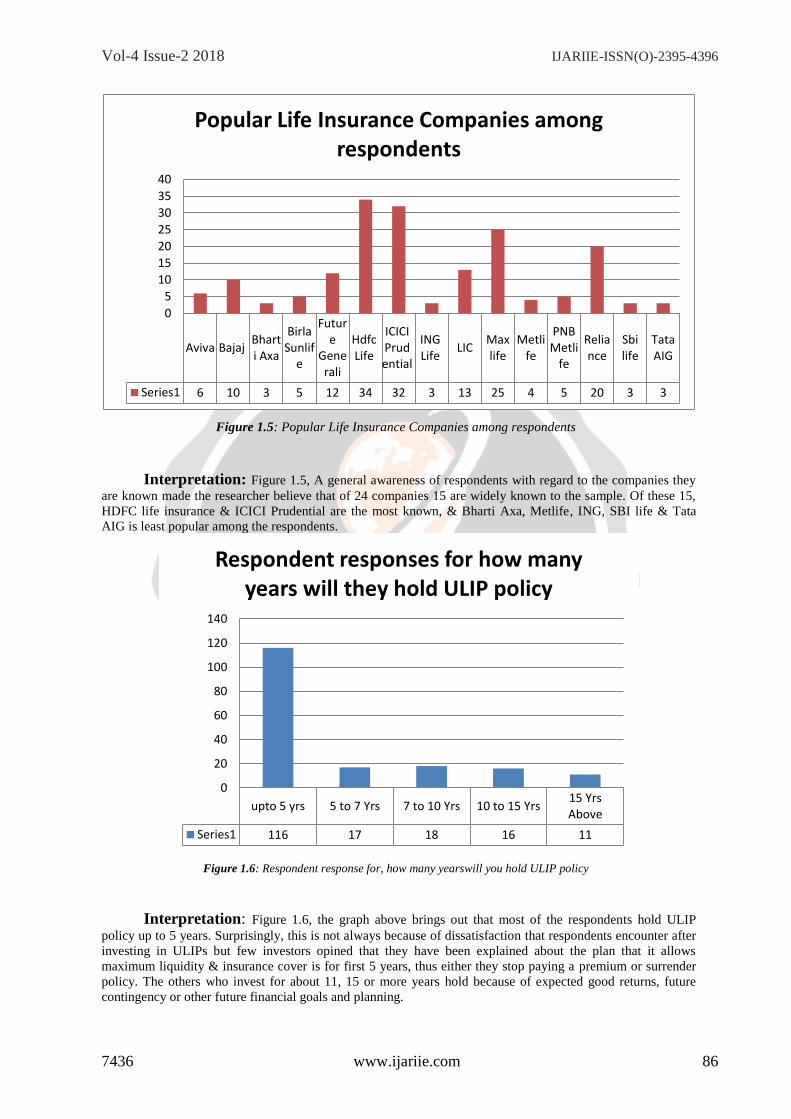
Figure 1.5: Popular Life Insurance Companies among respondents
Interpretation: Figure 1.5, A general awareness of respondents with regard to the companies they
are known made the researcher believe that of 24 companies 15 are widely known to the sample. Of these 15,
HDFC life insurance & ICICI Prudential are the most known, & Bharti Axa, Metlife, ING, SBI life & Tata
AIG is least popular among the respondents.
Figure 1.6: Respondent response for, how many yearswill you hold ULIP policy
Interpretation: Figure 1.6, the graph above brings out that most of the respondents hold ULIP
policy up to 5 years. Surprisingly, this is not always because of dissatisfaction that respondents encounter after
investing in ULIPs but few investors opined that they have been explained about the plan that it allows
maximum liquidity & insurance cover is for first 5 years, thus either they stop paying a premium or surrender
policy. The others who invest for about 11, 15 or more years hold because of expected good returns, future
contingency or other future financial goals and planning.
Aviva BajajBharti Axa
BirlaSunlif
e
Future
Generali
HdfcLife
ICICIPrudential
INGLife
LICMaxlife
Metlife
PNBMetli
fe
Reliance
Sbilife
TataAIG
Series1 6 10 3 5 12 34 32 3 13 25 4 5 20 3 3
0
5
10
15
20
25
30
35
40
Popular Life Insurance Companies among respondents
upto 5 yrs 5 to 7 Yrs 7 to 10 Yrs 10 to 15 Yrs15 YrsAbove
Series1 116 17 18 16 11
0
20
40
60
80
100
120
140
Respondent responses for how many years will they hold ULIP policy

Vol-4 Issue-2 2018 IJARIIE-ISSN(O)-2395-4396
7436 www.ijariie.com 87
Figure 1.7: Respondent choice of % in Equity in their ULIP Funds
Interpretation: Figure 1.7, the table figures out the choice of ULIP investors about the preferred
equity content therein. 66 respondents had no idea about it, i.e. they rely on the agent’s perspective & have just
invested, 57 respondents prefer 50-75% equity content & extreme results were seen with just 4 respondents in
100% equity preference & less than 25% equity preference. In the nutshell, moderate equity investment is the
choice of most of the respondents.
lessthen 25
%
25% to50 %
50% to75%
75% to90 %
90 to100%
100%Don'tknow
Series1 4 9 57 22 4 16 66
0
10
20
30
40
50
60
70
Axi
s Ti
tle
Out of different fund option available in ULIP Plans, what is your choice of
% in Equity
Vol-4 Issue-2 2018 IJARIIE-ISSN(O)-2395-4396
7436 www.ijariie.com 88
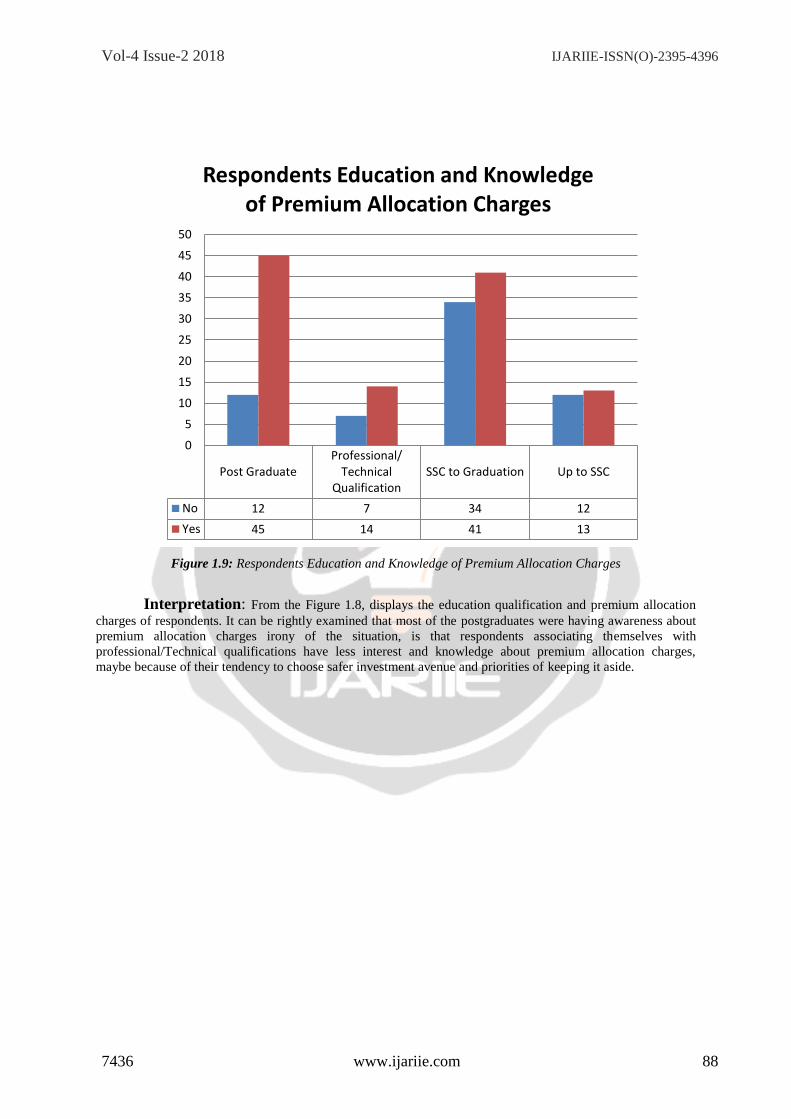
Figure 1.9: Respondents Education and Knowledge of Premium Allocation Charges
Interpretation: From the Figure 1.8, displays the education qualification and premium allocation
charges of respondents. It can be rightly examined that most of the postgraduates were having awareness about
premium allocation charges irony of the situation, is that respondents associating themselves with
professional/Technical qualifications have less interest and knowledge about premium allocation charges,
maybe because of their tendency to choose safer investment avenue and priorities of keeping it aside.
Post GraduateProfessional/
TechnicalQualification
SSC to Graduation Up to SSC
No 12 7 34 12
Yes 45 14 41 13
0
5
10
15
20
25
30
35
40
45
50
Respondents Education and Knowledge of Premium Allocation Charges
Vol-4 Issue-2 2018 IJARIIE-ISSN(O)-2395-4396
7436 www.ijariie.com 89
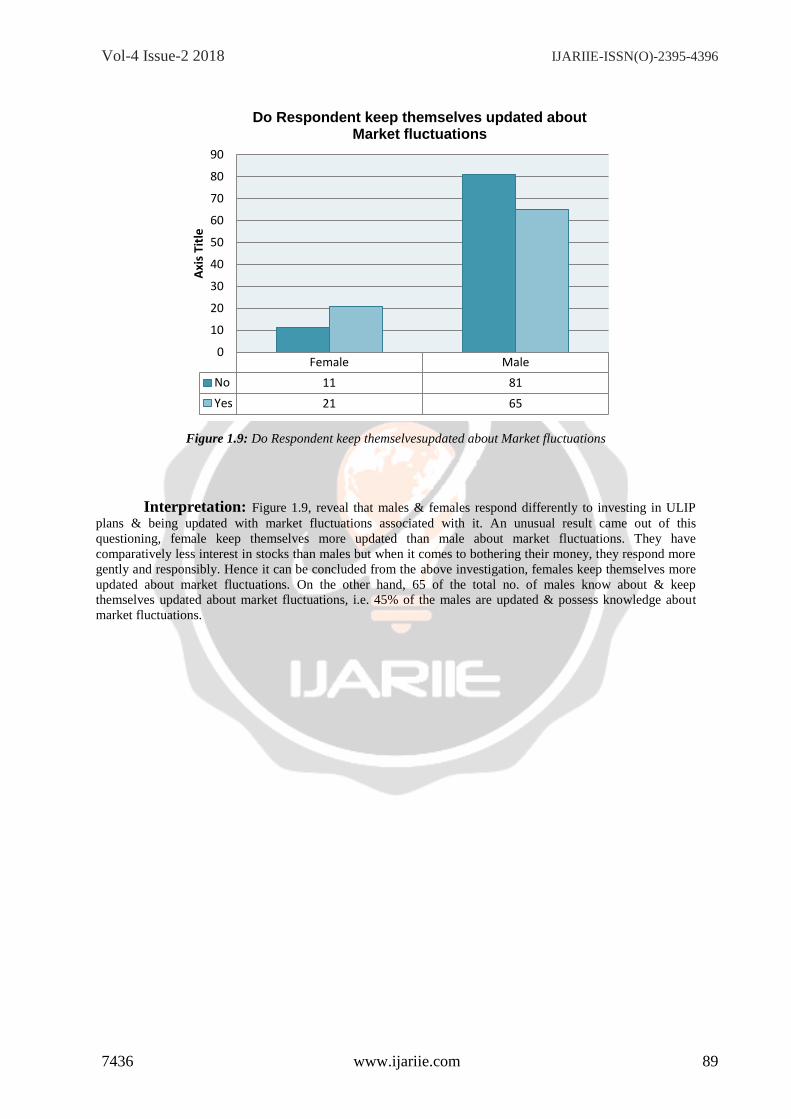
Figure 1.9: Do Respondent keep themselvesupdated about Market fluctuations
Interpretation: Figure 1.9, reveal that males & females respond differently to investing in ULIP
plans & being updated with market fluctuations associated with it. An unusual result came out of this
questioning, female keep themselves more updated than male about market fluctuations. They have
comparatively less interest in stocks than males but when it comes to bothering their money, they respond more
gently and responsibly. Hence it can be concluded from the above investigation, females keep themselves more
updated about market fluctuations. On the other hand, 65 of the total no. of males know about & keep
themselves updated about market fluctuations, i.e. 45% of the males are updated & possess knowledge about
market fluctuations.
Female Male
No 11 81
Yes 21 65
0
10
20
30
40
50
60
70
80
90
Axi
s Ti
tle
Do Respondent keep themselves updated about Market fluctuations
Vol-4 Issue-2 2018 IJARIIE-ISSN(O)-2395-4396
7436 www.ijariie.com 90
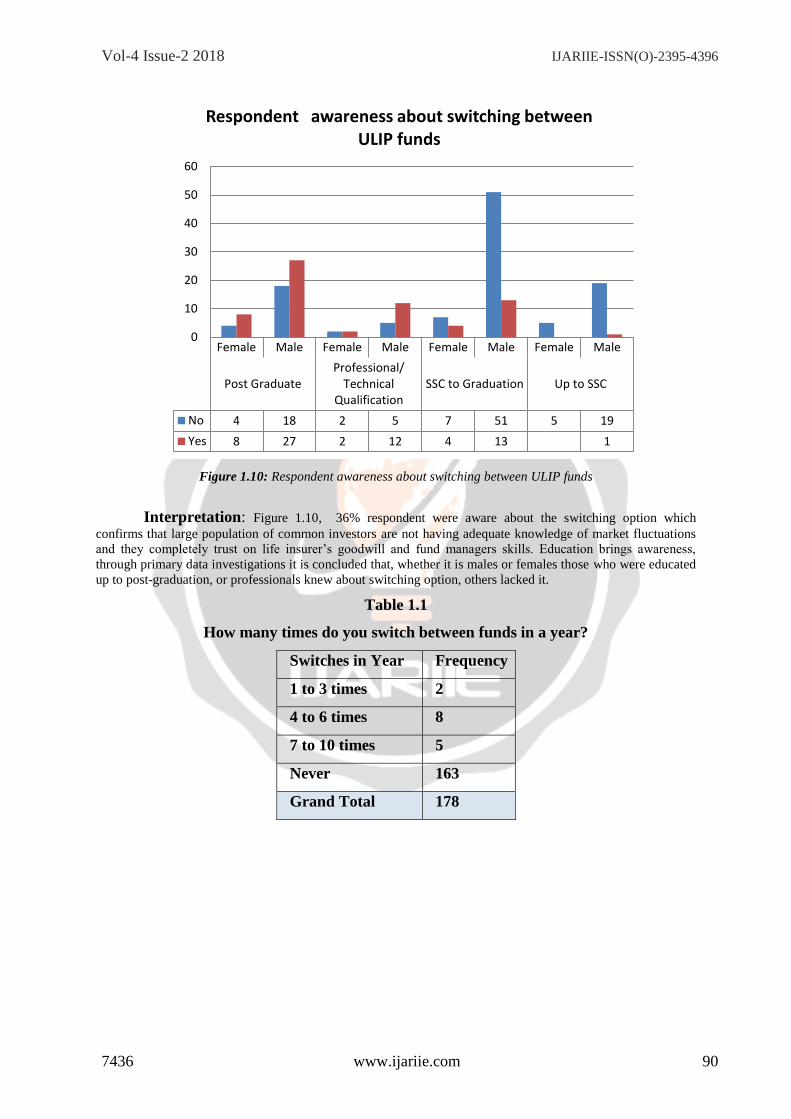
Figure 1.10: Respondent awareness about switching between ULIP funds
Interpretation: Figure 1.10, 36% respondent were aware about the switching option which
confirms that large population of common investors are not having adequate knowledge of market fluctuations
and they completely trust on life insurer’s goodwill and fund managers skills. Education brings awareness,
through primary data investigations it is concluded that, whether it is males or females those who were educated
up to post-graduation, or professionals knew about switching option, others lacked it.
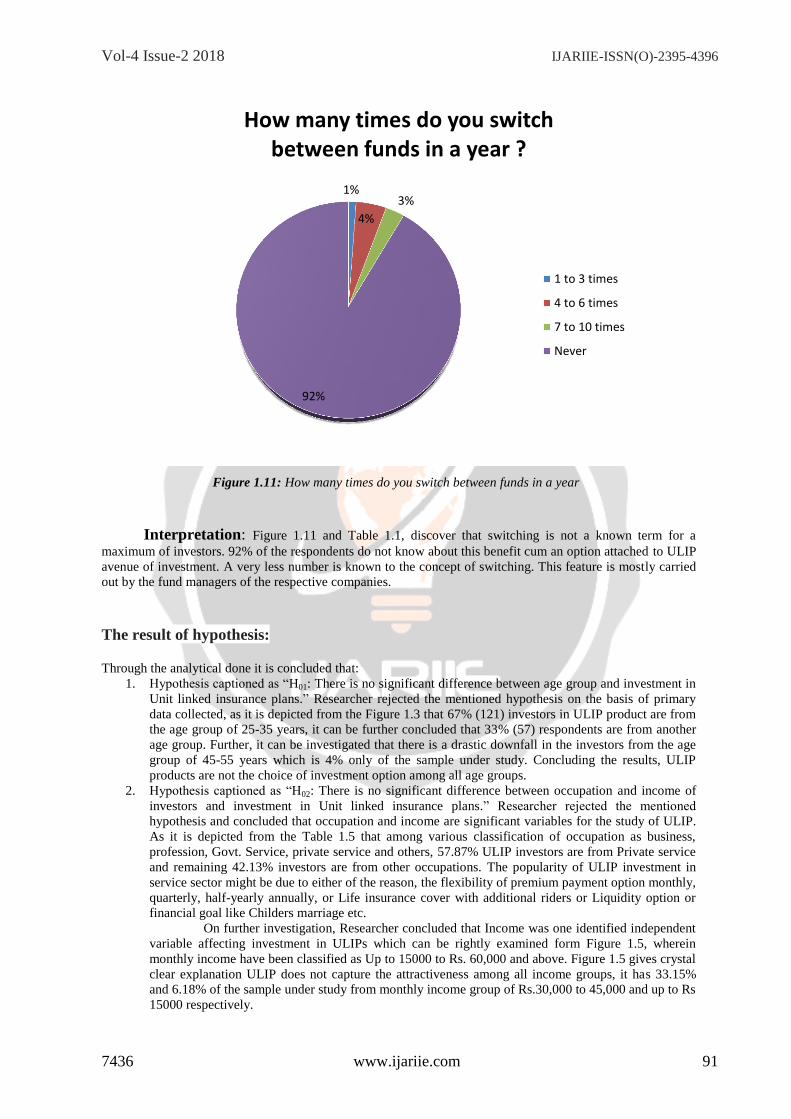
Table 1.1
How many times do you switch between funds in a year?
Switches in Year Frequency
1 to 3 times 2
4 to 6 times 8
7 to 10 times 5
Never 163
Grand Total 178
Female Male Female Male Female Male Female Male
Post GraduateProfessional/
TechnicalQualification
SSC to Graduation Up to SSC
No 4 18 2 5 7 51 5 19
Yes 8 27 2 12 4 13 1
0
10
20
30
40
50
60
Respondent awareness about switching between ULIP funds
Vol-4 Issue-2 2018 IJARIIE-ISSN(O)-2395-4396
7436 www.ijariie.com 91
Figure 1.11: How many times do you switch between funds in a year
Interpretation: Figure 1.11 and Table 1.1, discover that switching is not a known term for a
maximum of investors. 92% of the respondents do not know about this benefit cum an option attached to ULIP
avenue of investment. A very less number is known to the concept of switching. This feature is mostly carried
out by the fund managers of the respective companies.
The result of hypothesis:
Through the analytical done it is concluded that:
1. Hypothesis captioned as “H01: There is no significant difference between age group and investment in
Unit linked insurance plans.” Researcher rejected the mentioned hypothesis on the basis of primary
data collected, as it is depicted from the Figure 1.3 that 67% (121) investors in ULIP product are from
the age group of 25-35 years, it can be further concluded that 33% (57) respondents are from another
age group. Further, it can be investigated that there is a drastic downfall in the investors from the age
group of 45-55 years which is 4% only of the sample under study. Concluding the results, ULIP
products are not the choice of investment option among all age groups.
2. Hypothesis captioned as “H02: There is no significant difference between occupation and income of
investors and investment in Unit linked insurance plans.” Researcher rejected the mentioned
hypothesis and concluded that occupation and income are significant variables for the study of ULIP.
As it is depicted from the Table 1.5 that among various classification of occupation as business,
profession, Govt. Service, private service and others, 57.87% ULIP investors are from Private service
and remaining 42.13% investors are from other occupations. The popularity of ULIP investment in
service sector might be due to either of the reason, the flexibility of premium payment option monthly,
quarterly, half-yearly annually, or Life insurance cover with additional riders or Liquidity option or
financial goal like Childers marriage etc.
On further investigation, Researcher concluded that Income was one identified independent
variable affecting investment in ULIPs which can be rightly examined form Figure 1.5, wherein
monthly income have been classified as Up to 15000 to Rs. 60,000 and above. Figure 1.5 gives crystal
clear explanation ULIP does not capture the attractiveness among all income groups, it has 33.15%
and 6.18% of the sample under study from monthly income group of Rs.30,000 to 45,000 and up to Rs
15000 respectively.
1%
4%
3%
92%
How many times do you switch between funds in a year ?
1 to 3 times
4 to 6 times
7 to 10 times
Never

Vol-4 Issue-2 2018 IJARIIE-ISSN(O)-2395-4396
7436 www.ijariie.com 92
3. Key Hypothesis of research paper captioned as “H03: Common investors do not have knowledge
about market fluctuations and switching option in Unit linked insurance plans.” on the basis of
primary data collected which can be depicted following from
The Figure 1.09, that 48% (86) respondents keep themselves updated about market
fluctuations- BSE Sensex, BSE All Cap, BSE 500, NIFTY etc.
Further, Figure 1.10, depicts respondent awareness about switching between ULIP funds
and their education qualification wherein only 36% respondents gave positive response and remaining
64 % were not even aware about the outstanding feature of ULIP plans offered by the Company. This
might be either due to any of the following reason investors are not given complete information by
Life Insurance Company’s sales manager or lack of proper understanding or hectic schedule of
investors or either investors are not computer friendly.
Lastly from Figure 1.11, examined the analysis regarding the stated question from the
questionnaire that how many times investors, switch between the ULIP funds and surprisingly 92% of
the investors have never accessed the feature of ULIP funds.
On the basis of the Figure 1.10, figure 1.11 and figure 1.12, researcher rejected the
hypotheses and concluded that common investors although have knowledge about market fluctuations
but they never use the unique feature of switching between the ULIP funds either due to lack of
knowledge or confidence on fund managers skills.
FINDINGS
1. Through the paper, it was concluded that males have a much larger preference as compared to females
for ULIPs but the females who have taken ULIP plans are much more aware of the market fluctuations.
2. People qualify in the grade from SSC to Graduation are more inclined towards ULIP plan investments
& those with technical or professional education do not prefer investing here.
3. People belonging to the age group between 35-45 years are the main customers of this insurance plan.
4. Private sector employees invest more in this option as compared to others.
5. People earning a salary of 30000 to 40,000 per month take ULIPs as their choice of investment more
while others consider other options better for the purpose of investment.
6. Respondent’s choice for the company preferred for investing in ULIPs was none other than HDFC
Standard Life & ICICI Prudential on the top. These two companies enjoy the largest market share.
7. 57 investors (32%) of ULIP plans prefer 50-75% equity content in their plans. They match themselves
with the dynamicity of the market & have a bullish tendency. On the other hand, 66 investors (37%)
were unaware of it when enquired off.
8. With regard to premium allocation charges, 113 respondents are aware of it as they are explained about
it at the time of selling of plans.
9. Ironically, respondents know about the premium allocation charges but a larger proportion does not
know about the market fluctuations as theoretically they may be strong enough to be aware of the
concept but when it comes to practical follow up & an insight picture they are not known to it.
10. A minority of the investors are aware of the switching option (67), all others (111) have no idea about
what is switching & how to use it. This calls for a big awareness program to be organized by the
companies for the existing investors to build up the level of awareness among the mass.
11. Most likely, when the respondents were asked about the number of times they switch between the
funds, 163 respondents admitted no to it which made us conclude that yet the level of understanding
the concept of switching between the ULIP funds is weak.
CONCLUSION
As it is depicted clearly from the table and charts that 40% respondent keep themselves updated about market
fluctuations and only 36 % respondent were aware about the switching option which confirms that large
population of common investors are not having adequate knowledge of market fluctuations and they
completely trust on life insurer’s goodwill and fund managers skills, researcher fail to accept the null
hypothesis, and conclude that common investor do not have knowledge about the relationship of Sensex and
NAV indices of Unit linked insurance plans.
Vol-4 Issue-2 2018 IJARIIE-ISSN(O)-2395-4396
7436 www.ijariie.com 93
REFERENCES
1 Lakhani, D. (2014). Risk-adjusted return of unit linked insurance plans. Journal of Global Information
and Business Strategy, 6(1), 37-45. Retrieved from http://www.academia.
edu/22537308/RISK-ADJUSTED_RETURN_OF_UNIT LINKED_INSURANCE_PLANS. 2 Samajpati, U. (2013). Performance appraisal of unit linked insurance plans (ulips) in india: A case study.
Management Insight, 8(2). Retrieved from http://www.inflibnet.ac.in/ojs/index.
php/MI/article/view/1491 3 Kumar, S. A., Murali, R., & Bharath, S. (2011). An empirical study-consumers’prefernce towards unit
linked investment plan (ulip). SRM Management Digest-2011, 9, 123-133. 4 Seranmadevi, R., Saravanaraj, D. M., & Natarajan, D. M. L. (2011). An empirical evaluation of
investors inclination on ulip insurance products with reference to delhi city. CHIEF PATRON CHIEF
PATRON, 1(6), 79-83. Retrieved from http://www.academia.edu/320340
1/AN_EMPIRICAL_EVALUATION_OF_INVESTORS_INCLINATION_ON_ULIP_INSURANCE_P
RODUCTS_WITH_REFERENCE_TO_DELHI_CITY. 5 Kumar, S. A., Murali, R., & Bharath, S. (2011). An empirical study-consumers’prefernce towards unit
linked investment plan (ulip). SRM Management Digest-2011, 9, 123-133. 6 Karuna, K. (2009). Relevance of ulip as a good investment tool. Insurance Chronicle, IX(V), 43-46.
Retrieved from http://www.iupindia.in/509/IC_ Relevance_of_ULIPs_43.html.