Embed Size (px)
Citation preview
An Evaluation of IlluminatedPedestrian Push Buttons inWindsor, OntarioREPORT NO. FHWA-RD-00-102 August 2001
U.S. Department of TransportationFederal Highway AdministrationResearch, Development, and TechnologyTurner-Fairbank Highway Research Center6300 Georgetown PikeMcLean, VA 22101-2296
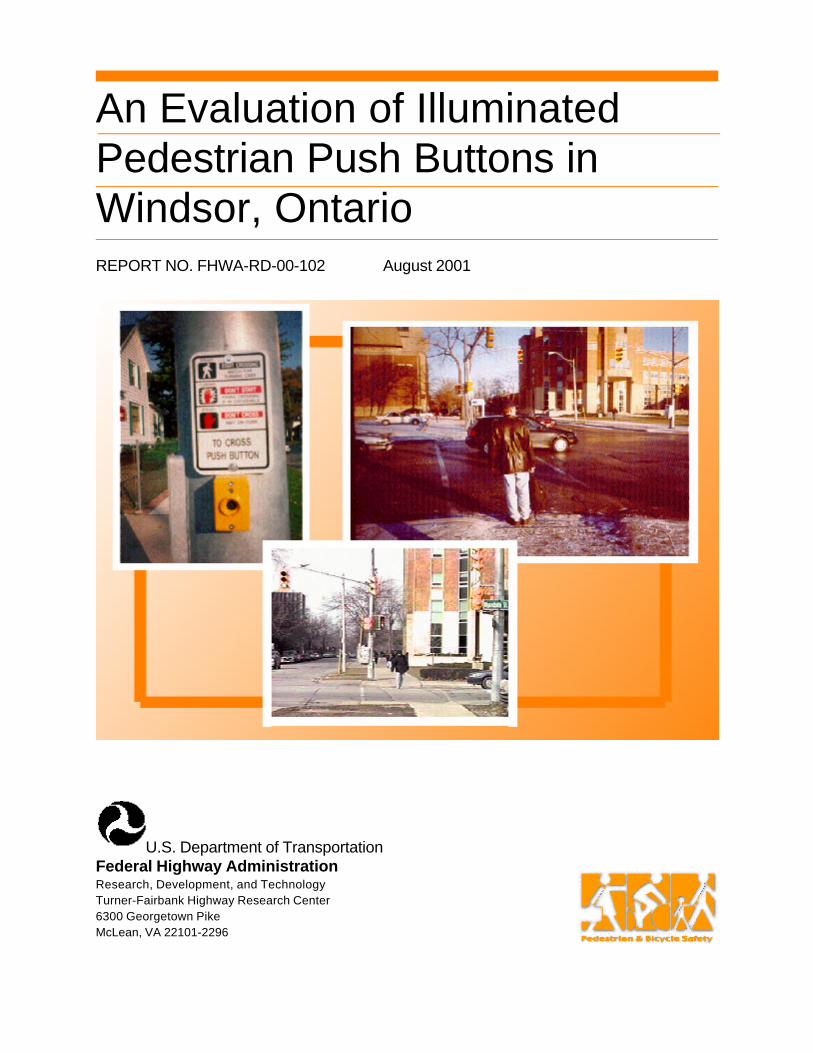
FOREWORD The FHWA’s Pedestrian and Bicycle Safety Research Program’s overall goal is to increase pedestrian and bicycle safety and mobility. From better crosswalks, sidewalks and pedestrian technologies to growing educational and safety programs, the FHWA’s Pedestrian and Bicycle Safety Research Program strives to pave the way for a more walkable future. At many signalized intersections, pedestrian detection is accomplished by the pedestrians pushing buttons to activate the Walk phase. Often, pedestrians do not whether the button already has been pressed or if it is even working. To address this problem, illuminated push buttons are used to indicate when the Walk phase has been activated. This study evaluated the effects of illuminated push buttons on pedestrian behavior. This study was part of a larger Federal Highway Administration research study investigating the effectiveness of innovative engineering treatments on pedestrian safety. It is hoped that readers also will review the reports documenting the results of the related pedestrian safety studies. The results of this research will be useful to transportation engineers, planners, and safety professionals who are involved in improving pedestrian safety and mobility.
Michael F. Trentacoste
Director Office of Safety Research and Development
NOTICE This document is disseminated under the sponsorship of the Department of Transportation in the interest of information exchange. The United States Government assumes no liability for its content of use thereof. This report does not constitute a standard, specification or regulation. The United States Government does not endorse products or manufactures. Trade and manufactures’ names appear in this report only because they are considered essential to the object of the document.
Technical Report Documentation Page 1. Report No.
FHWA-RD-00-1022. Government Accession No. 3. Recipient's Catalog No.
4. Title and Subtitle
AN EVALUATION OF ILLUMINATED PEDESTRIAN PUSHBUTTONS IN WINDSOR, ONTARIO
5. Report Date
August 20016. Performing Organization Code
7. Author(s)
Herman F. Huang and Charles V. Zegeer8. Performing Organization Report No.
9. Performing Organization Name and Address
Highway Safety Research CenterUniversity of North Carolina730 Airport Road, Bolin Creek Ctr.Chapel Hill, NC 27599-3430
10. Work Unit No. (TRAIS)
11. Contract or Grant No.
DTFH61-92-C-00138
12. Sponsoring Agency Name and Address
Federal Highway AdministrationTurner-Fairbank Highway Research Center6300 Georgetown PikeMcLean, VA 22101-2296
13. Type of Report and Period Covered
Research ReportJuly 1, 1996 - October 31, 1999
14. Sponsoring Agency Code
15. Supplementary Notes
Contracting Officer’s Technical Representative (COTR): Carol Tan Esse, HRDS-0516. Abstract
At many intersections, pedestrians must push buttons to activate the Walk phase. However, they often donot know whether the button has been pressed and whether it is functional. If the Walk phase does not appearsoon after the button has been pressed, they may believe that the button does not work and start crossing early,while the steady Don’t Walk is still being displayed. When a pedestrian presses an illuminated push button, a lightnear the button turns on, indicating that the Walk phase has been activated and will appear. The objective of thisstudy is to evaluate the effects of illuminated push buttons on pedestrian behavior.
In general, illuminated push buttons did not have a statistically significant effect on how often the pedestrianphases were activated, how many people pushed the button, how many people complied with the Walk phase, orsuch pedestrian behaviors as running, aborted crossings, and hesitation before crossing. Only 17 and 13 percentof pedestrians pushed the button in the “before” and “after” periods, respectively. In both the before and afterperiods, someone pushed the button in 32 percent of signal cycles with pedestrians. The majority of pedestrians(67.8 percent with, and 72.3 percent without illuminated push buttons) who arrived when parallel traffic had thered and who pushed the button complied with the Walk phase.
17. Key Words:
pedestrians, push buttons, illuminated,walk phase, compliance
18. Distribution Statement
No restrictions. This document is available to thepublic through the National Technical InformationService, Springfield, VA 22161
19. Security Classif. (of this report)
Unclassified20. Security Classif. (of this page)
Unclassified21. No. of Pages
2022. Price
Form DOT F 1700.7 (8-72) Reproduction of form and completed page is authorized
ii
TABLE OF CONTENTS
Page
INTRODUCTION . . . . . . . . . . . . . . . . . . . . . . . . . . . . . . . . . . . . . . . . . . . . . . . . . . . . . . . . . . . . . 1
STUDY DESIGN . . . . . . . . . . . . . . . . . . . . . . . . . . . . . . . . . . . . . . . . . . . . . . . . . . . . . . . . . . . . . . 2
SITE DESCRIPTIONS . . . . . . . . . . . . . . . . . . . . . . . . . . . . . . . . . . . . . . . . . . . . . . . . . . . . . . . . . . 3
HOW MANY PEDESTRIANS PUSHED THE BUTTON? . . . . . . . . . . . . . . . . . . . . . . . . . . . . . . 5
SIGNAL CYCLES DURING WHICH THE BUTTON WAS PUSHED . . . . . . . . . . . . . . . . . . . . 6
DID PEDESTRIANS COMPLY WITH THE WALK SIGNAL? . . . . . . . . . . . . . . . . . . . . . . . . . . 9
PEDESTRIAN CROSSING BEHAVIOR . . . . . . . . . . . . . . . . . . . . . . . . . . . . . . . . . . . . . . . . . . . 10
DISCUSSION AND CONCLUSIONS . . . . . . . . . . . . . . . . . . . . . . . . . . . . . . . . . . . . . . . . . . . . 12
ACKNOWLEDGMENTS . . . . . . . . . . . . . . . . . . . . . . . . . . . . . . . . . . . . . . . . . . . . . . . . . . . . . . 17
REFERENCES . . . . . . . . . . . . . . . . . . . . . . . . . . . . . . . . . . . . . . . . . . . . . . . . . . . . . . . . . . . . . . . 17
iii
LIST OF FIGURES
Page
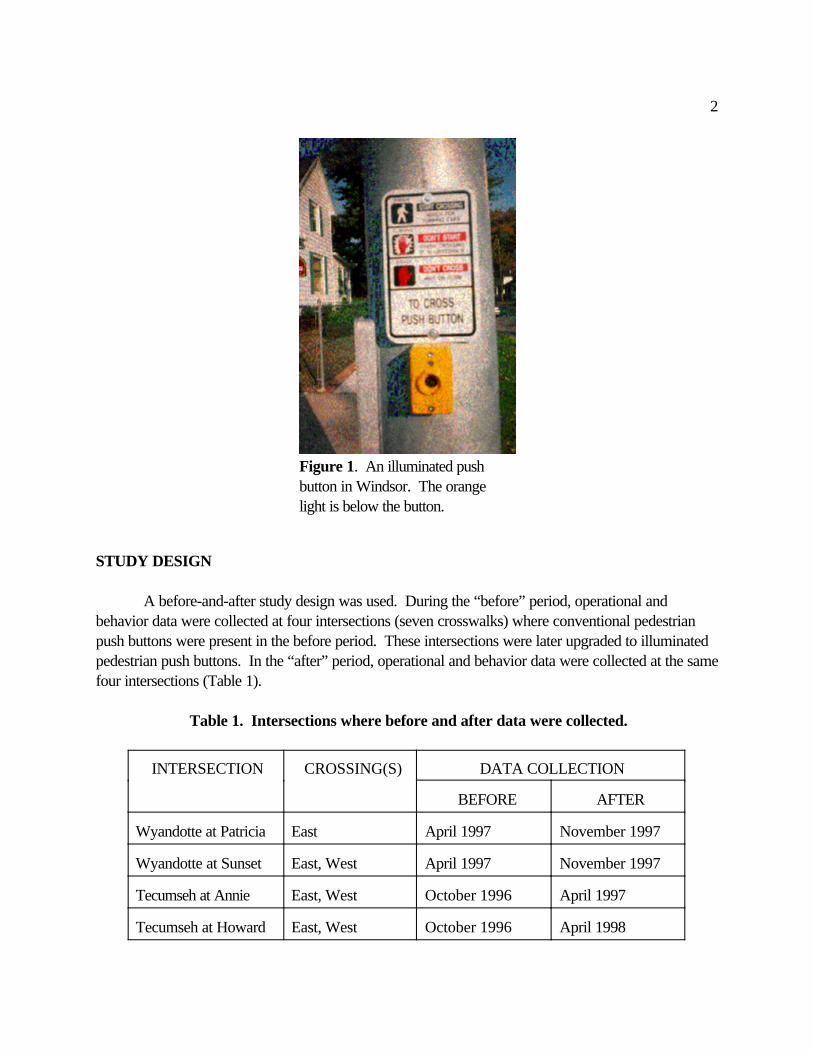
Figure 1. An illuminated push button in Windsor. The orange light is below the button . . . . . . . . . . . . . . . . . . . . . . . . . . . . . . . . . . . . . . . . . . . . . . . . . . . . . . . . . . . . 2
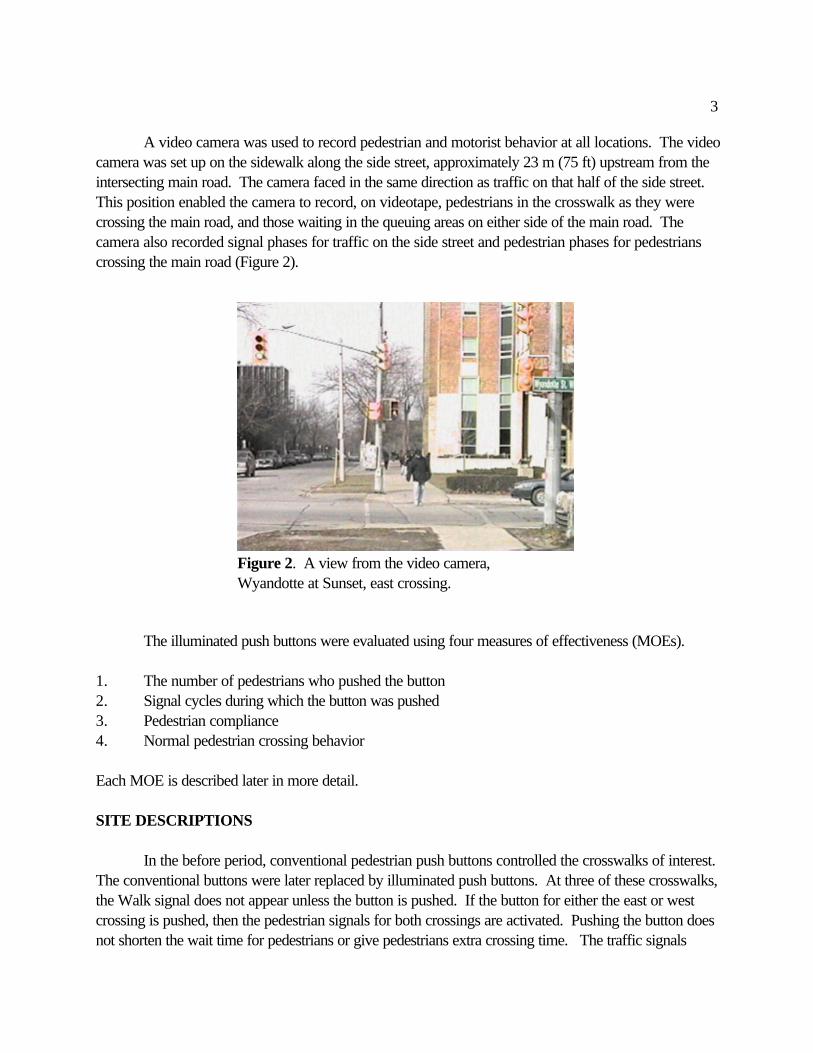
Figure 2. A view from the video camera, Wyandotte at Sunset, east crossing . . . . . . . . . . . . . . . . . . 3
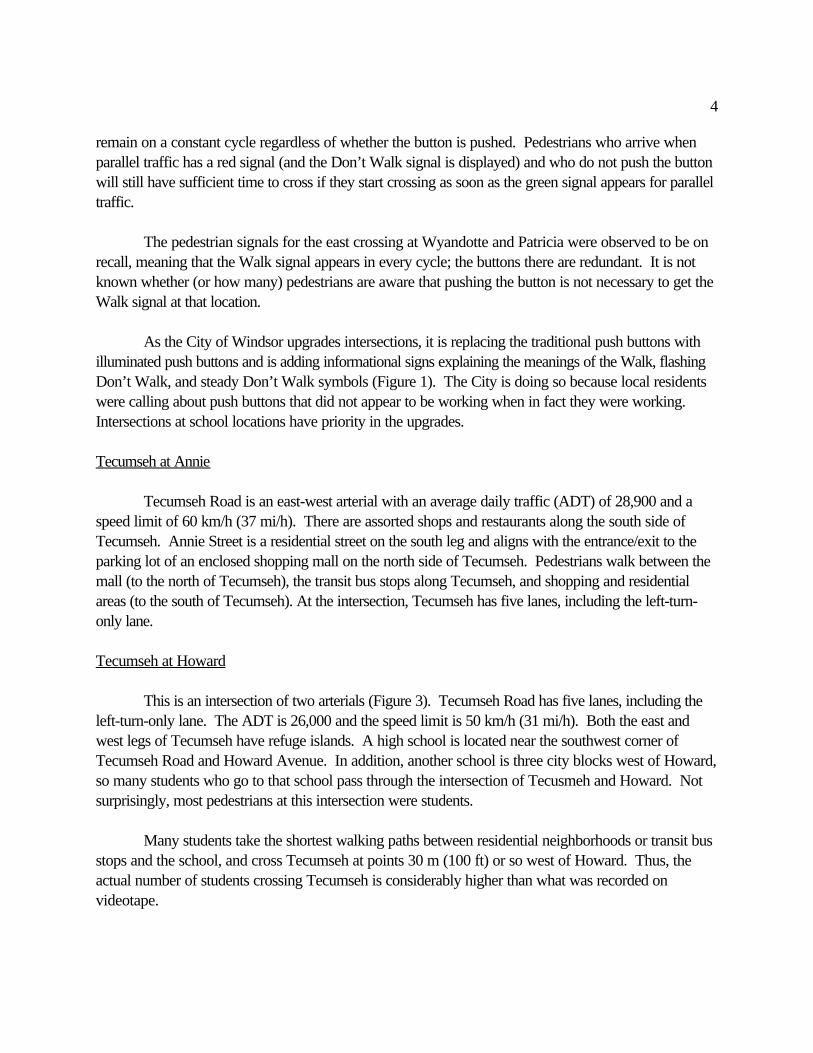
Figure 3. Tecumseh at Howard, west leg . . . . . . . . . . . . . . . . . . . . . . . . . . . . . . . . . . . . . . . . . . . . 5
Figure 4. Wyandotte at Patricia, east leg . . . . . . . . . . . . . . . . . . . . . . . . . . . . . . . . . . . . . . . . . . . . . 6
Figure 5. Pedestrians complying with the Walk signal, Tecumseh at Howard, west crossing . . . . . . . . . . . . . . . . . . . . . . . . . . . . . . . . . . . . . . . . . . . . . . . . . . . . . . . . . 9
Figure 6. A pedestrian push button displaying the message "SIGNAL KOMMT" (signal is coming). (FHWA Study Tour, 1994) . . . . . . . . . . . . . . . . . . . . . . . . . . . . . . . . 14
Figure 7. This pedestrian is waiting for the Walk display, but many pedestrians do not wait . . . . . . . . . . . . . . . . . . . . . . . . . . . . . . . . . . . . . . . . . . . . . . . . . . . . . . . . . . . . 16
LIST OF TABLES
Page
Table 1. Intersections where before and after data were collected . . . . . . . . . . . . . . . . . . . . . . . . . . 2
Table 2. How many pedestrians pushed the button? . . . . . . . . . . . . . . . . . . . . . . . . . . . . . . . . . . . . 7
Table 3. Percentage of cycles during which someone pushed the button . . . . . . . . . . . . . . . . . . . . . . 8
Table 4. Number and percentage of pedestrians who complied with the Walk signal . . . . . . . . . . . 10
Table 5. Number and percentage of pedestrians who exhibited normal crossing behavior . . . . . . . . . . . . . . . . . . . . . . . . . . . . . . . . . . . . . . . . . . . . . . . . . . . . . . . . . . . . . 11
Table 6. The effects of illuminated push buttons by site . . . . . . . . . . . . . . . . . . . . . . . . . . . . . . . . . 13
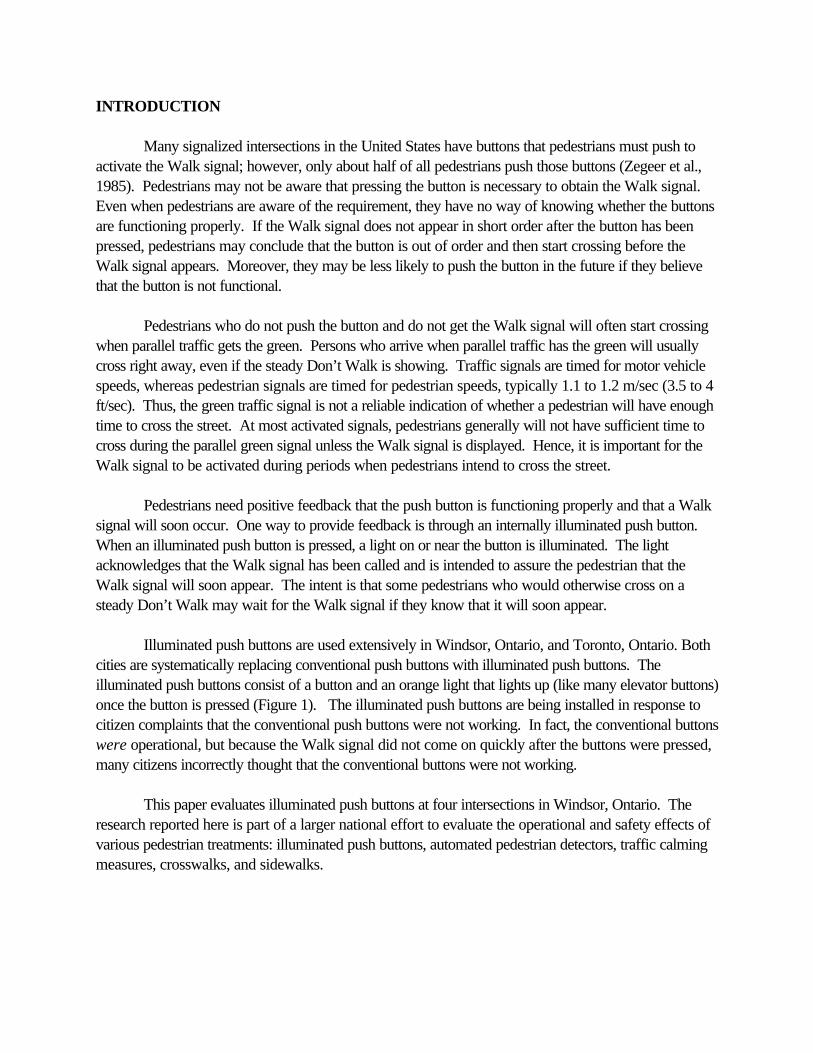
INTRODUCTION
Many signalized intersections in the United States have buttons that pedestrians must push toactivate the Walk signal; however, only about half of all pedestrians push those buttons (Zegeer et al.,1985). Pedestrians may not be aware that pressing the button is necessary to obtain the Walk signal. Even when pedestrians are aware of the requirement, they have no way of knowing whether the buttonsare functioning properly. If the Walk signal does not appear in short order after the button has beenpressed, pedestrians may conclude that the button is out of order and then start crossing before theWalk signal appears. Moreover, they may be less likely to push the button in the future if they believethat the button is not functional.
Pedestrians who do not push the button and do not get the Walk signal will often start crossingwhen parallel traffic gets the green. Persons who arrive when parallel traffic has the green will usuallycross right away, even if the steady Don’t Walk is showing. Traffic signals are timed for motor vehiclespeeds, whereas pedestrian signals are timed for pedestrian speeds, typically 1.1 to 1.2 m/sec (3.5 to 4ft/sec). Thus, the green traffic signal is not a reliable indication of whether a pedestrian will have enoughtime to cross the street. At most activated signals, pedestrians generally will not have sufficient time tocross during the parallel green signal unless the Walk signal is displayed. Hence, it is important for theWalk signal to be activated during periods when pedestrians intend to cross the street.
Pedestrians need positive feedback that the push button is functioning properly and that a Walksignal will soon occur. One way to provide feedback is through an internally illuminated push button. When an illuminated push button is pressed, a light on or near the button is illuminated. The lightacknowledges that the Walk signal has been called and is intended to assure the pedestrian that theWalk signal will soon appear. The intent is that some pedestrians who would otherwise cross on asteady Don’t Walk may wait for the Walk signal if they know that it will soon appear.
Illuminated push buttons are used extensively in Windsor, Ontario, and Toronto, Ontario. Bothcities are systematically replacing conventional push buttons with illuminated push buttons. Theilluminated push buttons consist of a button and an orange light that lights up (like many elevator buttons)once the button is pressed (Figure 1). The illuminated push buttons are being installed in response tocitizen complaints that the conventional push buttons were not working. In fact, the conventional buttonswere operational, but because the Walk signal did not come on quickly after the buttons were pressed,many citizens incorrectly thought that the conventional buttons were not working.
This paper evaluates illuminated push buttons at four intersections in Windsor, Ontario. Theresearch reported here is part of a larger national effort to evaluate the operational and safety effects ofvarious pedestrian treatments: illuminated push buttons, automated pedestrian detectors, traffic calmingmeasures, crosswalks, and sidewalks.
2
Figure 1. An illuminated pushbutton in Windsor. The orangelight is below the button.
STUDY DESIGN
A before-and-after study design was used. During the “before” period, operational andbehavior data were collected at four intersections (seven crosswalks) where conventional pedestrianpush buttons were present in the before period. These intersections were later upgraded to illuminatedpedestrian push buttons. In the “after” period, operational and behavior data were collected at the samefour intersections (Table 1).
Table 1. Intersections where before and after data were collected.
INTERSECTION CROSSING(S) DATA COLLECTION
BEFORE AFTER
Wyandotte at Patricia East April 1997 November 1997
Wyandotte at Sunset East, West April 1997 November 1997
Tecumseh at Annie East, West October 1996 April 1997
Tecumseh at Howard East, West October 1996 April 1998
3
Figure 2. A view from the video camera,Wyandotte at Sunset, east crossing.
A video camera was used to record pedestrian and motorist behavior at all locations. The videocamera was set up on the sidewalk along the side street, approximately 23 m (75 ft) upstream from theintersecting main road. The camera faced in the same direction as traffic on that half of the side street. This position enabled the camera to record, on videotape, pedestrians in the crosswalk as they werecrossing the main road, and those waiting in the queuing areas on either side of the main road. Thecamera also recorded signal phases for traffic on the side street and pedestrian phases for pedestrianscrossing the main road (Figure 2).
The illuminated push buttons were evaluated using four measures of effectiveness (MOEs).
1. The number of pedestrians who pushed the button2. Signal cycles during which the button was pushed3. Pedestrian compliance4. Normal pedestrian crossing behavior
Each MOE is described later in more detail.
SITE DESCRIPTIONS
In the before period, conventional pedestrian push buttons controlled the crosswalks of interest. The conventional buttons were later replaced by illuminated push buttons. At three of these crosswalks,the Walk signal does not appear unless the button is pushed. If the button for either the east or westcrossing is pushed, then the pedestrian signals for both crossings are activated. Pushing the button doesnot shorten the wait time for pedestrians or give pedestrians extra crossing time. The traffic signals
4
remain on a constant cycle regardless of whether the button is pushed. Pedestrians who arrive whenparallel traffic has a red signal (and the Don’t Walk signal is displayed) and who do not push the buttonwill still have sufficient time to cross if they start crossing as soon as the green signal appears for paralleltraffic.
The pedestrian signals for the east crossing at Wyandotte and Patricia were observed to be onrecall, meaning that the Walk signal appears in every cycle; the buttons there are redundant. It is notknown whether (or how many) pedestrians are aware that pushing the button is not necessary to get theWalk signal at that location.
As the City of Windsor upgrades intersections, it is replacing the traditional push buttons withilluminated push buttons and is adding informational signs explaining the meanings of the Walk, flashingDon’t Walk, and steady Don’t Walk symbols (Figure 1). The City is doing so because local residentswere calling about push buttons that did not appear to be working when in fact they were working. Intersections at school locations have priority in the upgrades.
Tecumseh at Annie
Tecumseh Road is an east-west arterial with an average daily traffic (ADT) of 28,900 and aspeed limit of 60 km/h (37 mi/h). There are assorted shops and restaurants along the south side ofTecumseh. Annie Street is a residential street on the south leg and aligns with the entrance/exit to theparking lot of an enclosed shopping mall on the north side of Tecumseh. Pedestrians walk between themall (to the north of Tecumseh), the transit bus stops along Tecumseh, and shopping and residentialareas (to the south of Tecumseh). At the intersection, Tecumseh has five lanes, including the left-turn-only lane.
Tecumseh at Howard
This is an intersection of two arterials (Figure 3). Tecumseh Road has five lanes, including theleft-turn-only lane. The ADT is 26,000 and the speed limit is 50 km/h (31 mi/h). Both the east andwest legs of Tecumseh have refuge islands. A high school is located near the southwest corner ofTecumseh Road and Howard Avenue. In addition, another school is three city blocks west of Howard,so many students who go to that school pass through the intersection of Tecusmeh and Howard. Notsurprisingly, most pedestrians at this intersection were students.
Many students take the shortest walking paths between residential neighborhoods or transit busstops and the school, and cross Tecumseh at points 30 m (100 ft) or so west of Howard. Thus, theactual number of students crossing Tecumseh is considerably higher than what was recorded onvideotape.
5
Figure 3. Tecumseh at Howard, west leg.
Wyandotte at Sunset
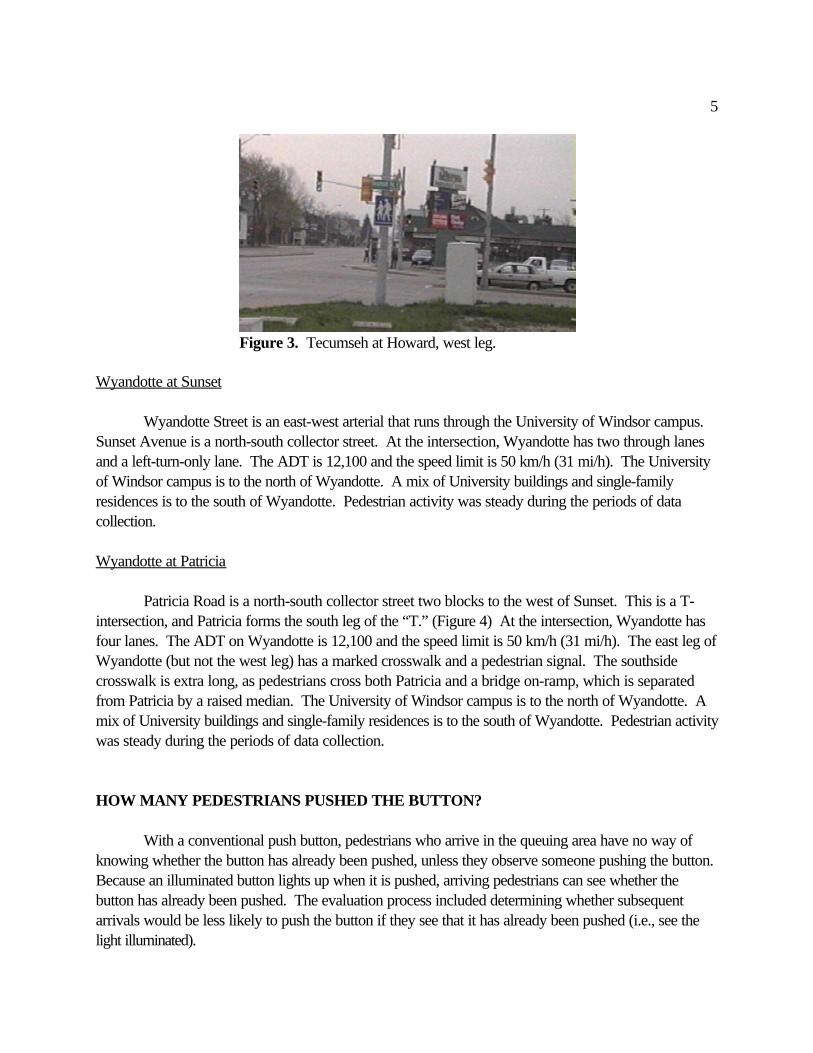
Wyandotte Street is an east-west arterial that runs through the University of Windsor campus. Sunset Avenue is a north-south collector street. At the intersection, Wyandotte has two through lanesand a left-turn-only lane. The ADT is 12,100 and the speed limit is 50 km/h (31 mi/h). The Universityof Windsor campus is to the north of Wyandotte. A mix of University buildings and single-familyresidences is to the south of Wyandotte. Pedestrian activity was steady during the periods of datacollection.
Wyandotte at Patricia
Patricia Road is a north-south collector street two blocks to the west of Sunset. This is a T-intersection, and Patricia forms the south leg of the “T.” (Figure 4) At the intersection, Wyandotte hasfour lanes. The ADT on Wyandotte is 12,100 and the speed limit is 50 km/h (31 mi/h). The east leg ofWyandotte (but not the west leg) has a marked crosswalk and a pedestrian signal. The southsidecrosswalk is extra long, as pedestrians cross both Patricia and a bridge on-ramp, which is separatedfrom Patricia by a raised median. The University of Windsor campus is to the north of Wyandotte. Amix of University buildings and single-family residences is to the south of Wyandotte. Pedestrian activitywas steady during the periods of data collection.
HOW MANY PEDESTRIANS PUSHED THE BUTTON?
With a conventional push button, pedestrians who arrive in the queuing area have no way ofknowing whether the button has already been pushed, unless they observe someone pushing the button. Because an illuminated button lights up when it is pushed, arriving pedestrians can see whether thebutton has already been pushed. The evaluation process included determining whether subsequentarrivals would be less likely to push the button if they see that it has already been pushed (i.e., see thelight illuminated).
6
Figure 4. Wyandotte at Patricia, east leg.
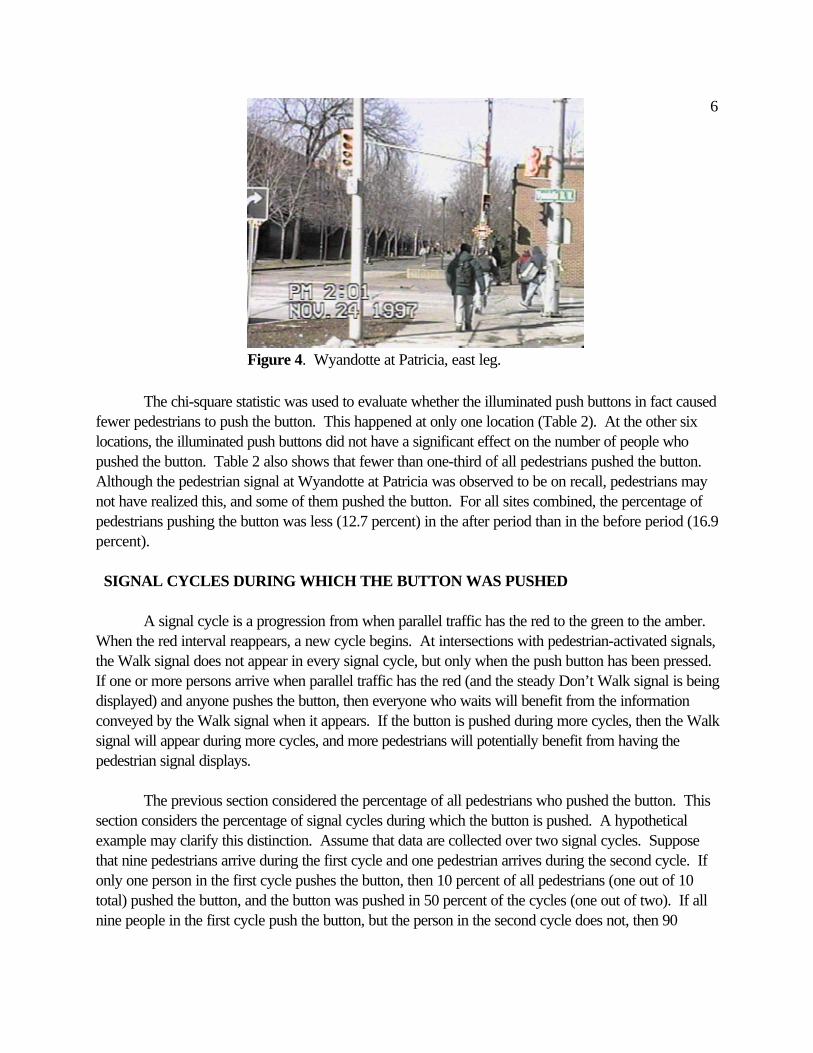
The chi-square statistic was used to evaluate whether the illuminated push buttons in fact causedfewer pedestrians to push the button. This happened at only one location (Table 2). At the other sixlocations, the illuminated push buttons did not have a significant effect on the number of people whopushed the button. Table 2 also shows that fewer than one-third of all pedestrians pushed the button. Although the pedestrian signal at Wyandotte at Patricia was observed to be on recall, pedestrians maynot have realized this, and some of them pushed the button. For all sites combined, the percentage ofpedestrians pushing the button was less (12.7 percent) in the after period than in the before period (16.9percent).
SIGNAL CYCLES DURING WHICH THE BUTTON WAS PUSHED
A signal cycle is a progression from when parallel traffic has the red to the green to the amber. When the red interval reappears, a new cycle begins. At intersections with pedestrian-activated signals,the Walk signal does not appear in every signal cycle, but only when the push button has been pressed. If one or more persons arrive when parallel traffic has the red (and the steady Don’t Walk signal is beingdisplayed) and anyone pushes the button, then everyone who waits will benefit from the informationconveyed by the Walk signal when it appears. If the button is pushed during more cycles, then the Walksignal will appear during more cycles, and more pedestrians will potentially benefit from having thepedestrian signal displays.
The previous section considered the percentage of all pedestrians who pushed the button. Thissection considers the percentage of signal cycles during which the button is pushed. A hypotheticalexample may clarify this distinction. Assume that data are collected over two signal cycles. Supposethat nine pedestrians arrive during the first cycle and one pedestrian arrives during the second cycle. Ifonly one person in the first cycle pushes the button, then 10 percent of all pedestrians (one out of 10total) pushed the button, and the button was pushed in 50 percent of the cycles (one out of two). If allnine people in the first cycle push the button, but the person in the second cycle does not, then 90
7
percent of all pedestrians (nine out of ten total) pushed the button, and the button was pushed in 50percent of the cycles (one out of two).
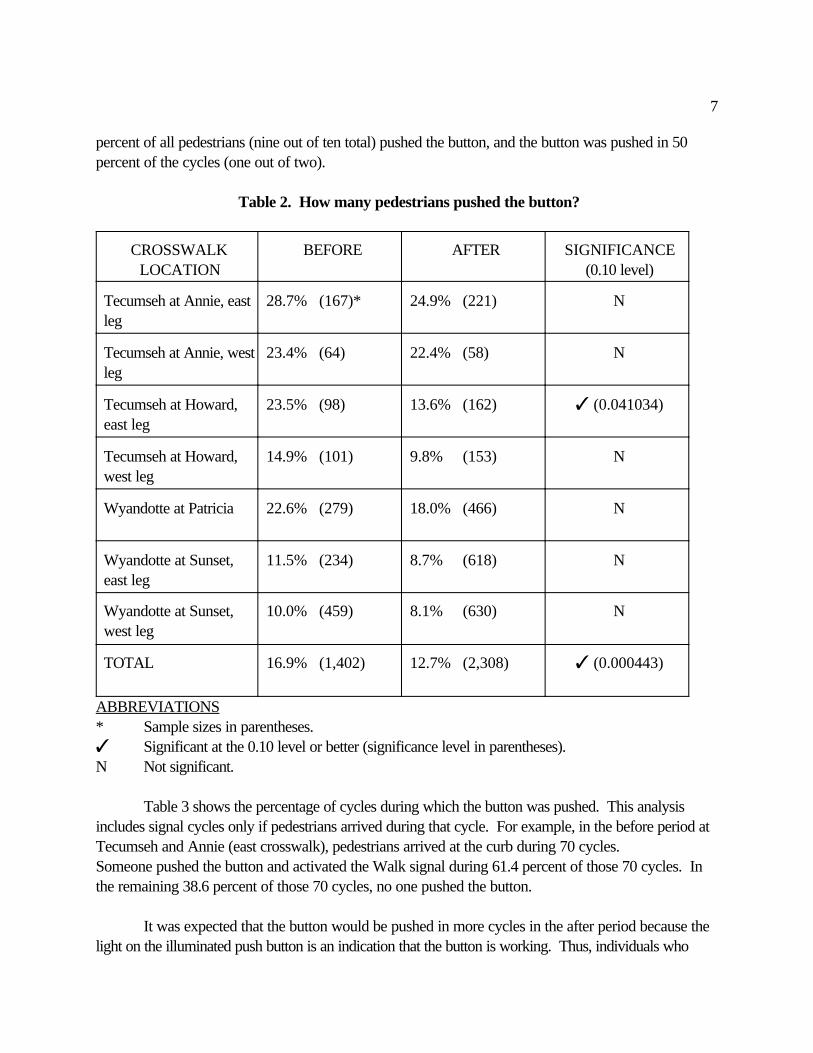
Table 2. How many pedestrians pushed the button?
CROSSWALKLOCATION
BEFORE AFTER SIGNIFICANCE(0.10 level)
Tecumseh at Annie, eastleg
28.7% (167)* 24.9% (221) N
Tecumseh at Annie, westleg
23.4% (64) 22.4% (58) N
Tecumseh at Howard,east leg
23.5% (98) 13.6% (162) T (0.041034)
Tecumseh at Howard,west leg
14.9% (101) 9.8% (153) N
Wyandotte at Patricia 22.6% (279) 18.0% (466) N
Wyandotte at Sunset,east leg
11.5% (234) 8.7% (618) N
Wyandotte at Sunset,west leg
10.0% (459) 8.1% (630) N
TOTAL 16.9% (1,402) 12.7% (2,308) T (0.000443)
ABBREVIATIONS* Sample sizes in parentheses.T Significant at the 0.10 level or better (significance level in parentheses).N Not significant.
Table 3 shows the percentage of cycles during which the button was pushed. This analysisincludes signal cycles only if pedestrians arrived during that cycle. For example, in the before period atTecumseh and Annie (east crosswalk), pedestrians arrived at the curb during 70 cycles. Someone pushed the button and activated the Walk signal during 61.4 percent of those 70 cycles. Inthe remaining 38.6 percent of those 70 cycles, no one pushed the button.
It was expected that the button would be pushed in more cycles in the after period because thelight on the illuminated push button is an indication that the button is working. Thus, individuals who
8
cross the intersection may realize that the button works and may be more inclined to push it than theywould be if no indication were given.
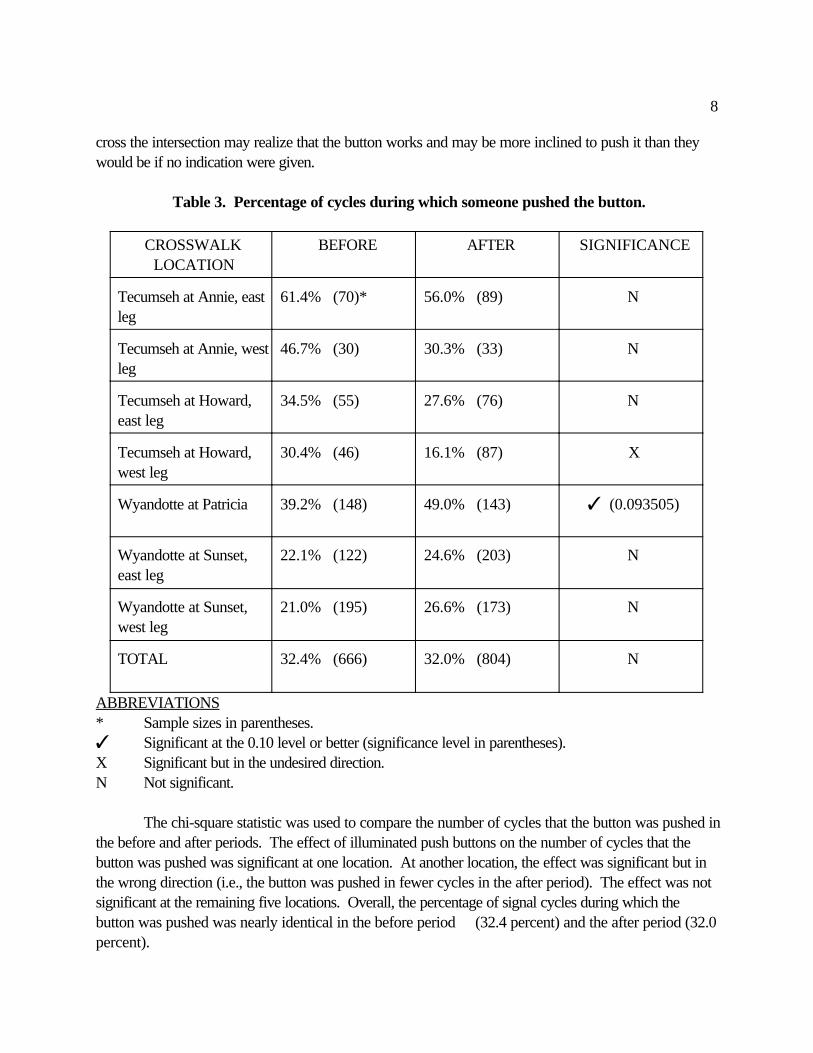
Table 3. Percentage of cycles during which someone pushed the button.
CROSSWALKLOCATION
BEFORE AFTER SIGNIFICANCE
Tecumseh at Annie, eastleg
61.4% (70)* 56.0% (89) N
Tecumseh at Annie, westleg
46.7% (30) 30.3% (33) N
Tecumseh at Howard,east leg
34.5% (55) 27.6% (76) N
Tecumseh at Howard,west leg
30.4% (46) 16.1% (87) X
Wyandotte at Patricia 39.2% (148) 49.0% (143) T (0.093505)
Wyandotte at Sunset,east leg
22.1% (122) 24.6% (203) N
Wyandotte at Sunset,west leg
21.0% (195) 26.6% (173) N
TOTAL 32.4% (666) 32.0% (804) N
ABBREVIATIONS* Sample sizes in parentheses.T Significant at the 0.10 level or better (significance level in parentheses).X Significant but in the undesired direction.N Not significant.
The chi-square statistic was used to compare the number of cycles that the button was pushed inthe before and after periods. The effect of illuminated push buttons on the number of cycles that thebutton was pushed was significant at one location. At another location, the effect was significant but inthe wrong direction (i.e., the button was pushed in fewer cycles in the after period). The effect was notsignificant at the remaining five locations. Overall, the percentage of signal cycles during which thebutton was pushed was nearly identical in the before period (32.4 percent) and the after period (32.0percent).
9
Figure 5. Pedestrians complying with the Walksignal, Tecumseh at Howard, west crossing.
DID PEDESTRIANS COMPLY WITH THE WALK SIGNAL?
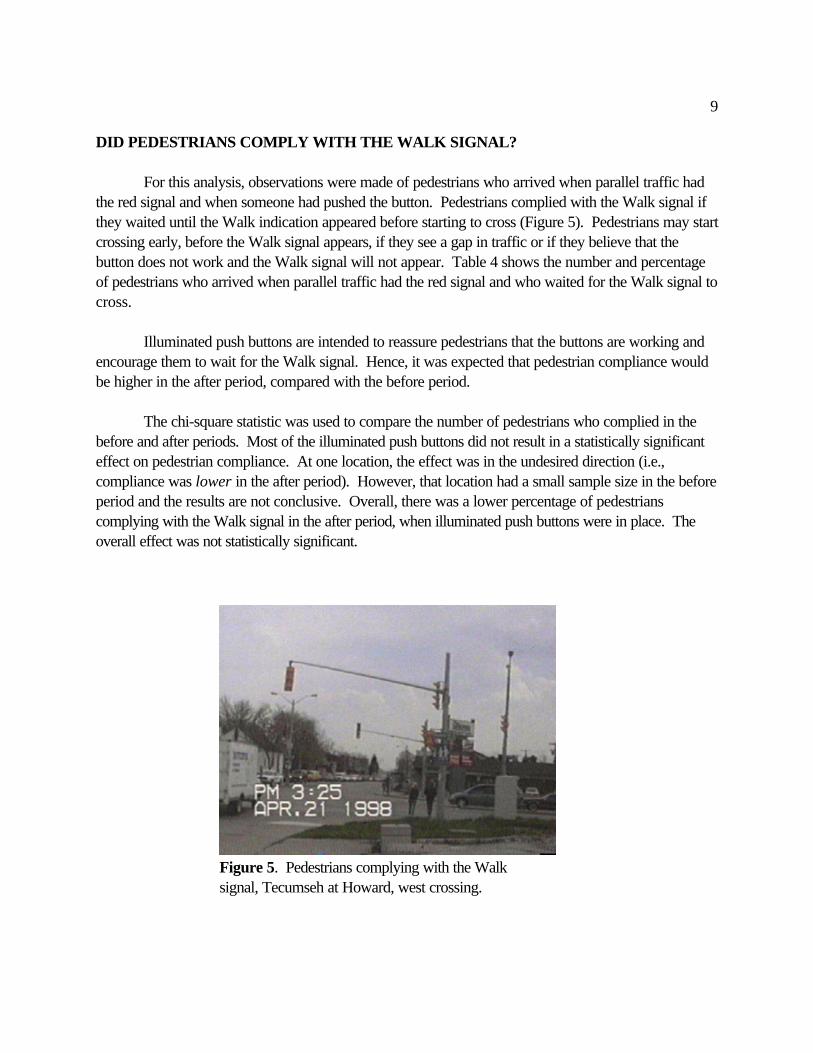
For this analysis, observations were made of pedestrians who arrived when parallel traffic hadthe red signal and when someone had pushed the button. Pedestrians complied with the Walk signal ifthey waited until the Walk indication appeared before starting to cross (Figure 5). Pedestrians may startcrossing early, before the Walk signal appears, if they see a gap in traffic or if they believe that thebutton does not work and the Walk signal will not appear. Table 4 shows the number and percentageof pedestrians who arrived when parallel traffic had the red signal and who waited for the Walk signal tocross.
Illuminated push buttons are intended to reassure pedestrians that the buttons are working andencourage them to wait for the Walk signal. Hence, it was expected that pedestrian compliance wouldbe higher in the after period, compared with the before period.
The chi-square statistic was used to compare the number of pedestrians who complied in thebefore and after periods. Most of the illuminated push buttons did not result in a statistically significanteffect on pedestrian compliance. At one location, the effect was in the undesired direction (i.e.,compliance was lower in the after period). However, that location had a small sample size in the beforeperiod and the results are not conclusive. Overall, there was a lower percentage of pedestrianscomplying with the Walk signal in the after period, when illuminated push buttons were in place. Theoverall effect was not statistically significant.
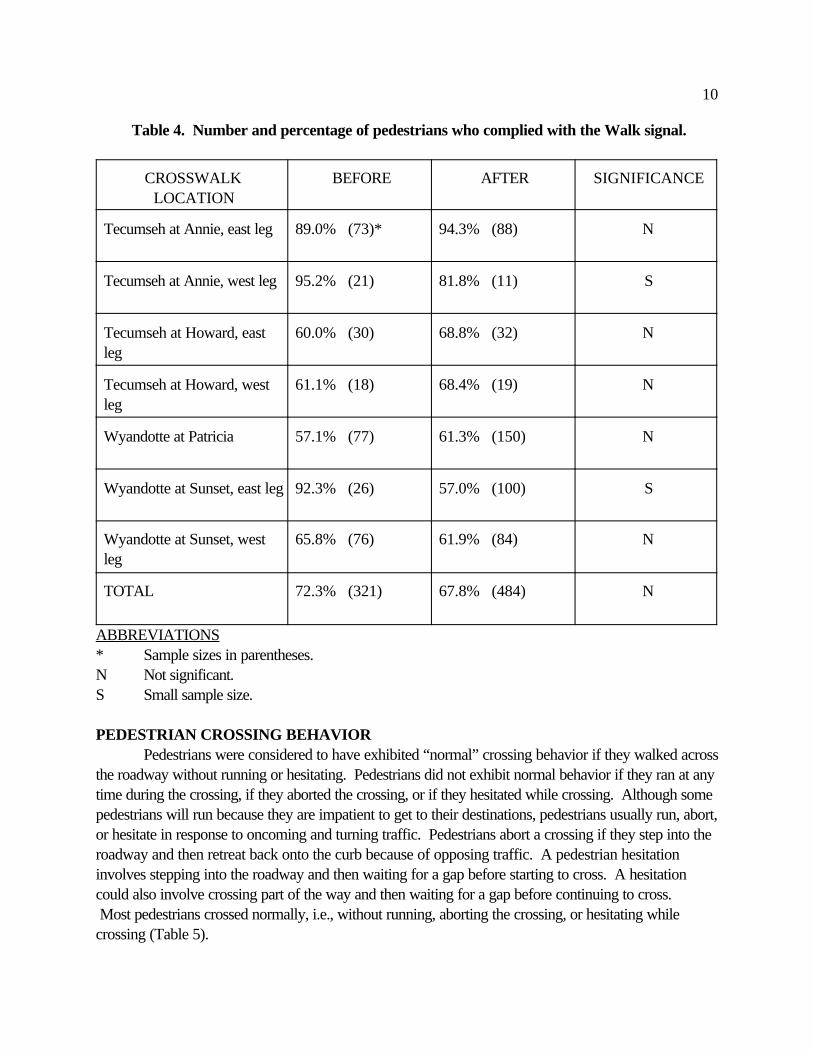
10
Table 4. Number and percentage of pedestrians who complied with the Walk signal.
CROSSWALKLOCATION
BEFORE AFTER SIGNIFICANCE
Tecumseh at Annie, east leg 89.0% (73)* 94.3% (88) N
Tecumseh at Annie, west leg 95.2% (21) 81.8% (11) S
Tecumseh at Howard, eastleg
60.0% (30) 68.8% (32) N
Tecumseh at Howard, westleg
61.1% (18) 68.4% (19) N
Wyandotte at Patricia 57.1% (77) 61.3% (150) N
Wyandotte at Sunset, east leg 92.3% (26) 57.0% (100) S
Wyandotte at Sunset, westleg
65.8% (76) 61.9% (84) N
TOTAL 72.3% (321) 67.8% (484) N
ABBREVIATIONS* Sample sizes in parentheses.N Not significant.S Small sample size.
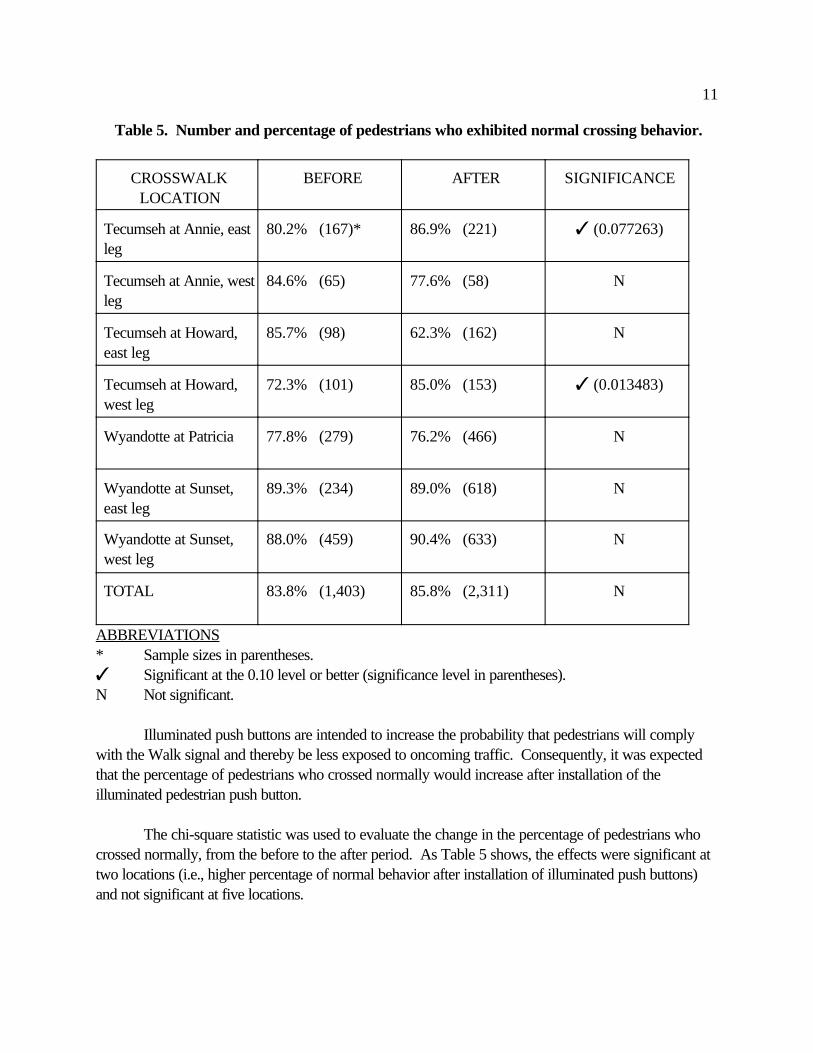
PEDESTRIAN CROSSING BEHAVIORPedestrians were considered to have exhibited “normal” crossing behavior if they walked across
the roadway without running or hesitating. Pedestrians did not exhibit normal behavior if they ran at anytime during the crossing, if they aborted the crossing, or if they hesitated while crossing. Although somepedestrians will run because they are impatient to get to their destinations, pedestrians usually run, abort,or hesitate in response to oncoming and turning traffic. Pedestrians abort a crossing if they step into theroadway and then retreat back onto the curb because of opposing traffic. A pedestrian hesitationinvolves stepping into the roadway and then waiting for a gap before starting to cross. A hesitationcould also involve crossing part of the way and then waiting for a gap before continuing to cross. Most pedestrians crossed normally, i.e., without running, aborting the crossing, or hesitating whilecrossing (Table 5).
11
Table 5. Number and percentage of pedestrians who exhibited normal crossing behavior.
CROSSWALKLOCATION
BEFORE AFTER SIGNIFICANCE
Tecumseh at Annie, eastleg
80.2% (167)* 86.9% (221) T (0.077263)
Tecumseh at Annie, westleg
84.6% (65) 77.6% (58) N
Tecumseh at Howard,east leg
85.7% (98) 62.3% (162) N
Tecumseh at Howard,west leg
72.3% (101) 85.0% (153) T (0.013483)
Wyandotte at Patricia 77.8% (279) 76.2% (466) N
Wyandotte at Sunset,east leg
89.3% (234) 89.0% (618) N
Wyandotte at Sunset,west leg
88.0% (459) 90.4% (633) N
TOTAL 83.8% (1,403) 85.8% (2,311) N
ABBREVIATIONS* Sample sizes in parentheses.T Significant at the 0.10 level or better (significance level in parentheses).N Not significant.
Illuminated push buttons are intended to increase the probability that pedestrians will complywith the Walk signal and thereby be less exposed to oncoming traffic. Consequently, it was expectedthat the percentage of pedestrians who crossed normally would increase after installation of theilluminated pedestrian push button.
The chi-square statistic was used to evaluate the change in the percentage of pedestrians whocrossed normally, from the before to the after period. As Table 5 shows, the effects were significant attwo locations (i.e., higher percentage of normal behavior after installation of illuminated push buttons)and not significant at five locations.
12
DISCUSSION AND CONCLUSIONS
This study involved the before-and-after evaluation of illuminated pedestrian push button deviceson pedestrian behavior. A total of seven crosswalks at four intersections in Windsor, Ontario, was usedfor test purposes. These intersections were located near schools, a large shopping center, and a stripcommercial area. The key findings and authors’ discussion are as follows:
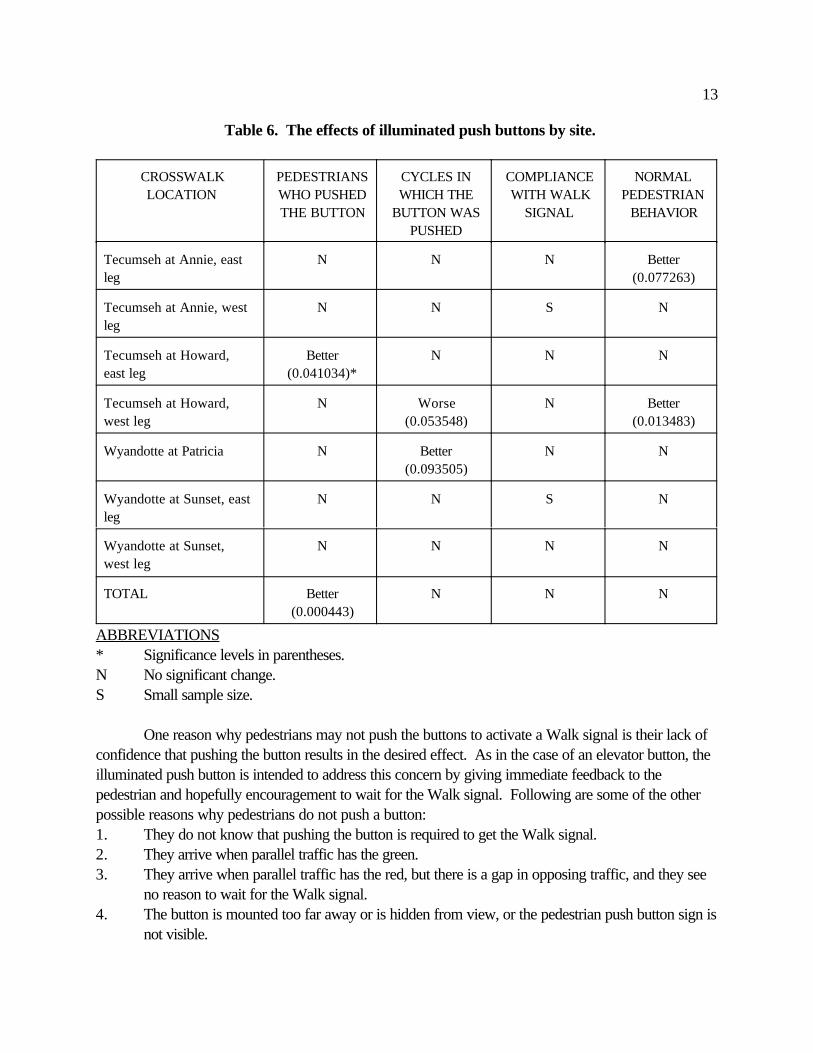
1. The illuminated pedestrian push buttons had a minimal effect on pedestrian behavior atthe test sites.
Table 6 summarizes the effects of illuminated push buttons on the selected MOEs. It shows, forexample, that the effects on the number of pedestrians who pushed the button were significantly better atone location and were not significant at the remaining six locations.
At most sites, no significant differences were found in pedestrian behavior. However, there wasa reduction in “abnormal” crossing behavior (i.e., running, aborted crossings, and hesitations) at two ofthe sites after illuminated push buttons were installed. At one site, there was an improvement in terms ofthe number of signal cycles in which someone pushed the button. When all sites are taken together,there were more pedestrians who pushed the button after the illuminated push buttons had beeninstalled.
Traffic officials in the City of Windsor indicated that they are receiving fewer service calls withthe illuminated push buttons than with the conventional push buttons. They attributed the reduction tofewer “false” service calls, i.e., calls from residents who mistakenly believe that the push buttons are notworking properly when in fact the buttons are working. Thus, the buttons may not have had much of aneffect on pedestrian behavior, but the City is saving money by not having to respond to as manyunnecessary requests for service.
2. A major reason for the lack of effectiveness of the illuminated push button device maybe that it does not address several basic reasons for pedestrians not pushing thebuttons.
The results of this study showed that only 16.9 percent of pedestrians pushed the button in thebefore period and 12.7 percent pushed the button in the after period (Table 3). Furthermore, the buttonwas pushed during only 32 percent of the signal cycles in both the before and after periods (Table 2). Previous research in the United States has found that only about half of pedestrians will push a button toactivate a Walk signal (Zegeer et al., 1985).
13
Table 6. The effects of illuminated push buttons by site.
CROSSWALKLOCATION
PEDESTRIANSWHO PUSHEDTHE BUTTON
CYCLES INWHICH THE
BUTTON WASPUSHED
COMPLIANCEWITH WALK
SIGNAL
NORMALPEDESTRIAN
BEHAVIOR
Tecumseh at Annie, eastleg
N N N Better(0.077263)
Tecumseh at Annie, westleg
N N S N
Tecumseh at Howard,east leg
Better(0.041034)*
N N N
Tecumseh at Howard,west leg
N Worse(0.053548)
N Better(0.013483)
Wyandotte at Patricia N Better(0.093505)
N N
Wyandotte at Sunset, eastleg
N N S N
Wyandotte at Sunset,west leg
N N N N
TOTAL Better(0.000443)
N N N
ABBREVIATIONS* Significance levels in parentheses.N No significant change.S Small sample size.
One reason why pedestrians may not push the buttons to activate a Walk signal is their lack ofconfidence that pushing the button results in the desired effect. As in the case of an elevator button, theilluminated push button is intended to address this concern by giving immediate feedback to thepedestrian and hopefully encouragement to wait for the Walk signal. Following are some of the otherpossible reasons why pedestrians do not push a button:1. They do not know that pushing the button is required to get the Walk signal.2. They arrive when parallel traffic has the green.3. They arrive when parallel traffic has the red, but there is a gap in opposing traffic, and they see
no reason to wait for the Walk signal.4. The button is mounted too far away or is hidden from view, or the pedestrian push button sign is
not visible.

14
Figure 6. A pedestrian push buttondisplaying the message “SIGNAL KOMMT”(signal is coming). (FHWA Study Tour, 1994).
5. They do not know which of two buttons mounted on the same pole pertains to the desiredcrossing.
6. Many pedestrian signals are on recall (and do not have push buttons). These lead pedestrians toautomatically expect a Walk interval at every pedestrian signal.
It seems unlikely that replacing conventional push buttons with illuminated push buttons will effectivelyaddress these issues.
Pedestrians may push buttons (including illuminated push buttons) more often if they get a bigger“reward,” i.e., a shorter wait time or a longer crossing interval. This option may be possible at crossingswith high pedestrian volume but that do not quite warrant a fixed-time signal with an automatic Walksignal on every cycle. The illuminated push buttons that were evaluated in this study did not provide aquicker or longer crossing opportunity.
3. Another reason for the lack of effectiveness may be that the light is difficult to see.
The illuminated push button device that was evaluated in this study is the accepted design beingused at hundreds of intersections in Canada. It has only a small orange light that may be difficult forpedestrians to see, particularly in the sun’s glare.
A more visible acknowledgment or an audible message may be more effective. For example,some push buttons in Germany display a lighted message, “SIGNAL KOMMT” (translates as “Signal iscoming”) when the button is pushed (Figure 6). Other push buttons emit a soft ticking sound that variesin speed according to how much longer before the WALK signal appears (FHWA Study Tour, 1994).
15
4. The potential for gaining further pedestrian compliance to the Walk signal may belimited at the study sites.
The majority of pedestrians (72.3 percent in the before period and 67.8 percent in the afterperiod) who arrived when parallel traffic had the red and who pushed the button complied with theWalk signal (Table 4). Perhaps these percentages are at or near the maximum levels of compliance thatthese crossings will attain, given existing traffic and pedestrian characteristics. That is, there may be littleor no additional compliance that can be realized without effective pedestrian enforcement or educationalprograms.
It appears that the effects of illuminated push buttons on changing pedestrian behavior may belimited. Perhaps the effects are stronger at locations other than those that were evaluated. It is alsolikely that illuminated push buttons may not be the best means to change behavior. As noted at thebeginning of this paper, the City of Windsor is replacing conventional buttons with illuminated buttons inresponse to complaints that the conventional buttons were not working. Illuminated push buttons maybe a worthwhile investment simply to cut down on the costs associated with field-checking buttons thatthe public erroneously report as being out of order.
5. The testing in this study was limited in duration and does not necessarily reflect long-term effects that may result after a longer acclimation period.
The days and times when data were collected in this study are a snapshot of pedestrian andmotorist behavior, and may or may not accurately portray long-term behavior. Day-to-day variations inthe MOEs may obscure significant changes and magnify insignificant changes. For example, if the realityis that 50 percent of pedestrians will comply with the Walk signal in the before period and 60 percent inthe after period, the expected change would be an increase of 10 percent. The actual percentages willvary from one day to the next, with a mean of 50 percent in the before period and 60 percent in the afterperiod. If a higher-than-average percentage of pedestrians complied when before data were collected,and a lower-than-average percentage complied when after data were collected, then the observedchange will be less than 10 percent, and may turn out to be not significant. Improvements in pedestrianbehavior may also result from pedestrian educational programs regarding such devices and propercrossing behavior.
Although the results of this study were disappointing, it would be worthwhile to evaluateilluminated pedestrian push buttons at other locations to determine if improved behavior or crossingconditions would result.
6. Other signal hardware is also being tested in the United States in an attempt toenhance pedestrian safety.
Countdown signals are being tested in a few places, including Sacramento County, California,and Lake Buena Vista, Florida. By displaying the number of seconds left before the steady Don’t Walksignal appears, a countdown signal provides more information than conventional pedestrian signals.
16
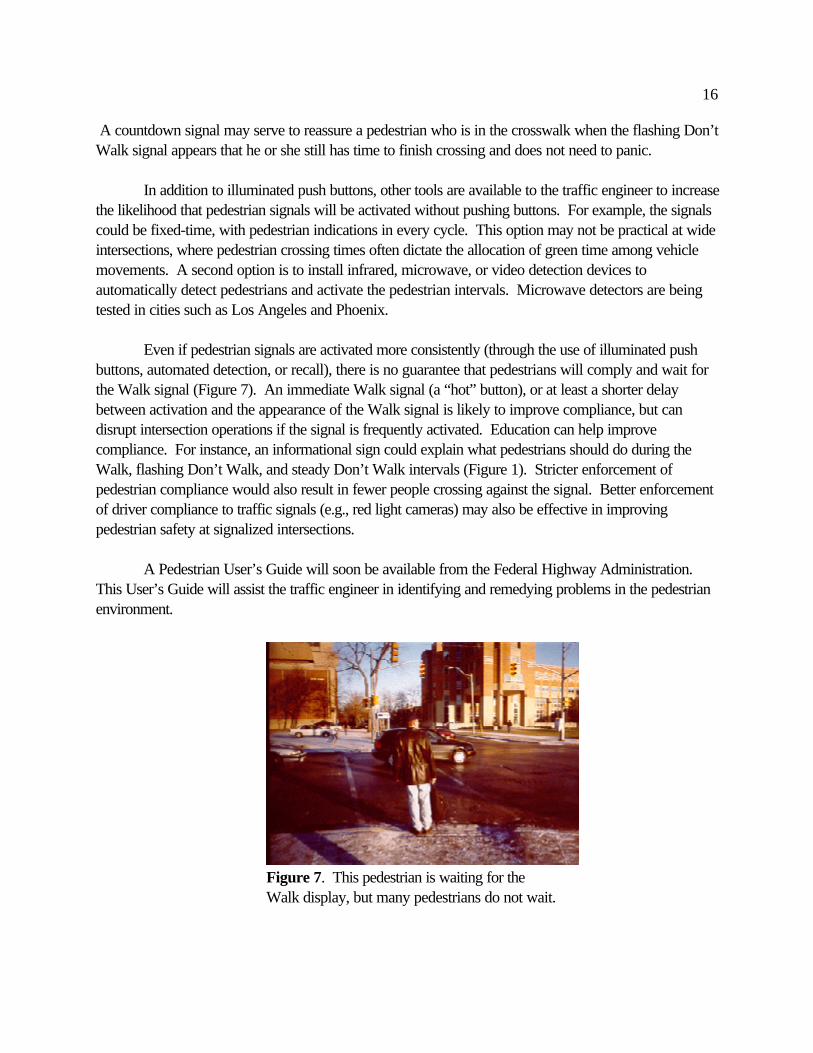
Figure 7. This pedestrian is waiting for theWalk display, but many pedestrians do not wait.
A countdown signal may serve to reassure a pedestrian who is in the crosswalk when the flashing Don’tWalk signal appears that he or she still has time to finish crossing and does not need to panic.
In addition to illuminated push buttons, other tools are available to the traffic engineer to increasethe likelihood that pedestrian signals will be activated without pushing buttons. For example, the signalscould be fixed-time, with pedestrian indications in every cycle. This option may not be practical at wideintersections, where pedestrian crossing times often dictate the allocation of green time among vehiclemovements. A second option is to install infrared, microwave, or video detection devices toautomatically detect pedestrians and activate the pedestrian intervals. Microwave detectors are beingtested in cities such as Los Angeles and Phoenix.
Even if pedestrian signals are activated more consistently (through the use of illuminated pushbuttons, automated detection, or recall), there is no guarantee that pedestrians will comply and wait forthe Walk signal (Figure 7). An immediate Walk signal (a “hot” button), or at least a shorter delaybetween activation and the appearance of the Walk signal is likely to improve compliance, but candisrupt intersection operations if the signal is frequently activated. Education can help improvecompliance. For instance, an informational sign could explain what pedestrians should do during theWalk, flashing Don’t Walk, and steady Don’t Walk intervals (Figure 1). Stricter enforcement ofpedestrian compliance would also result in fewer people crossing against the signal. Better enforcementof driver compliance to traffic signals (e.g., red light cameras) may also be effective in improvingpedestrian safety at signalized intersections.
A Pedestrian User’s Guide will soon be available from the Federal Highway Administration. This User’s Guide will assist the traffic engineer in identifying and remedying problems in the pedestrianenvironment.
17
ACKNOWLEDGMENTS
This study was conducted as part of a research project funded by the Federal HighwayAdministration, under contract number DTFH61-92-C-00138. Carol Tan Esse was the ContractingOfficer’s Technical Representative. The authors gratefully acknowledge the research assistanceprovided by John Wolf (City of Windsor). The authors wish to thank the data collectors: George Fox,Bradley Keadey, Lori McKee, and Thomas Meadows. Eric Rodgman and J. Richard Stewart (fromthe University of North Carolina Highway Safety Research Center) provided computer and statisticalexpertise, respectively.
REFERENCES
FHWA Study Tour for Pedestrian and Bicyclist Safety in England, Germany, and theNetherlands. Report No. FHWA-PL-95-006. Federal Highway Administration, Washington,DC, October 1994.
Zegeer, C.V., Opiela, K.S., and Cynecki, M.J. “Pedestrian Signalization Alternatives,” FederalHighway Administration, July, 1985.