Embed Size (px)
Citation preview

An evaluation of the Quo-Test® performance against NGSP criteria and sigma-metricsLenters-Westra, E.
Diagnosticsfor life

Introduction
The first evaluation of the Quo-Test® was performed by the ERL (European Reference Laboratory) in 20091. This evaluation was not completed as a number of small technical issues with the analyzer became apparent early in the course of the project.
A year later, in 2010, a second evaluation was performed which showed an undesirable lot-lot variability2. A third evaluation3 in 2014 identified a di�erence in results between frozen and fresh patient samples. Because Quo-Test® was calibrated using frozen IFCC secondary reference material, the fresh patient samples showed a significant negative bias.
Following cooperation between the European Reference Laboratory for Glycohemoglobin and Quotient Diagnostics Ltd, an EKF Diagnostics company, Quo-Test® was submitted for further evaluation.
Methods
To get an overall impression of performance before starting the CLSI EP-5 and EP-9 protocols, 12 fresh patient samples were run in duplicate. Values were assigned to the fresh patient samples by the three Secondary Reference Method Procedures (SRMPs) detailed below. Precision was also calculated by analyzing the samples in duplicate. The results were satisfactory to allow the continuation of the evaluation.
The CLSI EP-5 protocol was used to further investigate assay imprecision (duplicate measurements twice per day on two patient samples for 20 days). Aliquots were made from the patient samples and stored at minus 80°C degrees until analysis. CVs were also calculated on the basis of the duplicates of the fresh patient samples in the EP-9 protocol. The CLSI EP-9 protocol was performed twice with two di�erent reagent lot numbers, and the data was used to investigate the bias between the Quo-Test® and the three SRMPs (n= 48 (normally n=40), five days, duplicate measurements). The data was also used to calculate the NGSP certification criteria. NGSP certification requires that, beginning in January 2014, 37 of 40 results must be within 6% (relative) of an individual NGSP SRMP to pass.
An evaluation of the Quo-Test® performance against NGSP criteria and sigma-metrics
Lenters-Westra, E.
HbA1c Researcher, European Laboratory for Glycohemoglobin, Isala, Zwolle, Netherlands
Diagnosticsfor life
HbA1c value determination of the patient samples was performed with three certified SRMPs:
• Roche Tina-quant Gen.2 HbA1c on Integra 800,immunoassay, IFCC and NGSP certified (Roche Diagnostics);
• Premier Hb9210, a�nity chromatography HPLC, IFCC and NGSP certified (Trinity Biotech); and
• Tosoh G8, cation-exchange HPLC, IFCC certified (Tosoh Bioscience).
To check overall calibration and bias independently of the chosen SRMP, the results of the Quo-Test® instruments in the EP-9 procedure were compared with the mean of the three SRMPs, and medical decision point (MDP) analysis was performed at an HbA1c value of 48 mmol/mol (6.5% Diabetes Control and Complications Trial (DCCT) units) and 75 mmol/mol (9.0% DCCT units). When the two methods are statistically identical, the 95% CI for each y MDP includes the corresponding x MDP.
Interference from common Hb variants HbAS, HbAC, HbAD, HbAE, HbAJ, increased A2 (β-thalassemia), and HbF was investigated by the Quo-Test®. Five samples of each variant with di�erent HbA1c values were analyzed in one day.
Results
Table 1 shows the results of the EP-5 protocol and the CVs on the basis of the duplicate samples analyzed in EP-9.
Table 1: Imprecision results based on EP-5 and on the duplicates in EP-9
* Based on duplicates in EP-9
CV (%) SI units CV (%) DCCT units
3.3 (49 mmol/mol) 2.2 (6.6%)
1.8 (75 mmol/mol) 1.3 (9.0%)
Lot number 1* 1.9 1.3
Lot number 2* 1.2 0.9
Quo-Test (EP-5)
Quo-Test (EP-5)
Lot number 020268 Lot number 020269
Mean SRM 48.8 (48.5–49.2) 74.6 (74.1–75.2) 49.2 (48.9–49.5) 75.9 (75.4–76.5)
Tosoh G8 48.9 (48.3–49.4) 73.7 (72.9–74.4) 49.2 (48.7–49.7) 75.0 (74.3–75.7)
Roche Tina-quant Integra 800 48.8 (48.4–49.2) 74.7 (74.1–75.3) 49.1 (48.7–49.5) 76.1 (75.5–76.7)
Premier Hb9210 49.0 (48.7–49.3) 75.1 (74.6–75.6) 49.3 (49.0–49.7) 76.5 (76.0-77.0)
Deming regression lines Lot number 020268 Bias SEE Out ± 6% SRM NGSP criteria
Quo-Test (Y) vs Premier (X) Y=0.96X + 0.33 0.07 0.13 0 Pass
vs Tina-quant (X) Y=0.95X + 0.43 0.09 0.16 2 Pass
vs Tosoh G8 (X) Y=0.93X + 0.58 0.06 0.20 4 Pass*
Deming regression lines Lot number 020269 Bias SEE Out ± 6% SRM NGSP criteria
Quo-Test (Y) vs Premier (X) Y=1.00X + 0.14 0.12 0.14 0 Pass
vs Tina-quant (X) Y=0.99X + 0.24 0.14 0.18 1 Pass
vs Tosoh G8 (X) Y=0.96X + 0.41 0.11 0.20 3 Pass
Table 2 shows NGSP certification pass/fail criteria with respect to the results of the EP-9 protocol performed with fresh patient samples.
Table 2: EP-9 results in DCCT units and calculations of NGSP certification criteria
*37 of 40 results need to be within 6% (relative) of an individual NGSP SRMP to pass certification. In this study 48 samples were analyzed instead of 40.
Figure 1 shows the EP-9 results compared to the mean of the three SRMP. The mean bias of the two lot numbers used compared to the mean of the three SRMP is < 2 mmol/mol (bias lot number 020268 is 0.6 mmol/mol and lot number 020269 is 1,1 mmol/mol).
Figure 1: Quo-Test vs mean Premier Hb9210, Tosoh G8 and Roche Tina-quant on Integra 800.
Diagnosticsfor life
Table 3 shows the results of the medical decision point analysis of 48 mmol/mol and 75 mmol/mol compared to the mean of the three SRMP and the individual SRMP.
Table 3: Medical decision point of 48 mmol/mol and 75 mmol/mol (in brackets the 95% CI) compared to the di�erent reference methods
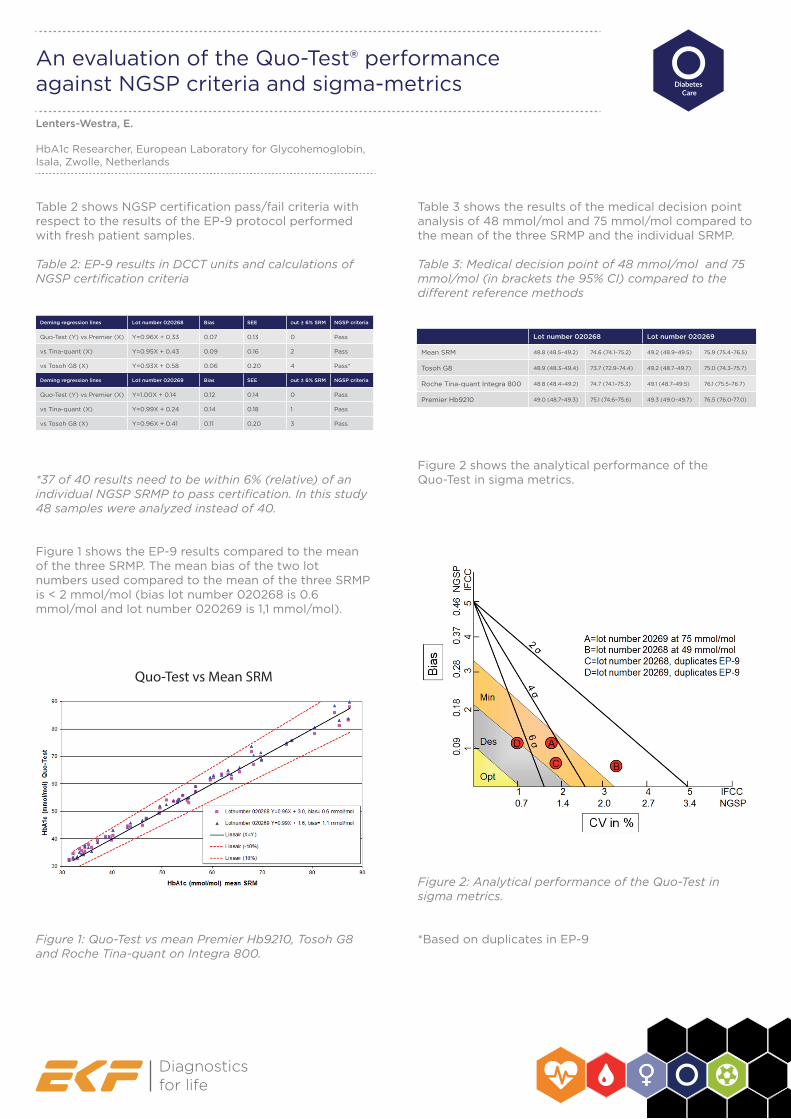
Figure 2 shows the analytical performance of the Quo-Test in sigma metrics.
Figure 2: Analytical performance of the Quo-Test in sigma metrics.
*Based on duplicates in EP-9
Quo-Test vs Mean SRM
Lenters-Westra, E.
HbA1c Researcher, European Laboratory for Glycohemoglobin, Isala, Zwolle, Netherlands
An evaluation of the Quo-Test® performance against NGSP criteria and sigma-metrics

Figure 3 shows the results of fresh normal non-variant samples (n=48) and frozen Hb-variants samples (n=5 per Hb-variant). The mean relative di�erence of the Hb-variants measured in SI units (mmol/mol) compared to the assigned value was for HbAS 1.1%, HbAC 1.2%, HbAD 5.1%, HbAE 9.2%, HbAJ 0.7% elevated A2 5.3% and HbF -7.0%. The percentage HbF in the samples were 3.2%, 4.6%, 8.6%, 15% and 18%. These results have not been corrected for the bias with frozen normal non-variant samples.
Figure 3: Interference of Hb-variants with the Quo-Test
Discussion
The CV in the EP-5 protocol at an HbA1c value of 49 mmol/mol is a little (3.3% in SI units and 2.2% in DCCT units) above the criteria of <3% in SI units (<2% in DCCT units). However, the CVs at an HbA1c value of 75 mmol/mol and the CVs of the duplicates in the EP-9 were well within the acceptable criteria.
The calibration of the Quo-Test® is su�cient which was confirmed by passing the NGSP criteria compared with the three SRMPs. The mean bias compared with the mean of the SRMPs was well within the acceptable criteria of <2 mmol/mol. Medical decision point analysis at an HbA1c value of 48 mmol/mol and 75 mmol/mol showed a significant statistical di�erence compared with the mean of the SRMP and the individual SRMP.
Diagnosticsfor life
However, clinically seen, the di�erences were small and therefore acceptable. The combined performance in sigma metrics is very good. Sigma is >2 at 48 mmol/mol and at a HbA1c value of 75 mmol/mol > 4. If the CVs of the duplicates are examined then it is apparent that one lot number has a sigma >6; this is a class-leading level of performance.
From the previous study we know that the Quo-Test® had a negative bias of approximately 2 mmol/mol with fresh patient samples because in the past frozen IFCC secondary reference material was used to calibrate the Quo-Test® and this material appeared not to be commutable with the Quo-Test® methodology. To investigate the interference of Hb-variants the study used frozen samples. Remarkably, the Quo-Test® showed no interference of the common Hb-variants HbAS, HbAC, HbAD, HbAE, HbAJ, elevated A2 (β-thallasemia) and HbF <8.6% (figure 2). The main negative relative di�erence of the Hb-variants compared with the 2014 study was that this study compensated by the adjusted calibration with fresh patient samples, except for HbAE. In the 2014 study the Quo-Test® had a positive relative di�erence of HbAE samples compared with the reference method but now, due to the adjusted calibration, the mean relative di�erence was 9.2%.
Conclusions:
The Quo-Test® met the generally accepted performance criteria for HbA1c.
References
1. Lenters-Westra E, Slingerland RJ. Six of eight Hemoglobin A1c point-of-care instruments do not meet the general accepted analytical performance criteria. Clinical Chemistry 2010;56:44-52.2. Lenters-Westra E, Slingerland RJ. Evaluation of the Quo-Test Hemoglobin A1c point-of-care instrument: second chance. Clin Chem 2010;56:1191-1193.3. Lenters-Westra E, Slingerland RJ. Three of Seven Hemoglobin A1c Point-of-Care Instruments Do Not Meet the Generally Accepted Analytical Performance Criteria. Clinical Chemistry 2014;1062-72.4. Weykamp C, John G, Gillery P, English E, Ji L, Lenters-Westra E, Little RR, Roglic G, Sacks DB, Takei I. Investigation of 2 Models to Set and Evaluate Quality Targets for HbA1c: Biological Variation and Sigma-Metrics. Clinical Chemistry 2015;61:752-9.
Quo-Test® vs Premier Hb9210(HbF with Menarini HA8180)
Lenters-Westra, E.
HbA1c Researcher, European Laboratory for Glycohemoglobin, Isala, Zwolle, Netherlands
An evaluation of the Quo-Test® performance against NGSP criteria and sigma-metrics