Embed Size (px)
Citation preview

July 15, 2014
An Evaluation Report
Your File No.14-00011
Sample Report1234 Main Street
Sacramento
CALIFORNIA
95882
COMPLETED FOR:
Karen Short
North Valley Bank
300 Park Marina Circle
Redding, CA 96001
Processed with PetroMARK® Valuation Software
COPYRIGHT © 2014 C-STORE EVALUATIONS LLC. ALL RIGHTS RESERVED.

2 EVALUATION REPORT
© Copyright 2007-2014 C-Store Evaluations LLC. All Rights Reserved.
C - S T O R E E V A L U A T I O N S L L C A SPECIALIZED FINANCIALSERVICES PROVIDER OF C-STORE VALUATIONS
D A L L A S, T E X A S
FOR CURRENT INDUSTRY INFORMATION, PLEASE VISIT US AT: w w w . c s t o r e v a l u e . c o m
E-Mail: [email protected]

3 EVALUATION REPORT
© Copyright 2007-2014 C-Store Evaluations LLC. All Rights Reserved.
Table of Contents
Situs .................................................................................................................... 4 Physical Characteristics ...................................................................................... 4 Recommended Fair Market Values ..................................................................... 4 Diagnostic Ratios Panel ...................................................................................... 5 Intended User/Client Identification ...................................................................... 6 Methodology: Capitalization of Earnings ............................................................ 7 Step 1: Trade Area Supply and Demand ........................................................... 8 Step 2: Gallonage and Sales Projections ........................................................... 9 Step 3: Calculation of Adjusted EBIDTA .......................................................... 10 Step 4: Capitalization of Earnings .................................................................... 11 Value Check: Peer-Group Transaction Data ..................................................... 12 Recent National Value Trends for NAICS 4457 ................................................ 13 Value Check: Cost Approach ........................................................................... 14 Mortgage Loan Metrics ..................................................................................... 15 Preparer’s Certification ..................................................................................... 18 Supplemental Report Provisions ....................................................................... 19 Appendix
How Retail Property Value is Created ............................................................................. 24 Trade Area Map and Drive-Times ................................................................................... 25 Photographs .................................................................................................................... 26 Required Repairs/Deferred Maintenance ........................................................................ 27 Sketch/Plat Map/Aerial .................................................................................................... 28 Competitive/Hypermarket Locations ............................................................................... 29 FF&E Valuation ............................................................................................................... 30 Shutdown Value .............................................................................................................. 31 Leased Fee Valuation (Optional) ..................................................................................... 32

4 EVALUATION REPORT
© Copyright 2007-2014 C-Store Evaluations LLC. All Rights Reserved.
Situs
Store Number 14-0011
Brand Union 76
Street Address 1234 Main Street
City Sacramento
County Sacramento
State CALIFORNIA
Zip Code 95882
Owner Smith Properties LLC
Assessment Number 1234-5678-9123
Assessed Value $566,033
Sale Price Last 5 Years $0
Physical Characteristics
Site Size (Sq. Ft.) 27,878
Store Size (Sq. Ft.) 1,624
Fueling Positions 8
Car Wash 0
Year Built/Major Remodel 2013
Effective Age 15
FAIR
MARKET VALUE
Real Property Value $1,071,000
TANGIBLE ASSETS, REALTY
(Site, Store Building, Canopy, Fuel Dispensers, USTs, Electronics
Car Wash and all associated systems, if any)
FF&E Value $10,000
TANGIBLE ASSETS, NON-REALTY
(Moveable Personal Property)
Business Enterprise Value $66,000
INTANGIBLE ASSETS
(Capitalized Accounting and Economic Profit)
Going Concern Value $1,147,000TOTAL ASSESTS OF THE BUSINESS
RECOMMENDED FAIR MARKET VALUES
FAIR MARKET VALUE OF THE FEE SIMPLE INTEREST UNDER TYPICAL OWNERSHIP
BASED ON EARNINGS CAPITALIZATION AND ASSUMING 100% FAIR MARKET VALUE
Property Identification
Assessed value is
lower than 100% of
Fair Market Value.
5 EVALUATION REPORT
© Copyright 2007-2014 C-Store Evaluations LLC. All Rights Reserved.
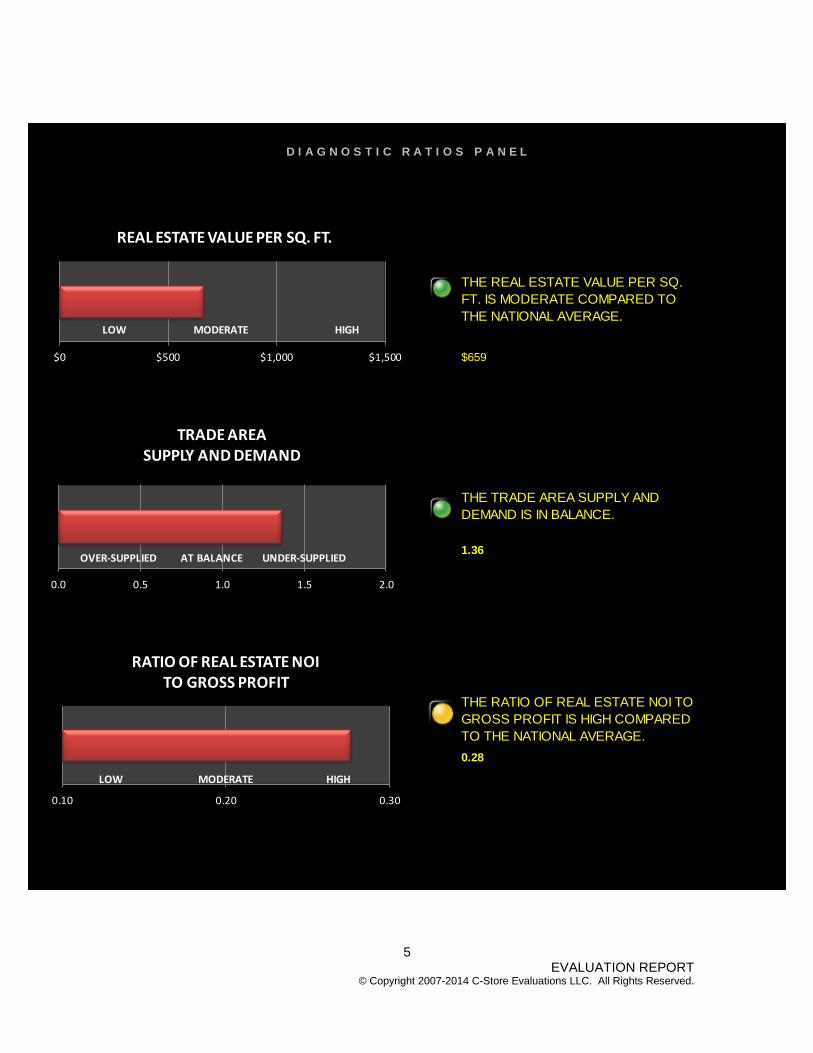
$659
1.36
0.28
THE TRADE AREA SUPPLY AND
DEMAND IS IN BALANCE.
THE REAL ESTATE VALUE PER SQ.
FT. IS MODERATE COMPARED TO
THE NATIONAL AVERAGE.
THE RATIO OF REAL ESTATE NOI TO
GROSS PROFIT IS HIGH COMPARED
TO THE NATIONAL AVERAGE.
D I A G N O S T I C R A T I O S P A N E L
$0 $500 $1,000 $1,500
LOW MODERATE HIGH
REAL ESTATE VALUE PER SQ. FT.
0.0 0.5 1.0 1.5 2.0
OVER-SUPPLIED AT BALANCE UNDER-SUPPLIED
TRADE AREASUPPLY AND DEMAND
0.10 0.20 0.30
LOW MODERATE HIGH
RATIO OF REAL ESTATE NOI TO GROSS PROFIT

6 EVALUATION REPORT
© Copyright 2007-2014 C-Store Evaluations LLC. All Rights Reserved.
CLIENT FILE NO. 14-0011
PROJECT NAME Sample Report
STATE JURISDICTION California
DATE OF EVALUATION February 5, 2014
INTENDED USER(S) North Valley Bank
CLIENT North Valley Bank
Client Name Karen Short
Street Address 300 Park Marina Circle
City, State, Zip Redding, CA 96001
PURPOSE an evaluation of the total assets of the business.
STUDY LOCATION Sample Report
Street Address 1234 Main Street
City Sacramento
State CALIFORNIA
Zip 95882
County Sacramento
OWNER Smith Properties LLC
BRAND Union 76
PROPERTY TYPE convenience store with gas station
Assessment Number 1234-5678-9123
Assessed Value $566,033
Sale Price Last 5 Years
Year Built/Remo 2013
Our File No. 14-0032
Actual Age 1
Flood Map No. 07067C0170H
Census Tract No.
Flood Map Date 8/6/2012
Flood Zone Yes
Comments:
1. On-going environmental inspections are taking place. It is assumed the property is free and clear of contamination.
2. The assessor shows 1,624 sq ft. as the building size. The building reportedly inlcudes 828 sq. ft. of auto repair
space that is leased to a third-party for $48,000 per year. From the rental income, 35% is deducted for vacancy
allowance, utilities, maintenance and reserves. The net rental income is $31,200. The merchadise area is 796 sq. ft.
3. Because of the older design (circa 1969), we have added 200-basis points to the capitalization rate to reflect
greater market risk. This is a hybrid automotive service/convenience store.
Intended User/Client Identification

7 EVALUATION REPORT
© Copyright 2007-2014 C-Store Evaluations LLC. All Rights Reserved.
Method of Valuation: Earnings Capitalization Convenience stores and gas stations are special-built properties that are designed to generate earnings from the retail sale of specific products. According to Convenience Stores and Retail Fuel Properties: Essential Appraisal Issues, published by the Appraisal Institute, the most appropriate and accurate method for appraising the fair market value of these properties is an earnings capitalization. This method is more accurate than the cost approach or sales comparison approach. An earnings capitalization approach best reflects the actions of actual buyers and sellers of convenience stores and gas stations. Stores and locations with poor earnings have lower real estate values than those with better physical features and locations. The fee simple value is based on typical management and ownership of a particular store and location. The fair market value of the fee simple interest of the real property of a convenience store does not consider nor include any specific brand. EARNINGS CAPITALIZATION Step 1 An earnings capitalization approach begins with a supply and demand analysis of the trade area. A typical convenience store will draw 70% to 80% of its customers from the primary trade area. A successful location requires at least 2,500 people per store within a 2-3 mile radius of the store. Hypermarket competition is a significant competitive disadvantage for a traditional convenience store. Step 2 is a projection of gallonage and sales. The physical features of the subject, such as the accessibility of the site, the size and age of the store, and the number of fuel positions, along with the supply and demand characteristics of the trade area, determine the earnings capacity of any convenience store. Step 3 is the calculation of Adjusted EBIDTA, which is the gross economic return to all the assets of the business. After allocating the earnings to FF&E and the business enterprise, the residual earnings is the amount earned by the real estate. Step 4 A capitalization of the net earnings to real estate is the final step in estimating this evaluation process. A graphic of this process is shown in the Appendix.
Key Point
An earnings capitalization is the most appropriate method of appraising convenience stores and gas stations.

8 EVALUATION REPORT
© Copyright 2007-2014 C-Store Evaluations LLC. All Rights Reserved.
Trade Area Characteristics
Primary Market Population 11,181
Secondary Market Population N/A
Primary Market Competition 4
Location Quotient 1.36
ESRI® Retail Spending Potential Index 0.99
Hypermarket Competition No
Step 1: Trade Area Supply and Demand The Primary Trade Area for convenience retail property is generally the 2 to 3-minute drive-time or the 2-mile ring. The following population and competitive levels are sourced from ESRI® Business Analyst. Hypermarket competition is the most significant threat to the profit of a traditional convenience store or gas station. A hypermarket is a large format discount retailer that sells department store merchandise, groceries and gasoline. Typically, hypermarkets sell three times the volume of gasoline of a traditional convenience store at a discount of 5 to 7 cents per gallon of the retail price. Often, the retail street price of gasoline at the hypermarket is less than the wholesale cost to the convenience store operator. The characteristics for the subject store’s primary trade area, including supply and demand, resident demographics, and hypermarket competition, are summarized below. This trade area data is sourced from ESRI®. A map of the trade area is included in the appendix.
Key Point
A hypermarket is a large format discount retailer that sells department store merchandise, groceries, and gasoline. Examples of hypermarkets include Wal-Mart and Costco.

9 EVALUATION REPORT
© Copyright 2007-2014 C-Store Evaluations LLC. All Rights Reserved.
PetroMARK®
PHYSICAL FACTORS
Fuel Positions 8
Store Size 1,624
Access 2
Traffic Count 2
ECONOMIC FACTORS 0.00
Location Quotient 1.36
ESRI Supply/Demand 1
ESRI Spending Potential Index 0.99
FEE SIMPLE GALLONAGE 1,481,000
FEE SIMPLE FUEL MARGIN $0.19
FEE SIMPLE IN-STORE SALES/SQ FT $239
FEE SIMPLE BRANDED FOOD SERVICE SALES/SQ FT $0
FEE SMPLE CAR WASH SALES $0
Day Parts
Gallonage and Sales Calculator
FEE SIMPLE INTEREST UNDER TYPCIAL OWNERSHIP AND MANAGEMENT
Step 2: Gallonage and Sales Projection
Using the subject’s physical features, such as site size, store size, age, fueling positions, and trade area characteristics which measure supply and demand, the subject’s gallonage and sales potential can be estimated. Our PetroMARK® Software uses this data along with operating statistics published by The National Association of Convenience Stores and the Oil Pricing Information Service to project the gallons of fuel sold (gallonage) and sales potential of the subject store assuming fee simple ownership and typical management. These projections of gallonage and sales are not based on the actual ownership or existing branding agreements. The existing branding and management do not represent fee simple ownership, and therefore should not be the basis for a fair market value projection of gallonage and sales. The following page summarizes our Adjusted EBIDTA calculations based on the gallonage and sales projections in the table below.

10 EVALUATION REPORT
© Copyright 2007-2014 C-Store Evaluations LLC. All Rights Reserved.
Step 3: Calculation of Adjusted EBIDTA
PetroMARK®
COST OF GROSS
GROSS SALES GOODS SOLD PROFIT
1 Motor Fuel2 Gallonage 1,481,0003 Price per Gallon $3.504 Gross Fuel Sales $5,183,5005 Cost of Goods Sold $4,900,6296 Motor Fuel Gross Profit $282,8717 Fuel Margin Cents per Gallon $0.19
8 Inside Sales9 In-Store Sales $387,879
10 Cost of Goods Sold $282,51511 In-Store Gross Profit $105,36512 In-Store Margin 27%13 In-Store Sales Per Sq. Ft. $239
14 Food Service Sales $015 Cost of Goods Sold $016 Food Service Gross Profit $017 Food Service Margin #DIV/0!
18 Inside Sales Gross Profit $105,36519 Inside Margin 27%
20 Car Wash Sales $021 Cost of Goods Sold $022 Car Wash Gross Profit $023 Car Wash Margin #DIV/0!
24 Total Gross Sales $5,571,379
25 Total Gross Profit $388,23626 Gross Profit Margin 7%27 Motor Fuel Contribution Ratio 73%27 In-Store Contribution Ratio 27%29 Car Wash Contribution Ratio 0%
30 Product Shrink 0.23% $12,536
31 Operating Expenses% GROSS PROFIT
32 Labor 35% $135,88233 Credit Card Fees 8% $31,05934 Utilities 6% $23,29435 Other 8% $31,83536 Sub-total Operating Expenses 57% $222,071
37 Adjusted EBIDTA 40% $153,629
GROSS RETURN TO ASSETS OF THE BUSINESS
38 Asset Allocation of Earnings
39 Earnings to FF&E $3,846
40 Earnings to Accounting Profit $33,000
41 Earnings to Economic Profit $0
42 Residual Earnings to Real Estate $116,783
43 Less: Real Estate Operating Expenses $40,874
44 Add: Other Real Estate Net Income $31,200
45 Net Operating Income to Real Estate $107,109
46 Economic Gross Rent per Sq. Ft. $71.91
47 Economic Net Rent per Sq. Ft. $65.95
EBIDTA Projection and Earnings Allocation SummaryEBIDTA PROJECTION UNDER FEE SIMPLE INTEREST UNDER TYPCIAL OWNERSHIP AND MANAGEMENT
Step 3: Calculation of Adjusted EBIDTA

11 EVALUATION REPORT
© Copyright 2007-2014 C-Store Evaluations LLC. All Rights Reserved.
ADJUSTED EBIDTA $153,629
Asset Allocation of Earnings
Earnings to FF&E $3,846
Earnings to Accounting Profit $33,000
Earnings to Economic Profit $0
Residual Earnings to Real Estate $116,783
Less: Real Estate Operating Expenses $40,874
Add: Other Real Estate Net Income $31,200
Net Operating Income to Real Estate $107,109
Economic Gross Rent per Sq. Ft. $71.91
Economic Net Rent per Sq. Ft. $65.95
Capitalization of Fee Simple Earnings
CAPITALIZATION
RATE
1. Real Property Value
TANGIBLE ASSETS, REALTY
(Site, Store Building, Canopy, Fuel Dispensers, USTs, Electronics)
2. FF&E Value
TANGIBLE ASSETS, NON-REALTY
(Moveable Personal Property)
3. Business Enterprise Value
INTANGIBLE ASSETS
(Capitalized Accounting and Economic Profit)
Going Concern Value
TOTAL ASSETS OF THE BUSINESS
25%
50%
$1,071,000
$10,000
$66,000
$1,147,000
VALUE
10.0%
Step 4: Capitalization of Earnings Adjusted EBIDTA is the gross return to the assets of the business. These business assets include three categories: 1. tangible assets, realty; 2. tangible assets, non-realty; and 3. intangible assets. The earnings allocation and capitalization rates are shown below.

12 EVALUATION REPORT
© Copyright 2007-2014 C-Store Evaluations LLC. All Rights Reserved.
Price Range Check: Peer Group Real Estate Sale Prices Peer group sales of convenience stores with gas stations (NAICS 4471) located near the subject property are summarized below. PEER GROUP TRANSACTION SUMMARY NAICS 4471
CALIFORNIA C-Store Real Estate Sales
SALE STORE YR BLT SITE PRICE
SALE DATE LOCATION PRICE SIZE REMO SIZE SQ.FT.
1 2013 Calabasas $2,650,000 1,540 1966 0.54 $1,721
2 2012 Fresno $2,615,000 2,300 2001 0.085 $1,137
3 2012 Cathedral City $2,400,000 2,866 1998 0.78 $837
4 2012 San Diego $1,500,000 1,728 1968 0.5 $868
5 2013 Glendale $1,513,000 2,079 1971 0.61 $728
6 2013 Sacramento $2,600,000 3,600 2004 1.18 $722
7 2012 Stockton $2,900,000 3,274 1998 0.66 $886
8 2013 Moreno Valley $2,680,000 4,836 1997 0.88 $554
9 2012 Simi Valley $1,603,000 1,702 1980 0.47 $942
10 2013 Hayward $3,500,000 1,572 1968 0.81 $2,226
LOW
$554
HIGH
$2,226
MEDIAN
$868
AVERAGE $933
The average price per square foot of store area from this peer group is $933 and the median price is $868. We have estimated the value of the subject’s real property at $1,071,000 , or $659 per square foot of store area under typical ownership and operations.

13 EVALUATION REPORT
© Copyright 2007-2014 C-Store Evaluations LLC. All Rights Reserved.
$400,000
$600,000
$800,000
$1,000,000
$1,200,000
$1,400,000
2007 2008 2009 2010 2011 2012
USA MEDIAN C-STORE SALE PRICES2007 TO 2012
Recent Sales and Value Trends NAICS 4471
Convenience store real estate prices peaked in 2006 at just under $1.4 million, according to CoStar. This median price reflects convenience stores with fuel service. Convenience store sales prices declined from 2007 to 2012. The real estate price movement for convenience stores has fared slightly worse than retail commercial property in the U.S. as a whole. Moody’s National Commercial Properties Index shows retail commercial real estate prices down 39% from their peak in 2007. The national median price of convenience stores is down 44% over the same period to $785,000 in 2012. (Source: CoStar) CoStar’s Commercial Property Resale Price Index (CPRPI) indicates that retail property prices began stabilizing in 2012. We do not anticipate further price declines over the next 24 months.
Key Point
The median price of a convenience store with fuel service declined 44% from 2007 to $785,000 in 2012.

14 EVALUATION REPORT
© Copyright 2007-2014 C-Store Evaluations LLC. All Rights Reserved.
Cost Approach Summary (Real Estate Only)NOTE: F F & E NOT INCLUDED
DEPRECIATED VALUES
Store Building 253,750$
Fuel Service 112,000$
Car Wash -$
Site Improvements 13,127$
Total Depreciated Value of Improvements 378,877$
SITE VALUE 650,000$
INDICATED VALUE 1,028,877$
Cost New 906,508$
Cost New Less Physical Deterioration + Site Value 1,113,400$
Total Obsolescence -$
SECTION A
Replacement Cost New of the Store 406,000$
Accrued Physical Curable Deterioration -$
Observed Physical Age 15
Accrued Physical, Incurable Deterioration 152,250$
Accrued Functional Obsolescence -$
Accrued External Obsolescence -$
Depreciated Value of the Store Building 253,750$
Real Estate Valuation Check: The Cost Approach

15 EVALUATION REPORT
© Copyright 2007-2014 C-Store Evaluations LLC. All Rights Reserved.
SECTION B
Replacement Cost New of the Fuel Service 448,000$
Accrued Physical Curable Deterioration -$
Observed Physical Age 15
Accrued Physical, Incurable Deterioration 336,000$
Accrued Functional Obsolescence -$
Accrued External Obsolescence -$
Depreciated Value of the Fuel Service 112,000$
SECTION C
Replacement Cost New of the Car Wash -$
Accrued Physical Curable Deterioration -$
Observed Physical Age 15
Accrued Physical, Incurable Deterioration -$
Accrued Functional Obsolescence -$
Accrued External Obsolescence -$
Depreciated Value of the Car Wash -$
SECTION D
Replacement Cost New of the Site Improvements 52,508$
Accrued Physical Curable Deterioration -$
Observed Physical Age 15
Accrued Physical, Incurable Deterioration 39,381$
Accrued Functional Obsolescence -$
Accrued External Obsolescence -$
Depreciated Value of the Site Improvements $13,127
Cost Approach Conclusion
The indicated value for the real estate from the cost approach is $1,028,877 with
$650,000 allocated to the site and $378,877 allocated to the improvements.
The Insurable replacement Cost is estimated at $833,700 .

16 EVALUATION REPORT
© Copyright 2007-2014 C-Store Evaluations LLC. All Rights Reserved.
Sample Report
VALUATION SUMMARY Page 7
Mortgage LoanTechnical SummaryInsurable Replacement Cost $833,700
Exposure Time 3 to 12 mo
Marketing Time 3 to 12 mo
Remaining Economic Life 50 yrs
NOI to Real Estate and Debt Service Analysis:
Estimated Value of Real Estate $1,071,000
Adjusted EBIDTA $153,629
Less: Return to Tangible Assets, Non-Realty $3,846
Less: Real Estate Operating Expenses (Property Taxes, Maintenance.etc) $40,874
Less: Return to Intangible Assets (Accounting and Economic Profit) $33,000
Add: Other Income to Real Estate $31,200
Equals: NOI to Real Estate $107,109
Targeted Debt Coverage Ratios
Low 1.5
High 2.25
Dollars Available for Debt Service (Low) $47,604
Dollars Available for Debt Service (High) $71,406
Mortgage Constant 0.0758
Total Possible Mortgage, Real Estate Only (Low) $627,622
Total Possible Mortgage, Real Estate Only (High) $941,433
Calculated Loan-to-Value Ratios 0
Low 59%
High 88%
Mortgage Loan Metrics BASED ON FEE SIMPLE OWNERSHIP UNDER TYPICAL MANAGEMENT
Mortgage terms provided by Realty Rates.com

17 EVALUATION REPORT
© Copyright 2007-2014 C-Store Evaluations LLC. All Rights Reserved.
Report End Notes
Sources consulted in preparing this report:
1. State of the Industry Report, National Association of Convenience Stores, published annually
2. Retail Fuel Watch, Oil Pricing and Information Service, published annually.
3. ESRI® Business Analyst
4. Claritas Retail Market Report
5. CoStar
6. PetroMARK® Valuation Software

18 EVALUATION REPORT
© Copyright 2007-2014 C-Store Evaluations LLC. All Rights Reserved.
PREPARER’S CERTIFICATION We certify that, to the best of our knowledge and belief: • The statements of fact contained in this report are true and correct • The reported analyses, opinions, and conclusions are limited only by the reported assumptions and limiting conditions and are our personal, impartial, and unbiased professional analyses, opinions, and conclusions. • We have no present or prospective interest in the property that is the subject of this report and no personal interest with respect to the parties involved. • We have no bias with respect to the property that is the subject of this report or to the parties involved. • Our engagement in this assignment was not contingent upon developing or reporting predetermined results. • Our compensation for completing this assignment is not contingent upon the development or reporting of a predetermined value or direction in value that favors the cause of the client, the amount of the value opinion, the attainment of a stipulated result, or the occurrence of a subsequent event directly related to the intended use of this evaluation. • Our analyses, opinions, and conclusions were developed, and this report has been prepared, in conformity with the Interagency Appraisal and Evaluation Guidelines date December 10, 2010 jointly by the Office of the Comptroller of the Currency, The Board of Governors of the Federal Reserve System, The Federal Deposit Insurance Corporation, and the Office of Thrift Supervision ("Federal Guidelines"). Accordingly this Report may be relied upon by Customer in accordance with the Federal Guidelines. • We have not made a personal viewing of the property that is the subject of this report. • Robert E. Bainbridge, MAI developed the PetroMARK® software used in estimating the value of this property, and provided consultation with the undersigned preparer of this evaluation report, in the following manner:
1. Checked and approved the assumptions in the model 2. Checked the input data in the model. 3. Checked the model output for reasonableness, based on the assumptions and input data. 4. Provided statistical testing of the model input variables and found a 93% coefficient of determination, and a coefficient of variation of 11%.
.
Evaluation Report and Software Output Reviewed By
Sandra G. Bainbridge Managing Partner
This Evaluation report has been prepared by
C-Store Evaluations LLC Sandra G. Bainbridge, Managing Partner A SPECIALIZED FINANCIAL SERVICES COMPANY OF
C-Store Valuations www.cstorevalue.com

19 EVALUATION REPORT
© Copyright 2007-2014 C-Store Evaluations LLC. All Rights Reserved.
EVALUATION PRODUCT SUPPLEMENTAL REPORT PROVISIONS This Enhanced Property Valuation is the product of automated valuation technology, public record data, and human decisioning logic combined to provide a logical estimate of the most probable selling price of a petroleum marketing property. This valuation is not an appraisal. This valuation estimates property value assuming fee simple title ownership and the property condition as indicated on the PetroMARK® Questionnaire. This Enhanced Property Valuation is intended for use only for extensions of credit applicable with commercial property equity lending or as a screening tool for collateral risk exception management. Enhanced Property Valuations are not suitable for complex properties. This valuation contains no representations or warranties regarding marketability, functional or economical obsolescence, environmental contamination or flood insurance determination. This valuation does not warrant the accuracy of any public record information or data sources used to prepare this valuation. This data may not be re-sold. The market value, information, data, content and process to produce this report cannot be insured, warranted, or underwritten without the express written consent of C-Store Evaluations LLC. THE VALUATIONS ARE PROVIDED "AS IS" AND C-STORE EVALUATIONS LLC MAKES NO REPRESENTATION OR WARRANTY WITH RESPECT TO THEIR ACCURACY, COMPLETENESS, OR CURRENTNESS. C-STORE EVALUATIONS LLC SPECIFICALLY DISCLAIMS ANY OTHER WARRANTY, EXPRESS, IMPLIED OR STATUTORY, INCLUDING ANY WARRANTY OF MERCHANTABILITY OR FITNESS FOR A PARTICULAR PURPOSE. IN NO EVENT WILL C-STORE EVALUATIONS LLC BE LIABLE FOR THE RESULTS OF YOUR USE OR MISUSE OF THE VALUATIONS, INCLUDING ANY USE CONTRARY TO STATE AND FEDERAL LAW; YOUR INABILITY OR FAILURE TO CONDUCT YOUR BUSINESS; OR FOR ANY INDIRECT, SPECIAL, OR CONSEQUENTIAL DAMAGES. VALUES ARE PROVIDED “AS IS” AND ALL USES ARE AT THE USER’S SOLE RISK. ALL WARRANTIES CONCERNING THE VALUES AND ALL UNDERLYING DATA AND PROCESSES BOTH EXPRESSED AND IMPLIED ARE EXPRESSLY EXCLUDED INCLUDING WITHOUT LIMITATION ANY WARRANTIES OF MERCHANTABILITY, ACCURACY, OR FITNESS FOR A PARTICULAR PURPOSE. The Values are calculated using various models and techniques proprietary to C-Store Evaluations LLC. This report does not constitute an appraisal and has not been prepared by a certified or licensed appraiser. Values are dependent on the accuracy of any data supplied by the user. Values may not be used to produce or attempt to produce models used to generate the Values. The term Value is used in this report to mean the estimated market values generated by using the PetroMARK® proprietary models.
PHYSICAL CONDITION OF THE PROPERTY The physical condition of the improvements is estimated from the indicated date of construction and last major remodel; third-party inspection reports, if any; photographs of the interior and exterior; and itemized repairs shown on the Property & Operations Survey. The preparer of this Evaluation Report did not make an inspection of the property. CURRENT USE, PROPOSED USE, HIGHEST AND BEST USE The current and anticipated future use is convenience retail commercial. The highest and best use as currently improved is continuation as convenience retail commercial. PROPERTY-SPECIFIC DATA Property specific data is summarized on Page 4. Tangible Assets, realty includes the site, site improvements, buildings, fuel service including all retail dispensers, underground storage tanks, associated POS electronics and piping and canopy. It also includes the car wash and all related car wash systems. The Tangible Assets, Non-realty includes movable personal property as generally described on Page 30. No inventory of non-realty items has been made.

20 EVALUATION REPORT
© Copyright 2007-2014 C-Store Evaluations LLC. All Rights Reserved.
NEIGHBORHOOD DATA Relevant Trade Area (neighborhood) data is summarized on Page 5. CURRENT TAX ASSESSMENT The current ad valorem tax assessment has been examined as part of this investigation. Our value conclusions in this Evaluation Report are not dependent upon, nor derived from the assessed value. Records of the assessed value for this property are retained in our work file. SOURCES OF DATA Sources consulted in preparing this report include the completed Property & Operations Survey; State of the Industry Report, National Association of Convenience Stores, published annually; Retail Fuel Watch, Oil Pricing and Information Service, published annually; ESRI® Business Analyst; Claritas Retail Market Report; CoStar; PetroMARK® Valuation Software; tax assessment records; photographs of the store exterior, store interior, fuel service and street scene.
SCOPE OF WORK This evaluation report is not a state-certified appraisal. The significant elements of scope included the following: This report has been prepared in accordance with the for an evaluation as specified in the Interagency Appraisal and Evaluation Guidelines issued on December 10, 2010. This is a specific appraisal product developed to meet the needs of this client and is not intended for any other use. This evaluation report is intended for use as evaluation of the collateral for a mortgage loan. Intended user(s) and client of the report are identified on Page 4. No other use is authorized. Physical information about the property is taken from the occupants/operator’s responses to the Property & Operations Survey, which is part of our work file, assessor’s records, third-party inspection reports, and a physical inspection of the property, when available. We did not make a physical inspection of this property. The primary method estimating the value of the tangible and intangible assets is a capitalization of earnings income approach assuming typical management. This is the methodology recommended by Convenience Stores and retail Fuel Properties: Essential Appraisal Issues, 2012, Second Edition, published by the Appraisal Institute, and International Valuation Standards (IVS) for this type of property. Summary peer-group transaction data and a cost approach summary have been used to check the validity of the estimate value of the real estate. Source data consulted in this assignment includes. State of the Industry Report, National Association of Convenience Stores, published annually; Retail Fuel Watch, Oil Pricing and Information Service, published annually; ESRI® Business Analyst; Claritas Retail Market Report; CoStar; PetroMARK® Valuation Software. Robert E. Bainbridge, MAI developed the PetroMARK® software used in estimating the value of this property, and provided consultation with the undersigned preparer of this evaluation report, in the following manner:
1. Checked and approved the assumptions in the model 2. Checked the input data in the model. 3. Checked the model output for reasonableness, based on the assumptions and input data. 4. Provided statistical testing of the model input variables and found a 93% coefficient of determination, and a coefficient of variation of 11%.
SALE HISTORY (analyze all sales within the last 3 years, current options, listings, offers or purchase agreements)

21 EVALUATION REPORT
© Copyright 2007-2014 C-Store Evaluations LLC. All Rights Reserved.
According to the local assessor’s office and the current owner, the property has not sold within the last three years The property does not appear to be listed for sale. The exterior signage indicated the property is owner-occupied.
ESTIMATED EXPOSURE TIME AND ESTIMATED MARKETING TIME The estimated exposure and estimated market time are six to 12 months based upon statistical data compiled by CoStar and interviews with buyers and sellers.
RELIABILITY The 21 variables used in our valuation estimates for C-Stores & Gas Stations have been statistically tested and shown to have high explanatory power at 93% (R
2) and a low error 11% (coefficient of dispersion).
For a full explanation of each variable and the related statistical output, please see Convenience Stores and Retail Fuel Properties: Essential Appraisal Issues, 2012, Second Edition, pp 275-288. Published by the Appraisal Institute, Chicago.
ASSUMPTIONS AND SPECIAL CONDITIONS This evaluation report has been made with the following general assumptions: 1. Title to the property is assumed to be good and marketable unless otherwise stated in this report. 2. The property value is estimated as though free and clear of any or all liens and encumbrances unless
otherwise stated in this report. 3. Responsible ownership and competent property management are assumed unless otherwise stated in
this report. 4. All engineering is assumed to be correct. The plot plans and illustrative material in this report are
included only to assist the reader in visualizing the property. 5. It is assumed that there are no hidden or unapparent conditions of the property, subsoil, or structures that
render it more or less valuable. 6. It is assumed that there is full compliance with all applicable federal, state, and local environmental
regulations and laws unless otherwise stated in this report. It is assumed that all applicable zoning and use regulations and restrictions have been complied with, unless nonconformity has been stated, defined, and considered in this evaluation report.
7. It is assumed that all required licenses, certificates of occupancy consents, or other legislative or administrative authority from any local, state, or national governmental or private entity or organization have been or can be obtained or renewed for any use on which the value estimates contained in this report are based.
8. The preparer is not qualified to detect hazardous waste and/or toxic materials. Any comment by the preparer that might suggest the possibility of the presence of such substances should not be taken as confirmation of the presence of hazardous waste and/or toxic materials. Such determination would require investigation by a qualified expert in the field of environmental assessment. The presence of substances such as asbestos, urea-formaldehyde foam insulation or other potentially hazardous materials may affect the value of the property. The preparer’s value estimate is predicated on the assumption that there is no such material on or in the property that would cause a loss in value unless otherwise stated in this report. No responsibility is assumed for any environmental conditions, or for any expertise or engineering knowledge required to discover them. The appraiser's descriptions and resulting comments are the result of the routine observations made during the evaluation process.
9. Unless otherwise stated in this report, the subject property is appraised without a specific compliance survey having been conducted to determine if the property is or is not in conformance with the requirements of the Americans with Disabilities act. The presence of architectural and communications barriers that are structural in nature that would restrict access by disabled individuals may adversely affect the property's value, marketability, or utility.
This evaluation report has been made with the following general limiting conditions: 1. The intended user makes no express or implied representation or warranty of any kind, and expressly
disclaims any liability to any person or entity with respect to this evaluation report.
A. Market Value Definition: The term market value used herein is in accordance with the definition of the
office of the Comptroller of the Currency, under 12-CFR, part 34, subpart C-Appraisals, 34.42 Definitions [F]. Source: 12 CFR 34.42(g).
“Market value means the most probable price which a property should bring in a competitive and open market under all conditions requisite to a fair sale, the buyer and seller each acting prudently and

22 EVALUATION REPORT
© Copyright 2007-2014 C-Store Evaluations LLC. All Rights Reserved.
knowledgeably, and assuming the price is not affected by undue stimulus. Implicit in this definition is the consummation of a sale as of a specified date and the passing of title from seller to buyer under conditions whereby: Buyer and seller are typically motivated; Both parties are well informed or well advised, and acting in what they consider to be their own best interests; A reasonable time is allowed for exposure to the open market; Payment is made in terms of cash in U.S. dollars or in terms of financial arrangements comparable thereto; and The price represents a normal consideration for the property sold unaffected by special or creative financing or sales concessions granted by anyone associated with the sale.” B. Unless otherwise stated herein:
i. The effective date of value coincides with the inspection date. ii. This Evaluation reflects the fee simple interest. iii. Exposure Time is one year or less. iv. The Highest and Best Use (HB&U) is believed to be essentially in accord with the current use (a thorough H&BU is beyond the scope of this Evaluation). v. The subject has been valued based upon its current use; no projected or proposed uses have been considered. vi. In addition to the Evaluation, this Review has considered the information presented in the Inspection including photographs (as applicable) and working papers contained in the work file.
C. Confidentiality: Unless specifically stated otherwise, borrower and property information made
available should be considered as confidential and not used or disclosed outside the normal course of performing this assignment.

23 EVALUATION REPORT
© Copyright 2007-2014 C-Store Evaluations LLC. All Rights Reserved.
APPENDIX
How Retail Property Value is Created
Trade Area Maps
Hypermarket Competition
FF&E Valuation
Shutdown Value

24 EVALUATION REPORT
© Copyright 2007-2014 C-Store Evaluations LLC. All Rights Reserved.

25 EVALUATION REPORT
© Copyright 2007-2014 C-Store Evaluations LLC. All Rights Reserved.
TRADE AREA MAP, 1, 3 and 5-Minute Drive-Time

26 EVALUATION REPORT
© Copyright 2007-2014 C-Store Evaluations LLC. All Rights Reserved.
PHOTOGRAPHS

27 EVALUATION REPORT
© Copyright 2007-2014 C-Store Evaluations LLC. All Rights Reserved.
REQUIRED REPAIRS/DEFERRED MAINTENANCE
None noted. No on-site inspection was made. The statements by the operator did not indicate any deferred maintenance. Reportedly, the store was remodeled in 2013 at a cost of $215,000.

28 EVALUATION REPORT
© Copyright 2007-2014 C-Store Evaluations LLC. All Rights Reserved.
SKETCH/PLAT MAP/AERIAL/SKETCH
SUBJECT

29 EVALUATION REPORT
© Copyright 2007-2014 C-Store Evaluations LLC. All Rights Reserved.
COMPETITIVE/HYPERMARKT LOCATIONS
SUBJECT
HYPERMARKET
(None)

30 EVALUATION REPORT
© Copyright 2007-2014 C-Store Evaluations LLC. All Rights Reserved.
Equipment List
DESCRIPTION QTY EACH % GOOD TOTAL
CO2 TANK W. VALVE CONNECTED W/ SODA MACHINE 1 $500 0% $0
DRINK DISPENSER W/ REMOTE TANK SYSTEM 1 $2,650 0% $0
COFFEE MAKER 1 $1,575 0% $0
HOT CHOCOLATE 1 $605 0% $0
CUP DISPENSERS 2 $170 0% $0
CASH REGISTER 1 $3,000 0% $0
TELEPHONE BOARD 1 $1,750 0% $0
PORTABLE FIRE EXTINGUISHER 2 $175 0% $0
STAINLESS STEEL SINK 2 $2,025 0% $0
ICE MACHINE 1 $2,700 0% $0
TIME RECORDER 1 $7,000 0% $0
CORNER CAP 1 $750 0% $0
BAG IN BOX 1 $250 0% $0
MICROWAVE 1 $375 0% $0
OVEN 1 $3,500 0% $0
POPCORN MACHINE 1 $995 0% $0
SLUSH PUPPY 1 $2,960 0% $0
PASTRY CASE 1 $2,000 0% $0
HOT DOG MACHINE 0 $670 0% $0
GONDOLAS W/ END CAP 3 $250 0% $0
2FT WIDE SHELVING/72 IN HIGH 12 $150 0% $0
GRILL COOKER 0 $2,000 0% $0
PAY PHONE 1 $750 0% $0
COMPUTER 1 $5,000 0% $0
SHELVES 3 $150 0% $0
UNDERCOUNTER SAFE 2 $1,500 0% $0
LOTTO MACHINE 1 $1,000 0% $0
RECEIPT MACHINE 1 $500 0% $0
CREDIT CARD MACHINE 1 $300 0% $0
CONDIMENT TRAY 1 $1,025 0% $0
ATM MACHINE 1 $4,500 0% $0
ICE CREAM COOLER 2 $705 0% $0
2-DOOR FREEZER 1 $3,000 0% $0
PRINTER 1 $500 0% $0
DISPLAY CASE 2 $475 0% $0
OVERHEAD CIGARETTE DISPENSER 1 $1,500 0% $0
DEEP SHELF WITH MOP HOLDERS 1 $750 0% $0
FOOD SERVICE EQUIPMENT 0 $150,000 0% $0
TOTAL ADJUSTED BOOK VALUE: Tangible Assets, Non-Realty $10,000
STORE BLDG SIZE (NON-FOOD SERVICE) 1,624
EQUIPMENT VALUE/SF $6.16

31 EVALUATION REPORT
© Copyright 2007-2014 C-Store Evaluations LLC. All Rights Reserved.
SHUT DOWN VALUE
Fee Simple Market Value of the Tangible Assets, Realty $1,071,000
Less Costs of:
1. Taking Possession (Estimated Legal and Closing Fees, etc.) $21,420
2. Preserving the Asset (Operating expenses during the 6-month holding period)
Real Estate Taxes $10,710
Insurance $2,142
Maintenance/Repairs/Security $5,355
Utilities $4,284
Management $5,355
Misc/Contigency $2,142
3. Marketing the Asset
Sales Commission $64,260
4. Lender Stigma (If any) $53,550
5. Delinquent Real Estate Taxes (If any) $21,420
6. Deduction for 6-Month Marketing Time (If any) $107,100
7. Add: In-place Value of Operating Equipment $10,000
SHUT DOWN VALUE $763,262
SHUTDOWN VALUE The Shutdown Value is the hypothetical net cash proceeds from the sale of the real estate assuming an orderly liquidation and lender-in-possession. No net value is assigned to the moveable personal property. By definition, no intangible asset value exists. An orderly liquidation assumes segregation of the assets of the business and an adequate marketing time, in contrast to a forced liquidation, which assumes the assets are sold at auction.

32 EVALUATION REPORT
© Copyright 2007-2014 C-Store Evaluations LLC. All Rights Reserved.
LEASED FEE VALUE
None.


![[D2 campus]Key-value store 만들기](https://img.pdfslide.net/doc/110x75/5879927c1a28ab95318b5dd1/d2-campuskey-value-store-.jpg)