Embed Size (px)
Citation preview
An examination of future firm performance and fundamental
ABSTRACT
The purpose of fundamental
research of fundamental analysis attempts to link fundamental analysis signals (e.g., changes in
accounts receivable or research and development) with future
using data from the US document signif
earnings and returns (e.g. Abarbanell and Bushee 1997
relationship between fundamental signals and value is well documented in the US, little research
examines this relationship in an international setting.
ability of the fundamental signals to explain both future earnings and returns of firms in India.
India is quickly becoming one of the largest economies is in the wor
relationship between financial statement data and firm performance
importance. The results of this study
signals and future earnings in India. However, the relationship between fundamental signals and
returns and earnings differs substantially that the relationship identified by prior studies in the
US.
Keywords: Fundamental analysis, future earnings, annual returns
Journal of Finance and Accountancy
An examination of future firm performance, Page
examination of future firm performance and fundamental
analysis
Chris Luchs
Ball State University
Suneel Maheshwari
Marshall University
Mark Myring
Ball State University
undamental analysis is to identify key drivers of firm value. Academic
of fundamental analysis attempts to link fundamental analysis signals (e.g., changes in
accounts receivable or research and development) with future returns and earnings.
document significant relationships between fundamental signals and
Abarbanell and Bushee 1997; Lev and Thiagarajan 1993
relationship between fundamental signals and value is well documented in the US, little research
relationship in an international setting. The purpose of this study is to examine the
ability of the fundamental signals to explain both future earnings and returns of firms in India.
India is quickly becoming one of the largest economies is in the world. Thus, understanding the
relationship between financial statement data and firm performance in India is of increasing
The results of this study document a significant relation between fundamental
signals and future earnings in India. However, the relationship between fundamental signals and
returns and earnings differs substantially that the relationship identified by prior studies in the
analysis, future earnings, annual returns
rnal of Finance and Accountancy
An examination of future firm performance, Page 1
examination of future firm performance and fundamental
firm value. Academic
of fundamental analysis attempts to link fundamental analysis signals (e.g., changes in
returns and earnings. Prior studies
icant relationships between fundamental signals and
and Thiagarajan 1993). While the
relationship between fundamental signals and value is well documented in the US, little research
The purpose of this study is to examine the
ability of the fundamental signals to explain both future earnings and returns of firms in India.
. Thus, understanding the
India is of increasing
significant relation between fundamental
signals and future earnings in India. However, the relationship between fundamental signals and
returns and earnings differs substantially that the relationship identified by prior studies in the
INTRODUCTION
Fundamental analysis examines the association of key signals derived from financial
statements and either earnings and returns.
particularly important as it attempts to show that accounting disclosures other than earnings are
useful in predicting firm performance. Research in the US suggests that fundamental signals are
associated with future returns, earnings, and analysts
Penman 1989; Lev and Thiagarajan
1998, and Wieland 2011). Results of these studies suggest that
statements information is useful in pre
recognize their usefulness as these signals bear an association with future earnings and returns.
Despite the documented relation between fundamental
the US, little research has examined this relation
to partially fill the void by examining the relation between fundamental signals and firm
performance in India. India is currently the ninth largest economy in the wo
GDP. The economy has experienced sizable growth rates and is one of the leading nations in
terms of attracting foreign direct investments.
Despite the impressive performance of the Indian economy, little research investigates
the relevance of financial statements in India. Prior to 2011, financial statements were prepared
using Indian GAAP. Further, Indian has not adopted
Standards. This calls into question the usefulness of fin
provides evidence as to whether Indian financial disclosures are useful in predicting future
returns and earnings.
Using a sample of publically traded firms in India, this study
fundamental signals and firm performance.
Global Vantage database. These signals are inventory, accounts receivable, R&D, auditor
qualification, and effective tax rate.
earnings. Results of these regressions suggest that
signals are associated with future
predicting future earnings. Results of regression
that fundamental signals are not predictive of future
fundamental signals derived from financial statements are predictive of future firms
performance, many differences exist in the relations observed
research aimed at understanding these differences could potential
financial reporting both in India and the US.
The remainder of the paper is
prior literature concerning fundamental signals. Section 3
results from regression analysis. Section
LITERATURE REVIEW
Many studies have examin
Richardson et al. (2010) and Lewellen (2010) provide an in
Examination of fundamental analysis
Holthausen and Larcker (1992) and L
studies was the identification of fundamental
Journal of Finance and Accountancy
An examination of future firm performance, Page
Fundamental analysis examines the association of key signals derived from financial
statements and either earnings and returns. Academic research examining fundamental sign
particularly important as it attempts to show that accounting disclosures other than earnings are
useful in predicting firm performance. Research in the US suggests that fundamental signals are
associated with future returns, earnings, and analysts’ earnings forecasts (see, e.g.,
and Thiagarajan 1993; Abarbanell and Bushee 1997; Abarbanell and Bushee
. Results of these studies suggest that non-earnings financial
useful in predicting future earnings. Further, investors and analysts
recognize their usefulness as these signals bear an association with future earnings and returns.
Despite the documented relation between fundamental analysis and firm performance in
le research has examined this relation in an international setting. This study
void by examining the relation between fundamental signals and firm
performance in India. India is currently the ninth largest economy in the world as measured by
GDP. The economy has experienced sizable growth rates and is one of the leading nations in
terms of attracting foreign direct investments.
Despite the impressive performance of the Indian economy, little research investigates
evance of financial statements in India. Prior to 2011, financial statements were prepared
using Indian GAAP. Further, Indian has not adopted International Auditing and Assurance
. This calls into question the usefulness of financial disclosures in India. The study
evidence as to whether Indian financial disclosures are useful in predicting future
lically traded firms in India, this study examines the
signals and firm performance. Five signals are constructed using data from th
Global Vantage database. These signals are inventory, accounts receivable, R&D, auditor
qualification, and effective tax rate. These signals are regressed on both future ret
Results of these regressions suggest that the audit qualification and effect tax rate
signals are associated with future earnings. This suggests that fundamental signals are useful in
. Results of regression of fundamental signals on future
predictive of future returns. While this analysis suggest
fundamental signals derived from financial statements are predictive of future firms
ences exist in the relations observed in India and in the US. Future
research aimed at understanding these differences could potentially enhance the quality of
financial reporting both in India and the US.
The remainder of the paper is organized as follows. Section 2 provides a discussion of the
prior literature concerning fundamental signals. Section 3 describes the research design
results from regression analysis. Section 4 summarizes this paper.
Many studies have examined a variety of issues concerning fundamental analysis. Both
Richardson et al. (2010) and Lewellen (2010) provide an in-depth analysis of the literature.
Examination of fundamental analysis benefited from early work by Ou and Penman (1989),
nd Larcker (1992) and Lev and Thiagarajan (1993). The primary focus of these
fundamental signals. These signals were hypothesize to contain
rnal of Finance and Accountancy
An examination of future firm performance, Page 2
Fundamental analysis examines the association of key signals derived from financial
Academic research examining fundamental signals is
particularly important as it attempts to show that accounting disclosures other than earnings are
useful in predicting firm performance. Research in the US suggests that fundamental signals are
’ earnings forecasts (see, e.g., Ou and
Abarbanell and Bushee
financial
dicting future earnings. Further, investors and analysts
recognize their usefulness as these signals bear an association with future earnings and returns.
and firm performance in
in an international setting. This study attempts
void by examining the relation between fundamental signals and firm
rld as measured by
GDP. The economy has experienced sizable growth rates and is one of the leading nations in
Despite the impressive performance of the Indian economy, little research investigates
evance of financial statements in India. Prior to 2011, financial statements were prepared
International Auditing and Assurance
s in India. The study
evidence as to whether Indian financial disclosures are useful in predicting future
the association of
constructed using data from the
Global Vantage database. These signals are inventory, accounts receivable, R&D, auditor
on both future returns and
the audit qualification and effect tax rate
This suggests that fundamental signals are useful in
of fundamental signals on future returns suggest
analysis suggests that
fundamental signals derived from financial statements are predictive of future firms
the US. Future
enhance the quality of
follows. Section 2 provides a discussion of the
the research design and
ed a variety of issues concerning fundamental analysis. Both
depth analysis of the literature.
enman (1989),
Thiagarajan (1993). The primary focus of these
signals. These signals were hypothesize to contain

value-relevant information. Studies like Abarbanell and Bushee (1997),
(1998), and Wieland (2011) extend the earlier work on fundamental analysis by examining the
role of the signals have on both future firm performance and
Penman (1989) collected data on 68 potential signa
These signals were selected on the basis of availability. The authors removed variables that were
not significant when regressed on change of future earnings. After screening variables in this
fashion, 34 variables remained. The authors then used step
set of signals to 18. The results showed that these variables
earnings changes. Holthausen and
and Penman (1989) study. Instead of evaluating the value relevance of the signals based on
future change in earnings the authors used future excess returns.
of the signals are associated with future returns.
Lev and Thiagarajan (1993) utilized a different approach in selecting signals
examining those used by financial analysts.
attempts that conducted a search for relevant signals. Lev and Thiagaraj
information used by financial analysts yielded twelve signals. These twelve signals capture
information related to inventories, accounts receivable, capital expenditures, research and
development (R&D), gross margin, selling and
receivables, effective tax rate, order backlog, labor force, LIFO earnings and audit qualification.
The authors examined the association of the twelve signals and annual returns. In the full
analysis the coefficients for inventory, accounts receivable, capital expenditure, gross margin,
selling and administration expenses, and order backlog signals are significant. These results
suggest that these signals contain value relevant information. In furth
excluded the R&D, provision for doubt
do not report these variables, dropping the variables
of analysis reveal that the inventory,
selling and administration expenses, effective tax rate and labor force signals are value relevant.
The Lev and Thiagarajan (1993) signals have served as the basis of many studies on fundamental
analysis.
Abarbanell and Bushee (1997) incorporated the Lev and Thiagarajan (1993) fundamental
signals into their analysis of the association of the signals and future earnings. The authors used
only nine of the twelve signals from Lev and Thiagarajan (1993
were R&D, order backlog and provision for doubtful accounts. Data for these
limited and inclusion result in a small sample
and fundamental signals reveal a sig
inventory, gross margin, effective tax rates, LIFO and labor force have statistically significant
coefficients. The coefficients for these variables have the expected sign. For example the
coefficient for the inventory variable is negative. This result
goods inventory with respect to sales in negatively a
analyses, the authors examined the association of the signa
The results indicate gross margin, effective tax rate and labor force
associated with analysts’ behavior. Overall the authors present convincing evidence of the value
relevance of fundamental signals.
Abarbanell and Bushee (1998) examin
abnormal returns. The results indicate that the inventory, gross margin and selling and
administration expenses variables
Journal of Finance and Accountancy
An examination of future firm performance, Page
relevant information. Studies like Abarbanell and Bushee (1997), Abarbanell and Bushee
(1998), and Wieland (2011) extend the earlier work on fundamental analysis by examining the
role of the signals have on both future firm performance and future market returns. Ou and
enman (1989) collected data on 68 potential signals available from the financial statements.
These signals were selected on the basis of availability. The authors removed variables that were
not significant when regressed on change of future earnings. After screening variables in this
ables remained. The authors then used step-wise regression to reduce the final
set of signals to 18. The results showed that these variables are significantly associated
earnings changes. Holthausen and Larcker (1992) based their study on the 68 va
and Penman (1989) study. Instead of evaluating the value relevance of the signals based on
future change in earnings the authors used future excess returns. The results revealed that many
of the signals are associated with future returns.
Lev and Thiagarajan (1993) utilized a different approach in selecting signals
examining those used by financial analysts. This method is significantly different than previous
attempts that conducted a search for relevant signals. Lev and Thiagarajan (1993) analysis of the
information used by financial analysts yielded twelve signals. These twelve signals capture
information related to inventories, accounts receivable, capital expenditures, research and
development (R&D), gross margin, selling and administration expenses, provision for doubtful
receivables, effective tax rate, order backlog, labor force, LIFO earnings and audit qualification.
The authors examined the association of the twelve signals and annual returns. In the full
the coefficients for inventory, accounts receivable, capital expenditure, gross margin,
selling and administration expenses, and order backlog signals are significant. These results
suggest that these signals contain value relevant information. In further analysis, the authors
excluded the R&D, provision for doubtful accounts and order backlog signals. Since
do not report these variables, dropping the variables increased the sample size. This second set
of analysis reveal that the inventory, accounts receivable, capital expenditure, gross margin,
administration expenses, effective tax rate and labor force signals are value relevant.
The Lev and Thiagarajan (1993) signals have served as the basis of many studies on fundamental
Abarbanell and Bushee (1997) incorporated the Lev and Thiagarajan (1993) fundamental
signals into their analysis of the association of the signals and future earnings. The authors used
only nine of the twelve signals from Lev and Thiagarajan (1993). The three excluded variables
were R&D, order backlog and provision for doubtful accounts. Data for these variables is
small sample. The results of analysis of future change
and fundamental signals reveal a significant association of many of the signals. The variables
inventory, gross margin, effective tax rates, LIFO and labor force have statistically significant
coefficients. The coefficients for these variables have the expected sign. For example the
iable is negative. This result suggests that an increase in finished
goods inventory with respect to sales in negatively associate with future earnings. In additional
analyses, the authors examined the association of the signals and analysts’ forecast revisions.
The results indicate gross margin, effective tax rate and labor force variables are significantly
behavior. Overall the authors present convincing evidence of the value
al signals.
Abarbanell and Bushee (1998) examined the association of fundamental analysis and
The results indicate that the inventory, gross margin and selling and
variables are statistically associated with future abnormal returns.
rnal of Finance and Accountancy
An examination of future firm performance, Page 3
Abarbanell and Bushee
(1998), and Wieland (2011) extend the earlier work on fundamental analysis by examining the
future market returns. Ou and
ls available from the financial statements.
These signals were selected on the basis of availability. The authors removed variables that were
not significant when regressed on change of future earnings. After screening variables in this
wise regression to reduce the final
associated with
arcker (1992) based their study on the 68 variables from Ou
and Penman (1989) study. Instead of evaluating the value relevance of the signals based on
The results revealed that many
Lev and Thiagarajan (1993) utilized a different approach in selecting signals by
This method is significantly different than previous
an (1993) analysis of the
information used by financial analysts yielded twelve signals. These twelve signals capture
information related to inventories, accounts receivable, capital expenditures, research and
administration expenses, provision for doubtful
receivables, effective tax rate, order backlog, labor force, LIFO earnings and audit qualification.
The authors examined the association of the twelve signals and annual returns. In the full sample
the coefficients for inventory, accounts receivable, capital expenditure, gross margin,
selling and administration expenses, and order backlog signals are significant. These results
er analysis, the authors
accounts and order backlog signals. Since many firms
the sample size. This second set
, capital expenditure, gross margin,
administration expenses, effective tax rate and labor force signals are value relevant.
The Lev and Thiagarajan (1993) signals have served as the basis of many studies on fundamental
Abarbanell and Bushee (1997) incorporated the Lev and Thiagarajan (1993) fundamental
signals into their analysis of the association of the signals and future earnings. The authors used
. The three excluded variables
variables is
. The results of analysis of future change in EPS
nificant association of many of the signals. The variables
inventory, gross margin, effective tax rates, LIFO and labor force have statistically significant
coefficients. The coefficients for these variables have the expected sign. For example the
suggests that an increase in finished
ssociate with future earnings. In additional
ls and analysts’ forecast revisions.
are significantly
behavior. Overall the authors present convincing evidence of the value
association of fundamental analysis and
The results indicate that the inventory, gross margin and selling and
re abnormal returns. Using

the established signals from Lev and Thiagarajan (1993), Luchs et al. (2011) examined the
association of fundamental analysis and contemporaneous returns in India.
include: inventory, accounts receivable, R&D, aud
inventory, accounts receivable R&D, and effective tax rate signals are statistically significant
when regressed on returns. Of these five signals only the inventory and accounts
signals are statistically significant in the Lev and Thiagarajan (1993). The differences in the
results of the two studies reveal potential differences in the two capital markets.
examined high book-to-market firms using fundamental analysis. The author
strategy based on the information contained in the fundamental signals. This method yielded
above average returns. Aggarwal and Gupt
India. The authors used a variation of the fundamental signals to construct an F_Score for each
firm. Results for firms with a high F_Scores, denoting positive signals, show that these firms
greater than market returns.
This study adds to the literature on fundamental
association with future earning and returns in India.
of Indian firms on the association of fundamental signals
contradict the results of Lev and Thiagarajan (1993) analysis of US firms. Both Piotroski (2000)
analysis of high book-to-market US firms and Aggarwal and Gupt
book-to-market Indian firms yielded simila
universal nature of fundamental analysis by applying the analysis to other capital markets.
Results of these studies not only add to the understanding of fundamental analysis but seek
identify significant differences in
METHODOLOGY AND RESULTS
Using the methodology developed
are used to examine the relationship between firm performance and fundamental signals. The
first model includes only change in EPS as an independent variable and serves as a benchmark to
examine the incremental explanatory power of fundamental signals. The second model adds the
fundamental signals:
F_Perf = α + β∆EPSit + εit ;
Where:
F_Perf = Proxies for future performance tha
F_Ret
F_EPSit+1 = Year ahead
F_Retit+1 = 12 month return beginning the month of the financial statement
release
∆ EPSit = The
items), deflated by beginning
eit = Error term from regression analysis
i = 1, 2, 3,…, n, number of firms
The next model incorporates the five fundamental signals:
Journal of Finance and Accountancy
An examination of future firm performance, Page
the established signals from Lev and Thiagarajan (1993), Luchs et al. (2011) examined the
analysis and contemporaneous returns in India. These signals
include: inventory, accounts receivable, R&D, auditor qualification, and effective tax rate.
R&D, and effective tax rate signals are statistically significant
when regressed on returns. Of these five signals only the inventory and accounts
significant in the Lev and Thiagarajan (1993). The differences in the
results of the two studies reveal potential differences in the two capital markets.
market firms using fundamental analysis. The author employed a trading
strategy based on the information contained in the fundamental signals. This method yielded
Aggarwal and Gupta (2009) examined high book-to-market stocks in
India. The authors used a variation of the fundamental signals to construct an F_Score for each
firm. Results for firms with a high F_Scores, denoting positive signals, show that these firms
This study adds to the literature on fundamental analysis by examining the signals
association with future earning and returns in India. The results of Luchs et al. (2011) analysis
of Indian firms on the association of fundamental signals and contemporaneous returns
contradict the results of Lev and Thiagarajan (1993) analysis of US firms. Both Piotroski (2000)
market US firms and Aggarwal and Gupta (2009) analysis of high
market Indian firms yielded similar results. Emerging research examines the potential
analysis by applying the analysis to other capital markets.
Results of these studies not only add to the understanding of fundamental analysis but seek
icant differences in international capital markets.
METHODOLOGY AND RESULTS
Using the methodology developed by Lev and Thiagarajan (1993) the following models
to examine the relationship between firm performance and fundamental signals. The
rst model includes only change in EPS as an independent variable and serves as a benchmark to
examine the incremental explanatory power of fundamental signals. The second model adds the
Proxies for future performance that includes F_EPS
_Retit+1
ear ahead earnings per share.
12 month return beginning the month of the financial statement
release.
The annual change in EPS (primary, excluding extraordinary
items), deflated by beginning-of-year share price.
Error term from regression analysis.
1, 2, 3,…, n, number of firms.
The next model incorporates the five fundamental signals:
rnal of Finance and Accountancy
An examination of future firm performance, Page 4
the established signals from Lev and Thiagarajan (1993), Luchs et al. (2011) examined the
These signals
itor qualification, and effective tax rate. The
R&D, and effective tax rate signals are statistically significant
when regressed on returns. Of these five signals only the inventory and accounts receivable
significant in the Lev and Thiagarajan (1993). The differences in the
Piotroski (2000)
employed a trading
strategy based on the information contained in the fundamental signals. This method yielded
market stocks in
India. The authors used a variation of the fundamental signals to construct an F_Score for each
firm. Results for firms with a high F_Scores, denoting positive signals, show that these firms
the signals
The results of Luchs et al. (2011) analysis
and contemporaneous returns
contradict the results of Lev and Thiagarajan (1993) analysis of US firms. Both Piotroski (2000)
(2009) analysis of high
Emerging research examines the potential
analysis by applying the analysis to other capital markets.
Results of these studies not only add to the understanding of fundamental analysis but seek to
Lev and Thiagarajan (1993) the following models
to examine the relationship between firm performance and fundamental signals. The
rst model includes only change in EPS as an independent variable and serves as a benchmark to
examine the incremental explanatory power of fundamental signals. The second model adds the
(1)
F_EPSit+1 and
12 month return beginning the month of the financial statement
annual change in EPS (primary, excluding extraordinary

F_Perf = α + β0∆ EPS_PTit + β1INV
Where:
F-Perf = Proxies for future performance tha
F_Ret
F_EPSit+1 = Year ahead earnings per share.
F_Retit+1 = 12 month return beginning the month of the financial statement
release.
∆EPS_PT it = The annual change in Pretax EPS (primary, excluding
extraordinary items), deflated by beginning
INVit = Inventory measured as (
The Inventory variable used is ‘Finished Goods’ when available,
and ‘Total Inventory’ otherwise.
ARit = Accounts Receivable measured as (
R&Dit = Change in firm
AOit = Auditor Qualification, 1 for Qualified, 0 for
EffTaxit = PTE
beginning price
Tit = Effective tax rate
eit = Error term from regression analysis
i = 1, 2, 3,…, n, number of firms
Two proxies are used to measure firm performance: future earning and future returns.
Significant coefficients on the change in EPS variable suggest that
associated with future firm performance. Similarly significant coefficients on the
signals variables suggest that fundamental signals are associated with future firm performance.
The data used in the analysis are drawn for the Compustat
Only five of the original twelve signals from Lev and Thiagara
due to data limitation and accounting rules. The signals used in the analysis are inventory,
accounts receivable, R&D, auditor qualification, and effective tax rate. The sample consists of
291 firms and 398 firm-years. To
year effects are included in the model. Also to control for
winsorized at 5%. Data below the 5
5th
and 95th
percentiles, respectively.
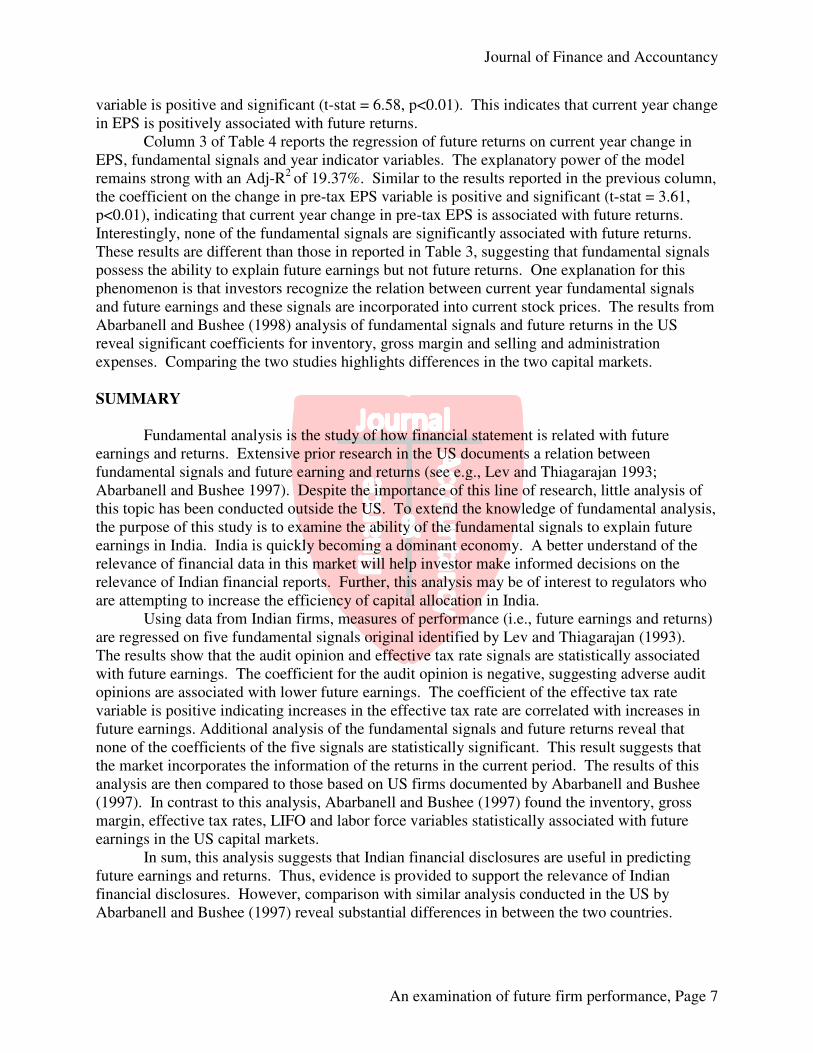
Table 1 contains descriptive statistics for
EPS, a measure of the EPS of the next
indicating firms maintained positi
tax-change in EPS are positive, suggesting the firms experienced increases in earnings during the
research period. The average of the inventory signal variable is
generally suggest higher than expected sales and suggest higher current and future earnings (Lev
and Thiagarajan 1993). The mean (median) accounts receivable signal was positive for the
period is 0.023 (0.175), suggesting that, on average, accounts receiva
research period. Increases in accounts receivable increases may suggest difficulties in selling the
firm’s products as well as an increasing likelihood of future earnings decreases from increases in
receivables’ provisions (Lev and T
increases during the research period, indicating increases in spending on research and
Journal of Finance and Accountancy
An examination of future firm performance, Page
INVit + β2ARit + β3RDit + β4AOit + β5EffTaxit +
Proxies for future performance that includes F_EPS
_Retit+1
Year ahead earnings per share.
12 month return beginning the month of the financial statement
release.
The annual change in Pretax EPS (primary, excluding
extraordinary items), deflated by beginning-of-year share price.
Inventory measured as (∆Inventory) – (∆Sales)
The Inventory variable used is ‘Finished Goods’ when available,
and ‘Total Inventory’ otherwise.
Accounts Receivable measured as (∆AR) – (∆Sales)
Change in firm-specific R&D
Auditor Qualification, 1 for Qualified, 0 for Unqualified
PTE it(Tti-1 – Tit ), PTE t = pretax earnings at time t
beginning price
Effective tax rate
Error term from regression analysis
1, 2, 3,…, n, number of firms
to measure firm performance: future earning and future returns.
Significant coefficients on the change in EPS variable suggest that current year change in EPS is
associated with future firm performance. Similarly significant coefficients on the
signals variables suggest that fundamental signals are associated with future firm performance.
analysis are drawn for the Compustat Global Vantage database.
Only five of the original twelve signals from Lev and Thiagarajan (1993) could be constructed
due to data limitation and accounting rules. The signals used in the analysis are inventory,
accounts receivable, R&D, auditor qualification, and effective tax rate. The sample consists of
To control for the effect of time period specific conditions fixed
year effects are included in the model. Also to control for extreme observations the data was
winsorized at 5%. Data below the 5th
percentile and above the 95th
percentile are recorded as t
percentiles, respectively.
Table 1 contains descriptive statistics for the sample of 398 Indian firms-
EPS, a measure of the EPS of the next fiscal year has a mean (median) of 0.351 (0.243),
indicating firms maintained positive earnings during the sample period. Both pre
change in EPS are positive, suggesting the firms experienced increases in earnings during the
research period. The average of the inventory signal variable is -0.022. Inventory decreases
enerally suggest higher than expected sales and suggest higher current and future earnings (Lev
. The mean (median) accounts receivable signal was positive for the
period is 0.023 (0.175), suggesting that, on average, accounts receivable increased during the
research period. Increases in accounts receivable increases may suggest difficulties in selling the
firm’s products as well as an increasing likelihood of future earnings decreases from increases in
d Thiagarajan 1993). The research and development signal
increases during the research period, indicating increases in spending on research and
rnal of Finance and Accountancy
An examination of future firm performance, Page 5
+ eit (2)
F_EPSit+1 and
12 month return beginning the month of the financial statement
The annual change in Pretax EPS (primary, excluding
year share price.
The Inventory variable used is ‘Finished Goods’ when available,
Sales)
Unqualified
= pretax earnings at time t , deflated by
to measure firm performance: future earning and future returns.
current year change in EPS is
associated with future firm performance. Similarly significant coefficients on the fundamental
signals variables suggest that fundamental signals are associated with future firm performance.
Global Vantage database.
jan (1993) could be constructed
due to data limitation and accounting rules. The signals used in the analysis are inventory,
accounts receivable, R&D, auditor qualification, and effective tax rate. The sample consists of
control for the effect of time period specific conditions fixed
extreme observations the data was
percentile are recorded as the
-years. Future
year has a mean (median) of 0.351 (0.243),
ve earnings during the sample period. Both pre-tax and after
change in EPS are positive, suggesting the firms experienced increases in earnings during the
0.022. Inventory decreases
enerally suggest higher than expected sales and suggest higher current and future earnings (Lev
. The mean (median) accounts receivable signal was positive for the
ble increased during the
research period. Increases in accounts receivable increases may suggest difficulties in selling the
firm’s products as well as an increasing likelihood of future earnings decreases from increases in
hiagarajan 1993). The research and development signal
increases during the research period, indicating increases in spending on research and
development. Such increases are thought to be associated with increases in future earnings and
returns. Finally, the average effective
this increase is not a result of increases in the statuary tax rate, it
signal (Lev and Thiagarajan 1993).
Table 2 reports correlation analysis for the sample firms.
earning are positively associated with current year change in EPS (both per and post tax
measures). Future returns are positively (negatively) correlated with inve
opinion, and effective tax rate (accounts receivable) signals. Future earnings are positively
(negatively) correlated with R&D, auditor opinion, and effective tax rate (accounts receivable
and inventory) signals. None of the correlati
to suggest a problem with multicollinearity. Further, variance inflation factors
test for multicollinearity. The results of this analysis provide no evidence of multicollinearity
problems.
The second column of Table 3 provides results of
current year change in EPS, fundamental signals and year indicator variables (coefficients not
reported). The first column reports the benchmark regression of future
change in EPS and year indicator variables. The Adj
suggesting that the current year change in EPS and the year indicator variables explain a sizable
portion of variation in future earnings. The
(t-stat = 6.58, p<0.01). This suggests that current year change in EPS is significantly related to
future earnings. Thus, firms experiencing current earnings growth are likely to realize
additional earnings growth in future years.
The last column of Table 3 report
change in current year earnings, fundamental signals and year indicator variables (coefficients
not reported). The Adj-R2
of this mod
This is primarily the result of a decrease in the significance of the year indicator variables (not
reported in table). Consistent with the benchmark model, the coefficient on the pre
EPS variable is positive and significant (t
year change in earnings bears a positive relationship with future earnings changes. With respect
to the fundamental signals, the audit opinion variable i
p<0.01) and the effective tax rate
indicates that, all else being equal, adverse audit opinions are associated with lower future
earnings and increases in the effective tax rate are associated with increases in future earnings.
Of the five variables in both the Abarbanell and Bushee (1997) and the current study only the
effective tax rate variable is significant in both studies. In the Abarbanel
study of US firms the inventory, gross margin, LIFO and labor force variables were also
statistically significant. The inventory variable is not significant in this study. The result
suggests that unlike in the US capital markets a cha
associated with future earnings. In both studies the coefficients for the accounts receivable and
R&D variables are insignificant, indicating that in both capital markets these variables have no
discernable bearing on future earnings.
Table 4 provides results of regression of year
EPS, fundamental signals and year indicator variables (coefficients not
column of the table reports the benchmark regression
from this regression is 20.20%, indicating that change in EPS and the year indicator variables
explain a substantial amount of variation in future returns. Further, the coefficient on the CEPS
Journal of Finance and Accountancy
An examination of future firm performance, Page
development. Such increases are thought to be associated with increases in future earnings and
effective tax rate increased over the research period. Assuming that
this increase is not a result of increases in the statuary tax rate, it is typically viewed as a
hiagarajan 1993).
Table 2 reports correlation analysis for the sample firms. As expected, future returns and
earning are positively associated with current year change in EPS (both per and post tax
measures). Future returns are positively (negatively) correlated with inventory, R&D, auditor
opinion, and effective tax rate (accounts receivable) signals. Future earnings are positively
(negatively) correlated with R&D, auditor opinion, and effective tax rate (accounts receivable
and inventory) signals. None of the correlations between independent variables are high enough
to suggest a problem with multicollinearity. Further, variance inflation factors are computed to
multicollinearity. The results of this analysis provide no evidence of multicollinearity
The second column of Table 3 provides results of the regression of year-ahead EPS on
current year change in EPS, fundamental signals and year indicator variables (coefficients not
reported). The first column reports the benchmark regression of future earnings on current year
change in EPS and year indicator variables. The Adj-R2
from this regression is 11.77%,
suggesting that the current year change in EPS and the year indicator variables explain a sizable
portion of variation in future earnings. The coefficient on the changes in EPS variable is 1.077
stat = 6.58, p<0.01). This suggests that current year change in EPS is significantly related to
future earnings. Thus, firms experiencing current earnings growth are likely to realize
future years.
he last column of Table 3 reports the results of the regression of future earnings on
change in current year earnings, fundamental signals and year indicator variables (coefficients
of this model (10.48%) is slightly lower than the benchmark model.
This is primarily the result of a decrease in the significance of the year indicator variables (not
reported in table). Consistent with the benchmark model, the coefficient on the pre
EPS variable is positive and significant (t-stat = 3.61, p<0.01). This result indicates that current
year change in earnings bears a positive relationship with future earnings changes. With respect
to the fundamental signals, the audit opinion variable is negative and significant (t
effective tax rate variable is positive and significant (t-stat = 4.59, p<0.01). This
indicates that, all else being equal, adverse audit opinions are associated with lower future
creases in the effective tax rate are associated with increases in future earnings.
Abarbanell and Bushee (1997) and the current study only the
effective tax rate variable is significant in both studies. In the Abarbanell and Bushee (1997)
study of US firms the inventory, gross margin, LIFO and labor force variables were also
statistically significant. The inventory variable is not significant in this study. The result
suggests that unlike in the US capital markets a change in inventory is not significantly
associated with future earnings. In both studies the coefficients for the accounts receivable and
nsignificant, indicating that in both capital markets these variables have no
future earnings.
Table 4 provides results of regression of year-ahead returns on current year change in
EPS, fundamental signals and year indicator variables (coefficients not reported). The second
column of the table reports the benchmark regression of change in EPS on returns. The Adj
from this regression is 20.20%, indicating that change in EPS and the year indicator variables
explain a substantial amount of variation in future returns. Further, the coefficient on the CEPS
rnal of Finance and Accountancy
An examination of future firm performance, Page 6
development. Such increases are thought to be associated with increases in future earnings and
tax rate increased over the research period. Assuming that
is typically viewed as a positive
As expected, future returns and
earning are positively associated with current year change in EPS (both per and post tax
ntory, R&D, auditor
opinion, and effective tax rate (accounts receivable) signals. Future earnings are positively
(negatively) correlated with R&D, auditor opinion, and effective tax rate (accounts receivable
ons between independent variables are high enough
are computed to
multicollinearity. The results of this analysis provide no evidence of multicollinearity
ahead EPS on
current year change in EPS, fundamental signals and year indicator variables (coefficients not
earnings on current year
from this regression is 11.77%,
suggesting that the current year change in EPS and the year indicator variables explain a sizable
on the changes in EPS variable is 1.077
stat = 6.58, p<0.01). This suggests that current year change in EPS is significantly related to
future earnings. Thus, firms experiencing current earnings growth are likely to realize
the results of the regression of future earnings on
change in current year earnings, fundamental signals and year indicator variables (coefficients
el (10.48%) is slightly lower than the benchmark model.
This is primarily the result of a decrease in the significance of the year indicator variables (not
reported in table). Consistent with the benchmark model, the coefficient on the pre-tax change in
stat = 3.61, p<0.01). This result indicates that current
year change in earnings bears a positive relationship with future earnings changes. With respect
s negative and significant (t-stat = -3.07,
stat = 4.59, p<0.01). This
indicates that, all else being equal, adverse audit opinions are associated with lower future
creases in the effective tax rate are associated with increases in future earnings.
Abarbanell and Bushee (1997) and the current study only the
l and Bushee (1997)
study of US firms the inventory, gross margin, LIFO and labor force variables were also
statistically significant. The inventory variable is not significant in this study. The result
nge in inventory is not significantly
associated with future earnings. In both studies the coefficients for the accounts receivable and
nsignificant, indicating that in both capital markets these variables have no
ahead returns on current year change in
reported). The second
of change in EPS on returns. The Adj-R2
from this regression is 20.20%, indicating that change in EPS and the year indicator variables
explain a substantial amount of variation in future returns. Further, the coefficient on the CEPS
variable is positive and significant (t
in EPS is positively associated with future returns.
Column 3 of Table 4 reports the regression of future returns on current year change in
EPS, fundamental signals and ye
remains strong with an Adj-R2
of 19.37%. Similar to the results reported in the previous column,
the coefficient on the change in pre
p<0.01), indicating that current year change in pre
Interestingly, none of the fundamental signals are significantly associated with future returns.
These results are different than those in reported in Table 3,
possess the ability to explain future earnings but not future returns. One explanation for this
phenomenon is that investors recognize the relation between current year fundamental signals
and future earnings and these signals are incorpora
Abarbanell and Bushee (1998) analysis of
reveal significant coefficients for inventory, gross margin and selling and administration
expenses. Comparing the two studies highlights
SUMMARY
Fundamental analysis is the study of how financial statement is related with future
earnings and returns. Extensive prior research in the US documents a relation between
fundamental signals and future earning and returns (see e.g.,
Abarbanell and Bushee 1997). Despite the importance of this line of research, little analysis
this topic has been conducted outside the US.
the purpose of this study is to examine the ability
earnings in India. India is quickly becoming a dominant economy. A
relevance of financial data in this market will help investor make informed decisions on the
relevance of Indian financial reports. Further, this
are attempting to increase the efficie
Using data from Indian firms, measures of performance (i.e., future earnings and returns)
are regressed on five fundamental signals
The results show that the audit op
with future earnings. The coefficient for the audit opinion is negative, suggesting
opinions are associated with lower future earnings. The coefficient of the effective tax r
variable is positive indicating increases in the effective tax rate are correlated with increases in
future earnings. Additional analysis of the fundamental signals and future returns reveal that
none of the coefficients of the five signals are statist
the market incorporates the information of the returns in the current period.
analysis are then compared to those based on US firms documented by
(1997). In contrast to this analysis,
margin, effective tax rates, LIFO and labor force variables statistically associated with future
earnings in the US capital markets.
In sum, this analysis suggests that Indian fin
future earnings and returns. Thus, evidence is provided to support the relevance of Indian
financial disclosures. However, comparison with similar analysis conducted in the US by
Abarbanell and Bushee (1997) re
Journal of Finance and Accountancy
An examination of future firm performance, Page
and significant (t-stat = 6.58, p<0.01). This indicates that current year change
in EPS is positively associated with future returns.
Column 3 of Table 4 reports the regression of future returns on current year change in
EPS, fundamental signals and year indicator variables. The explanatory power of the model
of 19.37%. Similar to the results reported in the previous column,
the coefficient on the change in pre-tax EPS variable is positive and significant (t
p<0.01), indicating that current year change in pre-tax EPS is associated with future returns.
Interestingly, none of the fundamental signals are significantly associated with future returns.
These results are different than those in reported in Table 3, suggesting that fundamental signals
possess the ability to explain future earnings but not future returns. One explanation for this
phenomenon is that investors recognize the relation between current year fundamental signals
signals are incorporated into current stock prices. The results from
Abarbanell and Bushee (1998) analysis of fundamental signals and future returns in the US
for inventory, gross margin and selling and administration
nses. Comparing the two studies highlights differences in the two capital markets.
analysis is the study of how financial statement is related with future
Extensive prior research in the US documents a relation between
fundamental signals and future earning and returns (see e.g., Lev and Thiagarajan 1993
. Despite the importance of this line of research, little analysis
has been conducted outside the US. To extend the knowledge of fundamental
this study is to examine the ability of the fundamental signals to explain future
India is quickly becoming a dominant economy. A better understand of the
relevance of financial data in this market will help investor make informed decisions on the
inancial reports. Further, this analysis may be of interest to regulator
are attempting to increase the efficiency of capital allocation in India.
Using data from Indian firms, measures of performance (i.e., future earnings and returns)
on five fundamental signals original identified by Lev and Thiagarajan (1993)
The results show that the audit opinion and effective tax rate signals are statistically associated
with future earnings. The coefficient for the audit opinion is negative, suggesting
opinions are associated with lower future earnings. The coefficient of the effective tax r
increases in the effective tax rate are correlated with increases in
future earnings. Additional analysis of the fundamental signals and future returns reveal that
none of the coefficients of the five signals are statistically significant. This result suggests that
the market incorporates the information of the returns in the current period. The results of
those based on US firms documented by Abarbanell and Bushee
analysis, Abarbanell and Bushee (1997) found the inventory, gross
margin, effective tax rates, LIFO and labor force variables statistically associated with future
in the US capital markets.
In sum, this analysis suggests that Indian financial disclosures are useful in predicting
future earnings and returns. Thus, evidence is provided to support the relevance of Indian
financial disclosures. However, comparison with similar analysis conducted in the US by
Abarbanell and Bushee (1997) reveal substantial differences in between the two countries.
rnal of Finance and Accountancy
An examination of future firm performance, Page 7
stat = 6.58, p<0.01). This indicates that current year change
Column 3 of Table 4 reports the regression of future returns on current year change in
ar indicator variables. The explanatory power of the model
of 19.37%. Similar to the results reported in the previous column,
tax EPS variable is positive and significant (t-stat = 3.61,
tax EPS is associated with future returns.
Interestingly, none of the fundamental signals are significantly associated with future returns.
suggesting that fundamental signals
possess the ability to explain future earnings but not future returns. One explanation for this
phenomenon is that investors recognize the relation between current year fundamental signals
ted into current stock prices. The results from
returns in the US
for inventory, gross margin and selling and administration
differences in the two capital markets.
analysis is the study of how financial statement is related with future
Extensive prior research in the US documents a relation between
Lev and Thiagarajan 1993;
. Despite the importance of this line of research, little analysis of
fundamental analysis,
signals to explain future
better understand of the
relevance of financial data in this market will help investor make informed decisions on the
analysis may be of interest to regulators who
Using data from Indian firms, measures of performance (i.e., future earnings and returns)
Lev and Thiagarajan (1993).
inion and effective tax rate signals are statistically associated
with future earnings. The coefficient for the audit opinion is negative, suggesting adverse audit
opinions are associated with lower future earnings. The coefficient of the effective tax rate
increases in the effective tax rate are correlated with increases in
future earnings. Additional analysis of the fundamental signals and future returns reveal that
ically significant. This result suggests that
he results of this
Abarbanell and Bushee
Abarbanell and Bushee (1997) found the inventory, gross
margin, effective tax rates, LIFO and labor force variables statistically associated with future
ancial disclosures are useful in predicting
future earnings and returns. Thus, evidence is provided to support the relevance of Indian
financial disclosures. However, comparison with similar analysis conducted in the US by
veal substantial differences in between the two countries.

Further research is needed to examine the causes of these differences and their potential
implications to financial statement users.
VII. REFERENCES
Abarbanell, J.S., & Bushee, B.J. (1997).
Prices, Journal of Accounting Research
Abarbanell, J.S., & Bushee, B.J. (1998).
The Accounting Review, 73(1),
Aggarwal, N, & Gupta, M. (2009).
Fundamental Analysis in India?,
Holthausen, R.W., & Larcker, D.F. (1992).
Statement Information, Journal of Accounting and
Lev, B., & Thiagarajan, S.R. (1993). Fundamental Information Analysis,
Research, 31(2), 190-215.
Lewellen, J. (2010). Accounting anomalies and fundamental analysis: An alternative view.
Journal Of Accounting & Economics
Luchs, C., Maheshwari, S., & Myring,
in India, DIAS Technology Review
(October-March).
Ou, J.A., & Penman, S. H. (1989).
Returns, Journal of Accounting and Economics
Piotroski, J. D. (2000). Value Investing: The Use of Historical Financial Statement Information
to Separate Winners from Losers.
Richardson, S., Tuna, İ., & Wysocki, P. (2010). Accounting anomalies and fundamental analysis:
A review of recent research advances.
454.
Wieland, M. M. (2011). Identifying Consensus Analysts' Earnings Forecasts that Correctly and
Incorrectly Predict an Earnings Increase.
38(5/6), 574-600
Journal of Finance and Accountancy
An examination of future firm performance, Page
Further research is needed to examine the causes of these differences and their potential
implications to financial statement users.
. (1997). Fundamental Analysis, Future Earnings
Journal of Accounting Research, 35(1), 1-24.
. (1998). Abnormal Returns to a Fundamental Analysis Strategy
, 73(1), 19-45.
(2009). Do High Book-to-Market Stocks Offer Returns to
Fundamental Analysis in India?, Decision 36(2), 155-175.
, D.F. (1992). The Prediction of Stock Returns Using Fina
Journal of Accounting and Economics, 15, 373-411.
(1993). Fundamental Information Analysis, Journal of Accounting
215.
Lewellen, J. (2010). Accounting anomalies and fundamental analysis: An alternative view.
& Economics, 50(2/3), 455-466.
Myring, M. (2011). An Empirical Test of Fundamental Analysis
DIAS Technology Review-The International Journal for Business and IT
, S. H. (1989). Financial Statement Analysis and the Prediction of Stock
Journal of Accounting and Economics, 11. 295-329.
Piotroski, J. D. (2000). Value Investing: The Use of Historical Financial Statement Information
to Separate Winners from Losers. Journal of Accounting Research, 38(3),
., & Wysocki, P. (2010). Accounting anomalies and fundamental analysis:
A review of recent research advances. Journal of Accounting & Economics
Identifying Consensus Analysts' Earnings Forecasts that Correctly and
Incorrectly Predict an Earnings Increase. Journal of Business Finance & Accounting
rnal of Finance and Accountancy
An examination of future firm performance, Page 8
Further research is needed to examine the causes of these differences and their potential
Fundamental Analysis, Future Earnings, and Stock
a Fundamental Analysis Strategy,
Market Stocks Offer Returns to
The Prediction of Stock Returns Using Financial
411.
Journal of Accounting
Lewellen, J. (2010). Accounting anomalies and fundamental analysis: An alternative view.
f Fundamental Analysis
The International Journal for Business and IT 16
the Prediction of Stock
Piotroski, J. D. (2000). Value Investing: The Use of Historical Financial Statement Information
(3), 1-41.
., & Wysocki, P. (2010). Accounting anomalies and fundamental analysis:
f Accounting & Economics, 50(2/3), 410-
Identifying Consensus Analysts' Earnings Forecasts that Correctly and
f Business Finance & Accounting,
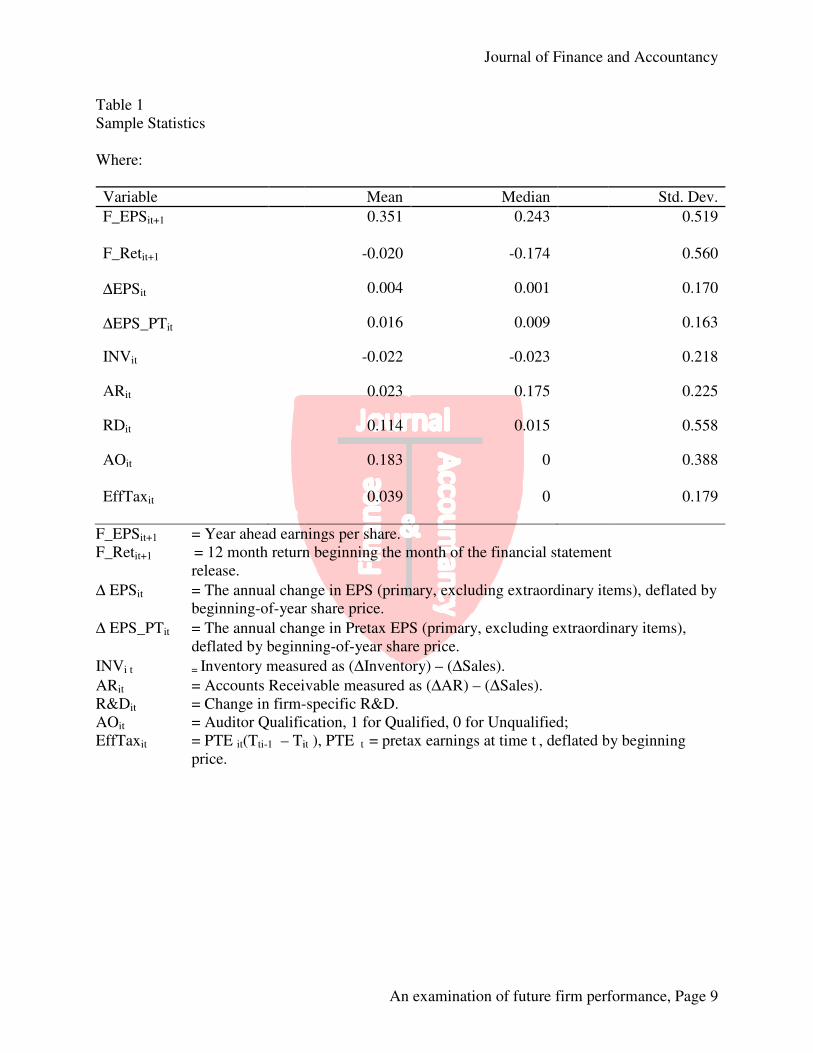
Table 1
Sample Statistics
Where:
F_EPSit+1 = Year ahead earnings
F_Retit+1 = 12 month return beginning the month of the financial statement
release.
∆ EPSit = The annual change in EPS (primary, excluding extraordinary items), deflated by
beginning-of-year
∆ EPS_PTit = The annual change in
deflated by beginning
INVi t = Inventory measured as (
ARit = Accounts Receivable measured as (
R&Dit = Change in firm-
AOit = Auditor Qualification, 1 for Qualified, 0 for Unqualified
EffTaxit = PTE it(Tti-1 – Tit
price.
Variable
F_EPSit+1
F_Retit+1
∆EPSit
∆EPS_PTit
INVit
ARit
RDit
AOit
EffTaxit
Journal of Finance and Accountancy
An examination of future firm performance, Page
Year ahead earnings per share.
12 month return beginning the month of the financial statement
= The annual change in EPS (primary, excluding extraordinary items), deflated by
year share price.
= The annual change in Pretax EPS (primary, excluding extraordinary items),
beginning-of-year share price.
Inventory measured as (∆Inventory) – (∆Sales).
= Accounts Receivable measured as (∆AR) – (∆Sales).
-specific R&D.
Auditor Qualification, 1 for Qualified, 0 for Unqualified;
it ), PTE t = pretax earnings at time t , deflated by beginning
Mean Median
0.351 0.243
-0.020 -0.174
0.004 0.001
0.016 0.009
-0.022 -0.023
0.023 0.175
0.114 0.015
0.183 0
0.039 0
rnal of Finance and Accountancy
An examination of future firm performance, Page 9
12 month return beginning the month of the financial statement
= The annual change in EPS (primary, excluding extraordinary items), deflated by
Pretax EPS (primary, excluding extraordinary items),
, deflated by beginning
Std. Dev.
0.519
0.560
0.170
0.163
0.218
0.225
0.558
0.388
0.179
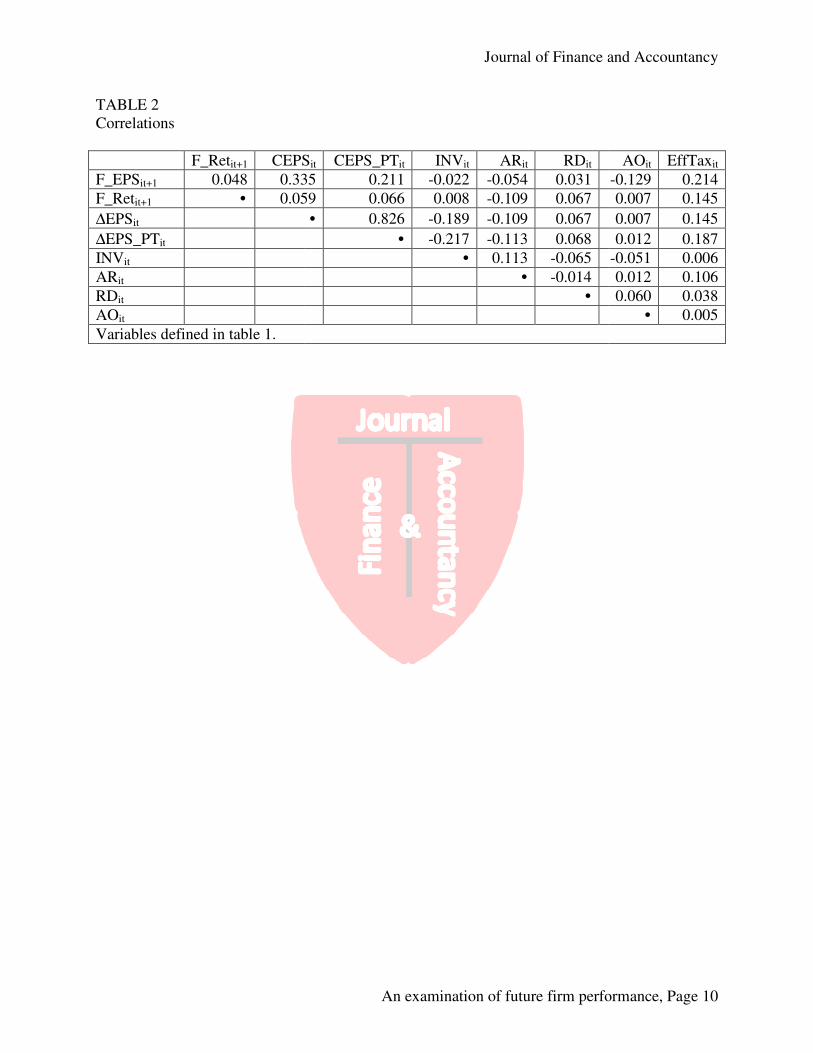
TABLE 2
Correlations
F_Retit+1 CEPS
F_EPSit+1 0.048 0.335
F_Retit+1 � 0.059
∆EPSit
∆EPS_PTit
INVit
ARit
RDit
AOit
Variables defined in table 1.
Journal of Finance and Accountancy
An examination of future firm performance, Page
CEPSit CEPS_PTit INVit ARit RDit
0.335 0.211 -0.022 -0.054 0.031
0.059 0.066 0.008 -0.109 0.067
� 0.826 -0.189 -0.109 0.067
� -0.217 -0.113 0.068
� 0.113 -0.065
� -0.014
�
rnal of Finance and Accountancy
An examination of future firm performance, Page 10
AOit EffTaxit
-0.129 0.214
0.007 0.145
0.007 0.145
0.012 0.187
-0.051 0.006
0.012 0.106
0.060 0.038
� 0.005
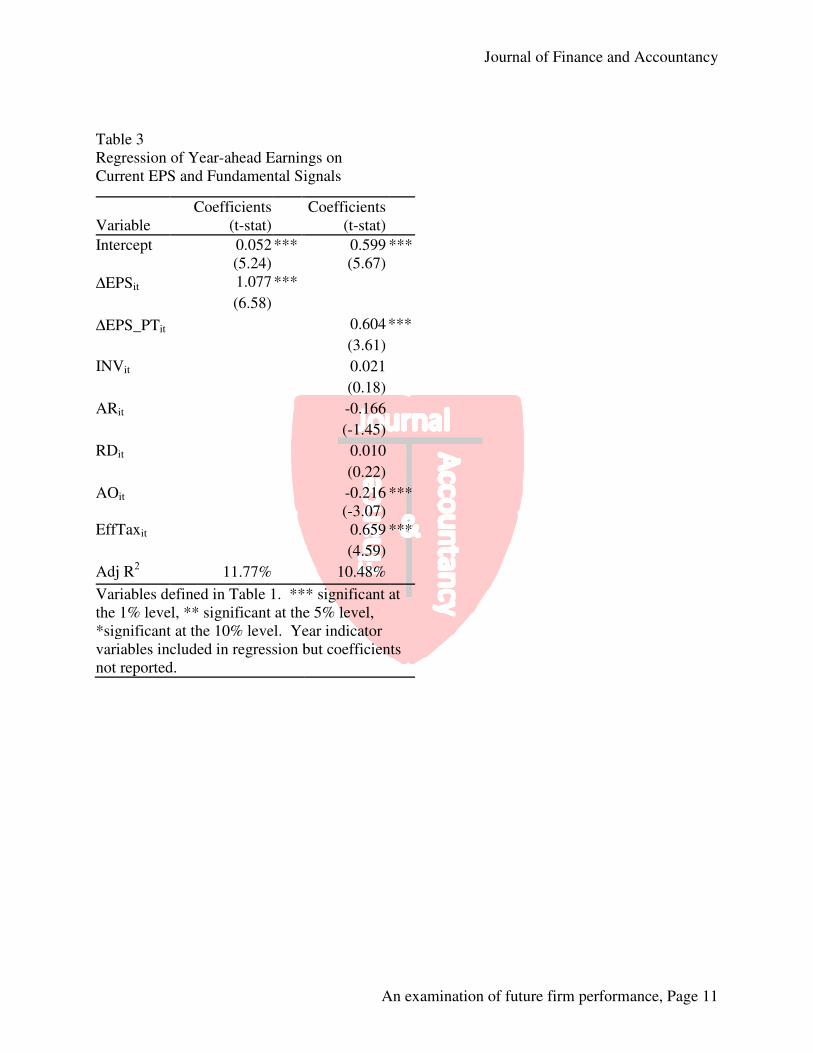
Table 3
Regression of Year-ahead Earnings on
Current EPS and Fundamental Signals
Variable
Coefficients
(t-stat)
Intercept
0.052
(5.24)
***
∆EPSit 1.077
(6.58)
***
∆EPS_PTit
INVit
ARit
RDit
AOit
EffTaxit
Adj R2 11.77%
Variables defined in Table 1. *** significant at
the 1% level, ** significant at the 5% level,
*significant at the 10% level. Year indicator
variables included in regression but coefficients
not reported.
Journal of Finance and Accountancy
An examination of future firm performance, Page
ahead Earnings on
Current EPS and Fundamental Signals
Coefficients
(t-stat)
0.599
(5.67)
***
0.604
(3.61)
***
0.021
(0.18)
-0.166
(-1.45)
0.010
(0.22)
-0.216
(-3.07)
***
0.659
(4.59)
***
10.48%
Variables defined in Table 1. *** significant at
the 1% level, ** significant at the 5% level,
*significant at the 10% level. Year indicator
variables included in regression but coefficients
rnal of Finance and Accountancy
An examination of future firm performance, Page 11
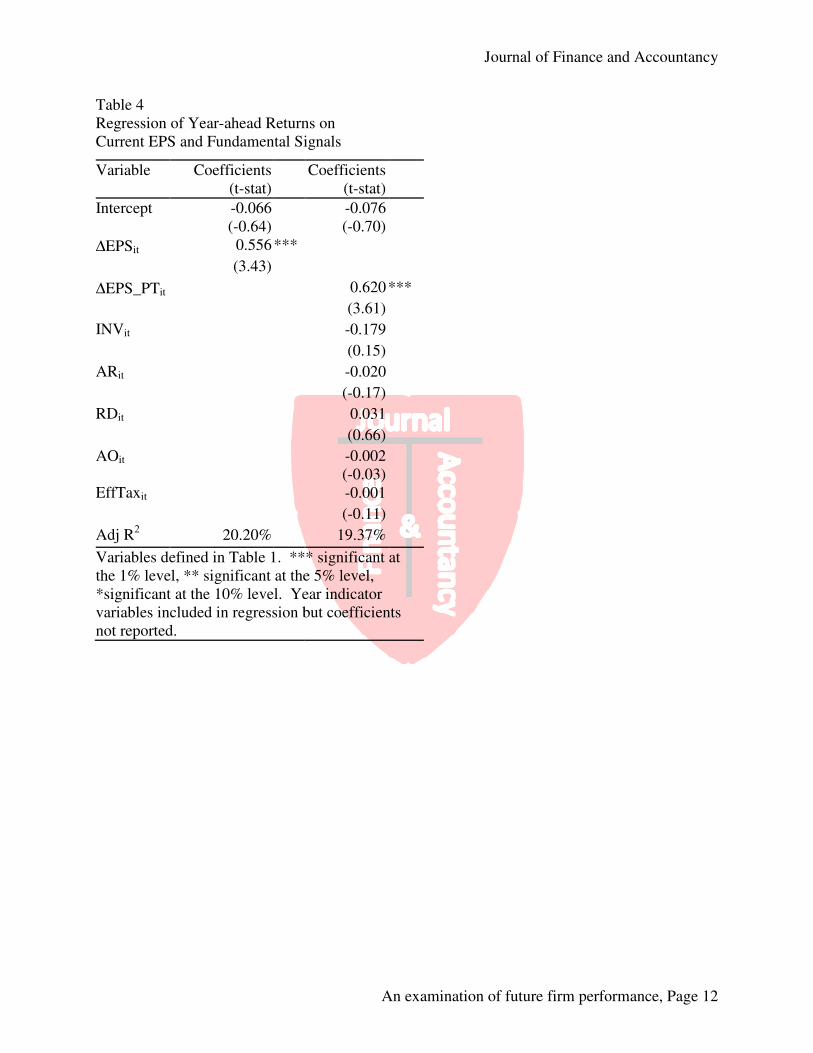
Table 4
Regression of Year-ahead Returns on
Current EPS and Fundamental Signals
Variable Coefficients
(t-stat)
Intercept
-0.066
(-0.64)
∆EPSit 0.556
(3.43)
***
∆EPS_PTit
INVit
ARit
RDit
AOit
EffTaxit
Adj R2 20.20%
Variables defined in Table 1. *** significant
the 1% level, ** significant at the 5% level,
*significant at the 10% level. Year indicator
variables included in regression but coefficients
not reported.
Journal of Finance and Accountancy
An examination of future firm performance, Page
ahead Returns on
Current EPS and Fundamental Signals
Coefficients
(t-stat)
-0.076
(-0.70)
0.620
(3.61)
***
-0.179
(0.15)
-0.020
(-0.17)
0.031
(0.66)
-0.002
(-0.03)
-0.001
(-0.11)
19.37%
Variables defined in Table 1. *** significant at
the 1% level, ** significant at the 5% level,
*significant at the 10% level. Year indicator
variables included in regression but coefficients
rnal of Finance and Accountancy
An examination of future firm performance, Page 12