Embed Size (px)
Citation preview
Brigham Young University Brigham Young University
BYU ScholarsArchive BYU ScholarsArchive
Theses and Dissertations
2010-03-19
An Examination of the DNA Content, Taxonomy and Phylogeny of An Examination of the DNA Content, Taxonomy and Phylogeny of
Penstemon (Plantaginaceae) Penstemon (Plantaginaceae)
Shaun R. Broderick Brigham Young University - Provo
Follow this and additional works at: https://scholarsarchive.byu.edu/etd
Part of the Animal Sciences Commons
BYU ScholarsArchive Citation BYU ScholarsArchive Citation Broderick, Shaun R., "An Examination of the DNA Content, Taxonomy and Phylogeny of Penstemon (Plantaginaceae)" (2010). Theses and Dissertations. 2044. https://scholarsarchive.byu.edu/etd/2044
This Thesis is brought to you for free and open access by BYU ScholarsArchive. It has been accepted for inclusion in Theses and Dissertations by an authorized administrator of BYU ScholarsArchive. For more information, please contact [email protected], [email protected].

An examination of the DNA content,
taxonomy and phylogeny of
Penstemon (Plantaginaceae)
Shaun R. Broderick
A thesis submitted to the faculty of
Brigham Young University
in partial fulfillment of the requirements for the degree of
Master of Science
Mikel R. Stevens
Dale T. Lindgren
Brad Geary
Eric N. Jellen
Department of Plant and Wildlife Sciences
Brigham Young University
April 2010
Copyright © 2010 Shaun R. Broderick
All Rights Reserved

ABSTRACT
An examination of the DNA content,
taxonomy and phylogeny of
Penstemon (Plantaginaceae)
Shaun R. Broderick
Department of Plant and Wildlife Sciences
Master of Science
Penstemon is the largest genus in North America with more than 270 reported species.
However, little is known about the genome size of this genus and how this information may be
useful in selecting species in developing hybrids for landscape use. Using flow cytometry, we
estimated the genome size of approximately 40% of the genus (117 specimens from 104 different
species.) Genome sizes for the putative diploids ranged from 2C = 0.94 – 1.89 pg (1C = 462 –
924 Mbp) and the putative polyploids ranged from 2.57 – 6.54 pg (1C = 1,257 – 3,156 Mbp).
Chromosome counts were compiled and compared with the flow cytometry results for the
species within this publication. Ploidy within the genus ranged from diploid to dodecaploid.
These data were compared and contrasted with the current taxonomy of Penstemon and
previously published ITS and cpDNA phylogenetic work. Based on genome size, reassigning P.
montanus, P. cardinalis, and P. uintahensis to the subgenus Penstemon and P. personatus to the
subgenus Dasanthera, would better reflect the phylogeny of the genus. Both auto- and allo-
polyploidization are plausible mechanisms for increasing ploidy within the genus. The diploid
species within the subgenus Saccanthera contain on average 1.09 pg (1C = 532 Mbp); however,
two species within this subgenus are tetraploid and octaploid. The DNA content of subgenus
Penstemon exhibits high plasticity and spans a six-fold increase. Our study found flow cytometry
to be useful in species identification and verification. This represents the first published work on
the genome size of Penstemon. This research will aid in future DNA sequencing experiments and
breeding programs.
Keywords: Penstemon, flow cytometry, DNA content, polyploid, C value, phylogeny

ACKNOWLEDGEMENTS
I would like to thank Dr. Mikel Stevens for his continual encouragement over these
several months. He was always there to provide great support, corrections on my writing, and his
friendship. I would also like to thank Dr. Dale T. Lindgren for his expertise in Penstemon and for
having him on my committee, Dr. Brad Geary for providing a great lab environment, and Dr.
Eric N. Jellen for instructing and coaching me with cytogenetics.
I would also like to thank all of those students that helped me in the greenhouse, in the
field, and in sample preparation. I really could not have completed this work without their
assistance. Work aside, I really appreciated their friendships.
My acknowledgements would be incomplete without mentioning my wife. Her support
was continual throughout every frustrating and stressful day. My parents are also in need of
thanking as they are the ones that instilled the need of continual education in me. I would have
stopped my education long ago without them.
iv
CONTENTS
TITLE PAGE ..................................................................................................................................................................i
ABSTRACT ................................................................................................................................................................. ii
ACKNOWLEDGEMENTS ......................................................................................................................................... iii
CHAPTER 1: A SURVEY OF PENSTEMON’S GENOME SIZE ............................................................................... 1
Introduction ....................................................................................................................................................................... 2
Materials and Methods ...................................................................................................................................................... 4
Penstemon diversity and identification ................................................................................................................... 4
Tissue sampling ...................................................................................................................................................... 4
Isolation of nuclei and genome size analysis .......................................................................................................... 5
Results and discussion ...................................................................................................................................................... 6
Ploidy within the Penstemon genus ........................................................................................................................ 7
Subgenus Cryptostemon ......................................................................................................................................... 9
Subgenus Dasanthera ............................................................................................................................................. 9
Subgenus Dissecti ................................................................................................................................................. 10
Subgenus Habroanthus ........................................................................................................................................ 10
Subgenus Penstemon ............................................................................................................................................ 11
Subgenus Saccanthera .......................................................................................................................................... 12
Hybrids ................................................................................................................................................................. 13
Flow cytometry and Penstemon classification ...................................................................................................... 13
Conclusion ...................................................................................................................................................................... 14
Acknowledgements ......................................................................................................................................................... 16
References ....................................................................................................................................................................... 17
CHAPTER 2: LITERATURE REVIEW ..................................................................................................................... 24
Introduction ..................................................................................................................................................................... 25
Penstemon taxonomy............................................................................................................................................ 26
Marker development and phylogenetic studies in Penstemon .............................................................................. 28
Ploidy in Penstemon ............................................................................................................................................. 29

v
Flow cytometry..................................................................................................................................................... 31
Development of flow cytometry ...................................................................................................................... 32
Sample preparation .......................................................................................................................................... 33
Secondary metabolites interfere with flow cytometry ..................................................................................... 33
Cell division .................................................................................................................................................... 34
Conclusion ...................................................................................................................................................................... 35
References ....................................................................................................................................................................... 37
FIGURES AND TABLES ........................................................................................................................................... 44
1
CHAPTER 1: A SURVEY OF PENSTEMON’S GENOME SIZE

2
INTRODUCTION
Penstemon (Plantaginaceae) is comprised of more than 270 species, making it the largest
genus endemic to North America. Species within the genus are morphologically diverse and are
adapted to a wide range of environments; many thrive on rocky, xeric slopes, especially those
distributed throughout the arid western US and others grow in moist, humid regions (Wolfe et al.
2006; Nold 1999). With regard to plant form, some species are prostrate and others are stately
and erect. A number of the species have high ornamental landscape value due to their
conspicuous flowers and drought tolerance but Penstemon, in general, has not achieved high
levels of consumer popularity because most species bloom prolifically for just a few weeks
during the growing season (Lindgren and Wilde 2003; Lindgren 2000). Many species are utilized
in reclamation projects and others are being considered for protection under the Endangered
Species Act (Kramer and Frant 2007). Therefore, gaining understanding of the genetics of this
genus will potentially have great value to multiple users.
The current accepted taxonomy of Penstemon divides the genus into 6 subgenera, 12
sections, and 23 subsections based on distinctive phenotypic characteristics (Wolfe et al. 2006).
Anther shape and dehiscence pattern are the most prominent and useful characteristics for
Penstemon characterization. Other morphological features are also used: flower shape, branching
habits, leaf shape, staminode shape, and pubescence (Cronquist et al. 1984; Welsh et al. 2008).
Although useful for classification, the current taxonomic structure does not entirely reflect the
evolutionary relationships among the species.
Wolfe et al. (2006) conducted the largest phylogenetic study to date on 163 Penstemon
species using the internal transcribed spacer (ITS) sequence and two chloroplast DNA (cpDNA)
spacers, trnT-L and trnC-D. They constructed ITS and cpDNA trees with ≥ 70% bootstrap

3
values. The phylogenetic trees were not combined because of discrepancies between them;
however, both trees exhibited similar branching patterns. The short branches observed in both
trees suggest rapid speciation of the genus dating back to the Pleistocene (Wolfe et al. 2006;
Wolfe et al. 2002; Levin 2000; Pennell 1935).
Chromosome counts have been conducted for approximately 40% of Penstemon species
(Freeman 1983). Most are diploid (2n = 2x = 16) while a few species, such as P. euglaucus, P.
subserratus, P. tubaeflorus, and P. digitalis, are reported to be polyploid (Clausen et al. 1940;
Crosswhite and Kawano 1965; Darlington and Ammal 1945; Freeman 1983; Löve and Löve
1982; Winge 1925; Nisbet and Jackson 1960; Smith 1964; Taylor and Brockman 1966).
Chromosome counts of additional species would have value; however, cytological work is
tedious and accurate counts are difficult to obtain for this genus. Alternatively, flow cytometry is
a simple and faster method for estimating nuclear DNA content (Galbraith et al. 1983). It is also
effective for determining ploidy levels (Farnham et al. 1998; Barker et al. 2001; Bonos et al.
2002) and estimating interspecific differences in DNA content (Zoldo et al. 1998; Dewitte et al.
2009; Kankanpää et al. 1996; Lysák et al. 1999).
During speciation, mutations accumulate and DNA content diverges. These differences
can then be utilized in phylogenetic analyses with the underlying assumption that closely related
species share similar amounts of nuclear DNA, whereas more distantly related species will differ
more in DNA content (Ricroch et al. 2008; Grotkopp et al. 2004). At present no information is
available on the DNA content in the genus Penstemon. Documentation of the genome size of this
genus would allow insight into why some species are known to develop interspecific hybrids
while others do not, for example in the speciation process (Wolfe et al. 1998a; Wolfe et al.
1998b; Lindgren and Schaaf 2007). Furthermore, gaining an understanding of the genome size of

4
this genus will be valuable to ecologists, taxonomists, conservationists, phylogeneticists and
Penstemon plant breeders. The objectives of the present study were to (1) estimate the nuclear
DNA range of the Penstemon genus via flow cytometry; (2) identify the ploidy of some of the
species using both cytogenetics and flow cytometry; and (3) compare our results with previous
phylogenetic ITS and cpDNA studies with an eye to taxonomical revision.
MATERIALS AND METHODS
Penstemon diversity and identification
Species and hybrids of the genus Penstemon were collected from their native habitats,
purchased or donated (Table 1). Each field-collected sample was assigned to its species/variety
using taxonomic keys specific to the Intermountain West (Cronquist et al. 1984; Welsh et al.
2008). For this study, the taxonomy of the American Penstemon Society and field guides of
Lodewick and Lodewick (1999) and Nold (1999) were used. This identification system is widely
used and currently accepted as a workable taxonomy of the Penstemon genus. Furthermore, it
was utilized by Wolfe et al. (2006) in their extensive molecular phylogenetic study of
Penstemon.
Tissue sampling
Healthy tissue samples were usually taken from multiple plants and source-identified
throughout the testing process. In many instances tissue of the same species was collected from
multiple native population/locations. If only 1-2 plants were available, multiple samples were
taken from the same plant(s), whether the source was cultivated or collected (Table 1). All tissue
samples were handled and stored in one of two ways prior to evaluation with the flow cytometer.
5
While most samples were stored at 4 °C as fresh tissue for a period of time no longer than three
days post-collection, some tissue samples were freeze dried and maintained at −80 °C until final
preparatory steps were initiated.
Isolation of nuclei and genome size analysis
All Penstemon flow cytometry samples were amenable to the MgSO4 buffer solution and
protocol described by Galbraith et al. (1983) and Arumuganathan and Earle (1991) without
additional purification steps. Approximately 0.25 g of Pisum sativum ‗Ctirad‘ leaf tissue was co-
prepared with each ~0.5 g Penstemon sample to provide an internal standard. Genome size was
quantified using the BD FACSCanto™ Flow Cytometer (Franklin Lakes, NJ). During flow
cytometry testing 10,000 events (i.e. particles measured in one sample) were initially collected
from each sample; to improve sample resolution, events were increased to 30,000. From one to
22 samples (mode=3) were prepared for each species (Table 1).
The collected data from each sample was analyzed with ModFit LT 3.0 (Verity Software
House, Topsham, ME). The following equation (Doležel 2009) was used to estimate the genome
size from the flow cytometry measurements:
( ) ( )
A value of 9.09 pg (Doležel et al. 1998) was used as the standard 2C DNA content, where
―2C‖ represents the holoploid, or complete, genome size (Greilhuber et al. 2007). Base-pair size
equivalents were assumed as 1 pg DNA = 978 Mbp (megabase pairs) (Doležel et al. 2003).
6
RESULTS AND DISCUSSION
Genome size was calculated for 117 Penstemon specimens consisting of 104 species, and
13 subspecies or cultivars. These specimens represented species from all 6 subgenera, 11 of 13
sections, and 15 of 22 subsections described by Lodewick and Lodewick (1999), Nold (1999),
and Wolfe et al. (2006) (Table 1). There was little variation in the flow cytometry results with
95% of the coefficient of variation (CV) for each sample peak below 10%. The mean CV for any
given species was 2.19% with 6 of the 117 tested specimens having a CV over 5%. (The largest
CV was 6.99% [P. wilcoxii].) For this study, CV values of approximately 5% were
insignificantly small. Penstemon ‗Rubycunda‘ is a clonally propagated cultivar and should have
minimal to no DNA content variation. Its CV value was 5.15% suggesting that CV values in this
range result from differences in sample preparation and analysis.
Most samples returned well-defined peaks in the readout. Normal readouts consisted of a
prominent G1 (gap 1, i.e. a cell with a normal amount of DNA) peak, and reduced or non-
detectable G2 (i.e. a cell with duplicated DNA awaiting cellular division) peak, and a prominent
G1 peak of the internal standard (Pisum sativum ‗Ctirad‘). Only P. harbourii consistently
displayed three distinct flow cytometry peaks (Fig. 1). Although multiple peaks are often
observed in flow analyses from endoreduplication (e.g. Arabidopsis thaliana; Bennett et al.
2003), these peaks are too crowded and fail to mimic the commonly observed patterns of
endoreduplication. The exact cause of these aberrant peaks remains unknown, but it may be a
result of an aneuploidization event within all three plants or a unique entophytic interaction.
Future research may elucidate the exact mechanism.
7
Ploidy within the Penstemon genus
Eleven of the Penstemon species we studied were identified as polyploids, with ploidy
levels ranging from tetraploid, (e.g. P. pratensis; Clausen et al. 1940; Keck 1945), to
dodecaploid P. digitalis (Winge 1925; Crosswhite and Kawano 1965; Darlington and Ammal
1945; Freeman 1983). Of particular interest, is the division in genome size between diploids and
polyploids (Fig. 1). There was an incremental increase in genome size for the putative diploids:
from 0.94 pg (1C = 462 Mbp) for P. dissectus to 1.89 pg (1C = 922 Mbp) for P. nitidus.
However, there was a large increase of approximately 200 Mbp from P. nitidus, the largest
analyzed diploid, to P. pratensis, the smallest analyzed tetraploid, (2.30 pg [1C = 1,124 Mbp])
(Fig. 2). The largest genome we studied was P. digitalis ‗Dark Towers‘ (6.45 pg [1C = 3,156
Mbp]). Of the species for which cytological work has been performed, those with less than 1.89
pg were found to be diploid while all species above 2.30 pg were polyploid (Table 1; Fig. 2).
Keck (1932; 1945) hypothesized that polyploid Penstemon were most likely
allopolyploids and not autopolyploids as this genus frequently overcomes species hybridization
barriers. However, our data suggest that both auto- and allo-polyploidization are reasonable
speciation mechanisms occurring within this genus. For example, P. humilis contains two
varieties with differing ploidy levels: P. humilis var. brevifolius (1.24 pg [1C = 607 Mbp]) is a
putative diploid, while P. humilis var. humilis (2.57 pg [1C = 1,255 Mbp]) is a putative tetraploid
(Table 1; Fig. 2). The similarities in genome size between the diploid and tetraploid varieties (i.e.
doubling the genome size of diploid is approximately equal to the genome size of the tetraploid)
suggest autopolyploid speciation. These samples appear—with minor phenotypic variation
typical of autopolyploids (i.e. slightly larger plant structure)—to be essentially the same.
Furthermore, Wolfe et al. (2006) identified nine Penstemon species in two subgenera and six
8
unique sections which had been reported to contain diploids and polyploids within the same
species.
In addition to autopolyploidization, evidence for allopolyploidization was found in one of
our P. thompsoniae samples. Flow cytometry was performed on samples from two
geographically distinct populations: Washington Co. UT and White Pine Co. NV. We found the
Washington Co. population to be a putative tetraploid with an average genome size of 2.3 pg (1C
= 1,126 Mbp) and the White Pine Co. population to be a putative diploid with an average
genome size of 1.32 pg (1C = 643 Mbp). The morphology of the in situ Washington Co. UT
population consisted of plants which formed larger mats but smaller leaves in comparison with
the White Pine Co. NV population. The tetraploid Washington Co. population is of special
interest because its genome size does not share a 2:1 ratio with the diploid White Pine Co.
specimen, suggesting that the tetraploid may be the result of an interspecific cross.
The P. thompsoniae putative allopolyploid may have resulted from crossing two species
that occupy the same geographical region. We found both P. linarioides var. sileri and P.
thompsoniae within two kilometers of each other at the Washington Co. collection site. Wolfe et
al. (2006) found that subsection Linarioides (contains P. linarioides) clustered around subsection
Caespitosi (contains P. thompsoniae) in both phylogenetic trees, suggesting that the
aforementioned species are closely related and may readily hybridize. This allopolyploid
hypothesis is supported because the genome size of the tetraploid P. thompsoniae is equal to the
summation of the genome sizes P. linarioides var. sileri and P. thompsoniae from White Pine
Co. NV. However, if this interspecific hybridization event has occurred, it is not supported by
morphology. The tetraploid P. thompsoniae specimens have no clearly identifiable
morphological characteristic from P. linarioides var. sileri. Nevertheless, the P. thompsoniae are

9
noted as having a diversity of morphological features which are not clearly delineated to an area
or region. In both taxonomic keys of Cronquist et al. (1984) and Welsh et al. (2008) the species
description of P. thompsoniae is noted to encompass a broad range of morphological forms. A
partial explanation for the variable morphology may be differences in ploidy levels among
populations of P. thompsoniae. Differences in ploidy level can affect morphological differences
(Cramer 1999).
Subgenus Cryptostemon
Penstemon personatus of the monotypic Cryptostemon subgenus has an average 2C value
of 1.01 pg (1C = 494 Mb) sharing similar 2C values with the subgenus Dasanthera (Fig. 2). This
species also shares morphological similarities with the subgenus Dasanthera (Keck 1936). In
Wolfe et al.‘s (2006) study P. personatus consistently grouped with the subgenus Dasanthera.
Thus our data supports Wolfe et al.‘s (2006) suggestion to reassign this species to subgenus
Dasanthera.
Subgenus Dasanthera
With an average DNA content of 1.11 pg (1C = 543 Mbp), the five subgenus Dasanthera
species are among the smallest genomes evaluated (Table 1; Fig. 2). However, based on genome
size, P. montanus appears distantly related to the other four of this subgenus and more closely
related to subgenus Penstemon (Fig. 2). This is consistent with Wolfe et al.‘s (2006) research as
both the ITS and the cpDNA sequence data placed subgenus Dasanthera sister to the Penstemon
clade in their respective phylogenetic trees. Penstemon montanus and P. lyallii (1.19 pg [1C =
581]) are the only herbaceous species assigned to the subgenus Dasanthera (Nold 1999), and

10
they contain the largest DNA content we measured for the subgenus (Fig. 2). Based on genome
size and dormancy characteristics, both species should be reassigned to the subgenus Penstemon.
Subgenus Dissecti
Like subgenus Cryptostemon, subgenus Dissecti is monotypic with P. dissectus being its
representative species. Penstemon dissectus has an unusual, conspicuous leaf shape that
distinguishes this species from all other species within the genus, and it is geographically
isolated on the east side of the Appalachian Mountains (Pennell 1935). It has the smallest
genome size of all the Penstemon species we tested with 0.94 pg (1C = 458 Mbp) and could
therefore retain its classification as a separate subgenus; however, it shares morphological
characteristics with the subgenus Saccanthera. The anther morphology and dehiscence are
indistinguishable from species in the subgenus Saccanthera (Wolfe et al. 2006). Furthermore,
our P. dissectus genome size data is similar to the DNA content we found in eight of the ten
Saccanthera species we tested (Fig. 2). Wolfe et al. (2006) suggested reassigning this species to
the subgenus Penstemon to reflect the phylogenetic results, but they also suggested reassigning
all Saccanthera species to a group within the subgenus Penstemon. Our data do not contradict
this conclusion.
Subgenus Habroanthus
We tested 28 species of the subgenus Habroanthus and, excluding the polyploids, they
were generally found to be among the largest diploid genomes of the Penstemon genus (2C DNA
of 1.12 to 1.81 pg [1C = 548 – 885 Mbp]). However, two of the 28 species, P. uintahensis (2C
DNA of 1.12 pg [1C = 548 Mbp]) and P. cardinalis (2C DNA of 1.28 pg [1C = 626 Mbp]),

11
exhibited unusually small genomes in comparison to other Habroanthus species tested (Fig. 2).
Penstemon cardinalis was originally placed in the subgenus Penstemon; however, it was later
reassigned to subgenus Habroanthus (Nold 1999). This species unfortunately was not included
in Wolfe et al.‘s (2006) phylogenetic work; however, our study reveals that P. cardinalis
putatively shares more in common with other subgenus Penstemon species because it differs by
more than 100 Mbp from its presently classified taxonomic relative, P. eatonii (Table 1; Fig. 2).
Generally, these data reflect Wolfe et al.‘s (2006) findings where ITS and cpDNA sequences
from subgenus Habroanthus species form clades within the subgenus Penstemon in their
phylogenetic trees.
Subgenus Habroanthus contains two sections: Habroanthus and Elmigera. The four
species we tested from section Elmigera appear to form a polyphyletic group, as they fail to
cluster together (Fig. 2). The remaining 24 tested species belong to the section Habroanthus.
They are clustered, but interspersed among the subgenus Penstemon. The subgenus Habroanthus
species are sandwiched between sections Peltanthera and Anularius of the subgenus Penstemon
and interwoven within the section Aurator (Fig. 2). Wolfe et al. (2006) suggested dissolving the
subgenus Habroanthus and reassigning these species to subgenus Penstemon—specifically to
sections Anularius and Peltanthera—to better reflect their phylogenetic relationship. Our
research also suggests either 1) a reassignment to the subgenus Penstemon as previously
mentioned or 2) the creation of a new Habroanthus section within subgenus Penstemon.
Subgenus Penstemon
The subgenus Penstemon contained the largest number of species tested in this study
(68). Those species represent seven of the nine sections of the subgenus Penstemon, Ambigui (1

12
species), Anularius (10), Aurator (11), Ericopsis (11) Fasciculus (2), Peltanthera (9), and
Penstemon (24). The genome size of this subgenus has the largest range of any of the subgenera,
spanning over a six-fold increase in 2C DNA content from P. linarioides var. sileri 1.02 pg (1C
= 500 Mbp) to P. digitalis 'Dark Towers' 6.45 pg (1C = 3,156 Mbp) (Fig. 2). The subgenus
Penstemon DNA content essentially ranges near or across the size of all the other subgenera.
Of the 13 polyploids evaluated, 11 belong to subgenus Penstemon. Tetra-, hexa-, and
dodeca-ploidy were observed. The plethora of species, number of polyploids observed, and
expanse of genome size across all other subgenera demonstrate the high plasticity of the DNA
content of subgenus Penstemon. The biological mechanism regulating the genome expansion in
subgenus Penstemon is unknown, but a possible explanation is that this subgenus has low
meiotic fidelity which results in a higher portion of unreduced gametes (Ramsey and Schemske
1998). This hypothesis could be verified by microscopic surveys of pollen size, as unreduced
pollen grains tend to be significantly larger (Katsiotis and Forsberg 1995.) Many commercially
developed cultivars directly result from crossing parents belonging to this subgenus. Such
plasticity is evidence for species from this subgenus to effectively interbreed.
Subgenus Saccanthera
We tested ten species belonging to the subgenus Saccanthera and all were found to have
comparatively small genomes, similar to those of subgenus Dasanthera, Dissecti and
Cryptostemon with an average of 1.09 pg (1C = 532 Mbp) among the diploid species; however,
P. azureus and P. venustus were found to be tetraploid and octaploid, respectively (Fig. 2).
Nevertheless, the 1Cx (i.e. the monoploid genome size) value remained 532 Mbp for these
polyploid Saccanthera species, suggesting that they are closely related despite past

13
polyploidization events. Wolfe et al. (2006) found that Saccanthera consistently grouped in a
basal clade of Penstemon genus.
Hybrids
Suda et al. (2007) reported that an interspecific hybrid will often show an intermediate
genome size between the parents. We did not test this hypothesis in Penstemon although we did
include four putative interspecific hybrid cultivars in our study: ‗Potus Bells‘ (1.22 pg [1C = 596
Mbp]), ‗Rubycunda‘ (1.24 pg [1C = 605 Mbp]), ‗Sweet Cherry‘ (1.29 pg [1C = 633 Mbp]), P.
mexicali ‗Sweet Joanne‘ (1.22 pg [1C = 596 Mbp]). These cultivars are putative interspecific
crosses between species within subgenus Penstemon; however they have ambiguous parentage.
Often, subgenus Penstemon interspecifically hybridizes in nature (Straw 1955); therefore, it may
be possible to utilize flow cytometry to aid in determining parentage in these natural hybrid
swarms (Suda et al. 2007).
Flow cytometry and Penstemon classification
Within the Penstemon genus many species share morphological similarities.
Identification often requires detailed dichotomous keys that are difficult to use. Within our
research, misclassification occasionally occurred, particularly when the characteristics of a
specimen were intermediate or less than distinctive. We found that flow cytometry became an
excellent aid in identifying a mislabeled or misidentified specimen. Thus, our experience
demonstrated that intraspecific variation in genome size is generally minimal, as has been
reported previously (Gregory 2005). The variation seen within individuals of the same
population was minimal for virtually all species (mean CV value of 2.19%). Although this

14
technique is not feasible in a field setting, it has been valuable for verifying field classifications
on preserved leaves.
Six species exhibited a CV value for genome size larger than 5%: P. confusus (6.55%), P.
wilcoxii (6.99%), P. cyaneus (6.08%), P. pachyphyllus var. pachyphyllus (5.41%), P.
‗Rubycunda‘ (5.15%), and P. humilis var. brevifolius (5.87%). These accessions may contain
populations with elevated levels of genome-altering mechanisms such as increased activity of
transposable elements. These populations may be developing into subspecies through various
selective pressures. Cronquist et al. (1984) stated that P. humilis contains many phenotypic
variants within the species and that the taxonomic key simply provided guidelines to help group
all of the variants into one congruent category.
CONCLUSION
The Penstemon genus is noted for its phenotypic plasticity (Cronquist et al., 1984; Nold
1999; Wolfe et al. 2006; Welsh et al., 2008). Furthermore, it is native only to North America
with over 100 of the ~270 species endemic to Utah (Wolfe et al. 2006). We have demonstrated
that Penstemon’s phenotypic plasticity is mirrored in its dramatic genome-size variation. There
are many different types of mutations that alter genome size and ultimately cause speciation.
Retrotransposition, accumulation of pseudogenes, intron expansion/reduction, rRNA gene
magnification/reduction, chromosomal loss, retention of duplication/deficiencies arising from
inversion and translocation heterozygosity, insertions and deletions (―indels‖), and chromosomal
fusions are some of the major mechanisms that alter genome size. To a lesser extent, indels in
satellite DNA length and ribosomal DNA (rDNA) alter genome size, but these effects are minute
in comparison to the nuclear genome. Gregory (2005) felt that, although it is often stated that

15
polyploidy is the fastest means to increase a genome size, it actually is not a mechanism that
changes genome size; rather, it is merely adding a second genome to a single nucleus. Using
high-throughput sequencing techniques, such as 454-pyrosequencing, it is now relatively easy to
study the possible mechanisms that contribute to and/or cause genome size fluctuations in
Penstemon (Swaminathan et al. 2007).
There are a growing number of studies that have perused correlations between
intraspecific genome size variation and environmental factors. Achigan-Dako et al. (2008)
studied Lagenaria siceraria and found a correlation between genome size and elevation;
however, no other correlations were determined from their data. In contrast, Kankanpää et al.
(1996) performed an extensive study of barley (Hordeum) but found no correlations between
genome size variation and environment.
The research reported in this study contributes to understanding the Penstemon genome
in four specific ways. First, it represents the first flow cytometry work published for Penstemon
and the first phylogenetic analysis using genome size for Penstemon. Although not all species
were tested, approximately 40% of this genus was analyzed. Second, the data presented here will
provide insight to Penstemon breeders about species barriers resulting from genome size,
specifically interspecific hybridization. Third, particularly for high-throughput sequencing, the
genome sizes presented here provide introductory information necessary for initiating
comparative genomic studies in Penstemon. High density genome-wide sequencing will
elucidate the mechanisms associated with the genome size plasticity we have reported in
conjunction with dramatic phenotypic variation previously reported (Cronquist et al., 1984; Nold
1999; Wolfe et al. 2006; Welsh et al., 2008). Finally, our results should assist in efforts to
remodel the genetic phylogeny of the Penstemon genus.
16
ACKNOWLEDGEMENTS
We would like to acknowledge Jaroslav Doležel, Head of the Laboratory of Molecular
Cytogenetics and Cytometry, for providing the Pisum sativum ‗Ctirad‘ seeds, Steve Caicco,
Botanist, of the U.S. Fish and Wildlife Service, Reno, Nevada, Jim Belsher-Howe, Botanist, U.S.
Forest Service for their assistance in providing P. personatus specimens for this study, and Mitch
A. Mendenhall and Bryson J. Ewell, undergraduates, Brigham Young University, for their help
in sample preparation and lab work. This research was funded in part by an Annaley Naegle
Redd Assistantship from the Brigham Young University Charles Redd Center for Western
Studies and a Brigham Young University Mentoring Environment Grant.

17
REFERENCES
Achigan-Dako, E.G., Fuchs, J., Ahanchede, A., and Blattner, F.R. 2008. Flow cytometric
analysis in Lagenaria siceraria (Cucurbitaceae) indicates correlation of genome size with
usage types and growing elevation. Plant Sys. Evo. 276(1-2): 9-19. doi: 10.1007/s00606-
008-0075-2.
Arumuganathan, K., and Earle, E.D. 1991. Estimation of nuclear DNA content of plants by flow
cytometry. Plant Mol. Biol. Rep. 9(3): 229-233. doi: 10.1007/BF02672073.
Barker, R.E., Kilgore, J.A., Cook, R.L., Garay, A.E., and Warnke, S.E. 2001. Use of flow
cytometry to determine ploidy level of ryegrass. Seed Sci. Tech. 29(2): 493-502.
Bennett, M.D., Leitch, I.J., Price, H.J., and Johnston, J.S. 2003. Comparisons with
Caenorhabditis (~100 Mb) and Drosophila (~175 Mb) using flow cytometry show
genome size in Arabidopsis to be ~157 Mb and thus ~25% larger than the Arabidopsis
genome initiative estimate of ~125 Mb. Ann. Bot. 91(5): 547-557. doi:
10.1093/aob/mcg057.
Bonos, S.A., Plumley, K.A., and Meyer, W.A. 2002. Ploidy determination in Agrostis using flow
cytometry and morphological traits. Crop Sci. 42(1): 192-196.
Clausen, J., Keck, D.D., and Hiesey, W.M. 1940. Experimental studies on the nature of species.
Carnegie Institution of Washington, Washington, D.C.
Cramer, C.S. 1999. Laboratory techniques for determining ploidy in plants. HortTechnology.
9(4): 594-596.
18
Cronquist, A., Holmgren, A.H., Holmgren, N.H., Reveal, J.L., and Holmgren, P.K. 1984.
Intermountain flora: vascular plants of the Intermountain West, U.S.A. The New York
Botanical Garden, Bronx, N.Y.
Crosswhite, F.S., and Kawano, S. 1965. Chromosome numbers in Penstemon (Scrophulariaceae)
I: new mitotic counts. Rhodora. 67: 187-190.
Darlington, C.D., and Ammal, E.K.J. 1945. Chromosome atlas of cultivated plants. George Allen
and Unwin Ltd., London, Engl.
Doležel, J. 2009. Determination of nuclear genome size [online]. Available from
http://olomouc.ueb.cas.cz/book/determination-nuclear-genome-size [accessed 24
December 2009].
Dewitte, A., Leus, L., Eeckhaut, T., Vanstechelman, I., Huylenbroeck, J.V., and Bockstaele, E.V.
2009. Genome size variation in Begonia. Genome. 52: 829-838. doi: 10.1139/G09-056.
Doležel, J., Greilhuber, J., Lucretti, S., Meister, A., Lysák, M.A., Nardi, L., and Obermayer, R.
1998. Plant genome size estimation by flow cytometry: inter-laboratory comparison.
Ann. Bot. 82(Supplement A): 17-26.
Doležel, J., Bartoš, J., Voglmayr, H., and Greilhuber, J. 2003. Nuclear DNA content and genome
size of trout and human. Cytometry Part A. 51A(2): 127-128. doi: 10.1002/cyto.a.10013.
Farnham, M.W., Caniglia, E.J., and Thomas, C.E. 1998. Efficient ploidy determination of anther-
derived broccoli. HortScience. 33(2): 323-327.
19
Freeman, C.C. 1983. Chromosome numbers in Great Plains species of Penstemon
(Scrophulariaceae). Brittonia. 35(2): 232-238.
Galbraith, D.W., Harkins, K.R., Maddox, J.M., Ayres, N.M., Sharma, D.P., and Firoozabady, E.
1983. Rapid flow cytometric analysis of the cell cycle in intact plant tissues. Science.
220(4601): 1049-1051.
Gregory, T.R. 2005. Genome size evolution in animals. In The evolution of the genome. Edited
by T.R. Gregory. Elsevier Academic Press, Burlington, Mass. pp. 3-87.
Greilhuber, J., Temsch, E.M., and Loureiro, J.C. M. 2007. Nuclear DNA content measurements.
In Flow cytometry with plant cells: analysis of genes, chromosomes and genomes. Edited
by J. Doležel, J. Greilhuber, J. Suda. Wiley-VCH Verlag GmbH and Co. KGaA,
Weinheim, Ger. pp. 67-101.
Grotkopp, E., Rejmánek, M., Sanderson, J.M., and Rost, L.T. 2004. Evolution of genome size in
pines (Pinus) and its life-history correlates: supertree analyses. Evolution. 58(8): 1705-
1729. doi: 10.1554/03-545.
Kankanpää, J., Mannonen, L., and Schulman, A.H. 1996. The genome sizes of Hordeum species
show considerable variation. Genome. 39(4): 730-735.
Katsiotis, A., and Forsberg R.A. 1995. Discovery of 2n gametes in tetraploid oat Avena
vaviloviana. Euphytica 81(1): 1-6. doi: 10.1007/BF00022452
Keck, D.D. 1932. Studies in Penstemon: a systematic treatment of the section Saccanthera.
Univ. Cal. Pub. Bot. 16(11): 367-426.

20
Keck, D.D. 1936. Studies in Penstemon. III. The section Cryptostemon. Madroño. 3: 248-250.
Keck, D.D. 1945. Studies in Penstemon. VIII. A cyto-taxonomic account of the section
Spermunculus. Amer. Mid. Natur. 33(1): 128-206.
Kramer, A.T., and Frant, J.B. 2007. Isolation and characterization of microsatellite loci in
Penstemon rostriflorus (Plantaginaceae) and cross-species amplification. Mol. Ecol.
Notes. 7(6): 998-1001. doi: 10.1111/j.1471-8286.2007.01754.x.
Levin, D.A. 2000. The origin, expansion, and demise of plant species. Oxford University Press,
Inc., New York, N.Y.
Lindgren, D.T. 2000. Breeding Penstemon. In Breeding ornamental plants. Edited by D.J.
Callaway, M.B. Callaway. Timber Press Inc., Portland, Oreg. pp. 196-212.
Lindgren, D.T., and Schaaf, D.M. 2007. Penstemon: a summary of interspecific crosses.
HortScience. 42(3): 494-498.
Lindgren, D., and Wilde, E. 2003. Growing Penstemons: species, cultivars and hybrids. Infinity
Publishing, Harverford, Penn.
Lodewick, R., and Lodewick, K. 1999. Key to the genus Penstemon and its related genera in the
tribe Cheloneae (Scrophulariaceae). 10th
Ave. Press, Eugene, Oreg.
Löve, Á., and Löve, D. 1982. IOPB chromosome number reports LXXV. Taxon. 31(2): 344-360.
Lysák, M.A., Doleželová, M., Horry, J.P., Swennen, R., and Doležel, J. 1999. Flow cytometric
analysis of nuclear DNA content in Musa. Theor. Appl. Genet. 98(9): 1344-1350. doi:
10.1007/s001220051201.

21
Nisbet, G.T., and Jackson, R.C. 1960. The genus Penstemon in New Mexico. Univ. Kansas Sci.
Bull. 41(5): 691-759.
Nold, R. 1999. Penstemons. Timber Press Inc., Portland, Oreg.
Pennell, F.W. 1935. Penstemon. Academy of Natural Sciences of Philadelphia, Philadelphia,
Penn. pp. 196-273.
Ramsey, J., and Schemske, D.W. 1998. Pathways, mechanisms, and rates of polyploid formation
in flowing plants. Annu. Rev. Eco. Syst. 29: 467-501. doi:
10.1146/annurev.ecolsys.29.1.467.
Ricroch, A., Yockteng, R., Brown, S.C., and Nadot, S. 2008. Evolution of genome size across
some cultivated Allium species. Genome. 48(3): 511-520. doi: 10.1139/G05-017.
Smith, E.B. 1964. Chromosome numbers of Kansas flowering plants. I. Tran. Kansas Acad. Sci.
67(4): 818-819.
Straw, R.M. 1955. Hybridization, homogamy, and sympatric speciation. Evolution. 9(4): 441-
444.
Suda, J., Kron, P., Husband, B.C., and Trávníček, P. 2007. Flow cytometry and ploidy:
application in Plant Systematics, Ecology and Evolutionary Biology. In Flow cytometry
with plant cells: analysis of genes, chromosomes and genomes. Edited by J. Doležel, J.
Greilhuber, J. Suda. Wiley-VCH Verlag GmbH and Co. KGaA, Weinheim, Ger. pp. 113-
130.

22
Swaminathan, K., Varala, K., and Hudson, M. 2007. Global repeat discovery and estimation of
genomic copy number in a large, complex genome using a high-throughput 454 sequence
survey. BMC Genomics. 8(1): 132. doi:10.1186/1471-2164-8-132.
Taylor, R.L., and Brockman, R.P. 1966. Chromosome numbers of some western Canadian
plants. Can. J. Bot. 44(8): 1093-1103. doi:10.1139/b66-117.
Welsh, S.L., Atwood, N.D., Goodrich, S., and Higgins, L.C. 2008. A Utah flora, 4th
edn.
Brigham Young University, Provo, Utah.
Winge, Ö. 1925. Contributions to the knowledge of chromosome numbers in plants. Cellule. 35:
303-324.
Wolfe, A.D., Xiang, Q.Y., and Kephart, S.R. 1998a. Assessing hybridization in natural
populations of Penstemon (Scrophulariaceae) using hypervariable intersimple sequence
repeat (ISSR) bands. Mol. Eco. 7(9): 1107-1125.
Wolfe, A.D., Xiang, Q.Y., and Kephart, S.R. 1998b. Diploid hybrid speciation in Penstemon
(Scrophulariaceae). Proc. Natl. Acad. Sci. USA. 95(9): 5112-5115.
Wolfe, A.D., Datwyler, S.L., and Randle, C.P. 2002. A phylogenetic and biogeographic analysis
of the Cheloneae (Scrophulariaceae) based on ITS and matK sequence data. Syst. Bot.
27(1): 138-148.
Wolfe, A.D., Randle, C.P., Datwyler, S.L., Morawetz, J.J., Arguedas, N., and Diaz, J. 2006.
Phylogeny, taxonomic affinities, and biogeography of Penstemon (Plantaginaceae) based
on ITS and cpDNA sequence data. Amer. J. Bot. 93(11): 1699-1713.

23
Zoldo, V., Pape, D., Brown, S. C., Panaud, O., and Siljak-Yakovlev, S. 1998. Genome size and
base composition of seven Quercus species: inter- and intra-population variation.
Genome. 41(2): 162-168. doi:10.1139/gen-41-2-162.

24
CHAPTER 2: LITERATURE REVIEW

25
INTRODUCTION
Water shortages are a growing problem in the southwestern regions of the United States,
and there are growing concerns over water availability. For example, drought has depleted Lake
Mead‘s reserve. This reservoir collects and stores the Colorado River runoff above
approximately Las Vegas, NV and is referred to as the ―life‘s blood of today‘s modern southwest
society and economy‖ (Barnett and Pierce 2008). It‘s estimated that over the past decade this
reservoir has dropped over 100 feet. If the water outflow continues to exceed the inflow, the lake
will eventually run dry. Barnett and Pierce (2008) estimated a 50% chance that the lake will be
dry by the year 2021, and that the Colorado River is likely to drop 10-30% over the next 30-50
years if climatic conditions remain unchanged. Seven southwestern states rely on the Colorado
River as a source for water. As less runoff water is collected water restrictions will continue to
increase annually. Government officials have already taken some action to reduce water usage.
In response to the increased governmental pressures, San Diego County California farmers cut
water usage by 30% in response to severe drought conditions in January 2008. In the non-
commercial sector, approximately 60% of residential water use in San Diego County is used
outdoors (Liarakos and Balben 2007).
The rugged landscape of the Intermountain West has extreme temperature swings with
most of the environment being harsh and arid. Despite these conditions, thousands of species
fully utilize their limited resources and even thrive (Cronquist et al. 1984). Utah alone is home to
more than 2,700 species (Welsh et al. 2008). This rich diversity of flora remains largely untapped
for new sources of environmentally resilient, drought-tolerant plant material. A straightforward
way to increase water efficiency is to select plants that require less water and are better adapted
to arid conditions (Helmle 2005). In response to a growing demand for environmentally
26
sustainable landscaping, Monrovia, one of the largest nurseries in the US, increased their
percentage of hardy, drought-tolerant plants they carry. As per their 2008 online catalog, 21% of
their newly-introduced stock was rated for low-water landscaping use. In 2009, that number rose
to 26% (http://monrovia.com). The Intermountain West would be an invaluable resource for
sustainable landscape plant material. Penstemon is a particularly interesting genus of the region,
because of their conspicuous beauty and durability.
Penstemon Mitchell (Plantaginaceae) is the largest endemic genus to North America.
There are over 270 species, of which, over 70 are indigenous to Utah (Wolfe et al. 2006). It is
often found growing in coarse, well-drained soils along road cuts and cliff sides. Many species
are short-lived, herbaceous perennials which thrive in sunny, low-water areas while others live in
wet, humid climates and can easily live for over a decade (Nold 1999). Some species are upright
in habit while others are prostrate. They also differ in flower color, flower size, and bloom time.
Many species would serve well in various landscape situations. These numerous morphological
differences wrought through rapid speciation are thought to have resulted from the selection
pressures of pollinators (Wolfe et al. 2006; Pennell 1935; Levin 2000; Wolfe et al. 2002).
In order to breed Penstemon it is critical to understand as much as possible about the
genetics of this genus. This literature review is focused on what is known about Penstemon
genetics and what additional studies are needed to facilitate further cultivar development with
adaptability for the arid Intermountain West urban landscapes.
Penstemon taxonomy
The taxonomy of Penstemon has undergone many name revisions for a number of species
(bracketed names in Table 1). Most taxonomists currently separate the genus into 6 subgenera,
27
13 sections, and 22 subsections (Lindgren and Wilde 2003). Much of the taxonomic criteria used
for classification center around anther dehiscence patterns (Cronquist et al. 1984; Welsh et al.
2008). Penstemon is commonly referred to as beardtongue because of a distinguishing sterile
stamen referred to as a staminode. These highly variable structures are also used for
identification. Staminodes vary from glabrous to pubescent and exserted to inserted from the
corolla (Holmgren 2010).
Although naturally aesthetically appealing, Penstemon are not without horticultural
problems; many species have short blooming periods (American Penstemon Society 2010), small
flowers, pest and disease susceptibility, and are short-lived (Nold 1999). Nevertheless, because
of the rich diversity in this genus, breeding for horticulturally pleasing characteristics is very
realistic.
A few groups have developed Penstemon breeding programs (Lindgren and Wilde 2003).
England and France were frontrunners in some of the first Penstemon breeding during the mid-
1800s. Much of this early work utilized only a few species: P. gentianoides, P. hartwegii, P.
campanulatus, P. kunthii, P. rotundifolius, and later P. cobaea. Although incomplete, this list
still provides a large portion of the species utilized. Breeding goals were aimed to domesticate
the wild species for bedding plant use. While focusing on developing larger flowers with novel
colors (Way and James 1998), traits of drought tolerance, disease resistance, and winter
hardiness were neglected. Lindgren and Schaaf (2007) shared some of the same objectives as the
work in Europe but emphasized cold tolerance and low maintenance, while they utilized a
different palate of Penstemon species. Their main research goal was to produce potentially new
ornamental plants through interspecific crossing. Bruce Meyers‘ work with crossing Penstemon
from Mexico and species from the more northern temperate areas of North America, emphasized

28
increasing blooming time. Although many of these breeding programs produced quality,
landscape-suitable plants, all of these programs were limited in the knowledge of Penstemon
genetics. Few genetic studies have been performed on Penstemon. Understanding genetics can
greatly aid in breeding programs and producing superior crops.
Marker development and phylogenetic studies in Penstemon
The development of molecular markers in the last 30 years to facilitate plant breeding has
dramatically altered our ability to quickly develop improved cultivars (Eathington et al. 2007;
Osborn et al. 2007). Some of the first genetic research of Penstemon used inter-simple sequence
repeats (ISSRs). Datwyler and Wolfe (2004) studied the phylogenetic relationship of two
populations of Penstemon subgenus Dasanthera located in the Rocky Mountains of North
America. They used 5 ISSR primers that amplified 131 bands. This data was then used to create
a phylogenetic tree. Their data indicated that both populations originated from the northern
Rocky Mountains.
In addition to the genetic evolutionary study of Dasanthera, Wolfe et al. (1998) studied
two species hypothesized to be a result of natural hybridization based on morphological data: P.
spectabilis, which was thought to be a hybrid of P. centranthifolius and P. grinnellii, and P.
clevelandii, which was thought to be a hybrid of P. centranthifolius and P. spectabilis (Straw
1955; Straw 1956a; Straw 1956b). They used eight anchored dinucleotide primers that produced
270 bands. From the banding patterns they found that P. spectabilis was not a result of hybrid
speciation as it lacked the banding patterns that matched both putative parental species. They did,
however, find that P. spectabilis shared a few bands with P. centranthifolius. This suggests that
this species descended from a common ancestor of P. centranthifolius. Evidence was found to
29
support P. clevelandii as a diploid hybrid speciation event as it shared banding patterns from
both putative parental species.
In 2006, Wolfe et al. reported on the largest DNA based phylogenetic study of
Penstemon. Their study used ITS and cpDNA sequences from 163 Penstemon species and were
able to construct the most comprehensive Penstemon phylogenetic tree. They concluded that the
taxonomy would need further modifications to reflect the phylogenetic relationships among
those species. To facilitate these proposed studies additional DNA based molecular markers and
additional funding would be required. Kramer and Fant (2007) developed the first microsatellite
(simple sequence repeat [SSR]) markers for Penstemon. Their work resulted in eight novel
primers designed from P. rostriflorus, all of which worked on the 40 other Penstemon species
tested. To date, neither the use of these SSR markers nor the development of additional markers
has been reported for this genus.
Ploidy in Penstemon
In addition to developing and utilizing molecular markers, knowing and manipulating the
ploidy of a species being developed for cultivation is potentially very valuable. Often higher
ploidy plants are morphologically larger than diploid plants. Thicker and/or larger leaves,
thickened stems, and enlarged petals are characteristic of polyploids (Cramer 1999).
Furthermore, polyploids have been noted to alter flower timing, increase flower size, generate
deeper leaf colors, and produce stronger (shorter) stems compared to their diploid progenitors
(Udall and Wendel 2006; Dhooghe et al. 2009). In Rosa the tetraploid internodes were found to
be longer, leaves larger, and flowers contained double the petals when compared to diploid
(Kermani et al. 2003). All of the above listed characteristics are sought after in markets of

30
horticulturally acceptable cultivars. Finally, triploids are often noted for being sterile with longer
bloom times. Sterility would also avoid potential weediness, which is a problem with some
Penstemon species. Thus knowing the ploidy of the varying species of Penstemon becomes a
valuable tool for breeding cultivars within this genus.
Contrary to the paucity in Penstemon molecular studies, chromosome counts have been
reported for approximately 40% of the genus (Freeman 1983). The earliest cytological work for
this genus was performed in 1925 by Winge. In his study, he found that seven of the eight
Penstemon species had a chromosome count of n = 8. The unique species, P. digitalis, was found
to be a dodecaploid (n = 48). Clausen, Keck and Hiesey (1940) reported chromosomal counts for
over 30 species. Keck (1945) obtained counts from root tips, ovary walls, ovules, corolla tissue,
and pollen divisions and confirmed the base number for Penstemon as x = 8. This appears to be
the first study to indicate the types of tissues used for chromosome counts. Crosswhite and
Kawano (1965) used only root tips in obtain chromosome counts in 12 additional species.
Freeman (1983) also utilized root tips and reported counts on seven more species. Although
chromosome counts have been collected for nearly half of the Penstemon species, no work has
been published to date on a systematic chromosome numbering scheme for this genus.
Many Penstemon species are diploid and have a chromosome count of 16 (2n = 16). In
addition to P. digitalis there are several other known polyploids. Others include P. azureus (2n =
16; 2n = 32) (Darlington and Ammal 1945), P. venustus (2n = 32) (Darlington and Ammal
1945), P. euglaucus (2n = 24) (Clausen et al. 1940; Keck 1945), and P. tubaeflorus (2n = 32)
(Crosswhite and Kawano 1965; Freeman 1983). Only species belonging to the subgenera
Penstemon and Dasanthera are known to have species of higher ploidy levels.
31
Karyotyping involves arresting root tip cells in metaphase, completely digesting the cell
wall and cell components, fixing the protoplasts containing chromosomes onto a glass slide, and
staining the genetic material with a fluorescent stain (Singh 2003). Chromosomes are then
counted and ploidy determined (Hadlaczky et al. 1983). This current karyological assay is
tedious and time consuming; however, it still stands as a standard test for ploidy determination.
Although cytological work has made some chromosome counts available in Penstemon it
does not directly address a fundamental genetic questions: the amount of nucleic acid content
(Gregory 2005). No study to date has attempted to measure DNA content in Penstemon. Such
preliminary information is critical when selecting species for genetic sequencing (Evans and
Gundersen-Rindal 2003). Furthermore, understanding genome size is extremely valuable in
determining possibilities and limitations associated with interspecific hybridization (Van Laere et
al. 2009). This will aid in utilizing the wide variety of genetics present in the more than 270
species within the Penstemon genus. Measuring DNA content is often accomplished using flow
cytometry.
Flow cytometry
The measurement of cells and cellular components, including nucleic acid content, using
fluorescent dyes, is termed cytometry (Greilhuber et al. 2007). Flow cytometers contain three
main components: fluidics, optics, and electronic systems. The fluidics system introduces the
sample into the machine. The sample particles are funneled into the flow chamber where they are
separated and aligned into a single-file stream. The fluorescently-stained particles individually
pass through an interrogation point where one or more lasers excite the fluorescent dye attached
to particles (nucleic acid). Passage through the flow chamber is carefully controlled by a motor-

32
powered syringe allowing the sample volume to be accurately measured and cell concentration to
be calculated (Robinson and Grégori 2007).
A series of dichroic mirrors reflect the laser beams and act as filters to sort the emitted,
scattered light to photodetectors. These detectors absorb photons and emit electrons. This
currency is then converted to a digital signal used to create a computer output. Flow cytometers
measure and calculate the forward scatter which estimates the particles‘ size, and the side scatter
which estimate the particles‘ complexity (Robinson and Grégori 2007). These measurements
produce a histogram of the sample and many additional values can be calculated (e.g. nucleus
size and DNA content.)
Development of flow cytometry: Today‘s flow cytometers are a result of many years of
innovation. Over the last 50 years, scientists developed assays that could measure and estimate
the nuclear content of cells. This research was initially advanced to provide a method for rapid
measurement of malignant cells. Mellors and Silver (1951) proposed the first automatic scanning
instrument that could test for potential tumor cells by rapidly screening cervical samples for
abnormal levels of DNA. These machines functioned on the principles of florescent
measurement rather than light absorption. Such technology was previously applied in
determining the ploidy of plant tissue. Swift (1950) found that haploid, diploid, and tetraploid
plant cells had a DNA content ratio of 1:2:4, respectfully. From these finding, he was first to coin
the term ―C-value‖ which is the haploid DNA content within a cell.
With the development of lasers and computers, came the invention of flow cytometers.
The first optical system using water-cooled ion lasers to scan sample particles were bulky
machines that took up 60 to 80 square feet. With the invention of solid-state lasers came smaller

33
―bench-top‖ analyzers. These innovations allowed flow cytometers to be more accessible and
common in laboratories (Robinson and Grégori 2007).
Sample preparation: Plant tissue must be properly prepared for accurate flow readings.
There are several materials and methods that have been developed for plant cytometric work but
they all follow a similar pattern of events. The initial steps for plant tissue preparation include
lysing plant cells for nucleus extraction, filtering cell debris while collecting nuclei in a lysis
buffer and staining nuclei with a fluorescent dye. The lysis buffer aids in preventing nucleus and
nucleic acid degradation and removing cellular debris (Loureiro et al. 2007). Often cells are
lysed by using a sharp razorblade. Prior to this method, cellulase was tediously added to the
sample to depolymerize plant cell walls; this was not efficient and had low nucleus yields.
Alternatively to razorblades, Roberts (2007) developed an effective method of coalescing glass
(2.5 or 1.0 mm diameter) or zirconia/silica (2.5 mm diameter) with the tissue sample and
mechanically shaking sample tubes for about 45 seconds. The glass beads bombard the cell walls
and create wounds that allow for nuclei release. The nuclei are then stained and processed
through the flow cytometer.
Secondary metabolites interfere with flow cytometry: Lysing plant cells results in
abundant plant debris in every sample. Flow cytometry samples are never completely purified
and often contain secondary metabolites. Secondary metabolites, especially those of phenolic
nature, can interfere with nuclear fluorescence. This occurs as minor particles aggregate around
the nucleus and increase nuclear fluorescence. Flow cytometry histogram peaks will therefore
overestimate nuclear size (Noirot et al. 2000). Tannic acid is a common, problematic phenolic
compound in flow analysis that creates a false peak that appears in the histogram and shifts the
position of the nuclear peaks (Loureiro et al. 2006). They termed this the ―tannic acid effect.‖

34
Despite some of the challenges presented by the interaction of secondary metabolites on cellular
nuclei, flow cytometry is a useful and efficient assay that can be utilized in plant breeding.
Cell division: Cells have many regulatory phages that control cell division. Gap 1 (G1
phase) contains cells that underwent mitosis, but have not begun DNA synthesis (S phase). These
cells contain one copy of each chromosome that is comprised of one chromatid. Before mitosis
occurs, DNA must replicate; this occurs during the S phase. After the cells have completely
copied each chromatid (forming two sister chromatids), they enter the Gap 2 (G2 phase) until
cellular division occurs.
The cycle of cell division creates differential amounts of DNA. Cells in the G1 phase
contain half of the DNA content of cells in the G2 phase. And cells undergoing S phase contain a
range of DNA depending on how long a cell is in S phase (Swift 1950). These phases are easily
measured and the percentage of cells within each stage can be calculated using flow cytometry.
With this amount of accuracy and sensitivity, flow cytometry is often utilized in genome size
estimation (Dewitte et al. 2009; Zoldo et al. 1998; Garcia et al. 2006). This allows for 1) analyses
of polyploids both within and among species and 2) the utilization of genome size in
phylogenetic research.
Polyploidization is extremely common within the plant kingdom, and it is thought that
nearly every plant has had some genome duplications within its evolutionary history (Cui et al.
2006; Masterson 1994; Wood et al. 2009; Adams and Wendel 2005). Cell division sometimes
fails to properly separate chromosomes during anaphase. This either results in unreduced
gametes or an unequal number of chromosomes in the resulting daughter cells (Comai 2005).
Flow cytometry is an efficient method to screen for aneuploidy and polyploidy (Barker et al.
2001).

35
DNA content has also been utilized to develop phylogenetic trees. Ricroch et al. (2008)
utilized DNA content to determine how genome size changed in 30 Allium and Allium-related
species over evolutionary time. They used this data in conjunction with the ITS (internal
transcribed spacer) sequences of 30 species and constructed a phylogenetic tree. With this
information they determined that the genome size was decreasing over time as many of the older
species contained larger DNA quantities. Chrtek et al. (2009) compared the DNA content of
Hieracium (Asteraceae) that was geographically isolated to the western or eastern European
regions. They found genome size correlated significantly with phylogeny but failed to correlate
with altitude, latitude or climate conditions. Hieracium species located in the western regions
had significantly lower genome size variation than species within the eastern regions. They
concluded that Hieracium subgenus Hieracium contained two chief phylogenetic clades.
CONCLUSION
We believe that understanding fundamental genetic questions such as genome size within
the genus will interest breeders, geneticists, phylogeneticists and conservationists. This data will
be particularly useful in future genetic sequencing work. High-throughput sequencing is
expensive and selecting a genome-size appropriate species is a key step to minimizing expenses
and collecting the most useful data. The numerous species within the genus and the broad range
of genome sizes will aid in the phylogenetic research as construction of the evolutionary history
of this genus continues. Conservationists can corroborate this information with threatened
populations to determine if speciation is occurring in an isolated population. The fantastic floral
displays, the broad and various phenotypic characteristics, and durability of Penstemon
demonstrate that this genus has great potential for future commercialization. Future breeding

36
programs will be able to use genome size and ploidy data when selecting species that will illicit
sterility or fertility. Understanding this large genus will elucidate new biological mechanisms of
speciation and provide new insight into evolutionary processes.
37
REFERENCES
Adams, K.L., and Wendel, J.F. 2005. Polyploidy and genome evolution in plants. Current
Opinion in Plant Biology. 8: 135-141. doi: 10.1016/j.jbi.2005.01.001.
American Penstemon Society. 2010. Species identification [online]. Available from
http://apsdev.org/identification/descriptions.php [accessed 13 February 2010].
Barker, R.E., Kilgore, J.A., Cook, R.L., Garay, A.E., and Warnke, S.E. 2001. Use of flow
cytometry to determine ploidy level of ryegrass. Seed Sci. Tech. 29(2): 493-502.
Barnett, T.P., and Pierce, D.W. 2008. When will Lake Mead go dry? Water Resour. Res. 44:
W03201. doi: 10.1029/2007WR006704.
Chrtek, J., Zahradnícek, J., Krak, K., and Fehrer, J. 2009. Genome size in Hieracium subgenus
Hieracium (Asteraceae) is strongly correlated with major phylogenetic groups. Ann. Bot.
104(1): 161-178. doi:10.1093/aob/mcp107.
Clausen, J., Keck, D.D., and Hiesey, W.M. 1940. Experimental studies on the nature of species.
Carnegie Institution of Washington, Washington, D.C.
Comai, L. 2005. The advantages and disadvantages of being polyploid. Nature. 6: 836-846.
Cramer, C.S. 1999. Laboratory techniques for determining ploidy in plants. HortTechnology.
9(4): 594-596.
Cronquist, A., Holmgren, A.H., Holmgren, N.H., Reveal, J.L., and Holmgren, P.K. 1984.
Intermountain flora: vascular plants of the Intermountain West, U.S.A. The New York
Botanical Garden, Bronx, N.Y.
38
Crosswhite, F.S., and Kawano, S. 1965. Chromosome numbers in Penstemon (Scrophulariaceae)
I: new mitotic counts. Rhodora. 67: 187-190.
Cui, L., Wall, P.K., Leebens-Mack, J.H., G., L.B., Soltis, D.E., Doyle, J.J., Soltis, P.S., Carlson,
J.E., Arumuganathan, K., Barakat, A., Albert, V. A., Ma, H., and dePamphilis, C. W.
2006. Widespread genome duplications throughout the history of flowering plants.
Genome Res. 16(6): 738-7349.
Darlington, C.D., and Ammal, E.K. J. 1945. Chromosome atlas of cultivated plants. George
Allen and Unwin Ltd., London, Engl.
Datwyler, S.L., and Wolfe, A.D. 2004. Phylogenetic relationships and morphological evolution
in Penstemon subg. Dasanthera (Veronicaceae). Sys. Bot. 29: 165-176.
Dewitte, A., Leus, L., Eeckhaut, T., Vanstechelman, I., Huylenbroeck, J.V., and Bockstaele, E.V.
2009. Genome size variation in Begonia. Genome. 52: 829-838. doi: 10.1139/G09-056.
Dhooghe, E., Denis, S., Eeckhaut, T., Reheul, D., and Labeke, M.-C.V. 2009. In vitro induction
of tetraploids in ornamental Ranunculus. Euphytica. 168(1): 33-40. doi: 10.1007/s10681-
008-9876-1.
Eathington, S.R., Crosbie, T.M., Edwards, M.D., Reiter, R.S., and Bull, J.K. 2007. Molecular
markers in a commercial breeding program. Crop Sci. 47(S3): S154-S163. doi:
10.2135/cropsci2007.04.0015IPBS.
Evans, J.D., and Gundersen-Rindal, D. 2003. Beenomes to Bombyx: future directions in applied
insect genomics. Genome Biology. 4(3): 107.

39
Freeman, C.C. 1983. Chromosome numbers in Great Plains species of Penstemon
(Scrophulariaceae). Brittonia. 35(2): 232-238.
Garcia, S., Garnatje, T., Twibell, J.D., and Vallès, J. 2006. Genome size variation in the
Artemisia arborescens complex (Asteraceae, Anthemideae) and its cultivars. Genome.
49: 244-253. doi:10.1139/G05-105.
Gregory, T.R. 2005. Genome size evolution in animals. In The evolution of the genome. Edited
by T.R. Gregory. Elsevier Academic Press, Burlington, Mass. pp. 3-87.
Greilhuber, J., Temsch, E.M., and Loureiro, J.C. M. 2007. Nuclear DNA content measurements.
In Flow cytometry with plant cells: analysis of genes, chromosomes and genomes. Edited
by J. Doležel, J. Greilhuber, J. Suda. Wiley-VCH Verlag GmbH and Co. KGaA,
Weinheim, Ger. pp. 67-101.
Hadlaczky, G., Bisztray, G., Praznovszky, T., and Dudits, D. 1983. Mass isolation of plant
chromosomes and nuclei. Planta. 157: 278-285.
Helmle, S.F. 2005. Water conservation planning: developing a strategic plan for socially
acceptable demand control programs. Master's Thesis, Political Science Department,
Texas State University. Texas State University, Round Rock.
Holmgren, N. 2010. Keys, viewed 6 January 2010,
http://apsdev.org/library/references/revised_penstemon_keys.pdf.
Keck, D.D. 1945. Studies in Penstemon. VIII. A cyto-taxonomic account of the section
Spermunculus. Amer. Mid. Natur. 33(1): 128-206.

40
Kermani, M.J., Sarasan, V., Roberts, A.V., Yokoya, K., Wentworth, J., and Sieber, V.K. 2003.
Oryzalin-induced chromosome doubling in Rosa and its effect on plant morphology and
pollen viability. Theoretial and Applied Genetics. 107(7): 1195-1200. doi:
10.1007/s00122-003-1374-1.
Kramer, A.T., and Frant, J.B. 2007. Isolation and characterization of microsatellite loci in
Penstemon rostriflorus (Plantaginaceae) and cross-species amplification. Mol. Ecol.
Notes. 7(6): 998-1001. doi: 10.1111/j.1471-8286.2007.01754.x.
Liarakos, J., and Balben, C. 2007. Water authority announces '20-Gallon Challenge' for
voluntary water conservation [online]. Available from
http://www.sdcwa.org/news/2007_0728_20GallonChallenge.phtml [accessed 13
February 2010].
Levin, D.A. 2000. The origin, expansion, and demise of plant species. Oxford University Press,
Inc., New York, N.Y.
Lindgren, D.T., and Schaaf, D.M. 2007. Penstemon: a summary of interspecific crosses.
HortScience. 42(3): 494-498.
Lindgren, D., and Wilde, E. 2003. Growing Penstemons: species, cultivars and hybrids. Infinity
Publishing, Harverford, Penn.
Loureiro, J., Rodriguez, E., Doležel, J., and Santos, C. 2006. Flow cytometric and microscopic
analysis of the effect of tannic acid on plant nuclei and estimation of DNA content. Ann.
Bot. 98: 515-527.
41
Loureiro, J., Rodriguez, E., Doležel, J., and Santos, C. 2007. Two new nuclear isolation buffers
for plant DNA flow cytometry: a test with 37 species. Ann. Bot. 100: 875-888.
Masterson, J. 1994. Stomatal size in fossil plants—evidence for polyploidy in majority of
angiospersm. Science. 264: 1759-1763.
Mellors, R.C., and Silver, R. 1951. A microfluorometric scanner for the differential detection of
cells: application to exfoliative cytology. Science. 114: 356-360.
Nisbet, G.T., and Jackson, R.C. 1960. The genus Penstemon in New Mexico. Univ. Kansas Sci.
Bull. 41(5): 691-759.
Noirot, M., Barre, P., Louarn, J., Duperray, C., and Hamon, S. 2000. Nucleus-cytosol
interactions--a source of stoichiometric error in flow cytometric estimation of nuclear
DNA content in plants. Ann. Bot. 86: 309-316.
Nold, R. 1999. Penstemons. Timber Press Inc., Portland, Oreg.
Osborn, T.C., Kramer, C., Graham, E., and Braun, C.J. 2007. Insight and innovations from wide
crosses: examples from canola and tomato. Crop Sci. S3(47): S228-S237. doi:
10.2135/cropsci2007.04.0012IPBS.
Pennell, F.W. 1935. Penstemon. Academy of Natural Sciences of Philadelphia, Philadelphia,
Penn. pp. 196-273.
Ricroch, A., Yockteng, R., Brown, S.C., and Nadot, S. 2008. Evolution of genome size across
some cultivated Allium species. Genome. 48(3): 511-520. doi: 10.1139/G05-017.

42
Roberts, A.V. 2007. The use of bead beating to prepare suspensions of nuclei for flow cytometry
from fresh leaves, herbarium leaves, petals and pollen. Cytometry Part A. 71A: 1039-
1044.
Robinson, J.P., and Grégori, G. 2007. Principles of flow cytometry. In Flow cytometry with plant
cells: analysis of genes, chromosomes and genomes. Edited by J. Doležel, J. Greilhuber,
J. Suda. Wiley-VCH Verlag GmbH and Co. KGaA, Weinheim, Ger. pp. 19-40.
Singh, R.J. 2003. Plant cytogenetics, 2nd edn. CRC Press, London, Eng.
Straw, R.M. 1955. Hybridization, homogamy, and sympatric speciation. Evolution. 9(4): 441-
444.
Straw, R.M. 1956a. Adaptive morphology of the Penstemon flower. Phytomorphology. 6: 112-
119.
Straw, R.M. 1956b. Floral isolation in Penstemon. Amer. Nat. 90: 47-53.
Swift, H. 1950. The constancy of deoxyribose nucleic acid in plant nuclei. PNAS. 36: 643-654.
Udall, J.A., and Wendel, J.F. 2006. Polyploidy and crop improvement. Crop Sci. 46(S1): 3-14.
doi:10.2135/cropsci2006.07.0489tpg.
Van Laere, K., Leus, L., Van Huylenbroeck, J., and Van Bockstaele, E. 2009. Interspecific
hybridisation and genome size analysis in Buddleja. Euphytica. 166(3): 445-456. doi:
10.1007/s10681-008-9844-9.
Way, D., and James, P. 1998. The gardener's guide to growning Penstemons. Timber Press,
Portland, Oreg.

43
Welsh, S.L., Atwood, N.D., Goodrich, S., and Higgins, L.C. 2008. A Utah flora, 4th edn.
Brigham Young University, Provo, Utah.
Winge, Ö. 1925. Contributions to the knowledge of chromosome numbers in plants. Cellule. 35:
303-324.
Wolfe, A.D., Xiang, Q.Y., and Kephart, S.R. 1998. Assessing hybridization in natural
populations of Penstemon (Scrophulariaceae) using hypervariable intersimple sequence
repeat (ISSR) bands. Mol. Eco. 7(9): 1107-1125.
Wolfe, A.D., Datwyler, S.L., and Randle, C.P. 2002. A phylogenetic and biogeographic analysis
of the Cheloneae (Scrophulariaceae) based on ITS and matK sequence data. Syst. Bot.
27(1): 138-148.
Wolfe, A.D., Randle, C.P., Datwyler, S.L., Morawetz, J.J., Arguedas, N., and Diaz, J. 2006.
Phylogeny, taxonomic affinities, and biogeography of Penstemon (Plantaginaceae) based
on ITS and cpDNA sequence data. Amer. J. Bot. 93(11): 1699-1713.
Wood, T.E., Takebayashi, N., Barker, M.S., Mayrose, I., Greenspoon, P.B., and Rieseberg, L.H.
2009. The frequency of polyploid speciation in vascular plants. PNAS. 106(33): 13875-
13879. doi: 10.1073/pnas.0811575106.
Zoldo, V., Pape, D., Brown, S. C., Panaud, O., and Siljak-Yakovlev, S. 1998. Genome size and
base composition of seven Quercus species: inter- and intra-population variation.
Genome. 41(2): 162-168. doi:10.1139/gen-41-2-162.
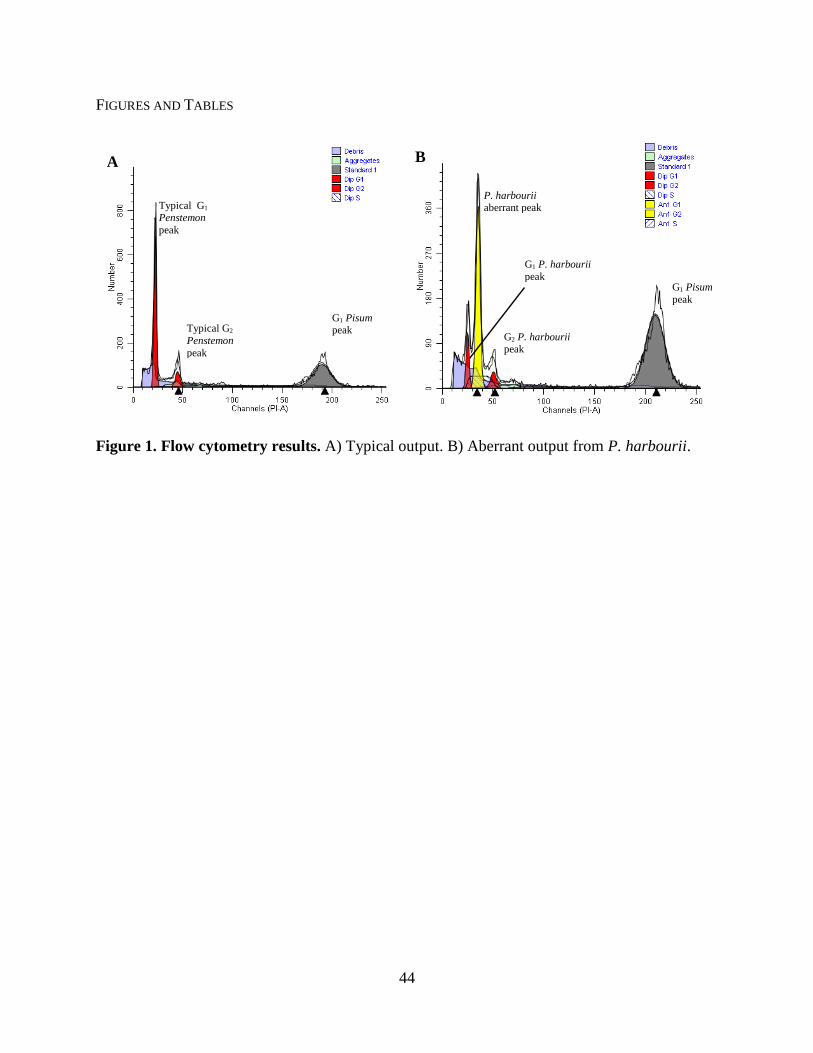
44
FIGURES AND TABLES
Figure 1. Flow cytometry results. A) Typical output. B) Aberrant output from P. harbourii.
Typical G1 Penstemon
peak
Typical G2
Penstemon
peak
G1 Pisum peak
A B
G1 Pisum
peak
P. harbourii aberrant peak
G2 P. harbourii peak
G1 P. harbourii
peak
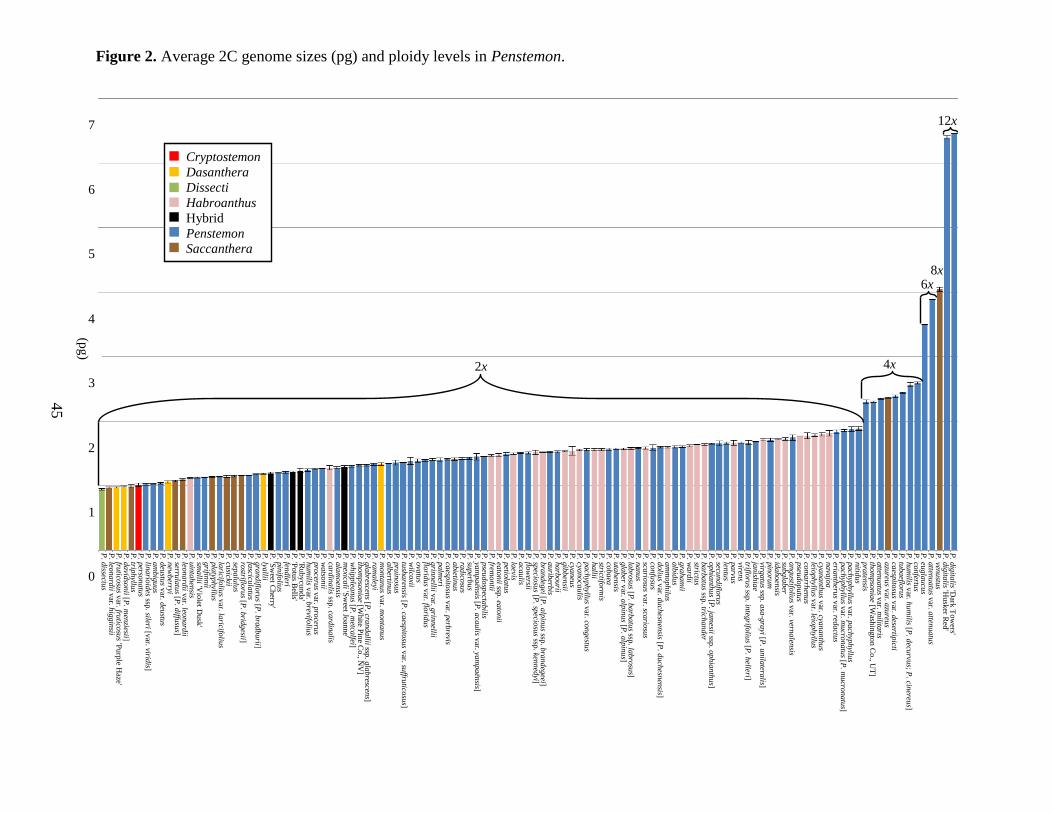
Figure 2. Average 2C genome sizes (pg) and ploidy levels in Penstemon.
45
4x
Cryptostemon
Dasanthera
Dissecti
Habroanthus
Hybrid
Penstemon
Saccanthera
2x
6x 8x
12x
P. d
igita
lis 'Dark
Tow
ers' P
. dig
italis 'H
usk
er Red
' P
. venustu
s P
. atten
uatu
s var. a
ttenuatu
s P
. eugla
ucu
s P
. confertu
s P
. hum
ilis var. h
um
ilis [P. d
ecurvu
s; P. cin
ereus]
P. tu
baeflo
rus
P. ca
espito
sus v
ar. desertip
icti P
. azu
reus v
ar. azu
reus
P. a
ttenuatu
s var. m
ilitaris
P. th
om
pso
nia
e [Wash
ingto
n C
o., U
T]
P. p
raten
sis P
. nitid
us
P. p
ach
yphyllu
s var. p
ach
yphyllu
s P
. pach
yphyllu
s var. m
ucro
natu
s [P. m
ucro
natu
s] P
. erianth
erus v
ar. redactu
s P
. nava
joa
P. cya
nanth
us v
ar. cyananth
us
P. leio
phyllu
s var. leio
phyllu
s P
. com
arrh
enus
P. p
seudoputu
s P
. angustifo
lius v
ar. vernalen
sis P
. subgla
ber
P. id
ahoen
sis P
. pin
oru
m
P. virg
atu
s ssp. a
sa-g
rayi [P
. unila
teralis]
P. ja
nish
iae
P. triflo
rus ssp
. integ
rifoliu
s [P. h
elleri] P
. virens
P. p
arvu
s P
. lentu
s P
. secundiflo
rus
P. o
phia
nth
us [P
. jam
esii ssp. o
phia
nth
us]
P. b
arb
atu
s ssp. trich
ander
P. strictu
s P
. ward
ii P
. gra
ham
ii P
. alb
idus
P. a
mm
ophilu
s P
. doliu
s var. d
uch
esnen
sis [P. d
uch
esnen
sis] P
. confu
sus
P. sca
riosu
s var. sca
riosu
s P
. nanus
P. la
bro
sus [P
. barb
atu
s ssp. la
bro
sus]
P. g
laber v
ar. alp
inus [P
. alp
inus]
P. u
tahen
sis P
. cobaea
P
. strictiform
is P
. hallii
P. p
ach
yphyllu
s var. co
ngestu
s P
. cyanoca
ulis
P. cya
neu
s P
. gib
ben
sii P
. harb
ourii
P. a
urib
erbis
P. b
randeg
ei [P. a
lpin
us ssp
. bra
ndeg
eei] P
. specio
sus [P
. specio
sus ssp
. kenned
yi] P
. flow
ersii P
. aca
ulis
P. la
evis P
. petio
latu
s P
. eato
nii ssp
. eato
nii
P. frem
ontii
P. p
seudosp
ectabilis
P. ya
mpaën
sis [P. a
caulis v
ar. yam
paën
sis] P
. superb
us
P. ra
dico
sus
P. a
bietin
us
P. ca
espito
sus v
ar. perb
revis P
. palm
eri P
. grin
nellii v
ar. grin
nellii
P. flo
ridus v
ar. florid
us
P. o
vatu
s P
. wilco
xii P
. tush
aren
sis [P. ca
espito
sus v
ar. suffru
ticosu
s] P
. pru
inosu
s P
. alb
ertinus
P. m
onta
nus v
ar. monta
nus
P. ra
maleyi
P. g
labrescen
s [P. cra
ndallii ssp
. gla
brescen
s] P
. thom
pso
nia
e [White P
ine C
o., N
V]
P. w
hip
plea
nus [P
. metca
lfei] P
. mexica
li 'Sw
eet Joan
ne'
P. a
lam
oen
sis P
. card
inalis ssp
. card
inalis
P. w
atso
nii
P. p
roceru
s var. p
roceru
s P
. hum
ilis var. b
revifoliu
s P
. 'Rubycu
nda'
P. 'P
otu
s Bells'
P. fen
dleri
P. p
inifo
lius
P. 'S
weet C
herry
' P
. lyallii
P. g
randiflo
rus [P
. bra
dburii]
P. fa
scicula
tus
P. ro
strifloru
s [P. b
ridgesii]
P. sep
alu
lus
P. cu
sickii P
. laricifo
lius v
ar. laricifo
lius
P. p
latyp
hyllu
s P
. grifin
nii
P. sm
allii 'V
iolet D
usk
' P
. uin
tahen
sis P
. leonard
ii var. leo
nard
ii P
. serrula
tus [P
. diffu
sus]
P. n
ewberryi
P. d
eustu
s var. d
eustu
s P
. am
big
uus
P. lin
ario
ides ssp
. sileri [var. virid
is] P
. perso
natu
s P
. triphyllu
s P
. david
sonii [P
. men
ziesii] P
. frutico
sus v
ar. frutico
sus 'P
urp
le Haze'
P. leo
nard
ii var. h
iggin
sii P
. dissectu
s
(pg
)
0
1
2
3
4
5
6
7
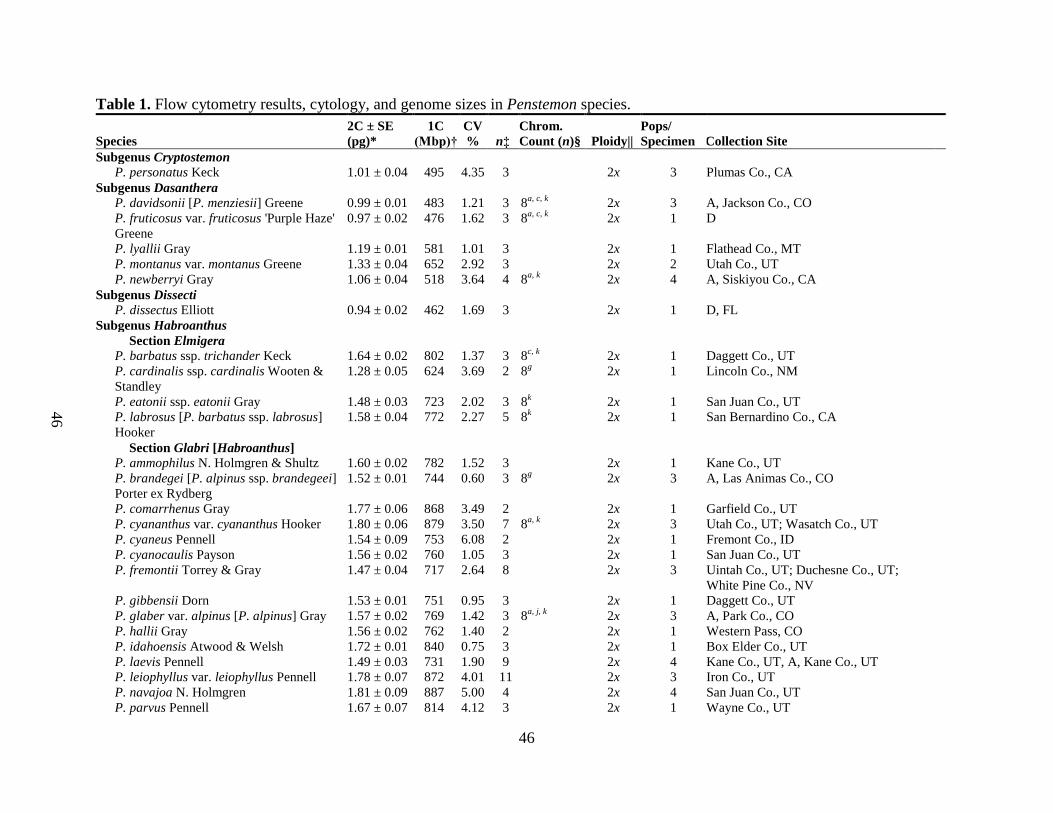
Table 1. Flow cytometry results, cytology, and genome sizes in Penstemon species.
46
46
Species
2C ± SE
(pg)*
1C
(Mbp)†
CV
% n‡
Chrom.
Count (n)§ Ploidy||
Pops/
Specimen Collection Site
Subgenus Cryptostemon
P. personatus Keck 1.01 ± 0.04 495 4.35 3 2x 3 Plumas Co., CA
Subgenus Dasanthera
P. davidsonii [P. menziesii] Greene 0.99 ± 0.01 483 1.21 3 8a, c, k
2x 3 A, Jackson Co., CO
P. fruticosus var. fruticosus 'Purple Haze'
Greene
0.97 ± 0.02 476 1.62 3 8a, c, k
2x 1 D
P. lyallii Gray 1.19 ± 0.01 581 1.01 3 2x 1 Flathead Co., MT
P. montanus var. montanus Greene 1.33 ± 0.04 652 2.92 3 2x 2 Utah Co., UT
P. newberryi Gray 1.06 ± 0.04 518 3.64 4 8a, k
2x 4 A, Siskiyou Co., CA
Subgenus Dissecti
P. dissectus Elliott 0.94 ± 0.02 462 1.69 3 2x 1 D, FL
Subgenus Habroanthus
Section Elmigera
P. barbatus ssp. trichander Keck 1.64 ± 0.02 802 1.37 3 8c, k
2x 1 Daggett Co., UT
P. cardinalis ssp. cardinalis Wooten &
Standley
1.28 ± 0.05 624 3.69 2 8g 2x 1 Lincoln Co., NM
P. eatonii ssp. eatonii Gray 1.48 ± 0.03 723 2.02 3 8k 2x 1 San Juan Co., UT
P. labrosus [P. barbatus ssp. labrosus]
Hooker
1.58 ± 0.04 772 2.27 5 8k 2x 1 San Bernardino Co., CA
Section Glabri [Habroanthus]
P. ammophilus N. Holmgren & Shultz 1.60 ± 0.02 782 1.52 3 2x 1 Kane Co., UT
P. brandegei [P. alpinus ssp. brandegeei]
Porter ex Rydberg
1.52 ± 0.01 744 0.60 3 8g 2x 3 A, Las Animas Co., CO
P. comarrhenus Gray 1.77 ± 0.06 868 3.49 2 2x 1 Garfield Co., UT
P. cyananthus var. cyananthus Hooker 1.80 ± 0.06 879 3.50 7 8a, k
2x 3 Utah Co., UT; Wasatch Co., UT
P. cyaneus Pennell 1.54 ± 0.09 753 6.08 2 2x 1 Fremont Co., ID
P. cyanocaulis Payson 1.56 ± 0.02 760 1.05 3 2x 1 San Juan Co., UT
P. fremontii Torrey & Gray 1.47 ± 0.04 717 2.64 8 2x 3 Uintah Co., UT; Duchesne Co., UT;
White Pine Co., NV
P. gibbensii Dorn 1.53 ± 0.01 751 0.95 3 2x 1 Daggett Co., UT
P. glaber var. alpinus [P. alpinus] Gray 1.57 ± 0.02 769 1.42 3 8a, j, k
2x 3 A, Park Co., CO
P. hallii Gray 1.56 ± 0.02 762 1.40 2 2x 1 Western Pass, CO
P. idahoensis Atwood & Welsh 1.72 ± 0.01 840 0.75 3 2x 1 Box Elder Co., UT
P. laevis Pennell 1.49 ± 0.03 731 1.90 9 2x 4 Kane Co., UT, A, Kane Co., UT
P. leiophyllus var. leiophyllus Pennell 1.78 ± 0.07 872 4.01 11 2x 3 Iron Co., UT
P. navajoa N. Holmgren 1.81 ± 0.09 887 5.00 4 2x 4 San Juan Co., UT
P. parvus Pennell 1.67 ± 0.07 814 4.12 3 2x 1 Wayne Co., UT

Figure 2. Average 2C genome sizes (pg) and ploidy levels in Penstemon.
47
Species
2C ± SE
(pg)*
1C
(Mbp)†
CV
% n‡
Chrom.
Count (n)§ Ploidy||
Pops/
Specimen Collection Site
P. pseudoputus N. Holmgren 1.77 864 - 1 2x 1 Garfield Co., UT
P. scariosus var. scariosus Pennell 1.59 ± 0.04 775 2.41 7 2x 1 Duchesne Co., UT
P. speciosus [P. speciosus ssp. kennedyi]
Douglas ex Lindley
1.52 ± 0.06 742 3.72 3 8a, c, k
2x 1 Owyhee Co., ID
P. strictiformis Rydberg 1.56 ± 0.03 762 2.15 3 2x 1 San Juan Co., UT
P. strictus Bentham 1.64 ± 0.03 801 1.60 22 8a, c, k
2x 7 C
P. subglaber Rydberg 1.73 ± 0.04 844 2.19 3 8a, k
2x 1 Utah Co., UT
P. uintahensis Pennell 1.12 ± 0.01 548 1.20 2 2x 2 A, Uintah Co., UT
P. virgatus ssp. asa-grayi [P. unilateralis]
Crosswhite
1.71 ± 0.04 837 2.06 4 8g 2x 1 Purchased, Rocky Mountain Rare Plants,
lot# 1591-JC
P. wardii Gray 1.62 ± 0.04 792 2.37 6 2x 2 Sevier Co., UT; Millard Co., UT
Hybrids
P. mexicali 'Sweet Joanne' 1.29 ± 0.03 633 2.32 2 2x 1 NE
P. 'Potus Bells' 1.22 ± 0.02 596 1.32 3 2x 1 D
P. 'Rubycunda' 1.24 ± 0.06 605 5.15 3 2x 1 D
P. 'Sweet Cherry' 1.19 ± 0.03 581 2.75 2 2x 1 D
Subgenus Penstemon
Section Ambigui
P. ambiguus Torrey 1.03 ± 0.01 504 0.69 2 8d, g, k
2x 1 Unknown
Section Cristati [Albidi; Aurator]
P. albidus Nuttall 1.60 ± 0.04 783 2.23 3 8d, f, k
2x 3 A, Yuma Co., CO
P. auriberbis Pennell 1.52 ± 0.01 746 0.92 3 8d, k
2x 1 Purchased, Western Native Seed,
lot#4074
P. cobaea Nuttall 1.56 ± 0.03 764 2.02 3 8d, h, k
, 32c 2x 3 B
P. dolius var. duchesnensis [P.
duchesnensis] N. Holmgren
1.60 ± 0.03 780 1.76 6 2x 1 Duchesne Co., UT
P. eriantherus var. redactus Pennell &
Keck
1.84 ± 0.05 899 2.79 3 8c 2x 1 Butte Co., ID
P. grahamii Keck ex Graham 1.60 ± 0.02 784 1.43 3 2x 1 Uintah Co., UT
P. janishiae N. Holmgren 1.68 ± 0.00 823 0.07 2 2x 1 Lassen Co., ID
P. nanus Keck 1.58 ± 0.01 774 0.55 3 2x 3 Millard Co., UT
P. ophianthus [P. jamesii ssp. ophianthus]
Pennell
1.65 ± 0.01 809 0.57 2 8k 2x 1 Purchased, Rocky Mountain Rare Plants,
lot #1278-JC
P. pinorum L. & J. Schultz 1.71 ± 0.04 837 2.57 3 2x 1 Washington Co., UT
P. triflorus ssp. integrifolius [P. helleri]
Pennell
1.67 ± 0.06 815 3.46 3 2x 1 Edward Co., TX
Section Coerulei [Anularius]

Figure 2. Average 2C genome sizes (pg) and ploidy levels in Penstemon.
48
Species
2C ± SE
(pg)*
1C
(Mbp)†
CV
% n‡
Chrom.
Count (n)§ Ploidy||
Pops/
Specimen Collection Site
P. angustifolius var. vernalensis N.
Holmgren
1.75 ± 0.07 855 4.08 3 8k 2x 1 Uintah Co., UT
P. fendleri Torrey & Gray 1.21 ± 0.02 590 1.70 3 8d, k
2x 3 C
P. flowersii Neese & Welsh 1.51 ± 0.03 738 2.20 5 2x 1 Uintah Co., UT
P. grandiflorus [P. bradburii] Nuttall 1.18 ± 0.01 576 1.12 3 8b, d, k
2x 1 Purchased, Rocky Mountain Rare Plants,
lot#2597
P. lentus Pennell 1.66 ± 0.03 811 1.61 3 2x 3 C
P. nitidus Douglas ex Bentham 1.89 ± 0.05 922 2.76 3 8d, f, i, k
2x 1 Jefferson Co. MT
P. pachyphyllus var. congestus N.
Holmgren
1.56 ± 0.03 761 1.77 3 8a, k
2x 1 Kane Co., UT
P. pachyphyllus var. mucronatus [P.
mucronatus] Neese
1.85 ± 0.03 907 1.56 3 8k 2x 1 Daggett Co., UT
P. pachyphyllus var. pachyphyllus Gray ex
Rydberg
1.87 ± 0.10 916 5.41 7 8b, k
2x 3 Uintah Co., UT; Duchesne Co., UT;
White Pine Co., NV
P. secundiflorus Bentham 1.66 ± 0.06 810 3.72 3 8a, g, k
, 16k 2x 1 Purchased, Plants of the Southwest
Section Ericopsis
Subsection Caespitosi
P. acaulis Williams 1.51 ± 0.02 736 1.06 3 2x 1 Daggett Co., UT
P. caespitosus var. desertipicti N.
Holmgren
2.38 ± 0.03 1,165 1.45 3 4x 1 Garfield Co., UT
P. caespitosus var. perbrevis N. Holmgren 1.41 ± 0.02 690 1.07 2 2x 1 Wasatch Co., UT
P. glabrescens [P. crandallii ssp.
glabrescens] Pennell
1.32 ± 0.02 645 1.47 2 8g 2x 1 Purchased, Rocky Mountain Rare Plants,
lot #1051-OT
P. ramaleyi A. Nelson 1.33 ± 0.03 651 2.30 3 2x 3 A, Saguache Co., CO
P. thompsoniae Rydberg 1.32 ± 0.02 643 1.13 3 8k 2x 1 White Pine Co., NV
P. thompsoniae Rydberg 2.30 ± 0.03 1,126 1.86 3 8k 4x 1 Washington Co., UT
P. tusharensis [P. caespitosus var.
suffruticosus] N. Holmgren
1.36 ± 0.01 667 0.56 3 2x 1 Wasatch Co., UT, Purchased, Specialty
Perennials
P. yampaënsis [P. acaulis var. yampaënsis]
Neese
1.45 ± 0.07 709 4.90 2 2x 1 Daggett Co., UT
Subsection Ericopsis
P. laricifolius var. laricifolius Hooker &
Arnold
1.14 ± 0.01 558 0.60 2 2x 1 Purchased, Rocky Mountain Rare Plants,
lot#16
Subsection Linarioides
P. linarioides ssp. sileri [var. viridis] Keck 1.02 ± 0.02 500 1.47 2 2x 1 Lincoln Co., NV
Section Fasciculus
Subsection Fasciculi

Figure 2. Average 2C genome sizes (pg) and ploidy levels in Penstemon.
49
Species
2C ± SE
(pg)*
1C
(Mbp)†
CV
% n‡
Chrom.
Count (n)§ Ploidy||
Pops/
Specimen Collection Site
P. fasciculatus Gray 1.16 ± 0.01 567 0.49 3 2x 2 NE
P. pinifolius Greene 1.19 ± 0.02 584 1.43 3 8g 2x 2 C
Section Peltanthera
Subsection Centranthifolii
P. alamoensis Pennell & Nisbet 1.28 ± 0.03 625 2.40 3 8g 2x 1 Otero Co., NM
P. confusus M. E. Jones 1.59 ± 0.10 777 6.55 6 8k 2x 3 Washington Co., UT
P. superbus A. Nelson 1.42 ± 0.03 696 2.36 3 8g 2x 3 C
P. utahensis Eastwood 1.57 ± 0.02 767 1.34 3 2x 1 San Juan Co., UT
Subsection Peltanthera
P. floridus var. floridus Brandegee 1.39 ± 0.03 680 1.82 2 8k 2x 1 Inyo Co., CA
P. grinnellii var. grinnellii Eastwood 1.40 ± 0.03 686 2.21 3 8k 2x 3 A, Ventura Co., CA
P. palmeri Gray 1.41 ± 0.04 688 2.91 3 8k, 16
k 2x 3 C
P. pseudospectabilis M. E. Jones 1.45 ± 0.01 709 0.75 3 8k 2x 3 C
Subsection Petiolati
P. petiolatus Brandegee 1.49 ± 0.05 729 3.58 5 2x 4 C, Aberdeen Research Field
Section Penstemon [Spermunculus]
Subsection Deusti
P. deustus var. deustus Douglas ex Lindley 1.04 ± 0.02 508 1.79 3 8a 2x 1 Power Co., ID
Subsection Harbouriani
P. harbourii Gray 1.53 ± 0.03 748 1.92 3 8b 2x 3 A, Summit Co., CO
Subsection Humiles
P. abietinus Pennell 1.41 ± 0.03 690 2.39 3 2x 1 Sevier Co., UT
P. albertinus Grenne 1.34 ± 0.00 656 0.11 2 8a, e, k
2x 1 Purchased, Rocky Mountain Rare Plants,
lot #127
P. grifinnii A. Nelson 1.13 ± 0.00 552 0.33 3 8k 2x 3 C
P. humilis var. brevifolius Keck 1.24 ± 0.07 607 5.87 15 8k 2x 3 Daggett Co., UT; Sevier Co., UT; Utah
Co., UT
P. humilis var. humilis [P. decurvus; P.
cinereus] Nuttall ex A. Gray
2.57 ± 0.10 1,255 3.97 8 8a, k
4x 2 Box Elder Co., UT, Bannock Co., ID
P. ovatus Douglas ex Hooker 1.39 ± 0.04 679 2.53 2 8a, c, e, g, j, k
2x 1 Aberdeen research fields
P. pruinosus Douglas ex Lindley 1.36 ± 0.07 663 4.87 3 8a, d, e
2x 1 Chelan Co., WA
P. radicosus A. Nelson 1.42 ± 0.04 695 2.60 4 8k 2x 1 Daggett Co., UT
P. virens Pennell ex Rydberg 1.67 ± 0.01 815 0.89 3 8a, d, e, g
2x 3 A, Grand Co., CO
P. whippleanus [P. metcalfei] Gray 1.3 ± 0.030 637 2.05 4 8g, k
2x 1 Iron Co., UT
P. wilcoxii Rydberg 1.38 ± 0.10 676 6.99 3 8e, k
, 16a, e, k
2x 1 Purchased, APS, lot#278-03G
Subsection Penstemon [Graciles]
P. digitalis 'Dark Towers' Nuttall ex Sims 6.45 3,156 - 1 48b, c, d, j, k
12x 1 NE

Figure 2. Average 2C genome sizes (pg) and ploidy levels in Penstemon.
50
Species
2C ± SE
(pg)*
1C
(Mbp)†
CV
% n‡
Chrom.
Count (n)§ Ploidy||
Pops/
Specimen Collection Site
P. digitalis 'Husker Red' Nuttall ex Sims 6.40 ± 0.05 3,127 0.73 3 48b, c, d, j, k
12x 1 NE
P. smallii 'Violet Dusk' Heller 1.13 ± 0.01 551 1.24 3 2x 1 D
Subsection Proceri
P. attenuatus var. attenuatus Douglas ex
Lindley
3.88 ± 0.01 1,899 0.27 3 16k, 24
a, e 6x 1 Purchased, APS, lot #20a-01G
P. attenuatus var. militaris Cronquist 2.35 ± 0.02 1,148 0.67 3 16g 4x 1 Custer Co., ID
P. confertus Douglas ex Lindley 2.59 ± 0.04 1,269 1.58 5 16a, e, i, k
4x 1 Purchased, J&J Seeds
P. euglaucus English 3.49 ± 0.01 1,709 0.28 3 24a, e, k
6x 3 A, Linn Co., OR
P. pratensis Grenne 2.30 ± 0.05 1,124 2.25 3 16a, e
4x 1 Purchased, APS, lot #05-017
P. procerus var. procerus Douglas ex
Graham
1.26 ± 0.03 615 2.40 6 8e, f, k
, 16e, i, k
2x 1 Iron Co., UT
P. watsonii Gray 1.27 ± 0.01 620 0.60 3 2x 1 Sevier Co., UT
Subsection Tubaeflori
P. tubaeflorus Nuttall 2.44 ± 0.01 1,193 0.34 3 16b, d, k
4x 3 NE
Subgenus Saccanthera
Section Bridgesiani [Emersus]
P. rostriflorus [P. bridgesii] Kellogg 1.16 ± 0.01 565 1.18 3 8k, 24
k 2x 3 A, Tulare Co., CA
Section Saccanthera
Subsection Saccanthera [Heterophylli]
P. azureus var. azureus Bentham 2.37 ± 0.02 1,157 0.87 4 16c, 24
c, k 4x 1 Jackson Co., OR
P. cusickii Gray 1.14 ± 0.03 559 3.01 6 2x 1 Gem Co., ID
P. leonardii var. higginsii Neese 0.97 ± 0.02 475 2.38 5 8k 2x 1 Washington Co., UT
P. leonardii var. leonardii Rydberg 1.09 ± 0.03 535 3.02 7 8k 2x 4 Cache Co., UT
P. platyphyllus Rydberg 1.14 ± 0.02 555 1.76 3 2x 1 Utah Co., UT
P. sepalulus Keck 1.15 ± 0.03 560 2.24 3 2x 3 Utah Co., UT
Subsection Serrulati
P. serrulatus [P. diffusus] Menzies ex
Smith
1.07 ± 0.02 524 2.31 3 8c, j, k
2x 1 Purchased, APS, lot #04-110
P. triphyllus Douglas ex Lindley 0.99 ± 0.05 484 4.90 3 8k 2x 1 Perce Co., MT
P. venustus Douglas ex Lindley 4.05 ± 0.06 1,978 1.45 3 32c, k
8x 3 A, Caribou Co., ID
*Average 2C DNA content (mean ± standard deviation)
†1 pg = 978 Mbp (Doležel et al. 2003)
‡Samples analyzed per species
§Chromosome number in haploid cells
||Values based on flow cytometry results
Figure 2. Average 2C genome sizes (pg) and ploidy levels in Penstemon.
51
A, location of seed collection = Seed purchased from alplains.com
B, location of seed collection = Seed purchased from prairiemoon.com
C, location of seed collection = Seed purchased from westernnativeseed.com
D, location of plant collection = Plants purchased from nursery aClausen et al. (1940);
bCrosswhite and Kawano (1965);
cDarlington and Ammal (1942);
dFreeman (1983);
eKeck (1945);
fLöve and
Löve (1982); gNisbet and Jackson (1960);
hSmith (1964);
iTaylor and Brockman (1966);
jWinge (1925);
kWolfe et al. (2006)


![Classical Taxonomy & Molecular Phylogeny [17.1-17.3] SPI 5 Apply evidence from the fossil record, comparative anatomy, amino acid sequences, and DNA structure](https://img.pdfslide.net/doc/110x75/56649ec65503460f94bd1738/classical-taxonomy-molecular-phylogeny-171-173-spi-5-apply-evidence-from.jpg)