Embed Size (px)
Citation preview
An Example of Evidence-Based
Standard Setting for an English Language Proficiency Test
NCME Philadelphia, PA
Sonya Powers
Natasha Williams
Leslie Keng
Laura Starr
April 2014
Draft (03/05/2014)
1
Abstract
Evidence-based standard setting (EBSS) uses empirical data as a key component of the standard-
setting process. This paper demonstrates how EBSS was used to recommend performance
standards on an English language proficiency test, the Texas English Language Proficiency
Assessment System (TELPAS) reading test. The empirical data was selected to validate claims
about characteristics of students at each of the proficiency levels. Specifically, studies were
chosen to evaluate whether or students scoring in the highest proficiency level on the English
language proficiency test in reading would be successful on the state academic reading test, the
State of Texas Assessments of Academic Readiness (STAAR), after an additional year of
instruction. Studies included: a text complexity analysis, a comparison of pass rates, a
comparison of average scale scores, concordance tables, decision consistency analyses, impact
data, and an evaluation of item proficiency-level classifications. To incorporate all the
information obtained from the studies into a coherent presentation for the standard-setting
panelists several approaches were used. Study data were used to identify reasonable ranges or
“neighborhoods” for the cut scores, to provide feedback to panelists after each round, and to
evaluate the recommended cut scores across grade levels during vertical articulation and the
reasonableness review. By providing additional empirical information throughout the standard-
setting meeting, panelists could use the data from external measures, along with content
information, to guide their judgments.
Keywords: standard setting, cut scores, large-scale assessment
Draft (03/05/2014)
2
An Example of Evidence-Based Standard Setting for an English Language Proficiency Test
Evidence-based standard setting (EBSS) is a method born out of the college and career
readiness movement within K-12 testing (Beimers, Way, McClarty, & Miles, 2012). The
method incorporates elements common to many standard-setting methods: selecting and training
panelists, collecting cut-score judgments, and arriving at numerical cut scores that represent the
standard-setting panel’s interpretation of the performance level descriptions. However, the
EBSS method also includes empirical data as a prominent piece of the process. This goes
beyond reporting of impact data based on panel recommendations, and begins long before the
standard-setting meetings take place. Data from relevant external measures are used along with
content information to guide panel judgments. The empirical data are selected to validate claims
about characteristics of students at each of the proficiency levels. For example, in the case of
setting a cut score on an end-of-course test that represents the level of knowledge students need
to be deemed ready for success in college and careers, the EBSS method would require
collection of external validity evidence showing the likelihood of success at various colleges and
in various careers based on particular cut scores. This information would be presented to
panelists during the standard-setting meeting to inform their judgments. It might also be
presented to other important stakeholder and policy groups. This method has been successfully
applied to set college and career readiness standards on the American Diploma Project (ADP)
Algebra II end-of-course assessment (McClarty, Way, Porter, Beimers, & Miles, 2013), as well
as the Texas end-of course assessments (Keng, Murphy, & Gaertner, 2012).
The clear strength of the EBSS method is the use of both content and empirical data to
support the claims that are part of the performance level descriptions. With a college and career
Draft (03/05/2014)
3
readiness standard, the outcome of interest is somewhat defined. What constitutes “success”,
and which colleges and careers are considered in the empirical research may still be up for some
debate, but there is a clear need to provide external validity evidence to support the cut score.
This is often implicitly the case in other standardized testing situations. For example, in
elementary and middle school academic assessments, there may be an underlying assumption
that passing the test doesn’t just mean mastering this year’s content; it also means being
adequately prepared to be successful on next year’s content. If test users have this assumption,
then this claim can be evaluated during standard setting by comparing student performance on
academic assessments in adjacent grades. If a large proportion of students who pass third grade
reading go on to fail fourth grade reading, there is evidence that the standards are not aligned
according to expectation. Perhaps the third grade standard is too lenient; perhaps the fourth
grade standard is too stringent.
EBSS can be used with any type of assessment that requires performance or proficiency
levels to be determined and for which relevant external measures are available that can be used
to inform cut-scores. In this paper, the generalizability of the EBSS method is demonstrated by
providing an example of its use with an English language proficiency assessment.
Background
The Texas English Language Proficiency Assessment System (TELPAS) assesses the
English language proficiency of K–12 English language learners (ELLs) in four language
domains: listening, speaking, reading, and writing. The TELPAS assessments are performance-
based and holistically rated, with the exception of the reading assessments for grades 2–12,
Draft (03/05/2014)
4
which are multiple-choice tests. The multiple-choice TELPAS reading assessments are
administered online in the following six grade clusters: 2, 3, 4–5, 6–7, 8–9, and 10–12.
TELPAS is used, in conjunction with the State of Texas Assessments of Academic
Readiness (STAAR) to show the extent to which districts and the state meet federal Annual
Measureable Achievement Objective (AMAO) accountability indicators that are specific to
English language proficiency and academic achievement of ELLs. Composite performance
(which combines performance on listening, speaking, reading, and writing), rather than
individual language domain performance, is used in TELPAS AMAO indicators. TELPAS
results are also used at the student level to help teachers design instruction and plan interventions
that appropriately address the student’s linguistic and academic needs.
For each language domain, TELPAS measures four levels, or stages, of increasing
English language proficiency:
beginning
intermediate
advanced
advanced high
Global definitions provide a common definition of the characteristics specific to each
proficiency level across language domains (see Table 1). The English Language Proficiency
Standards (ELPS) Proficiency Level Descriptors (PLDs) (not shown) are domain specific and
define how well ELLs at the four proficiency levels are able to understand and use English in
grade-level social and academic settings.
Draft (03/05/2014)
5
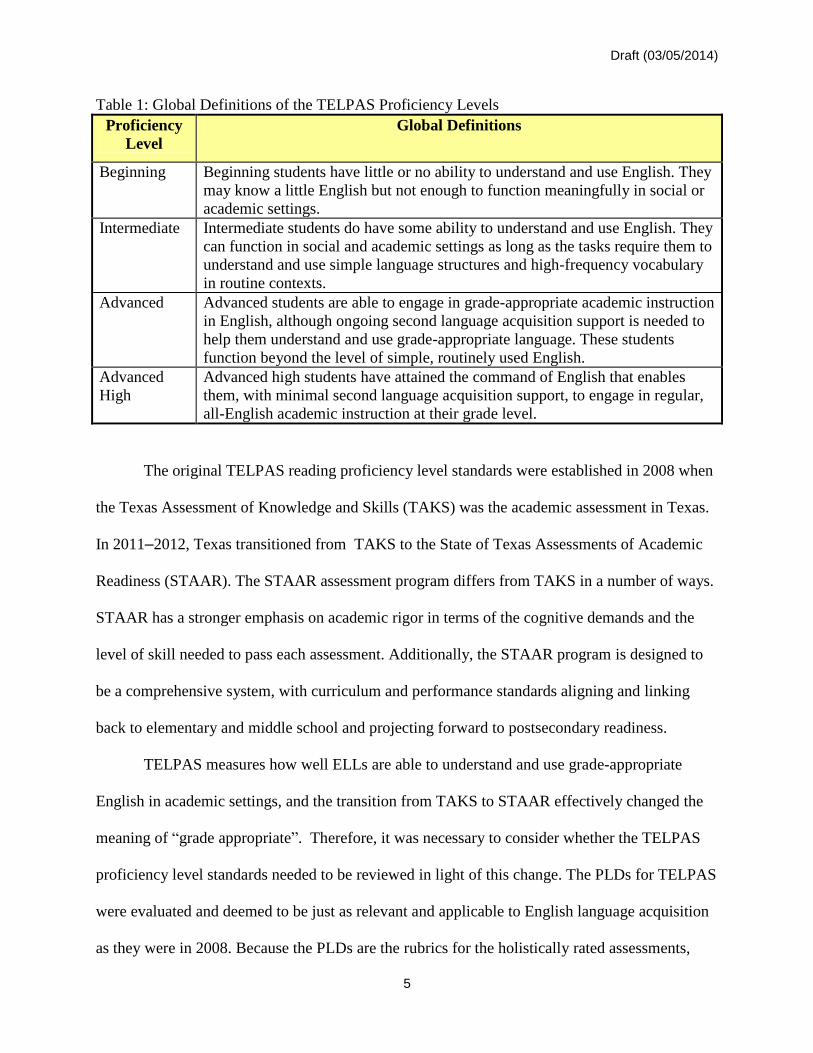
Table 1: Global Definitions of the TELPAS Proficiency Levels
Proficiency
Level
Global Definitions
Beginning Beginning students have little or no ability to understand and use English. They
may know a little English but not enough to function meaningfully in social or
academic settings.
Intermediate Intermediate students do have some ability to understand and use English. They
can function in social and academic settings as long as the tasks require them to
understand and use simple language structures and high-frequency vocabulary
in routine contexts.
Advanced Advanced students are able to engage in grade-appropriate academic instruction
in English, although ongoing second language acquisition support is needed to
help them understand and use grade-appropriate language. These students
function beyond the level of simple, routinely used English.
Advanced
High
Advanced high students have attained the command of English that enables
them, with minimal second language acquisition support, to engage in regular,
all-English academic instruction at their grade level.
The original TELPAS reading proficiency level standards were established in 2008 when
the Texas Assessment of Knowledge and Skills (TAKS) was the academic assessment in Texas.
In 2011–2012, Texas transitioned from TAKS to the State of Texas Assessments of Academic
Readiness (STAAR). The STAAR assessment program differs from TAKS in a number of ways.
STAAR has a stronger emphasis on academic rigor in terms of the cognitive demands and the
level of skill needed to pass each assessment. Additionally, the STAAR program is designed to
be a comprehensive system, with curriculum and performance standards aligning and linking
back to elementary and middle school and projecting forward to postsecondary readiness.
TELPAS measures how well ELLs are able to understand and use grade-appropriate
English in academic settings, and the transition from TAKS to STAAR effectively changed the
meaning of “grade appropriate”. Therefore, it was necessary to consider whether the TELPAS
proficiency level standards needed to be reviewed in light of this change. The PLDs for TELPAS
were evaluated and deemed to be just as relevant and applicable to English language acquisition
as they were in 2008. Because the PLDs are the rubrics for the holistically rated assessments,
Draft (03/05/2014)
6
proficiency level standards for the holistic domains were not included as part of the standards
review. However, it was deemed necessary to review the original TELPAS reading proficiency
level standards in grades 2–12 where the assessments are multiple-choice, so that performance
on TELPAS reading could be a meaningful indicator of the level of English language proficiency
required to be successful on STAAR reading. A standards review committee was convened to
make recommendations about how to adjust the TELPAS reading proficiency level standards to
align with STAAR so that TELPAS reading performance reflects when students are able to
engage in all-English academic instruction at their grade level.
An EBSS approach (O’Malley, Keng, & Miles, 2012) was used to review the cut scores
for the four proficiency levels (beginning, intermediate, advance, and advanced high) on the
TELPAS reading assessments. The EBSS approach was also used to establish the performance
standards on the STAAR assessments. The standards review approach for TELPAS reading
involved a process of combining considerations regarding policy, the ELPS global definitions
and PLDs, educator knowledge about what ELLs should know and be able to do, and empirical
data used to evaluate the alignment of ELL performance on TELPAS reading and STAAR
reading assessments. Standards review advisory committees, made up of groups of classroom
teachers, bilingual and ESL specialists, and English language acquisition experts, considered the
interaction of all these elements for each of the six TELPAS reading assessments.
Methods and Results
There are five general steps in the EBSS method (McClarty, Way, Porter, Beimers,
Miles, 2012):
1. Defining the outcomes of interest
2. Developing research, data collection, and analysis plans
Draft (03/05/2014)
7
3. Synthesizing research results
4. Conducting the standard-setting meeting
5. Continuing to gather validity evidence for the standards
This section details how each of these five steps have been implemented for TELPAS.
Defining the Outcomes of Interest
In many cases, students who score within the highest proficiency level on an English
language proficiency test are reclassified as English proficient, and are exited from ELL services.
In such cases, the outcome of interest would be evaluating whether or not the highest cut score
was placed such that the students who are exited are ready for main-stream instruction, and that
the students who are not exited still need ELL services.
In Texas, TELPAS is not used as an exiting criterion from ELL services. However, there
has been an expectation that ELLs who score in the highest proficiency level (advanced high) on
TELPAS will have attained a sufficient level of English proficiency to be successful in their
content-area assessments with an additional year of instruction. When TAKS was the academic
assessment, this expectation was typically accurate. However, many advanced high students are
no longer successful with an additional year of instruction on the new STAAR assessments.
Therefore, a review of the TELPAS reading proficiency level standards was conducted so that
performance on TELPAS reading could be a meaningful indicator of the level of English
language proficiency required to be successful on STAAR assessments. Using the EBSS method,
validity studies were used to evaluate the relationship between TELPAS and STAAR
performance. Results from these studies, along with content information were used to provide
guidance in reviewing the TELPAS reading standards.
Draft (03/05/2014)
8
Much of the empirical research focused on the cut score associated with the advanced
high proficiency level because the outcome of interest—success on STAAR reading—was well-
defined. However, there was an expectation that large increases in the advanced high cut score
would require shifts in the other two cut scores. Though an explicit claim is not associated with
these other cut scores, empirical evidence was used when possible to inform all cut scores.
Developing Research, Data Collection, and Analysis Plans
Developing research studies began with a set of three research questions:
1. How similar are TELPAS advanced high reading passages to STAAR reading passages in
terms of text complexity?
2. How much should the advanced high cut score increase on the six TELPAS reading
assessments so that advanced high students are successful on STAAR with an additional
year of instruction?
3. Do the intermediate and advanced cut scores need to be adjusted?
To address these questions, seven research studies were developed. These studies
included a text complexity analysis, a comparison of STAAR pass rates, a comparison of average
STAAR scores, TELPAS-STAAR concordance tables, TELPAS-STAAR decision consistency
analyses, TELPAS impact data, and TELPAS item classification evaluation. The text
complexity analysis was created to answer research question 1. The STAAR pass rate and
average scale score comparisons, and TELPAS-STAAR concordance tables and decision
consistency analyses were four different ways of looking at the relationship between TELPAS
reading and STAAR reading performance to help inform research question 2. In many cases,
obtaining data on external measures is difficult or time-consuming (e.g., requesting SAT or ACT
scores). In this case, STAAR data were readily available, so data collection was not a concern.
Draft (03/05/2014)
9
However, the STAAR passing standard is being phased in to allow students and teachers time to
learn the new curriculum and become prepared for the more rigorous assessment system. From
2012-2014, the first phase in (referred to hereafter as phase-in 1) was the STAAR passing
standard. The passing standard will be increased in future years using a second phase-in (phase-
in 2) and a final passing standard. Because the new TELPAS standards will be used for several
years, the relationship between TELPAS performance and STAAR performance was evaluated
for all three STAAR passing standards.
The last two studies, TELPAS impact data and item classification evaluation, were
conducted to inform research questions 2 and 3. Additionally, the TELPAS vertical scale was
used to evaluate the alignment of cut scores across grade clusters. Using vertical scale
information did not require an additional study, and will be described more in the Synthesizing
Research Results section. Details of the seven studies are detailed below to give the reader
examples of data collection and analysis methods that can be used to provide empirical validity
evidence to inform standard setting for an English language proficiency test.
Text Complexity Analysis
A large proportion of TELPAS reading items are associated with reading passages. An
initial concern was that the text complexity level of STAAR reading passages might be higher
than the complexity level of advanced high TELPAS passages for the same grade. If so, high
performance on TELPAS might not provide a good indicator of sufficient reading skills to be
successful on STAAR. This research question was addressed through a qualitative comparison
of STAAR reading passages and TELPAS advanced high passages. Content experts used a
rubric (based largely on two published rubrics: Hess & Hervey, 2011; Student Achievement
Draft (03/05/2014)
10
Partners, 2013) to rate the passages on four complexity criteria including purpose and meaning,
organization and structure, language, and knowledge demands.
Results of the text complexity analysis indicated a close alignment in the complexity of
advanced high TELPAS passages and STAAR passages at the elementary grades. At the middle
school grade clusters, there was a larger gap between grade-level passages for STAAR and
advanced high passages of TELPAS. Though the gap between TELPAS and STAAR at grade 8
was wider than at the lower grades, content experts agreed that students who score advanced
high on the grades 8–9 TELPAS test would, with one more year of instruction, likely have
enough English to access the language of STAAR passages corresponding to their grade level.
However, STAAR English II passages were found to be much more complex than TELPAS
advanced high passages at grades 10–12. Content experts agreed that students who scored
advanced high on TELPAS in grades 10–12 would need more than one additional year of
instruction to have enough English to access the language of the STAAR English II passages.
These results suggested that adjustments to TELPAS passage development might be
needed—especially at the 10–12 grade cluster—to adequately prepare ELLs for the rigorous
STAAR English II passages. Additionally, the text complexity evaluation pointed to a need for
more substantial increases in proficiency level standards at the higher grades than at the lower
grades.
Comparison of STAAR Pass Rates
Although a large percentage of students classified as advanced high on TELPAS passed
TAKS the following year, this is not true for STAAR. STAAR pass rates were calculated for a
variety of possible TELPAS advanced high cut scores based on the phase-in 1 passing standard
which was the passing standard in 2012, 2013, and 2014, along with phase-in 2 and final
Draft (03/05/2014)
11
standards which will be implemented in the future. Tables with STAAR pass rate information
were created for all six TELPAS reading assessments. A single group data collection design was
used to match 2012 TELPAS and 2013 STAAR scores for the same group of students (allowing
for the additional year of instruction between TELPAS and STAAR results).
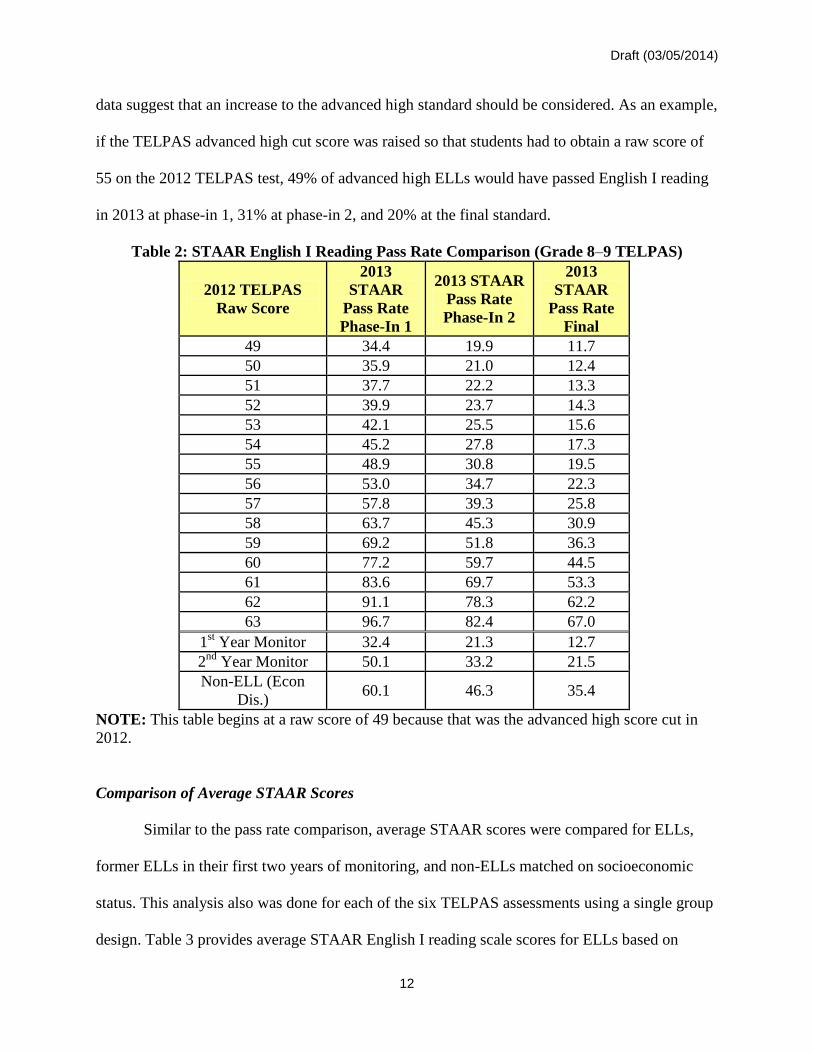
Table 2 provides an example of a pass rate comparison for ELLs who took TELPAS in
grade 8 and STAAR English I reading in grade 9. STAAR pass rates were computed for a variety
of hypothetical TELPAS advanced high cut scores, beginning with the original cut score which
was a raw score of 49 on the 2012 TELPAS 8–9 test, and ending at the maximum attainable
TELPAS score of 63 (100% correct). At the original TELPAS advanced high standard, 34% of
grade 8 ELLs classified as advanced high in 2012 passed English I reading in 2013 at the phase-
in 1 STAAR passing standard. If the phase-in 2 standard had been the passing standard in 2013,
20% would have passed, and if the final standard had been the passing standard in 2013, 12%
would have passed.
Table 2 also provides STAAR pass rates for former ELLs who were being monitored in
their first two years of exited status (1st and 2
nd year monitor), and for non-ELLs matched on
socioeconomic status (Econ Dis.). Comparing the STAAR pass rates of economically
disadvantaged non-ELLs to the performance of ELLs provides a more realistic picture of
performance gaps because the majority of ELLs in Texas are classified as economically
disadvantaged, and low socio-economic status has historically been associated with lower
academic achievement scores (e.g., White, 1982). Approximately 60% of non-ELLs passed
STAAR English I reading at the phase-in 1 standard, 46% at the phase-in 2 standard, and 35% at
the final recommended standard. Therefore advanced high ELLs with an additional year of
instruction are not performing nearly as well as socioeconomically matched non-ELLs. These
Draft (03/05/2014)
12
data suggest that an increase to the advanced high standard should be considered. As an example,
if the TELPAS advanced high cut score was raised so that students had to obtain a raw score of
55 on the 2012 TELPAS test, 49% of advanced high ELLs would have passed English I reading
in 2013 at phase-in 1, 31% at phase-in 2, and 20% at the final standard.
Table 2: STAAR English I Reading Pass Rate Comparison (Grade 8–9 TELPAS)
2012 TELPAS
Raw Score
2013
STAAR
Pass Rate
Phase-In 1
2013 STAAR
Pass Rate
Phase-In 2
2013
STAAR
Pass Rate
Final
49 34.4 19.9 11.7
50 35.9 21.0 12.4
51 37.7 22.2 13.3
52 39.9 23.7 14.3
53 42.1 25.5 15.6
54 45.2 27.8 17.3
55 48.9 30.8 19.5
56 53.0 34.7 22.3
57 57.8 39.3 25.8
58 63.7 45.3 30.9
59 69.2 51.8 36.3
60 77.2 59.7 44.5
61 83.6 69.7 53.3
62 91.1 78.3 62.2
63 96.7 82.4 67.0
1st Year Monitor 32.4 21.3 12.7
2nd
Year Monitor 50.1 33.2 21.5
Non-ELL (Econ
Dis.) 60.1 46.3 35.4
NOTE: This table begins at a raw score of 49 because that was the advanced high score cut in
2012.
Comparison of Average STAAR Scores
Similar to the pass rate comparison, average STAAR scores were compared for ELLs,
former ELLs in their first two years of monitoring, and non-ELLs matched on socioeconomic
status. This analysis also was done for each of the six TELPAS assessments using a single group
design. Table 3 provides average STAAR English I reading scale scores for ELLs based on
Draft (03/05/2014)
13
possible TELPAS advanced high cut scores, as well as the average STAAR English I reading
scores for 1st and 2
nd year monitor students and economically disadvantaged non-ELLs.
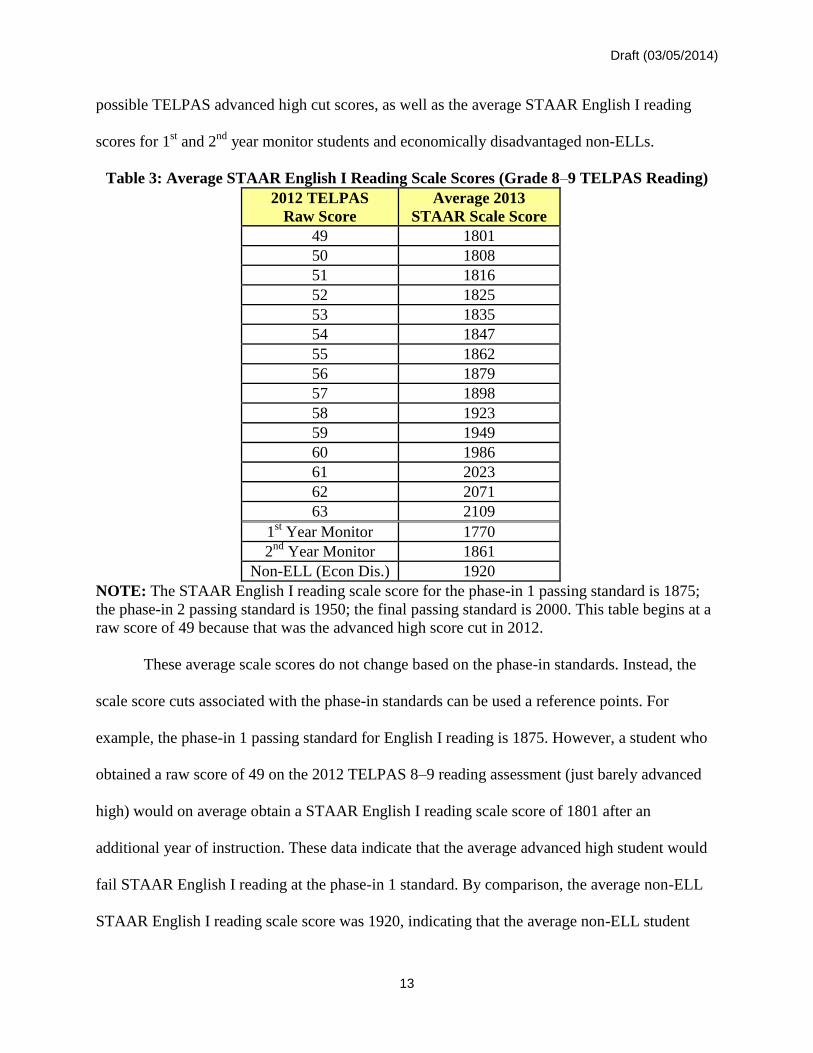
Table 3: Average STAAR English I Reading Scale Scores (Grade 8–9 TELPAS Reading)
2012 TELPAS
Raw Score
Average 2013
STAAR Scale Score
49 1801
50 1808
51 1816
52 1825
53 1835
54 1847
55 1862
56 1879
57 1898
58 1923
59 1949
60 1986
61 2023
62 2071
63 2109
1st Year Monitor 1770
2nd
Year Monitor 1861
Non-ELL (Econ Dis.) 1920
NOTE: The STAAR English I reading scale score for the phase-in 1 passing standard is 1875;
the phase-in 2 passing standard is 1950; the final passing standard is 2000. This table begins at a
raw score of 49 because that was the advanced high score cut in 2012.
These average scale scores do not change based on the phase-in standards. Instead, the
scale score cuts associated with the phase-in standards can be used a reference points. For
example, the phase-in 1 passing standard for English I reading is 1875. However, a student who
obtained a raw score of 49 on the 2012 TELPAS 8–9 reading assessment (just barely advanced
high) would on average obtain a STAAR English I reading scale score of 1801 after an
additional year of instruction. These data indicate that the average advanced high student would
fail STAAR English I reading at the phase-in 1 standard. By comparison, the average non-ELL
STAAR English I reading scale score was 1920, indicating that the average non-ELL student
Draft (03/05/2014)
14
would pass STAAR English I reading at the phase-in 1 standard. These results also suggest an
increase in the advanced high cut score is needed for the grade 8–9 TELPAS reading assessment.
TELPAS-STAAR Concordance Tables
In cases where an empirical link between two assessments is needed but no assumptions
about score equivalency can be made, regression-based approaches can be applied. Ordinary
least square (OLS) regression was used to calculate a regression equation:
Predicted_STAAR_Score = a*TELPAS_Score + b
where a is the slope coefficient, and b is the intercept coefficient. By plugging each TELPAS
score into the regression equation, a concordance table can be constructed, providing the
predicted STAAR score for each TELPAS score. The concordance table was used to identify the
TELPAS score associated with the following predicted STAAR scale scores:
the STAAR scale score achievable by guessing
the STAAR scale score associated with the old TAKS passing standard
the STAAR scale scores associated with the passing standard at phase-in 1, phase-in 2,
and final recommended.
Concordance tables were constructed for TELPAS reading and STAAR reading scores
using only ELL data. The two assessments measure fundamentally different things. However, the
concordance results are not meant to imply that TELPAS scores could be used with a
concordance table to provide students with a STAAR score. Students must take STAAR to get an
accurate measurement of their academic reading ability. However, concordance tables can be
used to inform reasonable cut scores for TELPAS by indicating how students are likely to
perform on STAAR reading given how they performed on TELPAS reading. For example,
predicted STAAR scores from the concordance table can be compared to the STAAR passing
Draft (03/05/2014)
15
standard (phase-in and recommended) to determine how high ELLs would have to score on
TELPAS to be predicted to pass STAAR.
As indicated in Table 4, students who received a score on the grade 8–9 TELPAS reading
test of 62 in grade 8 are predicted to pass STAAR reading at the phase-in 1 passing standard. A
score of 62 on TELPAS is one raw score away from a perfect score. Even an 8th
grade student
who received a perfect score (100% correct) on the 2012 TELPAS reading test would not be
predicted to pass STAAR English I reading the next year at the phase-in 2 standard. These data
suggest that an increase in the advanced high standard for the grade 8–9 TELPAS reading
assessment should be considered. These data also suggest that future TELPAS forms will need to
be built with more difficult items so that a higher standard can be set without placing it at a
perfect score.
Table 4: Concordance Table for Grade 8 TELPAS Reading and STAAR English I Reading
2012 TELPAS
Raw Score
2013 Predicted English I
Reading Scale Score
49 1738
50 1749
51 1760
52 1771
53 1782
54 1793
55 1804
56 1815
57 1826
58 1837
59 1848
60 1859
61 1870
62 1880
63 1891
NOTE: The STAAR English I reading scale score for the phase-in 1 passing standard is 1875;
the phase-in 2 passing standard is 1950; the final passing standard is 2000. This table begins at a
raw score of 49 because that was the advanced high score cut in 2012.
Draft (03/05/2014)
16
TELPAS-STAAR Decision Consistency
This study included only ELL data and was based a method recommended in a U.S.
Department of Education report called “National Evaluation of Title III Implementation
Supplemental Report: Exploring Approaches to Setting English Language Proficiency
Performance Criteria and Monitoring English Learner Progress”
(http://www2.ed.gov/rschstat/eval/title-iii/implementation-supplemental-report.html). This
method compares “consistent decisions” which are defined as “passing” both the academic and
English language proficiency assessments or “failing” both assessments. Although scores on
English language proficiency assessments are not usually classified into pass/fail categories, the
score used to exit students from ELL services can be used as a “passing” cut score. Holding the
cut score on the academic assessment constant, while increasing the cut score for the English
language proficiency assessment often results in an increase in decision consistency up to a
certain point, after which decision consistency decreases. The scores near where decision
consistency is maximized should be considered for the cut score associated with exiting on the
English language proficiency assessment, especially in cases where the cut score is used to make
decisions about whether a student is ready to be exited from ELL services.
In this study, decision consistency was defined as the percent of students who passed
STAAR (at the phase-in and recommended standards) and scored advanced high on TELPAS or
who failed STAAR and scored below advanced high on TELPAS. Decision consistency was
calculated for a variety of possible advanced high cut scores. The point along the TELPAS scale
where decision consistency was maximized was identified and used as validity evidence during
the TELPAS standards review.
Draft (03/05/2014)
17
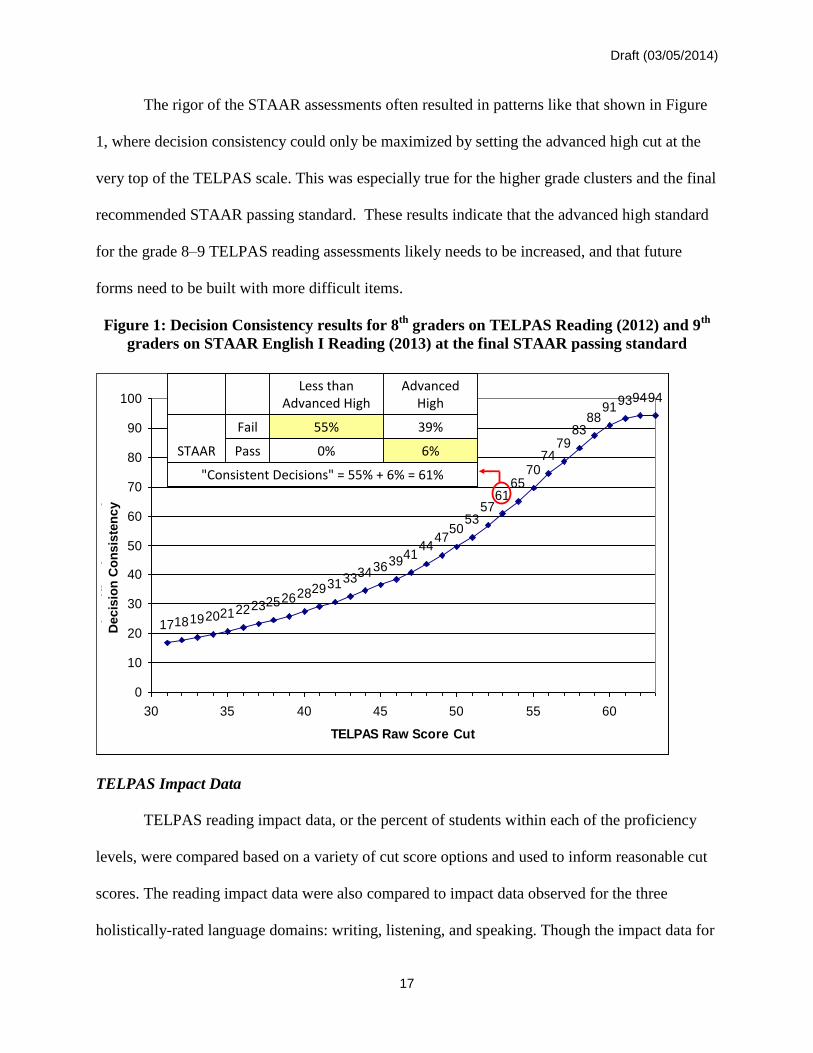
The rigor of the STAAR assessments often resulted in patterns like that shown in Figure
1, where decision consistency could only be maximized by setting the advanced high cut at the
very top of the TELPAS scale. This was especially true for the higher grade clusters and the final
recommended STAAR passing standard. These results indicate that the advanced high standard
for the grade 8–9 TELPAS reading assessments likely needs to be increased, and that future
forms need to be built with more difficult items.
Figure 1: Decision Consistency results for 8th
graders on TELPAS Reading (2012) and 9th
graders on STAAR English I Reading (2013) at the final STAAR passing standard
TELPAS Impact Data
TELPAS reading impact data, or the percent of students within each of the proficiency
levels, were compared based on a variety of cut score options and used to inform reasonable cut
scores. The reading impact data were also compared to impact data observed for the three
holistically-rated language domains: writing, listening, and speaking. Though the impact data for
Classification Consistency of 2012 Grade 9 TELPAS and STAAR
1718192021222325262829313334363941
4447
5053
5761
6570
7479
8388
91939494
0
10
20
30
40
50
60
70
80
90
100
30 35 40 45 50 55 60
TELPAS Raw Score Cut
Cla
ss
ific
ati
on
Co
ns
iste
nc
y
"Consistent Decisions" = 55% + 6% = 61%
6%0%Pass
39%55%Fail
STAAR
Advanced High
Less than Advanced High
De
cis
ion
Co
ns
iste
nc
y
Classification Consistency of 2012 Grade 9 TELPAS and STAAR
1718192021222325262829313334363941
4447
5053
5761
6570
7479
8388
91939494
0
10
20
30
40
50
60
70
80
90
100
30 35 40 45 50 55 60
TELPAS Raw Score Cut
Cla
ss
ific
ati
on
Co
ns
iste
nc
y
"Consistent Decisions" = 55% + 6% = 61%
6%0%Pass
39%55%Fail
STAAR
Advanced High
Less than Advanced High
De
cis
ion
Co
ns
iste
nc
y
Draft (03/05/2014)
18
each of the TELPAS domains are not expected to be the same, it is also not expected that the
percentages of students classified into the four proficiency levels would be substantially
different. A comparison of impact data across domains might not be possible for English
language proficiency tests that have standards set on the composite scores across domains. It is
possible here because the TELPAS reading proficiency level standards are set independently of
the other three language domains.
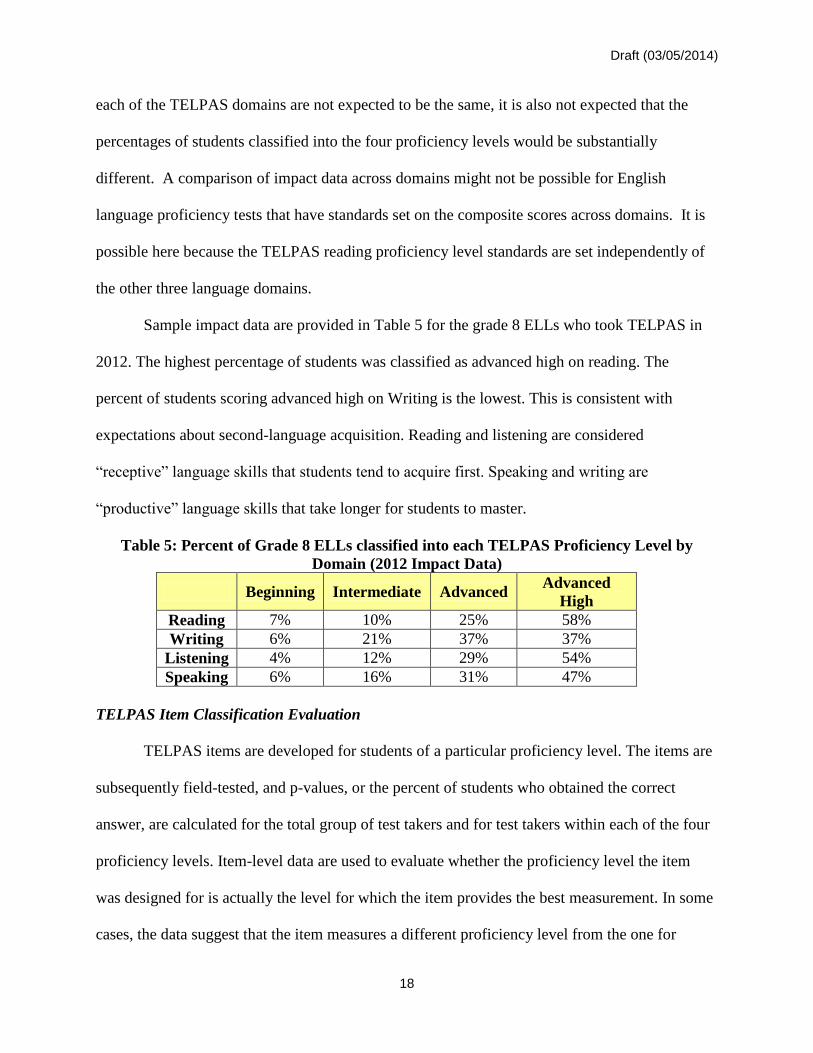
Sample impact data are provided in Table 5 for the grade 8 ELLs who took TELPAS in
2012. The highest percentage of students was classified as advanced high on reading. The
percent of students scoring advanced high on Writing is the lowest. This is consistent with
expectations about second-language acquisition. Reading and listening are considered
“receptive” language skills that students tend to acquire first. Speaking and writing are
“productive” language skills that take longer for students to master.
Table 5: Percent of Grade 8 ELLs classified into each TELPAS Proficiency Level by
Domain (2012 Impact Data)
Beginning Intermediate Advanced Advanced
High
Reading 7% 10% 25% 58%
Writing 6% 21% 37% 37%
Listening 4% 12% 29% 54%
Speaking 6% 16% 31% 47%
TELPAS Item Classification Evaluation
TELPAS items are developed for students of a particular proficiency level. The items are
subsequently field-tested, and p-values, or the percent of students who obtained the correct
answer, are calculated for the total group of test takers and for test takers within each of the four
proficiency levels. Item-level data are used to evaluate whether the proficiency level the item
was designed for is actually the level for which the item provides the best measurement. In some
cases, the data suggest that the item measures a different proficiency level from the one for
Draft (03/05/2014)
19
which it was originally developed. For example, an item may have been developed as a
beginning level item. However, p-values might indicate that the item is very difficult for
beginning students, moderately difficult for intermediate students, and not difficult for advanced
and advanced high students. This pattern would suggest that the item is more accurate at
measuring intermediate students and should be reclassified.
If the proficiency level standards change, the students who are classified into each of the
proficiency levels also changes. This change would result in different p-values by proficiency
level. If the standards are shifted to be substantially more difficult, the average performance of
students in each proficiency level will increase. In other words, the lowest performing
intermediate students would be classified into the beginning category, thereby increasing the
average performance of students in the beginning category. The lowest performing advanced
students would be classified as intermediate, thereby increasing the average performance of
students in the intermediate category. And finally, the lowest performing advanced high students
would be classified as advanced, increasing the average performance of both the advanced and
the advanced high categories. Therefore, the p-values by proficiency level are likely to increase.
An item that previously measured language proficiency best at the intermediate level might now
appear too easy for students classified as intermediate; the p-value pattern might suggest the item
is actually best classified as a beginning level item.
Because of the relationship between the TELPAS proficiency level standards and how
students and items are classified into proficiency levels, a p-value analysis was conducted to
show how p-values by proficiency level shift for various cut scores. Table 6 provides a set of p-
values for a hypothetical item. In this example, the p-values for the item using the TELPAS
standards that were set in 2008 shows that the item is difficult for beginning ELLs. Only 25% of
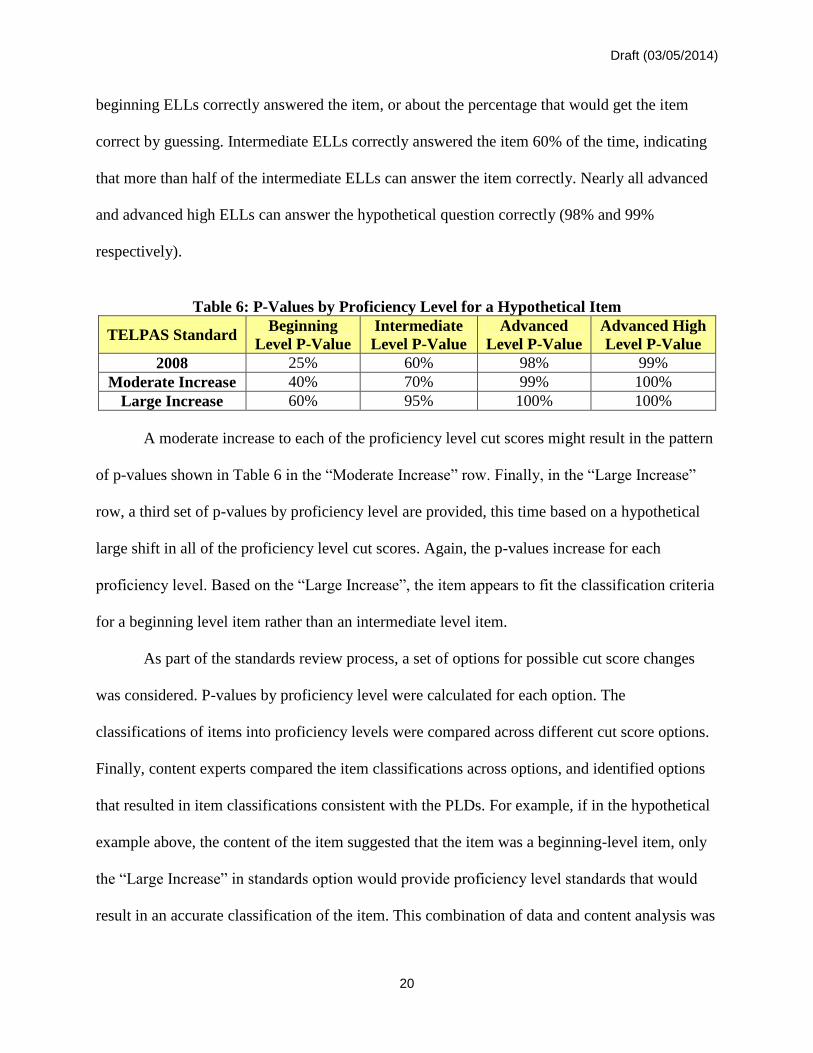
Draft (03/05/2014)
20
beginning ELLs correctly answered the item, or about the percentage that would get the item
correct by guessing. Intermediate ELLs correctly answered the item 60% of the time, indicating
that more than half of the intermediate ELLs can answer the item correctly. Nearly all advanced
and advanced high ELLs can answer the hypothetical question correctly (98% and 99%
respectively).
Table 6: P-Values by Proficiency Level for a Hypothetical Item
TELPAS Standard Beginning
Level P-Value
Intermediate
Level P-Value
Advanced
Level P-Value
Advanced High
Level P-Value
2008 25% 60% 98% 99%
Moderate Increase 40% 70% 99% 100%
Large Increase 60% 95% 100% 100%
A moderate increase to each of the proficiency level cut scores might result in the pattern
of p-values shown in Table 6 in the “Moderate Increase” row. Finally, in the “Large Increase”
row, a third set of p-values by proficiency level are provided, this time based on a hypothetical
large shift in all of the proficiency level cut scores. Again, the p-values increase for each
proficiency level. Based on the “Large Increase”, the item appears to fit the classification criteria
for a beginning level item rather than an intermediate level item.
As part of the standards review process, a set of options for possible cut score changes
was considered. P-values by proficiency level were calculated for each option. The
classifications of items into proficiency levels were compared across different cut score options.
Finally, content experts compared the item classifications across options, and identified options
that resulted in item classifications consistent with the PLDs. For example, if in the hypothetical
example above, the content of the item suggested that the item was a beginning-level item, only
the “Large Increase” in standards option would provide proficiency level standards that would
result in an accurate classification of the item. This combination of data and content analysis was

Draft (03/05/2014)
21
performed on hundreds of TELPAS items to identify reasonable areas within which the TELPAS
standards could be adjusted.
Synthesizing Research Results
Findings from the text complexity analysis indicated that TELPAS reading passages were
similar in complexity to STAAR reading passages for the lower grade levels. However, as grade
level increased, differences in text complexity between STAAR and TELPAS passages began to
emerge. By high school, the STAAR passages were much more complex than the TELPAS
passages. Although standards are set at the item level, rather than the passage level, this was
important information for those responsible for developing TELPAS passages and tests. Results
from the four studies that looked at TELPAS and STAAR performance data indicated that the
advanced high cut should be increased, and that the increase should be largest for the higher
grade clusters (6–7, 8–9, 10–12), and relatively small for the lower grade clusters (2, 3, 4–5).
Results from evaluating TELPAS impact data and item classifications corroborated the need to
increase the advanced high cut for the higher grade clusters, and also suggested increases in the
other two standards. Again, the greatest increases appeared necessary at the higher grade
clusters.
Although the three research questions have been answered, the next step was to figure out
how to incorporate all of the information obtained from the studies into a coherent presentation
for the standard setting panelists. How can we go from information overload to a helpful and
guiding level of detail? There are many places where the information could be helpful:
Identifying reasonable ranges or “neighborhoods” for cut scores on the scale score (and
incorporating reasonable ranges in the development of an ordered item booklet)
Providing information and feedback to panelists after judgment rounds
Draft (03/05/2014)
22
Using the information for vertical articulation and/or reasonableness review of the panel
recommended standards
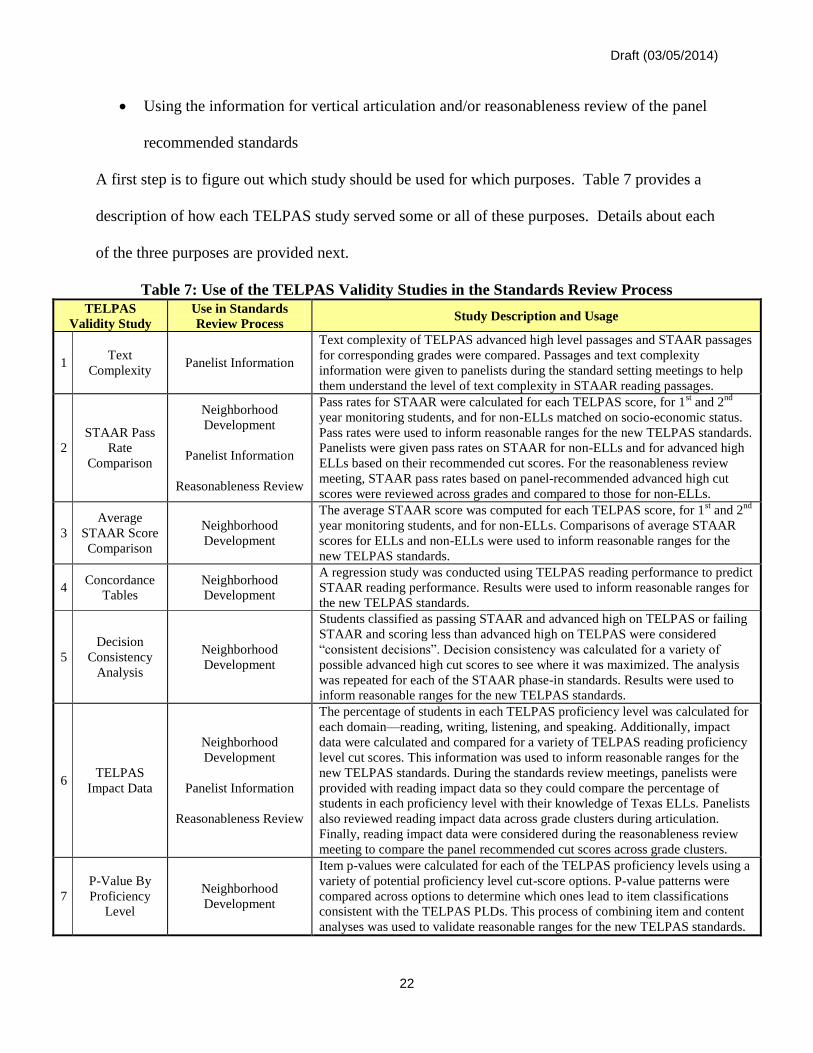
A first step is to figure out which study should be used for which purposes. Table 7 provides a
description of how each TELPAS study served some or all of these purposes. Details about each
of the three purposes are provided next.
Table 7: Use of the TELPAS Validity Studies in the Standards Review Process
TELPAS
Validity Study
Use in Standards
Review Process Study Description and Usage
1 Text
Complexity Panelist Information
Text complexity of TELPAS advanced high level passages and STAAR passages
for corresponding grades were compared. Passages and text complexity
information were given to panelists during the standard setting meetings to help
them understand the level of text complexity in STAAR reading passages.
2
STAAR Pass
Rate
Comparison
Neighborhood
Development
Panelist Information
Reasonableness Review
Pass rates for STAAR were calculated for each TELPAS score, for 1st and 2
nd
year monitoring students, and for non-ELLs matched on socio-economic status.
Pass rates were used to inform reasonable ranges for the new TELPAS standards.
Panelists were given pass rates on STAAR for non-ELLs and for advanced high
ELLs based on their recommended cut scores. For the reasonableness review
meeting, STAAR pass rates based on panel-recommended advanced high cut
scores were reviewed across grades and compared to those for non-ELLs.
3
Average
STAAR Score
Comparison
Neighborhood
Development
The average STAAR score was computed for each TELPAS score, for 1st and 2
nd
year monitoring students, and for non-ELLs. Comparisons of average STAAR
scores for ELLs and non-ELLs were used to inform reasonable ranges for the
new TELPAS standards.
4 Concordance
Tables
Neighborhood
Development
A regression study was conducted using TELPAS reading performance to predict
STAAR reading performance. Results were used to inform reasonable ranges for
the new TELPAS standards.
5
Decision
Consistency
Analysis
Neighborhood
Development
Students classified as passing STAAR and advanced high on TELPAS or failing
STAAR and scoring less than advanced high on TELPAS were considered
“consistent decisions”. Decision consistency was calculated for a variety of
possible advanced high cut scores to see where it was maximized. The analysis
was repeated for each of the STAAR phase-in standards. Results were used to
inform reasonable ranges for the new TELPAS standards.
6 TELPAS
Impact Data
Neighborhood
Development
Panelist Information
Reasonableness Review
The percentage of students in each TELPAS proficiency level was calculated for
each domain—reading, writing, listening, and speaking. Additionally, impact
data were calculated and compared for a variety of TELPAS reading proficiency
level cut scores. This information was used to inform reasonable ranges for the
new TELPAS standards. During the standards review meetings, panelists were
provided with reading impact data so they could compare the percentage of
students in each proficiency level with their knowledge of Texas ELLs. Panelists
also reviewed reading impact data across grade clusters during articulation.
Finally, reading impact data were considered during the reasonableness review
meeting to compare the panel recommended cut scores across grade clusters.
7
P-Value By
Proficiency
Level
Neighborhood
Development
Item p-values were calculated for each of the TELPAS proficiency levels using a
variety of potential proficiency level cut-score options. P-value patterns were
compared across options to determine which ones lead to item classifications
consistent with the TELPAS PLDs. This process of combining item and content
analyses was used to validate reasonable ranges for the new TELPAS standards.
Draft (03/05/2014)
23
Neighborhood Development and Verification
Creating “neighborhoods” for placing cut scores on the score scale provides a way to
synthesize important policy considerations, content considerations, and validity study results into
a set of reasonable ranges within which standards review committee members can make
judgments. The development of the neighborhoods requires a lot of careful planning prior to the
standard-setting meeting. However, the neighborhoods allow the committee to focus on key
content and data pieces, while still placing cut scores within regions that have been developed
using all relevant information.
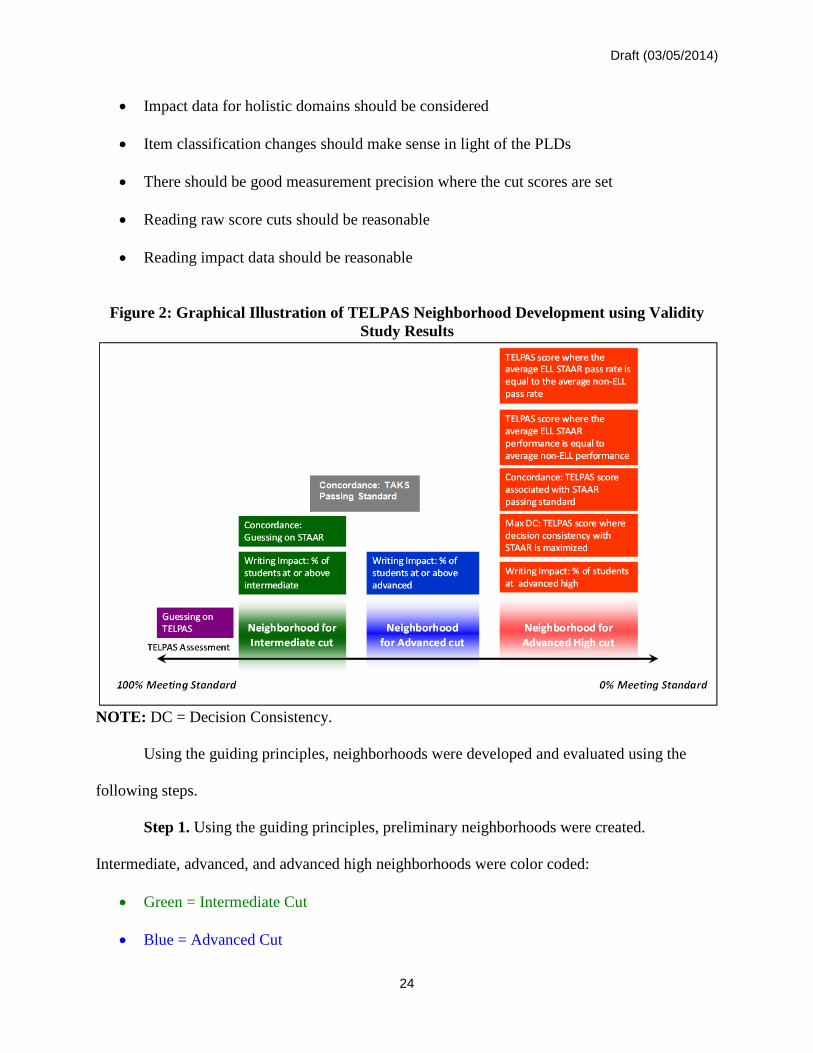
Figure 2 provides a graphical representation of how the empirical study information was
used to inform the neighborhoods. As can be seen, most of the study results pertained to the
advanced high cut score. The study results often spread over a large region of the scale. This is
especially true of the validity studies used to inform the advanced high cut. Moreover, the studies
map to different regions of the score scale at different grade clusters. In other words, the
location of the studies on the actual scale score may not always fall out as cleanly as the depicted
in Figure 2. To help narrow and obtain more reasonable neighborhoods, a set of guiding
principles was developed. These general guiding principles incorporated the studies from Figure
2 as well as information from the TELPAS item classification analysis, vertical scale
information, and the original TELPAS proficiency levels to inform neighborhoods for all three
proficiency level cut scores.
Guiding Principles:
Rigor of TELPAS reading cuts should not be lowered
Performance standards should be aligned across grade clusters
Performance standards should be informed by validity study results
Draft (03/05/2014)
24
Impact data for holistic domains should be considered
Item classification changes should make sense in light of the PLDs
There should be good measurement precision where the cut scores are set
Reading raw score cuts should be reasonable
Reading impact data should be reasonable
Figure 2: Graphical Illustration of TELPAS Neighborhood Development using Validity
Study Results
NOTE: DC = Decision Consistency.
Using the guiding principles, neighborhoods were developed and evaluated using the
following steps.
Step 1. Using the guiding principles, preliminary neighborhoods were created.
Intermediate, advanced, and advanced high neighborhoods were color coded:
Green = Intermediate Cut
Blue = Advanced Cut
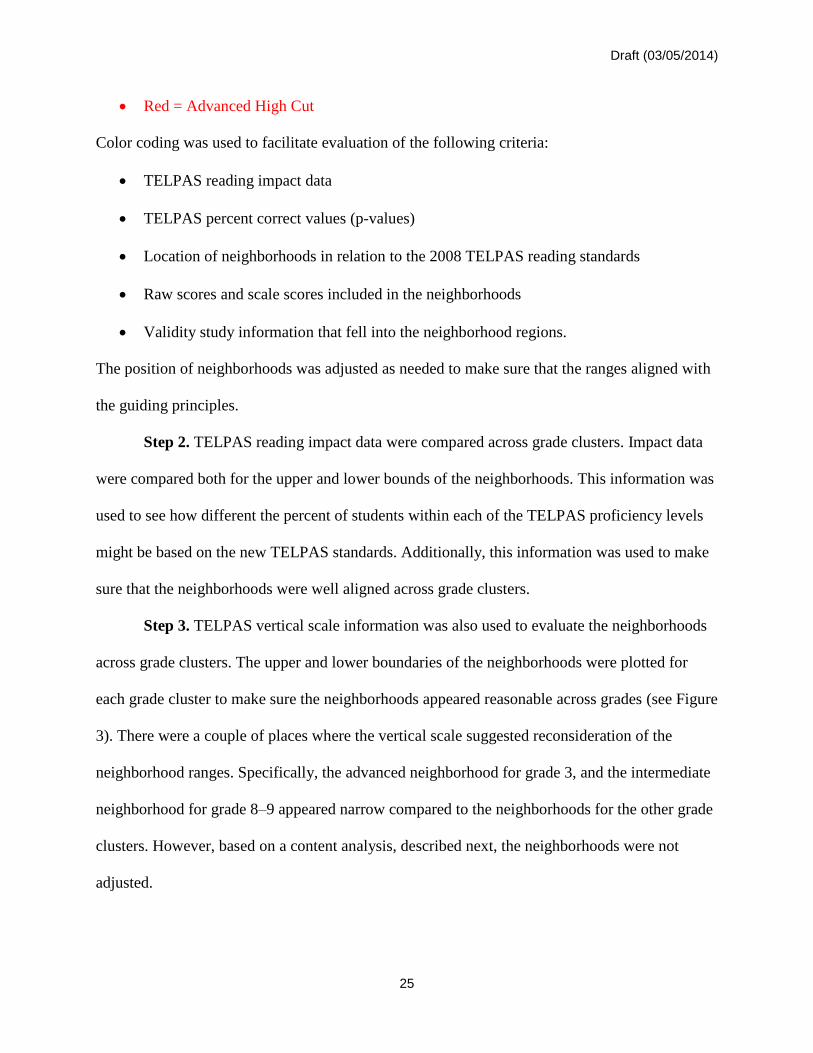
Draft (03/05/2014)
25
Red = Advanced High Cut
Color coding was used to facilitate evaluation of the following criteria:
TELPAS reading impact data
TELPAS percent correct values (p-values)
Location of neighborhoods in relation to the 2008 TELPAS reading standards
Raw scores and scale scores included in the neighborhoods
Validity study information that fell into the neighborhood regions.
The position of neighborhoods was adjusted as needed to make sure that the ranges aligned with
the guiding principles.
Step 2. TELPAS reading impact data were compared across grade clusters. Impact data
were compared both for the upper and lower bounds of the neighborhoods. This information was
used to see how different the percent of students within each of the TELPAS proficiency levels
might be based on the new TELPAS standards. Additionally, this information was used to make
sure that the neighborhoods were well aligned across grade clusters.
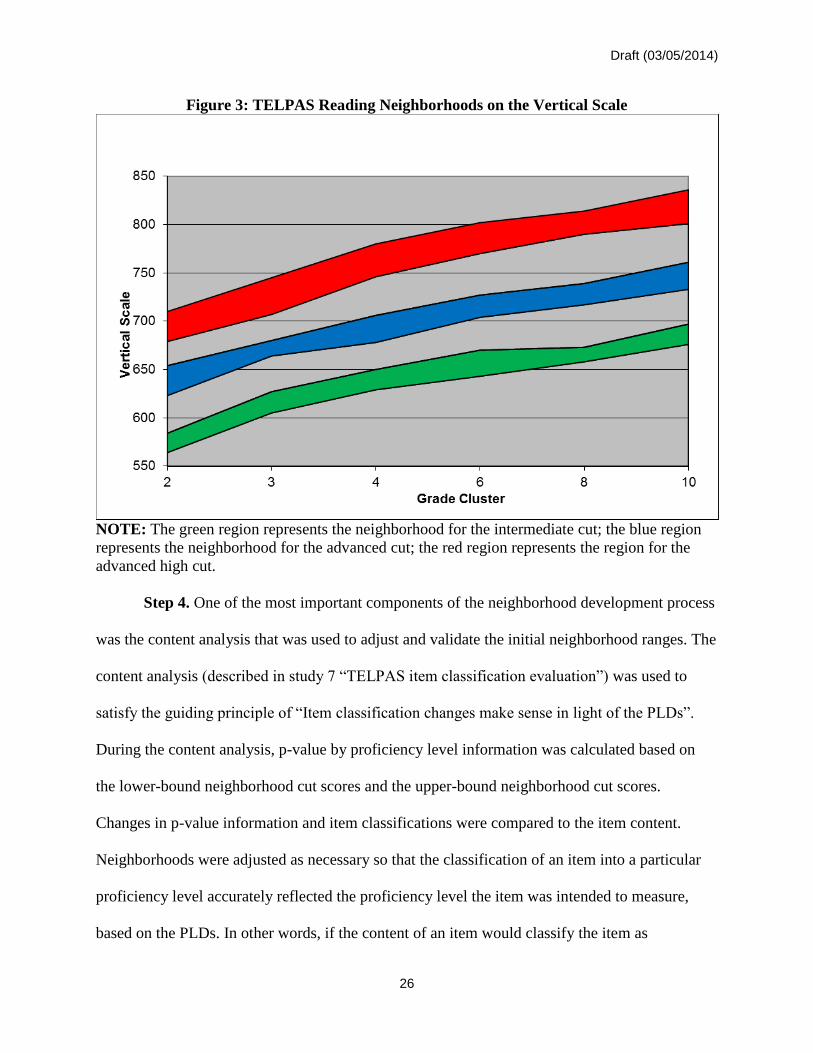
Step 3. TELPAS vertical scale information was also used to evaluate the neighborhoods
across grade clusters. The upper and lower boundaries of the neighborhoods were plotted for
each grade cluster to make sure the neighborhoods appeared reasonable across grades (see Figure
3). There were a couple of places where the vertical scale suggested reconsideration of the
neighborhood ranges. Specifically, the advanced neighborhood for grade 3, and the intermediate
neighborhood for grade 8–9 appeared narrow compared to the neighborhoods for the other grade
clusters. However, based on a content analysis, described next, the neighborhoods were not
adjusted.
Draft (03/05/2014)
26
Figure 3: TELPAS Reading Neighborhoods on the Vertical Scale
NOTE: The green region represents the neighborhood for the intermediate cut; the blue region
represents the neighborhood for the advanced cut; the red region represents the region for the
advanced high cut.
Step 4. One of the most important components of the neighborhood development process
was the content analysis that was used to adjust and validate the initial neighborhood ranges. The
content analysis (described in study 7 “TELPAS item classification evaluation”) was used to
satisfy the guiding principle of “Item classification changes make sense in light of the PLDs”.
During the content analysis, p-value by proficiency level information was calculated based on
the lower-bound neighborhood cut scores and the upper-bound neighborhood cut scores.
Changes in p-value information and item classifications were compared to the item content.
Neighborhoods were adjusted as necessary so that the classification of an item into a particular
proficiency level accurately reflected the proficiency level the item was intended to measure,
based on the PLDs. In other words, if the content of an item would classify the item as
Draft (03/05/2014)
27
intermediate based on the PLDs, the neighborhood was set so that the item would be classified as
intermediate.
Using the guiding principles and the four steps described above, neighborhoods were
obtained. These neighborhoods balanced the in-depth content analysis of TELPAS items with
study information from the other five empirical validity studies (text complexity was not
included in neighborhood development).
The EBSS method works well with a bookmark approach (Lewis, Mitzel, Green, & Patz,
1999). This approach requires panelists to review items sorted by difficulty from easiest to
hardest and to place a bookmark on the page that represents their best judgment about where the
cut score should be set. Often panelists must make a decision for one or more cut scores from all
possible items in the booklet. With the neighborhood approach, the range within which panelists
place their bookmarks can be narrowed to only the region that makes sense based on the
neighborhoods. The number of items within the neighborhoods varies between different
standard-setting meetings based on the quality of information and the amount of flexibility that is
desired for panelist judgments. During the TELPAS standards review some of the
neighborhoods were fairly narrow in terms of raw score range. Items were added to the OIB to
make sure there was a good spread of items across neighborhood regions, but this was balanced
with the goal of including only a few items of similar difficulty so that panelists would not be
frustrated by making large changes in their bookmarked page number without seeing a change in
the actual cut score. Additionally, panelists were informed that they could place their bookmarks
outside of the designated neighborhoods if they could justify doing so.
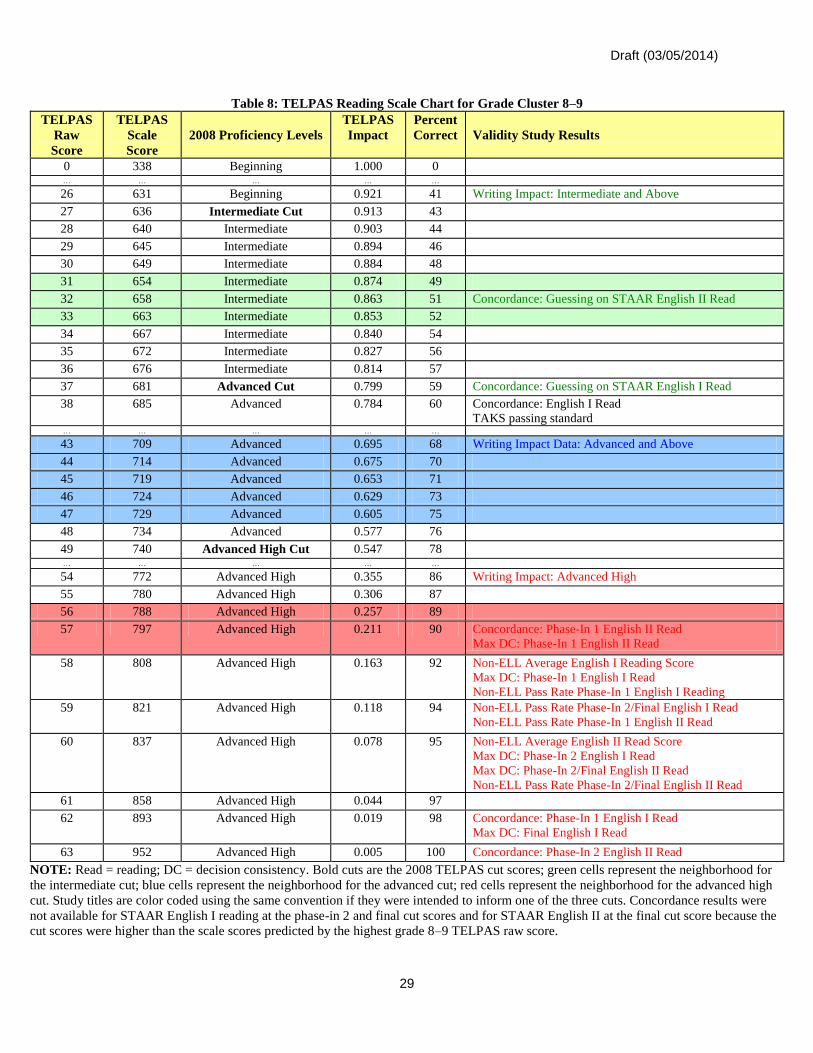
Table 8 provides a raw score to scale score table for the grade 8–9 TELPAS assessment.
The table has been augmented with impact data, percent correct data, and validity study results.
Draft (03/05/2014)
28
The text color of the validity studies indicates which of the standards they were meant to inform.
The colored shading indicates where the neighborhoods fell for the three cut scores.
Draft (03/05/2014)
29
Table 8: TELPAS Reading Scale Chart for Grade Cluster 8–9
TELPAS
Raw
Score
TELPAS
Scale
Score
2008 Proficiency Levels
TELPAS
Impact
Percent
Correct Validity Study Results
0 338 Beginning 1.000 0 … … … … …
26 631 Beginning 0.921 41 Writing Impact: Intermediate and Above
27 636 Intermediate Cut 0.913 43
28 640 Intermediate 0.903 44
29 645 Intermediate 0.894 46
30 649 Intermediate 0.884 48
31 654 Intermediate 0.874 49
32 658 Intermediate 0.863 51 Concordance: Guessing on STAAR English II Read
33 663 Intermediate 0.853 52
34 667 Intermediate 0.840 54
35 672 Intermediate 0.827 56
36 676 Intermediate 0.814 57
37 681 Advanced Cut 0.799 59 Concordance: Guessing on STAAR English I Read
38 685 Advanced 0.784 60 Concordance: English I Read
TAKS passing standard … … … … …
43 709 Advanced 0.695 68 Writing Impact Data: Advanced and Above
44 714 Advanced 0.675 70
45 719 Advanced 0.653 71
46 724 Advanced 0.629 73
47 729 Advanced 0.605 75
48 734 Advanced 0.577 76
49 740 Advanced High Cut 0.547 78 … … … … …
54 772 Advanced High 0.355 86 Writing Impact: Advanced High
55 780 Advanced High 0.306 87
56 788 Advanced High 0.257 89
57 797 Advanced High 0.211 90 Concordance: Phase-In 1 English II Read
Max DC: Phase-In 1 English II Read
58 808 Advanced High 0.163 92 Non-ELL Average English I Reading Score
Max DC: Phase-In 1 English I Read
Non-ELL Pass Rate Phase-In 1 English I Reading
59 821 Advanced High 0.118 94 Non-ELL Pass Rate Phase-In 2/Final English I Read
Non-ELL Pass Rate Phase-In 1 English II Read
60 837 Advanced High 0.078 95 Non-ELL Average English II Read Score
Max DC: Phase-In 2 English I Read
Max DC: Phase-In 2/Final English II Read
Non-ELL Pass Rate Phase-In 2/Final English II Read
61 858 Advanced High 0.044 97
62 893 Advanced High 0.019 98 Concordance: Phase-In 1 English I Read
Max DC: Final English I Read
63 952 Advanced High 0.005 100 Concordance: Phase-In 2 English II Read
NOTE: Read = reading; DC = decision consistency. Bold cuts are the 2008 TELPAS cut scores; green cells represent the neighborhood for
the intermediate cut; blue cells represent the neighborhood for the advanced cut; red cells represent the neighborhood for the advanced high
cut. Study titles are color coded using the same convention if they were intended to inform one of the three cuts. Concordance results were
not available for STAAR English I reading at the phase-in 2 and final cut scores and for STAAR English II at the final cut score because the
cut scores were higher than the scale scores predicted by the highest grade 8–9 TELPAS raw score.
Draft (03/05/2014)
30
Providing Feedback to Panelists
Once the neighborhoods were mapped to the ordered item booklets, flags were placed in
each booklet to identify the items within each neighborhood. Flags were color coded to
differentiate the intermediate, advanced, and advanced high neighborhoods.
Developing neighborhoods and incorporating them into the ordered item booklet is only
part of the many ways that empirical data can be incorporated into the standard-setting meeting
in a meaningful way. Although the information in Table 8 is helpful for evaluating and
visualizing the neighborhoods, it’s still not a particularly user-friendly display of information for
panelists. Clear and concise information is needed in order for study results to be helpful to
panelists in selecting cut scores, rather than overwhelming. For the TELPAS panelists, text
complexity information, impact data (STAAR and TELPAS), and vertical scale information
were presented.
Because of the importance of the text complexity analysis in thinking about the alignment
of TELPAS and STAAR, panelists were informed about the study methods and results. They
were also given a sample of STAAR and TELPAS advanced high reading passages to read and
compare.
Panelists were provided with impact data during the standards review committee meeting.
This occurred both as part of feedback after judgment rounds, and as information during a final
vertical articulation activity where panelists were able to see how the standards aligned across
grade clusters. During the standards review committee meeting, the following impact data were
provided as feedback to panelists:
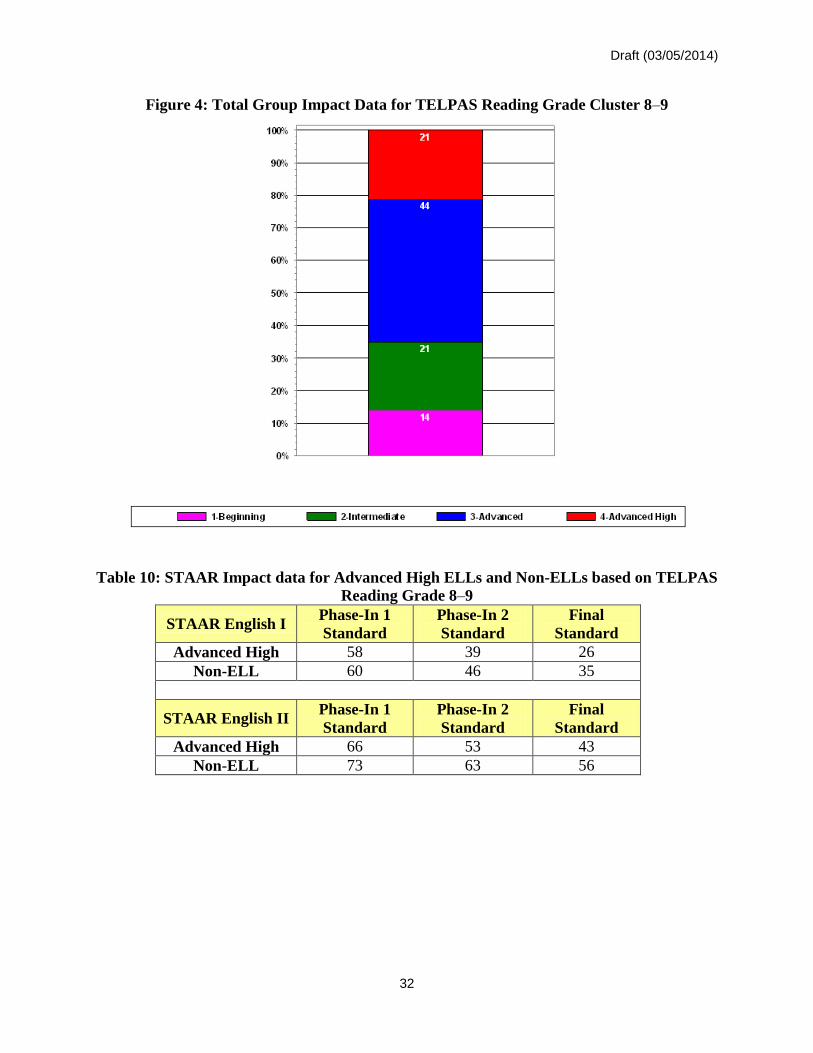
Percentage of students within each TELPAS reading proficiency level, based on cut score
recommendations for a specific grade cluster (see Figure 4)
Draft (03/05/2014)
31
Percentage of advanced high ELLs who would pass STAAR reading the next year, based
on the advanced high cut score recommendation for a particular grade, along with
STAAR reading pass rates for non-ELLs matched on socioeconomic status as a point of
comparison (see Table 10)
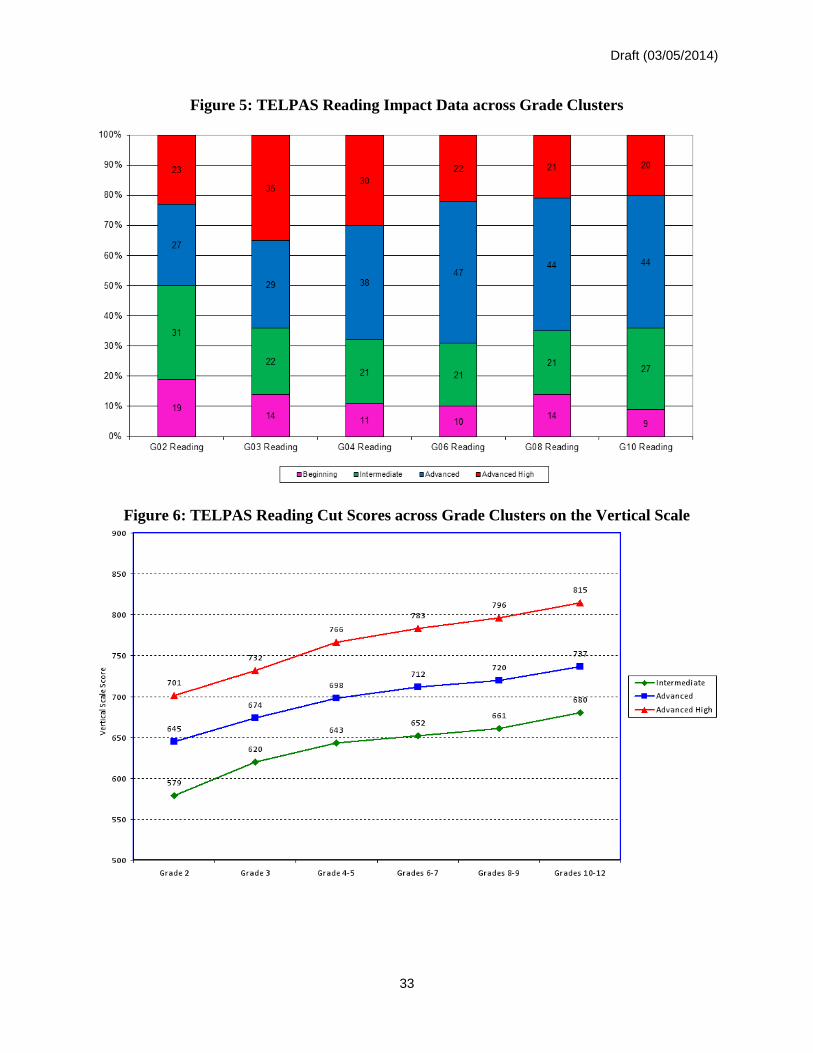
Percentage of students within each TELPAS reading proficiency level, based on the
committee’s recommendations across all grade clusters (see Figure 5)
Impact data were also used after the committee meeting to review and evaluate the
reasonableness of the standards recommended during the standards review committee meeting.
Because TELPAS reading scale scores are on a vertical scale, scores can be compared
from grade to grade. The vertical scale was used to evaluate the alignment of proficiency level
standards across grade clusters during vertical articulation and the reasonableness review (see
Figure 6).
Draft (03/05/2014)
32
Figure 4: Total Group Impact Data for TELPAS Reading Grade Cluster 8–9
Table 10: STAAR Impact data for Advanced High ELLs and Non-ELLs based on TELPAS
Reading Grade 8–9
STAAR English I Phase-In 1
Standard
Phase-In 2
Standard
Final
Standard
Advanced High 58 39 26
Non-ELL 60 46 35
STAAR English II Phase-In 1
Standard
Phase-In 2
Standard
Final
Standard
Advanced High 66 53 43
Non-ELL 73 63 56
Draft (03/05/2014)
33
Figure 5: TELPAS Reading Impact Data across Grade Clusters
Figure 6: TELPAS Reading Cut Scores across Grade Clusters on the Vertical Scale
Draft (03/05/2014)
34
Conducting the Standard-Setting Meeting
Once the steps of defining the outcomes of interest; developing research, data collection,
and analysis plans; and synthesizing research results have been completed, and all the usual
standard-setting preparations have been completed (selecting panelists, developing presentation
materials, printing ordered item booklets, etc.), the standard-setting meeting can be held. Using
an EBSS approach simply augments the typical content-based standard-setting meeting with data
to help inform panelist judgments.
On August 5–7, 2013, standards review committees were convened to recommend cut
points defining the proficiency level standards—specifically, Intermediate, Advanced, and
Advanced High for the six TELPAS reading assessments. The three-day standards review
meetings included sessions in which panelists (1) reviewed the test items and reading passages,
(2) became familiar with the proficiency level descriptors for the assessments, and (3) applied an
item-mapping procedure (Lewis, Mitzel, Green, & Patz, 1999) to set recommended cut points
within reasonable ranges. During the item-mapping procedure, panelists reviewed the content of
the test items, engaged in table and whole-group discussions, and considered the impact of their
cut-score recommendations on students’ proficiency level ratings. Before making
recommendations, the concept of reasonable ranges within which cut scores should fall was
presented to the committees. The reasonable ranges provided panelists with a target area in
which to make their judgments; however, panelists were not required to keep their cut score
recommendations within this range. At the conclusion of the standards review meetings, the
committees recommended a total of eighteen cut scores, three cut scores for each of the six
TELPAS reading assessments.
Draft (03/05/2014)
35
Continuing To Gather Validity Evidence for the Standards
The outcome of interest for TELPAS—namely, that students who score advanced high
should be successful on STAAR reading with an additional year of instruction—can continue to
be evaluated. It is important to continue to collect validity evidence supporting the standards that
are set on any assessment. However, it is especially crucial for TELPAS because the STAAR
passing standard is being phased in over time. As the passing standard increases, the alignment
of TELPAS and STAAR will need to be monitored. If the advanced high cut score fails to meet
the claim that educators and policy makers attribute to that level of performance, then another
standards review may be needed. The types of research, data collection, and analyses used for
the 2013 TELPAS standards review can continue to be used to gather validity evidence in the
future.
Summary and Discussion
The application of the EBSS process to an English language proficiency test expands the
ways in which empirical data can be used during a standard setting. The outcome of interest was
not focused on academic success, but specifically related to English language proficiency. In
order to determine which types of empirical data were most informative a clear definition of
what successful performance on an English language proficiency test should mean for students
had to be outlined. This example clearly linked language proficiency to performance on
academic content area tests but other assessment programs may have other outcomes of interest.
Based on a specific outcome of interest, studies can be developed. While available data
sources drive the types of studies that can be done, research questions that can support the
outcome of interest should be considered foremost when developing empirical studies. The
research questions used in the TELPAS EBSS process targeted expectations for how
Draft (03/05/2014)
36
performance on TELPAS should be related to performance on STAAR. From these research
questions, analysis plans for multiple studies were developed. Each of the studies (text
complexity analysis, comparison of pass rates, comparison of average scale scores, concordance
tables, decision consistency analyses, impact data, and an evaluation of item proficiency-level
classifications) contributed towards answering the research questions and provided validation for
the outcome of interest.
The large amount of information resulting from the studies had to be synthesized in some
way to make the results useful within the standard-setting process. To maximize the usefulness
of the study results, attempts were made to use study information at multiple times (before,
during, and after the meeting). Graphical representations were used frequently to help convey
large amounts of data. Careful consideration was given to the amount of information to share, the
audience reviewing the information (panelists versus the department of education), and how the
information could be used to make more informed decisions about cut score placements.
Once the studies were completed and decisions about how best to share information with
the panelists were made the actual standard setting was fairly straightforward. Information
relevant to the empirical studies was included during panelist training, as part of panelist
feedback between rounds, and during vertical articulation. To maximize panelists’ understanding
of the empirical information, investigation of innovative ways to present data should continue.
Careful use of relevant empirical study data results in more informed panelists and cut-score
recommendations (Williams, Keng, & O’Malley, 2012).
As discussed earlier, it is very important to continue to gather validity evidence for the
standards. Over time the relationships between the outcomes of interest and the research
questions may change. It is beneficial to continue data collection efforts to provide longitudinal
Draft (03/05/2014)
37
information for continuing validation of standards. Standards review planning should be part of
any assessment program.
This work represents a successful generalization of the EBSS process. Prior experience
with incorporating study information into standard settings for academic assessments was used to
extend the types of studies that were used to inform panelist judgments. By including empirical
information as part of an English language proficiency assessment standard setting, the
relationships between English language acquisition and performance on academic assessments
could be incorporated into the standard-setting process.
Draft (03/05/2014)
38
References
Beimers, J. N., Way, W. D., McClarty, K. L., & Miles, J. A. (2012). Evidence based standard
setting: Establishing cut scores by integrating research evidence with expert content
judgments. Pearson Bulletin, January 2012, Issue 21. Retrieved from
www.pearsonassessments.com
Cook, G., Linquanti, R., Chinen, M., & Jung, H. (2012). National evaluation of Title III
implementation supplemental report—exploring approaches to setting English language
proficiency performance criteria and monitoring English learner progress. Retrieved
December 1, 2013 from http://www2.ed.gov/rschstat/eval/title-iii/implementation-
supplemental-report.pdf
Hess, K. & Hervey, S. (2011). Tools for examining text complexity. Retrieved March 5, 2014
from http://nciea.org/publication_PDFs/Updated%20toolkit-
text%20complexity_KH12.pdf
Keng, L., Murphy, D., & Gaertner, M. (2012). Supported by data: A comprehensive approach
for building empirical evidence for standard setting. Paper presented at the annual
meeting of the National Council on Measurement in Education, Vancouver, B.C.
Lewis, D. M., Mitzel, H. C., Green, D. R., & Patz, R. J. (1999). The bookmark standard setting
procedure. Monterey, CA: McGraw-Hill.
McClarty, K. L., Way, W. D., Porter, A. C., Beimers, J. N., & Miles, J. A. (2013). Evidence-
based standard setting: Establishing a validity framework for cut scores. Educational
Researcher, 42(2), 78-88.
O’Malley, K., Keng, L., & Miles, J. (2012). Using validity evidence to set performance
standards. In G. J. Cizek (Ed.), Setting performance standards (2nd ed. pp.301–322).
New York: Routledge.
Student Achievement Partners. (2013). Text complexity: Qualitative measures rubric. Retrieved
March 5, 2014 from http://www.achievethecore.org/ela-literacy-common-core/text-
complexity/qualitative-measures
White, K. R. (1982). The relation between socioeconomic status and academic achievement.
Psychological Bulletin, 91(3), 461-481.
Williams, N.J., Keng, L., & O’Malley, K. (2012). Maximizing panel input: Incorporating
empirical evidence in a way the standard-setting panel will understand. Paper presented
at the annual meeting of the National Council on Measurement in Education, Vancouver,
B.C.