Embed Size (px)
Citation preview

i
An Experimental Study of Liquid Steel Sampling
Ola Ericsson
Licentiate Thesis
Stockholm 2009
Department of Materials Science and Engineering Division of Applied Process Metallurgy
Royal Institute of Technology SE-100 44 Stockholm
Sweden
Akademisk avhandling som med tillstånd av Kungliga Tekniska Högskolan i Stockholm, framlägges för offentlig granskning för avläggande av Teknologie Licentiatexamen, måndagen den 15 juni 2009, kl. 10:00 i K408, Brinellvägen 23, Kungliga Tekniska Högskolan, Stockholm.
ISRN KTH/MSE--09/25--SE+APRMETU/AVH ISBN 978-91-7415-371-2
ii
Ola Ericsson An Experimental Study of Liquid Steel Sampling
KTH School of Industrial Engineering and Management Division of Applied Process Metallurgy Royal Institute of Technology SE-100 44 Stockholm Sweden ISRN KTH/MSE--09/25--SE+APRMETU/AVH ISBN 978-91-7415-371-2
© The Author

iii
"Try not to become a man of success
but rather to become a man of value"
Albert Einstein


v
Abstract
Sampling of liquid steel to control the steel making process is very important in the
steel industry. However, there are numerous types of disposable samplers and no
united standard for sampling. The goal in this study is to investigate the effect of
slag protection type and sample geometry on sampling parameters and sample
homogeneity. Three sample geometries were selected: i) Björneborg ii) Lollipop
with a 6 mm thickness and iii) Lollipop with a 12 mm thickness. These sample
geometries have been tested with two types of slag protection: metal-cap-
protection and argon-protection. The filling velocity and solidification rate of steel
samples have been experimentally measured during plant trials. The sample
homogeneity with respect to total oxygen content and inclusion size distribution
has been determined in different parts of the samples. The study shows that argon-
protected samplers have lower, more even, filling velocities (0.19±0.09 m/s)
compared to metal-cap-protected samplers (1.28±2.23 m/s). The solidification rate
measurements of the different samplers show that the 6 mm thick Lollipop has the
highest solidification rate (99~105 °C/s). Measurements of total oxygen content in
argon-protected samples showed little variation between different zones of the
samples. However, metal-cap-protected samples contained much higher total
oxygen contents. Light optical microscope studies showed that the increase in total
oxygen content was probably caused by entrapment of top slag during sampling.
Furthermore, it was found that the contamination of top slag in the metal samples
increased with a decreased sample weight. Determination of inclusion size
distribution in argon-protected Lollipop samples showed that a larger number of
primary inclusions are found in the top part compared to the middle and the bottom
part of the samples.
Keywords: liquid steel sampling, slag protection, filling velocity, solidification
rate, sample homogeneity.


vii
Acknowledgements I would like to express my gratitude and appreciation to my supervisors Prof. Pär Jönsson and Dr. Andrey Karasev for their encouragement, guidance and support during the project, and a lot of help and fruitful discussions during the writing of this thesis. I also want to thank Prof. Ryo Inoue at Tohoku University for giving me the opportunity to study in Japan. I am grateful to Hans Hägglund at Rescon Electro-Nite for always being available for invaluable discussions and his never-ending enthusiasm. A lot of thanks go to Peter Lager and Jan Lindström at Provac for their support during the project. Many thanks go to Tord Pettersson and the personnel at the ladle station at Outokumpu Stainless for all their help during the plant trials. Thanks to Peter Henningsson, Lars-Ove Wanke and the others at the analysis laboratory at Sandvik Materials Technology for their help during the project. Financial support from VINNOVA, Jernkontoret, Bruksägare C J Yngströms fund and A H Göranssons fund are acknowledged. Thanks to all my colleagues at the department of Materials Science and Engineering. A special thanks to my friends at the division of Applied Process Metallurgy and the other divisions for making me able to enjoy every last minute of work. Thanks to my roommate Zhi Zhang for the Chinese tea and valuable and funny discussions during the project. Finally I would like to thank my family Evy, Kenth and Johanna for always believing in me. A special thought is sent to Rolf Hjerter who stood by me throughout my entire growth to the point where I am today. You are deeply missed.
Ola Ericsson, Stockholm, April 2009


ix
Supplements
The present thesis is based on the following papers:
Supplement 1: “An Experimental Study of Sampling Parameters for
Liquid Steel”
O.T. Ericsson, A.V. Karasev and P.G. Jönsson
Supplement 2: “Homogeneity of Steel Samples”
O.T. Ericsson, A.V. Karasev and P.G. Jönsson
Parts of this work have been presented at the following conference:
“Initital filling conditions of argon protected sampler by temperature
measurements”
O. Ericsson and P. Jönsson
3rd Nordic Conference for Young Scientists, 14-15 May 2008, Helsinki, Finland.
The contributions by the author to the different supplements of the thesis:
1. Literature survey, experimental work, major part of the writing.
2. Literature survey, experimental work, major part of the writing.


xi
1 INTRODUCTION 1
2 EXPERIMENTAL WORK 5
2.1 Sampling procedure of liquid steel 6 2.2 Measurement of filling velocity and solidification rate in steel samples 8 2.3 Analysis of total oxygen content in different samples 10 2.4 Light Optical Microscope observation of slag particles 12 2.5 Determination of inclusion size distribution 12
3 RESULTS AND DISCUSSION 17
3.1 Filling velocity 17 3.2 Solidification rate 20 3.3 Total oxygen content 22 3.4 Slag particles 26 3.5 Inclusion homogeneity in Lollipop samples 28
4 FINAL DISCUSSION 31
5 CONCLUSIONS 33
6 FUTURE WORK 35
7 REFERENCES 37


1
1 Introduction
During steelmaking it is of utmost importance to control the secondary refining
process in order to obtain the most optimum conditions for casting as well as the
optimum material properties for each specific application. Specifically, the
following main parameters need to be controlled during ladle treatment:
1. Temperature
2. Chemical composition of the steel
3. Level of impurities such as S, H, N
4. Inclusion characteristics
The temperature of the melt can be controlled with disposable temperature
probes. The chemical composition, as well as the level of impurities during
different periods of the ladle refining and casting, can be monitored by
determining the composition of steel samples taken from the liquid steel with
disposable samplers. Furthermore, as samples from liquid steel often are used
for determination of inclusion characteristics and process development it is very
important that they are representative of the melt at the steelmaking
temperature1,2. Today, there is no united standard for liquid steel sampling in
different countries and companies. In fact, a large variety of sample geometries
and sampling procedures are available on the market.
Overall, very little fundamental knowledge is presented in the open literature
regarding the influence of sampling parameters, such as dipping depth and
filling velocity, on the final quality of the steel sample. Instead, adjustments of
sampling parameters are based on empirical studies performed at the different
steel plants. It is believed that an increased knowledge regarding filling velocity

2
and solidification rate of different samples could be used to improve sampling of
liquid steel and lead to steel samples of higher quality. Moreover, the
experimentally measured values of filling velocity and solidification rate are
very important for development and validation of mathematical models for
filling and solidification of different sample shapes3.
Recently, Pulse Distribution Analysis (OES-PDA) has been developed for rapid
determination of inclusion characteristics in steel samples1-2,4-7. In order for the
steelmaking community to implement this technique it is necessary to have a
deep understanding of the following two aspects:
• how to design a sampler so that the inclusion population is
homogeneously distributed in the sample and
• how to design a sampler so that only the inclusions that exist at
steelmaking temperatures, are detected in the OES-PDA analysis.
Different sample geometries will influence the fluid flow of melt during
sampling. Depending on the fluid flow, inclusions can be heterogeneously
dispersed in different parts of the sample making it difficult to make an accurate
inclusion characteristic determination. The geometry (thickness and volume) of
the sample will also affect the solidification rate. At steelmaking temperatures,
the inclusions that exist in the melt are called primary inclusions. During
sampling and solidification of the steel sample secondary inclusions can be
formed due to a lower solubility of elements (e.g. oxygen) in the melt. To be
able to follow the steelmaking process and see the effect of process changes, by
analysis of steel samples, it is imperative that only the primary inclusions are
analyzed. In case the steel sample solidifies with a very high solidification rate,
the secondary inclusions can be very small (<1 µm)8. The size of the secondary

3
inclusions in the steel sample is very important for OES-PDA determinations of
inclusion characteristics where the detection limit can be as low as 1 µm.9
The purpose of Supplement 1 is to present results from measurements of
sampling parameters (filling velocity and solidification rate) from plant trials.
The Björneborg and the Lollipop disposable samplers (with 6 mm and 12 mm
thickness) were tested. The Lollipop samples are often used to determine the
overall chemical composition of the steel while the pin of the Björneborg
samples are mostly used for determination of hydrogen. In this study plant trials
were also performed with two different types of slag protection: argon-
protection and metal-cap-protection. The sampler types are further investigated
in Supplement 2 where the homogeneity in the metal samples with respect to
inclusion characteristics (total oxygen content and inclusion size distribution) is
analyzed.


5
2 Experimental Work
The plant trials were carried out at Outokumpu Stainless in Avesta. They
produce stainless steel with special steels as niche. In this study, samples form
three different steel grades denoted with following ASTM standards were
investigated: 304L, 316L and S32304. Typical compositions of these steel
grades are found in Table 1.
Table 1. Typical composition in weight percent of studied steel grades.
The analyses of the steel samples were carried out at Sandvik Materials
Technology in Sandviken and at IMRAM, Tohoku University in Sendai, Japan.
C N Cr Ni Mo
304L 0.02 - 18.2 10.1 -
316L 0.02 - 17.2 10.1 2.1
S32304 0.02 0.1 23 4.8 0.3

6
2.1 Sampling procedure of liquid steel
In order to keep sampling parameters as constant as possible, an automatic
sampling system at the ladle treatment was used. It made it possible to control
the argon gas pressure, dipping depth, dipping time and suction rate during
sampling. All samples were thereby taken using the same conditions. In this
study, two different types of slag protection approaches were used to prevent top
slag from entering the sampler during sampling of liquid steel: argon-protection
and metal-cap-protection. A schematic sketch of the different slag protection
types and samplers are shown in Figure 1.
Figure 1. Schematic sketch of metal-cap-protected (a, c) and argon-protected
(b, d) samplers, and photograph of finished samplers (e).
The sampling system at Outokumpu Stainless is normally used with argon-
protected samplers, but by disconnecting the argon supply from the sampling
lance it functions in the same manner as a metal-cap-protected system. A sketch
Björneborg Lollipop Björneborg
Argon
Argon
Metal cap Metal cap

7
of the sampling system and sampling location is shown in Figure 2. The
sampling lance has two sensors. The first one raises the lance in case the
sampler falls off. The other detects the bath level of the molten steel, which
makes the lance stop at the desired dipping depth.
Figure 2. Sketch of sampling of liquid steel during ladle treatment.
The procedure for argon-protected sampling in this study is as follows: first the
argon flow (argon pressure 2~3 bar) is started and air is flushed from the lance.
Then the lance moves down with a constant velocity of ~0.5 m/s and stop
shortly after it has reached the desired dipping depth (0.30~0.45 m). After
stopping, the argon flow is shut off and the gas is sucked out (suction pressure
~0.5 bar) from the lance. When the dipping time (~3 s) is reached the lance is
raised and returns to the starting position. In case metal-cap-protected samplers
were used, the argon supply was disconnected from the lance. All other settings
remained the same.
Sampling lance
Top slag
Dipping depth 30~45 cm
Disposable sampler
Melt

8
2.2 Measurement of filling velocity and solidification rate in steel
samples
To measure filling velocity and solidification rate thermocouples (type B) were
mounted into standard samplers. The Björneborg, Lollipop with 6 mm thickness
(LP-6) and Lollipop with 12 mm thickness (LP-12) samplers were used. The
experiments are summarized in Table 2.
Table 2. Measurement of filling velocity and solidification rate in the different
types of samplers in this study.
To be able to read the signals from the thermocouples, the sampling lance was
modified with an electric connector block. From the connector block copper
wires were drawn to the measuring instrument. Depending on the measurement
purpose (filling velocity or solidification rate) the thermocouples were placed at
different positions in the samplers. Schematic locations of the thermocouples are
shown in Figure 3. For velocity measurements (Björneborg and LP-12), two
thermocouples were used in each mold. Only one thermocouple in every mold
was used to measure the solidification rate. The Lollipop samplers were
constructed as double Lollipop samplers, containing one LP-6 mold and one LP-
12 mold in each sampler.
LP-6 LP-12 BB
Measurement AP MCP AP MCP AP MCP
Filling velocity + + + +
Solidification rate + + + + + +
AP = argon-protected, MCP = metal-cap-protected, + = Measured
LP-6 = 6 mm thick Lollipop, LP-12 = 12 mm thick Lollipop, BB = Björneborg

9
Figure 3. Location of thermocouples in the molds and sketch of filled samples.
The samplers were manufactured, as much as possible, in the same way as the
standard production samplers as to resemble normal sampling conditions.
Thermocouple wires of type B (Pt-30%Rh/Pt-6%Rh) with a diameter of 0.35
mm were cut in suitable lengths for connection to an electrical socket. One end
of the thermocouple was welded together. The thermocouples were mounted
into one of the mold halves. A quartz tube was placed between the two mold
halves. Thereafter, it was baked into sand. The sand body was placed into a
paper sleeve and on the end of the paper sleeve a fibrous non-splash layer was
attached. Metal caps where glued over the inlet for the metal-cap-protected
samplers, one small at the Björneborg sampler and one small for each quartz
tube in the double Lollipop sampler. A large metal cap covering both inlets
Björneborg Lollipop
Björneborg LP-6 LP-12

10
where added to the double Lollipop samplers. An illustration of the finished
samplers is shown in Figure 1.
The measuring instrument was connected to a 50 Hz filter next to the ladle
furnace to avoid electrical noise from the power grid. Then, the wires from the
modified sampling lance were attached to two different channels. When
sampling for solidification rate measurement, a temperature measurement
(Positherm by Heraeus Electro-Nite10) was made directly before sampling.
Otherwise, only one temperature measurement per sampling sequence was done.
2.3 Analysis of total oxygen content in different samples
An analysis of the total oxygen content in the different zones of the metal
sample provides a rough estimation of the homogeneity of oxidic inclusions.
Therefore, the body and the pin part of Björneborg and Lollipop samples were
cut into small sections and analyzed with the melt extraction method. Total
oxygen determinations were made on samples from a total of three melts of the
S32304 steel grade, taken both with argon-protection and metal-cap-protection.
See Table 3 for a summary of the studied sample types.
Table 3. Total oxygen analysis on samples from plant trials.
LP-6 LP-12 BB
Analysis AP MCP AP MCP AP MCP
Total oxygen content
-body + + + + + +
-pin + + + + + +
-inlet + +
AP = argon-protected, MCP = metal-cap-protected, + = Measured
LP-6 = 6 mm thick Lollipop, LP-12 = 12 mm thick Lollipop, BB = Björneborg
11
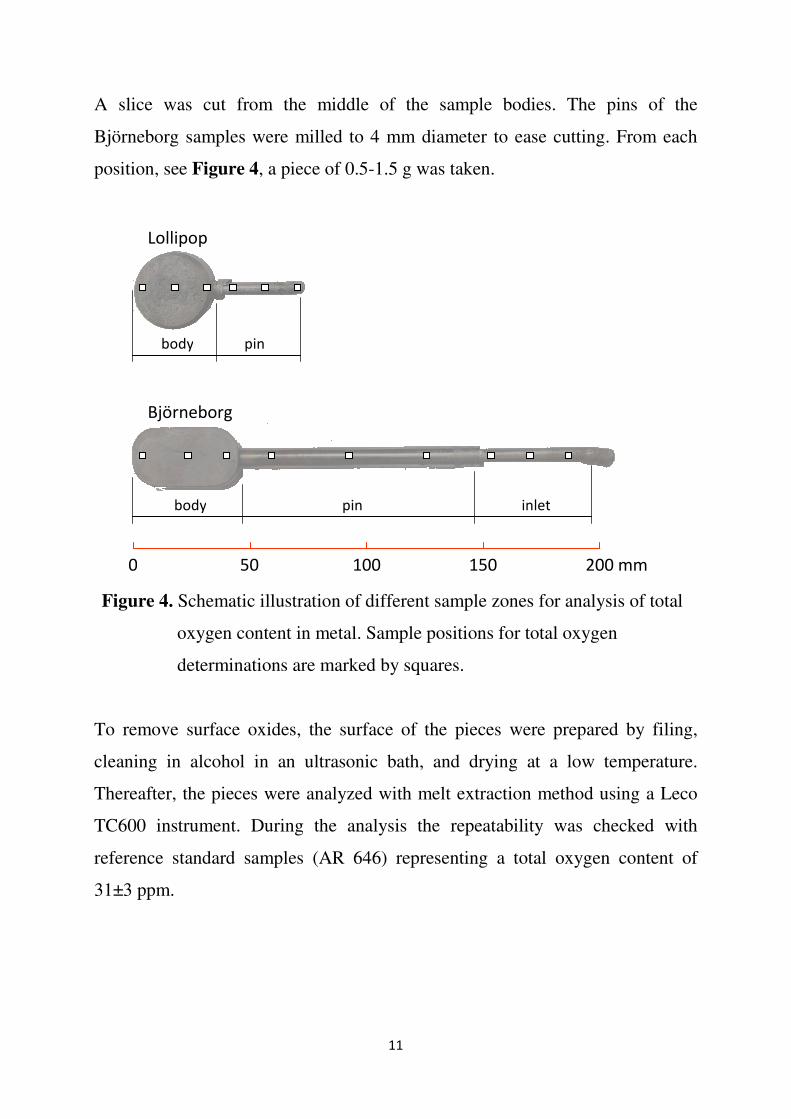
A slice was cut from the middle of the sample bodies. The pins of the
Björneborg samples were milled to 4 mm diameter to ease cutting. From each
position, see Figure 4, a piece of 0.5-1.5 g was taken.
Figure 4. Schematic illustration of different sample zones for analysis of total
oxygen content in metal. Sample positions for total oxygen
determinations are marked by squares.
To remove surface oxides, the surface of the pieces were prepared by filing,
cleaning in alcohol in an ultrasonic bath, and drying at a low temperature.
Thereafter, the pieces were analyzed with melt extraction method using a Leco
TC600 instrument. During the analysis the repeatability was checked with
reference standard samples (AR 646) representing a total oxygen content of
31±3 ppm.
Lollipop
body pin
body pin inlet
Björneborg
0 50 100 150 200 mm

12
2.4 Light Optical Microscope observations of slag particles
After cutting pieces for total oxygen analysis one of the metal-cap-protected LP-
6 samples was cut in the middle. This resulted in a top and bottom part. The
vertical cross- section of the top part was ground, polished and used for
observation of slag particles using a Light Optical Microscope.
2.5 Determination of inclusion size distribution
Samples for determination of homogeneity of primary inclusions were taken at
the end of the ladle treatment for a 316L stainless steel grade. A double Lollipop
sampler (one LP-6 and one LP-12) was stored in a drying oven for 24 hours
before sampling to minimize the moist content and reoxidation of the melt
during sampling. In Table 4 the sample types used for determination of
inclusion size distribution are listed. Pieces approximately 12×8×5 mm (l×w×d)
were cut from the top, middle and bottom parts of the 6 mm and 12 mm
Lollipop samples, as illustrated in Figure 5.
Table 4. Sample types for electrolytic extraction.
LP-6 LP-12 BB
Analysis AP MCP AP MCP AP MCP
Inclusion size distribution
< 0.5 µm + +
> 0.8 µm + +
AP = argon-protected, MCP = metal-cap-protected, + = Measured
LP-6 = 6 mm thick Lollipop, LP-12 = 12 mm thick Lollipop, BB = Björneborg

13
Figure 5. Schematic illustration of different zones in Lollipop samples for
electrolytic extraction and analysis of inclusion size distribution.
The pieces were ground with a fine grinding machine to remove possible oxides
and defects on the surface. After grinding, the pieces were put in acetone and
cleaned in an ultrasonic bath.
A sketch of the equipment used for galvanostatic electrolytic extraction and
filtration is shown in Figure 6. The steel contained high amounts of chromium
and Ca-Si-Al-Mg-O inclusions. Previous research11 has shown that for these
conditions the 10%AA solution is suitable. It consists of 1 w/v%
tetramethylammonium chloride, 10 v/v% acetyl acetone and methanol. For
extraction of small size inclusions, it was found that 150 Coulombs was suitable.
For large size inclusions 600 Coulombs was found to be more appropriate.
middle
bottom
LP-6
LP-12
top
14
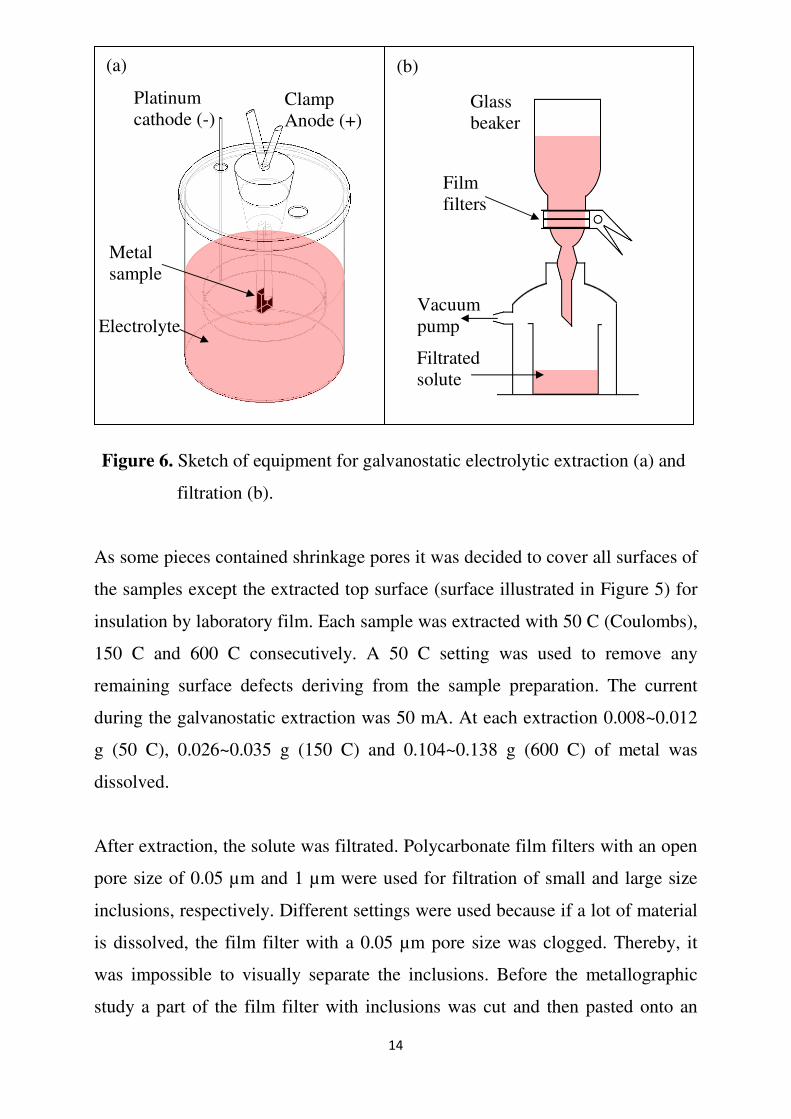
Figure 6. Sketch of equipment for galvanostatic electrolytic extraction (a) and
filtration (b).
As some pieces contained shrinkage pores it was decided to cover all surfaces of
the samples except the extracted top surface (surface illustrated in Figure 5) for
insulation by laboratory film. Each sample was extracted with 50 C (Coulombs),
150 C and 600 C consecutively. A 50 C setting was used to remove any
remaining surface defects deriving from the sample preparation. The current
during the galvanostatic extraction was 50 mA. At each extraction 0.008~0.012
g (50 C), 0.026~0.035 g (150 C) and 0.104~0.138 g (600 C) of metal was
dissolved.
After extraction, the solute was filtrated. Polycarbonate film filters with an open
pore size of 0.05 µm and 1 µm were used for filtration of small and large size
inclusions, respectively. Different settings were used because if a lot of material
is dissolved, the film filter with a 0.05 µm pore size was clogged. Thereby, it
was impossible to visually separate the inclusions. Before the metallographic
study a part of the film filter with inclusions was cut and then pasted onto an
Platinum cathode (-)
Clamp Anode (+)
Metal sample
Electrolyte
Glass beaker
Film filters
Vacuum pump
Filtrated solute
(a) (b)
15
aluminum holder with graphite tape. Thereafter, the sample was coated with Pt
before the Scanning Electron Microscope (SEM) studies.
At first, the homogeneity of inclusion dispersion on film filter was checked
visually by comparing the center, middle and outer areas using SEM. The
inclusion size distribution was determined with a magnification of x5000 for the
0.05 µm film filter and a magnification of x1000 for the 1 µm film filter. On
each film filter 20 views were photographed (divided into two areas of the
filter). The inclusions on each view were copied on paper and analyzed with an
image analyzer to obtain the equivalent circle diameter of the inclusions (dv),
which in this study is referred to as the inclusion size. After analysis, they were
separated into classes with a 0.1 µm size interval. A qualitative analysis of
inclusion composition was determined with Energy Dispersive Spectroscopy
(EDS). Finally, the number of inclusions per volume unit (Nv) was calculated
according to Equation 1.
�� = � ��
���
�
� � (1)
where n is the number of inclusions in the size interval, �� is the filter area with
inclusions (~1245 mm2), ���� is the total observed area (~0.2 mm2 for x1000
and ~0.01 mm2 for x5000), �� is the density of the metal (density for iron was
used=0.0078 g/mm3) and ���� is the weight of the dissolved metal during
extraction.


3 Results and Discussion
First, the experimentally measured
the plant trials will be discussed. Thereafter, the homogeneity
total oxygen and inclusion characteristics in
detail.
3.1 Filling velocity
In order to optimize sampling conditions the filling velocity in
protected and metal-cap
measured, see Table 2. The thermocouples in both sampler types where placed
as shown in Figure 3. Figure 7
sampling of liquid steel by LP
Figure 7. Typical time-temperature profile measured in 12 mm
sampler with argon
Tem
per
atu
re [
°C]
17
Results and Discussion
the experimentally measured filling velocity and solidification rate
the plant trials will be discussed. Thereafter, the homogeneity
total oxygen and inclusion characteristics in steel samples will be
In order to optimize sampling conditions the filling velocity in
cap-protected Lollipop and Björneborg sample
The thermocouples in both sampler types where placed
Figure 7 shows a typical time-temperature profile during
sampling of liquid steel by LP-12 sampler with argon-protection.
temperature profile measured in 12 mm
with argon-protection.
Time [s]
filling velocity and solidification rate during
the plant trials will be discussed. Thereafter, the homogeneity with respect to
steel samples will be discussed in
In order to optimize sampling conditions the filling velocity in both argon-
Lollipop and Björneborg samplers were
The thermocouples in both sampler types where placed
temperature profile during
protection.
temperature profile measured in 12 mm thick Lollipop

18
The data from both the lower and upper thermocouples are plotted in the same
diagram. By using this data, the experimental filling velocity, ����, in the pin
part of the sampler was determined using Equation 2.
���� = ∆��
∆ (2)
where ∆�� is the distance between the two thermocouples and ∆t is the time
difference between the response of the lower and upper thermocouple. Table 5
summarizes the measured filling velocities.
Table 5. Experimental values of filling velocity in different samplers.
Measurement No. Sample Slag protection Zone of sampler Average velocity [m/s]
1 BB AP Body 0.26
2 BB AP Body 0.11
3 BB AP Body 0.12
4 BB AP Body 0.12
5 BB AP Mean of pin 0.23
6 BB AP Mean of pin 0.32
7 BB AP Mean of pin 0.24
8 BB AP Bottom of pin 0.29
9 BB AP Bottom of pin 0.28
10 BB AP Middle of pin 0.48
11 BB AP Middle of pin 0.33
12 BB AP Top of pin 0.34
13 BB AP Top of pin 0.50
14 BB AP Top of pin 0.71
15 BB MCP Body 0.24
16 BB MCP Body 6.00
17 BB MCP Body 0.37
18 BB MCP Mean of pin 0.56
19 BB MCP Bottom of pin 0.38
20 BB MCP Bottom of pin 0.18
21 BB MCP Bottom of pin 0.52
22 LP-12 MCP Body 0.59
23 LP-12 MCP Body 0.39
24 LP-12 MCP Body 0.08
25 LP-12 AP Body 0.16
26 LP-12 AP Body 0.21
27 LP-12 AP Body 0.35
AP = argon-protected, MCP = metal-cap-protected
LP-12 = 12 mm thick Lollipop, BB = Björneborg

19
The mean values of the filling velocities in the body part of the samplers
together with their minimum and maximum values are shown in Figure 8.
Figure 8. Filling velocity of body part for different samples and types of slag
protection. (BB = Björneborg, LP-12 = 12 mm thick Lollipop,
AP = argon-protection, MCP=metal-cap-protection)
In Figure 8 it is clear that argon-protected samplers have much higher
reproducibility regarding filling velocity. It is also seen that the difference
between argon-protected LP-12 and Björneborg is not so big. This means that it
is easier to predict filling times for argon-protected samplers. A possible
explanation for the high value of the metal-cap-protected Björneborg sampler (6
m/s) can be a sudden decrease in pressure inside the mold. During immersion
the gas inside the mold expands and the pressure increases. If a gap suddenly
opens in the top part of the mold the gas can rapidly flow into the lance where
the pressure is lower. As a result, the melt is rapidly sucked into the mold. The
total filling time, !"#, can be estimated according to Equation 3.
!"# = $%
& (3)
where $% is the total sample volume [m3] and Q is the volumetric flow rate
[m3/s].
0
1
2
3
4
5
6
7
BB MCP BB AP LP-12 MCP LP-12 AP
Ve
loci
ty [
m/s
]

20
A filling velocity of 0.2-0.6 m/s in the pin results in filling times of: 1.3-0.4 s for
LP-6, 2.2-0.7 s for LP-12 and 2.1-0.7 s for Björneborg. A dipping time of ~3 s
were used in the plant trials. The experimentally calculated filling times are
lower than the empirical value used as dipping time at the steel plant. This is
understandable since the dipping time has been developed to give as many filled
samples as possible. A more detailed discussion about the filling velocity can be
found in Supplement 1.
3.2 Solidification rate
A typical time-temperature profile of a Björneborg sample taken from a 304L
melt is shown in Figure 9.
Figure 9. Typical time-temperature profile for Björneborg sampler.
In Figure 9 it can be seen that the temperature reaches a maximum value at the
liquidus temperature and not the melt temperature. If this is correct or not is not
known at this stage of the project. It may be due to cooling during filling or slow
response of the thermocouple.
t��(
t)

21
In this study, an estimation of the solidification rate, r, was calculated according
to Equation 4.
r = ,�-./0,�.
1�.012 (4)
where T�4(1 is the measured temperature of the melt in the ladle, T��( is the
solidus temperature for the given steel grade, t��( is the time when the
thermocouple reaches the solidus temperature and t) is the time when the melt
reaches the thermocouple, as shown in Figure 9.
For some reason the measured temperatures did not reach the solidus
temperature in all cases. This makes it impossible to use Equation 4 to calculate
the solidification rate. Instead, a normalized solidification rate, r5, was used in
this study. Using Equation 5 and Equation 6 to calculate r5, the assumption is
made that the maximum registered temperature was too low and in reality
should be approximately the same as the liquidus temperature.
r5 = ,�-./0,�.
17012 (5)
τ = T�9: − <T(�= − T��(> (6)
where T�9: is the maximum temperature registered by the thermocouple and t?
is the time where the thermocouple reaches a temperature of T = τ.
In the case when the maximum temperature and liquidus temperature are the
same then r give the same result as r5. The estimated solidification rate and
solidification time for the different samples are summarized in Table 6.

22
Table 6. Solidification rate and solidification time of steel samples.
It can be seen that the Björneborg and the LP-12 samples have approximately
the same solidification rate (45~55 °C/s) and solidification time (2.3~2.9 s) for a
S32304 steel grade. The solidification rate in a 304L grade for a Björneborg
sample was 21~23 °C/s and solidification time was 4~4.5 s. The LP-6
measurements were all below liquidus, forcing the use of Equation 5. The LP-6
sample solidifies with a rate of 99~105 °C/s within 0.9~1.3 s for 304L and
S32304 steel grades. Unfortunately, no measurements with LP-12 were
successful on a 304L steel grade. However, since the Björneborg and the LP-12
samples have almost the same thickness in the body part, it is reasonable that the
solidification rates are close to each other. The solidification rate and
solidification time is measured where it is believed that the last solidified melt
exist in the sample. The inlet part of the samples will probably solidify in less
time. Thus, the solidification time in the body part can be longer than the
dipping time (~3 s).
3.3 Total oxygen content
The total oxygen content in different zones of the Björneborg and Lollipop
samples were determined using melt extraction method. It was found that the
last part of the pin in all samples contained very high amounts of total oxygen.
This is probably an effect of slag entrapment and/or reoxidation during
Mold Steel grade Thickness [mm] Weight [g]
Solidification
rate [°C/s]
Solidification
time [s]
Solidification
rate [°C/s]
Solidification
time [s]
LP-6 S32304 6 40 - - 99 1.3
LP-12 S32304 12 80 55 2.3 45 2.9
BB S32304 14 170 53 2.5 46 2.9
LP-6 304L 6 40 - - 105 0.9
LP-12 304L 12 80 - - - -
BB 304L 14 170 23 4.0 21 4.5
LP-6 = 6 mm thick Lollipop, LP-12 = 12 mm thick Lollipop, BB = Björneborg
r rn

23
withdrawal of the sampler from the melt. Therefore, that part is excluded from
the following results. An overall comparison of the total oxygen in samples
depending on slag protection systems is made in Figure 10 by comparing the
average total oxygen for different samplers. The horizontal axis in Figure 10
shows the different sample types and their respective weights. The vertical axis
shows the average difference between the total oxygen content in each zone of
the sample and the lowest total oxygen content found in the entire sample. This
value is used instead of average total oxygen content in the samples because
each melt differs a little bit with respect to the total oxygen content. The error
bars show standard deviation of the total oxygen determinations.
Figure 10. Total oxygen content in metal-cap and argon-protected Lollipop and
Björneborg samples.
It can be seen that the argon-protected samples show almost the same level for
all sample types (dark grey area). However, the metal-cap-protected samples
(light grey area) show very high total oxygen contents. Moreover, the total
oxygen content decreases as the sample weight increases. In general, the high
total oxygen contents may be explained by top slag which is entrapped in the
sample during sampler filling. This phenomenon is further analyzed by looking
-20
0
20
40
60
80
100
120
O(i
)-O
(min
)
(ppm
)
LP-6(40)
LP-12(80)
BB(160)
Sample :Weight, g:
without Ar
with Ar
O(i
)-O
(min
) [p
pm
]

24
at the total oxygen content in the different zones of the samples, as shown in
Figure 11 for Lollipop samples and Figure 12 for Björneborg.
Figure 11. Total oxygen content in different zones of LP-12 (a) and LP-6 (b).
The light grey and dark grey areas in these figures correspond to the standard
deviation of total oxygen content for metal-cap-protected and argon-protected
samples, respectively. As seen, the total oxygen content in the body part of the
metal-cap-protected LP-6 samples is higher than in the metal-cap-protected LP-
12 samples. The volume of the LP-6 sample is about half of the LP-12 sample.
If the top slag is assumed to be the cause of the high total oxygen content it
probably freezes onto the metal cap during immersion of the sampler. Since the
LP-6 sample and LP-12 sample come from the same sampler, it can be assumed
that the same amount of top slag is entrapped in both samples. Thus, the lower
total oxygen content in the LP-12 can be explained by a higher metal to slag
ratio. This is further supported by the results from the Björneborg samples in
Figure 12.
0
50
100
150
0 10 20 30 40 50 60 70
O(i
)-O
(min
)
(pp
m)
Distance from sample top (mm)
LP-12 sample
Body
Pin
0
50
100
150
O(i
)-O
(min
) (p
pm
)
LP-6 sample
Body
Pin
Slag protection:- without Ar,- with Ar
0
0 10 20 30 40 50 60 70
Distance from sample top (mm)
(a) (b) Slag protection:- without Ar,- with Ar
O(i
)-O
(min
) [p
pm
]
O(i
)-O
(min
) [p
pm
]
[mm] [mm]

25
Figure 12. Total oxygen content in different zones of Björneborg sample.
The Björneborg samples show the smallest difference in total oxygen content
between argon-protected and metal-cap-protected samplers. The later part of the
pin part show almost the same total oxygen content for both types of slag
protection. Judging from the results from the LP-6, LP-12 and Björneborg, it is
probable that top slag freezes on the metal cap. When the metal cap melts during
sampling, the top slag is mixed into the melt that fills the sample. The melt that
enters first contains most slag and end up in the top of the sample body. As a
result, the pin part and the inlet part show lower total oxygen content than the
body part.
Overall, this information shows that it is very difficult to get a realistic result of
the total oxygen content with metal-cap-protected samples. Even if the analyzed
value is within the expected ppm-range small particles from the top slag could
be present. More homogenous and reliable results are obtained by using argon-
protected samples. This is especially critical for Lollipop samples with a lower
sample weight. Therefore, it can be concluded that argon-protected sampling is
better than metal-cap-protected sampling when the steel samples should be used
for determination of the total oxygen content. In this case, the dispersion of O(i)-
O(min) values in argon-protected samples are usually lower than 10 ppm.
0
10
20
30
40
50
60
0 50 100 150 200
O(i
)-O
(min
) (p
pm
)
Distance from sample top (mm)
Slag protection:- without Ar,- with Ar
Body
Pin Inlet
BB sample
O(i
)-O
(min
) [p
pm
]
[mm]

26
3.4 Slag particles
The big difference in total oxygen content between argon-protected and metal-
cap-protected samplers is probably due to slag entrapment. Some reoxidation
can occur for metal-cap-protected samplers because of the air in the sampler.
But this cannot explain such large difference of total oxygen content in different
zones of metal sample. Figure 13 show typical photographs of the surface on
LP-6 samples taken with metal-cap-protection (a) and argon-protection (b).
Figure 13. Typical photographs of surface for LP-6 samples with metal-cap-
protection (a) and argon-protection (b).
The dark areas in the metal-cap-protected sample were believed to be entrapped
top slag. To validate that slag caused these high total oxygen contents, a vertical
slice of one metal-cap-protected LP-6 sample was examined in Light Optical
Microscope. In most parts of the sample dark particles could be seen, both
spherical particles (Figure 14 (a)) up to almost 400 µm in diameter and large
irregular shaped particles (Figure 14 (b)).
(b) (a)
20 mm

27
Figure 14. Typical photographs of spherical (a) and irregular shaped (b) slag
particles in metal-cap-protected LP-6 sample.
These particles probably originate from the top slag due to their large size. As
seen from the high total oxygen contents measured in the top part of the metal-
cap-protected samples in section 3.3, particles of this size significantly affect the
total oxygen content in the sample. Future SEM-EDS studies should be
performed to validate that the composition of the particles correspond to the top
slag.
(a) (b)

28
3.5 Inclusion homogeneity in Lollipop samples
According to analysis of small and large size inclusions on film filters after
electrolytic extraction, it was found that the inclusion size distribution had two
peaks. As shown in Figure 15 the peak in Figure 15 (a) corresponded to primary
inclusions and the peak in Figure 15 (b) to secondary inclusions. The primary
inclusions consisted mainly of Ca-Al-Si-Mg-O. The secondary inclusions were
found to consist mainly of Al-O and Ti-O. In addition, some inclusions also
contained small amounts of Mg, Cr and Fe.
Figure 15. Example on inclusion size distribution of primary inclusions (a) and
secondary inclusions (b) in Lollipop samples.
The inclusions were roughly divided into primary (dv > 0.8 µm) and secondary
(dv > 0.5 µm). The total number of primary inclusions per unit volume is plotted
for different zones of Lollipop samples in Figure 16 (a). This diagram shows
that the top part of both LP-6 and the LP-12 contains more inclusions than the
middle and bottom part, where the results are quite close to each other. Since
there was little difference in diameter this may imply that larger inclusions is
pushed toward the top by the fluid flow but that there is not much agglomeration
within this size range. The volume fraction of primary inclusions in the top part
0 100
2 103
4 103
6 103
8 103
1 104
N (m
m )
V-3
(a)
0
5 106
1 107
1.5 107
0 1 2 3
d ( m)V µ
N
(mm
)
V-3
(b)
0 1 2 3
d ( m)V µ
(a) (b)
[m
m-3
]
[m
m-3
]
[µm] [µm]

29
is also larger than that in the middle and bottom part of samples, as shown in
Figure 16 (b).
Figure 16. Total number per volume unit (a) and volume fraction (b) of
primary inclusions in different zones of Lollipop samples.
0
2 104
4 104
6 104
Analyzed zones of sample
top middle bottom
LP-6
LP-12
d > 0.8 mµV
To
tal
N
(mm
)
V-3
0 100
1 10-4
2 10-4
Analyzed zones of sample
top middle bottom
LP-6
LP-12
d > 0.8 mV µ
f V
(a) (b)
[m
m-3
]


31
4 Final Discussion
This study can hopefully be used as a general guideline for sampling of liquid
steel. In Supplement 1 it has been shown that the filling velocity and filling time
highly depend on the type of slag protection. The reproducibility for argon-
protected samplers is much higher, making it easier to find a suitable dipping
time for each type of sampler. As mentioned in the experimental work, the
samplers in this study have molds that are baked into sand. Some pressure was
built up in the mold, but the gas was ventilated from the mold after a while. The
choice of material in the sampler may very well influence the sample quality
negatively if it is too tight. First, it must be porous enough to provide an argon
flow that is able to push the top slag away. Second, it must be porous enough to
let the air or argon to be evacuated from the mold, making it possible for the
melt to fill the sample. A study of different argon-protected samplers may be
needed to investigate this effect.
The homogeneity with respect to inclusion characteristics, e.g. total oxygen and
inclusion size distribution, in the metal sample was studied in Supplement 2.
With respect to the results, argon-protected samplers are recommended since
metal-cap-protected samplers are contaminated by top slag. The top slag
increases the total oxygen content to a large degree, especially in Lollipop
samples because they have a small sample volume. The Björneborg samples are
not affected as much and it might be possible to use the pin part for total oxygen
determination. However, when the determined value of the total oxygen content
is trustworthy low for the steel grade in question, the metal-cap-protected
samples can still be contaminated by top slag. As a result, the increase in total
oxygen content is small and the value might be taken as true. To minimize the

32
risk for misinterpreted total oxygen content determinations, argon-protected-
sampling is recommended in all cases.
The inclusion size distribution in different parts of argon-protected Lollipop
samples was determined in Supplement 2. No clear difference could be seen
between the two thicknesses. Both the 6 mm thick and the 12 mm thick Lollipop
sample contained a larger number of primary inclusions in the top part of the
sample compared to the middle and bottom part. In Supplement 1 it was found
that the solidification rate of the 6 mm thick Lollipop sample was about twice as
high as for the 12 mm thick Lollipop sample. This does not seem to influence
the homogeneity of primary inclusions on the surface of the sample. Further
studies should be made to determine the inclusion size distribution at different
depths of the sample. Since the sample solidifies from the surface and into the
middle it is quite possible that the solidification rate has a larger effect on the
homogeneity in that direction.
Overall, the argon-protected 6 mm thick Lollipop sample can be recommended
for determination of both total oxygen content and inclusion size distribution.
For practical reasons, it is best to use the pin part of the sample for total oxygen
determination. However, it is very important that the sample preparation is made
thoroughly. Often there are pits of varying size on the surface and these must be
removed. Since the number of inclusions is larger in the top part of the sample it
may be recommended to determine the inclusion size distribution in that part of
the sample to obtain a worst case scenario.

33
5 Conclusions
Filling velocity and solidification rate have been measured for argon-protected
and metal-cap-protected samplers of the following types: Björneborg, Lollipop
with 6 mm thickness and Lollipop with 12 mm thickness. Homogeneity with
respect to total oxygen content and primary inclusions in different samplers and
sampling systems has been studied. From these results the following conclusions
can be made:
1) The filling velocity of sampler for liquid steel is mostly dependent on the slag
protection system. Argon-protected-sampling has a lower filling velocity
(0.19±0.09 m/s) and higher reproducibility than metal-cap-protected sampling
(1.28±2.23 m/s)
2) The difference in filling velocity between sampler geometries is not as large
as between sampling systems. The filling velocity in the body of argon-protected
Björneborg sampler is 0.15±0.07 m/s and in 12 mm thick Lollipop sampler
0.24±0.10 m/s.
3) The filling velocity seems to increase during filling of the sampler. The filling
velocity of a Björneborg sampler increases from 0.28~0.29 m/s in the bottom
part of the pin to 0.34~0.71 m/s in the top part of the pin. During filling of the
sample body the measured velocity was in the range of 0.11~0.26 m/s, which
correspond to a filling velocity in the pin part of 0.06~0.12 m/s.
34
4) The solidification rate for the different samplers was found to be as follows
(with solidification time in parenthesis): 21~53 °C/s for Björneborg (2.9~4.5 s),
45~55 °C/s for 12 mm Lollipop (2.3~2.9 s) and 99~105 °C/s for 6 mm Lollipop
(0.9~2.9 s).
5) Metal-cap-protected samplers are polluted by top slag which affects the total
oxygen content to a large degree and becomes more severe as the sample
volume decreases.
6) Regarding Lollipop samplers it is crucial to use argon-protection to obtain a
representative sample while metal-cap-protected Björneborg samples can
perhaps be used but with high caution.
7) The surface of the top part of both argon-protected 6 mm thick Lollipop and
12 mm thick Lollipop contained higher amounts of primary inclusions than the
middle and bottom part.

35
6 Future Work
In some cases, more filling velocity and solidification rate measurements should
be done since the amount of successful measurements are low. The solidification
structure in the samples may be analyzed and compared with the solidification
rate to validate the results. With more solidification rate and filling velocity data
it may be possible to calculate the lower and upper limit for filling velocity. The
lower limit is calculated to avoid total solidification in the pin (and an unfilled
sample) and an upper limit is good to avoid turbulence and risk of inclusion
agglomeration. The total oxygen content in different parts of the steel samples
may be analyzed with different samplers to investigate the effect of preheating
and drying of samplers before sampling. Furthermore, the homogeneity of
primary inclusions depending on the analyzed depth of the steel sample (surface
to middle) will be determined.

37
7 References
1. L. Huet, P. Jönsson and F. Reinholdsson, "The effect of deoxidation practice on inclusion characteristics in bearing steel production", Steel
Times Int., Nov. 1997, p. 47-50.
2. M. Göransson and P. Jönsson, “Ideas for Process Control of Inclusion Characteristics during Steelmaking”, ISIJ Int., Vol. 41, 2001, pp. S42-S46.
3. Z. Zhang, A. Tilliander, M. Iguchi and P.G. Jönsson, ”Physical Modeling of a Sampler”, Submitted for publication in ISIJ International, Apr 2009.
4. V. Tusset et.al., “Cleanness assessment of high quality steels produced by RH treatment”, Ironmaking & Steelmaking, Vol. 30, 2003, pp. 142-145.
5. F. Reinholdsson et.al., “A Metallurgical Tool for Rapid Determination of Micro Inclusion Characteristics in Bearing Steel Production”, ISIJ
International, Vol. 37, 1997, pp. 637-639.
6. T. Muori, W. Nagasawa, H. Narai and M. Ohori, ”Rapid Evaluation of Inclusions in Bearing Steel”, ASTM International, Vol. 3, 2006
7. R. Meilland and L. Dosdat, “Rapid characterization of inclusionnary cleanliness in steels by PDA-OES mapping”, La Revue de Métallurgie-
CIT, Apr 2002, pp. 373-382.
8. R. Dekkers, B. Blanpain and P. Wollants, “Steel sampling to study inclusions”, Proc. Iron and Steel Society, AIME, Indianapolis, USA, 2003, pp. 1007-1019.
9. I.R.C. Whiteside et.al., “Fast characterization of steel cleanness by advanced mathematical analysis of spark and laser source optical emission data”, European report, No. 7210-PR/298, EUR 22070, 2006
10. Internet: www.electro-nite.de/eng/Products/sensors/Iron_Positherm.html, 2009-05-07
11. R. Inoue, T. Ariyama and H. Suito, “Extraction and evaluation of inclusion particles in steel”, submitted for presentation at Asia Steel 2009 International Conference, May 24-27, Busan, Korea