Embed Size (px)
Citation preview

AN FMRI STUDY OF THE IMPACT OF OLFACTORY CUES ON CIGARETTE
CRAVING
by
Lea Martin
B.S. in Psychology, University of Florida, 2013
M.S. in Psychology, University of Pittsburgh, 2016
Submitted to the Graduate Faculty of
The Dietrich School of Arts and Sciences in partial fulfillment
of the requirements for the degree of
Doctor of Philosophy in Psychology
University of Pittsburgh
2019

ii
UNIVERSITY OF PITTSBURGH
THE DIETRICH SCHOOL OF ARTS AND SCIENCES
This dissertation was presented
by
Lea Martin
It was defended on
January 11, 2019
and approved by
Kasey G. Creswell, PhD, Assistant Professor
Tristen K. Inagaki, PhD, Assistant Professor
Marc N. Coutanche, PhD, Assistant Professor
Julie A. Fiez, PhD, Professor
Dissertation Advisor: Michael A. Sayette, PhD, Professor

iii
Copyright © by Lea Martin
2019

iv
Cigarette smoking remains the number one preventable cause of death in the United States.
Cigarette craving during a quit attempt has been linked to relapse, suggesting it is a clinically
significant construct. This study investigated an understudied method of craving reduction,
involving the administration of olfactory cues after craving induction. Olfactory cues may work to
combat craving because they strongly engage attentional and emotional processing, can induce
vivid autobiographical memory (AM) recall, and because olfactory processing brain regions
overlap with regions involved in craving. Using both general linear model (GLM) and multivoxel
pattern analysis (MVPA) approaches, this study collected fMRI and behavioral data to build upon
a set of behavioral studies that have found odors to be an effective craving reduction tool. The
neural response during a strong craving state was assessed in 39 adult daily smokers across a
variety of craving, olfactory, and AM regions before and after an odor exposure paradigm, during
which half of the participants smelled a pleasant odor cue and half smelled a neutral odor. Results
indicate that exposure to a pleasant odor cue (compared to a neutral odor cue) changed the neural
response in craving related regions. Odor characteristics, namely specific memory association for
an odor, and individual differences in attention to odors were found to influence this odor-induced
craving change. In addition, this study found that MVPA techniques are compatible with the
unique study design requirements of craving research. Study limitations, implications, and possible
future directions are discussed in light of these findings.
AN FMRI STUDY OF THE IMPACT OF OLFACTORY CUES ON CIGARETTE
CRAVING
Lea Martin, PhD
University of Pittsburgh, 2019

v
TABLE OF CONTENTS
PREFACE .................................................................................................................................... XI
1.0 INTRODUCTION ........................................................................................................ 1
1.1 CRAVING ............................................................................................................ 2
1.1.1 Behavioral evidence of the importance of craving ..................................... 2
1.1.2 Neuroimaging of craving .............................................................................. 3
1.1.3 Peak-provoked craving ................................................................................. 6
1.1.4 Combating cravings ...................................................................................... 7
1.2 THE IMPACT OF OLFACTORY STIMULI ON CRAVING ....................... 9
1.2.1 The power of olfaction .................................................................................. 9
1.2.2 Olfaction and craving ................................................................................. 11
1.3 ATTENUATING CIGARETTE CRAVINGS WITH ODORS ..................... 12
1.3.1 Theoretical rationale for odor attenuated cigarette cravings ................. 12
1.3.2 Odor characteristics that may alter craving ............................................ 13
1.3.3 Behavioral evidence of odor attenuated cigarette cravings .................... 14
1.4 THE CURRENT STUDY .................................................................................. 15
1.4.1 Aims and hypotheses................................................................................... 17
1.4.1.1 Manipulation checks ........................................................................... 17
1.4.1.2 Primary aim ........................................................................................ 18
1.4.1.3 Exploratory aims ................................................................................ 20
2.0 METHODS ................................................................................................................. 23
2.1 STUDY RECRUITMENT ................................................................................ 23

vi
2.2 DEMOGRAPHICS ............................................................................................ 24
2.3 STUDY OVERVIEW ........................................................................................ 24
2.4 MEASURES AND MATERIALS .................................................................... 25
2.4.1 Behavioral session assessments .................................................................. 25
2.4.2 Neuroimaging session assessments ............................................................ 27
2.4.3 Materials ...................................................................................................... 27
2.5 PROCEDURES .................................................................................................. 28
2.5.1 Behavioral session procedures ................................................................... 28
2.5.2 Neuroimaging session procedures ............................................................. 29
2.6 DATA ANALYSIS ............................................................................................. 31
2.6.1 Behavioral measures ................................................................................... 31
2.6.2 Preprocessing and modeling of the neuroimaging data .......................... 31
2.6.3 Region of interest selection ......................................................................... 33
2.6.4 GLM analyses .............................................................................................. 36
2.6.5 Multivariate pattern analyses .................................................................... 36
2.6.6 Power analysis ............................................................................................. 39
3.0 RESULTS ................................................................................................................... 40
3.1 DEMOGRAPHICS AND SMOKING CHARACTERISTICS ..................... 40
3.2 BEHAVIORAL EXPERIMENTAL MEASURES ......................................... 42
3.2.1 State-based affect ........................................................................................ 42
3.2.2 Craving change............................................................................................ 42
3.2.3 AIO and memory specificity ...................................................................... 43
3.2.4 Pleasant odor characteristics ..................................................................... 44

vii
3.3 NEUROIMAGING RESULTS ......................................................................... 45
3.3.1 Manipulation checks ................................................................................... 45
3.3.2 Craving induction manipulation check ..................................................... 46
3.3.3 Olfactory exposure manipulation check ................................................... 49
3.3.4 Assessing the impact of odor on craving ................................................... 52
3.3.4.1 GLM analyses ...................................................................................... 52
3.3.4.2 RSA analyses ....................................................................................... 57
3.3.4.3 Classification analyses ........................................................................ 59
3.3.5 Exploratory study aims .............................................................................. 60
3.3.5.1 Exploratory GLM analyses ................................................................ 60
3.3.5.2 Exploratory MVPA ............................................................................ 61
4.0 DISCUSSION ............................................................................................................. 63
4.1 EFFECTIVENESS OF THE CRAVING INDUCTION AND ODOR
EXPSOURE ........................................................................................................................ 63
4.2 PRIMARY STUDY AIM .................................................................................. 65
4.2.1 Self-reported craving change ..................................................................... 69
4.2.2 Exploratory study aims .............................................................................. 70
4.3 USE OF GLM AND MVPA TECHNIQUES .................................................. 72
4.4 LIMITATIONS .................................................................................................. 74
4.5 FUTURE DIRECTIONS ................................................................................... 77
4.6 IMPLICATIONS ............................................................................................... 80
APPENDIX A .............................................................................................................................. 83
APPENDIX B .............................................................................................................................. 84

viii
APPENDIX C .............................................................................................................................. 85
BIBLIOGRAPHY ....................................................................................................................... 87

ix
LIST OF TABLES
Table 1. AM, olfactory, PPC, and craving localizer ROI maps.................................................... 35
Table 2. Significant clusters for the whole brain voxel-wise craving comparison ....................... 48
Table 3. Significant clusters for the whole brain voxel-wise odor and baseline comparison in the
neutral odor group ......................................................................................................................... 50
Table 4. Significant clusters for the whole brain voxel-wise cigarette and post-cigarette odor
comparison in the neutral odor group ........................................................................................... 53
Table 5. RSA correlations that differed significantly between the pleasant and neutral group .... 58
Table 6. Thresholding parameters for whole brain voxel-wise GLM tests .................................. 85
Table 7. Thresholding parameters for ROI GLM tests ................................................................. 86

x
LIST OF FIGURES
Figure 1. Timing and content of trials in runs 1 and 2 .................................................................. 30
Figure 2. The whole brain voxel-wise group craving comparison ............................................... 48
Figure 3. The whole brain voxel-wise odor and baseline comparison within the neutral odor group
....................................................................................................................................................... 49
Figure 4. The whole brain voxel-wise odor comparison of the cigarette and post-cigarette odor
periods in the neutral group .......................................................................................................... 53
Figure 5. The whole brain voxel-wise odor comparison of the cigarette and post-cigarette odor
periods in the positive group ......................................................................................................... 54
Figure 6. The between group, whole brain voxel-wise odor comparison of the cigarette and post-
cigarette odor periods .................................................................................................................... 55

xi
PREFACE
I would like to thank and acknowledge my committee members for their guidance and input on
this dissertation. I would also like to thank my advisor, Michael Sayette, and co-advisor, Julie Fiez,
for their mentorship throughout graduate school, your wisdom has been instrumental and I am so
thankful to have worked with you both. For the past year I have had the amazing opportunity to
intern with some of the best people I have ever met, thank you so much to my PHEO family. To
my friends and family, I really could not have done this without you and thank you falls short of
what you deserve. Finally, thank you J, I owe you a drink or two. This document is dedicated to
Christopher Wallace.

1
1.0 INTRODUCTION
Cigarette smoking ranks as the number one preventable cause of death in the United States (US)
and kills more individuals each year than HIV, illegal drug and alcohol use, motor vehicle
accidents, and murders combined (Ray, Schnoll, & Lerman, 2009). Smoking also accounts for
substantial morbidity due to increased cancer and coronary heart disease risk (US Department of
Health and Human Services, 2014). A recent meta-analysis assessing the impact of low cigarette
consumption found that smoking even a single cigarette on a daily basis conveys substantial risk
for coronary heart disease and stroke, demonstrating that no amount of smoking is safe (Hackshaw,
Morris, Boniface, Tang, & Milenković, 2018).
This substantial disease burden has prompted continued efforts to decrease smoking rates,
which overall have been successful. In the past 50 years the percentage of US adults that smoke
has fallen from over 40% in 1965 to 16% in 2016 (Jamal et al., 2018). These efforts have also
planted the seed of quitting in the minds of many smokers; roughly 70% of current smokers report
they would like to quit smoking cigarettes entirely (Centers for Disease Control and Prevention
(CDC), 2011). Unfortunately, the successful transition from the desire to quit smoking to actually
quitting is still difficult to actualize for most smokers. Quit rates for smokers remain low, with
rates ranging between 4-6% (CDC, 2011; Zhu, Lee, Zhuang, Gamst, & Wolfson, 2012). A
synthesis of the last two decades of quit rates found, despite the growth of available quit smoking
aids, that there has not been a substantial increase in the number of people who successfully quit

2
smoking (Zhu et al., 2012). While there are many reasons a smoker may relapse during a quit
attempt, few have been as hotly debated as craving (Sayette, 2016).
1.1 CRAVING
The idea that craving is an essential component of addiction is not new (Jellinek, 1960), yet the
term is often loosely and inconsistently defined (Sayette, 2016; Tiffany & Wray, 2012).
Researchers continue to debate the core meaning of what can be considered a craving, with
questions arising over whether ‘weak’ cravings can be considered cravings at all (West & Brown,
2013). Although there have been questions about the utility of craving in smoking research, a meta-
analysis of craving found it to have both diagnostic and treatment importance (Tiffany & Wray,
2012). Consistent with this meta-analysis is the inclusion of craving as a core feature for substance
use disorders in the most recent Diagnostic and Statistical Manual of Mental Disorders (DSM–5)
(American Psychiatric Association, 2013).
1.1.1 Behavioral evidence of the importance of craving
Despite the lack of clarity surrounding craving as a concept, there has been a substantial amount
of behavioral research on cigarette craving, which has served to further our understanding of
tobacco use disorder. For instance, we know that craving can serve as a powerful motivator during
nicotine withdrawal (Baker, Japuntich, Hogle, McCarthy, & Curtin, 2006). There is work
supporting the relationship between cigarette craving and subsequent relapse during a quit attempt
(Abrams, Monti, Carey, Pinto, & Jacobus, 1988; Killen & Fortmann, 1997; Waters et al., 2004),

3
with some research even showing a link between craving and time to first smoking lapse (Waters
et al., 2004). Experimental laboratory studies of craving have found ratings of craving to predict
nicotine dependence severity (Donny, Griffin, Shiffman, & Sayette, 2008), as well as differences
in smoking behavior (Conklin et al., 2015). Conklin and colleagues found that those who reported
higher levels of craving were faster to start smoking and smoked more intensely (e.g., took more
frequent and deeper cigarette puffs) than those with lower craving scores. In addition to craving’s
role in smoking outcomes and behavior, craving can broadly alter emotional and cognitive
processes (see Oliver, MacQueen, & Drobes, 2013 and Field, Munafò, & Franken, 2009,
respectively, for reviews).
1.1.2 Neuroimaging of craving
There is also mounting evidence from neuroimaging research that craving is a core feature of
addiction and that it leads to substantial changes in neurobiological processing. Based on work
with rodents, Robinson and Berridge (1993) postulated that craving was a unique state from drug
liking and that, over time, continued drug use results in these states becoming identifiably
dissociated from one another. Neuroimaging research with humans has found support for this
theory by investigating drug self-administration in cocaine users (Risinger et al., 2005). Risinger
and colleagues found that the neural activity associated with high craving periods differed from
the activation associated with periods of hedonic effects (high), thus demonstrating in humans that
drug liking and drug wanting or craving should be studied as a distinct concepts.
Rapid methodological (both technological and data analytic) advances in functional
magnetic resonance imaging (fMRI) have permitted researchers to study how craving alters the
brain in increasingly complex ways. Whole brain voxel-wise analyses and region of interest (ROI)
4
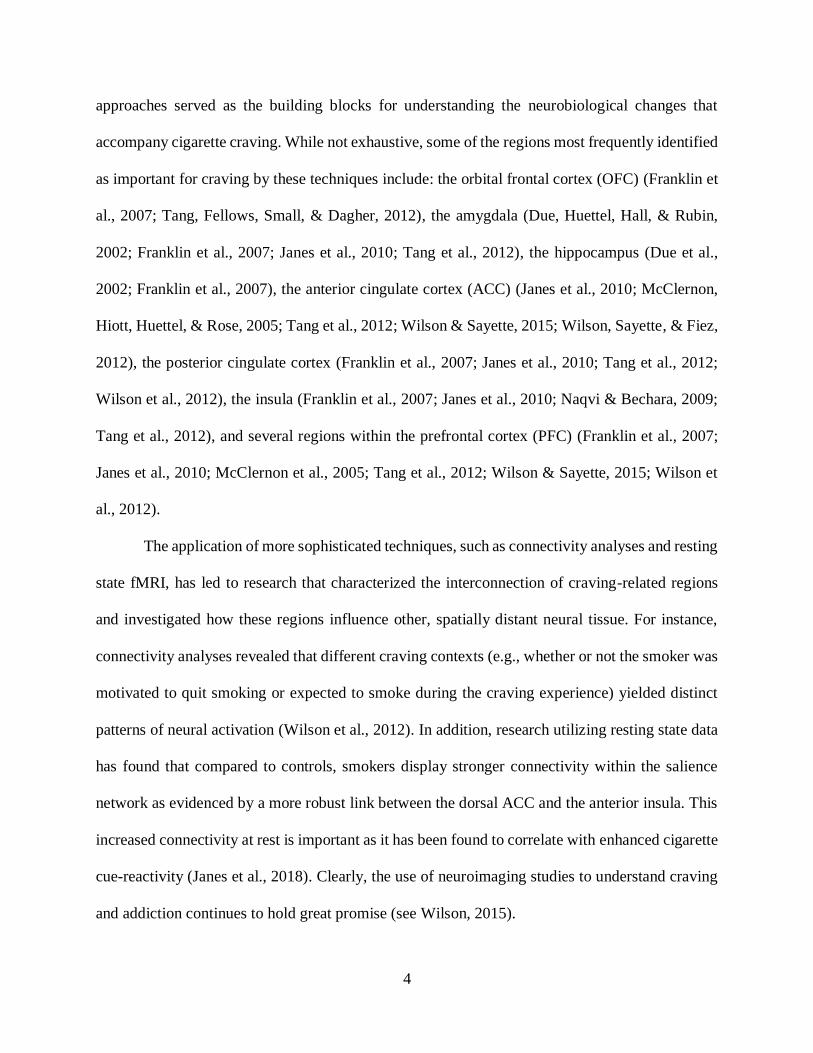
approaches served as the building blocks for understanding the neurobiological changes that
accompany cigarette craving. While not exhaustive, some of the regions most frequently identified
as important for craving by these techniques include: the orbital frontal cortex (OFC) (Franklin et
al., 2007; Tang, Fellows, Small, & Dagher, 2012), the amygdala (Due, Huettel, Hall, & Rubin,
2002; Franklin et al., 2007; Janes et al., 2010; Tang et al., 2012), the hippocampus (Due et al.,
2002; Franklin et al., 2007), the anterior cingulate cortex (ACC) (Janes et al., 2010; McClernon,
Hiott, Huettel, & Rose, 2005; Tang et al., 2012; Wilson & Sayette, 2015; Wilson, Sayette, & Fiez,
2012), the posterior cingulate cortex (Franklin et al., 2007; Janes et al., 2010; Tang et al., 2012;
Wilson et al., 2012), the insula (Franklin et al., 2007; Janes et al., 2010; Naqvi & Bechara, 2009;
Tang et al., 2012), and several regions within the prefrontal cortex (PFC) (Franklin et al., 2007;
Janes et al., 2010; McClernon et al., 2005; Tang et al., 2012; Wilson & Sayette, 2015; Wilson et
al., 2012).
The application of more sophisticated techniques, such as connectivity analyses and resting
state fMRI, has led to research that characterized the interconnection of craving-related regions
and investigated how these regions influence other, spatially distant neural tissue. For instance,
connectivity analyses revealed that different craving contexts (e.g., whether or not the smoker was
motivated to quit smoking or expected to smoke during the craving experience) yielded distinct
patterns of neural activation (Wilson et al., 2012). In addition, research utilizing resting state data
has found that compared to controls, smokers display stronger connectivity within the salience
network as evidenced by a more robust link between the dorsal ACC and the anterior insula. This
increased connectivity at rest is important as it has been found to correlate with enhanced cigarette
cue-reactivity (Janes et al., 2018). Clearly, the use of neuroimaging studies to understand craving
and addiction continues to hold great promise (see Wilson, 2015).

5
Progress toward understanding the neuroscience of craving may be further enhanced by
adoption of a fairly recent fMRI analytic approach, referred to as multivoxel or multivariate pattern
analysis (MVPA). MVPA is an analytic technique that uses machine learning procedures to decode
the activity pattern within a group of voxels under certain conditions (e.g., while a subject looks
at an image of a cow); this decoded pattern is then applied to new data from the same group of
voxels to predict information about a condition with a certain level of accuracy (e.g., how confident
are we that this person is looking at an image of a cow at time X) (Norman, Polyn, Detre, & Haxby,
2006). MVPA has been found to be more sensitive to fine grain changes in neural activation related
to task differences than the more traditional general linear model (GLM) (Coutanche, 2013), which
is used to measure the average activation within a defined brain region (Friston et al., 1994). Thus
far, MVPA primarily has been used to characterize the response to visual stimuli associated with
cognitive processes and research is just beginning to address other sensory domains and affective
responses (Clark-Polner, Wager, Satpute, & Barret, 2016; Etzel, Cole, Zacks, Kay, & Braver,
2015).
The methodological challenges of conducting cue-elicited fMRI craving studies create a
unique setting for using MVPA. For instance, due to trial-to-trial craving carry-over effects
(Sayette, Griffin, & Sayers, 2010), it is difficult to administer multiple, intermixed trials of
smoking and control cues to generate craving and non-craving assessment intervals. To date,
MVPA has been used exclusively in studies with multiple trials. The contrast of a single trial of
smoking and control cues has, however, yielded valuable fMRI data using traditional GLM
analyses (Wilson et al., 2012). Because MVPA characterizes the pattern of voxel responses and
can be used to detect subtle differences in stimuli response, I expected that a single cue exposure

6
trial also would be amenable to MVPA, but this has yet to be tested. This study used both MVPA
and GLM analytic approaches to investigate the neurobiological changes associated with craving.
1.1.3 Peak-provoked craving
The impact of craving across a broad range of behavioral and neurobiological responses may help
explain the low quit rate of smokers. Of particular interest may be peak-provoked craving (PPC),
which is a high intensity craving elicited by a combination of smoking abstinence-based craving
(also referred to as tonic or baseline craving), and craving that is cued by smoking-related stimuli
(also known as phasic or cue-elicited craving) (Sayette & Tiffany, 2013). PPC is an important
concept to consider when assessing craving because a smoker attempting to quit will likely
experience both abstinence and exposure to smoking cues during the initial, highest risk days
following cessation. Smoking abstinence as brief as five hours is sufficient to elicit strong craving,
meaning smokers can experience PPC states even when they are not trying to quit (Sayette &
Dimoff, 2016). Nicotine withdrawal alters the processing of smoking cues, such that smoking
related information becomes more salient (Field et al., 2009), and smokers are likely to be
embedded in social networks that include other smokers (Bray, Smith, Piper, Roberts, & Baker,
2016), which means they have a high likelihood of being exposed to external cigarette cues on a
regular basis1.
Laboratory based studies that induce PPC states in smokers find these states are highly
disruptive to cognitive and emotional processing (Sayette & Hufford, 1994; Sayette, Martin,
1 High exposure to smoking cues is more likely for those who belong to ethnic or sexual minority
groups or that are low-income because smoking rates are higher in these groups (Antin,
Lipperman-Kreda, & Hunt, 2015; Hiscock, Bauld, Amos, Fidler, & Munafo, 2012) and tobacco
advertising often heavily targets these individuals (Washington, 2002).

7
Wertz, Shiffman, & Perrott, 2001). PPC can alter attentional focus (toward smoking cues), time
perception (time is perceived to pass more slowly than while in a neutral state), and reward
magnitude perception (smoking is seen as more rewarding), all processes that presumably make
cessation more difficult (Sayette, 2016). PPC states also result in more intense activation of
craving-related regions during cue exposure than do less intense craving states, including the
rostral ACC and the nearby medial/ventromedial PFC (Wilson & Sayette, 2015). These results
suggest that not all levels of craving are the same; PPCs might be particularly difficult to manage
because of the cognitive and affective disruption and robust neural engagement they entail.
1.1.4 Combating cravings
PPC states are likely to occur during a quit attempt and are powerfully disruptive to smokers.
Unfortunately, the quit aids that are typically recommended and the easiest to obtain, such as over-
the-counter nicotine replacement therapy (NRT), are often ill-equipped to combat these states. The
nicotine patch, which provides relatively stable levels of nicotine (Srivastava, Russell, Feyerabend,
Masterson, & Rhodes, 1991), is effective at diminishing abstinence induced craving, but has been
found to be ineffective at controlling the increases in craving that arise when exposed to smoking
cues (Tiffany, Cox, & Elash, 2000). Other studies that administered nicotine patches prior to cue-
exposure found the patch reduced cravings during PPC states, but cravings still remained high
(Morissette, Palfai, Gulliver, Spiegel, & Barlow, 2005; Waters et al., 2004). Even faster acting
NRTs have limitations in their ability to reduce PPC states because they cannot offer relief on the
same time scale as a cigarette (Stead et al., 2012).
The amount of time it takes for a craving to trigger smoking is very short, with about half
of lapses happening within 11 minutes of a reported craving (Ferguson & Shiffman, 2009).
8
Nicotine gum, which delivers nicotine through the lining of the mouth, reaches peak levels of
nicotine within 30 minutes (Benowitz, Porchet, Sheiner, & Jacob, 1988) and has been found to
help reduce PPC states starting 15 minutes after administration (Shiffman et al., 2003), making it
too slow to address the majority of cravings that lead to a lapse. Nicotine nasal spray works on a
faster time scale, reaching peak levels within 5-10 minutes (Fagerström, 2000), but is still too slow
to stop a large percentage of lapses and nasal sprays are not always well tolerated due to unpleasant
side effects (Hjalmarson, Franzon, Westin, & Wiklund, 1994). More broadly, products that deliver
nicotine (including e-cigarettes) may not be an attractive alternative for many smokers who want
to move away from using an addictive substance (nicotine); for these individuals, it is important
that a non-nicotine product be available to help control craving.
The powerful and diverse effects of craving that continue to plague smokers even with the
aid of NRT have led to recent efforts to better manage intense craving. For instance, non-
medication based methods to combat craving have become popular and include techniques such
as mindfulness meditation (Ruscio, Muench, Brede, & Waters, 2016; Westbrook et al., 2013),
visualization or imagery (May, Andrade, Panabokke, & Kavanagh, 2010; Versland & Rosenberg,
2007), and cognitive based coping skills (Kober, Kross, Mischel, Hart, & Ochsner, 2010; Wilson,
Sayette, & Fiez, 2013). These craving reduction approaches are promising, but they all require
sustained cognitive effort. Purposefully engaging in a cognitively taxing process can be
challenging at the best of times, and, as noted above, is likely to be extraordinarily difficult during
a high craving state.
Evidence from research on coping skills shows that during a quit attempt individuals fail
to utilize the skills they have learned prior to a lapse – rates vary depending on the study, with
some showing roughly 20% do not engage coping skills (Shiffman, Paty, Gnys, Kassel, &
9
Hickcox, 1996) and others finding evidence that this number may be as high as 71% (Brandon,
Tiffany, Obremski, & Baker, 1990). Moreover, even when people report engaging in a coping
skill, smoking following a PPC state is highly likely (Wilson, Sayette, et al., 2013). One possible
explanation for why people fail to use coping skills that can help them, and why these skills do not
always inhibit smoking even when they are used, is because the effort associated with utilizing a
coping skill during a high vulnerability moment is simply too high.
1.2 THE IMPACT OF OLFACTORY STIMULI ON CRAVING
1.2.1 The power of olfaction
One way to avoid both the lag in craving relief associated with NRT and the concern of overtaxing
a smoker’s cognitive resources is to use a craving reduction strategy that engages attention in a
stimulus driven or ‘bottom-up’ fashion. Capitalizing on bottom-up attentional processes should
minimize the cognitive burden associated with the aforementioned craving reduction strategies,
while simultaneously providing rapid relief because of the automatic engagement that occurs when
a highly salient stimulus is encountered (Sarter, Givens, & Bruno, 2001; Sobel, Gerrie, Poole, &
Kane, 2007).
Few environmental stimuli are more attention demanding than olfactory cues. Unlike
visual, tactile, and auditory information, olfactory input is immediately routed to emotion and
memory processing regions of the brain, including the amygdala, the OFC, the insula, the
entorhinal cortex, and the hippocampus (Gottfried, 2006). This privileged and direct access to
evolutionarily old brain regions is what makes olfactory stimuli particularly effective at cueing

10
emotionally powerful responses, such as autobiographical memories (Chu & Downes, 2002; Herz,
2004; Herz & Schooler, 2002) and emotional states (Herz, 2002). Neuroimaging studies of
olfaction and autobiographical memory (AM) retrieval have found that olfactory cues, compared
to visual cues, produce significantly more activation within emotion and memory processing
regions, including the amygdala (Herz, Eliassen, Beland, & Souza, 2004), the parahippocampal
gyrus (Arshamian et al., 2013), and the hippocampus (Herz et al., 2004).
Olfaction’s direct access to these regions also explains why olfactory cues are effective at
inducing bottom-up processing; through their unique attachment to emotions and memories they
can viscerally engage attention with little need for top-down attention or vigilance. Indeed, odors
often are reported to ‘carry individuals away’, which can be positive or negative depending on the
association of the odor. For example, episodes of post-traumatic stress disorder, which are
characterized by involuntary recall of disruptive and vividly distressing memories (American
Psychiatric Association, 2013), can be induced with olfactory cues associated with the original
trauma (Kline & Rausch, 1985).
The extent to which odors affect memory and emotion appears to vary by individual,
suggesting that some people may be more or less likely to be attentionally engaged by odors.
Wrzesniewski, McCauley, and Rozin (1999) found scores on the Attention to and Importance of
Odors Questionnaire (AIO) identified which individuals were most likely to experience odor-
mediated memories, as well as who paid most attention to odors in their environment. They also
found that scores on the AIO correlated with an associative learning task delivered in the
laboratory, suggesting that processes tied to odor perception can operate outside of consciousness.
Because the attention paid to odors and the importance placed on odors might vary by individual,

11
the current study examined scores on the AIO to better characterize how the role of odors in one’s
environment alters an odor’s ability to affect other processes, namely craving.
1.2.2 Olfaction and craving
There is research suggesting that olfactory cues are well suited to elicit not just emotional or
memory specific states, but also drug specific states, such as craving. Alcohol research has shown
that exposing problem drinkers to the sight and smell of their preferred alcoholic beverage results
in more desire to drink (Cooney, Litt, Morse, Bauer, & Gaupp, 1997), while blocking visual and
olfactory cues results in less desire to drink in social drinkers (Perkins, Ciccocioppo, Jacobs,
Doyle, & Caggiula, 2003). Research on problematic eating has shown food specific odors are
especially apt at inducing cravings for that food in restrained eaters (Fedoroff, Polivy, & Herman,
1997).
With regard to cigarette craving and olfaction, the tobacco industry has long understood
that the sense of smell can be leveraged to more effectively market their product (Megerdichian,
Rees, Wayne, & Connolly, 2007), yet the smoking research community has only scratched the
surface of olfaction’s role in craving. Research suggests olfaction plays an important role in
smoking and that olfactory cigarette cues can induce drug craving. Blocking the olfactory
component of smoking can reduce the reported enjoyment of smoking (Baldinger, Hasenfratz, &
Bättig, 1995). This may be especially true for some subsamples of smokers (i.e., women), who
appear to derive a portion of the reinforcing aspects of smoking from their olfactory cues (Perkins
et al., 2001). In vivo smoking cues (lighting and holding a lit cigarette) generally lead to more
powerful responses than a visual smoking cue (i.e., a video of an individual lighting and holding a
lit cigarette) (Shadel, Niaura, & Abrams, 2001). Based on the ability of olfactory cues to provoke

12
cravings across multiple substances and the importance of olfactory cues in smoking satisfaction
during use, it appears that olfactory cues can induce craving states in smokers.
1.3 ATTENUATING CIGARETTE CRAVINGS WITH ODORS
1.3.1 Theoretical rationale for odor attenuated cigarette cravings
While research makes it clear that drug or food related odors can induce cravings, there are
theoretical reasons to believe that olfactory stimuli also could be used to attenuate craving (Sayette
& Parrott, 1999). Craving is thought to be a visceral, emotionally laden experience (Loewenstein,
1996). Similarly, odor processing is closely tied to emotional experience. The shared experiences
of craving and odor processing suggest that odors may be useful in distracting an individual away
from a craving state in ways that more cognitive or intellectual interventions cannot. Moreover,
the overlapping neural regions responsible for processing both craving and olfaction information
(e.g., the OFC, the amygdala, the hippocampus, the insula) suggest it may be difficult to process
both streams of information simultaneously. It is possible that smelling an odor that is unrelated
to smoking during a craving state could reduce craving by drawing upon the available, and
presumably limited, processing resources in these regions. Purposefully consuming a limited
resource to impair similar types of processing is well studied in cognitive psychology, for example,
forcing an individual to engage in concurrent articulation (i.e., repeating a word such as the)
impairs other cognitive processes, such as memory rehearsal (Baddeley & Hitch, 1974).
The Elaborated Intrusion Theory of Desire posits that because craving or desire typically
involves sensory images (e.g., olfactory, gustatory, visual), tasks in the same modality that

13
compete for similar resources will create interference with the desire state (Kavanagh, Andrade,
& May, 2005). Based on this theory, engaging the regions shared by craving and olfaction with
olfactory cues may work to “highjack” the processing of the craving information (whether this be
stimulated by internal cues such as affect, or external cues such as a cigarette lying on the
sidewalk), thus providing immediate relief to the individual that requires little or no effortful
cognitive engagement. The primary aim of the current study was to assess the ability of pleasant,
non-smoking related olfactory stimuli to attenuate craving related neural activation in smokers
who were in a PPC state.
1.3.2 Odor characteristics that may alter craving
Odors have several other distinct properties that make them well suited to attenuate craving in
addition to their neural connections. Odors are powerfully connected to the first instance in which
they are encountered, which is beneficial for craving reduction for two reasons. First, research has
found that odor associations are insensitive to retroactive interference (i.e., once an odor is paired
with a context it is difficult to ‘rewrite’ this association) (Lawless & Engen, 1977), thus an odor
could theoretically reduce multiple cravings without becoming associated with a craving state.
Second, when odors induce memory retrieval, these memories are often autobiographical and
drawn from childhood experiences (Willander & Larsson, 2006), a time that often predates
smokers’ initiation of their smoking habit, which reduces the chance the memory would be
associated, even distantly, with smoking cues2. To more precisely explore the role of odor-memory
2 Individuals may, of course, recall childhood memories that involve others smoking, however,
these memories are unlikely to generate a craving state in the same way as a memory of their
own smoking.
14
in craving attenuation at the neurobiological level, a set of AM ROIs were tested alongside the
olfactory related ROIs. In addition, a self-report measure of specific memories (or lack thereof)
associated with the odor they were assigned was assessed for each participant and memory
specificity was correlated with their craving response to test for an effect on craving.
Another property of odors that may be important for craving reduction is that both the types
of odors a person prefers (Engen, 1974), as well as their general feeling about odors in their
environment (Wrzesniewski et al., 1999), is highly variable. The ability to customize one’s odor
stimuli for craving attenuation means that optimal stimuli can be selected for each person. With
the recent rise and success of personalized medicine (Hamburg & Collins, 2010), the possibility
of personalized craving relief is likely to become a focus of interventions. The current study
attempted to customize the odor stimuli by providing participants with a menu of six pleasant odors
and assigning each experimental participant to their most pleasant odor.
1.3.3 Behavioral evidence of odor attenuated cigarette cravings
In addition to the aforementioned theoretical reasons why odors may serve to reduce cigarette
cravings, there exists a small, yet promising set of behavioral studies that has used odor stimuli to
reduce cravings for both highly palatable food and cigarettes. Kemps, Tiggemann, and Bettany,
(2012) found that smelling a non-food odor (jasmine) lowered chocolate cravings better than a
food related (green apple) or neutral odor (water) in young women. In a subsequent study, exposure
to a neutral, non-food odor (menthyl acetate) was more successful than exposure to a control or a
neutral auditory task (speech in a foreign language) at lowering craving for both savory and sweet
food, as well as for chocolate (Kemps & Tiggemann, 2013). These findings suggest that modality

15
specific interference using a non-cue related stimulus might work to reduce the available resources
to process cravings.
Three studies have examined olfactory attenuated craving specifically for nicotine. A small
naturalistic study on nicotine cravings (including cigarettes, chew, and snuff) found that exposure
to odors can reduce cravings and that certain odors may delay the use of nicotine products more
effectively (Cordell & Buckle, 2013). Two experiments have found that odors can attenuate
cigarette craving. Sayette and Parrott (1999) found that when smokers in a PPC state smelled an
odor they had previously rated as pleasant or unpleasant, they reported significantly lower rates of
craving than those who smelled a neutral odor. In a larger study of the impact of odors on cigarette
craving, Sayette, Marchetti, Herz, Martin, and Bowdring (Under Review) found that pleasant
olfactory cues resulted in significantly higher craving reductions than either neutral or tobacco
related odors. Taken together, this set of studies suggests that odors are able to reduce craving
more than other sensory modalities. These data make it clear that future research is needed to
delineate possible mechanisms underlying the ability of odors to reduce cigarette cravings.
1.4 THE CURRENT STUDY
This study aimed to increase understanding of odor attenuated cigarette craving by integrating
behavioral and neuroimaging techniques. Because prior work on this topic is limited to a handful
of studies, all of which relied exclusively on behavioral data, there are still many unanswered
questions about the role of olfactory cues in controlling cigarette cravings. In particular, the
neurobiological substrates underlying odor-induced craving attenuation remain unclear. This study
utilized fMRI to characterize how the introduction of an odor cue during craving might shift neural

16
responses in craving related regions. It also leveraged both GLM and MVPA techniques to assess
the neural substrates of craving response in an attempt to better characterize suitable methods for
executing neurobiological studies of craving.
While this study’s primary aim was to provide a neuroimaging-based test of the impact of
odors on craving reduction, it also aimed to extend the behavioral findings from prior work to
address possible mechanisms underlying any observed craving reduction. Recent work by Sayette
et al. (Under Review) found that smokers with the most specific AM systems benefited the most
from the craving attenuation provided by pleasant olfactory cues. Moreover, although the sample
size was small and the finding did not reach significance (p <.13), data from Sayette and Parrott
(1999) leave open the possibility that when odors are associated with a memory, they may decrease
craving levels more than when odors do not invoke memories. The present study attempted to
answer this question in three ways:
First, I examined whether odors that invoked an AM would reduce craving more than odors
that did not invoke a memory (and if so, whether the specificity of the memory would affect urge
reduction). Memory specificity may be an important component of the craving reduction process
(e.g., more specific memories may draw more heavily upon limited-capacity cognitive resources)
and this study aimed to test this possibility.
Second, by including AM processing ROIs, I investigated whether activation within these
regions would be associated with self-reported changes in craving.
Third, I evaluated the role the importance of and attention to odors (via the AIO) had on
the impact of odors on craving. By using the AIO to assess individual variation in the tendency to
notice and value odors, it was possible to test if this factor altered the efficacy of odors in craving
reduction.

17
In summary, this study utilized two fMRI analysis techniques in conjunction with several
behavioral measures to examine the efficacy of odors in reducing cigarette cravings as well as
possible mechanisms underlying any odor-induced craving reduction. Moreover, it sought to
address gaps in knowledge from previous behavioral studies and inform the future use of odors in
craving reduction by measuring specific qualities related to the odors and participants.
1.4.1 Aims and hypotheses
1.4.1.1 Manipulation checks
This study had one primary aim and two exploratory aims. Prior to addressing these aims, two
manipulation checks were performed to determine if the craving induction paradigm (i.e., holding
a cigarette while in nicotine withdrawal) and the odor exposure protocol were effective in
increasing craving and delivering a perceivable odor, respectively. Both GLM and MVPA
techniques were used for both manipulation checks.
To test for an effect of the PPC induction paradigm using GLM, a within-subjects
comparison of the neural response to the cigarette cue and the neutral cue (i.e., a roll of tape) was
examined3. I expected that the cigarette and neutral cue comparison would find significantly more
3 In behavioral studies of craving, it is typical to assess craving intensity at multiple points, for
example, both before and after cue exposure, and after any attempt to decrease a cued craving. In
contrast, this study only assessed craving after attempting to reduce it. The disadvantage of the
current approach is that it no longer requires the subject to offer a real-time assessment of their
urge, but instead requires them to retrospectively estimate their prior urge state and then contrast
it with their current urge state. It also reduces the assessment from a continuous measure of urge
to an ordinal one. The decision to use a suboptimal urge assessment stemmed from recent work
suggesting that repeatedly asking individuals to quantify their craving can influence the craving
experience itself (Creswell, Sayette, Schooler, Wright, & Pacilio, 2018). In particular, because
this study’s primary aim focuses on neural response, there were concerns that introducing
multiple, quantitative behavioral assessments of craving during the neuroimaging scan might
alter (contaminate) the craving response in unexpected ways. For example, it was a concern that

18
activation in craving related regions. Due to the small amount of research on odors and craving, it
is unknown whether experiencing a pleasant odor prior to a craving induction alters the experience.
To examine this possibility, a between-group t-test was performed to test for any differences in the
neural response to the craving induction based on group membership. MVPA techniques were also
used to test for an effect of the PPC induction paradigm on craving response. For both analyses,
no group differences in the craving response were expected.
To test the effectiveness of the odor exposure protocol in delivering a perceivable odor to
participants, both behavioral and neuroimaging manipulation checks were utilized. The behavioral
measure used to assess odor perception occurred during the two odor exposure periods of the fMRI
scan (i.e., prior to and shortly following smoking cue exposure). Participants were instructed to
press a button if they smelled an odor at any point during these two time periods. The neuroimaging
manipulation check for odor perception consisted of a between-subjects comparison (pleasant vs.
neutral odor groups) to test for differences in the olfactory and AM ROIs. It was expected that
only the pleasant odor group would have increased activation in olfactory and AM processing
regions.
1.4.1.2 Primary aim
This study had one primary aim, to characterize the neurobiological changes associated with
smelling a pleasant odor during a PPC state. This aim was assessed using two distinct
neuroimaging analysis techniques, the traditional GLM approach, and MVPA, an analysis method
verbal overshadowing might interfere with the craving experience, which can occur when an
individual verbally describes a visceral (Creswell et al., 2018) state. This possibility was viewed
as more of a concern than the use of a single urge measure. Accordingly, self-reported craving
was assessed only once, after the cue and odor exposure periods, as a change score (see Section
3.2.2 for details).

19
that has become popular in neuroimaging, but that has yet to be applied to cigarette craving
research.
To test this aim using the GLM approach, both whole brain voxel-wise and ROI analyses
were used to compare the activation during the cigarette cue period to the activation during the
post-cigarette odor period (referred to as the craving change comparison). Between-group
comparisons and one-sided t-tests were used to determine if smelling a pleasant (vs. neutral) odor
during a PPC state reduced activation in craving related brain regions. In addition, the self-reported
craving change score, which was recorded after the post-cigarette odor period, was correlated with
the change in craving activation to determine if self-reported craving change was associated with
any observed shifts in neural activation. Based on behavioral evidence that odors can reduce
cigarette cravings, as well as the close neural overlap of these processes, I hypothesized that there
would be significant decreases in neural activation within craving regions for individuals who
receive an odor and little, if any, decreases in activation for individuals who receive a neutral odor.
It was also hypothesized that the self-reported craving change score would correlate with changes
in craving related activation.
The MVPA used to assess this aim included representational similarity analysis (RSA) and
machine learning based classification. RSA measures the similarity of neural activation within
specific tissue via correlation (Dimsdale-Zucker & Ranganath, 2019). For example, one could use
RSA to measure the similarity between activation to a red circle and a blue square within primary
visual cortex. By assessing the similarity between stimuli classes within a specific region, RSA
can contribute fine grain understanding of which regions differentiate between stimuli. In the
service of this aim, RSA was used to evaluate the similarity between the baseline, odor, cigarette,
and post-cigarette odor periods within the AM, olfactory, PPC, and craving ROIs for each person.

20
I hypothesized that the cigarette period and post-cigarette odor period would be more similar
across the PPC and craving ROIs for those who received the neutral odor compared to those who
received their most pleasant odor. Because I expected that the pleasant odor cue would increase
activation in olfactory regions, I hypothesized that the baseline period and odor period would be
less similar in the olfactory and AM ROIs for those in the pleasant odor group than the neutral
group due to changes induced by perceiving an odor.
To further test this aim using MVPA, a machine learning classifier was used to classify each
individual as belonging to either the neutral or pleasant group. While the primary time period of
interest for classification with regard to this aim was the post-cigarette odor period, the classifier
was also used to classify individuals based on the activation during the odor and cigarette periods
for each ROI. It was expected that the cigarette period would not differ between groups and thus
would not yield accuracy values significantly different from zero. Conversely, it was expected that
the classifier would be able to distinguish the pleasant and neutral group participants at an above
chance rate for the odor and post-cigarette odor periods.
1.4.1.3 Exploratory aims
This study also assessed two exploratory questions related to the primary aim. The first tested if
the neural response to an odor, both before and after cigarette cue exposure, differed based on the
specificity of any memory associated with the odor (Exploratory Aim 1). Because this study
assessed whether or not the assigned odor for the pleasant odor condition was associated with a
memory and how specific that memory was, it was possible to test if memory specificity influenced
the impact of an odor on neural activation during the odor exposure and craving change
comparison.

21
To test this aim using the GLM analyses, Pearson correlations were used to test the
relationship between the memory specificity for a participant’s chosen odor and both the activation
within olfactory and AM ROIs during the odor exposure period. In addition, the relationship
between memory specificity and the extent to which the odor altered the activation during the
craving change comparison within both the PPC and craving localizer ROIs was also examined. It
was hypothesized that odors that triggered more specific memories would be correlated with
increased activation in olfactory and AM processing regions during the odor exposure period and
also would be correlated with reduced activation in craving related regions.
Exploratory Aim 1 was also tested using the MVPA classification data. Specifically, the
likelihood of each participant being correctly classified as belonging to the pleasant or neutral odor
group was correlated with their memory specificity rating. I hypothesized that those with more
specific memories would be more likely to be accurately classified during the odor period within
the olfactory and AM ROIs, as well as during the post-cigarette odor period within the craving
ROIs. Such findings would be consistent with the idea that utilizing a limited resource for one
process, in this case processing a specific odor related memory, detracts from the same pool of
resources available to process similar types of information, such as craving related information.
Exploratory Aim 2 tested whether an individual’s self-reported attention to odors in their
environment (using the AIO) correlated with odor-induced changes in neural responding within
craving related regions. While prior behavioral research has shown that odors can reduce cravings,
it is not yet understood for whom this approach works best. For the GLM data, AIO scores for the
pleasant odor group were correlated with the activation from the post-cigarette periods within the
PPC and craving ROIs. It was expected that individuals who reported being most attuned to odors
in their environment would benefit the most from smelling the odor while craving, which would

22
be evidenced by less activation in craving related brain regions after smelling their odor. The AIO
scores for the pleasant odor group participants were also correlated with the MVPA derived
likelihood of that participant being correctly classified as belonging in the pleasant group for the
post-cigarette period within the PPC and craving ROIs. It was expected that those with higher AIO
scores would be more likely to be classified correctly as belonging to the pleasant group than those
with lower AIO scores.
23
2.0 METHODS
2.1 STUDY RECRUITMENT
Participants were recruited through a combination of community newspaper and bus
advertisements and the Pitt+Me registry, a research registry maintained by the Clinical and
Translational Science Institute of the University of Pittsburgh. Consistent with prior smoking
research conducted by the Alcohol and Smoking Research Laboratory (ASRL), smoking related
inclusion criteria consisted of smoking an average of 10-30 cigarettes per day for at least 12
months, not actively trying to quit smoking, and not using any other forms of combustible nicotine
daily. To satisfy the constraints associated with neuroimaging research, individuals had to be
between 18 to 45 years of age, under 250 lbs, right-handed, and free of uncorrected hearing or
vision issues, psychological disorders, neurological issues, or fMRI contraindications. Individuals
were tested for an impaired sense of smell using an in-house olfaction acuity test; no participants
failed this screening.
Study recruitment began in July 2017 and concluded in July of 2018. Of the 424 individuals
that were screened telephonically, 100 qualified for the behavioral lab session. Of these 100, 38
did not attend their first scheduled session4; 42 of the remaining 62 completed both the behavioral
and neuroimaging portions of the study. Reasons for not completing both sessions included issues
with CO levels (either too low for the behavioral session or too high at the neuroimaging session)
participant no-show or scheduling issues for the neuroimaging session, and the discovery of
4 Participants were given one chance to reschedule each of the two sessions.

24
scanning contraindications (e.g., neck tattoos, body size issues, and claustrophobia). From the 42
completed individuals, two participants’ data were excluded immediately after study completion;
one due to a researcher error in the protocol and one who revealed he had quit smoking for over a
week shortly before the study began during the study debriefing. One individual in the neutral
group was excluded for repeated excessive head motion above a 1.5 mm threshold, resulting in a
final sample of 39 individuals.
2.2 DEMOGRAPHICS
The full sample of 39 participants was 41% female and identified as Caucasian (72%), African
American (21%), or multiracial (8%). One individual was of Hispanic/Latino origin. On average,
participants were 32.56 years old (SD = 6.77 yrs) and reported an average of 13.32 years of
education (SD = 2.21), with 51% (n = 20) reporting some schooling in addition to high school.
Participants average household income was between $20,000 and $29,999 and ranged from less
than $5,000 (n = 3) to over $80,000 (n = 5).
2.3 STUDY OVERVIEW
The study involved two laboratory visits that were scheduled on two separate days. The number
of days between the sessions ranged from 1 to 50, with the average amount of time being 12.61
days (SD = 11.81). Examination of the data revealed that one participant who had 50 days between

25
sessions was considered an outlier for the days between sessions measure5. Because it was unclear
if the additional days between sessions might be correlated with other variables of interest, all of
the behavioral, between-group analyses were run both with and without this participant to
determine if their inclusion altered the results. This participant belonged to the neutral odor group
and there were no significance changes to the results when excluding the participant, so they were
included in all analyses.
The first session took place at the ASRL and the second session took place at the
Neuroscience Imaging Center. Because the first session included only behavioral tasks, this
session will be referred to as the behavioral session and the second session will be referred to as
the neuroimaging session. Randomized to the pleasant or neutral odor condition occurred before
the behavioral session. The sole difference between the two groups’ experience was that during
the fMRI scan, individuals in the pleasant odor condition were presented with the odor they rated
as most pleasant in the behavioral session (see Section 2.4), while those in the neutral odor
condition were not presented with an odor.
2.4 MEASURES AND MATERIALS
2.4.1 Behavioral session assessments
Participants completed a variety of questionnaires during the behavioral session, some of which
are unrelated to the current study and are not discussed further (see Appendix A for a list of all
5 The longer delay between sessions for this subject was due in part to complications with the
fMRI scanner.

26
measures). Participants completed three questionnaires pertinent to the current study that assessed
a variety of individual differences: a set of standard demographic questionnaires frequently used
in the ASRL (Sayette & Dimoff, 2016); a state-based mood measure, the Positive and Negative
Affect Schedule (PANAS) (Watson, Clark, & Tellegen, 1988), which has high construct validity
in non-clinical samples (Crawford & Henry, 2004); and a questionnaire that assesses how people
typically interact with odors in their daily life, the shortened 8-item version of the aforementioned
AIO (Wrzesniewski et al., 1999), which has been used in previous studies of naturalistic odor
preference (Herz, 2004).
Participants completed several questionnaires related to their smoking history and attitudes
toward smoking. Relevant to the current study are the Smoking History Questionnaire, which has
been used extensively in the ASRL (Sayette et al., 2001) and the revised Fagerstrom Test for
Nicotine Dependence (FTND; Heatherton, Kozlowski, Frecker, & Fagerstrom, 1991), which is the
most frequently used questionnaire to assess nicotine dependence.
During the behavioral session, participants sampled six pleasant odors (apple, lily of the
valley, vanilla, coconut, chocolate, and peppermint) in a random order (see Appendix B for odor
creation details). These odors were selected based on analysis from 177 participants from a now
completed behavioral study in the ASRL (Sayette et al., Under Review). After smelling each odor,
participants answered a series of questions adapted from an aroma questionnaire used by Herz and
colleagues for studies of olfactory-induced memory retrieval (Herz & Cupchik, 1992; Herz &
Schooler, 2002), which will be referred to as the Semi-Structured Odor Sampling Interview. This
form includes questions about the pleasantness, intensity, and familiarity of an odor. Participants
rated each dimension using a Likert-type scale ranging from 1 extremely weak to 9 extremely
strong. They were then asked if the odor elicited any memories. If a memory was cued, they briefly
27
described the memory, rated it for emotional intensity, specificity, and pleasantness using scales
ranging from 1 to 9, and indicated if the memory was social or if they were alone at the time of the
memory. The Semi-Structured Odor Sampling Interview was administered verbally and responses
were recorded by the experimenter.
2.4.2 Neuroimaging session assessments
During the neuroimaging session, participants filled out several questionnaires, including the
PANAS. The PANAS was administered repeatedly because it is sensitive to state-based changes
in affect (Crawford & Henry, 2004) and was compared between groups to test for group level
affective differences. Following the odor and cue exposure periods during the fMRI scan,
participants reported their craving change score, which asked them to compare their urge at that
moment to the urge they felt while holding their cigarette. Participants could select one of three
levels: a lower urge, the same urge, or a higher urge. After the scan, participants answered several
questions about the study on a debriefing questionnaire. The debriefing questions were
administered verbally, and answers were recorded by the experimenter.
2.4.3 Materials
This study used several unique materials for administering the odor stimuli in the behavioral and
neuroimaging sessions. In the behavioral session, participants sampled the odors from identical
opaque jars. To administer the odors to participants while they were in the fMRI scanner a pulley
system operated by a research assistant was used to rapidly transfer the odor-soaked pellets into
and out of the scanner bore. The research assistant was cued to move the pulley via laser pointer,

28
which was synced to the visual display seen by participants. To equate the pleasant and neutral
odor conditions as similar as possible, two odorless pellets were used in the neutral condition.
2.5 PROCEDURES
2.5.1 Behavioral session procedures
Participants were instructed to smoke as they normally would for the behavioral session and carbon
monoxide (CO) levels were collected to ensure compliance. To be eligible for the behavioral
session, CO levels had to be above 10 parts per million (ppm) (Benowitz et al., 2002). In addition,
participants were given a forced choice odor test, weighed to ensure they were under the 250 lbs
weight limit of the scanner table, and asked about their level of comfort in tight spaces to determine
if they would be comfortable undergoing the fMRI scan. Ineligible participants were given
information about other smoking studies and dismissed. Eligible participants then completed a
questionnaire packet that included the PANAS and demographics form. Following the first set of
questionnaires, participants completed the Semi-Structured Odor Sampling Interview and a second
packet of questionnaires, which included the PANAS, the AIO, the smoking history questionnaire,
and the FTND. At the end of the behavioral session participants were scheduled for their
neuroimaging session (when feasible) and paid $25.

29
2.5.2 Neuroimaging session procedures
The neuroimaging session required at least six hours of smoking abstinence, which was confirmed
using CO readings. Participants’ CO readings had to be below either 10 ppm or 60% of their
baseline CO level, whichever was higher. This cutoff differed from the more typical cutoff of 50%
because of the shorter abstinence period (see Sayette & Dimoff 2016) and was selected to balance
inducing a strong cigarette craving with the inherent anxiety of nicotine withdrawal, which might
be exacerbated in the scanner. The experimenter explained the timeline of the session and gave
specific instructions about when during the scan they would be asked to respond via button press.
The participants’ cigarettes were collected to later be used in the cue exposure. The participant
then completed the PANAS, practiced a task unrelated to the current study, and completed a safety
screen with the fMRI technician.
Run one of the neuroimaging scan lasted 74 s and will be referred to as the odor exposure
run. The odor exposure run consisted of a baseline rest period, an odor exposure period, and a final
rest period (Figure 1). During this run, participants were instructed to respond via button press if
they smelled anything. After the odor exposure run, participants flipped their right-hand palm side
up so they could be given objects to hold during the second run. The same research assistant that
operated the odor pulley gave and removed objects from the participant’s hand during the scan,
which was also signaled by laser pointer. A series of cameras in the scanner room made it possible
for the participant to see their own hand and what they are holding, a setup that has worked well
in previous neuroimaging studies within the ASRL (Wilson, Creswell, Sayette, & Fiez, 2013;
Wilson, Sayette, Delgado, & Fiez, 2005; Wilson et al., 2012).
Run two lasted 182 s and will be referred to as the cue exposure run. The cue exposure run
started with the participant holding a neutral cue (a role of tape), followed by holding a cigarette,

30
a procedure that was successfully employed to generate cigarette cravings in prior PPC fMRI
studies (Wilson et al., 2012). Participants were told what they would be holding by a message on
the screen that read “Now you will hold a role of tape” or “Now you will hold your cigarette”.
Next, participants were given either an odor or the odorless pellets. Finally, they rated their urge
to smoke at that moment compared to when they held their cigarette via button press (i.e., lower
urge, the same urge, or higher urge) (Figure 1). Three more functional runs were collected after
these tasks for research questions unrelated to the current study. After the scan, participants
completed a final set of questionnaires, including the debriefing questions, and were paid $55. The
University of Pittsburgh Institutional Review Board approved all procedures.
Figure 1. Timing and content of trials in runs 1 and 2

31
2.6 DATA ANALYSIS
2.6.1 Behavioral measures
Basic demographic and smoking history information was examined for group differences using
between group individual sample t-tests and one-way analyses of variance (ANOVAs). The
experimental behavioral measures included the AIO, which was scored by averaging the responses
on the 8-items, the memory specificity measure, which was a single value, and the self-report
change score, which was obtained during the neuroimaging scan and was treated as a categorical
variable. For all analyses, the Welch statistic was used if the Levene’s Test of Homogeneity of
Variances was violated.
2.6.2 Preprocessing and modeling of the neuroimaging data
Imaging data were collected on a 3T Siemens Allegra equipped with a standard radio frequency
coil. High-resolution structural scans were acquired using a single, high-resolution T1-weighted
(TE/TR 4.53/9848 ms) anatomical scan with 192 slices (0.938 x 0.938 x 1.0 mm voxels).
Functional data was collected across 42 oblique, interleaved slices (3.125 x 3.125 x 3.2 mm voxels,
TE/TR 35/2000 ms, flip angle 90°, FOV = 240 mm).
The neuroimaging data was preprocessed using the Analysis of Functional NeuroImages
(AFNI) software package (Cox, 1996). The first brain volume from each functional run was
discarded to allow for stabilization of the MR signal. The functional images were slice time
(3dTshift) and motion corrected (3dvolreg). For the GLM analyses, images were smoothed with a
Gaussian filter using a smoothing kernel of 6 mm and the motion estimates were included in the

32
group level analyses. AFNI was used to run all of the GLM analyses. For the MVPA, the data were
not smoothed, which is a common practice in MVPA (Mur, Bandettini, & Kriegeskorte, 2009).
Matlab, AFNI, and the Princeton Multi-Voxel Pattern Analysis (MVPA) Toolbox
(https://pni.princeton.edu/pni-software-tools/mvpa-toolbox) were used to process the data for
MVPA. The functional images for all analyses were registered to the skull stripped high-resolution
structural images before each participant’s data were transformed into standard Talairach space
(Talairach & Tournoux, 1988).
Studies of odor processing have found that it is important to model olfactory activation
based upon the perception of the stimuli rather than on the stimulus onset (Cerf-Ducastel &
Murphy, 2004). Because each individual in the pleasant odor group detected their odor at different
times, the odor and post-cigarette odor periods were individually modeled starting when the
participant indicated they smelled their odor (rounded to the closest TR). Because the neutral odor
group never smelled an odor, the mid-point of the odor exposure period (16 s) was used as their
odor onset time.
Unlike the neural response to visual or auditory stimuli, the response to olfactory stimuli
tends to decay rapidly (Tabert et al., 2007). To overcome issues associated with this rapid response
decay, Tabert and colleagues tested several statistical approaches for modeling the response to
odor stimuli in olfactory processing regions. They found that the optimal model fit utilized a six
second ON period, modeled using a double hemodynamic response (HRF) function. In an effort
to optimize the signal-to-noise ratio, the current study modeled the odor periods for six seconds
using a double HRF using the basis function 'SPMG2' in AFNI to mimic as closely as possible the
approach suggested by Tabert and colleagues.

33
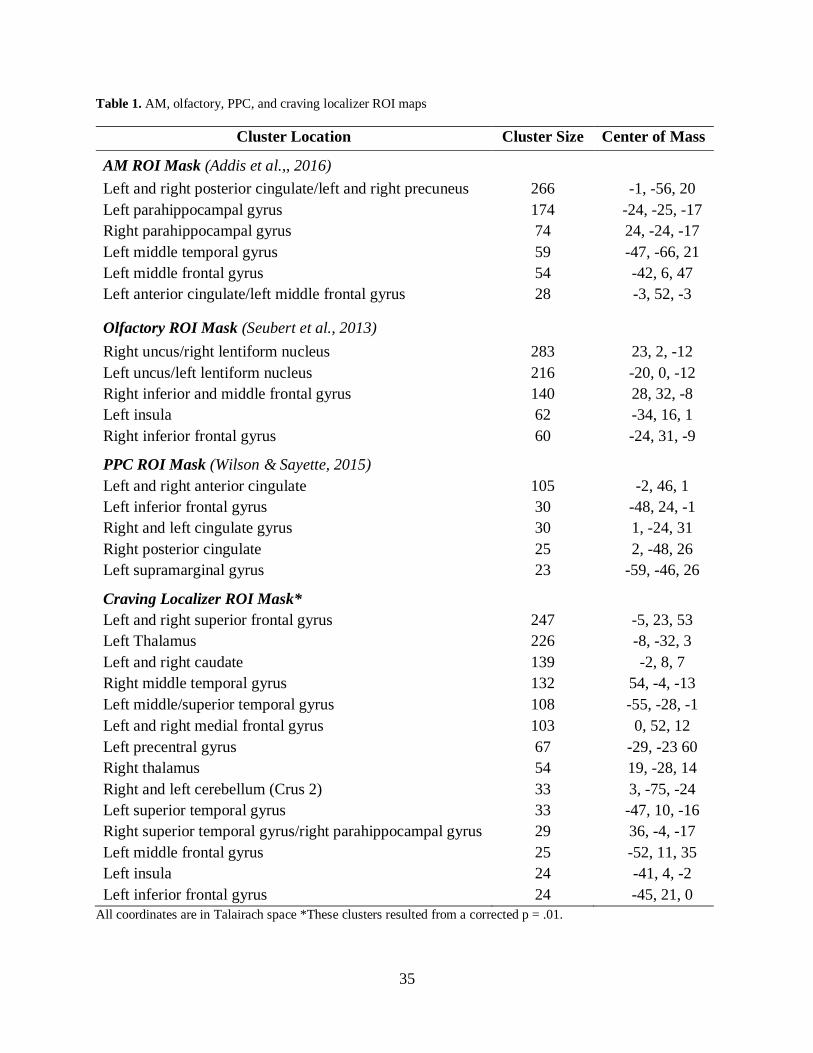
2.6.3 Region of interest selection
Both the MVPA and GLM analyses utilized the same a priori ROIs, including olfactory ROIs,
AM ROIs, and two sets of craving related ROIs (see Table 1). One of the craving ROI masks was
attained via a localizer contrast within the study sample – this ROI map is referred to as the craving
localizer. The craving localizer map was created by comparing the cigarette and tape periods, and
this set of clusters was used to examine the post-cigarette odor period (see Section 3.3.2).
Because this study was not designed to localize either olfactory or memory responses, I
used ROI maps from two meta-analyses of published neuroimaging studies on olfactory and AM
processing. Both of these studies used the Activation Likelihood Estimation (ALE) statistical
approach to generate cluster maps. ALE analyses create cluster maps by first modeling the reported
coordinates from the publications included in the meta-analysis as centers of 3D spheres. The
overlap from these spheres is then compared against a permutation testing generated random
distribution of overlap. The resulting whole-brain map contains estimates of the likelihood of
activation for each voxel based on the areas that were most reliably activated in the reviewed
studies. For a full review of the ALE statistical approach, see Laird et al. (2005).
The olfactory ROIs were drawn from a meta-analysis on the human olfactory cortex
(Seubert, Freiherr, Djordjevic, & Lundström, 2013). Seubert and colleagues used ALE to generate
a set of probability maps from 45 published fMRI and positron emission tomography (PET) studies
of human olfaction. For the current study, clusters identified from their odor and non-odor baseline
comparison were used, which included areas commonly labeled as primary and secondary
olfactory cortex. Addis, Moloney, Tippett, Roberts, and Hach (2016) conducted an ALE meta-
analysis on 32 fMRI and PET studies that assessed AM retrieval compared to a non-memory
related baseline task (e.g., semantic retrieval, rest, visual search). The clusters from the probability
34
map generated by this contrast served as the AM ROI mask for the current study and included
regions typically associated with AM retrieval, such as the thalamus, the hippocampus, and the
medial prefrontal cortex.
Although this study included a localized craving ROI map, a supplemental set of PPC ROIs
was also used to offer a direct contrast of the cigarette and post-cigarette odor periods without
concerns of circular analysis (i.e., using the same data to define and test within an ROI). The PPC
ROIs were attained from an ALE meta-analysis of 12 fMRI studies that induced PCC states by
exposing deprived smokers to cigarette cues (Wilson & Sayette, 2015). The probability map
generated from the cigarette and non-cigarette cue contrast in the dozen PPC studies served as the
PPC ROIs.
The three ALE derived ROI masks were created from their respective probability maps,
which were provided by the authors via personal communication. These were transformed into
standard Talairach space and resampled (AFNI’s 3dresample program) to be in the same reference
space and resolution as the functional data. Although the ALE probability maps were thresholded
to meet significance, an additional cut-off of 20 voxels was applied to the resampled ROI maps
because resampling into the larger voxel size of the functional data resulted in several clusters of
very small size (e.g., 2 voxels). Retaining such small voxel clusters would likely have been
problematic for the ROI based GLM analyses and the MVPA because such small areas of tissue
may suffer from increased noise and are not anatomically meaningful.
35
Table 1. AM, olfactory, PPC, and craving localizer ROI maps
Cluster Location Cluster Size
(Voxels)
Center of Mass
(X,Y,Z) AM ROI Mask (Addis et al.,, 2016)
Left and right posterior cingulate/left and right precuneus 266 -1, -56, 20
Left parahippocampal gyrus 174 -24, -25, -17
Right parahippocampal gyrus 74 24, -24, -17
Left middle temporal gyrus 59 -47, -66, 21
Left middle frontal gyrus 54 -42, 6, 47
Left anterior cingulate/left middle frontal gyrus 28 -3, 52, -3
Olfactory ROI Mask (Seubert et al., 2013)
Right uncus/right lentiform nucleus 283 23, 2, -12
Left uncus/left lentiform nucleus 216 -20, 0, -12
Right inferior and middle frontal gyrus 140 28, 32, -8
Left insula 62 -34, 16, 1
Right inferior frontal gyrus 60 -24, 31, -9
PPC ROI Mask (Wilson & Sayette, 2015)
Left and right anterior cingulate 105 -2, 46, 1
Left inferior frontal gyrus 30 -48, 24, -1
Right and left cingulate gyrus 30 1, -24, 31
Right posterior cingulate 25 2, -48, 26
Left supramarginal gyrus 23 -59, -46, 26
Craving Localizer ROI Mask*
Left and right superior frontal gyrus 247 -5, 23, 53
Left Thalamus 226 -8, -32, 3
Left and right caudate 139 -2, 8, 7
Right middle temporal gyrus 132 54, -4, -13
Left middle/superior temporal gyrus 108 -55, -28, -1
Left and right medial frontal gyrus 103 0, 52, 12
Left precentral gyrus 67 -29, -23 60
Right thalamus 54 19, -28, 14
Right and left cerebellum (Crus 2) 33 3, -75, -24
Left superior temporal gyrus 33 -47, 10, -16
Right superior temporal gyrus/right parahippocampal gyrus 29 36, -4, -17
Left middle frontal gyrus 25 -52, 11, 35
Left insula 24 -41, 4, -2
Left inferior frontal gyrus 24 -45, 21, 0
All coordinates are in Talairach space *These clusters resulted from a corrected p = .01.

36
2.6.4 GLM analyses
For the GLM analyses, one-sided and two-sided t-tests were performed within the ROI and whole
brain group masks for beta coefficients for the stimuli and contrasts of interest (e.g., the odor period
VS the baseline period, the cigarette exposure period VS the post-cigarette odor exposure period)
using 3dttest++. For the GLM analyses, a single, averaged beta coefficient was obtained for every
person for each network of ROIs (i.e., the olfaction, AM, PPC, and craving localizer). These values
were then entered into 3dttest++. This method of combining the clusters for each map was selected
to avoid making too many unadjusted comparisons, which could increase the false discovery rate
of any significant clusters6. To assess the two exploratory aims, the activation within ROI networks
were extracted for each participant for the stimuli and contrasts of interest using the AFNI
3dROIstats program, which averages the beta coefficients within a specified region for each
individual. These values were exported to IBM Statistical Package for the Social Sciences (SPSS)
version 25 to test for statistically significant correlations with the AIO scores and memory
specificity.
2.6.5 Multivariate pattern analyses
One of the two MVPA techniques used in this study, RSA, provides information on how similar
or dissimilar activation is for periods of interest, in this case the cigarette and post-cigarette odor
periods, within specified ROIs. To address the manipulation checks and primary study aim, RSA
6 Because 3dttest++ provides thresholding values based in part on the voxel size of the mask that
is used, using a separate ROI mask for each cluster instead of using a mask that includes all the
clusters being tested would yield thresholding values that were not corrected for the total number
of voxels being tested.

37
was used to attain a correlation value between the following stimuli pairs: baseline and odor,
baseline and post-cigarette odor, odor and post-cigarette odor, cigarette and post-cigarette odor.
This was achieved by comparing the beta coefficients, which were extracted from the convolved
model of the stimuli classes, for each person within each unique cluster within the AM, olfactory,
PPC, and craving ROI maps. These values were Fisher Z transformed before being exported to
SPSS, where they were tested for group differences using between-group, individual sample t-
tests.
The second MVPA technique, classification, followed a machine learning training and
testing procedure. During the training phase, a Gaussian Naive Bayes (GNB) classifier was
provided with the correct stimulus labels (i.e., pleasant or neutral group membership) and the
associated data. Following training, the testing phase began, during which the data was provided
without the stimulus labels. This generated a judgment of the testing data, which was rated for
accuracy (see Norman et al., 2006 for a review of the classification process). For this study, the
classifier was trained and tested on participants while being asked to determine their group
membership. Each participant in-turn served as the test data (‘leave-one-subject-out cross-
validation’) while the classifier was trained on an equal number of individuals from the pleasant
and neural groups. It is important that the classifier trained on an equal amount of data from each
available group, otherwise the classifier could use this information as a factor when classifying the
test data. To remedy the unequal group numbers for training in this study, a random subset of
individuals was sampled from the neutral and pleasant groups so there were equal numbers of both
available for training. This random subsampling was repeated a hundred times for each fold of the
cross-validation (i.e., each time a subject was held-out), which resulted in 100 accuracy values.

38
These 100 accuracy values were averaged into a single accuracy score for each of the convolved
beta coefficients from the stimuli of interest within each of the ROI clusters.
To determine if the classifier accuracy was significantly different than chance (in this case
50%), permutation testing was used to generate a distribution of classification values from data
that have been shuffled randomly (Etzel, 2017; Etzel & Braver, 2013). One thousand random
permutations were run for each stimuli of interest within each ROI cluster. For each of the 1,000
iterations, participants’ data was randomly shuffled before the training and testing phase. These
random distributions were then used to determine the statistical likelihood, up to p = .001, of the
classification accuracy being different than chance. Because the aim of this study was to determine
which classification accuracy values were better than chance, rather than just different from
chance, a one-sided p-value was utilized.
A portion of the classifier results was also used to address both of the exploratory aims. In
addition to an overall accuracy value for the entire sample, the classifier also provided information
about the classification accuracy for each individual for each stimuli and ROI. Because this study
used 100 random samplings for each test case, each participant had an average percentage of times
they were classified correctly (e.g., subject one was classified correctly 70%). Pearson correlations
were used to determine if the person-level classification accuracies during the odor period within
the olfaction and AM ROIs and the post-cigarette odor period within the PPC and craving ROIs
were correlated with odor memory specificity (Exploratory Aim 1) or an individual’s self-reported
attention to odors (Exploratory Aim 2).

39
2.6.6 Power analysis
The current study collected data from 40 participants; 20 in the neutral odor group and 20 in the
pleasant odor group. This sample size was selected based on results from a similar behavioral
study, past neuroimaging studies of craving, and research on the necessary number of participants
for MVPA. In their study of odors and craving reduction, Sayette and Parrott (1999) found an
effect size of d = .51 for pleasant odors to reduce self-report craving. Further, neuroimaging
research using the same smoking cue-exposure manipulation found significant effects of craving
with just ten subjects per group (Wilson et al., 2005). In a recent meta-analysis of MVPA effects,
109 of a possible 110 studies obtained results with 42 or fewer participants (Coutanche, Solomon,
& Thompson-Schill, 2016). As a whole, these separate areas of research suggest that the current
study was adequately powered to assess the primary study aim. Regarding the exploratory aims,
which involve correlational analyses within just the pleasant odor group (N = 20), power was
suboptimal, but the data for these exploratory aims were expected to prove useful for future
investigations.

40
3.0 RESULTS
3.1 DEMOGRAPHICS AND SMOKING CHARACTERISTICS
To determine if the neutral and pleasant groups differed on basic demographic characteristics, one-
way ANOVAs were performed on age, gender, race, ethnicity, education, and income. Of these,
only age differed significantly by group, F(1, 37) = 7.11, p = .011, such that the pleasant group
was younger (M = 29.95, SD = 6.36) than the neutral group (M =35.32, SD = 6.19). Although the
groups differed by age, Pearson correlations between age and several other behavioral measures
of interest (the AIO, the FTND, cigarettes per day, years smoking at their current smoking rate,
self-report craving change score, and memory specificity) found that age was only associated with
years smoking at their current smoking rate, r(37) = .57, p < .001); none of the other correlations
were significant (ps > .43).
Participants, on average, began smoking at 15.69 years old (SD = 3.17 years), smoked
14.46 cigarettes/day (SD = 4.84), had maintained their current rate of smoking for 9.13 years (SD
= 5.93), and tended to prefer menthol cigarettes (67%). Overall, the sample was moderately
dependent on nicotine as assessed by the full FTND (M = 4.64, SD = 2.19). To confirm that
participants had smoked in their typical manner before their first session, a non-abstinent, baseline
CO reading was taken at the start of the first session to confirm their self-reported time since last
cigarette. Participants reported smoking shortly before the session, on average 28.21 minutes (SD
= 34.38) prior to their appointment. This was verified by their high CO readings, which averaged
30.33 ppm (SD = 12.94). Each individual’s baseline CO level was multiplied by 60% to determine

41
their abstinent CO level cutoff. Average abstinent CO levels were 12.51 ppm (SD = 6.13) and were
taken after a reported smoking abstinence period of 10.17 hours (SD = 3.56).
To test for group differences in smoking related measures, ANOVAs were performed on
age of smoking initiation, cigarettes per day, years smoking at current rate, FTND score, and first
and second session CO level and time since last cigarette. With the exception of years smoking at
current smoking rate, F(1,37) = 17.41, p < .001, there were no group differences on these measures
(Fs < 1.45, ps >.23). Those in the neutral group reported 12.53 years (SD = 5.47) at their current
rate while the pleasant group reported 5.90 years (SD = 4.84) at their current rate. Years smoking
at current rate was uncorrelated with other measures of interest, including the FTND, r(37) = .16,
p = .342), cigarettes per day, r(37) = .13, p = .415), the age at which the participant started smoking,
r(37) = .03, p = .865), AIO scores, r(36) = -.09, p = .586), or the self-report craving change score
r(30) = -.25, p = .161).
In summary, although age and years smoking at current smoking rate differed between the
pleasant and neutral groups, these two variables were not found to correlate with other behavioral
measures of interest. Most notably, neither was related to nicotine dependence (FTND), the self-
report craving change, or AIO. Moreover, although the pleasant group was younger than the
neutral group, the age range for this study (18-45 yrs) was well below the age at which olfactory
acuity has been found to decline for pleasant odors (starting in the 60s) (Wysocki & Gilbert, 1989).
Based on the lack of correlation with other behavioral measures of interest and the data on age
related changes in olfaction, age and years at current smoking rate were not included as control
variables.
42
3.2 BEHAVIORAL EXPERIMENTAL MEASURES
3.2.1 State-based affect
State-based affect was measured at three time points during the study via the PANAS, which
contains scales for positive affect and negative affect. The first and second administrations of the
PANAS occurred during the behavioral session, just before and after the odor sampling, allowing
a test for emotion change based on odor sampling. The third administration occurred before the
neuroimaging scan. The first and second administrations were included in the study to assess odor-
related changes in affect and are not discussed further. For the purposes of the current study, which
focuses on the neuroimaging session, only the third administration of the PANAS was assessed as
a way to check for any baseline group differences in pleasant and negative affect prior to the
experimental manipulation. There were no group differences for the positive, t(37) = .91, p = .371,
or negative, t(37) = .71, p = .482, scales of the PANAS, indicating that the groups did not differ
on affect prior to neuroimaging scan.
3.2.2 Craving change
While the primary aim of this study was to assess the neural responses involved in craving, a
behavioral measure of craving was assessed via a change score that was recorded at the end of the
post-cigarette odor exposure period (see Figure 1 for an overview of the scanning timeline). This
score reflects the participant’s estimation of any change in craving from the cigarette exposure
period to immediately after the post-cigarette odor period (a delay of 56 s). Due to data collection
complications, 1 of the 19 neutral participants and 6 of the 20 pleasant participants had an invalid

43
change score. Reasons for the high number of invalid scores included not responding within the
14 s time frame and pressing multiple buttons, thus making it impossible to determine their craving
score. The change score differed significantly between the groups, F(1,22.98) = 6.91, p = .015;
unexpectedly the pleasant group showed more of a craving increase. Three participants in the
neutral group and one in the pleasant group reported their craving had dropped, 14 in the neutral
group and six in the pleasant group reported their craving was the same, and one in the neutral
group and seven in the pleasant group reported their craving had increased.
3.2.3 AIO and memory specificity
To assess the two exploratory aims, two individual difference measures were assessed, the AIO
and memory specificity. Although the exploratory aims only used scores from the pleasant odor
group, all participant’s attention to and importance of odors (measured via the AIO) was assessed
to test for possible group differences. The AIO yields scores ranging from one to four, with one
being the lowest odor attention and importance and four being the highest. On average, the sample
scored 3.00 (SD = .53) and there was no difference between the pleasant and neutral group scores,
F(1,36) = .12, p = .736.
Fourteen individuals in the pleasant group reported a specific memory associated with the
odor they rated as most pleasant. Individual sample t-tests were used to test for differences in AIO
scores, self-reported craving change, and age between those in the pleasant odor group that
reported a memory for their odor and those that did not. AIO scores differed significantly, t(17.10)
= -2.92, p = .009, such that those who reported a memory for their most pleasant odor had higher
AIO scores (M = 3.18, SD = .57) than those that did not have a memory (M = 2.69, SD = .17). The
self-report craving change score, t(12) = -.12, p = .908, and age, t(18) = .10, p = .924), did not

44
differ between those that had a memory and those that did not. Memory specificity was measured
on a one to nine scale, with higher scores indicating more specific memories. Average memory
specificity was high (M = 7.29, SD = 2.05), suggesting that when individuals did recall a memory
in response to their most pleasant odor, the memory was fairly specific.
3.2.4 Pleasant odor characteristics
Each participant in the pleasant odor group was assigned their most pleasant odor from the Semi-
Structured Odor Sampling Interview. In instances where more than one odor had the highest
pleasantness rating, the odor that was associated with a memory was selected7. If more than one
odor had a memory, the one rated as most intense was selected. If intensity ratings were also tied,
a die was rolled to select the odor. Apple was the most popular odor, with eight participants rating
it as their most pleasant odor (40%). Coconut, peppermint, and vanilla were equally popular, with
each being chosen by three participants (15%). Lily was selected twice (10%) and chocolate was
selected once (5%).
Another odor characteristic of importance for this study was the delay in perception for
each odor during the fMRI scan. While most neuroimaging scans of olfaction utilize an
olfactometer, which deliver odors in a consistent, rapid manner via pressurized air, this option
was not possible for the current study. Instead, a hand-operated pulley system was used to
administer the odor. This method of odor delivery created a more gradual administration of the
7 There were two exceptions to this criteria 1) If the odor memory involved alcohol it was not
selected because alcohol and nicotine are often consumed together (Istvan & Matarazzo, 1984)
and may cause cross substance craving 2) If the odor memory induced negative emotion it was
not selected; for example, one participant associated peppermint, which she rated as highly
pleasant, with her recently deceased grandmother.

45
odor, as it relied on passive airflow to circulate the scent of the soaked odor pellets. To determine
how long it took to detect each odor and to see if this differed between odors, the detection time
for each odor was averaged across participants and compared using a one-way ANOVA. On
average, it took participants 14.02 s (SD = 8.49) to detect the apple odor, 17.50 s (SD = 10.73) to
detect coconut, 16.80 s (SD = 10.79) to detect peppermint, 27.17 s (SD = 4.69) to detect vanilla,
16.57 s (SD = 6.55) to detect lily, and 9.83 s (SD = 1.59) to detect chocolate. Although the
difference between the odor detection times was not significant overall, F(5,29) = 1.70, p = .166,
post-hoc comparisons were examined specifically for the vanilla odor because the detection time
was nearly 10 s slower than the next slowest odor (coconut). Post-hoc comparisons found that
vanilla was significantly slower than apple (p = .012) and chocolate (p = .028), and marginally
slower than peppermint, coconut, and lily (ps < .096).
3.3 NEUROIMAGING RESULTS
3.3.1 Manipulation checks
Prior to testing the primary and exploratory aims of the study, two sets of manipulation checks
were performed: one to determine if the PPC paradigm effectively induced craving and one to
determine if the odor exposure technique resulted in odor perception. Both GLM and MVPA were
used for each manipulation check. For the GLM analyses, whole brain voxel-wise and ROI

46
analyses were executed via 3dttest++8 in AFNI. The whole brain analyses used a whole brain
mask, which was created by combining the individual masks of each subject (3dmaskave), while
the ROI analyses used the olfactory, AM, and PPC ROI masks. For the MVPA, RSA and
classification analyses were applied to the odor and craving time points across the ROI masks to
identify any group differences. To accomplish this, correlations between the activation during the
baseline and odor period and the cigarette and neutral cue period were obtained and compared
across groups using t-tests for the RSA. To accomplish the manipulation checks using
classification, overall classification accuracy values were obtained for the odor and cigarette
exposure periods.
3.3.2 Craving induction manipulation check
To evaluate the effectiveness of the cigarette cue exposure paradigm, this time period was
compared to the neutral tape cue using a whole brain voxel-wise analysis. A one-sided t-test of the
entire sample against zero found 6 large positive activation clusters, which included a variety of
well-known craving regions including the bilateral anterior cingulate, caudate, and posterior
cingulate, as well as the left insula (see Figure 2 and Table 2). This cluster map was used as a
craving localizer within the sample at a more stringently corrected threshold, p = .01, to reduce the
size of any one ROI (see Table 1). To determine if there were any group differences in craving
anywhere in the brain, a between-subjects whole brain voxel-wise contrast was performed. Only a
8 A recent change to 3dttest++ results in individual cluster thresholding parameters for each t-
test. For simplicity, the cluster-size and uncorrected p-values for each t-test performed in the
GLM analyses are listed for in Appendix C. All tests were thresholded at a corrected p = .05.

47
single significant cluster was detected in the left cerebellum (voxel size: 31, center of mass: -19, -
31, -48), such that this region was more active in the neutral group compared to the pleasant group.
In addition to the whole brain analyses, ROI analyses were conducted using the PPC
regions to better understand the craving response within a priori craving regions. A within-subjects
comparison found three significant positive clusters within the PPC regions when comparing the
craving response to the tape cue for the entire group (voxel size: 59, center of mass: 1, 46, 1; voxel
size: 25, center of mass: -48, 24, -1; voxel size: 8, center of mass: -57, -45, 26). No significant
clusters were found within the PPC regions when comparing the craving response of the pleasant
and neutral groups, suggesting that the groups did not differ in their craving response within these
a priori regions. Similar to the GLM ROI results, the RSA correlations between the cigarette and
tape periods did not detect any significant group differences across the craving localizer or PPC
ROIs. The classification analysis also failed to find discernable differences between the two groups
during the cigarette exposure period, as reflected by the fact that the classifier did not perform
significantly better than chance (50%) for any of the craving ROIs.
Based on these analyses, it was concluded that the craving paradigm was effective in
inducing a PPC state. In addition, there was a relative lack of differences between the two groups
in terms of craving response, the sole exception being a more active cluster within the left
cerebellum found by a whole brain voxel-wise analysis. This similarity across groups was expected
because the only difference between the groups at the point of the PPC induction was that the
pleasant odor group has been exposure to their odor a few minutes prior.

48
Figure 2. The whole brain voxel-wise group craving comparison
All six clusters were positive, indicating more activation for the cigarette cue as compared to the neutral tap cue.
Table 2. Significant clusters for the whole brain voxel-wise craving comparison
Cluster Location Cluster Size
(Voxels)
Center of Mass
(X,Y,Z)
Left and right caudate and left middle temporal gyrus/left
insula*
1868 -19, -16, 0
Left and right medial and superior frontal gyrus and left
middle frontal gyrus/left pre- and post-central gyrus*
1258 -15, 12, 45
Right middle and superior temporal gyrus 347 51, -6, -13
Right and left cerebellum (Crus 2) 82 3, -74, -25
Left supramarginal gyrus 35 -52, -50, 22
Left posterior cingulate 31 -10, -48, 24
Coordinates are in Talairach space
*Because these clusters are large, they included several distinct regions, the largest of which are noted.

49
3.3.3 Olfactory exposure manipulation check
The second manipulation check tested for differences between the two groups during the odor
exposure period, with the expectation that only the pleasant odor group would show increased
activation in olfactory, and possibly AM, regions. To achieve this manipulation check using GLM
analyses, a set of whole brain voxel-wise analyses were used to compare the baseline and odor
periods both within and between the groups. A one-sided t-test against zero found six negative
activation clusters, including tissue within the right insula and the left putamen, for the neutral
group, indicating that there was less activation in these regions during the odor exposure period
compared to the baseline (see Figure 3, Table 3). No significant clusters were found in the one-
sided t-test for the pleasant odor group. The between group comparison of the odor and baseline
periods did not find any clusters that differed significantly between the groups.
Figure 3. The whole brain voxel-wise odor and baseline comparison within the neutral odor group
All six of the clusters were negative, indicating more activation for the baseline period compared to the odor exposure
period.
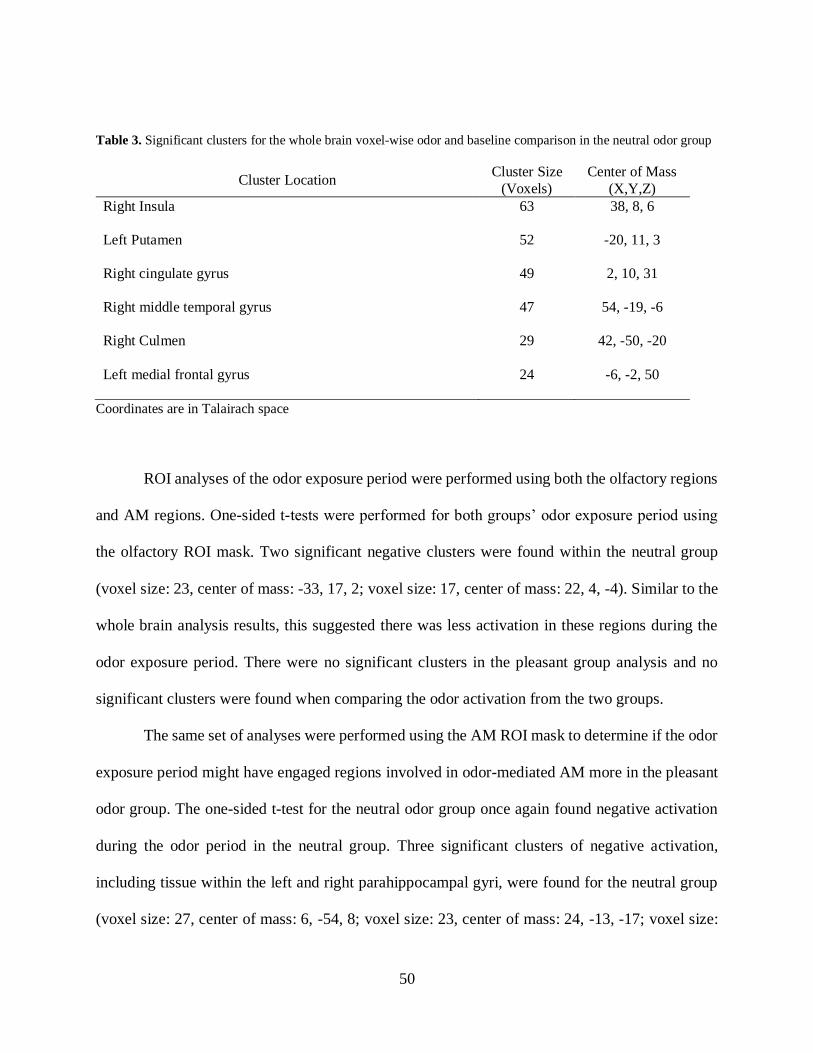
50
Table 3. Significant clusters for the whole brain voxel-wise odor and baseline comparison in the neutral odor group
Cluster Location Cluster Size
(Voxels)
Center of Mass
(X,Y,Z)
Right Insula 63 38, 8, 6
Left Putamen 52 -20, 11, 3
Right cingulate gyrus 49 2, 10, 31
Right middle temporal gyrus 47 54, -19, -6
Right Culmen 29 42, -50, -20
Left medial frontal gyrus 24 -6, -2, 50
Coordinates are in Talairach space
ROI analyses of the odor exposure period were performed using both the olfactory regions
and AM regions. One-sided t-tests were performed for both groups’ odor exposure period using
the olfactory ROI mask. Two significant negative clusters were found within the neutral group
(voxel size: 23, center of mass: -33, 17, 2; voxel size: 17, center of mass: 22, 4, -4). Similar to the
whole brain analysis results, this suggested there was less activation in these regions during the
odor exposure period. There were no significant clusters in the pleasant group analysis and no
significant clusters were found when comparing the odor activation from the two groups.
The same set of analyses were performed using the AM ROI mask to determine if the odor
exposure period might have engaged regions involved in odor-mediated AM more in the pleasant
odor group. The one-sided t-test for the neutral odor group once again found negative activation
during the odor period in the neutral group. Three significant clusters of negative activation,
including tissue within the left and right parahippocampal gyri, were found for the neutral group
(voxel size: 27, center of mass: 6, -54, 8; voxel size: 23, center of mass: 24, -13, -17; voxel size:

51
19, center of mass: -25, -37, -16), while no clusters survived thresholding in the pleasant group
one-sided t-test. The between group comparison yielded two positive clusters (voxel size: 50,
center of mass: 2, -56, 8; voxel size: 27, center of mass: -24, -39, -17), which was driven by the
negative activation within the neutral group.
The RSA odor perception manipulation check correlated the activation for the baseline and
odor periods to test for group differences. One cluster, a right inferior frontal gyrus cluster
(olfactory ROI mask), (t(33) = -2.27, p = .030), was found to differ significantly by group, such
that the neutral group had a negative correlation and the pleasant group had a positive correlation.
This suggests that activation during the baseline and odor periods were more similar for the
pleasant group than the neutral group. The classification analyses failed to find group differences
during the odor period for any of the olfactory or AM ROIs. While the lack of above chance
classification accuracy for the odor period was not expected, it is consistent with several of the
null results found in the GLM analyses for the odor period.
I hypothesized that there would be group differences during the odor period, such that the
pleasant odor group would display positive activation in olfactory and AM regions and there would
be few, if any changes, in the neutral odor group. While this hypothesis was not supported by the
neuroimaging data, the consistent finding of negative activation during the odor period for the
neutral odor group and the difference in correlations from the RSA for one of the olfactory ROIs
was interesting and suggests that the groups did have different responses to their experience during
the odor exposure period. Moreover, the behavioral manipulation check of odor perception
(responding via button press during the scan if an odor was detected) found robust, significant
group differences that support the claim that the odor delivery protocol did yield detectable odors.
Specifically, the number of responses (indicating an odor was detected) during the odor and post-

52
cigarette odor periods were compared across groups using Chi Square tests. There were
significantly more responses to the odor period, X2(1, N = 39) = 18.92, p < .001, and the post-
cigarette odor period, X2 (1, N = 39) = 24.86, p < .001, in the pleasant group. Based on these data,
the primary and exploratory aims of the study were conducted and are reported with the caveat
that the hypothesized increase in olfactory activation for the pleasant odor group during the odor
exposure period was not supported.
3.3.4 Assessing the impact of odor on craving
3.3.4.1 GLM analyses
The primary aim of this study was to assess the neural impact of smelling an odor on the cigarette
craving. To accomplish this using the GLM approach, the activation during the cigarette cue
exposure was compared to the activation during the subsequent odor exposure period across
groups. As with the manipulation checks, both whole brain and ROI analysis approaches were
utilized to assess this craving change. Two ROI maps were utilized: the PPC regions derived from
the ALE analysis (Wilson & Sayette, 2015) and the craving localizer, which consisted of the
clusters identified when comparing the cigarette and tape cues for the entire sample (see Table 1).
The whole brain voxel-wise analysis used to test this aim included two one-sided t-tests,
which were performed separately for the pleasant and neutral groups. Six positive clusters were
identified in the neutral group, reflecting more activation in these clusters during the PPC period
than the post-cigarette odor period, including a portion of the left insula, the posterior left fusiform
gyrus, and visual response regions (right occipital gyrus) (see Table 4 and Figure 4). Two negative
clusters were identified in the pleasant group, one near the left caudate body (voxel size: 29, center
of mass: -18, -17, 30) and one near the right caudate body (voxel size: 48, center of mass: 20, -8,

53
28) (see Figure 5). The negative activation reflects more activation in these clusters during the
post-cigarette odor period compared to the PPC period. A between group, two-sided, whole brain
voxel-wise comparison of the PPC and post-cigarette odor periods identified two significant
negative clusters, one that included tissue in the left superior parietal lobe and precuneus (voxel
size: 30, center of mass: -1, -57, 61) and one that included tissue in the left fusiform gyrus, which
extended into crus 1 in the cerebellum (voxel size: 32, center of mass: -42, -61, -18) (see Figure
6). The negative activation within these clusters was due to increased activation in the neutral odor
group for the PPC period compared to post-cigarette odor period, as compared to the pleasant odor
group’s activation from the PPC period and post-cigarette odor period contrast.
Figure 4. The whole brain voxel-wise odor comparison of the cigarette and post-cigarette odor periods in the neutral
group
All six of the clusters were positive, indicating more activation for the cigarette cue as compared to the post-cigarette
odor cue.
Table 4. Significant clusters for the whole brain voxel-wise cigarette and post-cigarette odor comparison in the
neutral odor group
Cluster Location Cluster Size
(Voxels)
Center of Mass
(X,Y,Z)
Left lingual gyrus 189 -1, -90, 1
Right middle occipital gyrus 185 49, -66, -3

54
Left superior temporal gyrus 64 -52, -28, 16
Right middle occipital gyrus 53 25, -87, 16
Right superior temporal gyrus 46 59, -46, 13
Left declive 31 -41, -63, -17
Coordinates are in Talairach space.
Figure 5. The whole brain voxel-wise odor comparison of the cigarette and post-cigarette odor periods in the
positive group
The two clusters were negative, indicating less activation for the cigarette cue as compared to the post-cigarette odor
cue.

55
Figure 6. The between group, whole brain voxel-wise odor comparison of the cigarette and post-cigarette odor
periods
The two clusters were negative, indicating more activation for the cigarette cue as compared to the post-cigarette odor
cue for the neutral group.
To further examine the craving response change from the cigarette to post-cigarette odor
periods, activation within the PPC regions was examined via one-sided t-tests for the neutral and
pleasant odor groups. These analyses identified one positive significant cluster that straddled the
left and right cingulate gyrus in the neutral group (voxel size: 12, center of mass: 0, -28, 31), which
indicates that this cluster was more active during the cigarette period compared to the post-cigarette
odor period. No significant clusters survived thresholding in the pleasant group. The between
group comparison failed to find any significant clusters that differed between the groups in the
PPC regions. In addition to the PPC ROI analysis, the ROI map from the craving localizer was
applied to the post-cigarette odor period to determine if there were any clusters that differed
significantly between the groups in regions that were found to be more active for the cigarette cue
as compared to the neutral cue. Unlike the PPC ROI analysis, no clusters survived thresholding
within the craving localizer ROIs.

56
Although my hypothesis that there would be significant decreases in neural activation
within craving regions for the pleasant odor group during the post-cigarette odor period was not
supported, the GLM analyses did find evidence of differences in the craving response between the
pleasant and neutral odor groups. The decrease in activation seen in the neutral odor group might
have been expected because the post-cigarette odor period likely induced less craving than a robust
PPC induction. The increased activation in the bilateral caudate for the pleasant odor group during
the post-cigarette odor period was not expected, but may be evidence of pleasant odor processing
operating on same neural substrates linked to craving. Were this to be the case, the Elaborated
Intrusion Theory of Desire (Kavanagh et al., 2005) suggests this would interfere with a craving
response, a possibility that is discussed more in Section 4.2. Based on these findings, the primary
study aim was partially supported, such that significant between group differences were detected.
The one-sided t-test findings for the positive and neutral odor groups also demonstrate that the
groups showed different neural responses to the craving state in certain regions associated with
craving. While the ROI analyses only replicated the whole brain voxel-wise analyses for the
neutral group, it is possible that the craving ROIs for the current study were too limited to capture
the regions that were most effected by smelling the pleasant odor (see Section 4.5 for more
discussion on ROIs).
In addition to assessing craving change via neural activation, this study assessed craving
change via self-report after the post-cigarette odor exposure period. This ordinal self-report score
was correlated with the changes in craving activation within the PPC regions to determine if self-
reported changes in craving were associated with shifts in neurobiological activation. The AFNI
program 3dROIstats was used to extract the activation for each participant across the PPC ROI
map for the craving change comparison (cigarette VS post-cigarette odor). These values were

57
exported to SPSS and correlated with the self-report score using a Spearman’s rank-order
correlation. Contrary to my hypothesis, no significant relationship was found between the self-
reported craving change and the activation from the craving change comparison within the PPC
regions, rs = -.21, p = .243.
3.3.4.2 RSA analyses
The primary aim of this study was also addressed using two types of MVPA, the first of which
was RSA. To test the main study main using RSA, correlations between the baseline and post-
cigarette odor periods, the odor and post-cigarette odor periods, and the cigarette and post-cigarette
odor periods were obtained for each individual across all of the ROIs. Between group t-tests were
performed on these correlations to determine if they differed significantly between groups. Table
5 shows the significant t-test results and the Fisher Z scored correlation values for the neutral and
pleasant groups.
For the baseline and post-cigarette odor period correlations, three ROIs were found to differ
by group: a left parahippocampal gyrus cluster from the olfactory ROI mask, t(36) = 3.62, p =
.001, a left supramarginal gyrus cluster from the PPC ROI mask, t(36) = 2.60, p = .013, and a left
insula cluster from the craving localizer, t(36) = 2.99, p = .005. These three clusters had positive
correlations for the neutral group and negative correlations for the pleasant group, which indicates
that within those regions, activation from the baseline and post-cigarette odor period were less
similar for the pleasant odor group. The lower similarly between these time periods for the pleasant
odor group likely reflects the fact that participants were smelling their pleasant odor. One region
within the PPC ROI mask, the right posterior cingulate, differed by group for the odor and post-
cigarette odor periods, t(32) = -2.42, p = .021. Within this cluster, the neutral group had a negative
correlation while the pleasant group had a positive correlation, thus the odor and post-cigarette
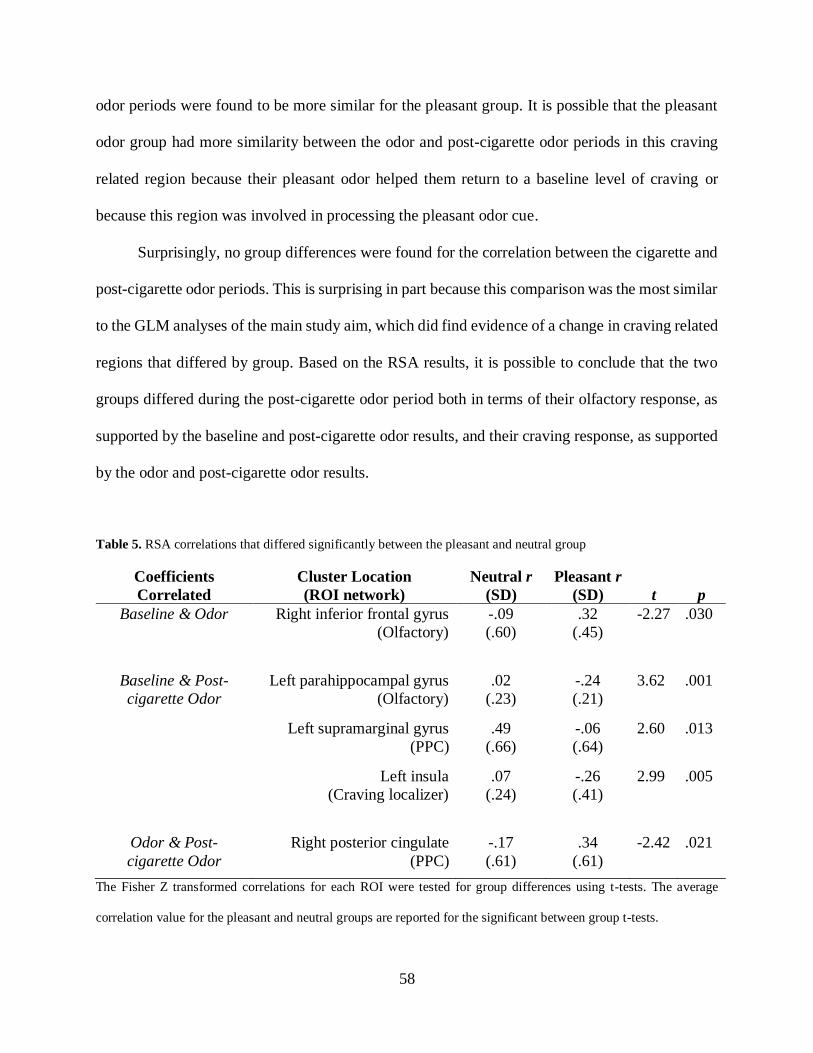
58
odor periods were found to be more similar for the pleasant group. It is possible that the pleasant
odor group had more similarity between the odor and post-cigarette odor periods in this craving
related region because their pleasant odor helped them return to a baseline level of craving or
because this region was involved in processing the pleasant odor cue.
Surprisingly, no group differences were found for the correlation between the cigarette and
post-cigarette odor periods. This is surprising in part because this comparison was the most similar
to the GLM analyses of the main study aim, which did find evidence of a change in craving related
regions that differed by group. Based on the RSA results, it is possible to conclude that the two
groups differed during the post-cigarette odor period both in terms of their olfactory response, as
supported by the baseline and post-cigarette odor results, and their craving response, as supported
by the odor and post-cigarette odor results.
Table 5. RSA correlations that differed significantly between the pleasant and neutral group
Coefficients
Correlated
Cluster Location
(ROI network)
Neutral r
(SD)
Pleasant r
(SD) t p
Baseline & Odor Right inferior frontal gyrus
(Olfactory)
-.09
(.60)
.32
(.45)
-2.27 .030
Baseline & Post-
cigarette Odor
Left parahippocampal gyrus
(Olfactory)
.02
(.23)
-.24
(.21)
3.62 .001
Left supramarginal gyrus
(PPC)
.49
(.66)
-.06
(.64)
2.60 .013
Left insula
(Craving localizer)
.07
(.24)
-.26
(.41)
2.99 .005
Odor & Post-
cigarette Odor
Right posterior cingulate
(PPC)
-.17
(.61)
.34
(.61)
-2.42 .021
The Fisher Z transformed correlations for each ROI were tested for group differences using t-tests. The average
correlation value for the pleasant and neutral groups are reported for the significant between group t-tests.

59
3.3.4.3 Classification analyses
To further test the impact of odors on the neural response to a craving cue (primary aim), a second
type of MVPA, classification, was used to classify each individual as a member of either the neutral
or pleasant odor group. The period of most interest to the current study, the post-cigarette odor
period, resulted in significantly above chance classification for 12 of the 30 ROIs. Within the AM
ROI mask, three ROIs had above chance classification: a cluster that included portions of the left
and right posterior cingulate and precuneus, (accuracy: 72.03%, p = .009), a right parahippocampal
gyrus cluster, (accuracy: 65.05%, p = .039), and a left middle frontal gyrus cluster (accuracy:
68.55%, p = .015). Within the olfactory ROI mask, four ROIs had above chance classification: a
right uncus and lentiform nucleus cluster, (accuracy: 64.58%, p = .031), a left uncus and lentiform
nucleus cluster, (accuracy: 66.16%, p = .04), a right inferior/middle frontal gyrus cluster,
(accuracy: 66.08%, p = .04), and a left insula cluster, (accuracy: 73.58%, p = .003). Within the
PPC ROI mask, one region was found to have above chance classification: a left inferior frontal
gyrus cluster, (accuracy: 65.42%, p = .05). Finally, within the craving localizer ROI mask, four
ROIs had above chance classification accuracies: a cluster that spanned the left and right caudate,
(accuracy: 75.32%, p = .001), a left middle/superior temporal gyrus cluster, (accuracy: 67.82%, p
= .031), a cluster within the medial frontal gyrus that included both left and right hemisphere tissue,
(accuracy: 68.76%, p = .024), and a left inferior frontal gyrus cluster, (accuracy: 66.37%, p = .046).
Overall, activation from the post-cigarette period yielded above chance classification across a
number of key olfactory, AM, and craving related regions. This indicates that the classifier was
able to delineate differences between the neutral and pleasant odor groups based on differences in
the neural response of the two groups during the critical post-cigarette odor period.

60
3.3.5 Exploratory study aims
3.3.5.1 Exploratory GLM analyses
Although power was low, this study included two exploratory aims, the first of which was to assess
if the neural response to an odor, both before and after cigarette cue exposure, differed based on
the specificity of any memory associated with the odor. To address this aim using GLM,
3dROIstats was again used to extract the activation for each participant for the craving change
comparison within the PPC ROI map and the odor exposure period for the olfactory and AM ROI
maps and then exported to SPSS. Odor memory specificity for the 14 participants with a memory
was correlated with the activation from the odor contrast within the olfactory regions and the AM
regions, as well as with the activation from the craving change comparison within the PPC regions.
Memory specificity was not significantly correlated with activation from the odor exposure period
within the olfactory regions, r(9) = .24, p = .473, or the AM regions, r(9) = -.24, p = .480), nor was
it correlated with the craving change contrast in the PPC regions, r(11) = -.08, p = .806). Based on
these preliminary GLM results, individual differences in pleasant odor memory specificity did not
track with changes in the neural response to odors or the effect of odors on craving related
activation.
The second exploratory aim was to test whether self-reported attention to odors in the
environment (i.e., AIO scores) correlated with the neural response to an odor and the craving
change response after smelling an odor. To assess this, AIO scores from the pleasant odor group
were correlated with the activation for the odor exposure period within the olfactory and AM
regions as well as the craving change response in PPC regions. AIO scores were not correlated
with the response to the odor in the olfactory regions, r(14) = .00, p = .996), or the AM regions
r(14) = .02, p = .946). In addition, the craving change response within the PPC regions was not
61
found to correlate with the AIO scores, r(17) = -.15, p = .538). Similar to the memory specificity
findings, person-level differences in attention to and importance of odors does not appear related
to the neural response to odors or odor mediated craving reduction.
3.3.5.2 Exploratory MVPA
MVPA was also employed to address Exploratory Aim 1, which focused on the role of memory
specificity in altering the response to odors both before and after a cigarette cue. The classification
accuracy for each individual was saved from the classification of each stimuli and ROI. This
accuracy percentage was correlated with memory specificity to determine if odor related memory
specificity was related to classification accuracy in olfactory and AM ROIs during the odor period
or in PPC and craving localizer ROIs during the post-cigarette odor period. Pearson correlations
found that memory specificity was correlated with person-level classification accuracy during the
post-cigarette odor period for three of the craving localizer ROIs: a cluster spanning the left and
right superior frontal gyrus r(11) = -.65, p = .017), a cluster in the left and right Crus 2 of the
cerebellum, r(11) = -.61, p = .026), and a left middle frontal gyrus cluster, r(11) = -.69, p = .009).
For all three regions, as memory specificity increased, classification discriminability within these
craving related regions decreased. None of the correlations between memory specificity and
activation for the odor exposure period within the olfactory or AM ROIs were significant.
The person-level classification accuracies were also used to examine Exploratory Aim 2,
which investigated the role of an individual’s self-reported attention to odors (AIO) in neural
responses to the odor. For those in the pleasant odor group, the percentage of time they were
correctly classified during the odor period within the olfaction and AM ROIs, and the percentage
of time they were correctly classified during the post-cigarette odor period within the PPC and
craving ROIs was correlated with their AIO score. During the odor period, classification accuracy

62
within the right parahippocampal gyrus cluster of the AM ROI mask positively correlated with
AIO scores r(14) = .61, p = .012). On the other hand, classification accuracy during the post-
cigarette odor period negatively correlated with AIO scores within a right posterior cingulate
cluster in the PPC ROI mask, r(17) = -.48, p = .040).
The MVPA results for the exploratory aims suggest that more attention to odors in daily life
is associated with more accurate classification of an individual as receiving a pleasant odor during
the odor period in a key AM processing region. This may be because those who are more odor
conscious were more attuned to their pleasant odor during the neuroimaging scan and thus were
easier to distinguish from their neutral odor counterparts. On the other hand, increased attention to
odors in daily life and more specific odor memory were found to decrease classification accuracy
during the post-cigarette odor period. This finding was surprising but may stem from the fact that
craving regions also process reward more generally. In other words, those who were more odor
conscious and who had a specific odor memory may have derived more pleasure from their odor,
making it difficult to classify them as different from the neutral odor group, whose members should
have been experiencing a prolonged craving response.

63
4.0 DISCUSSION
The goal of this study was to contribute neuroimaging data to an emerging behavioral literature
that has found evidence of olfactory mediated cigarette craving reduction. Specifically, two fMRI
analysis techniques, GLM and MVPA, were used to analyze data from 39 moderately nicotine
dependent individuals, who were either exposed to a pleasant or a neutral odor before and after a
PPC induction during an fMRI scan. In addition, behavioral measures of odor related memory
specificity and attention to and importance of odors in daily life (AIO) were collected to probe for
possible memory related mechanisms underlying odor-related craving reduction.
4.1 EFFECTIVENESS OF THE CRAVING INDUCTION AND ODOR EXPSOURE
Prior to examining the primary and exploratory aims of the study, a series of manipulation checks
were performed to ensure that the craving induction protocol increased the urge to smoke as
expected and that the odor delivery method resulted in odor perception for the pleasant odor group.
To examine the efficacy of the craving induction protocol, which was modeled after previous
neuroimaging studies of PPC (Wilson et al., 2005; Wilson et al., 2012; Wilson, Sayette, et al.,
2013), both GLM and MVPA were utilized. Both approaches offered compelling evidence that the
PPC induction was successful in inducing a robust craving experience. In addition, between group
differences were also examined to determine if experiencing a pleasant odor prior to a PPC state
altered craving response. Because the limited research on the use of odors to reduce craving has
focused on their application post-craving, there was no available evidence to inform the possibility

64
of odors serving a protective or preventative role with regard to craving. With one exception, a left
cerebellar cluster found to be more active for the neutral odor group, the manipulation checks did
not find any such effect of pleasant odors on craving.
A similar dual analysis approach was used to examine the neural response to the odor
delivery method. Contrary to my hypothesis, there was no evidence of increased activation in the
pleasant odor group and very little evidence (the single significantly different ROI from the RSA)
of a group difference. Despite the lack of expected increased neural activation within the pleasant
odor group, the behavioral manipulation check used to probe odor perception, the button press
response during the odor and post-cigarette odor period, found that the pleasant odor group was
significantly more likely to report smelling an odor.
It is worth noting that while there was no increase in olfactory and AM ROI activity for
the pleasant odor group, there was a consistent pattern of decreased activation across both the
whole brain voxel-wise and ROI analyses within the neutral odor group. This decrease in activation
during the odor period may have resulted from violated expectations during the odor exposure
period for the neural odor group. Prior to the neuroimaging scan, participants were informed that
during the scan, small cotton pellets would be moved into the scanner bore and they were instructed
to press a button if they smelled an odor at this time. It is possible that because odors had never
been withheld prior to this point (i.e., every time odors were discussed, an odor was presented),
the lack of olfactory stimulation resulted in violated expectations – referred to in perceptual
research as an omission paradigm (den Ouden, Kok, & de Lange, 2012). Perceptual omission
paradigms often find an increase in activity within primary sensory cortices (Kok, Rahnev, Jehee,
Lau, & De Lange, 2011), but interestingly, reward processing research finds that omission of an
expected reward often causes suppressed responding (Schultz, Dayan, & Montague, 1997). It is

65
possible that an omission of an expected, pleasant odor would more closely resemble the pattern
of results found in reward processing research, because of the close overlap of primary olfactory
cortex and reward regions. While this study did not intend to create an omission paradigm for the
neutral odor group, it is possible that the negative activation in the neutral group resulted from this
phenomenon.
The significant group difference found for the behavioral odor perception manipulation
check suggests that the odor delivery method did result in successful odor perception for the
pleasant odor group, which was the overall goal of the odor exposure protocol. While the expected
increase in neural response for the pleasant odor group was not detected, this could be for a variety
of reasons, including how the odor perception was modeled, the intensity of the odors, or even the
expectation that an odor would be experienced. Again, turning to perceptual research, it is not
uncommon to find that expected stimuli has a reduced neural amplitude compared to unexpected
stimuli (Kok, Jehee, & De Lange, 2012). Based on the combined results of the craving induction
and the odor perception manipulation checks, I felt there was sufficient evidence to provide an
initial test of my primary and exploratory study aims.
4.2 PRIMARY STUDY AIM
The primary goal of the current study was to assess the neural impact of smelling a pleasant odor
on intense cigarette cravings, with the expectation that smelling a pleasant odor after a PPC state
(i.e., the cigarette exposure period) would result in reduced activation within craving related
regions. Two distinct methods of neuroimaging analysis were used to accomplish this aim, GLM
66
and MVPA. While these methods provide different types of information, both can be used to test
the efficacy of odors as a means to attenuate the craving response.
The whole brain voxel-wise GLM analyses used in this study found evidence that the
neutral odor group had higher activation in several regions, including the left insula, during the
cigarette cue exposure compared to the post-cigarette odor period. This finding was further
supported by the ROI analysis, which found the neutral group had higher activation within a PPC
ROI cluster that included a portion of the left and right cingulate, again reflecting more activation
in this region during the cigarette cue period. On the other hand, the whole brain voxel-wise
analysis of the positive odor group found an increase in activation within two clusters (the left and
right caudate bodies) from the cigarette to post-cigarette odor period. Finally, a between group t-
test of the whole brain voxel-wise data found the neutral odor group had more activation in two
regions (the left superior parietal lobe/precuneus and the left fusiform gyrus/crus 1) for the
cigarette period (as compared to the post-cigarette odor period) than the positive group.
Taken as a whole, these findings do not support my original hypothesis that the pleasant
odor group would experience a decrease in neural activation within craving regions. Nevertheless,
the GLM results suggest that receiving a pleasant odor after a PPC state (compared to a neutral
odor) did change the neural activation within certain craving related regions. The reduced
activation that was seen in the neutral group may reflect a decrease in craving that is associated
with the passage of time after exposure to a cigarette cue. Evidence of such a decrease in craving
when exposed to a neutral odor can be found in the self-report craving of the neutral odor group
in a recent study of odor attenuated craving by Sayette and colleagues (Under Review). In this
study, individuals who smelled a neutral odor reported an average drop in craving of 11.2 points
(on a 100 point scale), an effect that may be due to the passage of time since their cue exposure.

67
More puzzling is the increase in activation within the bilateral caudate for the positive odor
group after exposure to their pleasant odor. The caudate is known to be involved in reward
processing (Delgado, 2007) and it was hypothesized that smelling a pleasant odor after exposure
to a cigarette cue would result in reduced activation within regions associated with reward. One
possibility is that, contrary to the results of previous behavioral studies, the pleasant odor cue
actually increased cigarette craving. While possible, this seems unlikely given the behavioral
evidence that pleasant odors reduce cigarette cravings. Moreover, if pleasant odors did increase
cigarette craving, one might expect additional craving related regions (like those included in the
PPC and craving localizer ROI masks) to have shown increased activation, which was not the case.
Although not hypothesized, it is possible that processing a pleasant odor could engage the
caudate sufficiently to render an overall increase in activation compared to the cigarette cue. While
drug related rewards often activate reward regions more than non-drug rewards (i.e., a pleasant
odor) in those with dependence (Volkow & Morales, 2015), several unique aspects of reward
processing within the caudate suggest it is possible the increase in activation was a response to the
pleasant odor. The caudate has been found to be sensitive to several nuances of reward, including
the context surrounding the reward (Nieuwenhuis, 2005) as well as it’s motivational context
(Delgado, Stenger, & Fiez, 2004). The pleasant odor group may have had a more robust reward
response within the caudate for the pleasant odor than the cigarette cue because of differences in
reward availability (i.e., the context). Participants were informed before their scan that they would
not be able to smoke until the end of their study session, whereas the reward of the pleasant odor
cue was immediate. Another possibility is that smelling a pleasant odor engaged AM processing,
a function which the caudate has been found to support. Burianova and Grady (2007) conducted a
study to assess common pathways of activation for AM, semantic, and episodic memory retrieval

68
and found that the right caudate was involved in memory processing for all three. Because the
pleasant odor cue evoked memories for nearly 75% of the pleasant odor participants, it is possible
AM processing could have resulted in the increased activation in the caudate during the post-
cigarette odor period.
While the increased activation within the left and right caudate bodies for the pleasant odor
group during the post-cigarette odor period was not expected, there is research to suggest it may
have resulted from the processing of the pleasant odor stimuli. According to the Elaborated
Intrusion Theory of Desire, this should interfere with the craving state because of the utilization of
a shared set of limited resources between a visceral craving state and olfactory cues. Clearly, more
research is needed to further characterize these odor related craving changes, but the current study
results do suggest that processing a pleasant odor, compared to a neutral odor, alters the neural
response following a strong cigarette craving.
The primary aim of this study was also addressed using two types of MVPA, RSA and
classification. While no group differences were found for the correlation between the cigarette and
post-cigarette odor periods using RSA, group differences were found for the baseline and post-
cigarette odor period correlations within three ROIs. Within all three of these RIOs, the baseline
and post-cigarette odor periods were less correlated for the pleasant odor group compared to the
neutral odor group. A group difference was also discovered for the odor and post-cigarette odor
period within the right posterior cingulate (PPC ROI mask), such that activation during these time
periods was more correlated for the pleasant group. Despite the lack of a group difference between
the cigarette and post-cigarette odor periods, the group differences found between the baseline and
post-cigarette odor periods as well as the odor and post-cigarette odor periods suggest that the
activation changes for these periods differed as a result of experiencing a pleasant odor after a PPC

69
state. While RSA cannot speak to directionality in terms of these differences, it still contributes to
the primary study aim by providing further evidence of a group difference, particularly for the
baseline and post-cigarette odor periods.
The MVPA classification results from this study included accuracy values for the odor,
cigarette, and post-cigarette odor periods. Notably, for the post-cigarette odor period, the classifier
accuracy was significantly above chance for 12 of the 30 ROIs, including clusters within all four
of the ROI masks (olfactory, AM, PPC, and craving localizer). This classification performance
indicates that there were sufficient activation differences between the neutral and pleasant odor
groups during the post-cigarette odor period within these ROIs to allow for systematic accuracy
classification. Overall, the MVPA results demonstrate that there were distinguishable differences
between the two groups for the post-cigarette odor period. While these classification data cannot
be used to make claims about the direction of activation differences within craving regions, it can
aid in identifying which ROIs seem to best represent these group differences. In sum, the GLM
and MVPA results offer neural evidence to support the claim that when nicotine dependent
individuals smell a pleasant odor after exposure to a cigarette cue, there is a significant change in
the response of craving related brain regions and these individuals are distinguishable via neural
response from participants that received a neutral odor.
4.2.1 Self-reported craving change
Although this study was primarily concerned with assessing the response to craving and olfactory
cues via fMRI, a behavioral assessment of craving change was included in an effort to bridge the
previous behavioral work on olfactory mediated craving reduction with the current study findings.
The hypothesized response to the self-report craving change measure was not found. In fact,

70
according to the self-report measure of craving, the positive odor group experienced an increase
in craving after smelling a pleasant odor. This finding is inconsistent with larger behavioral studies
that have found olfactory cues to result in reduced cigarette craving (Sayette et al., Under Review;
Sayette & Parrott, 1999) and is considered in detail in section 4.4.
4.2.2 Exploratory study aims
This study also contained two exploratory aims, the first of which investigated the role of memory
specificity for the pleasant odors and how this might modify the response to odors both before and
after a cigarette cue. Both GLM and MVPA analyses were used to assess this exploratory aim.
Memory specificity was not found to correlate with the odor or craving response using the
traditional GLM analyses, but the MVPA classifier did find differences in individual’s
classification accuracy based on memory specificity. Odor memory specificity was negatively
correlated with classification accuracy during the post-cigarette odor period in three of the craving
localizer ROIs (a left and right superior frontal gyrus cluster, a cluster in the left and right Crus 2
of the cerebellum, and a left middle frontal gyrus cluster). An unexpected but intriguing finding
was that those with more specific odor memories were less likely to be accurately classified in
regions related to craving. This was unexpected in the sense that one might expect a more specific
odor related memory to render a pleasant odor participant more different (i.e., easier to accurately
classify) than a neutral odor participant. A possible explanation for this finding is that processing
a specific odor related memory caused increased activation within the same regions that were
active during a continued experience of craving, thus making it difficult to distinguish those in the
pleasant odor group who experienced a specific memory from those in the neutral group.
71
The second exploratory aim investigated the role of an individual’s self-reported attention
to odors (AIO) in neural responses to the odor. Similar to the findings for first exploratory aim,
the GLM analyses failed to find any significant differences based on AIO scores, while the MVPA
individual level classification results found a significant difference for the odor and post-cigarette
odor periods. During the odor period, classification accuracy within one of the AM ROIs (a right
parahippocampal gyrus cluster) was found to positively correlate with AIO scores, suggesting that
those who reported more attention to odors in their day-to-day life were easier to accurately
classify as receiving a pleasant odor within this neural tissue. During the post-cigarette odor period,
AIO scores were negatively correlated with classification accuracy within a PPC ROI mask (a
right posterior cingulate cluster). This finding is similar to what was seen with the memory
specificity results for the first exploratory aim and was equally unexpected. It may be the case that
those in the pleasant odor group who were most attuned to odors in daily life were harder to
distinguish from the neutral odor group because their odor perception resulted in increased
activation within craving regions, which often also process responses to pleasant, rewarding
stimuli.
Although preliminary, these exploratory findings suggest that odor memory specificity and
attention to odor in daily life (AIO) both meaningfully alter the neural response to an odor
following a PPC induction (as well as before in the case of AIO scores). Several of the findings
were unexpected with regard to how they impacted classification accuracy of pleasant odor
participants across different time points of the study. Because the power of this study was limited
with regard to the exploratory aims, more research is needed to clarify the role of memory
specificity and attention to odor in daily life in cigarette craving reduction. Future studies of
olfactory attenuated craving may want to deliberately manipulate the level of odor related memory

72
specificity to more carefully evaluate why having a more specific memory associated with an odor
cue would result in less accurate classification within craving related regions. Moreover, future
studies may want to include a measure of odor attention and importance for study participants, as
this could alter their responsiveness to odors as craving reduction tools.
4.3 USE OF GLM AND MVPA TECHNIQUES
This study utilized two distinct neuroimaging techniques to address the manipulation checks and
primary and exploratory study aims. The use of GLM analysis to evaluate neuroimaging data is
extremely common and has contributed significantly to the field’s understanding of the
neurobiological underpinnings of cigarette craving. MVPA is a more recently adopted
neuroimaging analysis technique that has been found to be more sensitive to fine grained changes
than GLM analyses, but until the current study, had never been applied to a neuroimaging study
of cigarette craving.
While both of these analysis methods were used to assess the same aims, they, by their
very nature, produced different types of information – GLM results are often discussed in terms of
activation change (increases or decreases of activity of activation), whereas MVPA results reflect
group or stimuli differences without an indication of the activation direction involved in the
difference. Both of these analysis techniques contributed important information to the current
study, but it is important to note that both have strengths and weaknesses that may impact their use
based on the needs of the research. For example, a strength of the GLM approach is that measuring
directional changes in activation between stimulus classes or groups is, for many researchers, a
straightforward method of accessing neural response and may be sufficient to answer their research
73
questions. One of GLM’s largest limitations is the fact that it cannot take into account the overall
pattern of activation, which can differ across voxels while still resulting in the same ‘average’
amount of activation. This limitation is perhaps the biggest strength of MVPA - for a review of
this concept see Coutanche, 2013. By utilizing multivariate information, MVPA techniques can
tap into the information that is reflected across multiple features (voxels), which is why it has been
found to be more sensitive to certain contrasts than the GLM approach.
In the current study, the results of the GLM and MVPA techniques proved to be largely
complimentary. While the GLM results allowed for directional conclusions between the stimulus
classes and groups, the MVPA results were more sensitive to group differences, particularly for
the exploratory aims, for which the GLM analyses did not find any significant differences. In
addition, the two techniques contributed important, unique information across the study ROIs. For
the GLM analyses, the ROI maps were used as networks to avoid excessive multiple comparisons.
For the RSA and classification analyses, the ROIs within each map were kept as unique clusters
because testing on ROIs with too many voxels can result in challenges regarding the classification
process. Because of these different restrictions surrounding the use of ROIs, the GLM and MVPA
results contributed different information, in particular the MVPA results allowed for a more
targeted understanding of the origin of any group differences, while the GLM results reflected
average activation across a network of ROIs.
When considering which analysis techniques to utilize for a neuroimaging study, there are
a variety of parameters to keep in mind, including study design, which can impact the analyses
that can be performed, and the study aims, which should guide the analytic approach used because
they will shape the conclusions that can be drawn. With regard to study design, this study found
that MVPA can be used to analyze single exposure craving data, a finding that may allow future

74
studies of craving to include MVPA, either as a primary or supplementary technique. Importantly,
the current study found that using both MVPA and GLM resulted in a more comprehensive
understanding of the effect of odors on cigarette craving. While not every study would necessarily
benefit from using both analysis techniques, the unique constraints presented by studying craving
(e.g., the single exposure of stimuli) as well as the unexplored nature of the neural response to
olfactory cues during a PPC state made using both GLM and MVPA a reasonable choice. Indeed,
by using both approaches, there was more evidence to support the findings of the main study aim.
In addition, the MVPA results suggested that the individual difference measures of interest in the
exploratory aims, which were not supported by the GLM analyses, did alter the odor and craving
response and thus might warrant further research with a more adequately powered study. Overall,
the combination of analysis techniques strengthened the results and conclusions that could be
drawn about the neural impact of odors on cigarette craving.
4.4 LIMITATIONS
This study had several limitations. Perhaps most impactful was the limitation of the olfactory
delivery system used in this study; due to technical issues and scanner restrictions associated with
the two available olfactometers, a human operated pulley system was used. This method of odor
delivery may have resulted in a suboptimal delivery of the odor stimuli compared to the odor
delivery performance that would be expected from an olfactometer. For example, there was
considerable lag time for the perception for all of the odors used in this study (the shortest of which
was roughly 10 s) and the lag time was highly variable between odors and participants. Because
olfactometers can be programed to synchronize with the scanner signals and use pressurized air to

75
deliver olfactory stimuli, it is unlikely they would suffer from extended perception lag time or
excessive perception variability.
Moreover, because this study modeled the odor period based on when participants reported
perceiving the odor, the apparent slow diffusion of the odors from the pellets may have made it
difficult for the participants to detect the start of the odor and resulted in a slow response time.
While research suggests that modeling odor stimuli based on perception is preferable to modeling
it at the start of stimuli presentation (Cerf-Ducastel & Murphy, 2004), this work also utilized an
automated odor delivery system. As a result, the findings from Ducastel and Murphy may not
generalize to the current study. Despite these odor delivery related limitations, I believe this study
was successful in administering an odor stimulus in the scanner based on the behavioral responses
of the pleasant odor group for the odor exposure period. In addition, I believe that modeling the
odor based on the reported perception time was the best possible approach due to the unique
habituation properties of olfactory stimuli (Tabert et al., 2007). Based on the findings of this study,
future research on odor attenuated craving may want to utilize an olfactometer to permit a stronger
test of odors on craving reduction.
Another limitation of the current study is the self-report craving change measure that was
used to behaviorally assess craving. The absence of urge ratings in the expected direction,
however, is not uncommon in relatively small (compared to behavioral studies) fMRI studies of
craving response (see Wilson et al., 2013). Moreover, many behavioral craving studies assess
craving at several time points, which allows participants to simply note their urge at various
moments (change due to cue exposure and craving reduction strategies is then inferred by
contrasting these real time values (Sayette et al., Under Review; Sayette & Parrott, 1999)). The
current study instead measured self-report craving only once, as a change score, which required
76
participants to recall their urge prior to receiving the odor. It is possible that the conditions of the
neuroimaging scan (e.g., lack of control over the odor experience, discomfort at being in the
scanner) rendered the odor stimuli ineffective, although if this were the case, one would expect the
self-report craving change score to be similar across groups. In light of the conflicting information
provided by this study’s self-report measure of craving when compared to two behavioral studies
of olfaction that have found odors to reduce behavioral results of craving, I am hesitant to infer
conclusions from this measure without additional evidence.
Though speculative, one possible reason for the unexpected findings with the self-report
craving change score is that it tapped into the fact that the pleasant odor group did experience a
change (i.e., smelling an odor), while the neutral group did not experience a change. Alternatively,
the odor may have worked as intended, meaning the pleasant odor group was distracted from their
craving by the odor, but assessing craving after the post-cigarette odor period reoriented them to
their craving state, making their craving experience seem more intense than that of the neutral odor
group. Unfortunately, because this study only assessed craving via self-report once, it is not
possible to resolve the conflicting findings of the self-report craving score and the neuroimaging
data. Use of self-reported urge in the scanner remains a challenging issue. Future studies may want
to employ a different behavioral measure of craving, such as magnitude estimation (Sayette et al.,
2000), which is a type of change score that requires people to quantitively assess how their craving
has changed (e.g., “Imagine your craving was a 10 while you held your cigarette, if your craving
is double what it was, it would be a 20, if it is half, it would be five”), or a non-verbal expression
of craving, such as a dynamometer, which measures squeeze force and duration (Creswell et al.,
2018).

77
A final limitation of the current study is the high percentage of individuals screened
ineligible for study participation. For safety reasons, individuals with certain types of metal in their
body (e.g., non-removeable piercings or bullet fragments) or who had tattoos on or above their
neck were not able to be scanned; these individuals made up 28.97% of those screened out. The
scanner table at the imaging site has a weight limit of 250 lbs and 20.34% of telephone screened
individuals reported being over or within five pounds of the scanner weight limit, rendering them
ineligible. The majority of those deemed ineligible by the phone screen, however, were excluded
because they reported a current or continued diagnosis of a psychiatric disorder or were taking or
had taken psychoactive medication within the last 6 months (34.48%). While excluding for
psychiatric illness or psychoactive medication is common in fMRI studies, because of the concern
that these medications can alter neural response (Phillips, Travis, Fagiolini, & Kupfer, 2008), the
proportion of those with psychiatric illness is much higher in the smoking population than in
typical health control groups (Lasser et al., 2000; Lawrence, Mitrou, & Zubrick, 2009). Excluding
individuals with mental illness or that are currently on psychoactive mediation may mean that
study results are less generalizable to an everyday smoker. This study was not powered to explore
how mental health diagnoses and mediation might alter the efficacy of odor stimuli for cigarette
craving, but future studies might want to include these individuals to generalize their findings.
4.5 FUTURE DIRECTIONS
This study provides evidence that olfactory cues can affect neural responses to cigarette craving.
Future research on odor-attenuated craving can build upon these findings in a variety of ways to
advance the field of cigarette craving attenuation. This study was not adequately powered to draw

78
firm conclusions on the role of memory specificity’s impact on odor facilitated craving reduction,
but it does provide neuroimaging support to behavioral research (Sayette et al., Under review;
Sayette & Parrott, 1999) that suggests memory specificity might play an important role in the
mechanism of olfactory mediated craving reduction. Future studies might more directly test the
role of memory specificity by contrasting individuals with highly specific odor related memories
and those with absolutely no memory association for their pleasant odor. Although the current
study asked participants to sample six unique odors, and the majority of those in the pleasant
condition reported having a specific memory for their pleasant odor (70%), studies of odor and
memory find that personalizing odors for participants may be the most efficient way to elicit strong
emotional and memory responses (Herz et al., 2004). Based on the evidence from this and other
studies of olfactory mediated craving reduction, it would be interesting to test a highly personalized
odor with a strong, specific memory association as an especially strong craving reduction tool.
Including those with and without specific odor related memories would also permit a test
of another possible mechanism underlying odor attenuated craving relief, affect management.
Pleasant odors may also work to reduce craving by increasing positive affect, which could occur
in conjunction with specific memory retrieval or independently. According to the DSM–5
(American Psychiatric Association, 2013), negative affect and depression frequently occur during
nicotine withdrawal. For smokers who are more sensitive to certain aspects of smoking abstinence,
for example those with a history of depression (Mendelsohn, 2012) or Non-Hispanic African
American smokers (Bello et al., 2016), inducing a positive affective state via a pleasant odor may
be particularly effective at combating these troubling withdrawal symptoms (Baker, Morse, &
Sherman, 1986). Future studies may want to investigate the role of odor mediated affect

79
management, both in the presence and absence of specific memories, to better understand the
possible paths through which odors impact craving response.
Another direction for future research would be to use anatomically defined ROIs or to
include a set of localizer tasks. Due to time constraints, it was impossible to include a localizer
task for odor and AM processing in the current study. Instead, published ALE meta-analyses of
published neuroimaging studies were used to derive the study’s ROIs. This approach was used
rather than relying on anatomically defined ROIs in an effort to locate specific neural tissue that
uniquely supports olfactory, AM, and PPC processing. While ALE studies rely on a number of
studies that include specific contrasts of interest, they are limited to the same constraints of any
meta-analysis (e.g., time frame restrictions, publishing language restrictions) and may not apply
precisely to the current study specifications. Because olfactory processing regions and craving
related regions do share close overlap, it may be particularly important for future studies to localize
the neural response to pleasant odors, odors that prompt AM retrieval, and PPC induction
paradigms within their participants.
This study compared the effects of a pleasant odor on craving to the effects of a neutral
odor on craving, but future research may wish to include a non-olfactory sensory stimulus (e.g.,
auditory) as a contrast. While prior work has found olfactory cues to be more effective at relieving
food cravings than auditory cues (Kemps & Tiggemann, 2013), alternate sensory modalities of
craving relief have not been tested with cigarette cravings, thus it is not known if they would result
in similar changes in craving response. It is possible that a non-olfactory stimulus, such as a
favorite song, would be just as or more effective than a pleasant olfactory cue if an individual
reported a stronger interest in or connection with auditory stimuli compared to olfactory stimuli.

80
This work may be challenging as it requires generating stimuli across modalities of similar
intensity, but it offers another possible direction for research on non-nicotine based craving relief.
Finally, while this and other studies of odor attenuated cigarette craving have focused on
using odors to reduce an existing craving, it is possible that exposure to an odor stimulus before
being exposed to a cigarette cue would work to inhibit or diminish a future craving. If odors work
by re-orienting attention or utilizing limited processing resources, then pre-treatment with an odor
could lessen the impact of the cigarette cue on overall craving. While the present data generally
did not support this possibility (with the exception of the finding that the neutral odor group had a
cluster of higher activation than the pleasant odor group in the left cerebellum during craving)
future studies that manipulate the odor pretreatment in a variety of ways might be useful. Such
efforts to “head off” strong cravings before they start may be warranted, particularly because
studies across a range of substances find that once detected, appetitive drug cues strongly capture
attention (Ehrman et al., 2002; Lubman, Peters, Mogg, Bradley, & Deakin, 2000; Sayette et al.,
1994).
4.6 IMPLICATIONS
The findings of this study add to a small, but growing set of behavioral studies about the
effectiveness of olfactory cues for craving reduction by providing neuroimaging data that suggests
smelling a pleasant olfactory cue after a craving induction can alter the neural response compared
to smelling a neutral olfactory cue. While this study does have limitations, including the robustness
of the odor delivery paradigm and the self-report craving assessment, it also provides a wealth of
data for future studies on olfaction and craving, including some promising preliminary results on

81
the role of specific odor memories in craving reduction. Even with the above caveats, this study
provides an important next step in understanding odor mediated cigarette craving reduction and
can serve as a roadmap for future neuroimaging studies of olfactory attenuated craving.
The information learned from this study has theoretical, methodological, and clinical
implications for craving research. From a conceptual perspective, theories of craving, such as the
Elaborated Intrusion Theory of Desire (Kavanagh et al., 2005) suggest that tasks in the same
modality compete for resources. By engaging regions that process olfactory cues, which overlap
with craving regions, it should be possible to effectively lessen the effect of cigarette cues. The
results from the pleasant odor group may lend support to this idea. Although it cannot be confirmed
without more research, it is possible that the increase in activation within the bilateral caudate for
the pleasant odor group was the result of processing a pleasant odor cue. In addition, the findings
from the exploratory aims of this study can inform research aimed at testing possible mechanisms
underlying the ability of odors to relieve cravings. Both AM processes and individual differences
in odor perception were found to relate to the neural response to a pleasant odor. Further research
into these factors could help shed light on what aspects of olfaction should be targeted when
pursuing craving relief.
Methodologically, this study’s results suggest that MVPA techniques can be used
successfully to analyze craving research, which would seem to present specific challenges to
MVPA, such as single exposures to stimuli. Not only did MVPA confirm several of the findings
from the GLM analyses, it was also successful in delineating group differences when the GLM
was not, which was particularly evident for the exploratory study aims. The successful
implementation of MVPA in the present study supports its continued use to study craving, which

82
may lead to advances because MVPA can provide more nuanced and detailed information about
stimulus processing.
Clinically, this study suggests that certain neural structures linked to craving and reward
processing are altered by experiencing a positive odor after a craving induction. When considered
in the context of several prior behavioral studies suggesting that self-reported urges are attenuated
by odors, this work supports continued testing of the efficacy and mechanisms of this novel craving
relief method, which is easy to use and does not contain nicotine. A variety of questions remain
about using olfactory cues for craving relief: for whom do odors work best, which processes
underlie the efficacy of odors for craving relief, and do odors work to combat cravings as well in
real-world settings. The use of odors to reduce cravings may not replace pharmacological quit aids,
but the addition of even a single tool in our toolbelt for combating craving is an exciting prospect
and may prove useful in conjunction with existing intervention approaches.

83
APPENDIX A
ALPHABETICAL LIST OF BEHAVIORAL MEASURES USED IN THE STUDY
Attention to and Importance of Odors Questionnaire
Contemplation Ladder
Demographics
Fagerstrom Test for Nicotine Dependence
Nicotine Dependence Syndrome Scale
Positive and Negative Affect Schedule
Revised NEO personality inventory
Semi-Structured Odor Sampling Interview
Smoking History Questionnaire
Social Reward Questionnaire
Survey of Autobiographical Memory
Visualizer/Verbalizer Questionnaire

84
APPENDIX B
ODOR DETAILS
1. Apple (International Flavors and Fragrance (IFF) corporation), 10% concentration applied
to two pellets
2. Lily (IFF), 25% concentration applied to two pellets
3. Vanilla (IFF), 5% concentration applied to three pellets
4. Coconut (Giant Eagle cooking extract), full concentration applied to two pellets
5. Peppermint (Giant Eagle cooking extract), full concentration applied to two pellets
6. Chocolate (Hershey’s chocolate), three unwrapped milk chocolate kisses

85
APPENDIX C
THRESHOLDING VALUES FOR 3DTTEST++ ANALSES
Table 6. Thresholding parameters for whole brain voxel-wise GLM tests
Description of comparison Activation comparison
(beta weights)
Test type
(sample size)
Thresholding for
corrected p = .05
(cluster size,
uncorrected p)
Craving response overall for the entire sample Cigarette - Tape One sided t-test (39) 29, .001
Craving response between groups Cigarette - Tape Two sample t-test (39) 29, .001
Odor response in neutral group Odor - Baseline One sided t-test (19) 23, .001
Odor response in positive group Odor - Baseline One sided t-test (16) 18, .001
Difference between odor response by group Odor - Baseline Two sample t-test (35) 27, .001
Post-cigarette odor response in neutral group
Post-cigarette odor -
Baseline One sided t-test (19) 25 .001
Post-cigarette odor response in positive group
Post-cigarette odor -
Baseline One sided t-test (19) 17, .001
Difference between post-cigarette odor
response by group
Post-cigarette odor -
Baseline Two sample t-test (38) 24, .001
Craving change response in neutral group
Cigarette - Post-cigarette
odor One sided t-test (19) 24, .001
Craving change response in positive group
Cigarette - Post-cigarette
odor One sided t-test (19) 18, .001
Difference between craving change response
by group
Cigarette - Post-cigarette
odor Two sample t-test (38) 25, .001

86
Table 7. Thresholding parameters for ROI GLM tests
Description of
comparison ROI Mask
Activation comparison
(beta weights)
Test type
(sample size)
Thresholding for
corrected p = .05
(cluster size,
uncorrected p)
Odor response in neutral
group Olfactory Odor - Baseline One sided t-test (19) 15, .010
Odor response in positive
group Olfactory Odor - Baseline One sided t-test (16) 11, .010
Difference between odor
response by group Olfactory Odor – Baseline
Two sample t-test
(35) 15, .010
Craving change response
in neutral group Olfactory
Cigarette - Post-cigarette
odor One sided t-test (19) 15, .010
Craving change response
in neutral group Olfactory
Cigarette - Post-cigarette
odor One sided t-test (19) 13, .010
Difference between
craving change response
by group Olfactory
Cigarette - Post-cigarette
odor
Two sample t-test
(38)
16, .010
Odor response in neutral
group AM Odor - Baseline One sided t-test (19) 14, .010
Odor response in positive
group AM Odor - Baseline One sided t-test (16) 15, .010
Difference between odor
response by group AM Odor - Baseline
Two sample t-test
(35) 17, .010
Craving change response
in neutral group AM
Cigarette - Post-cigarette
odor One sided t-test (19) 15, .010
Craving change response
in neutral group AM
Cigarette - Post-cigarette
odor One sided t-test (19) 13, .010
Difference between
craving change response
by group AM
Cigarette - Post-cigarette
odor
Two sample t-test
(38)
15, .010
Craving response overall
for the entire sample PPC Cigarette - Tape One sided t-test (39) 8, .010
Craving response between
groups PPC Cigarette - Tape
Two sample t-test
(39) 9, .010
Craving change response
in neutral group PPC
Cigarette - Post-cigarette
odor One sided t-test (19) 8, .010
Craving change response
in neutral group PPC
Cigarette - Post-cigarette
odor One sided t-test (19) 6, .010
Difference between
craving change response
by group PPC
Cigarette - Post-cigarette
odor
Two sample t-test
(38)
8, .010
Difference between post-
cigarette odor response by
group
Craving
localizer Post-cigarette odor
Two sample t-test
(38)
18, .010

87
BIBLIOGRAPHY
Abrams, D. B., Monti, P. M., Carey, K. B., Pinto, R. P., & Jacobus, S. I. (1988). Reactivity to
smoking cues and relapse: Two studies of discriminant validity. Behaviour Research and
Therapy, 26(3), 225-233. doi:https://doi.org/10.1016/0005-7967(88)90003-4
Addis, D. R., Moloney, E. E., Tippett, L. J., Roberts, R. P., & Hach, S. (2016). Characterizing
cerebellar activity during autobiographical memory retrieval: ALE and functional
connectivity investigations. Neuropsychologia, 90, 80-93.
American Psychiatric Association. (2013). Diagnostic and Statistical Manual of Mental
Disorders (DSM-5®). Washington, DC: American Psychiatric Pub.
Antin, T. M. J., Lipperman-Kreda, S., & Hunt, G. (2015). Tobacco Denormalization as a Public
Health Strategy: Implications for Sexual and Gender Minorities. American Journal of
Public Health, 105(12), 2426-2429. doi:10.2105/Ajph.2015.302806
Arshamian, A., Iannilli, E., Gerber, J. C., Willander, J., Persson, J., Seo, H. S., . . . Larsson, M.
(2013). The functional neuroanatomy of odor evoked autobiographical memories cued by
odors and words. Neuropsychologia, 51(1), 123-131.
doi:10.1016/j.neuropsychologia.2012.10.023
Baddeley, A. D., & Hitch, G. (1974). Working Memory. In G. H. Bower (Ed.), Psychology of
learning and motivation (Vol. 8, pp. 47-89): Academic Press.
Baker, T. B., Japuntich, S. J., Hogle, J. M., McCarthy, D. E., & Curtin, J. J. (2006). Pharmacologic
and behavioral withdrawal from addictive drugs. Current Directions in Psychological
Science, 15(5), 232-236.
Baker, T. B., Morse, E., & Sherman, J. E. (1986). The motivation to use drugs: A psychobiological
analysis of urges. Nebraska Symposium on Motivation, 34, 257-323.
Baldinger, B., Hasenfratz, M., & Bättig, K. (1995). Switching to ultralow nicotine cigarettes:
Effects of different tar yields and blocking of olfactory cues. Pharmacology Biochemistry
and Behavior, 50(2), 233-239. doi:https://doi.org/10.1016/0091-3057(94)00302-Y
Bello, M. S., Pang, R. D., Cropsey, K. L., Zvolensky, M. J., Reitzel, L. R., Huh, J., & Leventhal,
A. M. (2016). Tobacco Withdrawal Amongst African American, Hispanic, and White
Smokers. Nicotine & Tobacco Research, 18(6), 1479-1487. doi:10.1093/ntr/ntv231
Benowitz, N. L., Jacob III, P., Ahijevych, K., Jarvis, M. J., Hall, S., LeHouezec, J., . . . Tsoh, J.
(2002). Biochemical verification of tobacco use and cessation. Nicotine & Tobacco
Research, 4(2).

88
Benowitz, N. L., Porchet, H., Sheiner, L., & Jacob, P. (1988). Nicotine absorption and
cardiovascular effects with smokeless tobacco use: Comparison with cigarettes and
nicotine gum. Clinical Pharmacology & Therapeutics, 44(1), 23-28.
Brandon, T. H., Tiffany, S. T., Obremski, K. M., & Baker, T. B. (1990). Postcessation cigarette
use: The process of relapse. Addictive Behaviors, 15(2), 105-114. doi:10.1016/0306-
4603(90)90013-N
Bray, B. C., Smith, R. A., Piper, M. E., Roberts, L. J., & Baker, T. B. (2016). Transitions in
Smokers' Social Networks After Quit Attempts: A Latent Transition Analysis. Nicotine &
Tobacco Research, 18(12), 2243-2251. doi:10.1093/ntr/ntw173
Burianova, H., & Grady, C. L. (2007). Common and unique neural activations in autobiographical,
episodic, and semantic retrieval. Journal of Cognitive Neuroscience, 19(9), 1520-1534.
Centers for Disease Control and Prevention. (2011). Quitting smoking among adults--United
States, 2001-2010. MMWR. Morbidity and mortality weekly report, 60(44), 1513-1519.
Cerf-Ducastel, B., & Murphy, C. (2004). Improvement of fMRI data processing of olfactory
responses with a perception-based template. NeuroImage, 22(2), 603-610.
doi:10.1016/j.neuroimage.2004.01.021
Chu, S., & Downes, J. J. (2002). Proust nose best: Odors are better cues of autobiographical
memory. Memory & Cognition, 30(4), 511-518. doi:10.3758/BF03194952
Clark-Polner, E., Wager, T. D., Satpute, A. B., & Barret, L. F. (2016). Neural fingerprinting: Meta-
analysis, variation, and the search for brain-based essences in the science of emotion. In L.
F. Barrett, M. Lewis, & J. M. Haviland-Jones (Eds.), Handbook of Emotions (4th ed., pp.
146–165): Guilford Press.
Conklin, C. A., Vella, E. J., Joyce, C. J., Salkeld, R. P., Perkins, K. A., & Parzynski, C. S. (2015).
Examining the relationship between cue-induced craving and actual smoking.
Experimental and Clinical Psychopharmacology, 23(2), 90-96.
doi:http://dx.doi.org/10.1037/a0038826
Cooney, N. L., Litt, M. D., Morse, P. A., Bauer, L. O., & Gaupp, L. (1997). Alcohol cue reactivity,
negative-mood reactivity, and relapse in treated alcoholic men. Journal of Abnormal
Psychology, 106(2), 243-250. doi:http://dx.doi.org/10.1037/0021-843X.106.2.243
Cordell, B., & Buckle, J. (2013). The effects of aromatherapy on nicotine craving on a US campus:
A small comparison study. The Journal of Alternative and Complementary Medicine,
19(8), 709-713.
Coutanche, M. N. (2013). Distinguishing multi-voxel patterns and mean activation: Why, how,
and what does it tell us? Cognitive, Affective, & Behavioral Neuroscience, 13(3), 667-673.

89
Coutanche, M. N., Solomon, S. H., & Thompson-Schill, S. L. (2016). A meta-analysis of fMRI
decoding: Quantifying influences on human visual population codes. Neuropsychologia,
82, 134-141.
Cox, R. W. (1996). AFNI: Software for Analysis and Visualization of Functional Magnetic
Resonance Neuroimages. Computers and Biomedical Research, 29(3), 162-173.
doi:10.1006/cbmr.1996.0014
Crawford, J. R., & Henry, J. D. (2004). The Positive and Negative Affect Schedule (PANAS):
Construct validity, measurement properties and normative data in a large non‐clinical
sample. British Journal of Clinical Psychology, 43(3), 245-265.
Creswell, K. G., Sayette, M. A., Schooler, J. W., Wright, A. G. C., & Pacilio, L. E. (2018). Visceral
States Call for Visceral Measures: Verbal Overshadowing of Hunger Ratings Across
Assessment Modalities. Assessment, 25(2), 173-182. doi:10.1177/1073191116645910
Delgado, M. R. (2007). Reward‐related responses in the human striatum. Annals of the New York
Academy of Sciences, 1104(1), 70-88.
Delgado, M. R., Stenger, V. A., & Fiez, J. A. (2004). Motivation-dependent responses in the
human caudate nucleus. Cerebral Cortex, 14(9), 1022-1030.
Den Ouden, H. E., Kok, P., & De Lange, F. P. (2012). How prediction errors shape perception,
attention, and motivation. Frontiers in Psychology, 3, 548. doi:10.3389/fpsyg.2012.00548
Dimsdale-Zucker, H. R., & Ranganath, C. (2019). Representational Similarity Analyses: A
Practical Guide for Functional MRI Applications. In Handbook of Behavioral
Neuroscience (Vol. 28, pp. 509-525). Elsevier.
Donny, E. C., Griffin, K. M., Shiffman, S., & Sayette, M. A. (2008). The relationship between
cigarette use, nicotine dependence, and craving in laboratory volunteers. Nicotine &
Tobacco Research, 10(3), 447-455.
Due, D. L., Huettel, S. A., Hall, W. G., & Rubin, D. C. (2002). Activation in mesolimbic and
visuospatial neural circuits elicited by smoking cues: Evidence from functional magnetic
resonance imaging. American Journal of Psychiatry, 159(6), 954-960.
Ehrman, R. N., Robbins, S. J., Bromwell, M. A., Lankford, M. E., Monterosso, J. R., & O'Brien,
C. P. (2002). Comparing attentional bias to smoking cues in current smokers, former
smokers, and non-smokers using a dot-probe task. Drug and Alcohol Dependence, 67(2),
185-191.
Engen, T. (1974). Method and theory in the study of odor preferences. Human responses to
environmental odors, 121-141.
90
Etzel, J. A. (2017, June). MVPA significance testing when just above chance, and related
properties of permutation tests. In Pattern Recognition in Neuroimaging (PRNI), 2017
International Workshop on (pp. 1-4).
Etzel, J. A. (2015, June). MVPA permutation schemes: permutation testing for the group level.
In Pattern Recognition in NeuroImaging (PRNI), 2015 International Workshop on (pp. 65-
68).
Etzel, J. A., Cole, M. W., Zacks, J. M., Kay, K. N., & Braver, T. S. (2015). Reward motivation
enhances task coding in frontoparietal cortex. Cerebral Cortex, 26(4), 1647-1659.
Fagerström, K. (2000). Nicotine replacement therapies. In R. Ferrence, J. Slade, R. Room, & M.
Pope (Eds.), Nicotine and public health (pp. 199-207). Washington: American Public
Health Association.
Fedoroff, I. D. C., Polivy, J., & Herman, C. P. (1997). The Effect of Pre-exposure to Food Cues
on the Eating Behavior of Restrained and Unrestrained Eaters. Appetite, 28(1), 33-47.
doi:https://doi.org/10.1006/appe.1996.0057
Ferguson, S. G., & Shiffman, S. (2009). The relevance and treatment of cue-induced cravings in
tobacco dependence. Journal of Substance Abuse Treatment, 36(3), 235-243.
Field, M., Munafò, M. R., & Franken, I. H. A. (2009). A meta-analytic investigation of the
relationship between attentional bias and subjective craving in substance abuse.
Psychological Bulletin, 135(4), 589-607. doi:http://dx.doi.org/10.1037/a0015843
Franklin, T. R., Wang, Z., Wang, J., Sciortino, N., Harper, D., Li, Y., . . . Childress, A. R. (2007).
Limbic activation to cigarette smoking cues independent of nicotine withdrawal: A
perfusion fMRI study. Neuropsychopharmacology, 32, 2301. doi:10.1038/sj.npp.1301371
Friston, K. J., Holmes, A. P., Worsley, K. J., Poline, J. P., Frith, C. D., & Frackowiak, R. S. (1994).
Statistical parametric maps in functional imaging: A general linear approach. Human Brain
Mapping, 2(4), 189-210.
Gottfried, J. A. (2006). Smell: Central nervous processing. In H. T. & W.-L. A. (Eds.), Taste and
Smell: An Update (Vol. 63, pp. 44-69): Karger Publishers.
Hackshaw, A., Morris, J. K., Boniface, S., Tang, J.-L., & Milenković, D. (2018). Low cigarette
consumption and risk of coronary heart disease and stroke: Meta-analysis of 141 cohort
studies in 55 study reports. BMJ, 360. doi:10.1136/bmj.j5855
Hamburg, M. A., & Collins, F. S. (2010). The path to personalized medicine. New England Journal
of Medicine, 363(4), 301-304.

91
Heatherton, T. F., Kozlowski, L. T., Frecker, R. C., & Fagerstrom, K.-O. (1991). The Fagerström
Test for Nicotine Dependence: A revision of the Fagerstrom Tolerance Questionnaire.
British Journal of Addiction, 86(9), 1119-1127. doi:10.1111/j.1360-0443.1991.tb01879.x
Herz, R. S. (2002). Influences of Odors on Mood and Affective Cognition. In C. Rouby, B. Schaal,
D. Dubois, R. Gervais, & A. Holley (Eds.), Olfaction, Taste, and Cognition (pp. 160-177).
New York: Cambridge University Press.
Herz, R. S. (2004). A naturalistic analysis of autobiographical memories triggered by olfactory
visual and auditory stimuli. Chemical Senses, 29(3), 217-224. doi:10.1093/chemse/bjh025
Herz, R. S., & Cupchik, G. C. (1992). An Experimental Characterization of Odor-Evoked
Memories in Humans. Chemical Senses, 17(5), 519-528. doi:DOI
10.1093/chemse/17.5.519
Herz, R. S., Eliassen, J., Beland, S., & Souza, T. (2004). Neuroimaging evidence for the emotional
potency of odor-evoked memory. Neuropsychologia, 42(3), 371-378.
doi:10.1016/j.neuropsychologia.2003.08.009
Herz, R. S., & Schooler, J. W. (2002). A Naturalistic Study of Autobiographical Memories Evoked
by Olfactory and Visual Cues: Testing the Proustian Hypothesis. The American Journal of
Psychology, 115(1), 21-32. doi:10.2307/1423672
Hiscock, R., Bauld, L., Amos, A., Fidler, J. A., & Munafo, M. (2012). Socioeconomic status and
smoking: A review. Annals of the New York Academy of Sciences, 1248(1), 107-123.
doi:10.1111/j.1749-6632.2011.06202.x
Hjalmarson, A., Franzon, M., Westin, A., & Wiklund, O. (1994). Effect of nicotine nasal spray on
smoking cessation: A randomized, placebo-controlled, double-blind study. Archives of
Internal Medicine, 154(22), 2567-2572. doi:10.1001/archinte.1994.00420220059007
Istvan, J., & Matarazzo, J. D. (1984). Tobacco, alcohol, and caffeine use: a review of their
interrelationships. Psychological Bulletin, 95(2), 301.
Jamal, A., Phillips, E., Gentzke, A. S., Homa, D. M., Babb, S. D., King, B. A., & Neff, L. J. (2018).
Current Cigarette Smoking Among Adults—United States, 2016. Morbidity and Mortality
Weekly Report, 67(2), 53.
Janes, A. C., Gilman, J. M., Frederick, B. B., Radoman, M., Pachas, G., Fava, M., & Evins, A. E.
(2018). Salience network coupling is linked to both tobacco smoking and symptoms of
attention deficit hyperactivity disorder (ADHD). Drug and Alcohol Dependence, 182
(Supplement C), 93-97. doi:https://doi.org/10.1016/j.drugalcdep.2017.11.005
Janes, A. C., Pizzagalli, D. A., Richardt, S., Chuzi, S., Pachas, G., Culhane, M. A., ... & Kaufman,
M. J. (2010). Brain reactivity to smoking cues prior to smoking cessation predicts ability
to maintain tobacco abstinence. Biological psychiatry, 67(8), 722-729.
doi:10.1016/j.biopsych.2009.12.034

92
Jellinek, E. M. (1960). The disease concept of alcoholism. New Haven, CT, US: Hillhouse Press.
Kavanagh, D. J., Andrade, J., & May, J. (2005). Imaginary Relish and Exquisite Torture: The
Elaborated Intrusion Theory of Desire. Psychological Review, 112(2), 446-467.
doi:http://dx.doi.org/10.1037/0033-295X.112.2.446
Kemps, E., & Tiggemann, M. (2013). Olfactory stimulation curbs food cravings. Addictive
Behaviors, 38(2), 1550-1554.
Kemps, E., Tiggemann, M., & Bettany, S. (2012). Non-food odorants reduce chocolate cravings.
Appetite, 58(3), 1087-1090.
Killen, J. D., & Fortmann, S. P. (1997). Craving is associated with smoking relapse: Findings from
three prospective studies. Experimental and Clinical Psychopharmacology, 5(2), 137.
Kline, N. A., & Rausch, J. L. (1985). Olfactory Precipitants of Flashbacks in Post-traumatic Stress
Disorder: Case Reports. Journal of Clinical Psychiatry, 46, 383-384.
Kober, H., Kross, E. F., Mischel, W., Hart, C. L., & Ochsner, K. N. (2010). Regulation of craving
by cognitive strategies in cigarette smokers. Drug and Alcohol Dependence, 106(1), 52-
55. doi:10.1016/j.drugalcdep.2009.07.017
Kok, P., Jehee, J. F., & De Lange, F. P. (2012). Less is more: expectation sharpens representations
in the primary visual cortex. Neuron, 75(2), 265-270.
Kok, P., Rahnev, D., Jehee, J. F., Lau, H. C., & De Lange, F. P. (2011). Attention reverses the
effect of prediction in silencing sensory signals. Cerebral cortex, 22(9), 2197-2206.
Laird, A. R., Fox, P. M., Price, C. J., Glahn, D. C., Uecker, A. M., Lancaster, J. L., ... & Fox, P.
T. (2005). ALE meta‐analysis: Controlling the false discovery rate and performing
statistical contrasts. Human Brain Mapping, 25(1), 155-164.
Lasser, K., Boyd, J. W., Woolhandler, S., Himmelstein, D. U., McCormick, D., & Bor, D. H.
(2000). Smoking and mental illness: A population-based prevalence study. JAMA, 284(20),
2606-2610. doi:10.1001/jama.284.20.2606
Lawless, H., & Engen, T. (1977). Associations to odors: Interference, mnemonics, and verbal
labeling. Journal of Experimental Psychology: Human Learning and Memory, 3(1), 52-59.
doi:10.1037/0278-7393.3.1.52
Lawrence, D., Mitrou, F., & Zubrick, S. R. (2009). Smoking and mental illness: Results from
population surveys in Australia and the United States. BMC Public Health, 9(1), 285.
doi:10.1186/1471-2458-9-285

93
Loewenstein, G. (1996). Out of Control: Visceral Influences on Behavior. Organizational
Behavior and Human Decision Processes, 65(3), 272-292. doi:10.1006/obhd.1996.0028
Lubman, D. I., Peters, L. A., Mogg, K., Bradley, B. P., & Deakin, J. F. W. (2000). Attentional bias
for drug cues in opiate dependence. Psychological Medicine, 30(1), 169-175.
May, J., Andrade, J., Panabokke, N., & Kavanagh, D. (2010). Visuospatial tasks suppress craving
for cigarettes. Behaviour Research and Therapy, 48(6), 476-485.
doi:https://doi.org/10.1016/j.brat.2010.02.001
McClernon, F. J., Hiott, F. B., Huettel, S. A., & Rose, J. E. (2005). Abstinence-induced changes
in self-report craving correlate with event-related fMRI responses to smoking cues.
Neuropsychopharmacology, 30, 1940. doi:10.1038/sj.npp.1300780
Megerdichian, C. L., Rees, V. W., Wayne, G. F., & Connolly, G. N. (2007). Internal Tobacco
Industry Research on Olfactory and Trigeminal Nerve Response to Nicotine and Other
Smoke Components. Nicotine & Tobacco Research, 9(11), 1119-1129.
doi:10.1080/14622200701648458
Mendelsohn, C. (2012). Smoking and depression: A review. Australian Family Physician, 41(5),
304.
Morissette, S. B., Palfai, T. P., Gulliver, S. B., Spiegel, D. A., & Barlow, D. H. (2005). Effects of
Transdermal Nicotine During Imaginal Exposure to Anxiety and Smoking Cues in College
Smokers. Psychology of Addictive Behaviors, 19(2), 192-198.
doi:http://dx.doi.org/10.1037/0893-164X.19.2.192
Mur, M., Bandettini, P. A., & Kriegeskorte, N. (2009). Revealing representational content with
pattern-information fMRI—an introductory guide. Social Cognitive and Affective
Neuroscience, 4(1), 101-109.
Naqvi, N. H., & Bechara, A. (2009). The hidden island of addiction: The insula. Trends in
Neurosciences, 32(1), 56-67. doi:https://doi.org/10.1016/j.tins.2008.09.009
Nieuwenhuis, S., Heslenfeld, D. J., von Geusau, N. J. A., Mars, R. B., Holroyd, C. B., & Yeung,
N. (2005). Activity in human reward-sensitive brain areas is strongly context
dependent. Neuroimage, 25(4), 1302-1309.
Norman, K. A., Polyn, S. M., Detre, G. J., & Haxby, J. V. (2006). Beyond mind-reading: Multi-
voxel pattern analysis of fMRI data. Trends in Cognitive Sciences, 10(9), 424-430.
doi:http://dx.doi.org/10.1016/j.tics.2006.07.005
Oliver, J. A., MacQueen, D. A., & Drobes, D. J. (2013). Deprivation, craving, and affect:
Intersecting constructs in addiction. Principles of Addiction (pp. 395-403): Elsevier.

94
Perkins, K. A., Ciccocioppo, M., Jacobs, L., Doyle, T., & Caggiula, A. (2003). The subjective and
reinforcing effects of visual and olfactory stimuli in alcohol drinking. Experimental and
Clinical Psychopharmacology, 11(4), 269.
Perkins, K. A., Gerlach, D., Vender, J., Grobe, J., Meeker, J., & Hutchison, S. (2001). Sex
differences in the subjective and reinforcing effects of visual and olfactory cigarette smoke
stimuli. Nicotine & Tobacco Research, 3. doi:10.1080/14622200110043059
Phillips, M. L., Travis, M. J., Fagiolini, A., & Kupfer, D. J. (2008). Medication effects in
neuroimaging studies of bipolar disorder. American Journal of Psychiatry, 165(3), 313-
320.
Ray, R., Schnoll, R. A., & Lerman, C. (2009). Nicotine Dependence: Biology, Behavior, and
Treatment. Annual Review of Medicine, 60(1), 247-260.
doi:10.1146/annurev.med.60.041707.160511
Risinger, R. C., Salmeron, B. J., Ross, T. J., Amen, S. L., Sanfilipo, M., Hoffmann, R. G., . . .
Stein, E. A. (2005). Neural correlates of high and craving during cocaine self-
administration using BOLD fMRI. NeuroImage, 26(4), 1097-1108.
doi:https://doi.org/10.1016/j.neuroimage.2005.03.030
Robinson, T. E., & Berridge, K. C. (1993). The neural basis of drug craving: An incentive-
sensitization theory of addiction. Brain Research Reviews, 18(3), 247-291.
Ruscio, A. C., Muench, C., Brede, E., & Waters, A. J. (2016). Effect of Brief Mindfulness Practice
on Self-Reported Affect, Craving, and Smoking: A Pilot Randomized Controlled Trial
Using Ecological Momentary Assessment. Nicotine & Tobacco Research, 18(1), 64-73.
doi:10.1093/ntr/ntv074
Sarter, M., Givens, B., & Bruno, J. P. (2001). The cognitive neuroscience of sustained attention:
Where top-down meets bottom-up. Brain Research Reviews, 35(2), 146-160.
doi:https://doi.org/10.1016/S0165-0173(01)00044-3
Sayette, M. A. (2016). The Role of Craving in Substance Use Disorders: Theoretical and
Methodological Issues. Annual Review of Clinical Psychology, 12(1), 407-433.
doi:10.1146/annurev-clinpsy-021815-093351
Sayette, M. A., & Dimoff, J. D. (2016). In search of anticipatory cigarette cravings: The impact of
perceived smoking opportunity and motivation to seek treatment. Psychology of Addictive
Behaviors, 30(3), 277-286. doi:10.1037/adb0000177
Sayette, M. A., Griffin, K. M., & Sayers, W. M. (2010). Counterbalancing in Smoking Cue
Research: A Critical Analysis. Nicotine & Tobacco Research, 12(11), 1068-1079.
doi:10.1093/ntr/ntq159

95
Sayette, M. A., & Hufford, M. R. (1994). Effects of cue exposure and deprivation on cognitive
resources in smokers. Journal of Abnormal Psychology, 103(4), 812.
Sayette, M. A., Marchetti, M., Herz, R. S., Martin, L. M., & Bowdring, M. A. (Under Review).
Pleasant Olfactory Cues Can Reduce Cigarette Craving
Sayette, M. A., Martin, C. S., Wertz, J. M., Shiffman, S., & Perrott, M. A. (2001). A multi-
dimensional analysis of cue-elicited craving in heavy smokers and tobacco chippers.
Addiction, 96(10), 1419-1432. doi:10.1080/09652140120075152
Sayette, M. A., Monti, P. M., Rohsenow, D. J., Gulliver, S. B., Colby, S. M., Sirota, A. D., ... &
Abrams, D. B. (1994). The effects of cue exposure on reaction time in male
alcoholics. Journal of Studies on Alcohol, 55(5), 629-633.
Sayette, M. A., & Parrott, D. J. (1999). Effects of olfactory stimuli on urge reduction in smokers.
Experimental and Clinical Psychopharmacology, 7(2), 151-159.
doi:http://dx.doi.org/10.1037/1064-1297.7.2.151
Sayette, M. A., Shiffman, S., Tiffany, S. T., Niaura, R. S., Martin, C. S., & Shadel, W. G. (2000).
The measurement of drug craving. Addiction, 95 Suppl 2(8s2), S189-210.
doi:10.1046/j.1360-0443.95.8s2.8.x
Sayette, M. A., & Tiffany, S. T. (2013). Peak provoked craving: An alternative to smoking cue-
reactivity. Addiction, 108(6), 1019-1025. doi:10.1111/j.1360-0443.2012.04013.x
Schultz, W., Dayan, P., & Montague, P. R. (1997). A neural substrate of prediction and
reward. Science, 275(5306), 1593-1599.
Seubert, J., Freiherr, J., Djordjevic, J., & Lundström, J. N. (2013). Statistical localization of human
olfactory cortex. NeuroImage, 66, 333-342.
doi:https://doi.org/10.1016/j.neuroimage.2012.10.030
Shadel, W. G., Niaura, R., & Abrams, D. B. (2001). Effect of different cue stimulus delivery
channels on craving reactivity: Comparing in vivo and video cues in regular cigarette
smokers. Journal of Behavior Therapy and Experimental Psychiatry, 32(4), 203-209.
doi:https://doi.org/10.1016/S0005-7916(01)00035-0
Shiffman, S., Paty, J. A., Gnys, M., Kassel, J. A., & Hickcox, M. (1996). First lapses to smoking:
Within-subjects analysis of real-time reports. Journal of Consulting and Clinical
Psychology, 64(2), 366.
Shiffman, S., Shadel, W. G., Niaura, R., Khayrallah, M. A., Jorenby, D. E., Ryan, C. F., &
Ferguson, C. L. (2003). Efficacy of acute administration of nicotine gum in relief of cue-
provoked cigarette craving. Psychopharmacology, 166(4), 343-350. doi:10.1007/s00213-
002-1338-1

96
Sobel, K. V., Gerrie, M. P., Poole, B. J., & Kane, M. J. (2007). Individual differences in working
memory capacity and visual search: The roles of top-down and bottom-up processing.
Psychonomic Bulletin & Review, 14(5), 840-845. doi:10.3758/BF03194109
Srivastava, E., Russell, M., Feyerabend, C., Masterson, J., & Rhodes, J. (1991). Sensitivity and
tolerance to nicotine in smokers and nonsmokers. Psychopharmacology, 105(1), 63-68.
Stead, L. F., Perera, R., Bullen, C., Mant, D., Hartmann-Boyce, J., Cahill, K., & Lancaster, T.
(2012). Nicotine replacement therapy for smoking cessation. Cochrane Database of
Systematic Reviews, 11(11).
Tabert, M. H., Steffener, J., Albers, M. W., Kern, D. W., Michael, M., Tang, H., . . . Devanand, D.
P. (2007). Validation and optimization of statistical approaches for modeling odorant-
induced fMRI signal changes in olfactory-related brain areas. NeuroImage, 34(4), 1375-
1390. doi:10.1016/j.neuroimage.2006.11.020
Talairach, J., & Tournoux, P. (1988). Co-planar stereotaxic atlas of the human brain: 3-
dimensional proportional system: an approach to cerebral imaging.
Tang, D. W., Fellows, L. K., Small, D. M., & Dagher, A. (2012). Food and drug cues activate
similar brain regions: A meta-analysis of functional MRI studies. Physiology & Behavior,
106. doi:10.1016/j.physbeh.2012.03.009
Tiffany, S. T., & Wray, J. M. (2012). The clinical significance of drug craving. Annals of the New
York Academy of Sciences, 1248(1), 1-17. doi:10.1111/j.1749-6632.2011.06298.x
Tiffany, S., Cox, L. S., & Elash, C. A. (2000). Effects of transdermal nicotine patches on
abstinence-induced and cue-elicited craving in cigarette smokers. Journal of Consulting
and Clinical Psychology, 68(2), 233.
US Department of Health and Human Services. (2014). The health consequences of smoking—50
years of progress: A report of the Surgeon General. Atlanta, GA: US Department of Health
and Human Services, Centers for Disease Control and Prevention, National Center for
Chronic Disease Prevention and Health Promotion, Office on Smoking and Health, 17.
Versland, A., & Rosenberg, H. (2007). Effect of brief imagery interventions on craving in college
student smokers. Addiction Research & Theory, 15(2), 177-187.
doi:10.1080/16066350701200582
Volkow, N., & Morales, M. (2015). The brain on drugs: from reward to addiction. Cell, 162(4),
712-725. doi: 10.1016/j.cell.2015.07.046.
Washington, H. A. (2002). Burning love: Big tobacco takes aim at LGBT youths. American
Journal of Public Health, 92(7), 1086-1095.

97
Waters, A. J., Shiffman, S., Sayette, M. A., Paty, J. A., Gwaltney, C. J., & Balabanis, M. H. (2004).
Cue-Provoked Craving and Nicotine Replacement Therapy in Smoking Cessation. Journal
of Consulting and Clinical Psychology, 72(6), 1136-1143.
doi:http://dx.doi.org.pitt.idm.oclc.org/10.1037/0022-006X.72.6.1136
Watson, D., Clark, L. A., & Tellegen, A. (1988). Development and validation of brief measures of
positive and negative affect: The PANAS scales. Journal of Personality and Social
Psychology, 54(6), 1063.
West, R., & Brown, J. (2013). Theory of addiction. John Wiley & Sons.
Westbrook, C., Creswell, J. D., Tabibnia, G., Julson, E., Kober, H., & Tindle, H. A. (2013).
Mindful attention reduces neural and self-reported cue-induced craving in smokers. Social
Cognitive and Affective Neuroscience, 8(1), 73-84.
Willander, J., & Larsson, M. (2006). Smell your way back to childhood: Autobiographical odor
memory. Psychonomic Bulletin & Review, 13(2), 240-244. doi:10.3758/BF03193837
Wilson, S. J. (2015). The Wiley handbook on the cognitive neuroscience of addiction: John Wiley
& Sons.
Wilson, S. J., Creswell, K. G., Sayette, M. A., & Fiez, J. A. (2013). Ambivalence about smoking
and cue-elicited neural activity in quitting-motivated smokers faced with an opportunity to
smoke. Addictive Behaviors, 38(2), 1541-1549.
Wilson, S. J., & Sayette, M. A. (2015). Neuroimaging craving: Urge intensity matters. Addiction,
110(2), 195-203. doi:10.1111/add.12676
Wilson, S. J., Sayette, M. A., Delgado, M. R., & Fiez, J. A. (2005). Instructed smoking expectancy
modulates cue-elicited neural activity: A preliminary study. Nicotine & Tobacco Research,
7(4), 637-645.
Wilson, S. J., Sayette, M. A., & Fiez, J. A. (2012). Quitting-Unmotivated and Quitting-Motivated
Cigarette Smokers Exhibit Different Patterns of Cue-Elicited Brain Activation When
Anticipating an Opportunity to Smoke. Journal of Abnormal Psychology, 121(1), 198-211.
doi:10.1037/a0025112
Wilson, S. J., Sayette, M. A., & Fiez, J. A. (2013). Neural correlates of self-focused and other-
focused strategies for coping with cigarette cue exposure. Psychology of Addictive
Behaviors, 27(2), 466-476. doi:http://dx.doi.org/10.1037/a0027055
Wrzesniewski, A., McCauley, C., & Rozin, P. (1999). Odor and affect: Individual differences in
the impact of odor on liking for places, things and people. Chemical Senses, 24(6), 713-
721.

98
Wysocki, C. J., & Gilbert, A. N. (1989). National Geographic Smell Survey: effects of age are
heterogenous. Annals of the New York Academy of Sciences, 561(1), 12-28.
Zhu, S.-H., Lee, M., Zhuang, Y.-L., Gamst, A., & Wolfson, T. (2012). Interventions to increase
smoking cessation at the population level: How much progress has been made in the last
two decades? Tobacco Control, 21(2), 110-118.


![Wolbachia manipulates host pre-imaginal learning in …59 wasp with olfactory cues at emergence—the so-called “chemical legacy” hypothesis [19, 26]. 60 Two ectoparasitoid wasps,](https://img.pdfslide.net/doc/110x75/5f9455881d3b0a045c318a65/wolbachia-manipulates-host-pre-imaginal-learning-in-59-wasp-with-olfactory-cues.jpg)