Embed Size (px)
Citation preview
An FPGA-Based Real-Time System for 3DStereo Matching, Combining Absolute
Differences and Census with Aggregation andBelief Propagation
Kyprianos Papadimitriou, Sotiris Thomas, and Apostolos Dollas
School of ECE, Technical University of CreteAkrotiri, Chania, 73100, Greece
{kpapadim,sthomas,dollas}@mhl.tuc.gr
Abstract. The implementation of 3D stereo matching in real time isan important problem for many vision applications and algorithms. Thecurrent work, extending previous results by the same authors, presentsin detail an architecture which combines the methods of Absolute Differ-ences, Census, and Belief Propagation in an integrated architecture suit-able for implementation with Field Programmable Gate Array (FPGA)logic. Emphasis on the present work is placed on the justification of di-mensioning the system, as well as detailed design and testing informationfor a fully placed and routed design to process 87 frames per sec (fps)in 1920 × 1200 resolution, and a fully implemented design for 400 × 320which runs up to 1570 fps.
Keywords: stereo matching, correspondence problem, real-time, fieldprogrammable gate arrays, absolute differences, census, belief propaga-tion
1 Introduction
Stereo vision is a research area in which progress is made for some decades now,and yet emerging algorithms, technologies, and applications continue to driveresearch to new advancements. The purpose of stereo vision algorithms is toconstruct an accurate depth map out of two or more images of the same scene,taken under a slightly different angle/position. In a set of two images one imagehas the role of the reference image while the other is the non-reference one. Thebasic problem of finding pairs of pixels, one in the reference image and the otherin the non-reference image that correspond to the same point in space, is knownas the correspondence problem and has been studied for many decades [1]. Thedifference in coordinates of the corresponding pixels (or similar features in thetwo stereo images) is the disparity. Based on the disparity between correspond-ing pixels and on stereo camera parameters such as the distance between thetwo cameras and their focal length, one can extract the depth of the relatedpoint in space by triangulation. This problem has been widely researched by
the computer vision community and appears not only in stereo vision but inother image processing topics as well such as optical flow calculation [2]. Therange of applications of 3D stereo vision cannot be underestimated, with newfields of application emerging continuously, such as in recent research on shapereconstruction of space debris [3].
The class of algorithms which we study falls into the broad category of pro-ducing dense stereo maps. An extensive taxonomy of dense stereo vision algo-rithms is available in [4], and an online constantly renewed comparison can befound in [5], containing mainly software implementations. In general, the al-gorithm searches for pixel matches in an area around the reference pixel in thenon-reference frame. This entails a heavy processing task as for each pixel the 2Dsearch space should be exhaustively explored. To reduce the search space, a con-straint called epipolar line can be applied. This constraint aims at reducing the2D area search space to a 1D line by assuming that the two cameras are placed onthe same horizontal axis (much like the human eyes) and that the correspondingimages do not have a vertical displacement, thus the pixels which correspondto the same image location are only displaced horizontally. The epipolar lineconstraint is enforced through a preprocessing step called rectification, which isapplied to the input pair of stereo images. In this work we concentrate on thestereo correspondence algorithm and not on the rectification step, assuming thatimages are rectified prior to processing. We present an FPGA-based implemen-tation that is scalable and can be adjusted to the application at hand, offeringgreat speed-up over a software implementation. Essentially, we extend our workpublished in [6], by including more results and a detailed analysis on aspectsrelated to performance and resource utilization. We should note here that stereomatching is embarrassingly parallel and thus someone would reasonably expectgetting high performance gains from a custom hardware implementation. Hence,our contributions go beyond solely achieving high performance results, and theseare:
– an analysis showing how the use of aggregation alleviates the need to employthe more computationally demanding Sum of Absolute Differences (SAD)algorithm while still maintaining good results;
– an analysis on how to dimension the combination of the Absolute Diferences(AD) and the Census algorithms with aggregation in a single hardware im-plementation;
– the FPGA-based architecture with detailed tradeoff analysis in the use of itsprimitive resources (Block RAM, Flip-Flops, logic slices), which justifies theuse of FPGAs in the field of stereo vision;
– a placed-and-routed design allowing real-time processing up to 87 fps for fullHD 1920× 1200 frames in a medium-size FPGA;
– a modification at the final phase of design cycle that improved by 1.6x thesystem performance;
– a detailed cost vs. accuracy analysis and on-FPGA RAM usage for designoptimization.
The chapter is organized as follows: Section 2 discusses previous work, focus-ing mainly on hardware-related studies, and with a more up-to-date comparisonof recent research results vs. those in our previous work [6]. Section 3 describesthe algorithm and its individual steps. Section 4 analyses the benefits of map-ping the algorithm to an FPGA with emphasis on dimensioning, and especiallyon the usefulness of aggregation in addition to AD and Census vs. the SADalgorithm. An in-depth discussion of our system is given in Section 5, includingthe implementation of belief propagation. Section 6 has the system performanceand the usage of resources, and Section 7 summarizes the chapter.
2 Relevant Research
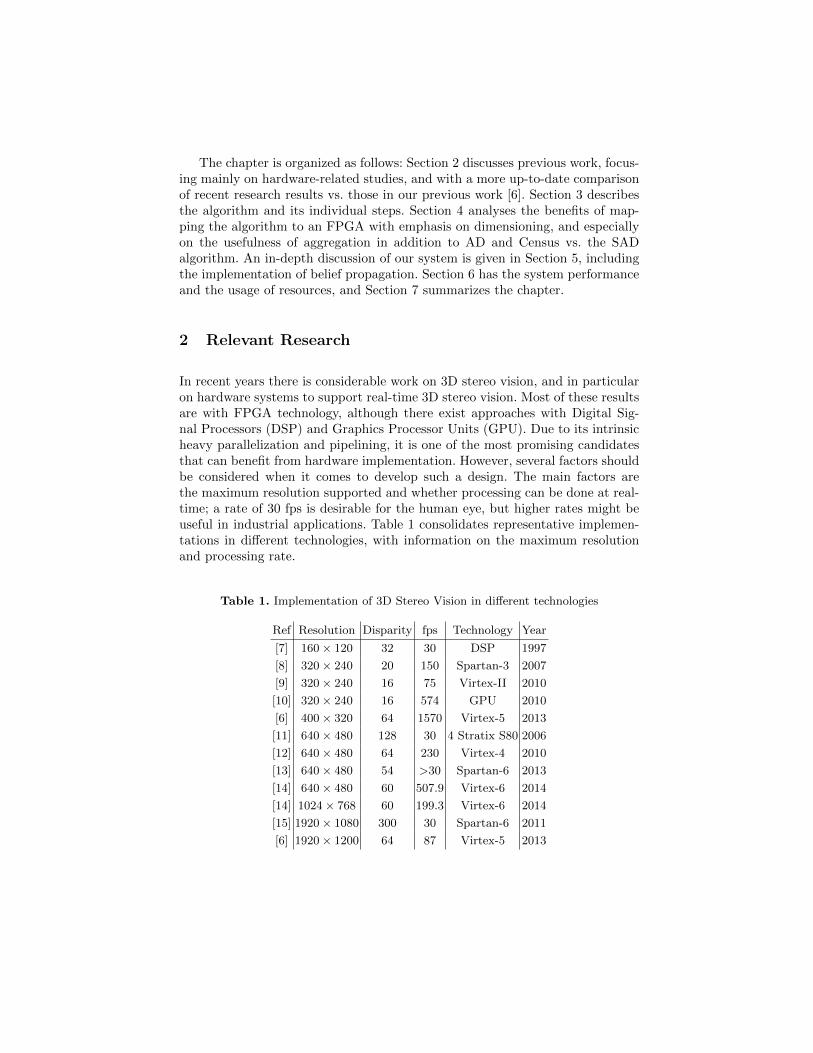
In recent years there is considerable work on 3D stereo vision, and in particularon hardware systems to support real-time 3D stereo vision. Most of these resultsare with FPGA technology, although there exist approaches with Digital Sig-nal Processors (DSP) and Graphics Processor Units (GPU). Due to its intrinsicheavy parallelization and pipelining, it is one of the most promising candidatesthat can benefit from hardware implementation. However, several factors shouldbe considered when it comes to develop such a design. The main factors arethe maximum resolution supported and whether processing can be done at real-time; a rate of 30 fps is desirable for the human eye, but higher rates might beuseful in industrial applications. Table 1 consolidates representative implemen-tations in different technologies, with information on the maximum resolutionand processing rate.
Table 1. Implementation of 3D Stereo Vision in different technologies
Ref Resolution Disparity fps Technology Year
[7] 160 × 120 32 30 DSP 1997
[8] 320 × 240 20 150 Spartan-3 2007
[9] 320 × 240 16 75 Virtex-II 2010
[10] 320 × 240 16 574 GPU 2010
[6] 400 × 320 64 1570 Virtex-5 2013
[11] 640 × 480 128 30 4 Stratix S80 2006
[12] 640 × 480 64 230 Virtex-4 2010
[13] 640 × 480 54 >30 Spartan-6 2013
[14] 640 × 480 60 507.9 Virtex-6 2014
[14] 1024 × 768 60 199.3 Virtex-6 2014
[15] 1920 × 1080 300 30 Spartan-6 2011
[6] 1920 × 1200 64 87 Virtex-5 2013
The work in [7] was one of the earliest ones to combine the development ofcost calculation with the Laplacian of Gaussian in a DSP. More recently, severalworks developed different algorithms in fully functional FPGA-based systemsranging from relatively simple [8, 9] to more complex ones [11, 12, 15, 14]. Theauthors of [12, 15] have designed full stereo vision systems incorporating the rec-tification preprocessing step. The work in [10] provides designs of an algorithmbased on census transform in three different technologies, i.e. CPU, GPU andDSP; the maximum performance was obtained with the GPU. The authors in[16] introduced a local stereo matching scheme, making use of a guided filter forweighted cost aggregation to achieve impressive results relative to the qualityof local algorithms. Their implementation on a GPU achieved real-time perfor-mance with 23 fps on average. The authors of [17] compare FPGA and GPUimplementations of stereo vision to expose the trade-off between the flexibilitybut relatively low speed of an FPGA, and the high speed and fixed architectureof the GPU; that work highlights the relative strengths and limitations of the twosystems. An interesting work reviewing algorithms suitable for low-cost FPGAimplementation was published in [18], concluding that the memory footprintof the algorithm is the most important consideration given the limited on-chipmemory of FPGAs; three different algorithms were demonstrated as a part of areal-time self-contained stereo vision system based on a Xilinx Spartan 6.
The supported disparity is an important parameter that scales with the imageresolution. As shown in Table 1, disparity for medium resolutions should bebetween 64 and 128; this was the case for our functional prototype as well.Our system surpasses all previous systems in terms of performance. The systemwe implemented in a Xilinx Virtex-5 FPGA sustains a processing rate of 1570fps for 400 × 320 frames. To the best of our knowledge this is far better thanany published work. For 640 × 533 resolution we achieved a processing rate of589 fps, while we support 1920 × 1200 resolution at a rate of 87 fps. Moreover,our analysis differs from other publications in the sense that we study the wayFPGA primitive resources suit the characteristics of each stage of the stereovision algorithm.
A more recent version of our system, aiming at a low-cost embeddable designhas been published in [13]. This design is substantially smaller in FPGA resourcesvs. the current work, however, the design in [13] has fewer capabilities, includinga 15% loss of 3D stereo matching capability in the near depth of field, whichcomes from limitations in the number of pixels among which the disparities arecomputed (54 in [13] vs. 64 in the present work), and the number of frames persecond was deliberately lowered to 30 in order to reduce power consumption;however, with a higher clock rate a higher fps rate could be achieved.
3 The Algorithm
A typical approach in stereo matching is to employ a local algorithm whichmatches corresponding pixels in the image pair. This local algorithm computesmatching costs between a pixel in the reference frame and a set of pixels in the
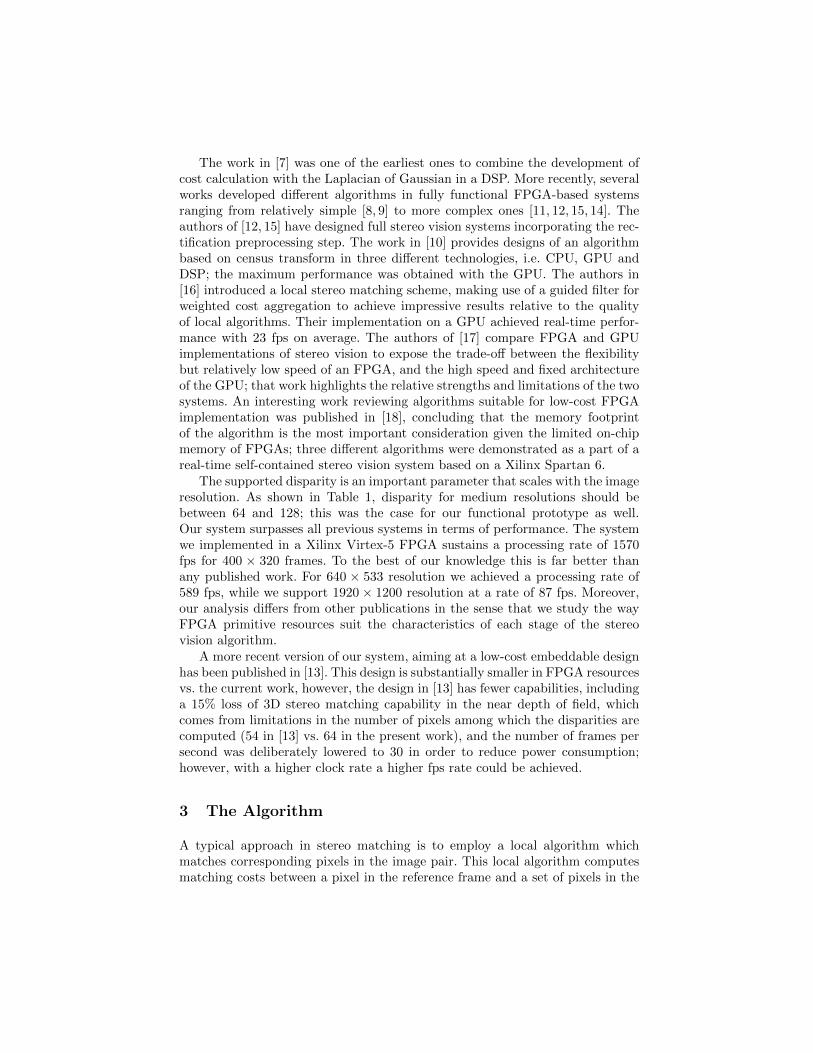
target frame and selects the match with the minimum cost. This is known as theWinner-Take-All (WTA) strategy, according to which the algorithm selects thematch with the global minimum cost in the search space. Essentially, this processis equivalent to computing a 3D cost matrix (called Disparity Search Image orDSI, shown in Figure 1) of size W ×H ×Dmax, - where W the frame width, Hthe frame height and Dmax the size of the search space - and selecting the indexof the minimum in the Dmax dimension. To improve the results, usually a costaggregation step that acts on the DSI is interjected between the cost computingand match selecting steps. Post-processing steps can further refine the resultingdisparity map.
Fig. 1. Disparity Search Image (DSI) volume
Our algorithm consists of the cost computation step implemented by the Ab-solute Difference (AD) census combination matching cost, a simple fixed windowaggregation scheme, a left/right consistency check and a scan-line belief prop-agation solution as a post processing step. Each step of the algorithm will beexplained below, whereas the justification for the choice of this combination ofalgorithms will become evident from quantitative data in Section 4.
The AD measure is defined as the absolute difference between two pixels,CAD = |p1 − p2|, while census [19] is a window based cost that assigns a bit-string to a pixel and is defined as the sum of the Hamming distance betweenthe bit-strings of two pixels. Let Wc be the size of the census window. A pixel’sbit-string is of size W 2
c − 1 and is constructed by assigning 1 if pi > pc or 0otherwise, for pi ∈ Window, and pc the central pixel of the window. The two
costs are fused by a truncated normalized sum:
C(pR, pT ) = max(CAD(pR, pT )
CMaxAD
+CCensus(pR, pT )
CMaxCensus
, λtrunc) (1)
where λtrunc is the truncation value given as parameter. This matching costencompasses image local light structure (census) as well as information aboutthe light itself (AD), and produces better results than its parts alone, as wasshown in [20]. At object borders, the aggregation window necessarily includescosts belonging to two or more objects in the scene, whereas ideally we wouldlike to aggregate only costs of one object. For this reason, truncating the coststo a maximum value helps at least limiting the effect of any outliers in eachaggregation window [4].
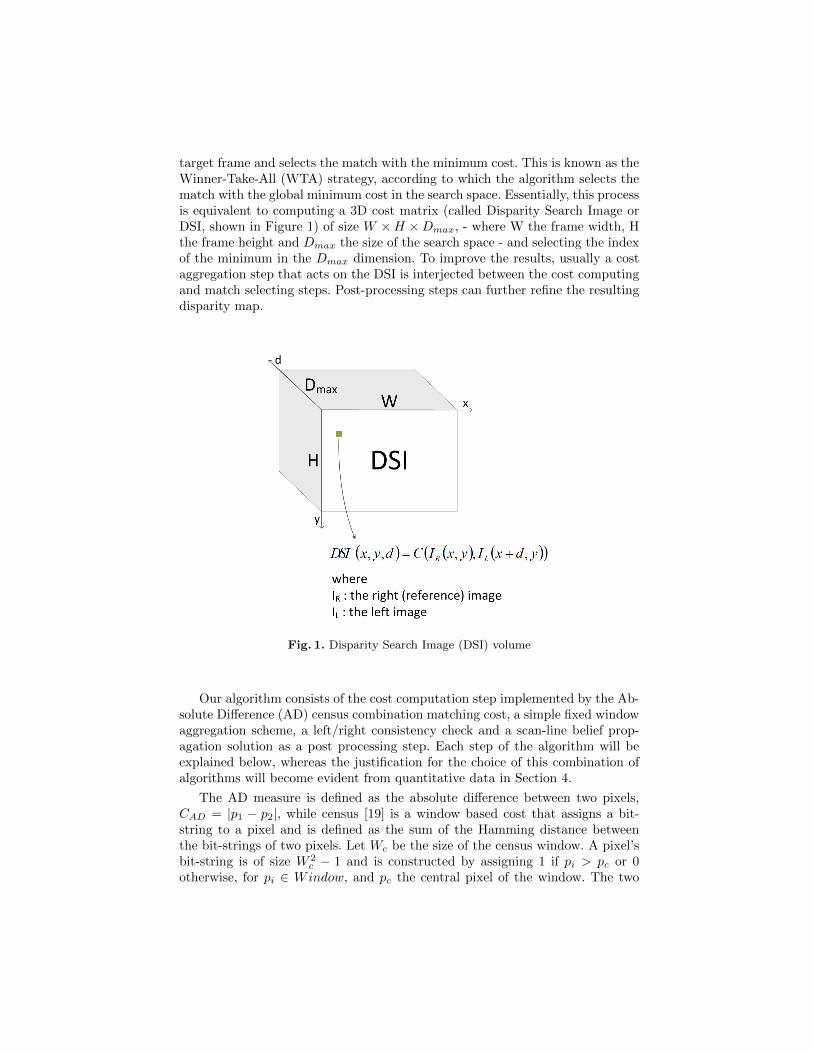
After initializing the DSI volume with AD-Census costs, we perform a simplefixed window aggregation on the W ×H slices of the DSI, illustrated in Figure 2.This is based on the assumption that neighbouring pixels (i.e. pixels belonging inthe same window) most likely share the same disparity (depth) as well. Althoughthis does not stand for object borders and slanted surfaces, it produces goodresults. On the other hand, one should select carefully the size of the aggregationwindow Wa, as large windows tend to lead to an edge fattening effect in objectborders while small aggregation windows lead to loss of accuracy in the insidearea of an object itself, which results in a noisy output.
Fig. 2. Example of 3x3 fixed window aggregation of DSI costs
Finally, we perform a left/right consistency check (LRC check) which repeatsthe match selection step but with the opposite frame as reference and comparesthe new disparity image with the original one. This process allows to detect mis-matches due to occlusions (areas of the scene that appear only in one frame).
Using the mismatches detected, our scan-line belief propagation solution propa-gates local confident matches along the scan-line, by accumulating matches thatpassed the LRC check in a queue (called confident queue due to that it storesonly disparities that passed the LRC check), and propagating them to localmatches classified as occlusions in a neighborhood queue.
4 Dimensioning of the FPGA Architecture
The algorithm can be mapped on an FPGA very efficiently due to its intrinsicparallelism. For instance, the census transform requires W 2
c −1 comparisons perpixel to compute the bit-string. Aggregation also requires W 2
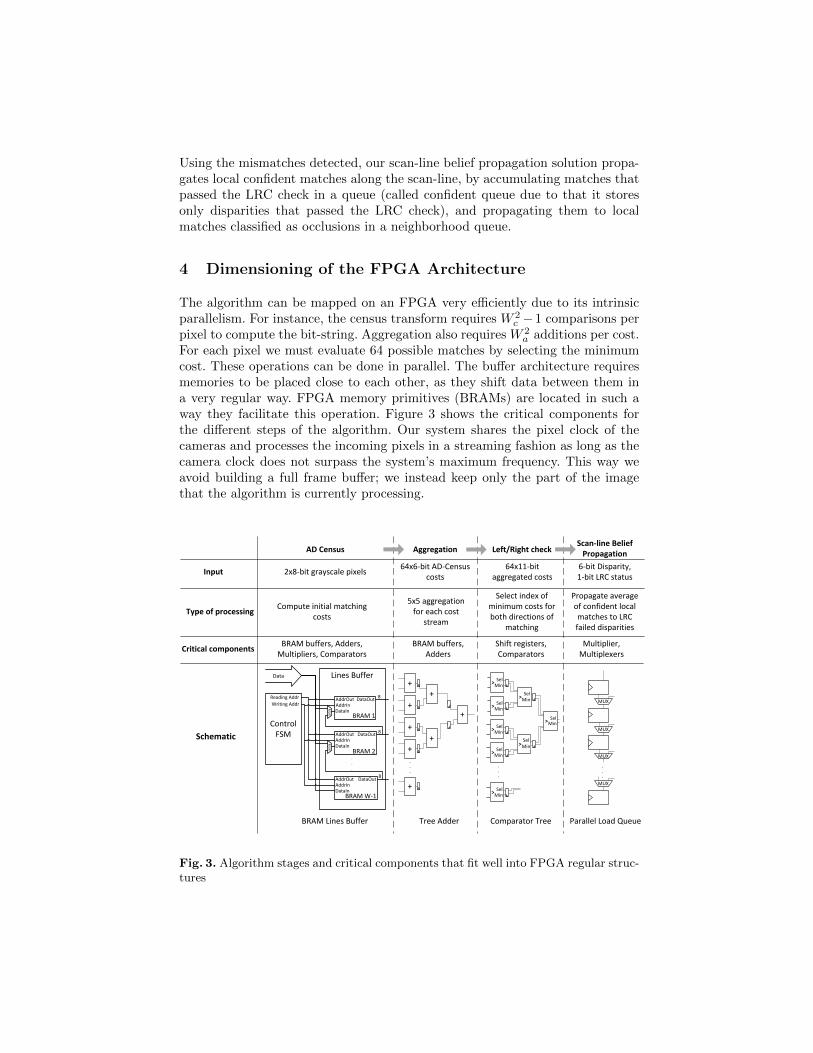
a additions per cost.For each pixel we must evaluate 64 possible matches by selecting the minimumcost. These operations can be done in parallel. The buffer architecture requiresmemories to be placed close to each other, as they shift data between them ina very regular way. FPGA memory primitives (BRAMs) are located in such away they facilitate this operation. Figure 3 shows the critical components forthe different steps of the algorithm. Our system shares the pixel clock of thecameras and processes the incoming pixels in a streaming fashion as long as thecamera clock does not surpass the system’s maximum frequency. This way weavoid building a full frame buffer; we instead keep only the part of the imagethat the algorithm is currently processing.
Lines Buffer
AddrOutAddrInDataIn
DataOut8
.
.
.
Data
Control FSM AddrOut
AddrInDataIn
DataOut 8
AddrOutAddrInDataIn
DataOut8
MU
XM
UX
Writing Addr
Reading Addr
Tree Adder Comparator TreeBRAM Lines Buffer Parallel Load Queue
MUX
.
.
.
BRAM buffers, Adders, Multipliers, Comparators
BRAM buffers, Adders
Shift registers, Comparators
Multiplier, Multiplexers
Compute initial matching costs
5x5 aggregation for each cost
stream
Select index of minimum costs for both directions of
matching
Propagate average of confident local matches to LRC failed disparities
2x8-bit grayscale pixelsInput
Type of processing
Critical components
Schematic
64x6-bit AD-Census costs
64x11-bit aggregated costs
6-bit Disparity, 1-bit LRC status
AD Census Aggregation Left/Right checkScan-line Belief
Propagation
+
+
+
+
+
+
+
+
.
.
.
>MinSel
>MinSel
>MinSel
>MinSel
.
.
.
.
.
.
BRAM 1
BRAM 2
BRAM W-1
>MinSel
>MinSel
>MinSel
>MinSel
MUX
MUX
MUX
Fig. 3. Algorithm stages and critical components that fit well into FPGA regular struc-tures
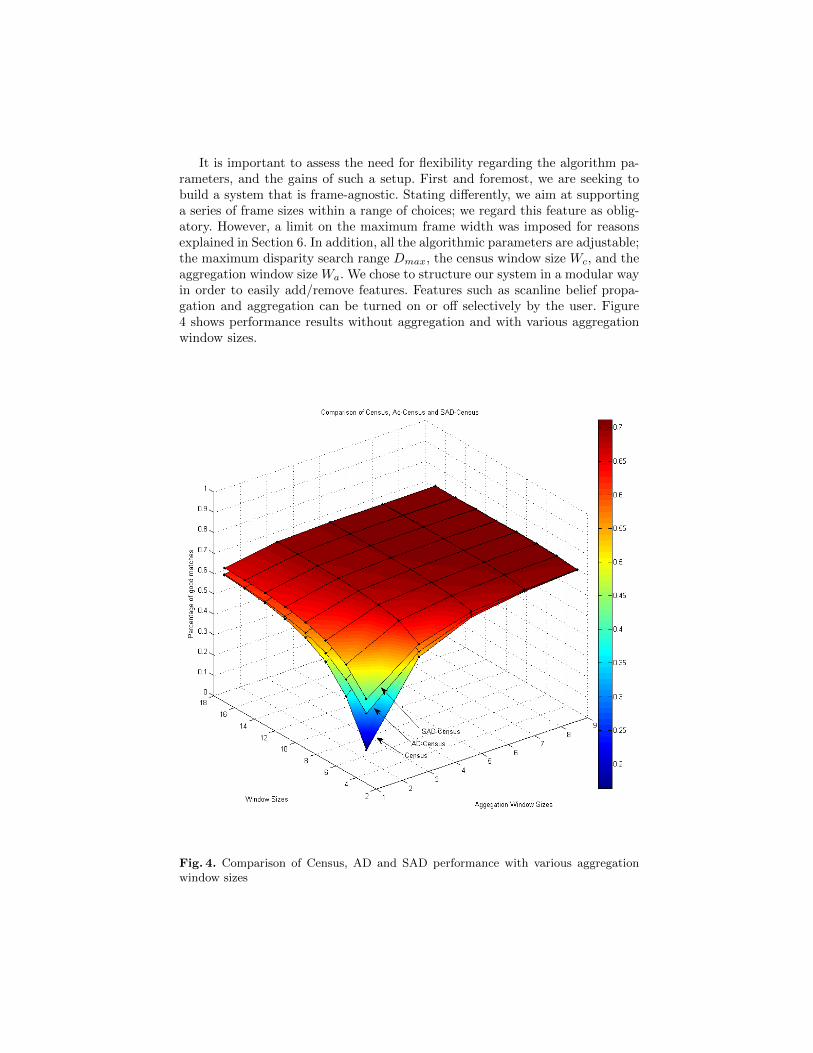
It is important to assess the need for flexibility regarding the algorithm pa-rameters, and the gains of such a setup. First and foremost, we are seeking tobuild a system that is frame-agnostic. Stating differently, we aim at supportinga series of frame sizes within a range of choices; we regard this feature as oblig-atory. However, a limit on the maximum frame width was imposed for reasonsexplained in Section 6. In addition, all the algorithmic parameters are adjustable;the maximum disparity search range Dmax, the census window size Wc, and theaggregation window size Wa. We chose to structure our system in a modular wayin order to easily add/remove features. Features such as scanline belief propa-gation and aggregation can be turned on or off selectively by the user. Figure4 shows performance results without aggregation and with various aggregationwindow sizes.
Fig. 4. Comparison of Census, AD and SAD performance with various aggregationwindow sizes
In order to develop an efficient architecture it is important to understand howresources are used. In terms of sheer performance when no aggregation is used,the SAD algorithm is the best, and so it would seem that it is best to implementit in hardware. No aggregation means that the aggregation window is of size1. , when computational cost is considered, the SAD algorithm is by far moreexpensive than the alternatives, as it has approximately 2 ×W 2 comparisons.It is therefore useful to consider cost vs. performance when we introduce aggre-gation to the system, where we notice that the system-level performance withaggregation comes close to the SAD performance, but at a lower computationalcost.
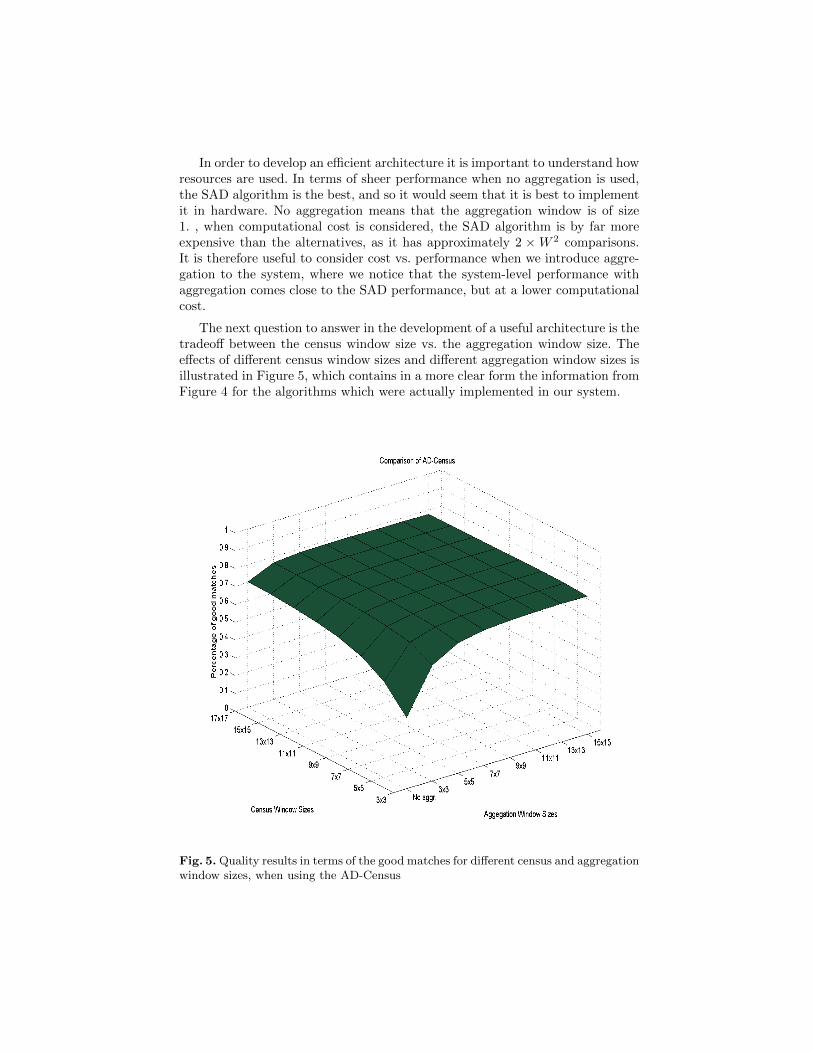
The next question to answer in the development of a useful architecture is thetradeoff between the census window size vs. the aggregation window size. Theeffects of different census window sizes and different aggregation window sizes isillustrated in Figure 5, which contains in a more clear form the information fromFigure 4 for the algorithms which were actually implemented in our system.
Fig. 5. Quality results in terms of the good matches for different census and aggregationwindow sizes, when using the AD-Census
We analyzed the influence of the algorithm’s parameters on the quality met-ric of percentage of good matches, over six (6) datasets of Middlebury’s 2005database [5]. We have settled on a Wc = 9×9 sized census window, a Wa = 5×5sized aggregation window and a Dmax = 64 disparity search range; these valuesoffer a good trade-off between overall quality and computational requirements.We followed a similar procedure to determine all the other secondary parame-ters as well, such as the confident neighborhood queue size and the neighborhoodqueue size of the scan-line belief propagation module, and the LR check thresholdof the LR consistency check module [10].
There are negligible gains if we choose a larger Wc or Wa. The maximumachievable percentage of good matches was 78,36% for AD-Census (Wc=7,Wa=13),therefore there is no actual benefit by choosing a large aggregation window. Itis thus our choice to fix the window sizes in our implementation. Our designremains generic in any parameter aspect but it is not reconfigurable at run-time. This decision simplifies our hardware design. For purposes of evaluationand experimental verification of the design we designed our system using XilinxFPGAs, namely, a Virtex 5 XC5VLX110T as well as a Spartan 3 1000, settingthe parameters accordingly to fit the FPGA device at hand.
Last but not least, we need to consider what happens with occluded pixelsfrom one or the other camera. It is therefore useful to allow for some resources tobe used for Belief Propagation (BP), as shown in Section 5. Belief propagation(which uses results from the Left-Right consistency check) does not consumesignificant resources but it solves the problem of uncertainty due to occludedpixels which would result if only one camera were used as the only referenceimage.
5 Design and Implementation
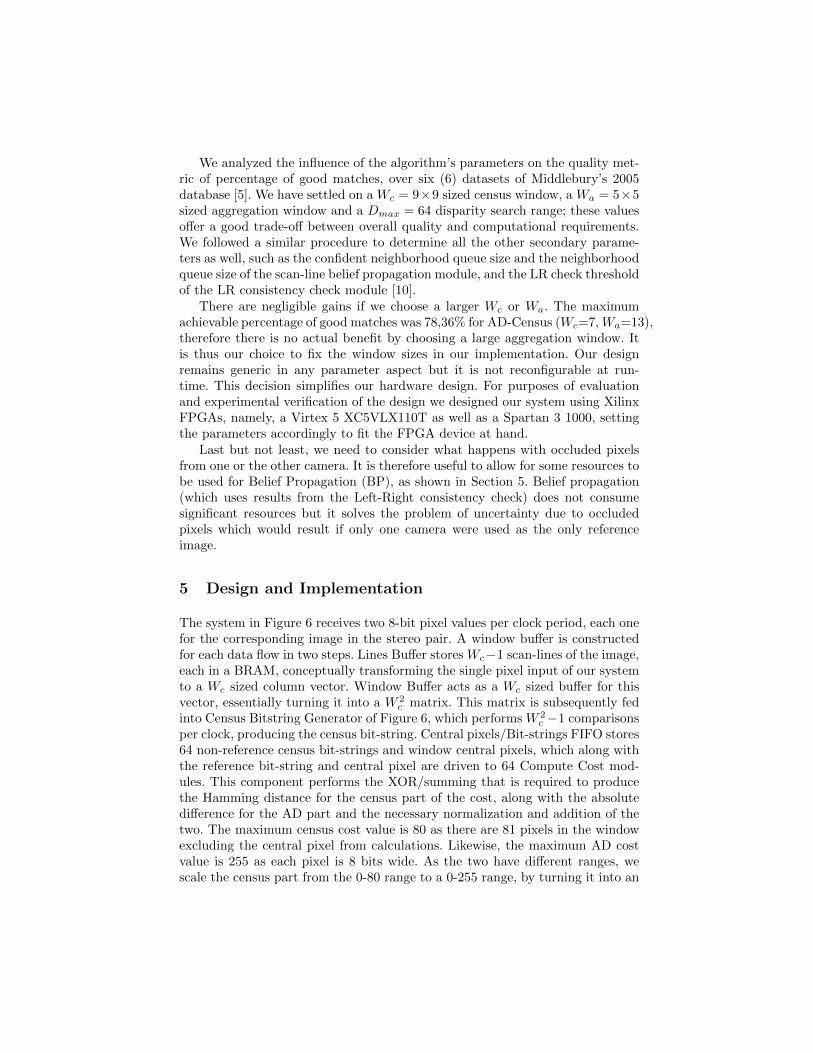
The system in Figure 6 receives two 8-bit pixel values per clock period, each onefor the corresponding image in the stereo pair. A window buffer is constructedfor each data flow in two steps. Lines Buffer stores Wc−1 scan-lines of the image,each in a BRAM, conceptually transforming the single pixel input of our systemto a Wc sized column vector. Window Buffer acts as a Wc sized buffer for thisvector, essentially turning it into a W 2
c matrix. This matrix is subsequently fedinto Census Bitstring Generator of Figure 6, which performs W 2
c −1 comparisonsper clock, producing the census bit-string. Central pixels/Bit-strings FIFO stores64 non-reference census bit-strings and window central pixels, which along withthe reference bit-string and central pixel are driven to 64 Compute Cost mod-ules. This component performs the XOR/summing that is required to producethe Hamming distance for the census part of the cost, along with the absolutedifference for the AD part and the necessary normalization and addition of thetwo. The maximum census cost value is 80 as there are 81 pixels in the windowexcluding the central pixel from calculations. Likewise, the maximum AD costvalue is 255 as each pixel is 8 bits wide. As the two have different ranges, wescale the census part from the 0-80 range to a 0-255 range, by turning it into an
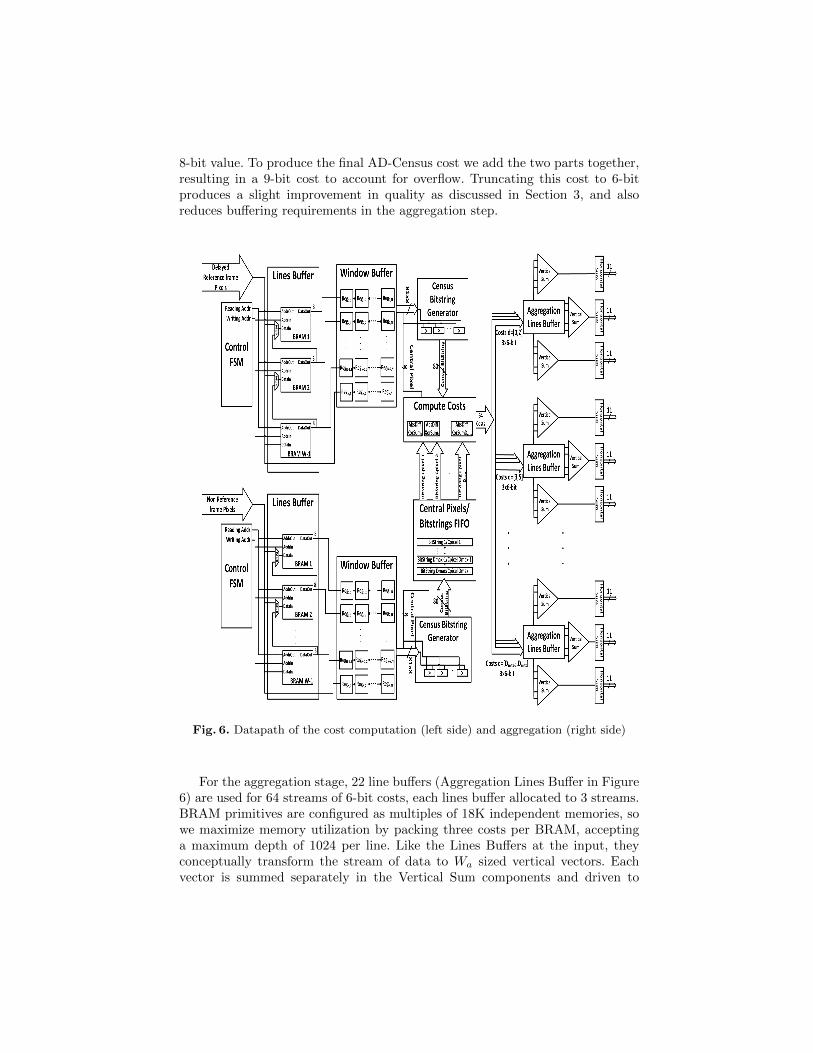
8-bit value. To produce the final AD-Census cost we add the two parts together,resulting in a 9-bit cost to account for overflow. Truncating this cost to 6-bitproduces a slight improvement in quality as discussed in Section 3, and alsoreduces buffering requirements in the aggregation step.
Fig. 6. Datapath of the cost computation (left side) and aggregation (right side)
For the aggregation stage, 22 line buffers (Aggregation Lines Buffer in Figure6) are used for 64 streams of 6-bit costs, each lines buffer allocated to 3 streams.BRAM primitives are configured as multiples of 18K independent memories, sowe maximize memory utilization by packing three costs per BRAM, acceptinga maximum depth of 1024 per line. Like the Lines Buffers at the input, theyconceptually transform the stream of data to Wa sized vertical vectors. Eachvector is summed separately in the Vertical Sum components and driven to
delay adders (Horizontal Sum), which output X(t) + X(t− 1) + ... + X(t− 4).At the end of this procedure we have 64 aggregated costs.
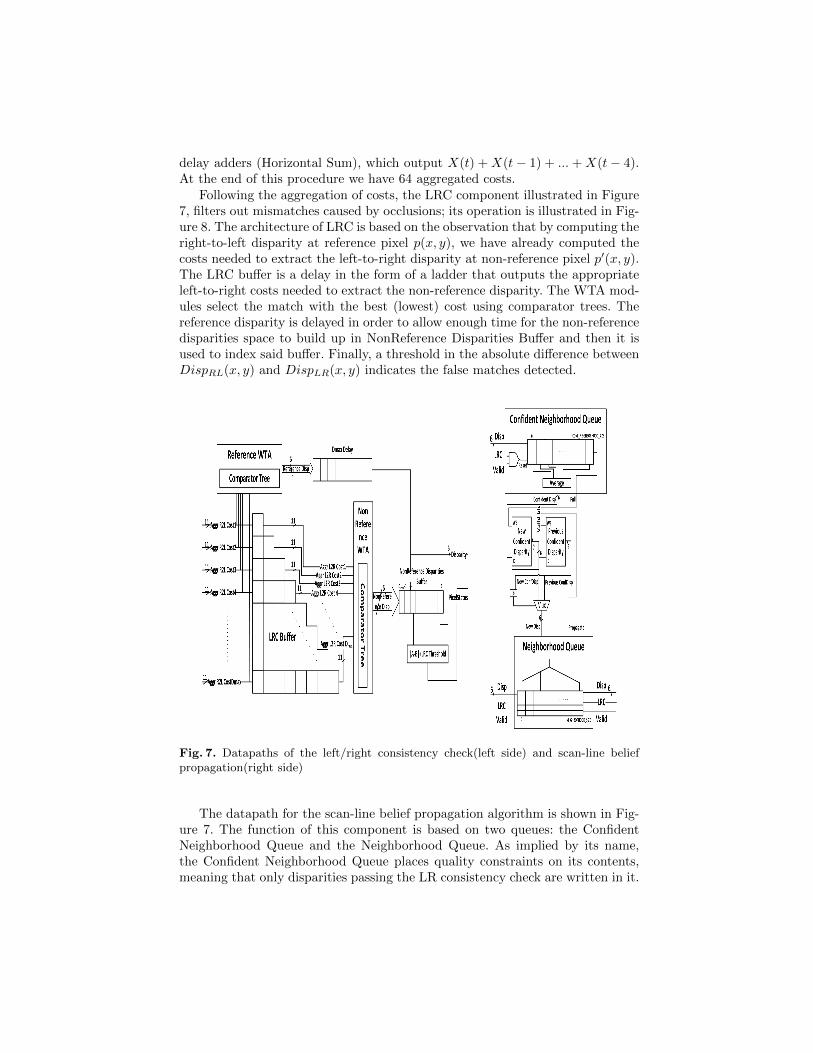
Following the aggregation of costs, the LRC component illustrated in Figure7, filters out mismatches caused by occlusions; its operation is illustrated in Fig-ure 8. The architecture of LRC is based on the observation that by computing theright-to-left disparity at reference pixel p(x, y), we have already computed thecosts needed to extract the left-to-right disparity at non-reference pixel p′(x, y).The LRC buffer is a delay in the form of a ladder that outputs the appropriateleft-to-right costs needed to extract the non-reference disparity. The WTA mod-ules select the match with the best (lowest) cost using comparator trees. Thereference disparity is delayed in order to allow enough time for the non-referencedisparities space to build up in NonReference Disparities Buffer and then it isused to index said buffer. Finally, a threshold in the absolute difference betweenDispRL(x, y) and DispLR(x, y) indicates the false matches detected.
Fig. 7. Datapaths of the left/right consistency check(left side) and scan-line beliefpropagation(right side)
The datapath for the scan-line belief propagation algorithm is shown in Fig-ure 7. The function of this component is based on two queues: the ConfidentNeighborhood Queue and the Neighborhood Queue. As implied by its name,the Confident Neighborhood Queue places quality constraints on its contents,meaning that only disparities passing the LR consistency check are written in it.
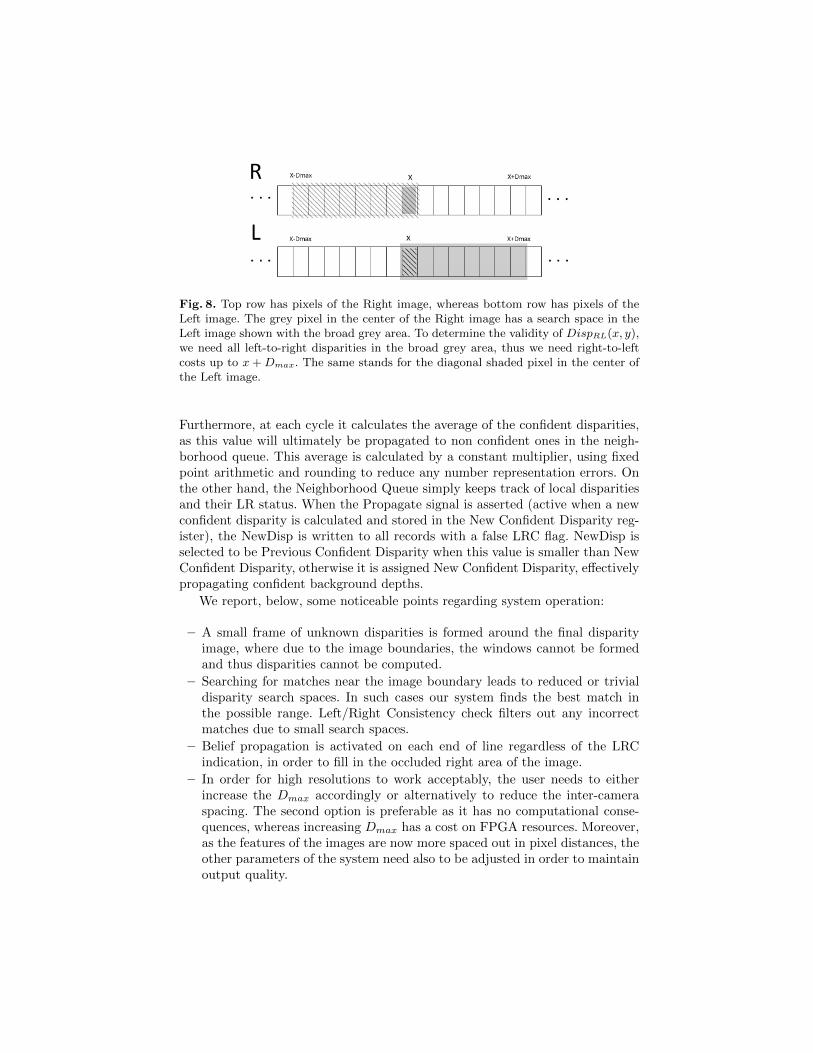
Fig. 8. Top row has pixels of the Right image, whereas bottom row has pixels of theLeft image. The grey pixel in the center of the Right image has a search space in theLeft image shown with the broad grey area. To determine the validity of DispRL(x, y),we need all left-to-right disparities in the broad grey area, thus we need right-to-leftcosts up to x + Dmax. The same stands for the diagonal shaded pixel in the center ofthe Left image.
Furthermore, at each cycle it calculates the average of the confident disparities,as this value will ultimately be propagated to non confident ones in the neigh-borhood queue. This average is calculated by a constant multiplier, using fixedpoint arithmetic and rounding to reduce any number representation errors. Onthe other hand, the Neighborhood Queue simply keeps track of local disparitiesand their LR status. When the Propagate signal is asserted (active when a newconfident disparity is calculated and stored in the New Confident Disparity reg-ister), the NewDisp is written to all records with a false LRC flag. NewDisp isselected to be Previous Confident Disparity when this value is smaller than NewConfident Disparity, otherwise it is assigned New Confident Disparity, effectivelypropagating confident background depths.
We report, below, some noticeable points regarding system operation:
– A small frame of unknown disparities is formed around the final disparityimage, where due to the image boundaries, the windows cannot be formedand thus disparities cannot be computed.
– Searching for matches near the image boundary leads to reduced or trivialdisparity search spaces. In such cases our system finds the best match inthe possible range. Left/Right Consistency check filters out any incorrectmatches due to small search spaces.
– Belief propagation is activated on each end of line regardless of the LRCindication, in order to fill in the occluded right area of the image.
– In order for high resolutions to work acceptably, the user needs to eitherincrease the Dmax accordingly or alternatively to reduce the inter-cameraspacing. The second option is preferable as it has no computational conse-quences, whereas increasing Dmax has a cost on FPGA resources. Moreover,as the features of the images are now more spaced out in pixel distances, theother parameters of the system need also to be adjusted in order to maintainoutput quality.
6 Performance Evaluation and Resource Utilization
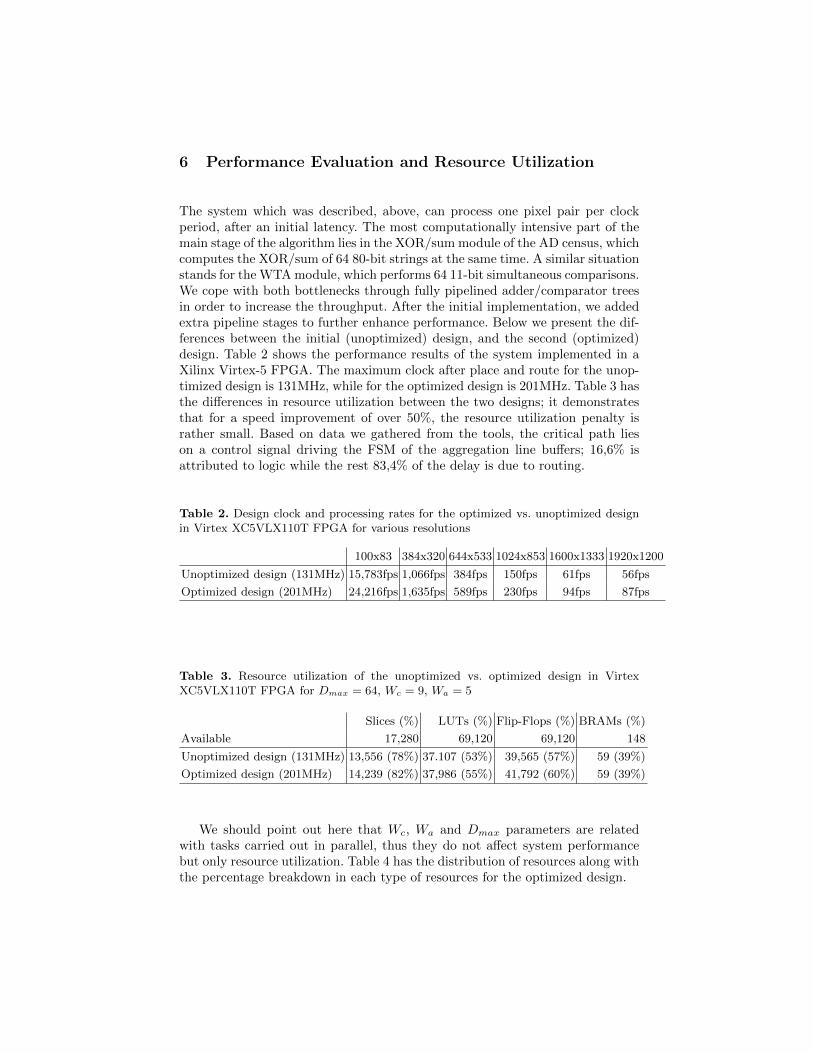
The system which was described, above, can process one pixel pair per clockperiod, after an initial latency. The most computationally intensive part of themain stage of the algorithm lies in the XOR/sum module of the AD census, whichcomputes the XOR/sum of 64 80-bit strings at the same time. A similar situationstands for the WTA module, which performs 64 11-bit simultaneous comparisons.We cope with both bottlenecks through fully pipelined adder/comparator treesin order to increase the throughput. After the initial implementation, we addedextra pipeline stages to further enhance performance. Below we present the dif-ferences between the initial (unoptimized) design, and the second (optimized)design. Table 2 shows the performance results of the system implemented in aXilinx Virtex-5 FPGA. The maximum clock after place and route for the unop-timized design is 131MHz, while for the optimized design is 201MHz. Table 3 hasthe differences in resource utilization between the two designs; it demonstratesthat for a speed improvement of over 50%, the resource utilization penalty israther small. Based on data we gathered from the tools, the critical path lieson a control signal driving the FSM of the aggregation line buffers; 16,6% isattributed to logic while the rest 83,4% of the delay is due to routing.
Table 2. Design clock and processing rates for the optimized vs. unoptimized designin Virtex XC5VLX110T FPGA for various resolutions
100x83 384x320 644x533 1024x853 1600x1333 1920x1200
Unoptimized design (131MHz) 15,783fps 1,066fps 384fps 150fps 61fps 56fps
Optimized design (201MHz) 24,216fps 1,635fps 589fps 230fps 94fps 87fps
Table 3. Resource utilization of the unoptimized vs. optimized design in VirtexXC5VLX110T FPGA for Dmax = 64, Wc = 9, Wa = 5
Slices (%) LUTs (%) Flip-Flops (%) BRAMs (%)
Available 17,280 69,120 69,120 148
Unoptimized design (131MHz) 13,556 (78%) 37.107 (53%) 39,565 (57%) 59 (39%)
Optimized design (201MHz) 14,239 (82%) 37,986 (55%) 41,792 (60%) 59 (39%)
We should point out here that Wc, Wa and Dmax parameters are relatedwith tasks carried out in parallel, thus they do not affect system performancebut only resource utilization. Table 4 has the distribution of resources along withthe percentage breakdown in each type of resources for the optimized design.
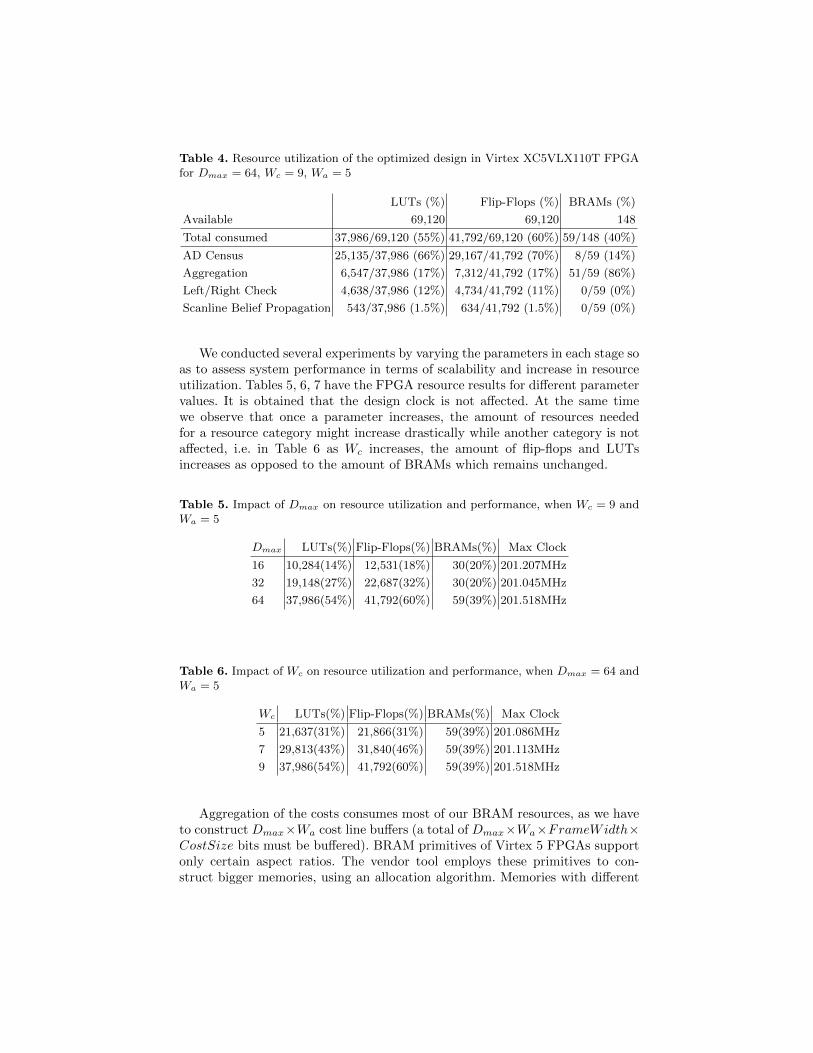
Table 4. Resource utilization of the optimized design in Virtex XC5VLX110T FPGAfor Dmax = 64, Wc = 9, Wa = 5
LUTs (%) Flip-Flops (%) BRAMs (%)
Available 69,120 69,120 148
Total consumed 37,986/69,120 (55%) 41,792/69,120 (60%) 59/148 (40%)
AD Census 25,135/37,986 (66%) 29,167/41,792 (70%) 8/59 (14%)
Aggregation 6,547/37,986 (17%) 7,312/41,792 (17%) 51/59 (86%)
Left/Right Check 4,638/37,986 (12%) 4,734/41,792 (11%) 0/59 (0%)
Scanline Belief Propagation 543/37,986 (1.5%) 634/41,792 (1.5%) 0/59 (0%)
We conducted several experiments by varying the parameters in each stage soas to assess system performance in terms of scalability and increase in resourceutilization. Tables 5, 6, 7 have the FPGA resource results for different parametervalues. It is obtained that the design clock is not affected. At the same timewe observe that once a parameter increases, the amount of resources neededfor a resource category might increase drastically while another category is notaffected, i.e. in Table 6 as Wc increases, the amount of flip-flops and LUTsincreases as opposed to the amount of BRAMs which remains unchanged.
Table 5. Impact of Dmax on resource utilization and performance, when Wc = 9 andWa = 5
Dmax LUTs(%) Flip-Flops(%) BRAMs(%) Max Clock
16 10,284(14%) 12,531(18%) 30(20%) 201.207MHz
32 19,148(27%) 22,687(32%) 30(20%) 201.045MHz
64 37,986(54%) 41,792(60%) 59(39%) 201.518MHz
Table 6. Impact of Wc on resource utilization and performance, when Dmax = 64 andWa = 5
Wc LUTs(%) Flip-Flops(%) BRAMs(%) Max Clock
5 21,637(31%) 21,866(31%) 59(39%) 201.086MHz
7 29,813(43%) 31,840(46%) 59(39%) 201.113MHz
9 37,986(54%) 41,792(60%) 59(39%) 201.518MHz
Aggregation of the costs consumes most of our BRAM resources, as we haveto construct Dmax×Wa cost line buffers (a total of Dmax×Wa×FrameWidth×CostSize bits must be buffered). BRAM primitives of Virtex 5 FPGAs supportonly certain aspect ratios. The vendor tool employs these primitives to con-struct bigger memories, using an allocation algorithm. Memories with different
widths/depths from those ratios are mapped to the closest possible solution butmay not use the resources optimally. Memories with ratios of 1 × 16K (16,384elements of 1-bit), 2× 8K, 4× 4K, 9× 2K, 18× 1K, 36× 512 are guaranteed toutilize a single 18K primitive and thus use the resources optimally.
Table 7. Impact of Wa on resource utilization and performance, when Dmax = 64 andWc = 9
Wa LUTs(%) Flip-Flops(%) BRAMs(%) Max Clock
1 (off) 28,505(41%) 33,047(47%) 9(6%) 201.005MHz
3 34,618(50%) 38,660(55%) 31(20%) 201.167MHz
5 37,986(54%) 41,792(60%) 59(39%) 201.518MHz
In addition, very large frame sizes cause parameter bloating. In specific, im-ages with 1800×1500 resolution require at least Dmax = 180 for achieving satis-factory results in terms of quality (without altering the current camera baseline).While keeping the other parameters constant (Wc = 9, Wa = 5), such a largeDmax would require buffering 180× 5× 1800 elements in the aggregation stage.
Due to the above we decided to put a limit on the image width. Restrictingthe frame width to 1024 pixels allowed us to:
– Pack at least two lines per 18K BRAM using a 18 × 1K BRAM primitiveconfiguration. For each cost line we allocate 9× 1024 bits.
– Avoid excessive parameter bloating.
Using AD-Census, the costs are 9-bit long as described earlier. This benefitsour design as BRAM primitives can be used optimally in a 18×1K configuration.Using pure Census, cost size is reduced to 7-bits. We can maximize BRAM usageby using 9-bit costs, so we have room to increase census window size Wc up to21× 21, with little additional cost to resource usage.
If the cost size is less than 9-bits or if the frame width is less than 1024 wecan pack more lines. This aspect of our design is also parametric, as dependingon the frame size and cost size, each BRAM can fit up to 6 lines in a 36 × 512BRAM configuration.
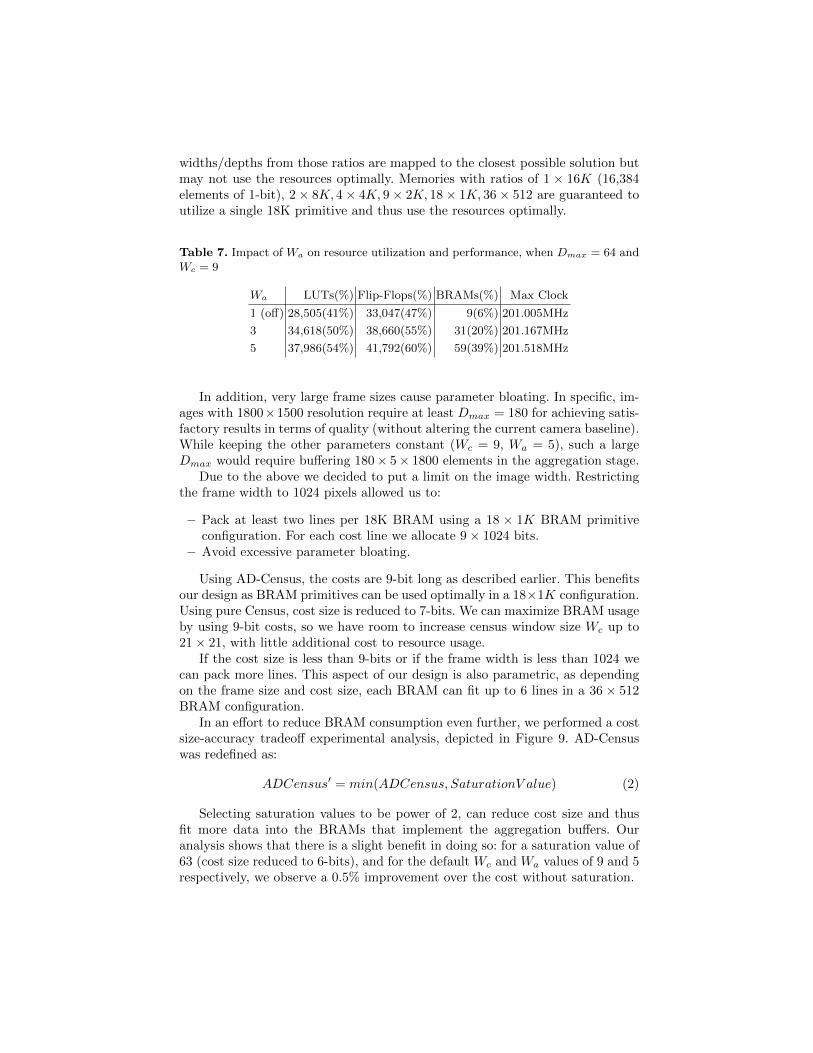
In an effort to reduce BRAM consumption even further, we performed a costsize-accuracy tradeoff experimental analysis, depicted in Figure 9. AD-Censuswas redefined as:
ADCensus′ = min(ADCensus, SaturationV alue) (2)
Selecting saturation values to be power of 2, can reduce cost size and thusfit more data into the BRAMs that implement the aggregation buffers. Ouranalysis shows that there is a slight benefit in doing so: for a saturation value of63 (cost size reduced to 6-bits), and for the default Wc and Wa values of 9 and 5respectively, we observe a 0.5% improvement over the cost without saturation.
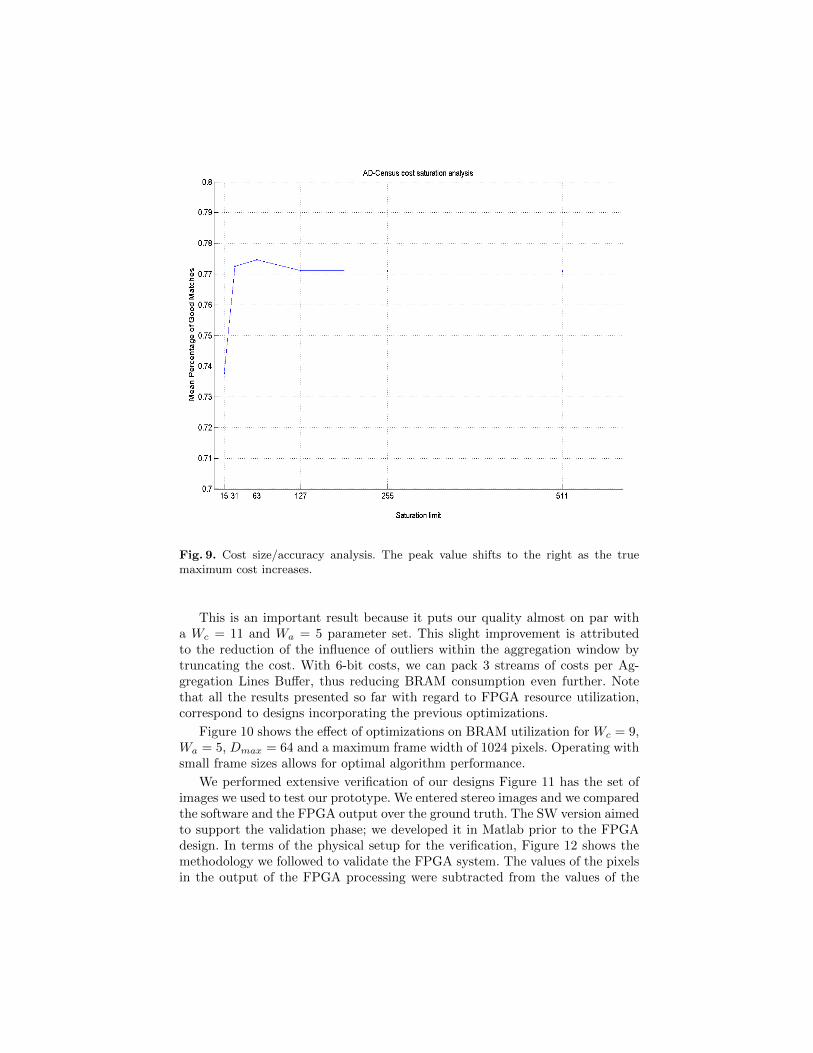
Fig. 9. Cost size/accuracy analysis. The peak value shifts to the right as the truemaximum cost increases.
This is an important result because it puts our quality almost on par witha Wc = 11 and Wa = 5 parameter set. This slight improvement is attributedto the reduction of the influence of outliers within the aggregation window bytruncating the cost. With 6-bit costs, we can pack 3 streams of costs per Ag-gregation Lines Buffer, thus reducing BRAM consumption even further. Notethat all the results presented so far with regard to FPGA resource utilization,correspond to designs incorporating the previous optimizations.
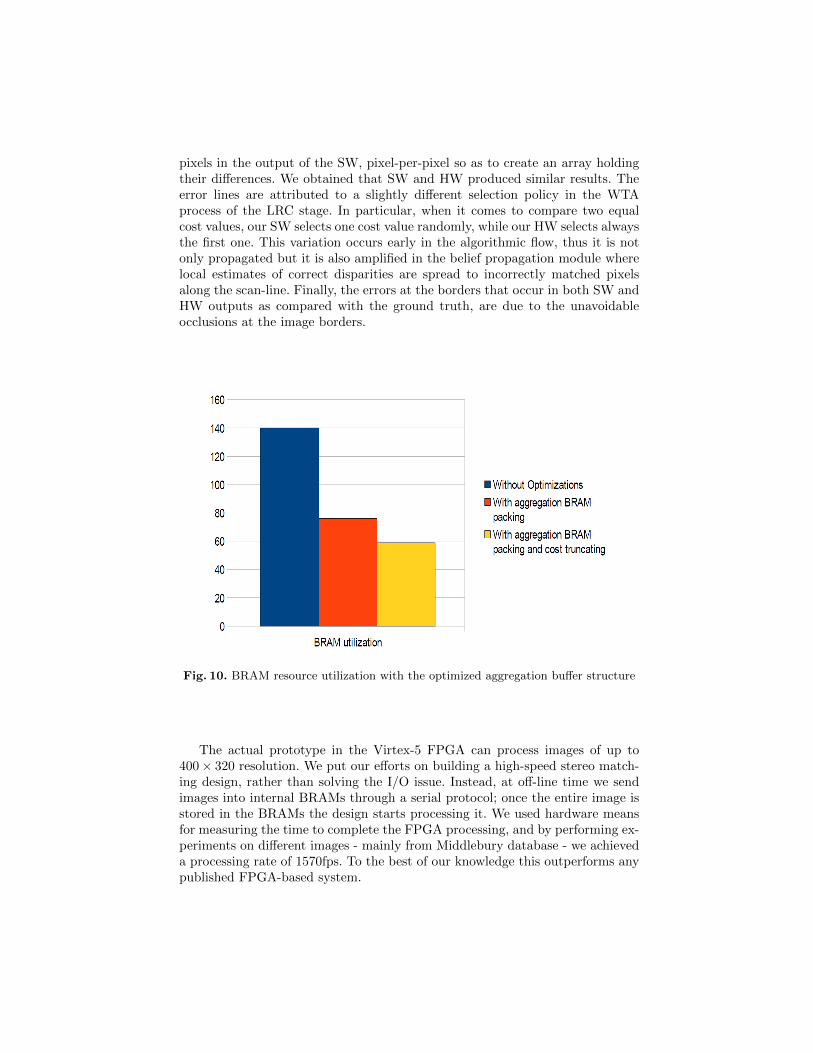
Figure 10 shows the effect of optimizations on BRAM utilization for Wc = 9,Wa = 5, Dmax = 64 and a maximum frame width of 1024 pixels. Operating withsmall frame sizes allows for optimal algorithm performance.
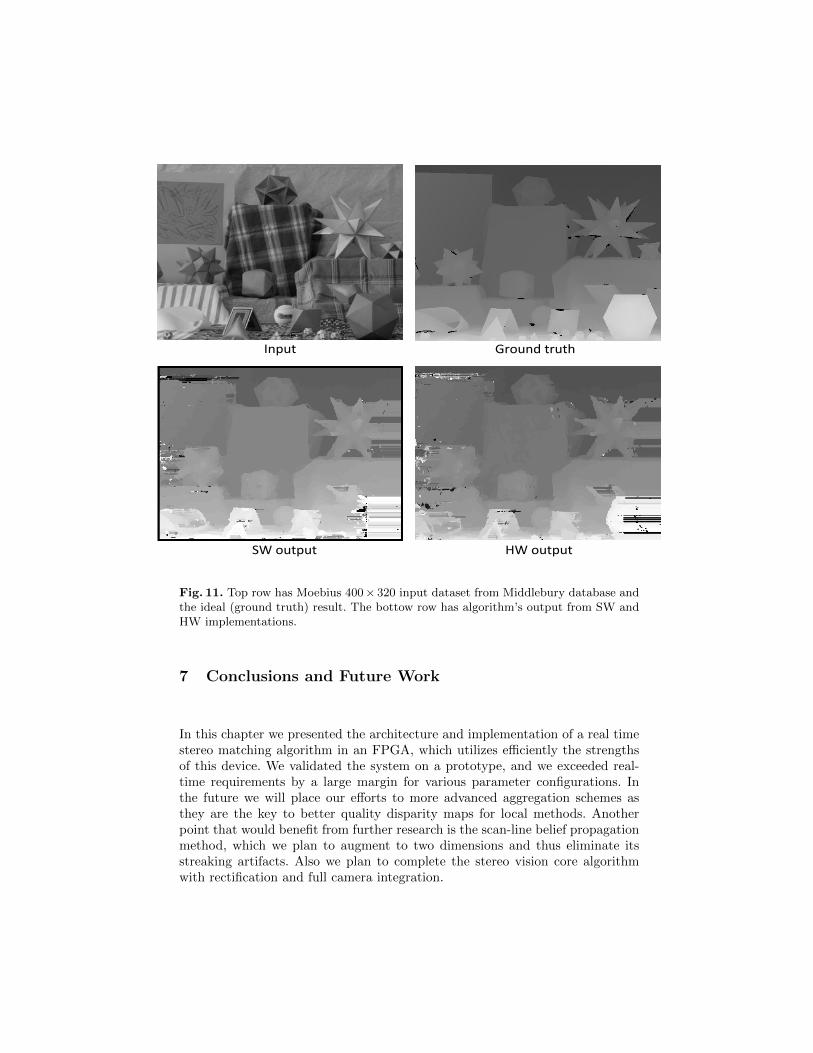
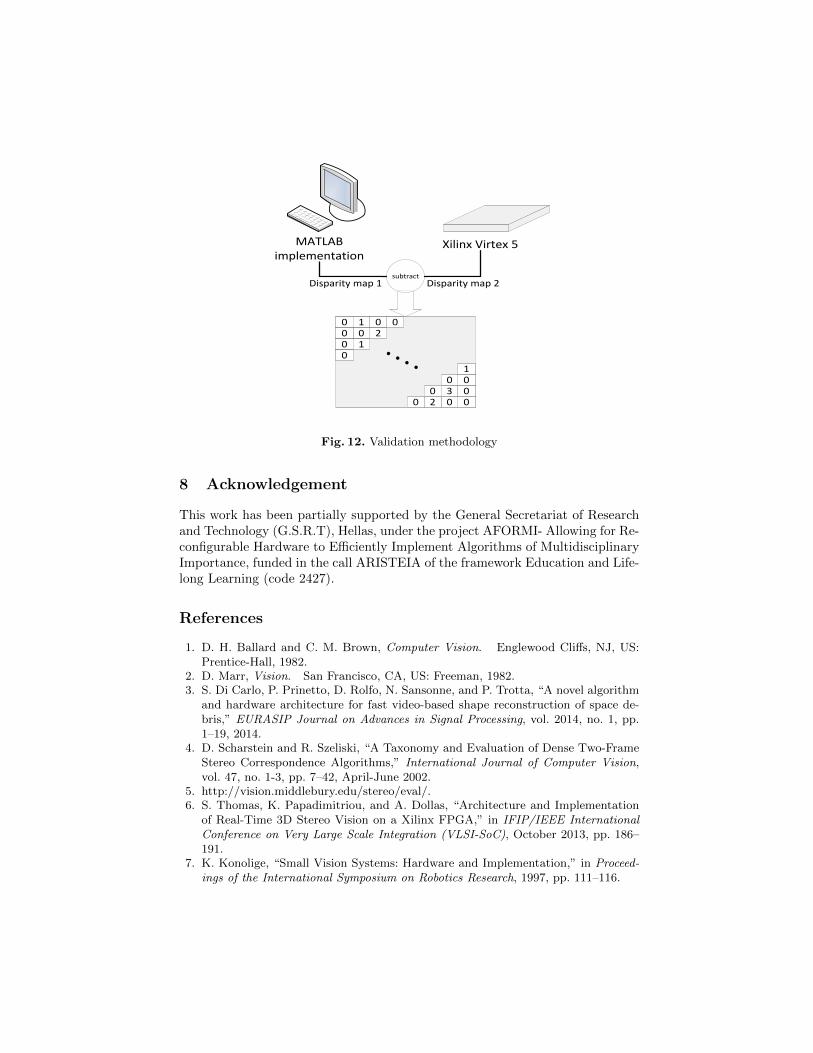
We performed extensive verification of our designs Figure 11 has the set ofimages we used to test our prototype. We entered stereo images and we comparedthe software and the FPGA output over the ground truth. The SW version aimedto support the validation phase; we developed it in Matlab prior to the FPGAdesign. In terms of the physical setup for the verification, Figure 12 shows themethodology we followed to validate the FPGA system. The values of the pixelsin the output of the FPGA processing were subtracted from the values of the
pixels in the output of the SW, pixel-per-pixel so as to create an array holdingtheir differences. We obtained that SW and HW produced similar results. Theerror lines are attributed to a slightly different selection policy in the WTAprocess of the LRC stage. In particular, when it comes to compare two equalcost values, our SW selects one cost value randomly, while our HW selects alwaysthe first one. This variation occurs early in the algorithmic flow, thus it is notonly propagated but it is also amplified in the belief propagation module wherelocal estimates of correct disparities are spread to incorrectly matched pixelsalong the scan-line. Finally, the errors at the borders that occur in both SW andHW outputs as compared with the ground truth, are due to the unavoidableocclusions at the image borders.
Fig. 10. BRAM resource utilization with the optimized aggregation buffer structure
The actual prototype in the Virtex-5 FPGA can process images of up to400× 320 resolution. We put our efforts on building a high-speed stereo match-ing design, rather than solving the I/O issue. Instead, at off-line time we sendimages into internal BRAMs through a serial protocol; once the entire image isstored in the BRAMs the design starts processing it. We used hardware meansfor measuring the time to complete the FPGA processing, and by performing ex-periments on different images - mainly from Middlebury database - we achieveda processing rate of 1570fps. To the best of our knowledge this outperforms anypublished FPGA-based system.
Input Ground truth
SW output HW output
Fig. 11. Top row has Moebius 400× 320 input dataset from Middlebury database andthe ideal (ground truth) result. The bottow row has algorithm’s output from SW andHW implementations.
7 Conclusions and Future Work
In this chapter we presented the architecture and implementation of a real timestereo matching algorithm in an FPGA, which utilizes efficiently the strengthsof this device. We validated the system on a prototype, and we exceeded real-time requirements by a large margin for various parameter configurations. Inthe future we will place our efforts to more advanced aggregation schemes asthey are the key to better quality disparity maps for local methods. Anotherpoint that would benefit from further research is the scan-line belief propagationmethod, which we plan to augment to two dimensions and thus eliminate itsstreaking artifacts. Also we plan to complete the stereo vision core algorithmwith rectification and full camera integration.
subtractDisparity map 1 Disparity map 2
MATLAB implementation
Xilinx Virtex 5
0 1 0 0200
0 10
00200 3 0
001
Fig. 12. Validation methodology
8 Acknowledgement
This work has been partially supported by the General Secretariat of Researchand Technology (G.S.R.T), Hellas, under the project AFORMI- Allowing for Re-configurable Hardware to Efficiently Implement Algorithms of MultidisciplinaryImportance, funded in the call ARISTEIA of the framework Education and Life-long Learning (code 2427).
References
1. D. H. Ballard and C. M. Brown, Computer Vision. Englewood Cliffs, NJ, US:Prentice-Hall, 1982.
2. D. Marr, Vision. San Francisco, CA, US: Freeman, 1982.3. S. Di Carlo, P. Prinetto, D. Rolfo, N. Sansonne, and P. Trotta, “A novel algorithm
and hardware architecture for fast video-based shape reconstruction of space de-bris,” EURASIP Journal on Advances in Signal Processing, vol. 2014, no. 1, pp.1–19, 2014.
4. D. Scharstein and R. Szeliski, “A Taxonomy and Evaluation of Dense Two-FrameStereo Correspondence Algorithms,” International Journal of Computer Vision,vol. 47, no. 1-3, pp. 7–42, April-June 2002.
5. http://vision.middlebury.edu/stereo/eval/.6. S. Thomas, K. Papadimitriou, and A. Dollas, “Architecture and Implementation
of Real-Time 3D Stereo Vision on a Xilinx FPGA,” in IFIP/IEEE InternationalConference on Very Large Scale Integration (VLSI-SoC), October 2013, pp. 186–191.
7. K. Konolige, “Small Vision Systems: Hardware and Implementation,” in Proceed-ings of the International Symposium on Robotics Research, 1997, pp. 111–116.
8. C. Murphy, D. Lindquist, A. M. Rynning, T. Cecil, S. Leavitt, and M. L. Chang,“Low-Cost Stereo Vision on an FPGA,” in Proceedings of the IEEE Symposiumon Field-Programmable Custom Computing Machines (FCCM), April 2007, pp.333–334.
9. S. Hadjitheophanous, C. Ttofis, A. S. Georghiades, and T. Theocharides, “TowardsHardware Stereoscopic 3D Reconstruction, A Real-Time FPGA Computation ofthe Disparity Map,” in Proceedings of the Design, Automation and Test in EuropeConference and Exhibition (DATE), March 2010, pp. 1743–1748.
10. M. Humenberger, C. Zinner, M. Weber, W. Kubinger, and M. Vincze, “A FastStereo Matching Algorithm Suitable for Embedded Real-Time Systems,” ComputerVision and Image Understanding, vol. 114, no. 11, pp. 1180–1202, November 2010.
11. D. K. Masrani and W. J. MacLean, “A Real-Time Large Disparity Range Stereo-System using FPGAs,” in Proceedings of the IEEE International Conference onComputer Vision Systems, 2006, pp. 42–51.
12. S. Jin, J. U. Cho, X. D. Pham, K. M. Lee, S.-K. Park, and J. W. J. Munsang Kim,“FPGA Design and Implementation of a Real-Time Stereo Vision System,” IEEETransactions on Circuits and Systems for Video Technology, vol. 20, no. 1, pp.15–26, January 2010.
13. G. Rematska, K. Papadimitriou, and A. Dollas, “A Low-Cost Embedded Real-Time3D Stereo Matching System for Surveillance Applications,” in IEEE InternationalSymposium on Monitoring and Surveillance Research (ISMSR), in conjunctionwith the IEEE International Conference on Bioinformatics and Bioengineering(BIBE), November 2013.
14. M. Jin and T. Maruyama, “Fast and Accurate Stereo Vision System on FPGA,”ACM Transactions on Reconfigurable Technology and Systems (TRETS), vol. 7,no. 1, pp. 3:1–3:24, February 2014.
15. http://danstrother.com/2011/01/24/fpga-stereo-vision-project/.16. C. Rhemann, A. Hosni, M.Bleyer, C. Rother, and M. Gelautz, “Fast Cost-Volume
Filtering for Visual Correspondence and Beyond,” in Proceedings of IEEE Con-ference on Computer Vision and Pattern Recognition (CVPR), June 2011, pp.3017–3024.
17. R. Kalarot and J. Morris, “Stereo Vision Algorithms for FPGAs,” in IEEE Con-ference on Computer Vision and Pattern Recognition Workshops (CVPRW), June2010, pp. 9–15.
18. S. Mattoccia, “Stereo Vision Algorithms for FPGAs,” in IEEE Conference onComputer Vision and Pattern Recognition Workshops (CVPRW), 2013, pp. 636–641.
19. R. Zabih and J. Woodfill, “Non-parametric Local Transforms for Computing VisualCorrespondence,” in Proceedings of the European Conference on Computer Vision(ECCV), 1994, pp. 151–158.
20. X. Mei, X. Sun, M. Zhou, S. Jiao, H. Wang, and X. Zhang, “On Building anAccurate Stereo Matching System on Graphics Hardware,” in Proceedings of theIEEE International Conference on Computer Vision Workshops (ICCV), Novem-ber 2011, pp. 467–474.