Embed Size (px)
Citation preview
HAL Id: hal-01627651https://hal.archives-ouvertes.fr/hal-01627651
Submitted on 2 Nov 2017
HAL is a multi-disciplinary open accessarchive for the deposit and dissemination of sci-entific research documents, whether they are pub-lished or not. The documents may come fromteaching and research institutions in France orabroad, or from public or private research centers.
L’archive ouverte pluridisciplinaire HAL, estdestinée au dépôt et à la diffusion de documentsscientifiques de niveau recherche, publiés ou non,émanant des établissements d’enseignement et derecherche français ou étrangers, des laboratoirespublics ou privés.
An FPGA stereo matching unit based on fuzzy logicM. Pérez-Patricio, Abiel Aguilar-González, M. Arias-Estrada, H.
Hernández-de León, J. Camas-Anzueto, J.A. de Jesús Osuna-Coutiño
To cite this version:M. Pérez-Patricio, Abiel Aguilar-González, M. Arias-Estrada, H. Hernández-de León, J. Camas-Anzueto, et al.. An FPGA stereo matching unit based on fuzzy logic. Microproces-sors and Microsystems: Embedded Hardware Design (MICPRO), Elsevier, 2016, 42, pp.87-99.�10.1016/j.micpro.2015.10.011�. �hal-01627651�
An FPGA stereo matching unit based on fuzzy logic
M. Perez-Patricioa, Abiel Aguilar-Gonzalez∗b, M. Arias-Estradab, H. R. Hernandez-De Leona, J. L. Camas-Anzuetoa, J. A. de J.Osuna-Coutinoa
aInstituto Tecnologico de Tuxtla Gutierrez, Tuxtla Gutierrez, MexicobInstituto Nacional de Astrofısica, Optica y Electronica, Cholula, Mexico
Abstract
The stereo matching is one of the most widely used algorithms in real-time image processing applications such as positioning sys-tems for mobile robots, three-dimensional building mapping and both recognition, detection and three-dimensional reconstructionof objects. In order to improve the runtime, stereo matching algorithms often have been implemented in dedicated hardware suchas FPGA or GPU devices. In this article an FPGA stereo matching unit based on fuzzy logic is described. The proposed methodconsists of three stages: first, three similarity parameters inherent to each pixel contained in the input stereo pair are determined;later, these parameters are submitted to a fuzzy inference system that determines a value of fuzzy-similarity; finally, the disparityvalue is determined as the index for the maximum value of the fuzzy-similarity values (zero up to dmax). Dense disparity maps arecomputed at a rate of 76 frames per second for input stereo pairs of 1280x1024 pixel resolution and a maximum expected disparityequal to 15. The developed FPGA architecture provides reduction of the hardware resource demand; up to 67,384, minimum 9,788for logic units, up to 35,475, minimum 11,766 for bits of memory. Increases the processing speed; up to 78,725,120, minimum14,417,920 pixels per second and outperforms the accuracy level of most of real-time stereo matching algorithms reported in theliterature.
Keywords: Stereo matching, Fuzzy logic, FPGA
1. Introduction
Depht values of the points contained in an image is one ofthe most used tasks of the computer vision systems and hasbeen used in several applications such as positioning systemsfor mobile robots and both recognition, detection and three-dimensional reconstruction of objects [1–7]. In stereo visiontechnique the correspondence between stereo pairs and the ge-ometrical configuration of the stereo camera allows to obtainimages of depth called disparity maps. In order to determinea disparity map it is necessary to measure the similarity of thepoints contained in the stereo pair. Techniques to determinethese similarities are divided in two categories: area-based al-gorithms [8, 9] and feature-based algorithms [10, 11].
Area-based algorithm use the color value of the surroundingpixels to the interest pixel and produce dense disparity maps, i.e., these compute the disparity value for each pixel in the inputstereo pair. The main characteristic of area-based algorithms ismathematical simplicity and low runtime. On the other hand,feature-based algorithms are based on specific interest pointsand are more stable against changes of contrast, enviromentconditions and illumination due to these represent the geometricproperties of the input stereo pair. However, these algorithmspossess high runtime and high mathematical complexity.
∗Corresponding authorEmail address: [email protected] (Abiel
Aguilar-Gonzalez∗)
2. Related works
FPGA devices allow the implementation of dedicated com-putational architectures that can accelerate algorithms. In pre-vious work there has been several FPGA stereo matching archi-tectures reported in the literature [12, 13]. However, in most ofthese FPGA architectures the authors have been concentratedin the accuracy level and not in the performance regarding tohardware resource consumption, which is an important parame-ter in mobile autonomous applications in which the use of smallFPGA devices and small power sources are required.
2.1. FPGA implementations
The system presented in [14] consists in a 4×4 array of FP-GAs connected in mesh type configuration, authors use a max-imum total of near 35,000 LUT of 4 inputs, allowing to process40 frames per second for images of 320×240 pixel resolution.In [15], a structure based on four FPGAs Virtex 2000E of Xil-inx is presented, obtaining dense disparity maps at a speed of 40frames per second for images of 256×360 pixel resolution. In[16], the use of a single FPGA is proposed, the developed sys-tem processes images at 30 frames per second using images of640×480 pixel resolution. The architecture developed in [17],uses a technique based on SAD to calculate the optical flow ef-ficiently, the system generates dense disparity maps at speedssuperiors to 800 frames per second for images of 320×240 pix-els using a correlation window of 7×7 and a maximum expecteddisparity equal to 121.
Preprint submitted to Elsevier April 24, 2017
A modification of SAD is shown in [18], the authors of thiswork synthesize diverse versions of SAD to determine the needsand the performance of the hardaware resources, by decompos-ing the correlation window of SAD in rows and columns usingbuffers a saving of resource of around 50% is reached. Usingdifferent forms of windows, the high consumptions of memorydecreases without any detriment of the quality. Disparity mapsare calculated at speed of 122 frames per second for images of320×240 pixels and a maximum expected disparity equal to 64.
The architecture in [19] uses four FPGAs to conduct a rectifi-cation in real-time, later, a verification of left-right consistencywas applied in order to improve the quality of the produced dis-parity map. Speeds of 30 frames per second are reached forimages of 640×480 pixel resolution and a maximum expecteddisparity equal to 128. In [9] an FPGA correlation-edge dis-tance approach is proposed. Speeds of 76 frames per second arereached for images of 1280×1024 pixel resolution and a maxi-mum expected disparity equal to 15. By using a geometric fea-ture, the euclidean distance between the selected point and thenearest left edge, the developed FPGA architecture provides aimprovement over others conventional correlation-based stereomatching algorithms.
2.2. Fuzzy logic approaches
In [20], similarity measure for stereo matching based onfuzzy relations is proposed. The strength of relationship offuzzy data of two windows in the left image and the right imageis determined by applying fuzzy aggregation operators. How-ever, these measures fail to establish correspondence of the oc-cluded pixels. In order to outperform the performance in theoccluded pixels an modification of the weighted normalizedcross correlation (WNCC) algorithm based on fuzzy relationsof fuzzy data is used for the stereo matching process.
Authors of [21] present an modification of the Zitnick andKanade stereo matching algorithm [22]. The authors proposethe use of a balanced correlation window. In addition, the useof a new fuzzy factor in the calculation of initial matching val-ues which expresses the possibility of matching between twopixels and a new iterative function for the refinement of the ini-tial matching values are presented. Experimental results areevaluated on synthetic and real images and a comparison ofthe results regarding to other algorithms reported in the liter-ature, using the ground truth data supplied by the University ofTsukuba, is presented.
Finally, in [23] an FPGA module suitable for real-time dis-parity map computation is presented. This enables a hardware-based fuzzy inference system parallel-pipelined design, for theoverall module, implemented on a single FPGA device with aoperating frequency of 138 MHz. This provides disparity mapcomputation at a rate of nearly 440 frames per second, for a in-put stereo pair with a disparity range of 80 pixels and 640×480pixel resolution. The proposed method allows high speed pro-cessing, enabling a suitable module for real-time stereo visionapplications.
3. The proposed method
Stereo matching algorithms suitable for real-time processinghave been studied by several authors, section 2.1. However,most of these algorithms possess high mathematical complex-ity; therefore, large FPGA devices are required in order imple-ment them. On the other hand, although some approaches basedon fuzzy logic have been reported in the literature section 2.2,the algorithms described in [20, 22] presented high mathemati-cal complexity and do not allow to be implemented in dedicatedhardware for real-time processing such as FPGA devices. Incase of the FPGA architecture in [23] possesses high accuracyand high speed processing. However, the developed modulemaintains high hardware resource consumption.
The main objective in this research is to develop an FPGAstereo matching unit suitable for real-time processing. The dis-parity maps are computed at a rate of 76 frames per second forinput stereo pairs of 1280×1024 pixel resolution and a maxi-mum expected disparity (dmax) equal to 15. In order to reachhigh accuracy level the use of multiple similarity parametersand a fuzzy approach is proposed. Furthermore, to obtain highspeed processing, the proposed method was implemented in anFPGA device. On the other hand, in order to maintain low hard-ware resources consumption it is proposed the use of new strate-gies such as: a fuzzy inference system based on point-slopeequations and the use of storage vectors. Finally, to obtain anappropriate configuration regarding to the environment settingof the input stereo pair, the developed FPGA architecture allowsto set up the exposition of the cameras and allows scalability fordifferent levels of maximum disparity of simple and systematicform. This allows that the resulting hardware can be applied toa wide range of applications of real-time stereo vision.
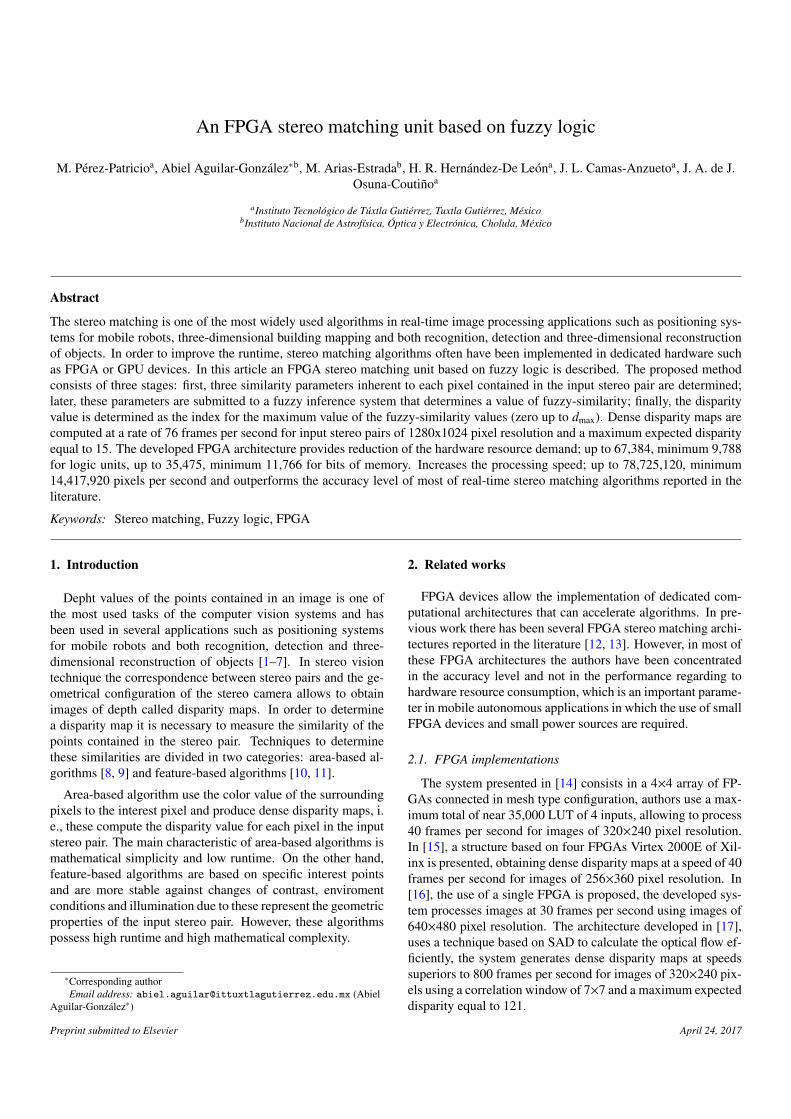
A general block diagram of the proposed method is shownin the Figure 1, the data obtained through a stereo camera isprocessed to the cadence of video and it is simultaneously com-puted three similarity parameters inherent to each pixel. 1 -correlation obtained via the Sum of absolute differences (SAD)algorithm [24–27]. 2 - similarity of the distance in pixels to thecloser left edge. 3 - similarity of the distance in pixels the closerright edge. Later, these three parameters are submited to a fuzzyinference system which assigns fuzzy-similarity values for thezero up to dmax disparity levels. Finally, the value of disparity isassigned as the index that maximizes the fuzzy-similarity value.
Figure 1: Block Diagram of the proposed method.
2
3.1. Correlation computation
In majority of area-based algorithms, a rectangular vicinitycentered on a reference pixel in one of the images from a stereopair is compared with similar vicinities for some pixels in thesame raster line of the other image. Vicinities are called corre-lation windows and can be compared using a correlation-basedmeasure such as SAD, equation 1; where 2w + 1 is the sizeof the correlation window centered in the pixel located in the(x, y) position. Il, Ir are the grayscale values of the pixels in theimages left and right respectively and z takes values from 0 upto dmax.
Crl(x, y, z) =
u=w,v=w∑u=−w,v=−w
|Il(x + u, y + u) − Ir(x + u + z, y + u)| (1)
3.2. Similarity of the edge distances
The euclidean distance between each pixel with coordenatesIl(x, y1) or Ir(x, y1) and the closer left edge (d1), consideringimages of X × Y resolution and a maximum level of expecteddisparity equal to dmax is computed via equations 2 - 3; whereβ represents the value of threshold to determine an edge. δ isdefined as l or r for the left or right images, respectively. zranges from 0 up to dmax. y1 ranges from 1 up to Y − dmax andg1 is defined by equation 4.
d1(x, y1, z) =
{l = 0, k1(x, y1, z) < βl = l + 1, k1(x, y1, z) > β (2)
k1(x, y1, z) = |Iδ(x, y1 + z) − Iδ(x, y1 − g1 + z)| (3)
g1 =
{1, y > 10, otherwise (4)
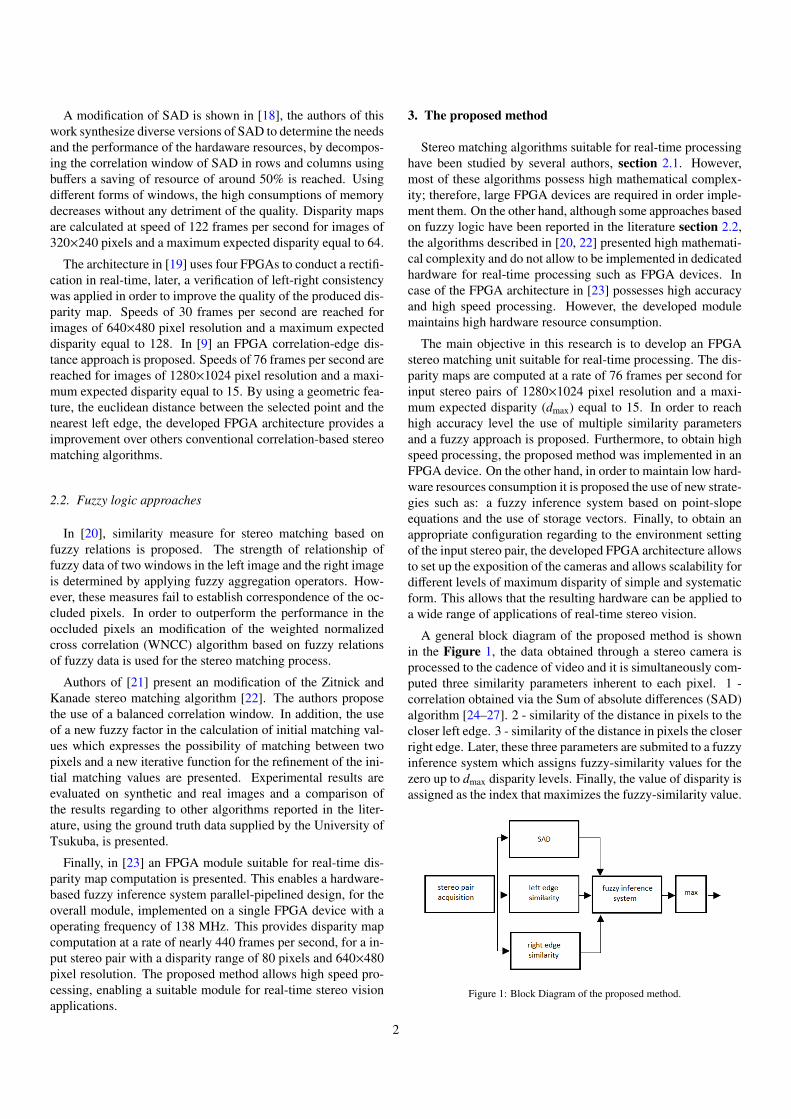
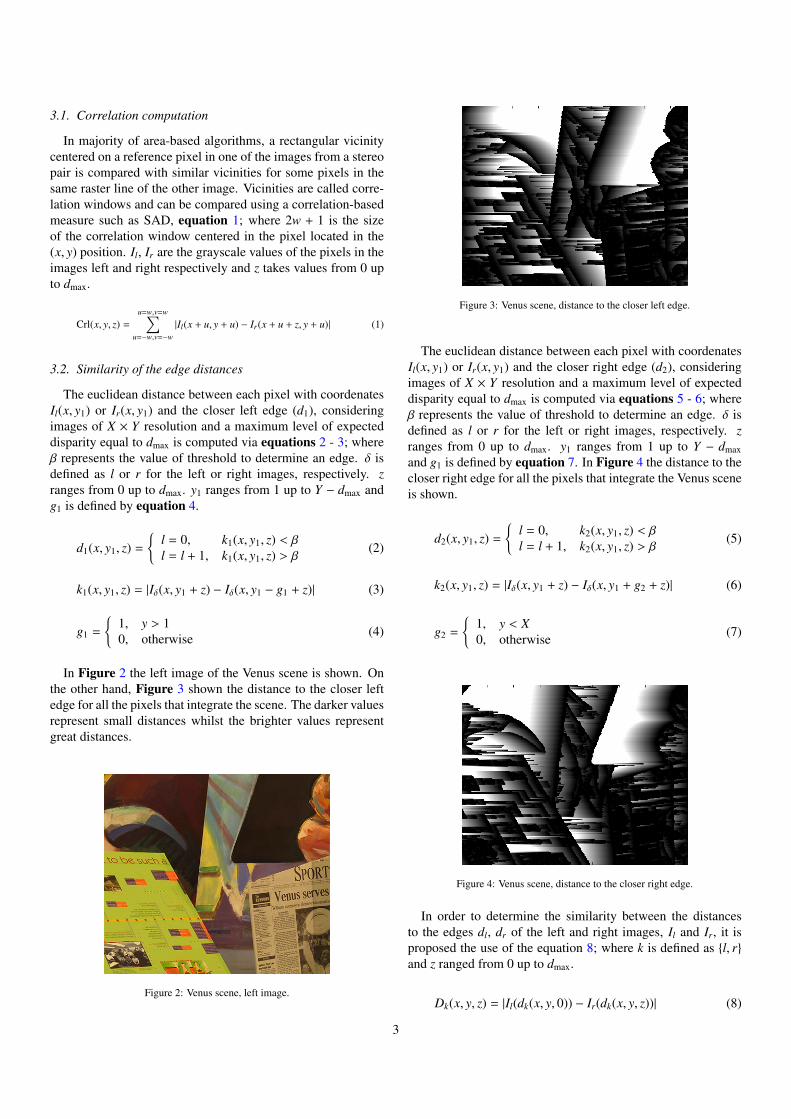
In Figure 2 the left image of the Venus scene is shown. Onthe other hand, Figure 3 shown the distance to the closer leftedge for all the pixels that integrate the scene. The darker valuesrepresent small distances whilst the brighter values representgreat distances.
Figure 2: Venus scene, left image.
Figure 3: Venus scene, distance to the closer left edge.
The euclidean distance between each pixel with coordenatesIl(x, y1) or Ir(x, y1) and the closer right edge (d2), consideringimages of X × Y resolution and a maximum level of expecteddisparity equal to dmax is computed via equations 5 - 6; whereβ represents the value of threshold to determine an edge. δ isdefined as l or r for the left or right images, respectively. zranges from 0 up to dmax. y1 ranges from 1 up to Y − dmaxand g1 is defined by equation 7. In Figure 4 the distance to thecloser right edge for all the pixels that integrate the Venus sceneis shown.
d2(x, y1, z) =
{l = 0, k2(x, y1, z) < βl = l + 1, k2(x, y1, z) > β (5)
k2(x, y1, z) = |Iδ(x, y1 + z) − Iδ(x, y1 + g2 + z)| (6)
g2 =
{1, y < X0, otherwise (7)
Figure 4: Venus scene, distance to the closer right edge.
In order to determine the similarity between the distancesto the edges dl, dr of the left and right images, Il and Ir, it isproposed the use of the equation 8; where k is defined as {l, r}and z ranged from 0 up to dmax.
Dk(x, y, z) = |Il(dk(x, y, 0)) − Ir(dk(x, y, z))| (8)
3
3.3. Fuzzy Inference System
The three similarity parameters, correlation (Crl) and theedge distances similarities (Dl,Dr), ineherent to each (x, y)pixel for each z level of disparity, are submited to a fuzzy in-ference system that determines a fuzzy-similarity value. In theproposed fuzzy inference system, input membership functionsfor Crl, D1 and D2 are used. These functions determine the de-gree of truth to the fuzzy sets good , medium and bad, thatrepresent the degree of similarity between the pixels of the leftand right images, being good a high value of similarity, bad alow value of similarity and medium an intermediate value be-tween high and low similarity.
Due to the linearity of the input data it is proposed to usetriangular type functions with binary based slopes. Functionsof this type allow to simplify the products and quotients to anshift operation over registers. This will be useful when im-plementing the proposed method in FPGA devices, this allowto reduce the hardware resources demand and maintaining lowmathematical complexity. The input membership functions offor the good, medium and bad sets were defined as shown inequations 9 - 11; where α, β and γ are equal to 0, 128 and 255respectively. h corresponds to the similarity parameters values.
µgood(x, y) =
0, γ ≤ hh−γα−γ· (255), α < h < γ
255, h ≤ α(9)
µmedium(x, y) =
h−αβ−α· (255), α < h < β
h−γβ−γ· (255), β ≤ h < γ
0, otherwise(10)
µbad(x, y) =
0, h ≤ αh−αγ−α· (255), α < h < γ
255, γ ≤ h(11)
In the proposed method the output with the larger numericalvalue regarding to the diferent z disparity levels. In order to as-sign output values three fuzzy output sets are proposed good,medium and bad. Where good represents the major numer-ical output values, descending to the values pertaining to themedium set and finally the values from the bad set that repre-sents the minimum numerical values that can define the output.The degrees of truth to these sets are determined via the func-tions ψgood, ψmedium and ψbad, equations 12 - 14; where α, β, γ,ρ and σ are equal to 0, 128, 255, 96 and 160 respectively.
ψgood(x, y) =
0, γ ≤ hh−γα−γ· (255), α < h < γ
255, h ≤ α(12)
ψmedium(x, y) =
h−ρβ−ρ· (255), ρ < h < β
h−σβ−σ· (255), β ≤ h < σ
0, otherwise(13)
ψbad(x, y) =
0, h ≤ αh−αγ−α· (255), α < h < γ
255, γ ≤ h(14)
To relating the input sets to the output sets, the use of rulesIF-THEN type and the AND operator of Zadet is proposed[28]. The design rules are shown in the Table 1. In order touse a fuzzy inference process with low hardware resource con-sumption, it is proposed the following fuzzy inference mecha-nism. First, the precedent of each rule is computed replacingthe numerical values of the Crl, D1 and D2 inputs in equa-tions 9-11; where εn(x, y) is the precedent of the nth rule andµ1(x, y), µ2(x, y) are both fuzzy sets included in each rule (Ta-ble 1). On the other hand, the consequent to each rule is de-termined as shown in equation 16; where ϑn(x, y) is the conse-quent of the nth rule. inp is the input value for the correspond-ing similarity parameter and fs is an point-slope type equationthat describes a linear segment of the output membership func-tions, equations 12-14. In the column fr of the Table 1 theassignation of functions fs for each rule is shown.
εn(x, y) = min (µ1(x, y), µ2(x, y)) (15)
ϑn(x, y) = fs(εn(x, y)) (16)
f1(εn(x, y)) = εn(x, y) (17)
f2(εn(x, y)) = −εn(x, y) + 255 (18)
f3(εn(x, y)) =
{(εn(x, y) − 768)/8, inp < 128(−εn(x, y) + 1280)/8, otherwise (19)
Table 1: Bank of rules of the proposed fuzzy inference system
Rule number Crl D1 D2 Output fs
1 good good none good fs = f12 good medium none good fs = f13 good bad none medium fs = f34 medium good none medium fs = f35 medium medium none bad fs = f26 medium bad none medium fs = f37 bad good none medium fs = f38 bad medium none medium fs = f39 bad bad none bad fs = f210 good none good good fs = f111 good none medium medium fs = f312 good none bad medium fs = f313 medium none good bad fs = f214 medium none medium medium fs = f315 medium none bad medium fs = f316 bad none good medium fs = f317 bad none medium bad fs = f218 bad none bad bad fs = f2
Finally, the result of the fuzzy inference is determined usingthe Mean-Max method, equation 20; where ϑm1(x, y), ϑm2(x, y)are the consequence of the two rules with higher implication inthe fuzzy inference process while the corresponding disparityvalue is determined via the equation 21.
fuzzy inference(x, y, z) = (ϑm1(x, y) + ϑm2(x, y))/2 (20)
disparity(x, y) = arg maxz fuzzy inference(x, y, z) (21)
4
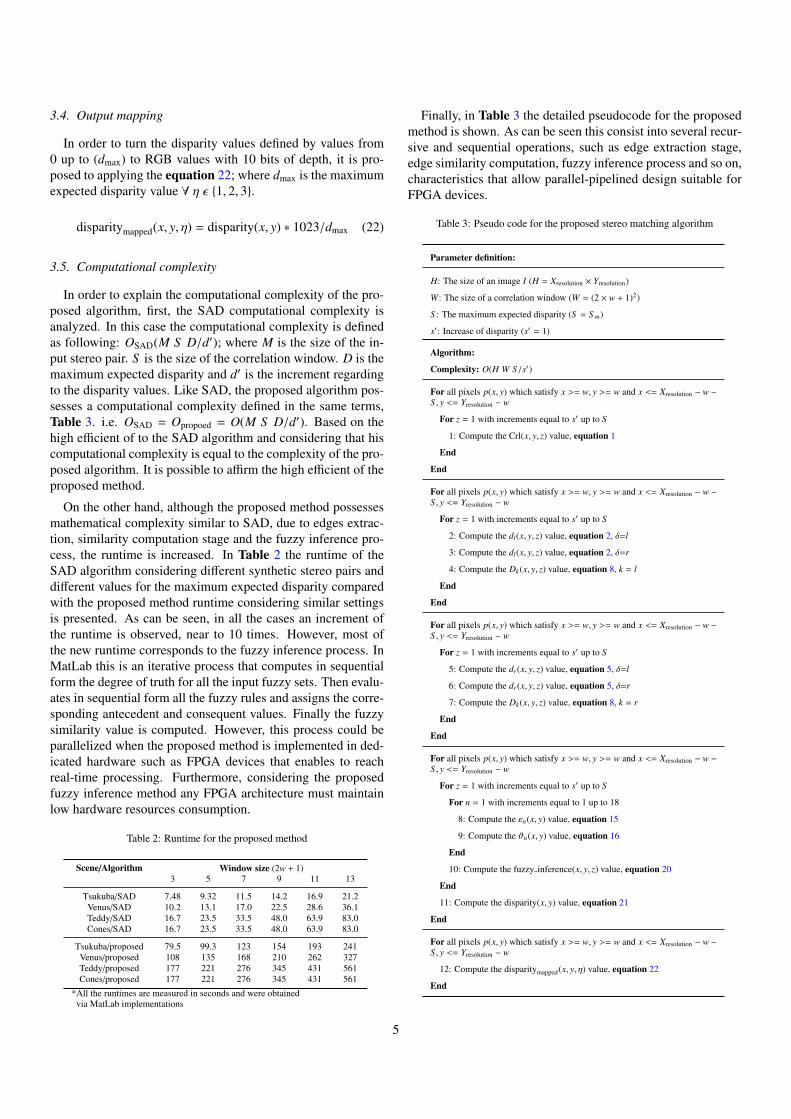
3.4. Output mapping
In order to turn the disparity values defined by values from0 up to (dmax) to RGB values with 10 bits of depth, it is pro-posed to applying the equation 22; where dmax is the maximumexpected disparity value ∀ η ε {1, 2, 3}.
disparitymapped(x, y, η) = disparity(x, y) ∗ 1023/dmax (22)
3.5. Computational complexity
In order to explain the computational complexity of the pro-posed algorithm, first, the SAD computational complexity isanalyzed. In this case the computational complexity is definedas following: OSAD(M S D/d′); where M is the size of the in-put stereo pair. S is the size of the correlation window. D is themaximum expected disparity and d′ is the increment regardingto the disparity values. Like SAD, the proposed algorithm pos-sesses a computational complexity defined in the same terms,Table 3. i.e. OSAD = Opropoed = O(M S D/d′). Based on thehigh efficient of to the SAD algorithm and considering that hiscomputational complexity is equal to the complexity of the pro-posed algorithm. It is possible to affirm the high efficient of theproposed method.
On the other hand, although the proposed method possessesmathematical complexity similar to SAD, due to edges extrac-tion, similarity computation stage and the fuzzy inference pro-cess, the runtime is increased. In Table 2 the runtime of theSAD algorithm considering different synthetic stereo pairs anddifferent values for the maximum expected disparity comparedwith the proposed method runtime considering similar settingsis presented. As can be seen, in all the cases an increment ofthe runtime is observed, near to 10 times. However, most ofthe new runtime corresponds to the fuzzy inference process. InMatLab this is an iterative process that computes in sequentialform the degree of truth for all the input fuzzy sets. Then evalu-ates in sequential form all the fuzzy rules and assigns the corre-sponding antecedent and consequent values. Finally the fuzzysimilarity value is computed. However, this process could beparallelized when the proposed method is implemented in ded-icated hardware such as FPGA devices that enables to reachreal-time processing. Furthermore, considering the proposedfuzzy inference method any FPGA architecture must maintainlow hardware resources consumption.
Table 2: Runtime for the proposed method
Scene/Algorithm Window size (2w + 1)3 5 7 9 11 13
Tsukuba/SAD 7.48 9.32 11.5 14.2 16.9 21.2Venus/SAD 10.2 13.1 17.0 22.5 28.6 36.1Teddy/SAD 16.7 23.5 33.5 48.0 63.9 83.0Cones/SAD 16.7 23.5 33.5 48.0 63.9 83.0
Tsukuba/proposed 79.5 99.3 123 154 193 241Venus/proposed 108 135 168 210 262 327Teddy/proposed 177 221 276 345 431 561Cones/proposed 177 221 276 345 431 561
*All the runtimes are measured in seconds and were obtainedvia MatLab implementations
Finally, in Table 3 the detailed pseudocode for the proposedmethod is shown. As can be seen this consist into several recur-sive and sequential operations, such as edge extraction stage,edge similarity computation, fuzzy inference process and so on,characteristics that allow parallel-pipelined design suitable forFPGA devices.
Table 3: Pseudo code for the proposed stereo matching algorithm
Parameter definition:
H: The size of an image I (H = Xresolution × Yresolution)
W: The size of a correlation window (W = (2 × w + 1)2)
S : The maximum expected disparity (S = S m)
s′: Increase of disparity (s′ = 1)
Algorithm:
Complexity: O(H W S/s′)
For all pixels p(x, y) which satisfy x >= w, y >= w and x <= Xresolution − w −S , y <= Yresolution − w
For z = 1 with increments equal to s′ up to S
1: Compute the Crl(x, y, z) value, equation 1
End
End
For all pixels p(x, y) which satisfy x >= w, y >= w and x <= Xresolution − w −S , y <= Yresolution − w
For z = 1 with increments equal to s′ up to S
2: Compute the dl(x, y, z) value, equation 2, δ=l
3: Compute the dl(x, y, z) value, equation 2, δ=r
4: Compute the Dk(x, y, z) value, equation 8, k = l
End
End
For all pixels p(x, y) which satisfy x >= w, y >= w and x <= Xresolution − w −S , y <= Yresolution − w
For z = 1 with increments equal to s′ up to S
5: Compute the dr(x, y, z) value, equation 5, δ=l
6: Compute the dr(x, y, z) value, equation 5, δ=r
7: Compute the Dk(x, y, z) value, equation 8, k = r
End
End
For all pixels p(x, y) which satisfy x >= w, y >= w and x <= Xresolution − w −S , y <= Yresolution − w
For z = 1 with increments equal to s′ up to S
For n = 1 with increments equal to 1 up to 18
8: Compute the εn(x, y) value, equation 15
9: Compute the ϑn(x, y) value, equation 16
End
10: Compute the fuzzy inference(x, y, z) value, equation 20
End
11: Compute the disparity(x, y) value, equation 21
End
For all pixels p(x, y) which satisfy x >= w, y >= w and x <= Xresolution − w −S , y <= Yresolution − w
12: Compute the disparitymapped(x, y, η) value, equation 22
End
5
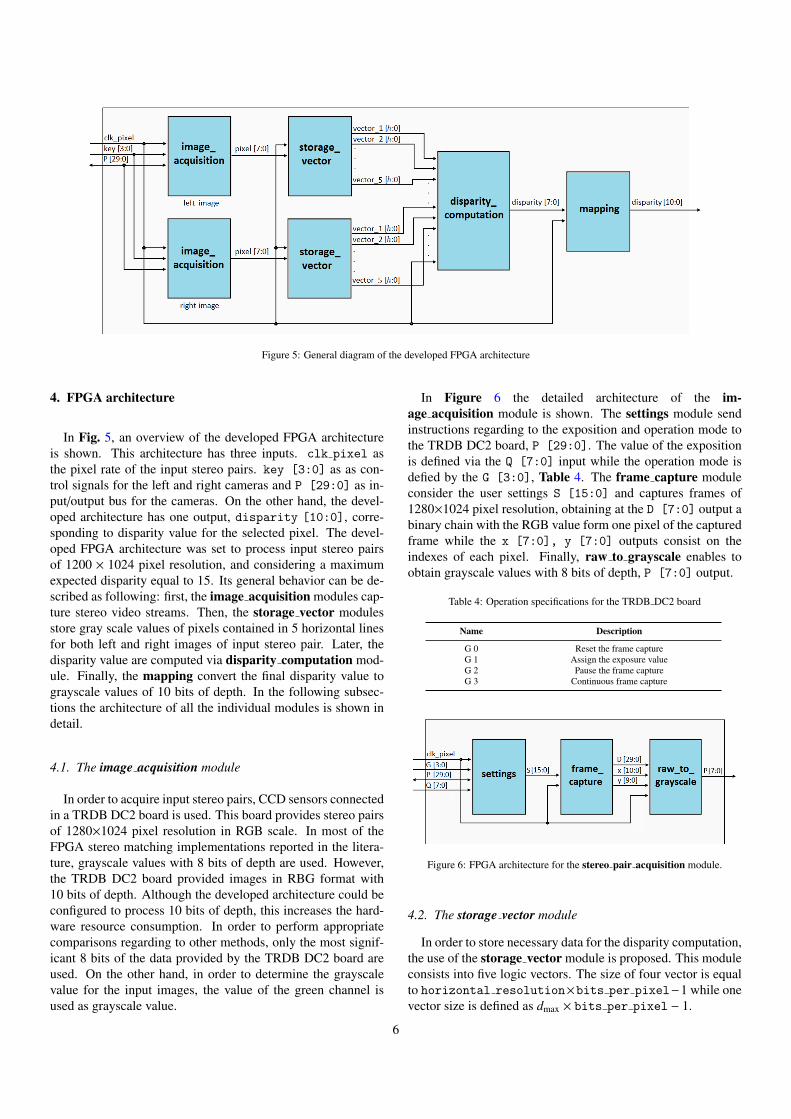
Figure 5: General diagram of the developed FPGA architecture
4. FPGA architecture
In Fig. 5, an overview of the developed FPGA architectureis shown. This architecture has three inputs. clk pixel asthe pixel rate of the input stereo pairs. key [3:0] as as con-trol signals for the left and right cameras and P [29:0] as in-put/output bus for the cameras. On the other hand, the devel-oped architecture has one output, disparity [10:0], corre-sponding to disparity value for the selected pixel. The devel-oped FPGA architecture was set to process input stereo pairsof 1200 × 1024 pixel resolution, and considering a maximumexpected disparity equal to 15. Its general behavior can be de-scribed as following: first, the image acquisition modules cap-ture stereo video streams. Then, the storage vector modulesstore gray scale values of pixels contained in 5 horizontal linesfor both left and right images of input stereo pair. Later, thedisparity value are computed via disparity computation mod-ule. Finally, the mapping convert the final disparity value tograyscale values of 10 bits of depth. In the following subsec-tions the architecture of all the individual modules is shown indetail.
4.1. The image acquisition module
In order to acquire input stereo pairs, CCD sensors connectedin a TRDB DC2 board is used. This board provides stereo pairsof 1280×1024 pixel resolution in RGB scale. In most of theFPGA stereo matching implementations reported in the litera-ture, grayscale values with 8 bits of depth are used. However,the TRDB DC2 board provided images in RBG format with10 bits of depth. Although the developed architecture could beconfigured to process 10 bits of depth, this increases the hard-ware resource consumption. In order to perform appropriatecomparisons regarding to other methods, only the most signif-icant 8 bits of the data provided by the TRDB DC2 board areused. On the other hand, in order to determine the grayscalevalue for the input images, the value of the green channel isused as grayscale value.
In Figure 6 the detailed architecture of the im-age acquisition module is shown. The settings module sendinstructions regarding to the exposition and operation mode tothe TRDB DC2 board, P [29:0]. The value of the expositionis defined via the Q [7:0] input while the operation mode isdefied by the G [3:0], Table 4. The frame capture moduleconsider the user settings S [15:0] and captures frames of1280×1024 pixel resolution, obtaining at the D [7:0] output abinary chain with the RGB value form one pixel of the capturedframe while the x [7:0], y [7:0] outputs consist on theindexes of each pixel. Finally, raw to grayscale enables toobtain grayscale values with 8 bits of depth, P [7:0] output.
Table 4: Operation specifications for the TRDB DC2 board
Name Description
G 0 Reset the frame captureG 1 Assign the exposure valueG 2 Pause the frame captureG 3 Continuous frame capture
Figure 6: FPGA architecture for the stereo pair acquisition module.
4.2. The storage vector module
In order to store necessary data for the disparity computation,the use of the storage vector module is proposed. This moduleconsists into five logic vectors. The size of four vector is equalto horizontal resolution×bits per pixel−1 while onevector size is defined as dmax × bits per pixel − 1.
6
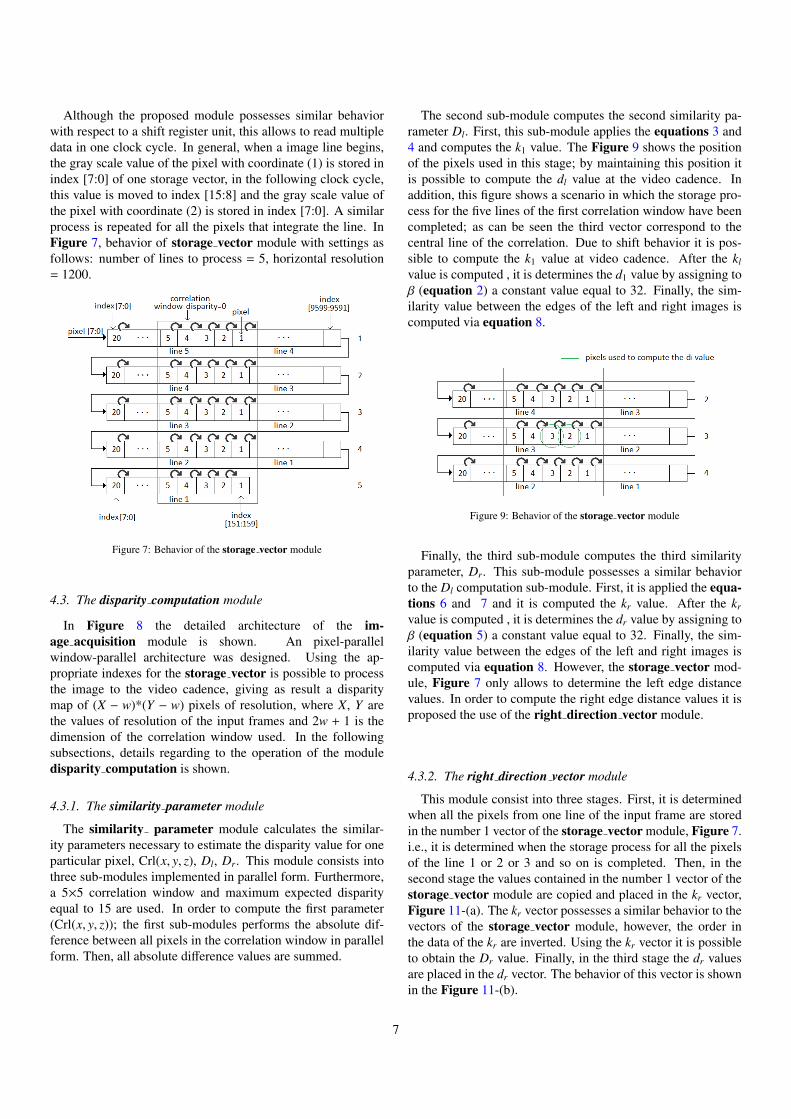
Although the proposed module possesses similar behaviorwith respect to a shift register unit, this allows to read multipledata in one clock cycle. In general, when a image line begins,the gray scale value of the pixel with coordinate (1) is stored inindex [7:0] of one storage vector, in the following clock cycle,this value is moved to index [15:8] and the gray scale value ofthe pixel with coordinate (2) is stored in index [7:0]. A similarprocess is repeated for all the pixels that integrate the line. InFigure 7, behavior of storage vector module with settings asfollows: number of lines to process = 5, horizontal resolution= 1200.
Figure 7: Behavior of the storage vector module
4.3. The disparity computation module
In Figure 8 the detailed architecture of the im-age acquisition module is shown. An pixel-parallelwindow-parallel architecture was designed. Using the ap-propriate indexes for the storage vector is possible to processthe image to the video cadence, giving as result a disparitymap of (X − w)*(Y − w) pixels of resolution, where X, Y arethe values of resolution of the input frames and 2w + 1 is thedimension of the correlation window used. In the followingsubsections, details regarding to the operation of the moduledisparity computation is shown.
4.3.1. The similarity parameter module
The similarity parameter module calculates the similar-ity parameters necessary to estimate the disparity value for oneparticular pixel, Crl(x, y, z), Dl, Dr. This module consists intothree sub-modules implemented in parallel form. Furthermore,a 5×5 correlation window and maximum expected disparityequal to 15 are used. In order to compute the first parameter(Crl(x, y, z)); the first sub-modules performs the absolute dif-ference between all pixels in the correlation window in parallelform. Then, all absolute difference values are summed.
The second sub-module computes the second similarity pa-rameter Dl. First, this sub-module applies the equations 3 and4 and computes the k1 value. The Figure 9 shows the positionof the pixels used in this stage; by maintaining this position itis possible to compute the dl value at the video cadence. Inaddition, this figure shows a scenario in which the storage pro-cess for the five lines of the first correlation window have beencompleted; as can be seen the third vector correspond to thecentral line of the correlation. Due to shift behavior it is pos-sible to compute the k1 value at video cadence. After the kl
value is computed , it is determines the d1 value by assigning toβ (equation 2) a constant value equal to 32. Finally, the sim-ilarity value between the edges of the left and right images iscomputed via equation 8.
Figure 9: Behavior of the storage vector module
Finally, the third sub-module computes the third similarityparameter, Dr. This sub-module possesses a similar behaviorto the Dl computation sub-module. First, it is applied the equa-tions 6 and 7 and it is computed the kr value. After the kr
value is computed , it is determines the dr value by assigning toβ (equation 5) a constant value equal to 32. Finally, the sim-ilarity value between the edges of the left and right images iscomputed via equation 8. However, the storage vector mod-ule, Figure 7 only allows to determine the left edge distancevalues. In order to compute the right edge distance values it isproposed the use of the right direction vector module.
4.3.2. The right direction vector module
This module consist into three stages. First, it is determinedwhen all the pixels from one line of the input frame are storedin the number 1 vector of the storage vector module, Figure 7.i.e., it is determined when the storage process for all the pixelsof the line 1 or 2 or 3 and so on is completed. Then, in thesecond stage the values contained in the number 1 vector of thestorage vector module are copied and placed in the kr vector,Figure 11-(a). The kr vector possesses a similar behavior to thevectors of the storage vector module, however, the order inthe data of the kr are inverted. Using the kr vector it is possibleto obtain the Dr value. Finally, in the third stage the dr valuesare placed in the dr vector. The behavior of this vector is shownin the Figure 11-(b).
7
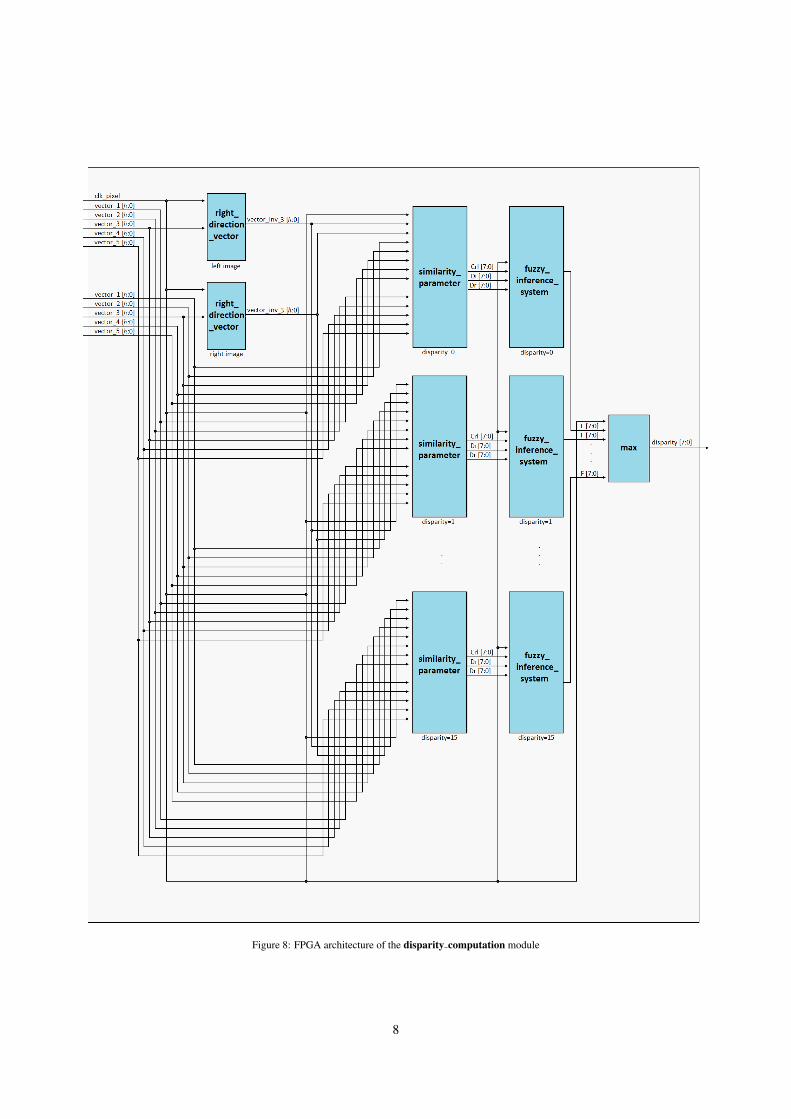
Figure 8: FPGA architecture of the disparity computation module
8
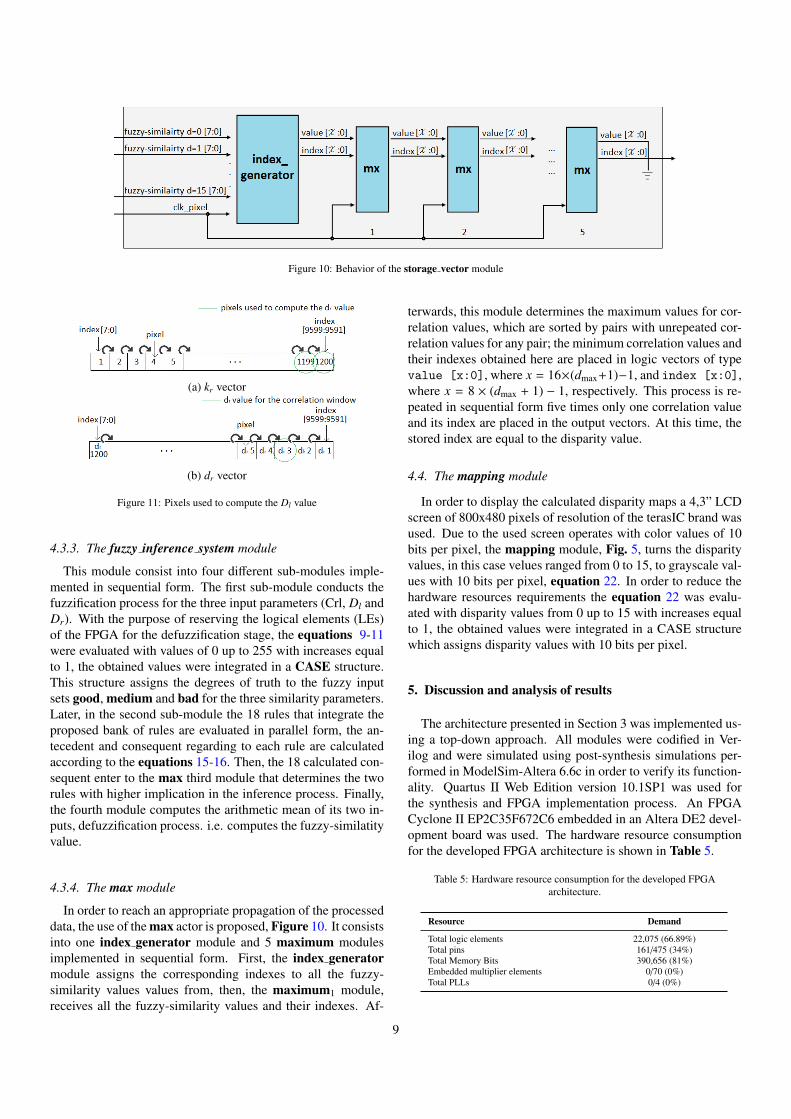
Figure 10: Behavior of the storage vector module
(a) kr vector
(b) dr vector
Figure 11: Pixels used to compute the Dl value
4.3.3. The fuzzy inference system module
This module consist into four different sub-modules imple-mented in sequential form. The first sub-module conducts thefuzzification process for the three input parameters (Crl, Dl andDr). With the purpose of reserving the logical elements (LEs)of the FPGA for the defuzzification stage, the equations 9-11were evaluated with values of 0 up to 255 with increases equalto 1, the obtained values were integrated in a CASE structure.This structure assigns the degrees of truth to the fuzzy inputsets good, medium and bad for the three similarity parameters.Later, in the second sub-module the 18 rules that integrate theproposed bank of rules are evaluated in parallel form, the an-tecedent and consequent regarding to each rule are calculatedaccording to the equations 15-16. Then, the 18 calculated con-sequent enter to the max third module that determines the tworules with higher implication in the inference process. Finally,the fourth module computes the arithmetic mean of its two in-puts, defuzzification process. i.e. computes the fuzzy-similatityvalue.
4.3.4. The max module
In order to reach an appropriate propagation of the processeddata, the use of the max actor is proposed, Figure 10. It consistsinto one index generator module and 5 maximum modulesimplemented in sequential form. First, the index generatormodule assigns the corresponding indexes to all the fuzzy-similarity values values from, then, the maximum1 module,receives all the fuzzy-similarity values and their indexes. Af-
terwards, this module determines the maximum values for cor-relation values, which are sorted by pairs with unrepeated cor-relation values for any pair; the minimum correlation values andtheir indexes obtained here are placed in logic vectors of typevalue [x:0], where x = 16×(dmax+1)−1, and index [x:0],where x = 8 × (dmax + 1) − 1, respectively. This process is re-peated in sequential form five times only one correlation valueand its index are placed in the output vectors. At this time, thestored index are equal to the disparity value.
4.4. The mapping module
In order to display the calculated disparity maps a 4,3” LCDscreen of 800x480 pixels of resolution of the terasIC brand wasused. Due to the used screen operates with color values of 10bits per pixel, the mapping module, Fig. 5, turns the disparityvalues, in this case velues ranged from 0 to 15, to grayscale val-ues with 10 bits per pixel, equation 22. In order to reduce thehardware resources requirements the equation 22 was evalu-ated with disparity values from 0 up to 15 with increases equalto 1, the obtained values were integrated in a CASE structurewhich assigns disparity values with 10 bits per pixel.
5. Discussion and analysis of results
The architecture presented in Section 3 was implemented us-ing a top-down approach. All modules were codified in Ver-ilog and were simulated using post-synthesis simulations per-formed in ModelSim-Altera 6.6c in order to verify its function-ality. Quartus II Web Edition version 10.1SP1 was used forthe synthesis and FPGA implementation process. An FPGACyclone II EP2C35F672C6 embedded in an Altera DE2 devel-opment board was used. The hardware resource consumptionfor the developed FPGA architecture is shown in Table 5.
Table 5: Hardware resource consumption for the developed FPGAarchitecture.
Resource Demand
Total logic elements 22,075 (66.89%)Total pins 161/475 (34%)Total Memory Bits 390,656 (81%)Embedded multiplier elements 0/70 (0%)Total PLLs 0/4 (0%)
9
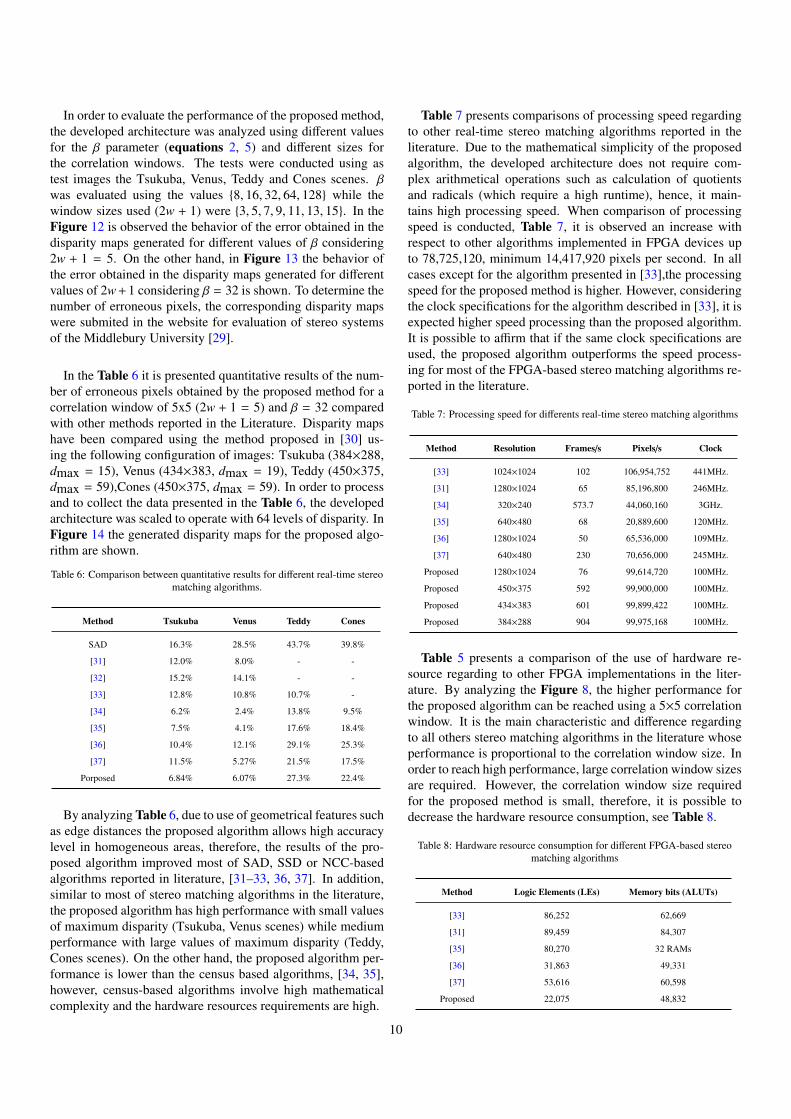
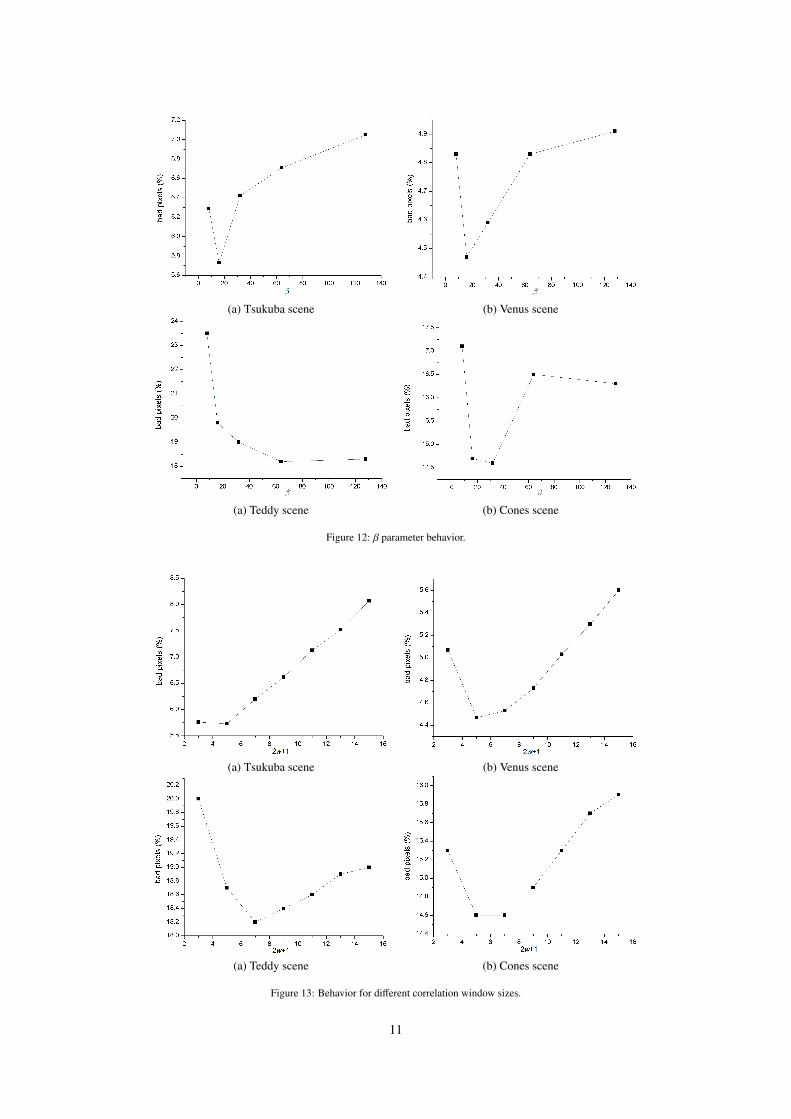
In order to evaluate the performance of the proposed method,the developed architecture was analyzed using different valuesfor the β parameter (equations 2, 5) and different sizes forthe correlation windows. The tests were conducted using astest images the Tsukuba, Venus, Teddy and Cones scenes. βwas evaluated using the values {8, 16, 32, 64, 128} while thewindow sizes used (2w + 1) were {3, 5, 7, 9, 11, 13, 15}. In theFigure 12 is observed the behavior of the error obtained in thedisparity maps generated for different values of β considering2w + 1 = 5. On the other hand, in Figure 13 the behavior ofthe error obtained in the disparity maps generated for differentvalues of 2w + 1 considering β = 32 is shown. To determine thenumber of erroneous pixels, the corresponding disparity mapswere submited in the website for evaluation of stereo systemsof the Middlebury University [29].
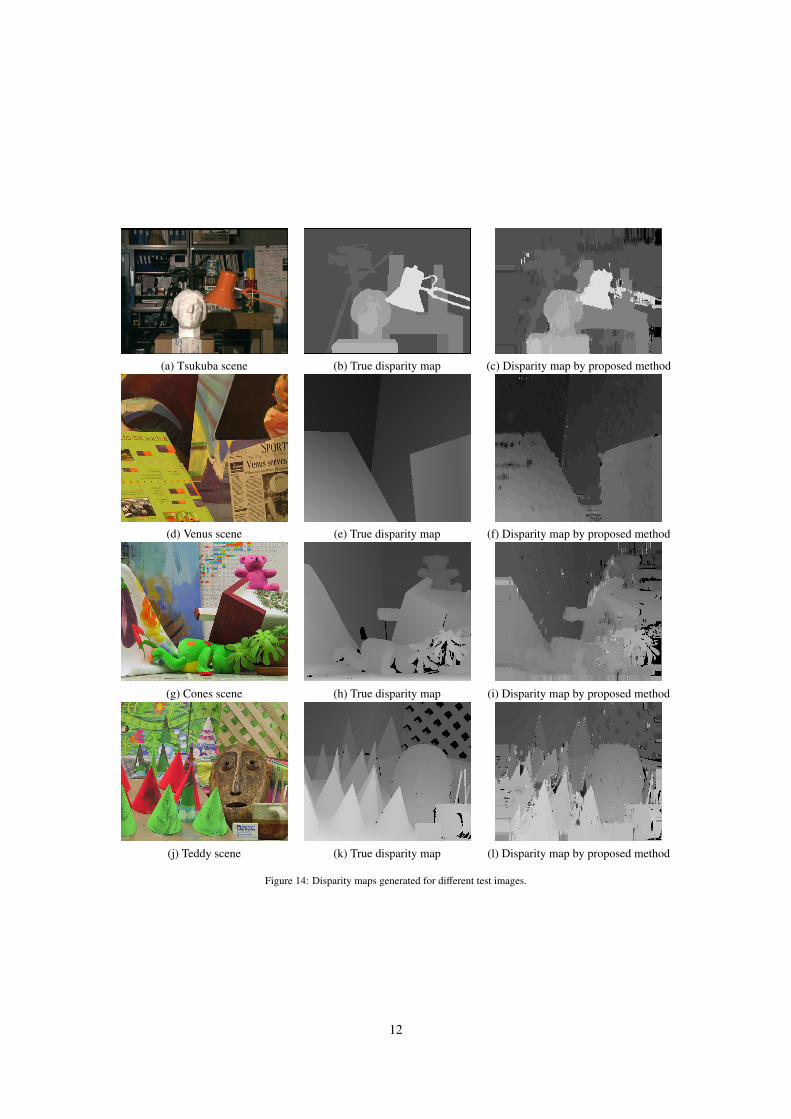
In the Table 6 it is presented quantitative results of the num-ber of erroneous pixels obtained by the proposed method for acorrelation window of 5x5 (2w + 1 = 5) and β = 32 comparedwith other methods reported in the Literature. Disparity mapshave been compared using the method proposed in [30] us-ing the following configuration of images: Tsukuba (384×288,dmax = 15), Venus (434×383, dmax = 19), Teddy (450×375,dmax = 59),Cones (450×375, dmax = 59). In order to processand to collect the data presented in the Table 6, the developedarchitecture was scaled to operate with 64 levels of disparity. InFigure 14 the generated disparity maps for the proposed algo-rithm are shown.
Table 6: Comparison between quantitative results for different real-time stereomatching algorithms.
Method Tsukuba Venus Teddy Cones
SAD 16.3% 28.5% 43.7% 39.8%
[31] 12.0% 8.0% - -
[32] 15.2% 14.1% - -
[33] 12.8% 10.8% 10.7% -
[34] 6.2% 2.4% 13.8% 9.5%
[35] 7.5% 4.1% 17.6% 18.4%
[36] 10.4% 12.1% 29.1% 25.3%
[37] 11.5% 5.27% 21.5% 17.5%
Porposed 6.84% 6.07% 27.3% 22.4%
By analyzing Table 6, due to use of geometrical features suchas edge distances the proposed algorithm allows high accuracylevel in homogeneous areas, therefore, the results of the pro-posed algorithm improved most of SAD, SSD or NCC-basedalgorithms reported in literature, [31–33, 36, 37]. In addition,similar to most of stereo matching algorithms in the literature,the proposed algorithm has high performance with small valuesof maximum disparity (Tsukuba, Venus scenes) while mediumperformance with large values of maximum disparity (Teddy,Cones scenes). On the other hand, the proposed algorithm per-formance is lower than the census based algorithms, [34, 35],however, census-based algorithms involve high mathematicalcomplexity and the hardware resources requirements are high.
Table 7 presents comparisons of processing speed regardingto other real-time stereo matching algorithms reported in theliterature. Due to the mathematical simplicity of the proposedalgorithm, the developed architecture does not require com-plex arithmetical operations such as calculation of quotientsand radicals (which require a high runtime), hence, it main-tains high processing speed. When comparison of processingspeed is conducted, Table 7, it is observed an increase withrespect to other algorithms implemented in FPGA devices upto 78,725,120, minimum 14,417,920 pixels per second. In allcases except for the algorithm presented in [33],the processingspeed for the proposed method is higher. However, consideringthe clock specifications for the algorithm described in [33], it isexpected higher speed processing than the proposed algorithm.It is possible to affirm that if the same clock specifications areused, the proposed algorithm outperforms the speed process-ing for most of the FPGA-based stereo matching algorithms re-ported in the literature.
Table 7: Processing speed for differents real-time stereo matching algorithms
Method Resolution Frames/s Pixels/s Clock
[33] 1024×1024 102 106,954,752 441MHz.
[31] 1280×1024 65 85,196,800 246MHz.
[34] 320×240 573.7 44,060,160 3GHz.
[35] 640×480 68 20,889,600 120MHz.
[36] 1280×1024 50 65,536,000 109MHz.
[37] 640×480 230 70,656,000 245MHz.
Proposed 1280×1024 76 99,614,720 100MHz.
Proposed 450×375 592 99,900,000 100MHz.
Proposed 434×383 601 99,899,422 100MHz.
Proposed 384×288 904 99,975,168 100MHz.
Table 5 presents a comparison of the use of hardware re-source regarding to other FPGA implementations in the liter-ature. By analyzing the Figure 8, the higher performance forthe proposed algorithm can be reached using a 5×5 correlationwindow. It is the main characteristic and difference regardingto all others stereo matching algorithms in the literature whoseperformance is proportional to the correlation window size. Inorder to reach high performance, large correlation window sizesare required. However, the correlation window size requiredfor the proposed method is small, therefore, it is possible todecrease the hardware resource consumption, see Table 8.
Table 8: Hardware resource consumption for different FPGA-based stereomatching algorithms
Method Logic Elements (LEs) Memory bits (ALUTs)
[33] 86,252 62,669
[31] 89,459 84,307
[35] 80,270 32 RAMs
[36] 31,863 49,331
[37] 53,616 60,598
Proposed 22,075 48,832
10
(a) Tsukuba scene (b) Venus scene
(a) Teddy scene (b) Cones scene
Figure 12: β parameter behavior.
(a) Tsukuba scene (b) Venus scene
(a) Teddy scene (b) Cones scene
Figure 13: Behavior for different correlation window sizes.
11
(a) Tsukuba scene (b) True disparity map (c) Disparity map by proposed method
(d) Venus scene (e) True disparity map (f) Disparity map by proposed method
(g) Cones scene (h) True disparity map (i) Disparity map by proposed method
(j) Teddy scene (k) True disparity map (l) Disparity map by proposed method
Figure 14: Disparity maps generated for different test images.
12
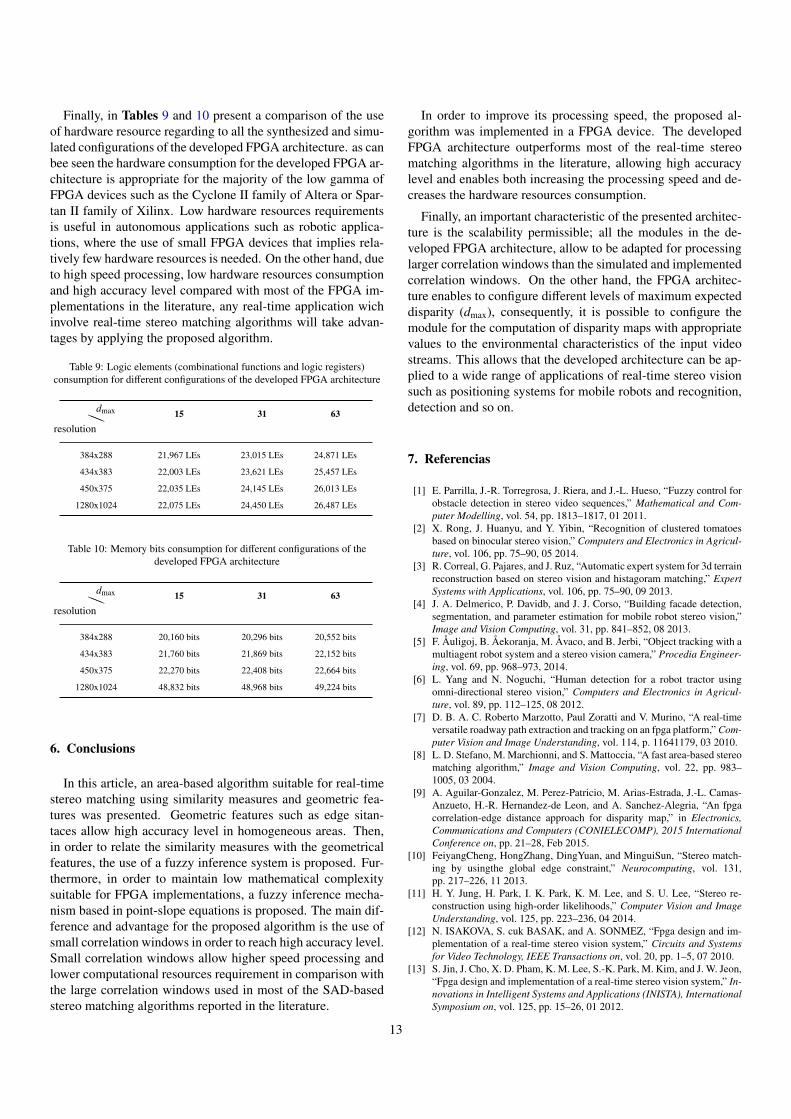
Finally, in Tables 9 and 10 present a comparison of the useof hardware resource regarding to all the synthesized and simu-lated configurations of the developed FPGA architecture. as canbee seen the hardware consumption for the developed FPGA ar-chitecture is appropriate for the majority of the low gamma ofFPGA devices such as the Cyclone II family of Altera or Spar-tan II family of Xilinx. Low hardware resources requirementsis useful in autonomous applications such as robotic applica-tions, where the use of small FPGA devices that implies rela-tively few hardware resources is needed. On the other hand, dueto high speed processing, low hardware resources consumptionand high accuracy level compared with most of the FPGA im-plementations in the literature, any real-time application wichinvolve real-time stereo matching algorithms will take advan-tages by applying the proposed algorithm.
Table 9: Logic elements (combinational functions and logic registers)consumption for different configurations of the developed FPGA architecture
aadmax
resolution15 31 63
384x288 21,967 LEs 23,015 LEs 24,871 LEs
434x383 22,003 LEs 23,621 LEs 25,457 LEs
450x375 22,035 LEs 24,145 LEs 26,013 LEs
1280x1024 22,075 LEs 24,450 LEs 26,487 LEs
Table 10: Memory bits consumption for different configurations of thedeveloped FPGA architecture
aadmax
resolution15 31 63
384x288 20,160 bits 20,296 bits 20,552 bits
434x383 21,760 bits 21,869 bits 22,152 bits
450x375 22,270 bits 22,408 bits 22,664 bits
1280x1024 48,832 bits 48,968 bits 49,224 bits
6. Conclusions
In this article, an area-based algorithm suitable for real-timestereo matching using similarity measures and geometric fea-tures was presented. Geometric features such as edge sitan-taces allow high accuracy level in homogeneous areas. Then,in order to relate the similarity measures with the geometricalfeatures, the use of a fuzzy inference system is proposed. Fur-thermore, in order to maintain low mathematical complexitysuitable for FPGA implementations, a fuzzy inference mecha-nism based in point-slope equations is proposed. The main dif-ference and advantage for the proposed algorithm is the use ofsmall correlation windows in order to reach high accuracy level.Small correlation windows allow higher speed processing andlower computational resources requirement in comparison withthe large correlation windows used in most of the SAD-basedstereo matching algorithms reported in the literature.
In order to improve its processing speed, the proposed al-gorithm was implemented in a FPGA device. The developedFPGA architecture outperforms most of the real-time stereomatching algorithms in the literature, allowing high accuracylevel and enables both increasing the processing speed and de-creases the hardware resources consumption.
Finally, an important characteristic of the presented architec-ture is the scalability permissible; all the modules in the de-veloped FPGA architecture, allow to be adapted for processinglarger correlation windows than the simulated and implementedcorrelation windows. On the other hand, the FPGA architec-ture enables to configure different levels of maximum expecteddisparity (dmax), consequently, it is possible to configure themodule for the computation of disparity maps with appropriatevalues to the environmental characteristics of the input videostreams. This allows that the developed architecture can be ap-plied to a wide range of applications of real-time stereo visionsuch as positioning systems for mobile robots and recognition,detection and so on.
7. Referencias
[1] E. Parrilla, J.-R. Torregrosa, J. Riera, and J.-L. Hueso, “Fuzzy control forobstacle detection in stereo video sequences,” Mathematical and Com-puter Modelling, vol. 54, pp. 1813–1817, 01 2011.
[2] X. Rong, J. Huanyu, and Y. Yibin, “Recognition of clustered tomatoesbased on binocular stereo vision,” Computers and Electronics in Agricul-ture, vol. 106, pp. 75–90, 05 2014.
[3] R. Correal, G. Pajares, and J. Ruz, “Automatic expert system for 3d terrainreconstruction based on stereo vision and histagoram matching,” ExpertSystems with Applications, vol. 106, pp. 75–90, 09 2013.
[4] J. A. Delmerico, P. Davidb, and J. J. Corso, “Building facade detection,segmentation, and parameter estimation for mobile robot stereo vision,”Image and Vision Computing, vol. 31, pp. 841–852, 08 2013.
[5] F. Åuligoj, B. Åekoranja, M. Åvaco, and B. Jerbi, “Object tracking with amultiagent robot system and a stereo vision camera,” Procedia Engineer-ing, vol. 69, pp. 968–973, 2014.
[6] L. Yang and N. Noguchi, “Human detection for a robot tractor usingomni-directional stereo vision,” Computers and Electronics in Agricul-ture, vol. 89, pp. 112–125, 08 2012.
[7] D. B. A. C. Roberto Marzotto, Paul Zoratti and V. Murino, “A real-timeversatile roadway path extraction and tracking on an fpga platform,” Com-puter Vision and Image Understanding, vol. 114, p. 11641179, 03 2010.
[8] L. D. Stefano, M. Marchionni, and S. Mattoccia, “A fast area-based stereomatching algorithm,” Image and Vision Computing, vol. 22, pp. 983–1005, 03 2004.
[9] A. Aguilar-Gonzalez, M. Perez-Patricio, M. Arias-Estrada, J.-L. Camas-Anzueto, H.-R. Hernandez-de Leon, and A. Sanchez-Alegria, “An fpgacorrelation-edge distance approach for disparity map,” in Electronics,Communications and Computers (CONIELECOMP), 2015 InternationalConference on, pp. 21–28, Feb 2015.
[10] FeiyangCheng, HongZhang, DingYuan, and MinguiSun, “Stereo match-ing by usingthe global edge constraint,” Neurocomputing, vol. 131,pp. 217–226, 11 2013.
[11] H. Y. Jung, H. Park, I. K. Park, K. M. Lee, and S. U. Lee, “Stereo re-construction using high-order likelihoods,” Computer Vision and ImageUnderstanding, vol. 125, pp. 223–236, 04 2014.
[12] N. ISAKOVA, S. cuk BASAK, and A. SONMEZ, “Fpga design and im-plementation of a real-time stereo vision system,” Circuits and Systemsfor Video Technology, IEEE Transactions on, vol. 20, pp. 1–5, 07 2010.
[13] S. Jin, J. Cho, X. D. Pham, K. M. Lee, S.-K. Park, M. Kim, and J. W. Jeon,“Fpga design and implementation of a real-time stereo vision system,” In-novations in Intelligent Systems and Applications (INISTA), InternationalSymposium on, vol. 125, pp. 15–26, 01 2012.
13
[14] J. Woodfill and B. V. Herzen, “Real time stereo vision on the parts recon-figurable computer,” IEEE Symposium on Field-Programmable CustomComputing Machines, vol. 5, pp. 201–210, 04 1997.
[15] A. Darabiha, W. MacLean, and J. Rose, “Reconfigurable hardware imple-mentation of a phase-correlation stereo algorithm,” Journal of MachineVision and Applications, vol. 17, pp. 116–132, 03 2006.
[16] J. Diaz, E. Ros, F. Pelayo, E. Ortigosa, and S. Mota, “Fpga based real-time opticalflow system,” IEEE Transactions on Circuits and Systems forVideo Technology, vol. 16, pp. 274–279, 02 2006.
[17] H. Niitsuma and T. Maruyama, “High-speed computation of the opticalflow,” Lecture Notes in Computer Science: Image Analysis and Process-ing, vol. 3617, pp. 287–295, 09 2005.
[18] S. Lee, J. Yi, and J. Kim, “Real-time stereo vision on a reconfigurable sys-tem,” Lecture Notes in Computer Science: Embedded Computer Systems,vol. 3553, pp. 299–307, 07 2005.
[19] D. Masrani and W. MacLean, “A real-time large disparity range stereo-system using fpgas,” IEEE International Conference on Computer VisionSystems, pp. 13–19, 01 2006.
[20] S. S. Kumar and B. N. Chatterji, “Stereo matching algorithms based onfuzzy approach,” International Journal of Pattern Recognition and Articial Intelligence, vol. 16, pp. 7:883–899, 2002.
[21] H. Ghazouani, R. Zapata, and T. Moncef, “Fuzzy sets based improvementof a stereo matching algorithm with balanced correlation window and oc-clusion detection,” in 2010 International Conference on Image Process-ing, Computer Vision, & Pattern Recognition, IPCV 2010, pp. 12–15, Jul2010.
[22] C. Zitnick and T. Kanade, “A cooperative algorithm for stereo match-ing and occlusion detection,” Pattern Analysis and Machine Intelligence,IEEE Transactions on, vol. 22, pp. 675–684, Jul 2000.
[23] C. Georgoulas and I. Andreadis, “A real-time fuzzy hardware structurefor disparity map computation,” Journal of Real-Time Image Processing,vol. 6, no. 4, pp. 257–273, 2011.
[24] J. Olivares, J. Hormigo, J. Villalba, and I. Benavides, “Minimum sumof absolute differences implementation in a single fpga device,” LectureNotes in Computer Science, vol. 3203, pp. 986–990, 09 2004.
[25] D. K. Hoa, L. Dung, and N. T. Dzung, “Efficient determination of dis-parity map from stereo images with modified sum of absolute differences(sad) algorithm,” International Conference on Advanced Technologies forCommunications, pp. 657–660, 09 2013.
[26] S. Wong, S. Vassiliadis, and S. Cotofana, “Sad implementation in fpgahardware,” Technical Report Research Report, Delft University of Tech-nology, 05 2006.
[27] C. Colodro-Conde, F. J. Toledo-Moreo, R. Toledo-Moreo, J. J. Martnez-lvarez, J. G. Guerrero, and J. M. Ferrndez-Vicente, “Evaluation of stereocorrespondence algorithms and their implementation on fpga,” Journal ofSystems Architecture, vol. 60, pp. 22–31, 11 2013.
[28] L. Zadeth, “Fuzzy sets,” Information Control, vol. 8, pp. 338–353, 1965.[29] http://vision.middlebury.edu/stereo/
[30] D. Scharstein and R. Szeliski, “A taxonomy and evaluation of dense two-frame stereo correspondence algorithms,” vol. 47, pp. 7–42, apr 2002.
[31] C. Georgoulas, L. Kotoulas, G. C. Sirakoulis, I. Andreadis, and A. Gaster-atos, “Real-time disparity map computation module,” Microprocessorsand Microsystems, vol. 32, pp. 159–170, 10 2008.
[32] M. Gong and Y.-H. Yang, “Near real-time reliable stereo matching usingprogrammable graphics hardware,” Computer Vision and Pattern Recog-nition, IEEE Computer Society Conference on, vol. 1, pp. 924–931, 062005.
[33] C. Georgoulas and I. Andreadis, “Fpga based disparity map computa-tion with vergence control,” Microprocessors and Microsystems, vol. 34,pp. 259–273, 06 2010.
[34] M. W. W. K. Martin Humenberger, Christian Zinner and M. Vincze, “Afast stereo matching algorithm suitable for embedded real-time systems,”Computer Vision and Image Understanding, vol. 114, p. 11801202, 032010.
[35] P. C. Stefania Perri and G. Cocorullo, “Adaptive census transform: Anovel hardware-oriented stereovision algorithm,” Computer Vision andImage Understanding, vol. 117, pp. 29–41, 04 2013.
[36] C. Ttofis, S. Hadjitheophanous, A. S. Georghiades, and T. Theocharides,“Edge-directed hardware architecture for real-time disparity map compu-tation,” IEEE TRANSACTIONS ON COMPUTERS, vol. 62, pp. 690–704,04 2013.
[37] S. Jin, J. Cho, X. D. Pham, K. M. Lee, S.-K. Park, M. Kim, and J. W. Jeon,“Fpga design and implementation of a real-time stereo vision system,”IEEE TRANSACTIONS ON CIRCUITS AND SYSTEMS FOR VIDEOTECHNOLOGY, vol. 20, pp. 15–26, 2010.
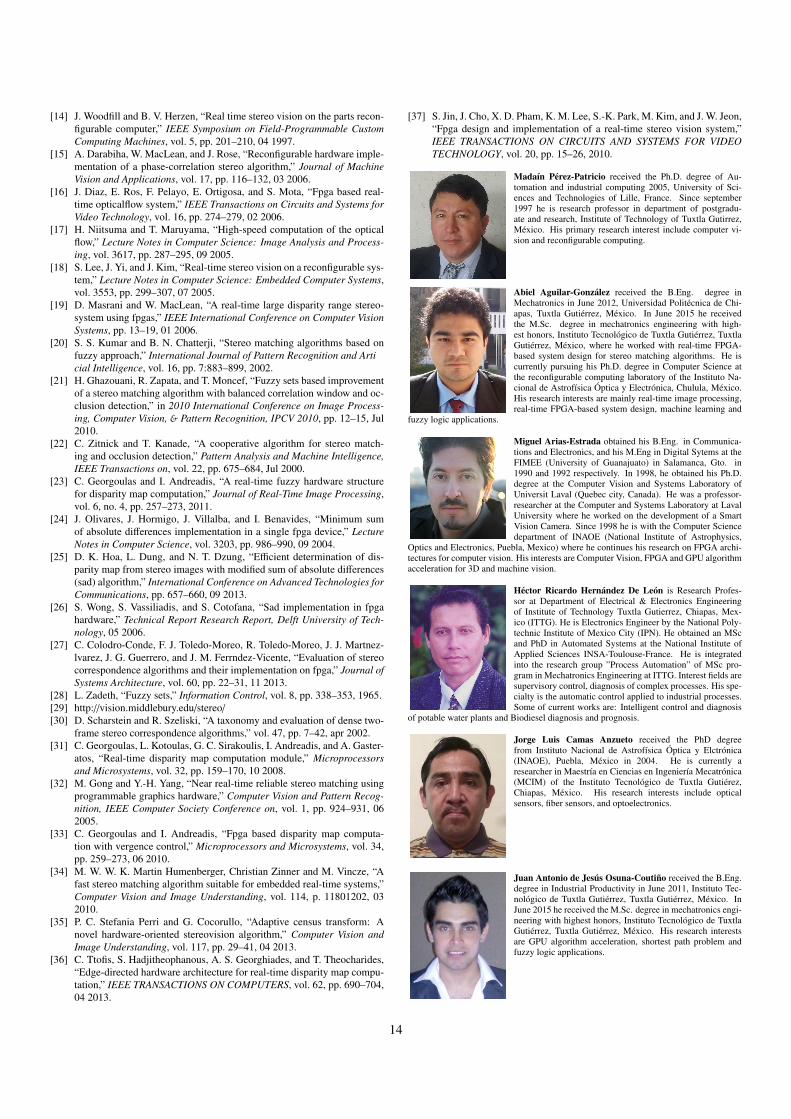
Madaın Perez-Patricio received the Ph.D. degree of Au-tomation and industrial computing 2005, University of Sci-ences and Technologies of Lille, France. Since september1997 he is research professor in department of postgradu-ate and research, Institute of Technology of Tuxtla Gutirrez,Mexico. His primary research interest include computer vi-sion and reconfigurable computing.
Abiel Aguilar-Gonzalez received the B.Eng. degree inMechatronics in June 2012, Universidad Politecnica de Chi-apas, Tuxtla Gutierrez, Mexico. In June 2015 he receivedthe M.Sc. degree in mechatronics engineering with high-est honors, Instituto Tecnologico de Tuxtla Gutierrez, TuxtlaGutierrez, Mexico, where he worked with real-time FPGA-based system design for stereo matching algorithms. He iscurrently pursuing his Ph.D. degree in Computer Science atthe reconfigurable computing laboratory of the Instituto Na-cional de Astrofısica Optica y Electronica, Chulula, Mexico.His research interests are mainly real-time image processing,real-time FPGA-based system design, machine learning and
fuzzy logic applications.
Miguel Arias-Estrada obtained his B.Eng. in Communica-tions and Electronics, and his M.Eng in Digital Sytems at theFIMEE (University of Guanajuato) in Salamanca, Gto. in1990 and 1992 respectively. In 1998, he obtained his Ph.D.degree at the Computer Vision and Systems Laboratory ofUniversit Laval (Quebec city, Canada). He was a professor-researcher at the Computer and Systems Laboratory at LavalUniversity where he worked on the development of a SmartVision Camera. Since 1998 he is with the Computer Sciencedepartment of INAOE (National Institute of Astrophysics,
Optics and Electronics, Puebla, Mexico) where he continues his research on FPGA archi-tectures for computer vision. His interests are Computer Vision, FPGA and GPU algorithmacceleration for 3D and machine vision.
Hector Ricardo Hernandez De Leon is Research Profes-sor at Department of Electrical & Electronics Engineeringof Institute of Technology Tuxtla Gutierrez, Chiapas, Mex-ico (ITTG). He is Electronics Engineer by the National Poly-technic Institute of Mexico City (IPN). He obtained an MScand PhD in Automated Systems at the National Institute ofApplied Sciences INSA-Toulouse-France. He is integratedinto the research group ”Process Automation” of MSc pro-gram in Mechatronics Engineering at ITTG. Interest fields aresupervisory control, diagnosis of complex processes. His spe-cialty is the automatic control applied to industrial processes.Some of current works are: Intelligent control and diagnosis
of potable water plants and Biodiesel diagnosis and prognosis.
Jorge Luis Camas Anzueto received the PhD degreefrom Instituto Nacional de Astrofısica Optica y Elctronica(INAOE), Puebla, Mexico in 2004. He is currently aresearcher in Maestrıa en Ciencias en Ingenierıa Mecatronica(MCIM) of the Instituto Tecnologico de Tuxtla Gutierez,Chiapas, Mexico. His research interests include opticalsensors, fiber sensors, and optoelectronics.
Juan Antonio de Jesus Osuna-Coutino received the B.Eng.degree in Industrial Productivity in June 2011, Instituto Tec-nologico de Tuxtla Gutierrez, Tuxtla Gutierrez, Mexico. InJune 2015 he received the M.Sc. degree in mechatronics engi-neering with highest honors, Instituto Tecnologico de TuxtlaGutierrez, Tuxtla Gutierrez, Mexico. His research interestsare GPU algorithm acceleration, shortest path problem andfuzzy logic applications.
14


![Real-Time Dense Stereo Matching with ELAS on FPGA Accelerated Embedded Devices · 2018-02-21 · arXiv:1802.07210v1 [cs.CV] 20 Feb 2018 1 Real-Time Dense Stereo Matching with ELAS](https://img.pdfslide.net/doc/110x75/5ea4d79358527f6f3377473e/real-time-dense-stereo-matching-with-elas-on-fpga-accelerated-embedded-devices-2018-02-21.jpg)