Embed Size (px)
Citation preview
1
AN IMPROVED INVENTORY OF METHANE EMISSIONS FROMCOAL MINING IN THE UNITED STATES
David A. KirchgessnerUnited States Environmental Protection Agency
Office of Research and DevelopmentResearch Triangle Park, North Carolina 27711 USA
Stephen D. Piccot and Sushma S. MasemoreSouthern Research Institute
Research Triangle Park, North Carolina 27709 USA
IMPLICATIONS
Estimates vary somewhat, but methane from coal mines comprise about 15 percent of total
domestic anthropogenic methane emissions. This study substantially increases the reliability of
these estimates by adding emission measurements from 30 separate coal mine sites. Sampling
efforts have focused on under-represented mining categories including surface mines, abandoned
mines, and handling facilities. Two new quality assured and verified measurement methods have
been developed for surface mines and coal handling facilities. The single path and plane-
integrated open-path Fourier transform infrared spectroscopy techniques developed for surface
mines have since been adopted for a number of other applications including landfills and animal
containment facilities.
ABSTRACT
Past efforts to estimate methane emissions from underground mines, surface mines, and other
coal mine operations have been hampered, to different degrees, by a lack of direct emissions
data. Direct measurements have been completely unavailable for several important coal mining
operations. A primary goal of this study was to collect new methane emissions measurements
and other data for the most poorly characterized mining operations, and use these data to develop
2
an improved methane emission inventory for the U.S. coal mining industry. This required the
development and verification of measurement methods for surface mines, coal handling
operations, and abandoned underground mines, and the use of these methods at about 30 mining
sites across the U.S. Although the study’s focus was on surface mines, abandoned underground
mines, and coal handling operations, evaluations were also conducted to improve our
understanding of underground mine emission trends, and to develop improved national data sets
of coal properties. Total U.S. methane emissions are estimated to be 4.669 million tons and, as
expected, emissions from underground mine ventilation and methane drainage systems dominate
(74 percent of the total emissions). On the other hand, emissions from coal handling, abandoned
underground mines, and surface mines are significant, and collectively they represent about 26
percent of the total emissions.
INTRODUCTION AND BACKGROUND
Trends in Past Methane Emissions Estimates for Coal Mining
Over the last 30 years there have been numerous attempts to estimate the global emissions of
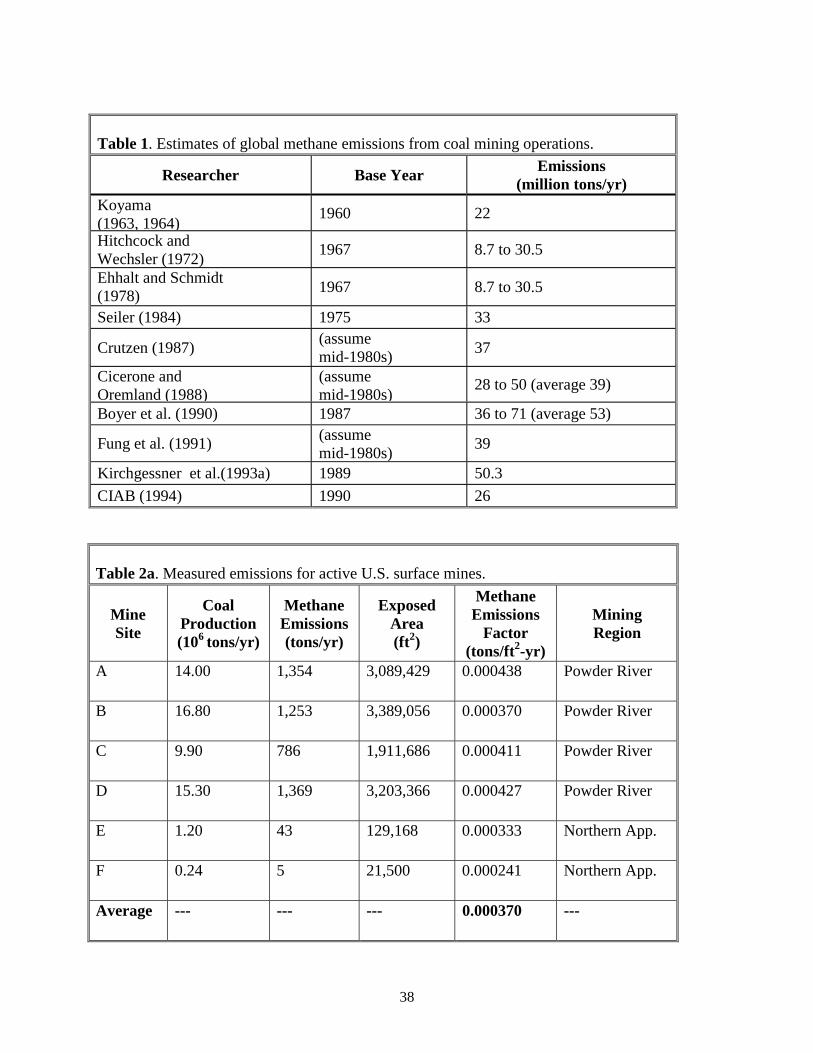
methane from coal mining operations. Table 1 presents a summary of global methane emissions
estimates developed by various researchers. Estimates range from 8.7 to 71 million tons per year.
Most estimates presented in Table 1 can be traced back to assumptions made by some of
the earliest researchers. Estimates developed by Hitchcock and Wechsler1, Ehhalt2, Ehhalt and
Schmidt3, Seiler4, Crutzen5, and Cicerone and Oremland6 were based in large part on simple
3
methane emissions ratios developed by Bates and Witherspoon7 and Koyama8, 9. More recent
estimates by Boyer et al.10 and Kirchgessner et al.11 were developed by correlating mine
emissions measurements data with various coal properties and mine production rates. The
estimate of Fung et al.12 was developed using a combination of global methane mass balances
and atmospheric modeling techniques to infer a budget for all methane sources that best
reproduces the spatial and seasonal variations of methane concentrations observed in the
atmosphere. The estimate produced by the Coal Industry Advisory Board (CIAB)13 yields a
relatively low estimate of 26 million tons because of the low emissions factors used.
Methodological and other differences among the estimates in Table 1 make direct
comparisons difficult. One problem is that the estimates represent different base years with
different coal production rates and, presumably, different methane emissions. Some estimates did
not include that all the coal produced globally account for hard coal only, excluding brown coals
and lignite which contain low quantities of methane4, 5, 6, 8, 9. Only the estimates of Boyer et al.10,
CIAB13, and Kirchgessner et al.11 include estimates of post-mining operations, and none address
the emissions characteristics of abandoned mines. Perhaps the most important difference to
understand is that different emissions factors have been employed by the various researchers and,
while it is not always explicit from the published papers, factors used range from 160 to 670 ft3
of methane per ton of coal mined. The lowest emissions factors appear to have been based on the
assumption that the amount of methane liberated during mining is limited to the methane
originally contained in the mined coal. This is a negatively biased assumption for most
underground coal mines, since it is now known that actual emissions are usually several times
higher than the emissions associated with the mined coal alone14.
4
While different approaches have been used to estimate emissions from coal mines in the
past, they all share a common weakness; surprisingly few direct measurements have been used,
and for some mining sources, direct measurements have been completely unavailable. Using new
emissions measurements and other data, this paper presents improved estimates of methane
emissions from U.S. coal mines.
Methane is formed in coal during the process of coalification, and the quality and
quantity of the gas created and retained is a function of the original organic matter composition
and the conditions of burial. Generally, more methane is formed during coalification than can be
stored within the coalbed itself, so excess methane migrates into, and can be stored in, the
surrounding strata. Methane is retained by the coalbed and surrounding strata as long as it
remains under pressure and, assuming that no geologic processes breach the reservoir first,
mining releases this pressure and the methane escapes.
Methane emitted from underground, surface, and abandoned coal mines is often released
from both the coal seams and surrounding strata. In longwall mines the zone of disturbance can
be large, depending on a variety of factors including size of the long wall, depth of mining, and
thickness of coal extracted. Creedy 15 has estimated that zone may extend up to 160 meters into
the roof rock and 40 meters below the seam being worked. Since additional coal and methane
often exist within this zone, emissions from longwall mines are much greater than would be
expected from the mined coal alone. Emissions escape from underground mines by various
5
pathways including ventilation shafts, methane drainage systems, and post-mining coal crushing
and handling operations10, 16.
In areas where miners are working, methane levels must be kept below 0.5 percent. This
is accomplished, in part, by sweeping the mine with large quantities of ventilation air. Although
containing less than one percent methane, ventilation air contributes the largest amount to total
emissions because the volume is so great.
Gas drainage systems are often employed at underground mines to relieve some of the
burden on ventilation systems. Vertical wells can be drilled into the coal in advance of mining to
drain methane from the coal and overlying strata. When a longwall miner passes under these
wells and subsidence fractures the overlying strata, these wells can be converted into gob wells
which drain the fractured area and prevent the release of gob gas into the mine workings.
Horizontal boreholes and cross-measure boreholes can be drilled from within the mine into the
coal and overlying strata, respectively. The methane is then conveyed to the surface through
piping within the mine. In Europe, methane recovered by gas drainage systems is more
commonly used as an energy source than in the U.S., where much of the gas is vented into the
atmosphere. There is little published data on methane emissions from gas drainage systems,
however, data obtained from industry representatives indicate that drainage may account for a
large fraction of the total emissions associated with underground mines10, 17.
Very few emissions measurements have been taken at surface mines. The limited data
which do exist suggest that the primary sources of emissions include seam areas fractured by
6
coal blasting, the lower most portions of surface mine pits (the pit floor), and inactive pits18, 19. In
general, the strata overlying the coal at surface mines do not appear to be a significant source of
emissions but, as in underground mines, emissions may be contributed from underlying seams,
faults, or gas bearing reservoirs. Historically, methane emissions from surface mines have been
thought to be much lower than from underground mines because of the lower gas contents
associated with these relatively young and shallow coals. However, until this program was
started there were no direct measurements available to demonstrate this.
After coal leaves a mine it typically undergoes a series of operations, collectively referred
to as coal handling. This may include crushing, separation of impurities, size classification,
drying, transportation, and storage. Different types of coals desorb methane at different rates, but
since coal is usually removed from a mine within hours or days of being mined, some methane
remains and is liberated from the coal during handling operations. To approximate these
emissions, the assumption is generally made that a fraction of the original methane remains in
the coal after mining, and that this is emitted completely to the atmosphere during post-mining
operations. Creedy estimated that 40 percent of the methane contained in the mined coal is
released after it leaves the mine20. The actual amount of gas that escapes into the atmosphere will
be a function of the rate of methane desorption, the coal’s original gas content, and the amount of
time elapsed before coal combustion occurs.
Emissions from abandoned underground mines come from unsealed slopes and mine
shafts, or from vents installed to prevent the buildup of methane in the mine after closure.
Emission mechanisms at abandoned mines are highly uncertain. However, emissions are likely a
7
function of diurnal and seasonal cycles related to changes in temperature and barometric
pressure, longer-term changes brought on by processes such as mine flooding and the slow
depletion of available methane, reservoir pressure, and the emissions produced by the mine when
it was active.
Since methane in underground mines constitutes a safety hazard, methane emissions in
U.S. mines are monitored quarterly by the Mine Safety and Health Administration (MSHA). As
a consequence, active underground mine emissions are reasonably well known. In contrast,
abandoned underground mines are not monitored, so their emission characteristics are poorly
defined, and their exact numbers and locations can not be determined from available data.
Methane emissions from surface mines and coal handling operations do not accumulate in
significant quantities, and because there is little or no safety hazard, emission rates for neither
have been measured in the past.
A primary goal of the study described in this paper was to collect new methane emissions
measurements and other data for those poorly characterized mining operations described above,
and to use these data to develop an improved emission inventory for the U.S. coal mining
industry. This required the development and verification of measurement methods for surface
mines, coal handling operations, and abandoned underground mines, and the use of these
methods at about 30 representative mining sites across the U.S. In addition, research was
conducted to improve underground mine emissions estimates, particularly for those mines that
do not produce coal, but continue to liberate methane (temporarily inactive mines).
8
EMISSIONS MEASUREMENTS, EMISSION FACTORS, AND EMISSIONS
ESTIMATES
Underground Mines
Emissions from underground mine ventilation shafts in the U.S. can be quantified using mine-
specific emission measurements and other data collected by MSHA. Quarterly methane emission
measurements collected by MSHA inspectors, quarterly coal production rates reported by mines
to MSHA, and mine operational status codes reported by MSHA. Operational status codes and
quarterly coal production rates were obtained from MSHA’s Part 50 database21, while quarterly
emissions measurements were provided by MSHA district offices. These data were used to
develop a mine-specific inventory of mineshaft emissions. Emissions from methane drainage
systems at underground mines are dealt with separately.
As a starting point in developing mine-specific emissions estimates, a comprehensive list
of mine sites was developed. Starting with all the underground mines listed in the Part 50
database, 622 sites permanently abandoned throughout 1995 and 70 sites with missing
operational status codes were removed. This resulted in a final list of 1,659 underground mines
with various operational status codes: producing, active but not producing, temporarily inactive,
under construction, and closed. MSHA district offices provided emissions measurements from
all four quarters of 1995 for 732 of these mines and no emissions estimation was required. These
data accounted for 83 percent of the final emissions estimate for underground mine shafts. For
the remaining 927 mines, MSHA measurements were unavailable for one or more quarters in
9
1995 and emission factors as a function of coal production had to be developed. Sufficient
quarterly emissions measurements were available to develop mine-specific relationships of
methane emissions to production for 276 of these mines. These measurements were not always
associated with the 1995 time frame however, so data for 1994 and 1996 were used when
necessary. For about 25 percent of the 276 mines, emissions ratios were developed relating
quarterly methane liberated per unit of production. In most cases however, quarterly data were
plentiful enough to develop mine-specific linear regressions of emissions versus production for
which at least three data points were required. Regression equations were not used if the
predicted emissions relationship was asymptotic, the equation did not follow the trend observed
in the data by visual inspection, or the data were insufficient to develop a discernable trend.
Emissions from these 276 mines account for 12 percent of the estimated emissions from
underground mine shafts.
The remaining 651 mines either had little data available for estimating emissions, or did
not produce coal for one or more quarters of 1995 but could still liberate significant quantities of
methane while inactive. Inactive mines may continue to operate their ventilation systems to
prevent methane buildup. Because measurements may not always be collected by MSHA during
these periods, this inventory would underestimate emissions if inactive mine emissions were
neglected.
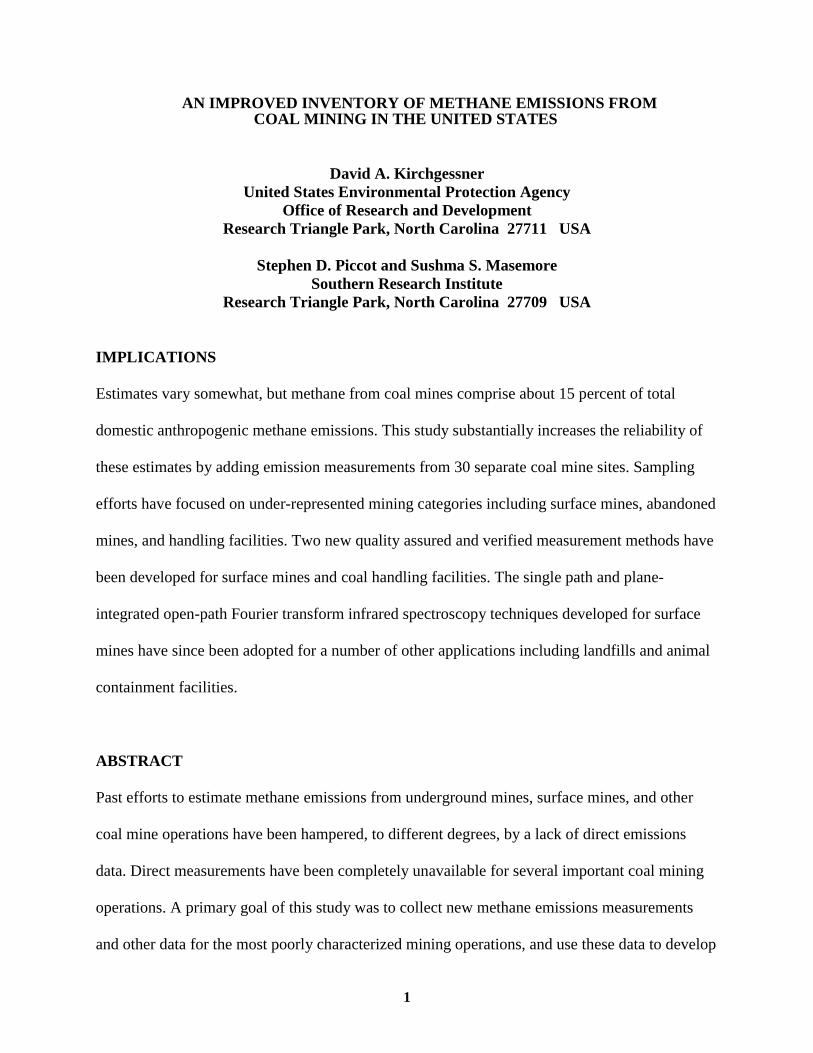
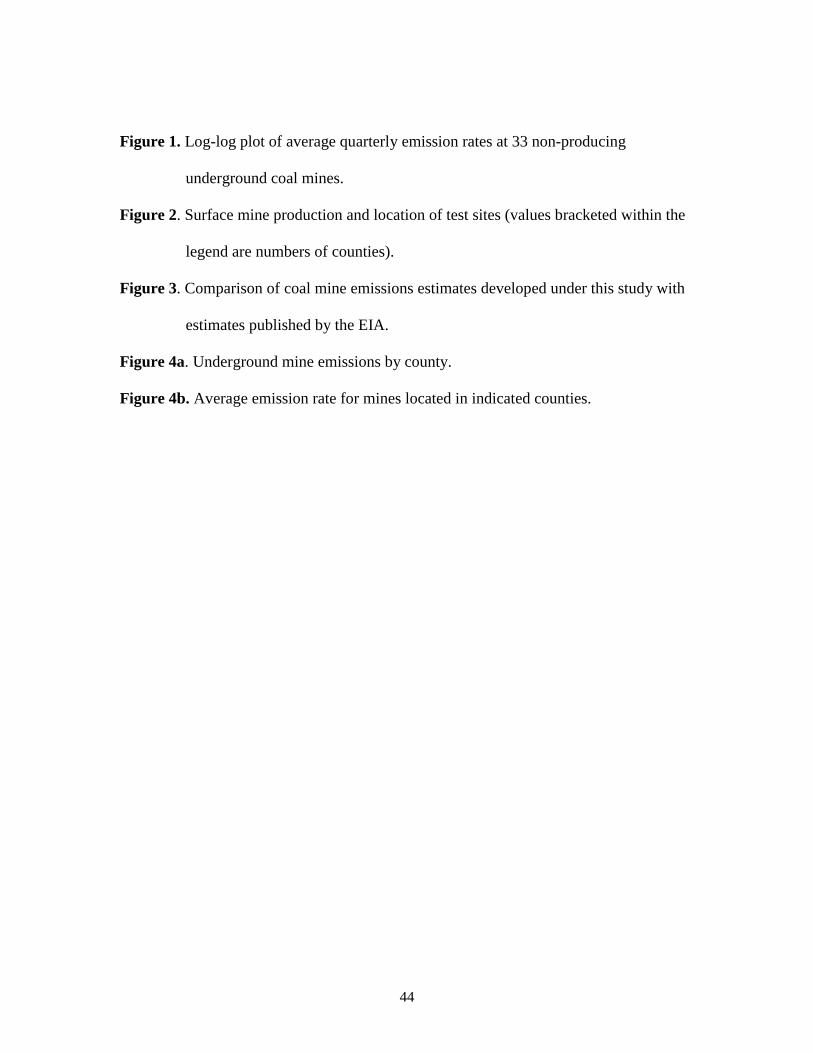
Figure 1 shows how emissions and production are related at 33 inactive mines (termed E-
status mines) that have the most complete and highest quality data available. The linear
relationship between the average of the measured emissions when production occurs, and the
10
average of the measured emissions when no production occurs, is shown in the figure. This
equation is used to estimate emissions for E-status mines with missing MSHA measurements
when insufficient data are available to develop a reliable mine specific-regression equation. The
equation estimates inactive emissions based on a mine’s active emissions rate. As Figure 1
shows, E-mines with average active emissions rates that range from about 3,000 cfd to 10,000
cfd can have inactive emissions that either approach zero, or have a value that is consistent with
the linear relationship shown. For mines with active emissions rates that are less than 5,000 cfd,
an emissions rate of zero is assigned for the inactive periods. If the active emissions are above
5,000 cfd, the relationship in Figure 1 is applied for inactive periods. Although direct
measurements were available in several cases, there were 169 of the 651 mines for which
inactive emissions were estimated for one or more quarters using the approach outlined above.
The emissions associated with this estimation procedure account for about 4 percent of total shaft
emissions.
The methods outlined so far account for about 99 percent of the estimated emissions from
underground mine shafts. The remaining emissions were estimated using county-average
emissions factors where available (ft3/ton of coal), or a generic data set average emissions factor
when no other options exist. A number of mines in the Part 50 data base were identified as under
development, and these mines were assigned an emissions rate of zero. This was done because
the status codes assigned indicate that, while shaft and slope development were underway, the
coal seam had not been encountered.
11
Once production-based emissions factors or regression equations had been developed,
mine-specific emissions were calculated. For those 927 mines lacking MSHA emissions data for
one or more quarters of 1995 but which were active for portions of the year, emissions factors or
regression equations were multiplied by the mine-specific quarterly coal production values
reported in the Part 50 data base to obtain emissions for the active portions of the year. For those
mines with periods of inactivity or which were wholly inactive, values from the relationship
shown in Figure 1 and described in the accompanying text were multiplied by the number of
inactive days to calculate emissions for the inactive portions of the year. Finally, these estimates
were summed with the measured emissions from the 732 mines having complete data sets to
obtain the total methane emissions from underground mine shafts.
Emissions from methane drainage systems like gob wells, in-mine horizontal boreholes,
and vertical wells are significant on a national scale. There are limited data available for
quantifying methane recovery by mine drainage installations, so it was necessary to rely on
published estimates of gas liberation associated with individual mines17, 22. Of the mines reported
to have used drainage systems in the past, 26 were found to be operational through 1995, and 3
were shutting down and assumed to operate for only a portion of 1995. Emissions from operating
drainage systems were estimated using mine specific emissions factors published by the U.S.
EPA22. These factors include both information provided by mine sites and estimated values, and
each account for the methane recovered for use or sale at sites in the Warrior, Appalachian, and
Western coal basins. As a percentage of total mine emissions, typical emissions factors used
were 40 percent for gob wells and in-mine boreholes, and 40 to 53 percent for combinations of
various technologies and gas sales scenarios. Three mines with drainage systems were closing
12
down during 1995, and it was assumed that drainage system emissions at these sites continued to
liberate emissions for six months after final coal production ceased. Gob wells can continue to
liberate emissions from mined-out gob areas for six months to a year or more after mining has
ceased.
Surface Mines
When this study was initiated, there were no emissions measurements available for surface coal
mines. Since surface mine production represents a large fraction of the coal produced in the U.S.
and abroad, new emissions measurements were collected at 6 surface mines to address this
uncertainty. A practical and effective method for measuring methane emissions at these large and
complex sites was unavailable, so two new methods were developed and validated using open-
path Fourier transform infrared (FTIR) spectroscopy, meteorological measurements, and tracer
gases released at known rates. Development of the two methodologies and their field validation
are described in detail elsewhere18, 23, 24. Briefly, the single-path method uses one FTIR path to
measure methane concentrations in the plumes downwind from exposed coal surfaces, while a
tracer gas, sulfur hexafluoride, is released simultaneously to determine plume dispersion
properties. Using on-site meteorological data and the measured methane and sulfur hexafluoride
concentrations, emissions rates from the coal surfaces are then estimated using a plume
dispersion model. The plane-integrated method analyzes a series of FTIR paths at several
elevations above the ground. The advantage of the latter technique is that more of the plume is
actually measured and less reliance is placed on the plume model. Both techniques were
validated at a field site measuring known emissions rates of methane and sulfur hexafluoride
13
from constructed area and volume sources. The techniques consistently measured emissions rates
to within 30 percent of the known value and often to within 15 to 20 percent. In this study the
plane-integrated method was used for inactive surface mine pits, while the single-path method
was used at active mines.
Under this program, over 30 site surveys were conducted at surface mines across the
U.S., and most included the collection of spot methane concentration measurements using a hand
held flame ionization detector. Based on these visits, and coal properties in the Refined Gas
Content (RGC) database25, it was concluded that auger/hilltop mining areas in various
Appalachian mining locations and lignite production areas in Oklahoma, Texas, and the Dakotas
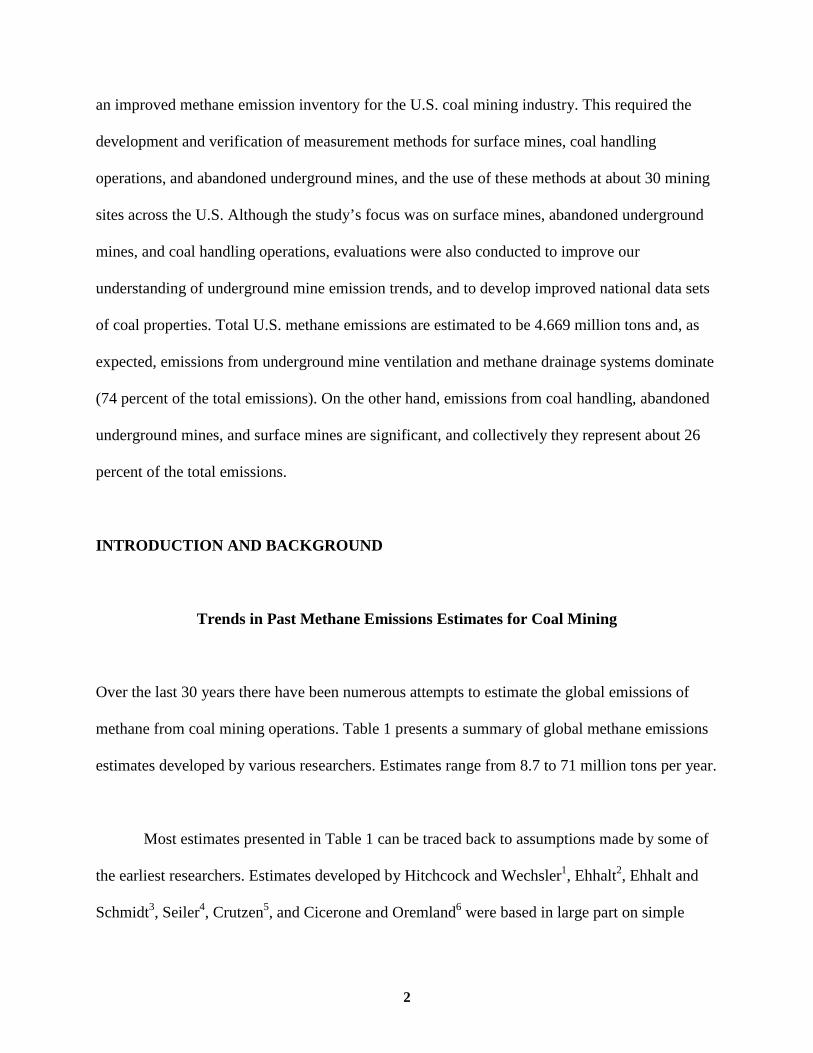
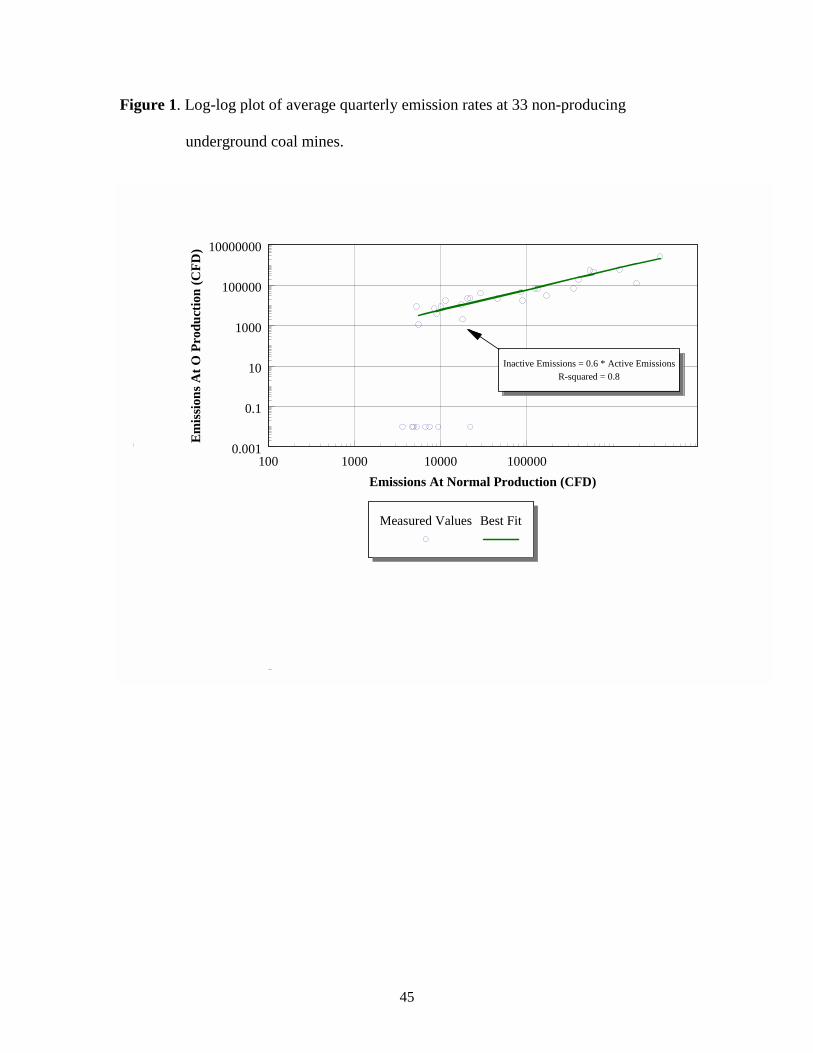
liberate little or no methane. They were eliminated from further consideration. Figure 2 shows
where surface coal mining occurred in 1995, and where surface mine testing was conducted. The
Powder River region of Wyoming and Montana is the largest surface mining region in the U.S.
(Campbell County, Wyoming is shown in black). This area accounts for about 55 percent of the
non-lignite surface mined coal produced in the US, and all mines surveyed in this area were
found to liberate methane. Four of the six sites tested were located within the Powder River
region, and together, these sites accounted for 23 percent of the total coal produced in the region.
Two of the sites tested contained large inactive pits that were also tested, and both were found to
liberate significant quantities of emissions. The fifth and sixth sites tested were located in the
Northern Appalachian region, an area which accounted for about 7 percent of the non-lignite
surface mine coal produced in 1995.
14
Table 2a presents the results of measurements for active areas at the six mines tested,
while Table 2b presents results for the two inactive sites tested. Total emissions for the active
Powder River sites were found to be similar, while the Northern Appalachian region mines tested
produced fewer emissions, primarily because of their small size and lower emissions rate. Active
site emissions are a strong function of the area of exposed coal surfaces. Emissions per unit of
exposed area were generally lower for Appalachian mines, presumably because of the lower
porosity and seam thickness associated with these older coals. While Northern Appalachian
mines may produce slightly lower emissions per unit area than Powder River mines, the data
base was insufficient to statistically identify them as two separate populations and they were
treated as one in this study. Area-based emission factors are used to estimate emissions in the
inventory as described later.
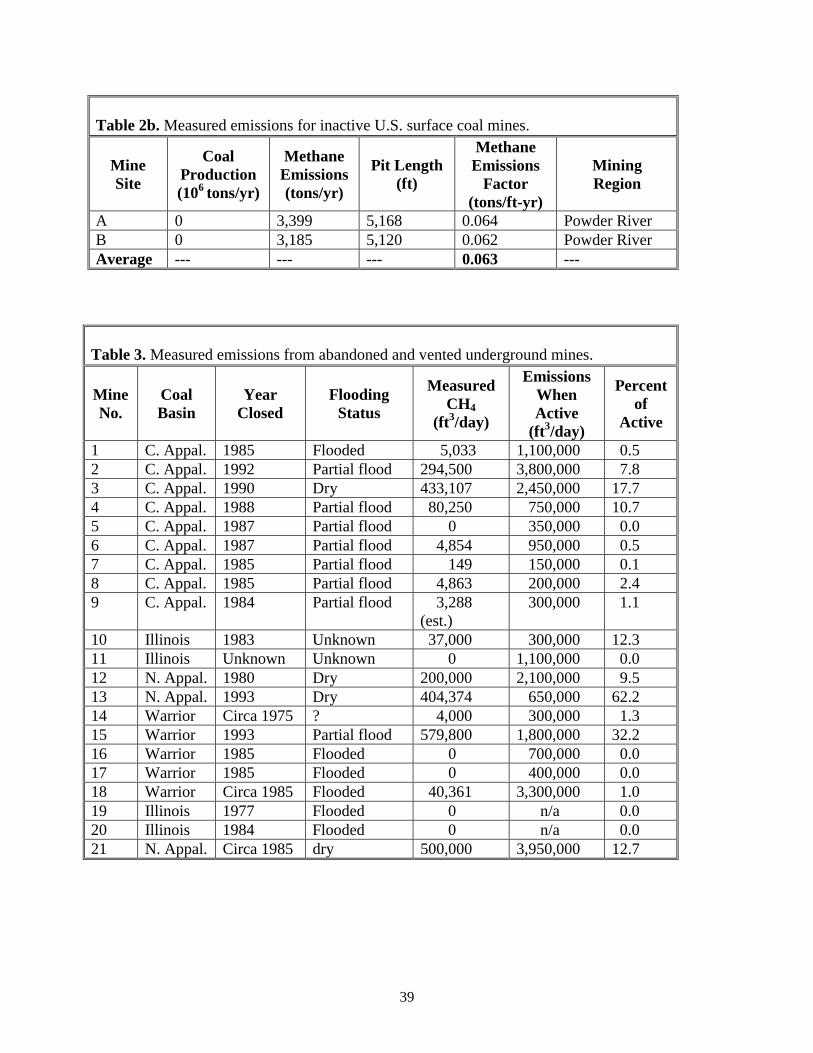
Table 2b shows that emission factors for inactive pits were calculated on a length basis
instead of an area basis as in the active pits. This was necessitated by the fact that the inactive
areas had virtually no coal remaining. Further, emissions were found to be related to the linear
extent of the exposed seams at the two inactive mines tested so the linear exposure of the coal
seam around the sides of the pit was used as a basis. For inactive mines included in the
inventory, these length-based emissions factors were used. While this makes it difficult to
compare active and inactive site emission factors, it was consistently observed that emissions
from inactive areas of sizes similar to the active areas were higher by at least a factor of two.
This observation was not expected and the data developed for this study were not designed to
explain it. However, the authors have observed that in active mines, a layer of coal 6 to 10 feet
thick is left behind in the pit floor to avoid mixing dirt with the coal being sold. When this layer
15
is penetrated, substantial gas evolution rates have been measured at several sites, and the source
of this gas is the strata underlying the seam being mined. At inactive sites, this layer may have
lost it’s integrity over time (most inactive pits are several years old), providing channels for the
continuous flow of gas from the underlying strata. This flow of underlying gas generally does not
occur at active sites, because the coal layer maintains it’s integrity, and the pit floor is quickly
backfilled.
MSHA’s Part 50 data shows that 628 million tons of coal were produced at surface mines
in 1995, so after subtracting lignite and auger production reported by DOE, it was estimated that
536 million tons of “methane-producing” surface mined coal was produced in 1995. As a starting
point in the inventory development process, a detailed mine-specific inventory was prepared for
33 individual Powder River mining operations using the area- and length-based emissions factors
developed from the Powder River mines tested (Tables 2a and 2b). Not all Powder River mines
were included in this analysis, but the combined production from the active mines examined
accounts for about 40 percent of the “methane-producing” coal extracted by U.S. surface mines
in 1995.
To support the use of the area- and length-based emissions factors at specific sites,
surface mine dimensions were obtained for 16 active and 17 inactive sites using U.S. Geological
Survey aerial photographs of Wyoming and Montana. Because the photos were taken in 1994,
adjustments were made to more accurately represent 1995 active mine dimensions. The 1994
areas measured were divided by 1994 mine production, and this ratio was multiplied by the 1995
production to yield an estimate of the 1995 dimensions. These calculated areas were checked by
16
comparing the calculated 1995 area to the areas measured at four Wyoming mines tested in 1995.
All areas agreed within a few percent.
Once the dimensions of all active and inactive sites were determined, emissions were
calculated by multiplying an emissions factor by the appropriate mine dimensions. For those
mines tested, emissions factors from the actual tests were used. For the other sites, the average
emissions factors presented in Tables 2a and 2b were used.
After examining the results of the Powder River analysis, it was concluded that emissions
from surface mines are significantly lower than expected and as such, further efforts to develop
mine-specific inventories were unjustified. Emissions associated with the remaining 60 percent
of the “methane-producing” surface mined coal were estimated by extrapolating the Powder
River results. Specifically, total emissions from the 16 active and 17 inactive mines were
summed and then divided by the coal production from the 16 mines. This factor was multiplied
by the remaining “methane-producing” coal production to yield an estimate of emissions from
the remaining mining regions. One key assumption inherent in this extrapolation is that mines
outside Powder River have emissions factors similar to Powder River mines. Limited funding
prohibited testing in every surface mining region, but this assumption is supported by two tests
conducted in the Northern Appalachian region, and over 30 mine surveys conducted in: Northern
and Central Appalachia, Illinois/Indiana, Green River, Wind River, Arkoma, Warrior, Raton, and
the Dakotas. A second assumption inherent in this extrapolation is that the emissions
characteristics of inactive sites, and the relative number of inactive sites, are similar between the
Powder River region and other mining areas.
17
Abandoned Underground Mines
Records compiled and maintained by MSHA indicate that thousands of underground mines have
been abandoned since 1981, and that numerous abandoned mines exist in virtually every major
mining region of the U.S. In the early 1990’s a methane emissions measurement campaign was
initiated under this program, and data for 21 abandoned mine sites have since been compiled.
Measurements were conducted at mines which had been closed and sealed, and which
used vent pipes to exhaust methane that continued to build-up within the closed workings.
Although not described in detail here, the measurement approach was simple; spot methane
concentrations were measured with a portable non-dispersive infrared analyzer, and vent pipe
flow rates were measured using a hand-held anemometer26. Continuous measurements were
conducted at one site for a period of several months.
Although it was not possible to conduct measurements in all of the major underground
mining regions of the U.S., the sites tested are in areas known to contain the majority of the
abandoned sites. Twelve of the sites tested are located in the Central and Northern Appalachian
basins, both areas that have experienced a disproportionate share of mine closures over the past
15 years. Four sites in the Illinois basin and five sites in the Warrior basin are also included.
The relatively small number of mines tested is an impediment to the development of
robust emissions relationships. However, it was observed that if a mine floods after closure,
emissions are negligible, while if no flooding occurs, emissions are likely to occur. Also, mines
18
with relatively low active emissions rates (e.g., less than about 100,000 cfd) are likely to have
less gas pressure buildup in the mine after closure. Thus, post closure emissions are likely to be
negligible. It was also found that when abandoned mines liberate emissions, they are likely to be
roughly proportional to the active mine emissions, and to be a function of time since
abandonment. On a daily basis these emissions can vary with changes in atmospheric pressure.
Table 3 presents data collected for the 21 abandoned underground coal mines described
above. About 50 percent of the sites tested were found to liberate some methane emissions (i.e.,
emissions greater than 0.5 percent of the mines active emissions), and when emissions did occur,
they were generally between 2 and 30 percent of the active mine emissions. For the abandoned
mines that liberated emissions, the average percent of active emissions was 17 percent. This
factor is applied to estimate emissions from abandoned mines in the inventory judged to have a
potential to liberate emissions (see later discussion). Although this emissions relationship uses all
of the data currently available, the data is not abundant and the uncertainty that accompanies the
estimate is recognized.
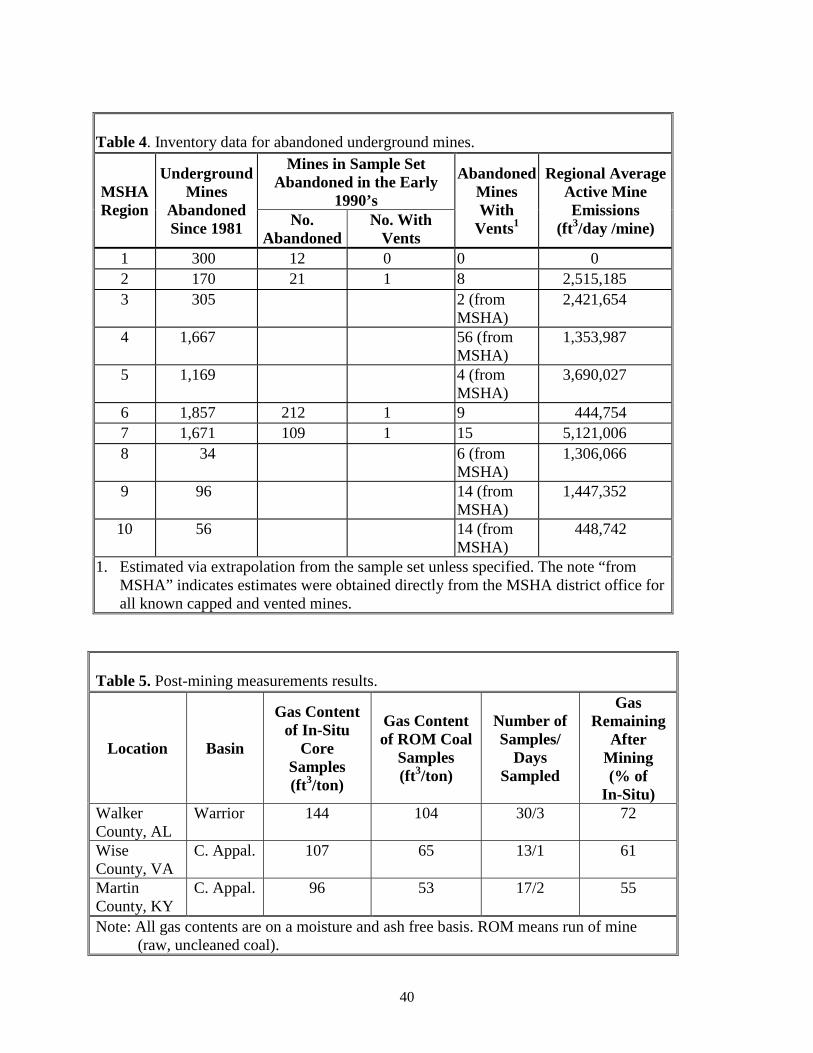
A six-step process was used to estimate emissions from abandoned mines. The data used
to support the method are presented in Table 4.
1. The number of underground mines abandoned since 1981 was identified for each
MSHA region based on MSHA’s Part 50 data base (Table 4, column 1). Reliable
data for pre-1981 closures are unavailable, so emissions from this group were
neglected. Because of the significant risk posed by closed and vented
19
underground mines, mines abandoned prior to 1981 are probably backfilled and
permanently sealed by now, and their emissions are likely insignificant.
2. For 6 of the 10 MSHA district offices, inspectors in those offices were asked to
identify the number of abandoned mines containing emissions vent pipes. These
values, shown in column 5 of Table 4 (“from MSHA”), are based on the best
recollections of inspectors because records on closures are incomplete. For the
remaining 4 districts that were unable to provide these data, an alternative
approach was used to estimate the number of capped and vented mines (Step 3).
3. Abandoned mines that were closed with shaft vents in place were approximated
for 4 MSHA districts by extrapolating from a subset of all abandoned mines (i.e.,
mines closed in the early to middle 1990’s). MSHA inspectors determined the
closure status of this subset to provide an estimate of the number of mines vented
in the early to mid 1990’s. The ratio of vented mines to total abandoned mines in
the subset was multiplied by the number of mines abandoned since 1981 to
estimate the number of mines closed with vents in the district since 1981. The
subset results are shown in columns 3 and 4 in Table 4.
4. Not all vented mines identified in column 5 of Table 4 will liberate emissions. For
those vented mines from Steps 2 and 3 which have a potential to produce
emissions, emissions are approximated based on the 21 abandoned mine sites
tested. It was assumed that 50 percent of the capped and vented mines in column
5 liberate emissions as outlined in an earlier section.
5. Abandoned mine emissions are estimated as a function of active mine emissions.
An average active mine emissions rate was approximated for each MSHA region
20
using the underground mine inventory (Table 4, column 6). If an abandoned mine
has a vent pipe that produces significant emissions, the mine is likely to have had
a high emissions rate when active. Thus, when determining the average active
mine emissions rate shown in column 6, only those underground mines with
emissions rates equal to or greater than 100,000 cfd were included. The average
active mine emissions rate was multiplied by 0.17 to approximate the post closing
emissions rate as described earlier in Section 2.1.
6. The number of vented mines producing emissions in each MSHA region from
Step 3 was multiplied by the emissions per closed mine for that region from Step
4, to estimate the total emissions from all abandoned mines in that region.
Coal Handling Operations
Direct emissions measurements from coal handling systems are unavailable and impractical to
collect. When this program was initiated, most coal handling inventories were based on estimates
of the amount of methane remaining in coal after mining. Expressed as a percent of the original
in-situ gas content, post-mining gas contents of 40 percent for British coals, and 25 to 60 percent
for other areas were reported27-30. Assuming all of this methane is liberated before combustion
occurs, handling emissions in those studies were estimated by multiplying assumed post-mining
coal gas contents based on these estimates, by annual coal production values.
Mining regions where large volumes of high gas content coals are produced contribute
most to coal handling emissions estimates, and in an effort to improve the emissions inventory,
21
coal handling operations at underground mines in the Black Warrior and Central Appalachian
basins were targeted for the collection of new measurements. Standard methods were used to
develop methane desorption rate curves for broken coal samples collected at the mine mouth,
and to identify the fraction of methane remaining relative to the coal’s original in-situ gas
content. Measurements were conducted at two underground mines in the Central Appalachian
basin (Virginia and eastern Kentucky) and one mine in the Warrior basin (Alabama).
The tests consisted of obtaining a representative set of mined coal samples from conveyor
belts at the mine mouth (prior to on-site preparation facilities). The ASTM method D-2234 for
manual sample collection was used to ensure that representative samples of broken coal and coal
particles were collected from the conveyor belts. Between 13 and 30 samples were collected at
each site, and the collection occurred at regular intervals over periods of from 1 to 3 days.
Samples were inserted into coal desorption canisters that were assembled and operated based on
guidelines provided by the U.S. Bureau of Mines for the Direct and Modified Direct methods31.
Once the samples were sealed, routine monitoring of pressure increases was conducted, enabling
the development of relationships between the desorbed gas volume and elapsed time. A gas
chromatograph was used to identify and quantify hydrocarbons (including methane) desorbing
from the coal, and to quantify the effects of oxygen sorption. Samples were routinely monitored
and bled for several months until no measurable pressure increases occurred, after which the
sample was crushed, the volume of gas that evolved during crushing determined, and the total
gas volume calculated.
22
Table 5 summarizes the measurement results for the three sites tested. The mines
provided the in-situ gas content values reported for coal located at each mine site, but these
values are not necessarily for coal collocated with the coal being mined during the coal handling
tests; the nearest samples available were used. The post-mining gas contents measured were
between 55 and 72 percent of the in-situ gas content of the coal before mining. These values are
used to estimate emissions in the inventory as described later. Previously reported values are
lower than these results, suggesting that post-mining emissions are higher than previously
thought.
The gas remaining in coal after mining for all Warrior basin mines is represented in the
inventory by the value determined from the Alabama test. For the Central Appalachian basin, the
average of the two tests conducted in this region was used. To estimate the gas remaining for
other coal mining regions, the measurement test results were used with Airey’s model and a
national data set of coal properties to approximate regional values of the gas remaining after
mining. Airey’s model closely matches desorption curves, and was developed based on a
theoretical treatment of gas emissions from broken coal32. In order to apply Airey’s model to
calculate the fraction of gas remaining, two parameters were needed: sorption time and
“synthetic” exposure time. The RGC database was used to estimate an average sorption time for
each basin25. This database contains over 1,000 gas content measurements collected by the U.S.
Bureau of Mines (BOM) in the 1970’s and 1980’s. The original raw measurements provided to
the authors by BOM were digitized to facilitate: (1) the automation of data quality assurance
checks, (2) the execution of temperature and pressure corrections, and (3) the analysis of coal
properties by region and seam.
23
The synthetic exposure time is that time between the initial exposure of the coal in the
mine and its eventual mining and removal from the mine. Using data from the three test sites, a
synthetic exposure time was calculated by substituting the known measurement data (fraction of
gas remaining and sorption times) into Airey’s model. For the three test sites, synthetic exposure
time values of 8.1, 9.5, and 11.6 days were determined for the Alabama, Virginia, and Kentucky
mines respectively. To estimate the gas fraction remaining for the other basins, an average
synthetic exposure time of 9.3 days was used. This average value was substituted, along with
basin specific average sorption times from the RGC database, into Airey’s model to calculate the
fraction remaining values for the Arkoma, Northern Appalachian, Illinois, and Western
underground mine coal fields.
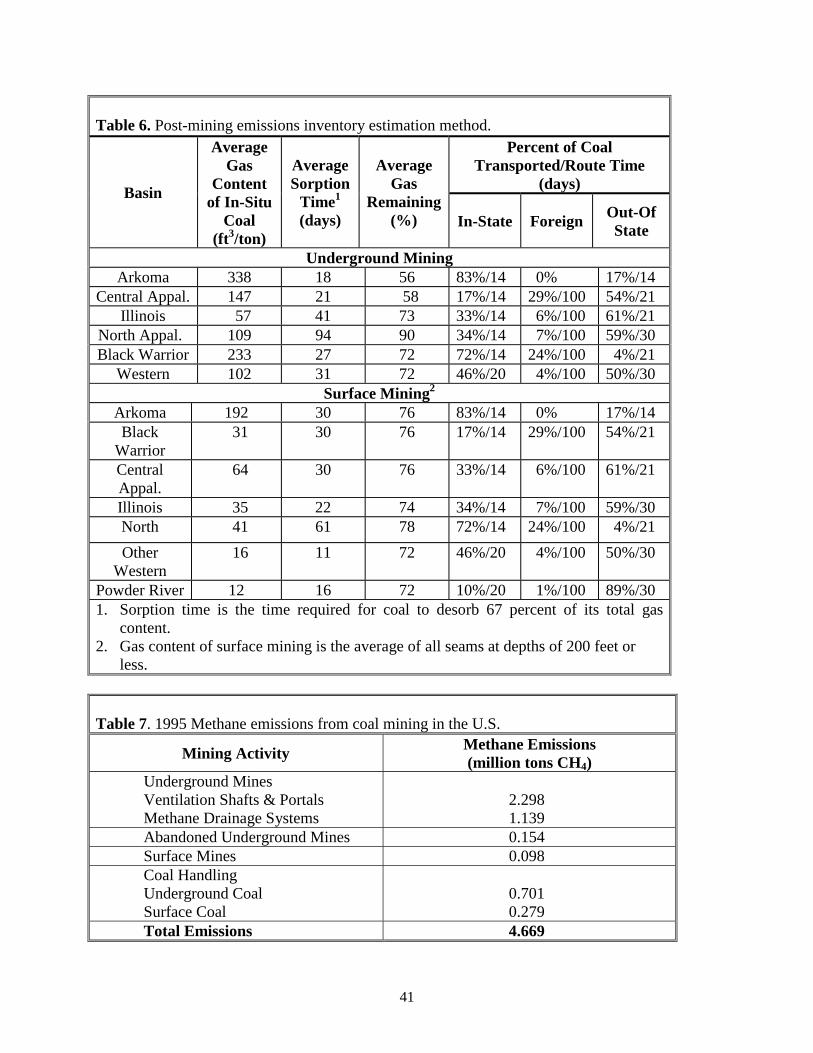
For surface mines, the synthetic exposure times assigned above cannot be used because
the rate of mining, size of the coal seams, and nature of surface mine operations vary greatly
from underground mines. Although actual measurement data would be useful, the gas desorption
equation used by the Bureau of Mines (BOM) to describe gas desorbing from coal cores, was
applied to approximate the gas remaining in surface minable coals after mining31. The desorption
rate equation is very similar to Airey's model except that it describes desorption from solid cores.
Observations of surface mining operations in the western U.S. indicate that: (1) at any given
time, the removal of overburden exposes about a 1 month supply of coal, and (2) once the coal is
blasted, it is hauled away within a five day time period.
24
Application of the desorption rate equation to western mining configurations suggests
that virgin coal that is 25 feet or more from the ambient atmosphere has a gas content that is
close to its virgin value. Thus, it is estimated that a significant fraction of the original gas
remains after the coal leaves the mine, a finding that is consistent with the unexpectedly low
emissions rates measured at active surface mines in Wyoming. For western mines, a synthetic
exposure time of 5 days was assigned, and substitution of this value, along with average sorption
times obtained from the RGC database, produces gas remaining values of 72 percent. For eastern
surface mines, a synthetic exposure time of 3 days was assigned due to the relatively rapid coal
removal occurring in those mines. Sorption parameters and gas remaining values are summarized
in Table 6.
Estimates of post-mining emissions should account for that portion of gas that may
remain in coal and be combusted. The approach taken here attempts to account for this by
estimating coal transport route and on-site storage times, and then relating these times to basin
average coal desorption rates. The Energy Information Administration’s (EIA) coal
transportation rate data were used to identify the quantity and destination of shipped coal33. Since
rail transportation is the primary mode for distributing coal to other states, the times required for
transporting and loading/unloading trains were examined. Route times were estimated to range
from between 21 days to 30 days for out-of-state distribution. Coal consumed within each state is
predominantly transported via trains and trucks, and a route time of 14 days was assigned to all
non-western locations. Exported coal is transported by water. Due to the long distance traveled
and slow traveling speeds, it was assumed that the route time for this coal is 100 days. Once coal
arrives at its destination, it is often stored on stockpiles before being utilized. Based on EIA’s
25
estimates, 30 days was assigned to represent the storage process. The coal distribution statistics
are assumed to be identical for both surface and underground coals because transportation data
specific to the method of mining are not readily available. Table 5 summarizes the key data used.
Coal handling emissions were estimated using basin-level production data for 1995
provided by DOE34. Multiplication of basin-level production, in-situ gas contents and gas
remaining values define the maximum emissions possible. Using the sorption rates, route times,
and storage time allows this maximum value to be refined by accounting for the time available
for desorption before combustion, and the specific desorption properties of each basin.
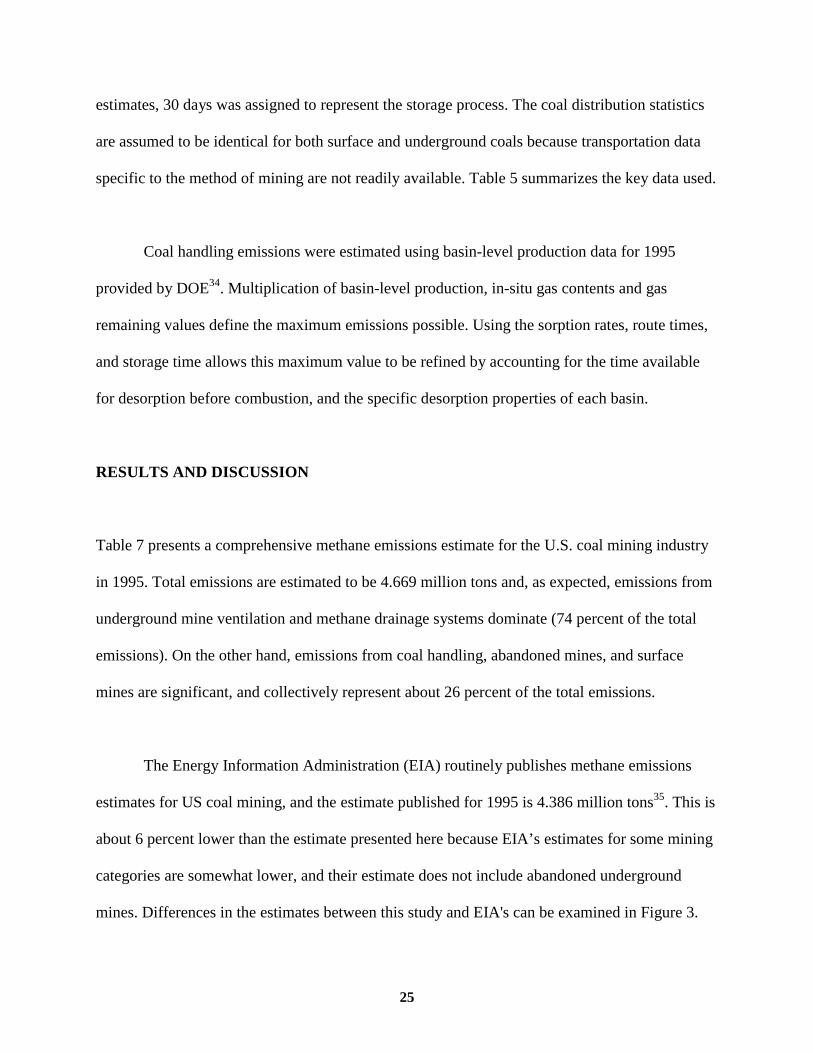
RESULTS AND DISCUSSION
Table 7 presents a comprehensive methane emissions estimate for the U.S. coal mining industry
in 1995. Total emissions are estimated to be 4.669 million tons and, as expected, emissions from
underground mine ventilation and methane drainage systems dominate (74 percent of the total
emissions). On the other hand, emissions from coal handling, abandoned mines, and surface
mines are significant, and collectively represent about 26 percent of the total emissions.
The Energy Information Administration (EIA) routinely publishes methane emissions
estimates for US coal mining, and the estimate published for 1995 is 4.386 million tons35. This is
about 6 percent lower than the estimate presented here because EIA’s estimates for some mining
categories are somewhat lower, and their estimate does not include abandoned underground
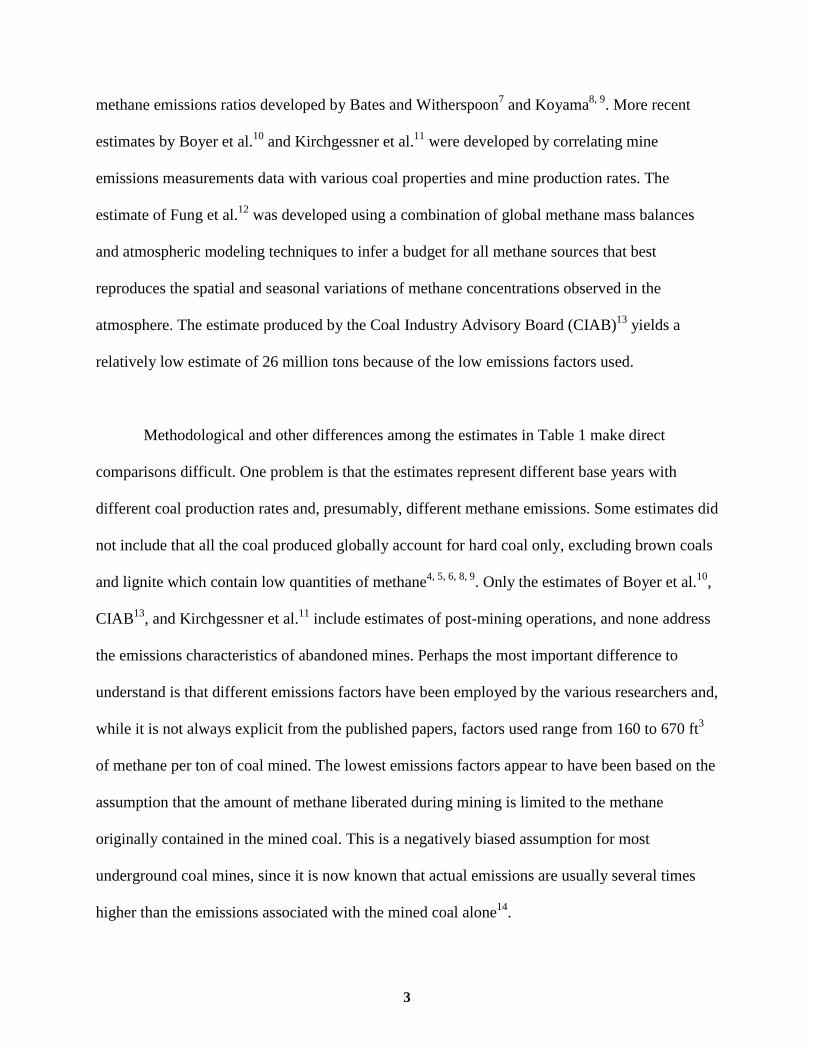
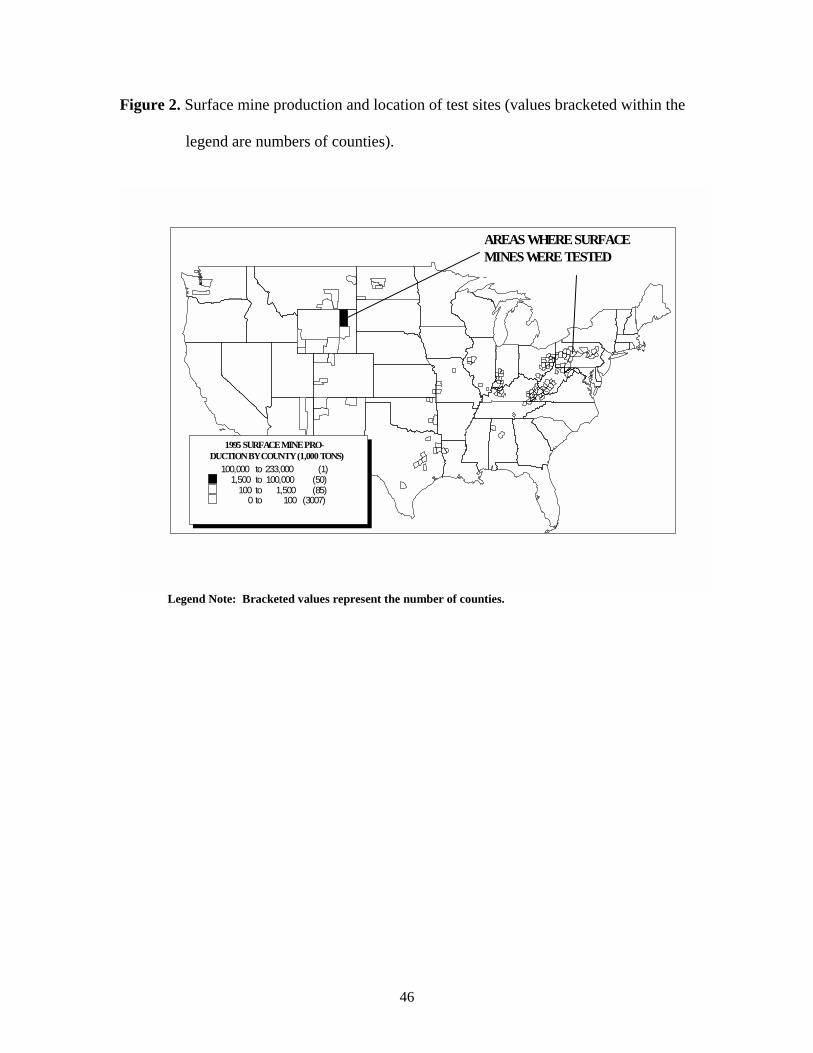
mines. Differences in the estimates between this study and EIA's can be examined in Figure 3.
26
The figure shows that estimates from this study are higher than EIA’s for all mining categories
except surface mines. It also shows that the most significant differences are associated with coal
handling of surface mined coal (0.236 million tons higher), underground mine ventilation shafts
(0.182 million tons higher), abandoned underground mines (0.154 million tons), and surface
mines (0.398 million tons lower). For coal handling of underground mined coal, the emissions
are similar, even though the gas available for release is assumed to be higher in this study. This is
because EIA’s estimate assumes all the gas trapped in coal escapes to the atmosphere, whereas
coal route and storage assumptions used here indicate some methane trapped in coal is
combusted before it has a chance to escape.
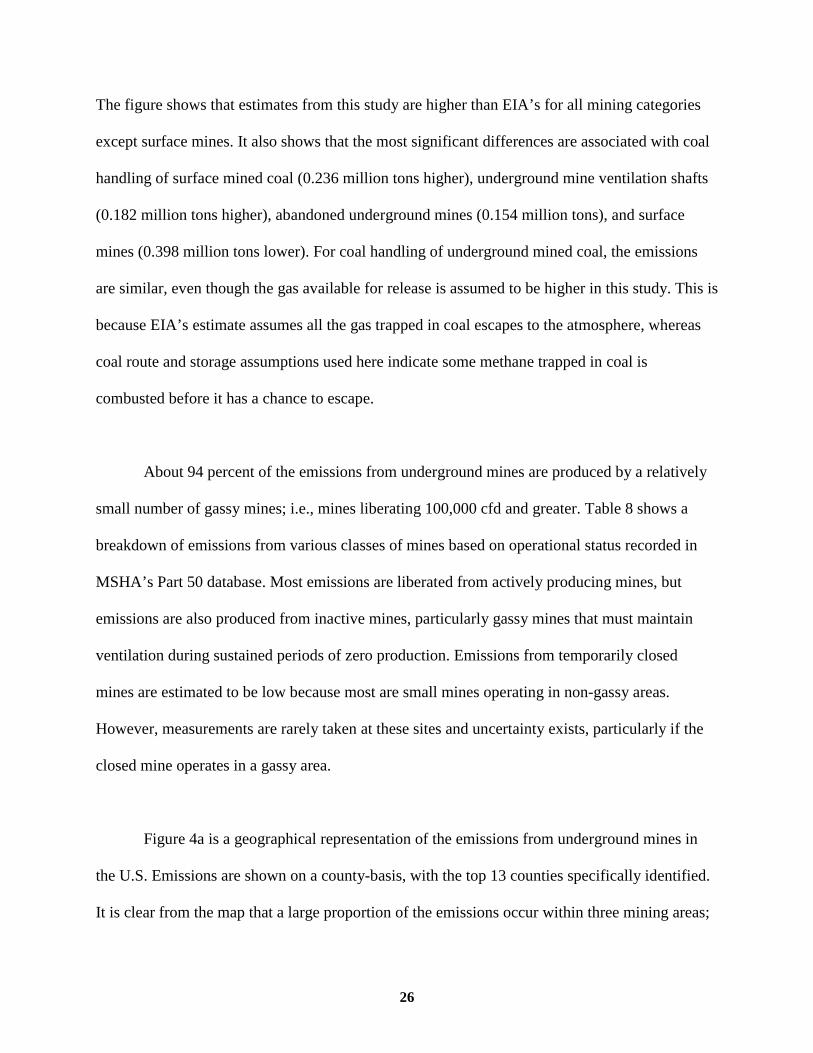
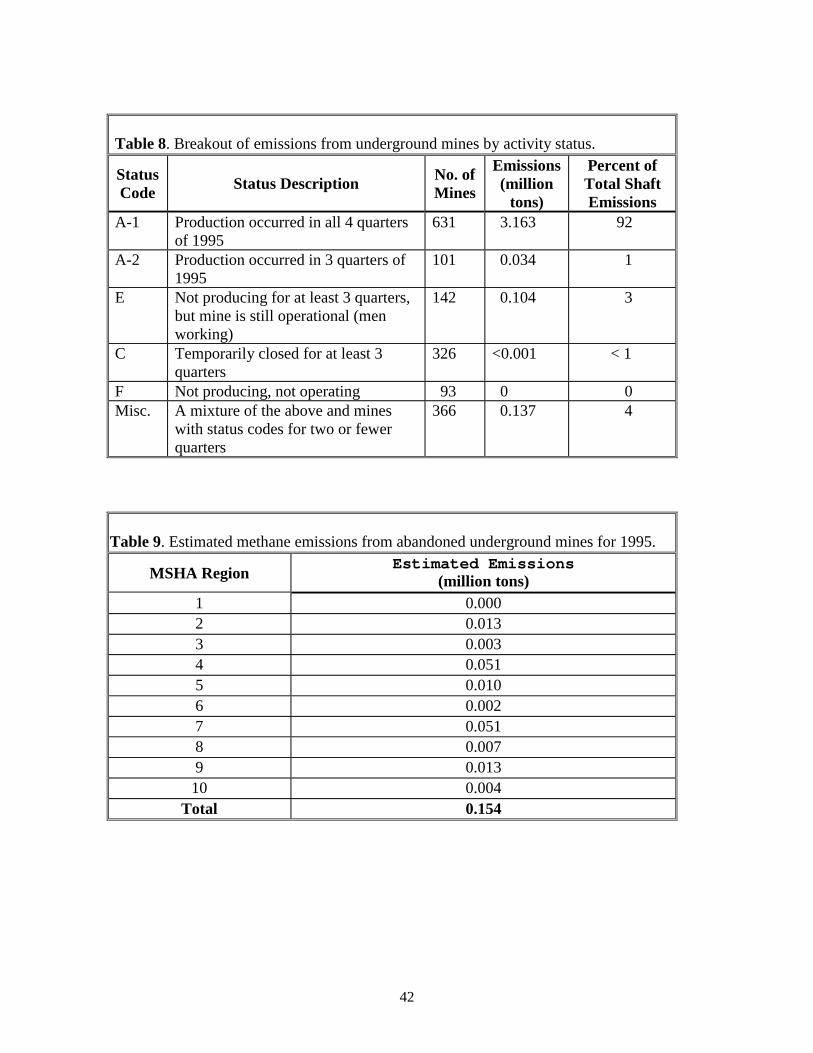
About 94 percent of the emissions from underground mines are produced by a relatively
small number of gassy mines; i.e., mines liberating 100,000 cfd and greater. Table 8 shows a
breakdown of emissions from various classes of mines based on operational status recorded in
MSHA’s Part 50 database. Most emissions are liberated from actively producing mines, but
emissions are also produced from inactive mines, particularly gassy mines that must maintain
ventilation during sustained periods of zero production. Emissions from temporarily closed
mines are estimated to be low because most are small mines operating in non-gassy areas.
However, measurements are rarely taken at these sites and uncertainty exists, particularly if the
closed mine operates in a gassy area.
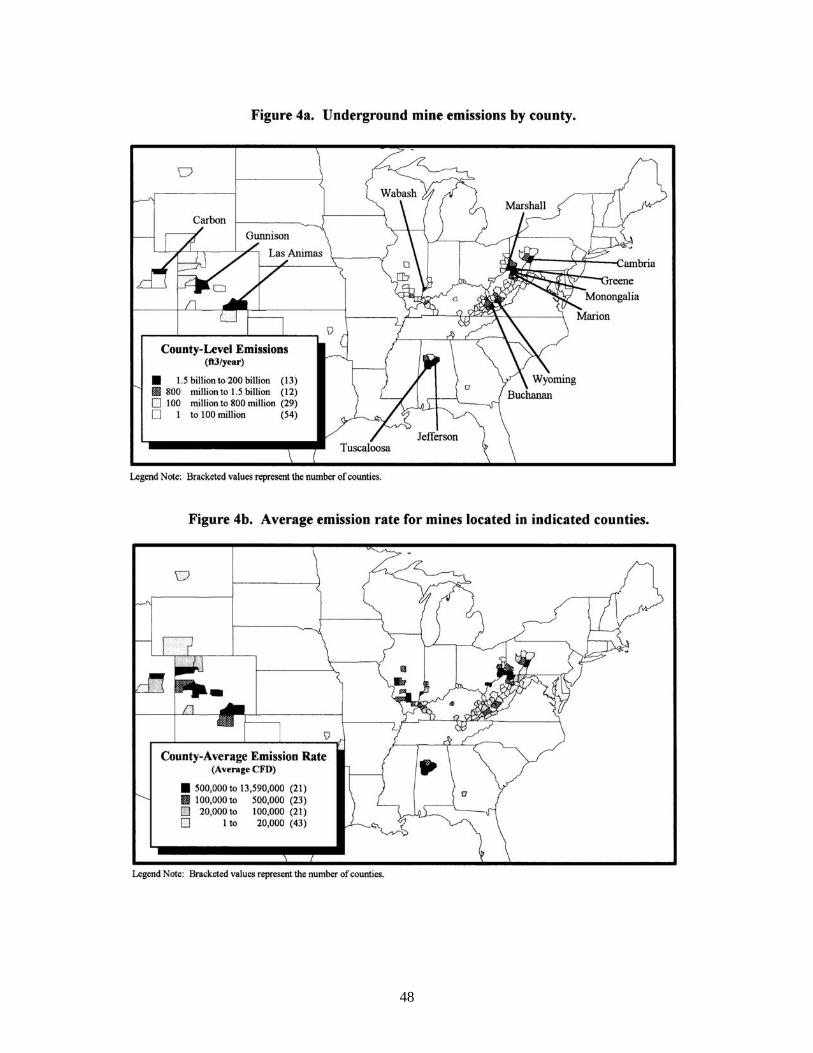
Figure 4a is a geographical representation of the emissions from underground mines in
the U.S. Emissions are shown on a county-basis, with the top 13 counties specifically identified.
It is clear from the map that a large proportion of the emissions occur within three mining areas;
27
the northern Appalachian region (northern West Virginia and Pennsylvania), the Warrior basin
(central Alabama), and the Colorado coal-fields. Figure 4b shows the average mine emissions
rate for each county, and as expected, counties with high emissions in Figure 4a generally
correspond to counties with high mine-average emissions rates. The exception is the
Illinois/Indiana mining region. Although this region liberates comparatively low emissions, the
potential to produce high emissions exists as evidenced by the gassy mines located there. If
production in this region increases, emissions increases could be significant.
According to MSHA records, there have been 7,325 underground mines permanently
abandoned in the US since 1981. Although this is a substantial number, many of these sites are
small mines that operated in or near non-gassy areas, and relatively few maintain vents to the
atmosphere. Emissions and other data from MSHA suggest that the number of mines abandoned
in gassy areas of the Appalachian region is high, but it should be noted that many abandoned
mines in this region are small hill top or auger mines where little or no emissions potential exists
despite the original gas content of the coal beds.
National emissions estimates for abandoned underground mines are presented in Table 9.
As the table shows, total emissions are estimated to be 0.154 million tons. There are no known
estimates developed for this category of mines, so there is no basis for comparison. However,
with the limited measurements and weak demographic information available for this mining
category, this estimate should be used with caution, and further examination of the gassy areas
should be conducted to improve estimates for this category, and to allow an assessment of the
energy resources involved.
28
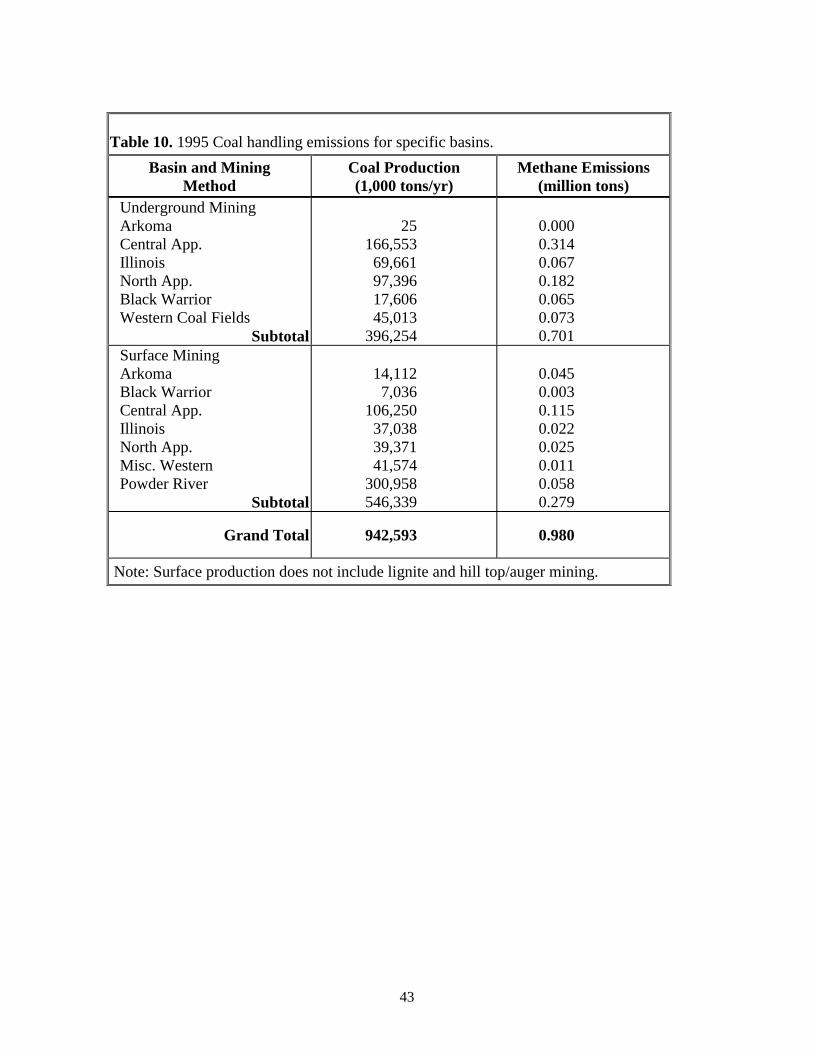
Table 10 summarizes the estimated coal handling emissions. Coal production data
published by the EIA were used to develop these estimates because their format was more
conducive to developing handling estimates than the MSHA data. Differences in production
between the two data sets are small (less than a few percent), and do not add significant
uncertainty to the estimates. Emissions for surface mined coal are higher than previous estimates
reported in the literature, so the total emissions from both surface mine sites and surface coal
handling operations (0.378 million tons) are similar to others’ estimates of total emissions from
surface mines (0.540 million tons from EIA). Although this study does not alter the total
emissions picture for surface mined coals appreciably, it does suggest the primary point of
release is not the mine site. However, unlike underground coal, handling estimates for surface
coal are not based on direct measurements, so these estimates should be used with caution.
Emissions estimates for active surface mines are significantly lower than previously
thought (0.098 million tons). Emissions from Powder River mines make up about 60 percent of
the total, while emissions from other non-lignite/non-auger producing areas account for the
remaining emissions. Although the surface mine estimate presented here is lower than previous
estimates, it is the first to be developed from direct emissions measurements at active and
inactive surface mine sites. The relatively low gas contents of surface minable coals, and the lack
of gassy strata surrounding many surface mined seams, and the relatively high percentage of gas
remaining after mining may have contributed to the relatively low emissions measured at surface
mine sites.
29
CONCLUSION
A primary goal of this program was to improve the emissions estimates for the most uncertain
mining categories. This goal was accomplished with the collection of emissions measurements at
over 30 coal mining sites including 6 active surface mine sites, 2 inactive surface mine sites, 3
coal handling sites, and 21 abandoned underground mine sites. These data have improved our
understanding of the emissions characteristics of individual sources, but additional
improvements could be achieved by collecting measurements for: (1) surface mine coal
handling, (2) abandoned underground mines in gassy areas, (3) methane drainage systems used
at underground mines, and (4) inactive and temporarily closed underground mines in gassy areas.
This study has estimated the 1995 methane emissions from all major mining sources in
the U.S. The emissions are estimated to be 4.669 million tons, which is 6 percent higher than
estimates published by DOE for 1995. The estimated emissions contributions from individual
mining sources are as follows: underground mine shafts and portals (49 percent), methane
drainage systems at underground mines (24 percent), coal handling of underground mined coal
(15 percent), abandoned underground mines (4 percent), coal handling of surface mined coal (3
percent), and surface mines (2 percent). The following source-specific emissions trends and
findings are noted:
• Abandoned Mines: About half of the mines tested liberate emissions, and
mines that are flooded do not liberate emissions. When emissions occur,
they are generally between 2 to 30 percent of the active mine emissions.
30
The numbers and locations of all vented abandoned mines are highly
uncertain.
• Coal Handling: Higher than expected gas contents occur in coal leaving
underground mines. Some of this gas is likely burned before it has a
chance to escape the coal.
• Surface Mines: Lower than expected surface mine emissions occur, and a
significant fraction of these emissions come from inactive surface mine
sites.
• Active Underground Mines: Emissions from active producing mines are
well understood, but emissions from inactive and temporarily closed
mines located in gassy areas require additional data and study. Emissions
from methane drainage systems are high, but few measurements are
publicly available.
ACKNOWLEDGEMENTS
This study was conducted under a Cooperative Agreement with the U.S. Environmental
Protection Agency, Air Pollution Prevention and Control Division. The authors wish to thank the
Mine Safety and Health Administration for their support in compiling and assessing national
emissions and other data sets, and for their assistance in the planning and execution of field
testing at abandoned mine sites. We also wish to express our appreciation for the professional
support of several coal mining companies in the Powder River basin, Warrior basin, and
31
Appalachian Basins. Without their active support, the new measurements data reported here
would not have been possible. The authors thank the many Southern Research Institute staff who
have supported this effort over the years including: Eric Ringler, Jill Webster, Jeff Lanning, John
Sokash, Wyn Lewis-Bevan, and Jim Bradey. We also thank researchers from other firms that
supported this program including David Winkler, Ajay Chadha, Phil Marsosudiro, Bill Hurget,
Peet Soot, and Joel Rucker. Finally, thanks to Karl Schultz of EPA’s Coalbed Methane Outreach
Program for his input and data on deep mine gas drainage systems, and to Pat Diamond and
Gerald Finfinger of the U.S. Bureau of Mines for providing advice and support on the numerous
occasions that we requested it.
REFERENCES
1. Hitchcock, D.R.; Wechsler, A.E. Biological Cycling of Atmospheric Trace Gases;
National Aeronautic and Space Administration. Washington, DC, 1972; NASW-2128.
2. Ehhalt, D.H. Tellus. 1974, 26, 58-70.
3. Ehhalt, D.H.; Schmidt, U. Pageoph. 1978, 116, 452-463.
4. Seiler, W. In Current Perspectives in Microbial Ecology; Klug, M.J.; Reddy, C.A.; Eds.;
American Society for Microbiology: Washington, DC, 1984; pp 468-477.
5. Crutzen, P.J. In Geophysiology of Amazonia;Dickinson, R.; Ed.; John Wiley and Sons:
New York, NY, 1987; pp 107-130.
32
6. Cicerone, R.J.; Oremland, R. Global Biogeochem. Cycles. 1988, 2, 299-327.
7. Bates, D.R.; Witherspoon, A.E. Roy. Astronom. Soc. Monthly Not. 1952, 112, 101-124.
8. Koyama, T. J. Geophys. Res. 1963, 68, 3,971-3,973.
9. Koyama, T. In Recent Researches in the Fields of Hydrosphere, Atmosphere, and
Geochemistry; Miyake, Y.; Koyama, T.; Eds.; Murucen: Tokyo, 1964; pp 143-177.
10. Boyer, C.M.; Kelafant, J.R.; Kuuskraa, V.A.; Manger, K.C.; Kruger, D. Methane
Emissions from Coal Mining: Issues and Opportunities for Reduction; U.S.
Environmental Protection Agency, Office of Air and Radiation: Washington, DC, 1990;
EPA-400/9-90/008.
11. Kirchgessner, D.A.; Piccot, S.D.; Winkler, J.D. Chemosphere, 1993a, 26, 453-472.
12. Fung, I.; John, J.; Lerner, J.; Matthews, E.; Prather, M.; Steele, L.P.; Fraser,P.J. J.
Geophys. Res. 1991, 96, 13033-13065.
13. CIAB (Coal Industry Advisory Board). Global Methane and the Coal Industry;
Organization for Economic Co-operation and Development Publications: Paris, France,
1994.
33
14. Kissel, F.N.; McCulloch, C.M.; Elder, C.H. The Direct Method of Determining Methane
Content of Coalbeds for Ventilation Design; U.S. Department of Interior, Bureau of
Mines: Pittsburgh, PA, 1973; RI 7767.
15. Creedy, D.P. Ph.D. thesis, University College, Cardiff, Wales, 1985.
16. Piccot, S.D.; Chadha, A.; DeWaters, J.; Lynch, T.; Marsosudiro, P.; Tax, W.; Walata, S.;
Winkler, J.D. Evaluation of Significant Anthropogenic Sources of Radiatively Important
Trace Gases; U.S. Environmental Protection Agency, Office of Research and
Development: Research Triangle Park, NC, 1990; EPA-600/8-90-079 (NTIS PB91-
127753).
17. Kruger, D. Identifying Opportunities for Methane Recovery at U.S. Coal Mines: Draft
Profiles of Selected Gassy Underground Coal Mines; U.S. Environmental Protection
Agency, Office of Air and Radiation: Washington DC, 1994; EPA-430-r-94-012.
18. Kirchgessner, D.A.; Piccot, S.D.; Chadha, A. Chemosphere. 1993b, 26, 23-44.
19. Piccot, S.D.; Masemore, S.S.; Ringler, E.S.; Kirchgessner, D.A. Developing Improved
Methane Emission Estimates for Coal Mining Operations, in Proceedings: The 1995
Symposium on Greenhouse Gas Emissions and Mitigation Research; U.S. Environmental
Protection Agency, Air Pollution Prevention and Control Division: Research Triangle
Park, NC, 1995; EPA/600/R-96/072 (NTIS PB96-187752).
34
20. Creedy, D.P. Chemosphere. 1993, 26, 419-440.
21. Mine Safety and Health Administration (MSHA), Part 50 Diskette User’s Handbook;
Program Evaluation and Information Resources Information Center: Denver, CO, 1996.
22. U.S. Environmental Protection Agency. Identifying Opportunities for Methane Recovery
at U.S. Coal Mines: Draft Profiles for Selected Gassy Coal Mines; U.S. Environmental
Protection Agency, Atmospheric Pollution Prevention Division: Washington, DC, 1997;
EPA-430-R-97-020.
23. Piccot S.; Masemore, S.; Ringler, E.; Srinivasan, S.; Kirchgessner, D.; Herget, W.J. of the
AWMA. 1994, 44, 271-279.
24. Piccot S.; Masemore, S.; Ringler, E.; Bevan,W.L.; Harris, D.B. J.of the AWMA. 1996,
46, 159-171.
25. Masemore, S.; Piccot, S.; Ringler, E.; Diamond, W. Evaluation and Analysis of Gas
Content and Coal Properties of Major Coal Bearing Regions of the United States; U.S.
Environmental Protection Agency, National Risk Management Research Laboratory:
Research Triangle Park, NC, 1996; EPA-600/R-96-065 (NTIS PB96-185491).
35
26. Ringler, E.; Piccot, S.; Kirchgessner, D. In Proceedings: The 87th Annual Meeting and
Exhibition of the Air and Waste Management Association; Cincinnati, OH, June 19-24,
1994; Paper No. 94-TP59.07.
27. BCTSRE (British Coal Technical Service Research Executive). Quantification of
Methane Emissions from British Coal Mine Sources; Prepared for the Working Group on
Methane Emissions, the Watt Committee on Energy: United Kingdom, 1992.
28. Creedy, D.P. Methane Emissions from Coal Related Sources in Britain: Development of
a Methodology; British Coal Technical Services and Research Executive: United
Kingdom, 1992.
29. CIAB (Coal Industry Advisory Board), Global Methane Emissions in the Coal Industry;
Prepared for the Global Climate Committee, International Energy Agency: Paris, France,
1992.
30. International Anthropogenic Methane Emissions: Estimates for 1990: Report to
Congress; Adler, M.J.Ed.; U.S. Environmental Protection Agency, Office of Policy
Planning and Evaluation: Washington, DC, 1994; EPA/230-R-93-010.
31. Ulery, J.P.; Hyman, D.M. In Proceedings: The 1991 Coalbed Methane Symposium;
Tuscaloosa, AL, May 13-17, 1991; Paper No. 9163.
32. Airey, E.M. Internat. J. of Rock Mech. and Min. Sci. 1968, 5, 475-494.
36
33. U.S. Department of Energy, Energy Policy Act Transportation Study: Interim Report on
Coal Transportation, USDOE, Energy Information Administration, DOE/EIA-0597,
Distribution Category UC-950. 1995a.
34. U.S. Department of Energy, Coal Industry Annual, USDOE Energy Information
Administration, DOE/EIA-0584 (95), Distribution Category UC-98, 1995b.
35. U.S. Department of Energy. Emissions of Greenhouse Gases in the United States 1996;
U.S. Department of Energy, Energy Information Administration: Washington, DC, 1996;
DOE/EIA-0573(96); Distribution Category UC-950.
ABOUT THE AUTHORS
The authors of this article are Dr. David A. Kirchgessner and Mr. Stephen D. Piccot. Dr.
Kirchgessner is a senior research scientist for the United States Environmental Protection
Agency; Office of Research and Development; National Risk Management Research Lab; MD-
63, Research Triangle Park, NC 27711. Mr. Piccot is Manager of the Environmental Studies
Division for Southern Research Institute; PO Box 13825, Research Triangle Park, NC 27709.
37
Table 1. Estimates of global methane emissions from coal mining operations.
Table 2a. Measured emissions for active U.S. surface mines.
Table 2b. Measured emissions for inactive U.S. surface coal mines.
Table 3. Measured emissions from abandoned and vented underground mines.
Table 4. Inventory data for abandoned underground mines.
Table 5. Post-mining measurements results.
Table 6. Post-mining emissions inventory estimation method.
Table 7. 1995 Methane emissions from coal mining in the U.S.
Table 8. Breakout of emissions from underground mines by activity status.
Table 9. Estimated methane emissions from abandoned underground mines for
1995.
Table 10. 1995 Coal handling emissions for specific basins.
38
Table 1. Estimates of global methane emissions from coal mining operations.
Researcher Base Year Emissions(million tons/yr)
Koyama(1963, 1964) 1960 22
Hitchcock andWechsler (1972) 1967 8.7 to 30.5
Ehhalt and Schmidt(1978) 1967 8.7 to 30.5
Seiler (1984) 1975 33
Crutzen (1987) (assumemid-1980s) 37
Cicerone andOremland (1988)
(assumemid-1980s) 28 to 50 (average 39)
Boyer et al. (1990) 1987 36 to 71 (average 53)
Fung et al. (1991) (assumemid-1980s) 39
Kirchgessner et al.(1993a) 1989 50.3CIAB (1994) 1990 26
Table 2a. Measured emissions for active U.S. surface mines.
MineSite
CoalProduction(106 tons/yr)
MethaneEmissions(tons/yr)
ExposedArea(ft2)
MethaneEmissions
Factor(tons/ft2-yr)
MiningRegion
A 14.00 1,354 3,089,429 0.000438 Powder River
B 16.80 1,253 3,389,056 0.000370 Powder River
C 9.90 786 1,911,686 0.000411 Powder River
D 15.30 1,369 3,203,366 0.000427 Powder River
E 1.20 43 129,168 0.000333 Northern App.
F 0.24 5 21,500 0.000241 Northern App.
Average --- --- --- 0.000370 ---
39
Table 2b. Measured emissions for inactive U.S. surface coal mines.
MineSite
CoalProduction(106 tons/yr)
MethaneEmissions(tons/yr)
Pit Length(ft)
MethaneEmissions
Factor(tons/ft-yr)
MiningRegion
A 0 3,399 5,168 0.064 Powder RiverB 0 3,185 5,120 0.062 Powder RiverAverage --- --- --- 0.063 ---
Table 3. Measured emissions from abandoned and vented underground mines.
MineNo.
CoalBasin
YearClosed
FloodingStatus
MeasuredCH4
(ft3/day)
EmissionsWhenActive
(ft3/day)
Percentof
Active
1 C. Appal. 1985 Flooded 5,033 1,100,000 0.52 C. Appal. 1992 Partial flood 294,500 3,800,000 7.83 C. Appal. 1990 Dry 433,107 2,450,000 17.74 C. Appal. 1988 Partial flood 80,250 750,000 10.75 C. Appal. 1987 Partial flood 0 350,000 0.06 C. Appal. 1987 Partial flood 4,854 950,000 0.57 C. Appal. 1985 Partial flood 149 150,000 0.18 C. Appal. 1985 Partial flood 4,863 200,000 2.49 C. Appal. 1984 Partial flood 3,288
(est.) 300,000 1.1
10 Illinois 1983 Unknown 37,000 300,000 12.311 Illinois Unknown Unknown 0 1,100,000 0.012 N. Appal. 1980 Dry 200,000 2,100,000 9.513 N. Appal. 1993 Dry 404,374 650,000 62.214 Warrior Circa 1975 ? 4,000 300,000 1.315 Warrior 1993 Partial flood 579,800 1,800,000 32.216 Warrior 1985 Flooded 0 700,000 0.017 Warrior 1985 Flooded 0 400,000 0.018 Warrior Circa 1985 Flooded 40,361 3,300,000 1.019 Illinois 1977 Flooded 0 n/a 0.020 Illinois 1984 Flooded 0 n/a 0.021 N. Appal. Circa 1985 dry 500,000 3,950,000 12.7
40
Table 4. Inventory data for abandoned underground mines.Mines in Sample Set
Abandoned in the Early1990’sMSHA
Region
UndergroundMines
AbandonedSince 1981 No.
AbandonedNo. With
Vents
AbandonedMinesWith
Vents1
Regional AverageActive MineEmissions
(ft3/day /mine)
1 300 12 0 0 02 170 21 1 8 2,515,1853 305 2 (from
MSHA)2,421,654
4 1,667 56 (fromMSHA)
1,353,987
5 1,169 4 (fromMSHA)
3,690,027
6 1,857 212 1 9 444,7547 1,671 109 1 15 5,121,0068 34 6 (from
MSHA)1,306,066
9 96 14 (fromMSHA)
1,447,352
10 56 14 (fromMSHA)
448,742
1. Estimated via extrapolation from the sample set unless specified. The note “fromMSHA” indicates estimates were obtained directly from the MSHA district office forall known capped and vented mines.
Table 5. Post-mining measurements results.
Location Basin
Gas Contentof In-Situ
CoreSamples(ft3/ton)
Gas Contentof ROM Coal
Samples(ft3/ton)
Number ofSamples/
DaysSampled
GasRemaining
AfterMining(% of
In-Situ)WalkerCounty, AL
Warrior 144 104 30/3 72
WiseCounty, VA
C. Appal. 107 65 13/1 61
MartinCounty, KY
C. Appal. 96 53 17/2 55
Note: All gas contents are on a moisture and ash free basis. ROM means run of mine(raw, uncleaned coal).
41
Table 6. Post-mining emissions inventory estimation method.Percent of Coal
Transported/Route Time(days)Basin
AverageGas
Contentof In-Situ
Coal(ft3/ton)
AverageSorption
Time1
(days)
AverageGas
Remaining(%) In-State Foreign Out-Of
State
Underground MiningArkoma 338 18 56 83%/14 0% 17%/14
Central Appal. 147 21 58 17%/14 29%/100 54%/21Illinois 57 41 73 33%/14 6%/100 61%/21
North Appal. 109 94 90 34%/14 7%/100 59%/30Black Warrior 233 27 72 72%/14 24%/100 4%/21
Western 102 31 72 46%/20 4%/100 50%/30Surface Mining2
Arkoma 192 30 76 83%/14 0% 17%/14Black
Warrior 31 30 76 17%/14 29%/100 54%/21
CentralAppal.
64 30 76 33%/14 6%/100 61%/21
Illinois 35 22 74 34%/14 7%/100 59%/30North 41 61 78 72%/14 24%/100 4%/21Other
Western 16 11 72 46%/20 4%/100 50%/30
Powder River 12 16 72 10%/20 1%/100 89%/301. Sorption time is the time required for coal to desorb 67 percent of its total gas
content.2. Gas content of surface mining is the average of all seams at depths of 200 feet or
less.
Table 7. 1995 Methane emissions from coal mining in the U.S.
Mining Activity Methane Emissions(million tons CH4)
Underground MinesVentilation Shafts & PortalsMethane Drainage Systems
2.2981.139
Abandoned Underground Mines 0.154Surface Mines 0.098Coal HandlingUnderground CoalSurface Coal
0.7010.279
Total Emissions 4.669
42
Table 8. Breakout of emissions from underground mines by activity status.
StatusCode Status Description No. of
Mines
Emissions(million
tons)
Percent ofTotal ShaftEmissions
A-1 Production occurred in all 4 quartersof 1995
631 3.163 92
A-2 Production occurred in 3 quarters of1995
101 0.034 1
E Not producing for at least 3 quarters,but mine is still operational (menworking)
142 0.104 3
C Temporarily closed for at least 3quarters
326 <0.001 < 1
F Not producing, not operating 93 0 0Misc. A mixture of the above and mines
with status codes for two or fewerquarters
366 0.137 4
Table 9. Estimated methane emissions from abandoned underground mines for 1995.
MSHA Region Estimated Emissions(million tons)
1 0.0002 0.0133 0.0034 0.0515 0.0106 0.0027 0.0518 0.0079 0.01310 0.004
Total 0.154
43
Table 10. 1995 Coal handling emissions for specific basins.Basin and Mining
MethodCoal Production(1,000 tons/yr)
Methane Emissions(million tons)
Underground MiningArkomaCentral App.IllinoisNorth App.Black WarriorWestern Coal Fields
Subtotal
25166,553 69,661 97,396 17,606 45,013396,254
0.0000.3140.0670.1820.0650.0730.701
Surface MiningArkomaBlack WarriorCentral App.IllinoisNorth App.Misc. WesternPowder River
Subtotal
14,112 7,036106,250 37,038 39,371 41,574300,958546,339
0.0450.0030.1150.0220.0250.0110.0580.279
Grand Total 942,593 0.980
Note: Surface production does not include lignite and hill top/auger mining.
44
Figure 1. Log-log plot of average quarterly emission rates at 33 non-producing
underground coal mines.
Figure 2. Surface mine production and location of test sites (values bracketed within the
legend are numbers of counties).
Figure 3. Comparison of coal mine emissions estimates developed under this study with
estimates published by the EIA.
Figure 4a. Underground mine emissions by county.
Figure 4b. Average emission rate for mines located in indicated counties.
45
Figure 1. Log-log plot of average quarterly emission rates at 33 non-producing
underground coal mines.
100 1000 10000 1000000.001
0.1
10
1000
100000
10000000
Emissions At Normal Production (CFD)
Emis
sions
At O
Pro
duct
ion
(CFD
)
Measured Values Best Fit
Inactive Emissions = 0.6 * Active EmissionsR-squared = 0.8
46
Figure 2. Surface mine production and location of test sites (values bracketed within the
legend are numbers of counties).
AREAS WHERE SURFACEMINES WERE TESTED
1995 SURFACE MINE PRO-DUCTION BY COUNTY (1,000 TONS)
100,000 to 233,000 (1)1,500 to 100,000 (50)
100 to 1,500 (85)0 to 100 (3007)
Legend Note: Bracketed values represent the number of counties.
47
Figure 3. Comparison of coal mine emissions estimates developed under this study with
estimates published by the EIA.
0
0.5
1
1.5
2
2.5
Deep MineShafts
Deep MineDegas
AbandonedMines
Surface Mines Handling(surface)
Handling(deep)
1995
em
issi
ons
in th
e U
.S (m
illion
tons
)
EIAThis Study
48