Embed Size (px)
Citation preview
Methane Emissions from Abandoned Coal Mines in China A study of abandoned coal mines in Shanxi Province, China, designed to
facilitate identification and development of abandoned mine methane
projects, enhance knowledge of abandoned mine methane emissions,
and develop methodologies to forecast emissions. For more
information, visit the project website at www.chinamethane.org.
Ruby Canyon Engineering ● University of Colorado Boulder ● Camco
Funded by the U.S. Environmental Protection Agency under cooperative agreement XA-83442901

Methane Emissions from Abandoned Coal Mines in China Page i
EPA Project No. EPAOARCCD0903
A project of the University of Colorado at Boulder’s Renewable and Sustainable
Energy Institute, Ruby Canyon Engineering, and Camco
Ron Collings, Ruby Canyon Engineering Kevin L. Doran, University of Colorado Boulder
Robin Murray, Camco
Methane Emissions from Abandoned Coal Mines in China

Methane Emissions from Abandoned Coal Mines in China Page ii
Contents Executive Summary ................................................................................................................................................................ 1
Introduction ............................................................................................................................................................................... 3
1. Goals and Objectives of the Study ............................................................................................................................... 4
2. China’s General Coal Mining Policies ......................................................................................................................... 5
3. China’s Coal Mine Closure and Consolidation Policies ....................................................................................... 6
3.1 National Policies ......................................................................................................................................................... 6
3.2 Local Policies ................................................................................................................................................................ 9
4. National Coal Mine Methane Extraction and Utilization Policies ................................................................ 10
4.1 Mandatory Policies for CMM Extraction and Utilization ......................................................................... 10
4.2 Incentive Policies for CMM Recovery and Utilization ............................................................................... 11
4.3 Barriers to Coal Mine Methane Utilization .................................................................................................... 12
4.4 Local Coal Mine Methane Policies ..................................................................................................................... 13
5. Selection of the Area of Study ..................................................................................................................................... 14
6. Analysis Approach and Data Acquisition ............................................................................................................... 14
6.1 Original Methane In-Place ..................................................................................................................................... 15
6.2 Methane Liberated During Mining ..................................................................................................................... 15
6.3 Methane Emitted Post Mining .............................................................................................................................. 16
6.4 Average Emission Rate .......................................................................................................................................... 16
6.5 Adsorption Pressure ............................................................................................................................................... 16
6.6 Decay Function .......................................................................................................................................................... 16
7. Gas Region Specific Data ............................................................................................................................................... 18
7.1 Qinshui Coalfield ........................................................................................................................................................ 19
7.2 Shouping Gas Region .............................................................................................................................................. 19
7.3 Qinnan Gas Region ................................................................................................................................................... 20
7.4 Xishan Coalfield .......................................................................................................................................................... 22
7.5 Xingjiashe Gas Region ............................................................................................................................................. 22
7.6 Hedong and Huozhou Coalfields ......................................................................................................................... 23
Methane Emissions from Abandoned Coal Mines in China
Methane Emissions from Abandoned Coal Mines in China Page iii
7.7 Daning-Jixian Gas Region ...................................................................................................................................... 23
8. Mine Specific Data ........................................................................................................................................................... 28
9. Results of Analysis ........................................................................................................................................................... 32
9.1 Calculated Data ........................................................................................................................................................... 32
9.2 Correlation of Data to Highly Prospective Abandoned Mines ................................................................ 38
9.3 Sensitivity Analysis ................................................................................................................................................... 41
9.4 Model Validation ........................................................................................................................................................ 42
10. Case Studies ..................................................................................................................................................................... 45
10.1 Pro Forma Economics ........................................................................................................................................... 49
10.2 Data Input and Results ........................................................................................................................................ 50
10.3 Recommendations .................................................................................................................................................. 53
11. Results and Conclusions .............................................................................................................................................. 53

Methane Emissions from Abandoned Coal Mines in China Page 1
Methane Emissions from Abandoned Coal Mines in China
Executive Summary This study is based on a detailed inventory of methane emissions from abandoned coal mines in China.
The initial data collection efforts for this study focused on the eastern piedmont of the Taihang
mountains in the coal-bearing region of Shanxi Province, China.
Chinese government sources state that methane emissions associated with coal production were 19
billion m3 in 2006, whereas the total methane emissions from all coal mine sources in China are
estimated to contribute 730 million tonnes of CO2 equivalent to the atmosphere each year. Chinese coal
production has risen from 2.380 billion tonnes in 2006 to 2.716 billion tonnes in 2008. While there are
activities to capture and destroy methane from active coal mines and pre-mine drainage funded through
the Clean Development Mechanism (CDM), through direct support from external organizations and
agencies and through the introduction of regulations, there is dearth of information on emissions from
abandoned mines and no known projects to capture and destroy the methane being emitted from this
source. The reasons for this are numerous: lack of empirical data on methane being generated,
ownership issues and a lack of focus on abandoned mine methane due to the range of opportunities
available at active mines—under the CDM, for instance, there is currently no approved methodology for
abandoned mine methane projects.
This study is designed to help redress the lack of knowledge of, and focus on, abandoned mines by
producing a systematic inventory of abandoned mine methane emissions in China, with an initial focus
on the coal bearing regions of Shanxi Province. There is believed to be 260 billion tonnes of coal in
Shanxi Province, and the annual coal production was 0.66 billion tonnes in 2008 (representing nearly
one quarter of the China total) from 2800 separate mines. The life time of an average local mine is
typically 20 years.
The following was developed during the course of this study:
A comprehensive set of government documents, both national and provincial, were
accumulated and summarized regarding policies on the closure and consolidation of coal mines
in China as well as policies regarding the incentives available to the coal mining industry for the
capture and utilization of CMM.
Coal characteristics relevant to methane content and production were cataloged for the various
gas regions of the Qinshui coal basin.
Specific information about the size, location, coal production, gas contents and opening and
closure dates for forty-four (44) abandoned mines in the Qinshui coal basin was gathered in
cooperation with the Shanxi Fenwei Energy Consulting Co. Ltd.

Methane Emissions from Abandoned Coal Mines in China Page 2
An approach was developed to estimate the AMM resource available for use and the probable
rate of recovery of that resource based on a combination of gas material balance, methane
emission rate during mining and a decline function based on an adsorption isotherm for the
relevant gas region. This methodology can be used to identify abandoned mines that may be
candidates for methane capture and use projects in any coal basin by providing estimates of the
remaining resource and possible methane production rates.
The Shanxi case study found that of the 44 abandoned mines studied 36 are expected to be able
to produce over 60 million m3 over a twenty year project life. The largest of these mines may
produce as much as 630 million m3.
Of the 44 mines analyzed three from different gas regions were selected for pro-forma
economic analysis case studies. These studies showed that power generation projects could be
economically instituted given that the current government power price incentives are obtained.
It was also found that only the largest of projects would be economically viable as gas treatment
and high pressure pipeline sales projects.
An online platform was created to present the above data and analysis. The online platform,
which is available at www.chinamethane.org, has three primary tools to facilitate interaction
with and analysis of project data: (1) a geographic information system that presents the
abandoned mine data using Google Maps API v3; (2) a relational MySQL database that enables
users to interact with the abandoned mine dataset using the GIS interface, the custom charting
system, or a separate search interface; and (3) a charting system that presents aggregate and
mine-specific data using dynamic HTML5 charts with data pulled from the MySQL database. In
addition to these tools, the platform contains reports and analysis generated throughout the
project. The system uses the extensible Joomla framework for content management and
administrative control. This framework allows different levels of users—e.g., administrators,
registered users, etc.—to easily interact with the underlying dataset and database. It also
provides an efficient and flexible backbone for tying the GIS system, MySQL database, and
custom charting tool together into a unified framework.
In addition to providing a systematic, supported and transparent resource to facilitate the identification
and development of abandoned mine methane projects, the study is intended to improve knowledge of
abandoned mine methane emissions and methodologies to forecast these emissions, provide a
template for similar work, and enable Chinese and other national authorities to better estimate
methane emissions.
This sample set of forty-four abandoned coal mines (out of thousands in Shanxi province) may be
emitting over 500,000,000 m3 per year of methane or about 7,000,000 tCO2e based on this analysis.
And although these represent the larger of the recently abandoned mines this large figure should
warrant more aggressive investigation to assess and both mitigate as well as to utilize this greenhouse
gas as clean energy fuel.

Methane Emissions from Abandoned Coal Mines in China Page 3
Introduction Coalbed methane is formed during coalification, the process that transforms plant material into coal.
Organic matter accumulates in swamps as lush vegetation dies and decays. As this organic matter
becomes more deeply buried, the temperature and pressure increase, subjecting the organic matter to
extreme conditions that transform it into coal, as well as byproducts including methane, carbon dioxide,
nitrogen, and water; with methane being the predominate gas constituent. The gasses contained in the
coal are commonly referred to as coalbed methane (CBM) or coal seam gas.
The methane is trapped in coal seams through physical adsorption. The amount of methane held in the
coal is a function of temperature and pressure. The rate at which the gas can be released is a function of
the permeability of the coal to the flow of gas. CBM can be produced through wellbores by initiating
flow through the coal by establishing a pressure differential between the wellbore and coal seam. It can
also be liberated through mining activities which reduces the pressure and also increases the
permeability because of the fracturing of the coal and surrounding rock coal caused by removal of the
coal.
The release of methane during mining is a safety problem worldwide and is dealt with through dilution
by ventilating the mine workings with fresh air, high concentration methane drainage within the mine
workings and sometimes through pre-drainage of the gas through boreholes prior to mining. As active
mining stops, the mine’s gas production decreases, but the methane liberation does not stop
completely. Following an initial rapid decline, abandoned mines can liberate methane at a near-steady
rate over many years. The gas migrates to the atmosphere through various conduits, such as poorly
sealed shafts and boreholes and as diffuse emissions through cracks and fissures in the strata overlying
the coal mine.
Chinese government sources state that methane emissions associated with coal production were 19
billion m3 in 2006, whereas the total methane emissions from all coal mine sources in China are
estimated to contribute 730 million tonnes of CO2 equivalent to the atmosphere each year. Chinese coal
production has risen from 2.380 billion tonnes in 2006 to 2.716 billion tonnes in 2008. While there are
activities to capture and destroy methane from active coal mines and pre-mine drainage funded through
the Clean Development Mechanism (CDM), through direct support from external organizations and
agencies and through the introduction of regulations, there is dearth of information on emissions from
abandoned mines and no known projects to capture and destroy the methane being emitted from this
source. The reasons for this are numerous: lack of empirical data on methane being generated,
ownership issues and a lack of focus on abandoned mine methane due to the range of opportunities
available at active mines—under the CDM, for instance, there is currently no approved methodology for
abandoned mine methane projects.
The determination of methane emissions from abandoned coal mines has a high degree of uncertainty
because of the diffuse nature of the emissions. Occasionally, open boreholes vent methane to the
atmosphere. In this case the flow rate and concentration can be monitored; however this is rarely the
case.
Methane Emissions from Abandoned Coal Mines in China Page 4
The U.S. Environmental Protection Agency issued a report in April 2004 that provided a methodology for
estimating the methane emissions from abandoned coal mines in the United States1. This methodology
combined physical characteristics of coals in various coal mining districts with known information about
the abandoned mines. A similar but modified approach is used in the evaluation of the mines identified
in this study.
This result of this study will help redress the lack of knowledge of, and focus on, abandoned mines
through producing a systematic inventory of abandoned mine methane emissions for a group of mines
in a coal bearing region of Shanxi Province. There is believed to be 260 billion tonnes of coal in Shanxi
Province, and the annual coal production was 0.66 billion tonnes in 2008 (representing nearly one
quarter of the China total) from 2800 separate mines. This investigation has selected 44 of the several
hundred abandoned coal mines in the area in order to develop a methodology that can be broadly
applied to a broader population of mines, not only in Shanxi province but elsewhere that has similar
data sets.
In addition to providing a systematic, supported and transparent resource to facilitate the identification
and development of abandoned mine methane projects the work will improve knowledge of abandoned
mine methane emissions and methodologies to forecast these emissions, will provide a template for
similar work in other Chinese provinces and regions and will allow Chinese authorities to better estimate
abandoned mine methane emissions nationwide.
1. Goals and Objectives of the Study Learn how to access information on abandoned coal mines
o Determine how and where to obtain data on abandoned mines
o Determine what data is available for those mines
Develop an approach to estimate the methane emissions through time for a sample set of
abandoned mines based on the data available
Estimate the volume of the methane resource by mine and provide an estimate of the probable
rate of recovery of that resource
Develop high level case studies for three potential projects and to present these opportunities
as case studies at regional or national mine methane forums to encourage private and public
sector action to reduce emissions.
Assist CMAs and third party developers in identifying viable methane mitigation opportunities
by listing local, provincial and nationwide incentives pertaining to the capture of abandoned
mine methane
Identify and catalogue some of the non-technical barriers to developing abandoned mine
methane projects in the regions studied. These include national and local regulations and
enforcement mechanisms, ownership, finance, technology and access to markets for the
methane captured.
1 Methane Emissions From Abandoned Coal Mines in the United States: Emission Inventory Methodology and 1990
– 2002 Emissions Estimates, US EPA, Air and Radiation 6202J, EPA 430-R-04-001, May 2004

Methane Emissions from Abandoned Coal Mines in China Page 5
Aid project developers in identifying potential AMM project sites by utilizing Geographical
Information System (GIS) technology to build an interactive online database. This GIS application
will allow project proponents to identify potential projects not only by probable methane
reserves but also by favorable access to necessary infrastructure such as the existing power grid,
pipelines, roads and towns.
Present the results of the study to industry stake holders through conferences and publications.
2. China’s General Coal Mining Policies The Five-year Plan for the Development of Coal Sector in China, released by NDRC in Jan 2007, draws a
prospective roadmap for China’s coal sector. The plan concludes that, coal, accounting for 2/3 of
nationwide energy consumption, plays a strategic role in the national economy for the long run. It is
expected that demand for coal will continue its recent rapid growth.
In the light of the Plan, China aims to build up a modernized coal industry system based on a series of
practices: consolidation of coal enterprises, improved mechanization, innovation in technologies,
organizational structure optimization, rational development, work safety, cost-efficient energy
utilization and protection of the environment. Efforts will be focused on the merger and acquisition for
the small-sized coalmines in the bid to rationalize the resource development with clean and safer
production.
Industrial upgrading based on science and technology is key for the coal sector. The 11th Five-year Plan
indicates the government aims to transition to the use of modern technology in coal mines, using coal
excavation mechanization at over 95% of large-scale coal mines, 80% at the medium-scale coal mines,
and 40% at smaller coal mines. To achieve this goal, China further enlarged technology investment,
promoted scientific research to tackle key issues in manufacturing efficient coal mining technologies,
including open-cast mining equipment, large-scale transportation equipment, coal washing equipment
and coal mine methane recovery and utilization.
According to the Plan, China will create six to eight coal mining groups with the capacity to produce 100
million tonnes of coal per annum, as well as another eight to ten coal groups with an annual production
of 50 million tonnes each. China will build 13 large coalmine bases, with coal production of 2.2 billion
tonnes per annum, a share of about 86% of the total national production.
The major tasks for the development of coal sector set by the Plan include:
To optimize the geologic distribution of coal resource development
To build up large-scaled coalmine bases
To encourage very large coal-based conglomerates
To adjust and upgrade small-sized coalmines
To push forward innovation in sciences and technology
To drive up the process of demonstration projects on coal chemicals
To upgrade the level of coalmine safety
Methane Emissions from Abandoned Coal Mines in China Page 6
To construct the new mine areas focusing on energy efficiency and environmental protection
To expand the transportation capacity of railways and coal ports
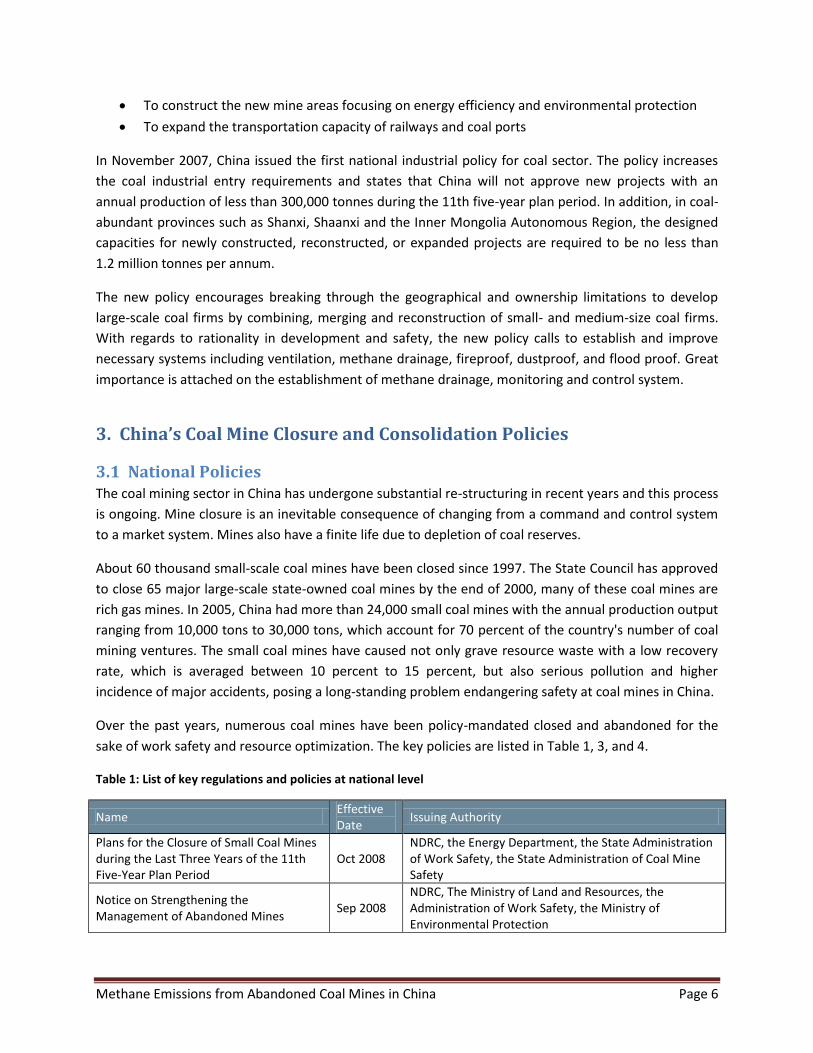
In November 2007, China issued the first national industrial policy for coal sector. The policy increases
the coal industrial entry requirements and states that China will not approve new projects with an
annual production of less than 300,000 tonnes during the 11th five-year plan period. In addition, in coal-
abundant provinces such as Shanxi, Shaanxi and the Inner Mongolia Autonomous Region, the designed
capacities for newly constructed, reconstructed, or expanded projects are required to be no less than
1.2 million tonnes per annum.
The new policy encourages breaking through the geographical and ownership limitations to develop
large-scale coal firms by combining, merging and reconstruction of small- and medium-size coal firms.
With regards to rationality in development and safety, the new policy calls to establish and improve
necessary systems including ventilation, methane drainage, fireproof, dustproof, and flood proof. Great
importance is attached on the establishment of methane drainage, monitoring and control system.
3. China’s Coal Mine Closure and Consolidation Policies
3.1 National Policies The coal mining sector in China has undergone substantial re-structuring in recent years and this process
is ongoing. Mine closure is an inevitable consequence of changing from a command and control system
to a market system. Mines also have a finite life due to depletion of coal reserves.
About 60 thousand small-scale coal mines have been closed since 1997. The State Council has approved
to close 65 major large-scale state-owned coal mines by the end of 2000, many of these coal mines are
rich gas mines. In 2005, China had more than 24,000 small coal mines with the annual production output
ranging from 10,000 tons to 30,000 tons, which account for 70 percent of the country's number of coal
mining ventures. The small coal mines have caused not only grave resource waste with a low recovery
rate, which is averaged between 10 percent to 15 percent, but also serious pollution and higher
incidence of major accidents, posing a long-standing problem endangering safety at coal mines in China.
Over the past years, numerous coal mines have been policy-mandated closed and abandoned for the
sake of work safety and resource optimization. The key policies are listed in Table 1, 3, and 4.
Table 1: List of key regulations and policies at national level
Name Effective Date
Issuing Authority
Plans for the Closure of Small Coal Mines during the Last Three Years of the 11th Five-Year Plan Period
Oct 2008 NDRC, the Energy Department, the State Administration of Work Safety, the State Administration of Coal Mine Safety
Notice on Strengthening the Management of Abandoned Mines
Sep 2008 NDRC, The Ministry of Land and Resources, the Administration of Work Safety, the Ministry of Environmental Protection

Methane Emissions from Abandoned Coal Mines in China Page 7
Notice regarding Strengthening the Rectification and Closure of Coal Mines
Sep 2006
12 ministries and departments, including NDRC, the Administration of Work Safety, the Administration of Coal Mine Safety, the Ministry of Land and Resources, and etc.
Comments on the Development of the Three-year Plan for Rectification and Closure of Coal Mines
May 2006 Work Safety Committee Office of the State Council
Comments on Strengthening the Management of Coal Mine Safety and Optimizing the Structure of Coal Industry
Mar 2006
8 ministries and departments, including the Administration of Work Safety, the Administration of Coal Mine Safety, the Ministry of Land and Resources, and etc.
Notice on Closing Unsafe and Illegal Coal Mines
Aug 2005 The State Council
The strategy for the treatment of small coal mines has been changing from shutting down unsafe small
coal mines toward phasing out outdated technologies, policy-mandated closure and resource
integration.
As early as 2005, based on the target set by the State Council to tackle small coal mine related problems
within three years, the State Administration of Work Safety and the State Administration of Coal Mine
Safety has put forward a Three-step Strategy “Rectification and Closure of Small Coal Mines– Resource
Integration and Technology Improvement – Management of Major Coal Mines”.
In August 2005, the State Council issued the Notice on Closing Unsafe and Illegal Coal Mines, which
required that, coal mining activities, which could not meet work safety requirements, or did not obtain
all legally required permits and approvals, or did not equip with coal mine methane monitoring and
drainage system, or did not through the final completion acceptance for the work safety equipment,
must be stopped for rectification, and coal mines that still fail to meet safety requirements after
rectification must be resolutely closed by the local government. The Notice also requires that relevant
authorities at local level should release the list of closed coal mines.
To further optimize coal industrial structure, eight ministries and departments, including the
Administration of Work Safety, the Administration of Coal Mine Safety, and the Ministry of Land and
Resources, jointly issued in March 2006 the Comments and Opinions on Strengthening the Management
of Coal Mine Safety and Optimizing the Coal Industrial Structure, and clearly stated that China is going to
close all small coal mines with an annual production capacity of 30,000 tonnes or less by the end of
2007. In addition, according to the Notice, China would streamline the coal mining sector to improve
work safety and encourage large coal mining firms to merge with smaller ones, but required that the
combined production capacity for individual coal mine located in Shanxi province should be no less than
300,000 tonnes per annum.
At the same time, to facilitate the implementation of the Three-step Strategy, in May 2006, the Work
Safety Committee Office of the State Council issued the Guidelines for the Development of the Three-
year Plan for the Rectification and Closure of Coal Mines. Based on the Plans submitted by local

Methane Emissions from Abandoned Coal Mines in China Page 8
governments, the Work Safety Committee set the target to shut down 9887 small coal mines in three
periods:
Phase I (July 2005 – June 2006): to close 5026 unsafe and illegal small coal mines
Phase II (July 2006 – June 2007): to close 2652 small coal mines, which have caused severe
damage to natural resources and environmental pollution or fall short of industrial policies
Phase III (July 2007 – June 2008): to close 2209 small coal mines
By the end of 2007 China has closed 11,155 small coal mines, which accounts for 45% of the total
number at the beginning of 2005, and 8,821 coal mines from 20 provinces, autonomous regions and
municipalities have been combined into 3,747 larger coal mines.
In October 2008, the National Development and Reform Commission, the Energy Department, the State
Administration of Work Safety, and the State Administration of Coal Mine Safety, issued a Plan for the
Closure of Small Coal Mines during the Last Three Years of the 11th Five-Year Plan Period. According to
the Plan, China pledges to further cut down another 4000 small coal mines, where 2500 small coal mine
will be fully closed and the remaining 1500 small coal mines must go through expansion and reform or
will be merged by larger coal mines. The ultimate goal of Chinese government is to control the number
of small coal mines with annual production capacity less than 300,000 tonnes to be less than 10,000 by
the end of 2010. The target for the closure of small coal mines has been broken down into every
province / region / municipal city. The following table presents the targets for Shanxi and Hebei province
to close small coal mines in the last three years of the 11th five-year plan period.
Table 2: Targets to close small coal mines in the last three years of the 11th five-year plan period
Number of existing small coal mines
Number of small coal mines to be closed
Number of small coal mines to be merged with large coal mines
Number of remaining small coal mines by the end of 2010
China 14069 2501 1616 9952
Shanxi 1702 500 102 1100
In January 2009, the director of the State Administration of Coal Mine Safety, Mr. Zhao Tiechui,
announced that China has further closed another 1,054 small coal mines which failed to meet the work
safety requirements or were inconsistent with industrial policies.
In September 2008, the National Development and Reform Commission, the Ministry of Land and
Resources, the Ministry of Environmental Protection, and the State Administration of Work Safety have
jointly issued an Notice on Strengthening the Treatment of Abandoned Mines, which requires that the
local government at various levels to conduct the research on the abandoned mines within its
jurisdiction and to develop relevant planning for the treatment of abandoned mines. According to the
Notice, both the research and planning for treatment are required to be completed by the first quarter
of 2009.
Methane Emissions from Abandoned Coal Mines in China Page 9
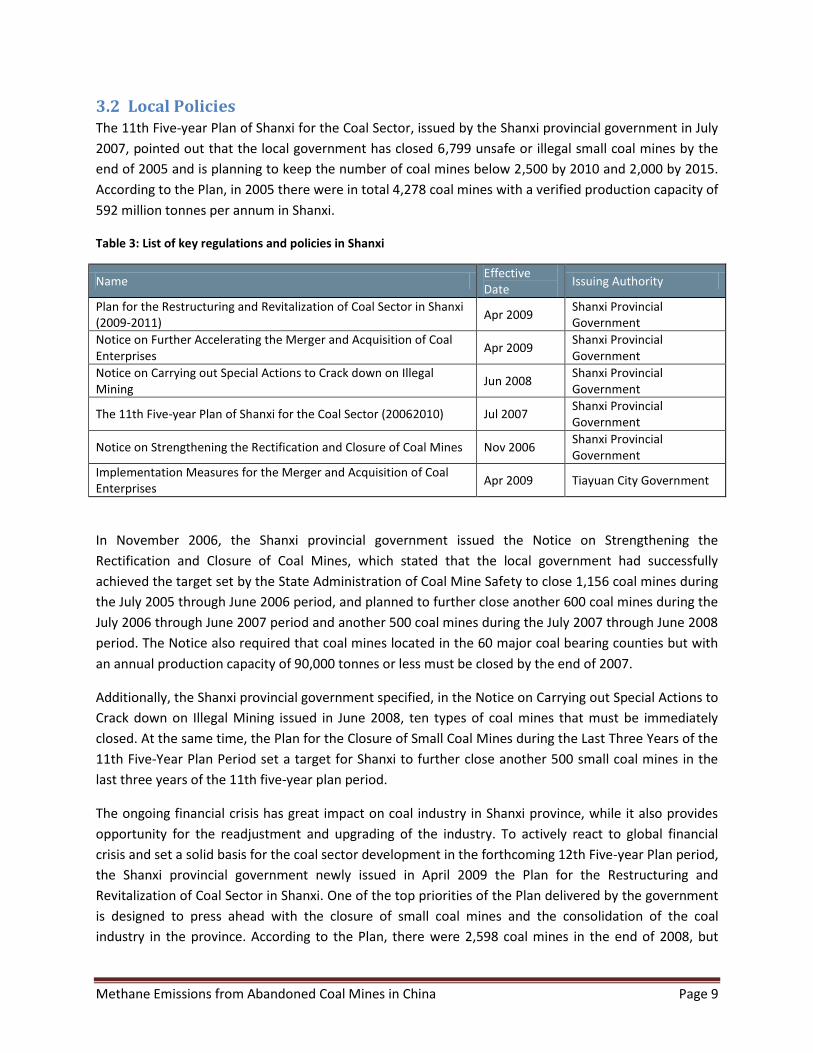
3.2 Local Policies The 11th Five-year Plan of Shanxi for the Coal Sector, issued by the Shanxi provincial government in July
2007, pointed out that the local government has closed 6,799 unsafe or illegal small coal mines by the
end of 2005 and is planning to keep the number of coal mines below 2,500 by 2010 and 2,000 by 2015.
According to the Plan, in 2005 there were in total 4,278 coal mines with a verified production capacity of
592 million tonnes per annum in Shanxi.
Table 3: List of key regulations and policies in Shanxi
Name Effective Date
Issuing Authority
Plan for the Restructuring and Revitalization of Coal Sector in Shanxi (2009-2011)
Apr 2009 Shanxi Provincial Government
Notice on Further Accelerating the Merger and Acquisition of Coal Enterprises
Apr 2009 Shanxi Provincial Government
Notice on Carrying out Special Actions to Crack down on Illegal Mining
Jun 2008 Shanxi Provincial Government
The 11th Five-year Plan of Shanxi for the Coal Sector (20062010) Jul 2007 Shanxi Provincial Government
Notice on Strengthening the Rectification and Closure of Coal Mines Nov 2006 Shanxi Provincial Government
Implementation Measures for the Merger and Acquisition of Coal Enterprises
Apr 2009 Tiayuan City Government
In November 2006, the Shanxi provincial government issued the Notice on Strengthening the
Rectification and Closure of Coal Mines, which stated that the local government had successfully
achieved the target set by the State Administration of Coal Mine Safety to close 1,156 coal mines during
the July 2005 through June 2006 period, and planned to further close another 600 coal mines during the
July 2006 through June 2007 period and another 500 coal mines during the July 2007 through June 2008
period. The Notice also required that coal mines located in the 60 major coal bearing counties but with
an annual production capacity of 90,000 tonnes or less must be closed by the end of 2007.
Additionally, the Shanxi provincial government specified, in the Notice on Carrying out Special Actions to
Crack down on Illegal Mining issued in June 2008, ten types of coal mines that must be immediately
closed. At the same time, the Plan for the Closure of Small Coal Mines during the Last Three Years of the
11th Five-Year Plan Period set a target for Shanxi to further close another 500 small coal mines in the
last three years of the 11th five-year plan period.
The ongoing financial crisis has great impact on coal industry in Shanxi province, while it also provides
opportunity for the readjustment and upgrading of the industry. To actively react to global financial
crisis and set a solid basis for the coal sector development in the forthcoming 12th Five-year Plan period,
the Shanxi provincial government newly issued in April 2009 the Plan for the Restructuring and
Revitalization of Coal Sector in Shanxi. One of the top priorities of the Plan delivered by the government
is designed to press ahead with the closure of small coal mines and the consolidation of the coal
industry in the province. According to the Plan, there were 2,598 coal mines in the end of 2008, but
Methane Emissions from Abandoned Coal Mines in China Page 10
more than 80% of these coal mines are small coal mines with an annual production capacity of 300,000
tonnes. It is the vision of the Plan that the total coal mines will be reduced to 1,000 by 2011, and 800 by
2015.
In order to better achieve the stringent target set in the Plan, several local governments at city or county
levels in Shanxi has considered providing financial incentives for counties that complete required targets
for the closure of small coal mines within timeline. Taiyuan government sets aside RMB 416 million to
prompt the closure of 50 small coal mines in 2009 and offers an award of RMB 5 million to the county
government for the close of each coal mine as schedule.
4. National Coal Mine Methane Extraction and Utilization Policies
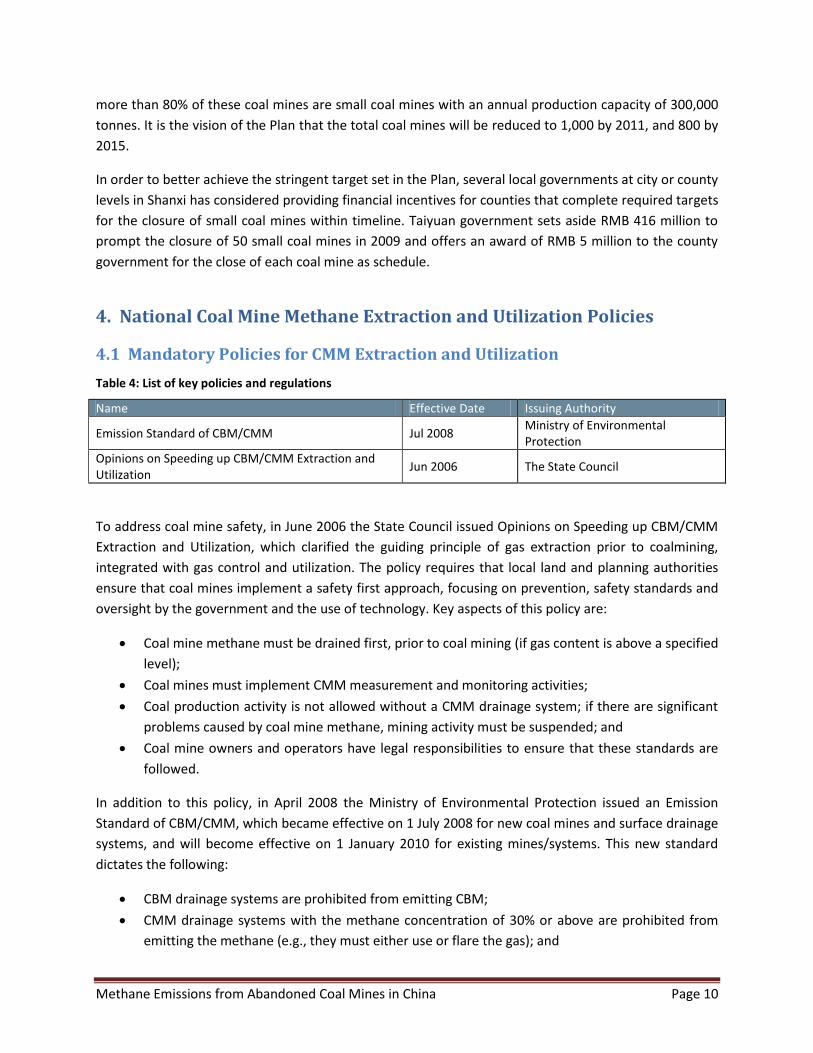
4.1 Mandatory Policies for CMM Extraction and Utilization
Table 4: List of key policies and regulations
Name Effective Date Issuing Authority
Emission Standard of CBM/CMM Jul 2008 Ministry of Environmental Protection
Opinions on Speeding up CBM/CMM Extraction and Utilization
Jun 2006 The State Council
To address coal mine safety, in June 2006 the State Council issued Opinions on Speeding up CBM/CMM
Extraction and Utilization, which clarified the guiding principle of gas extraction prior to coalmining,
integrated with gas control and utilization. The policy requires that local land and planning authorities
ensure that coal mines implement a safety first approach, focusing on prevention, safety standards and
oversight by the government and the use of technology. Key aspects of this policy are:
Coal mine methane must be drained first, prior to coal mining (if gas content is above a specified
level);
Coal mines must implement CMM measurement and monitoring activities;
Coal production activity is not allowed without a CMM drainage system; if there are significant
problems caused by coal mine methane, mining activity must be suspended; and
Coal mine owners and operators have legal responsibilities to ensure that these standards are
followed.
In addition to this policy, in April 2008 the Ministry of Environmental Protection issued an Emission
Standard of CBM/CMM, which became effective on 1 July 2008 for new coal mines and surface drainage
systems, and will become effective on 1 January 2010 for existing mines/systems. This new standard
dictates the following:
CBM drainage systems are prohibited from emitting CBM;
CMM drainage systems with the methane concentration of 30% or above are prohibited from
emitting the methane (e.g., they must either use or flare the gas); and
Methane Emissions from Abandoned Coal Mines in China Page 11
If the methane concentration is less than 30%, the methane is allowed to be released.
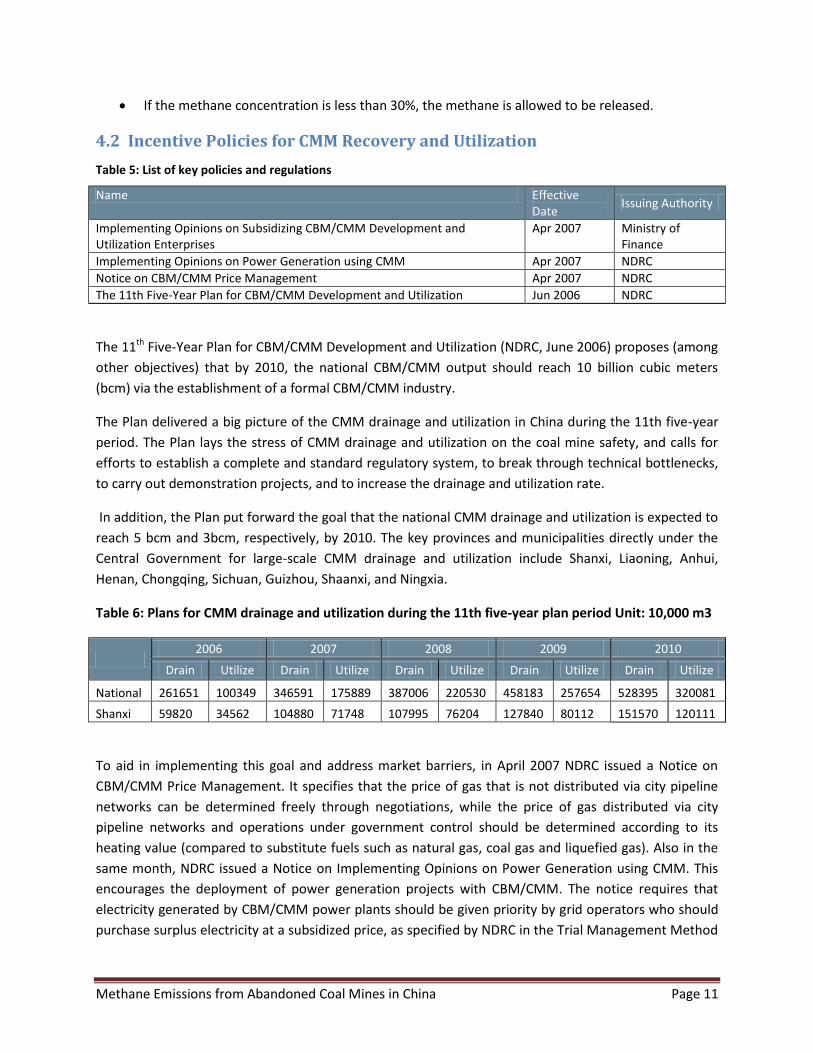
4.2 Incentive Policies for CMM Recovery and Utilization
Table 5: List of key policies and regulations
Name Effective Date
Issuing Authority
Implementing Opinions on Subsidizing CBM/CMM Development and Utilization Enterprises
Apr 2007 Ministry of Finance
Implementing Opinions on Power Generation using CMM Apr 2007 NDRC
Notice on CBM/CMM Price Management Apr 2007 NDRC
The 11th Five-Year Plan for CBM/CMM Development and Utilization Jun 2006 NDRC
The 11th Five-Year Plan for CBM/CMM Development and Utilization (NDRC, June 2006) proposes (among
other objectives) that by 2010, the national CBM/CMM output should reach 10 billion cubic meters
(bcm) via the establishment of a formal CBM/CMM industry.
The Plan delivered a big picture of the CMM drainage and utilization in China during the 11th five-year
period. The Plan lays the stress of CMM drainage and utilization on the coal mine safety, and calls for
efforts to establish a complete and standard regulatory system, to break through technical bottlenecks,
to carry out demonstration projects, and to increase the drainage and utilization rate.
In addition, the Plan put forward the goal that the national CMM drainage and utilization is expected to
reach 5 bcm and 3bcm, respectively, by 2010. The key provinces and municipalities directly under the
Central Government for large-scale CMM drainage and utilization include Shanxi, Liaoning, Anhui,
Henan, Chongqing, Sichuan, Guizhou, Shaanxi, and Ningxia.
Table 6: Plans for CMM drainage and utilization during the 11th five-year plan period Unit: 10,000 m3
2006 2007 2008 2009 2010
Drain Utilize Drain Utilize Drain Utilize Drain Utilize Drain Utilize
National 261651 100349 346591 175889 387006 220530 458183 257654 528395 320081
Shanxi 59820 34562 104880 71748 107995 76204 127840 80112 151570 120111
To aid in implementing this goal and address market barriers, in April 2007 NDRC issued a Notice on
CBM/CMM Price Management. It specifies that the price of gas that is not distributed via city pipeline
networks can be determined freely through negotiations, while the price of gas distributed via city
pipeline networks and operations under government control should be determined according to its
heating value (compared to substitute fuels such as natural gas, coal gas and liquefied gas). Also in the
same month, NDRC issued a Notice on Implementing Opinions on Power Generation using CMM. This
encourages the deployment of power generation projects with CBM/CMM. The notice requires that
electricity generated by CBM/CMM power plants should be given priority by grid operators who should
purchase surplus electricity at a subsidized price, as specified by NDRC in the Trial Management Method

Methane Emissions from Abandoned Coal Mines in China Page 12
for Electricity Prices and Sharing Expenses for Electricity Generated with Renewable Energy. CBM/CMM
power plant owners were also exempted from market price competition and do not undertake any
responsibilities for grid stability.
At the same time, in April 2007, the Ministry of Finance issued Implementing Opinions on Subsidizing
CBM/CMM Development and Utilization Enterprises whereby any enterprise engaged in CBM/CMM
extraction within China is entitled to financial subsidies, if it is used on site or marketed for residential
use or as a chemical feedstock. CBM/CMM used to generate power does not benefit from this subsidy.
Further, CMM power generation projects listed in the Catalogue of Comprehensive Utilization of
Resources (2003 revision) are eligible for certain preferences. Power authorities will grant enterprises
co-generating electricity and heat from CBM/CMM a grid connection if the individual units have an
installed capacity of above 500 kW and meet required standards. They are exempt from paying the
connection fee normally charged to small-scale, coal-fired power plants; they are excluded from quotas
under the national distribution plan; and they benefit from priority electricity sales to the grid at
wholesale prices, or even at higher prices if approved by the provincial authorities. Those with an
installed capacity of 1.2 MW or less are not required to support the grid by load following. Plants above
this capacity can deliver their full output during periods of peak demand, but will never be required to
drop below 85% output.
In addition to the previous policies, the Chinese government has developed a number of supporting
policies to promote CMM recovery and utilization. They are summarized as follows:
Under the National Land Transfer Policy, land use priority is given to CMM recovery and
utilization projects;
Coal mine companies with CMM drainage and recovery systems are allowed to use production
safety funds to invest in CMM drainage and utilization;
Governments at all levels are encouraged to provide discounted loans or grants to CMM
projects;
The value-added tax levied from coal mines which recover and utilize CMM is returned to the
coal mine operators (returned taxes are to be used in R&D and investment in coal mine for
enlarged production);
No income tax shall be levied for enterprises which are developing technologies for CMM
recovery and utilization;
4.3 Barriers to Coal Mine Methane Utilization According to desktop research and literature review, we concluded five major non-technical barriers
block CBM/CMM exploration and utilization in China. These barriers include aspects of policy, system,
market environment, investment, personnel.
1. Lack of strong policy support. China is on the initial stage of coal bed methane industry,
especially for abandoned mine methane develop, therefore, government needs to set up more
rigorous policy support to encourage its development.

Methane Emissions from Abandoned Coal Mines in China Page 13
2. CBM development rights and coal mining rights over lap. According to Chinese Mineral
Resources Law, coal firms who obtain coal mining right in a CBM area are not allowed to
conduct surface CBM exploitation. Separation of these two rights constrains CBM development.
3. CBM utilization is restricted due to some reasons: no affiliated transit pipeline in the CBM
exploitation area, which makes it difficult to get into market and increases cost; on-grid price for
gas power generation is too low to get profit for power generation company; lack of safety
management criterion, lack of standard and supervision regulations of CMM utilization; lack of
concerns on environmental pollution.
4. CMM needs large capital investment; therefore, more investment channels need to be opened.
5. CBM/CMM prospecting and exploitation personnel are from the coal, oil and geological sectors
with different background and skills. Professional technical training and management training
needs to be provided to these technical teams.
4.4 Local Coal Mine Methane Policies The CBM reserves of Shanxi amounts to 10 trillion cubic meters, accounting for 1/3 of the total CBM
reserves in China. Five of six major coal mines (except Datong Coal Mine) in Shanxi are all identified to
be gassy mines, where the Qinshui coal mine and Hedong Coal mine with CBM reserves of 6.85 trillion
m3 and 2.84 trillion m3, respectively, rank top two. The reserves of these two mines account for 93.26
of the total CBM reserves of Shanxi province.
The 11th Five-year Plan of Shanxi for the CBM/Natural Gas Sector describes the prospects for the
development of CBM/natural gas sector in Shanxi. It is reported that methane emissions associated with
coal production was about 6 billion m3 every year in Shanxi, whereas the CBM/CMM utilization was less
than 0.5 billion m3 every year, only 1/12 of the emission amount.
Table 7: List of key policies and regulations in Shanxi
Name Effective Date Issuing Authority
The 11th
Five-year Plan of Shanxi for the CBM/Natural Gas Sector Mar 2007 Shanxi NDRC
Based on the market research, the demand for CBM/CMM is estimated to be 5.05 billion m3 by 2010
and 7.2 billion m3 by 2020. During the 11th five-year period, Shanxi is planning to develop four
CBM/CMM bases including Qinnan, Yangquan, Daning-Jixian, and Baode, with expected annual
CBM/CMM drainage and utilization volume to be 6 billion m3 and 5 billion m3 by 2010, respectively. The
Plan specifics that, during the 11th five-year plan period, Shanxi will invest RMB 11 billion for surface
CBM extraction with expected annual output of 4.5 billion m3 and RMB 980 million for underground
CMM drainage with expected annual output of 1.55 billion m3. In addition, the local government is
proposing to construct 7 new gas pipeline networks with a total length of over 2000km.
Yangquan Mining Group has the first AMM scheme in China at their #4 mine. Preliminary studies are
underway. According to the Plan, the Group is going to further invest RMB 100 million for AMM project
during the 11th five-year period and aims to realize an annual AMM output of 50 million m3 by 2010.

Methane Emissions from Abandoned Coal Mines in China Page 14
5. Selection of the Area of Study The greater Qinshui coal basin of Shanxi province was selected because:
Most of the coal mined is high gas content anthracite and coking coal
There has been a long history of coal mining and hence a large number of abandoned mines
There is a high concentration of coalmines.
It has numerous active mine methane capture and utilization projects which could provide
operational expertise for AMM projects
It has an active CBM industry so an experienced drilling industry is present
The coal is known to have relatively good permeability for such high quality hard coal
It has a fairly well established gas distribution infrastructure
The Mayor of the prefecture city of Jincheng had expressed significant interest in the potential
of AMM projects in the city area
6. Analysis Approach and Data Acquisition Our approach to estimating the methane resource available for use and probable rate of recovery of
that resource is based on a combination of gas material balance and emission rate calculations. The
material balance calculations are based on:
1. Original volume of methane in place (OMIP)
2. The amount of methane liberated during active mining (MLM)
3. The amount of gas emitted to the atmosphere post mining (during abandonment) to the
present time (MEPM)
So the estimated volume of methane resource remaining in the system (VMR, m3) is
VMR = OMIP – MLM – MEPM
In order to perform the necessary calculations the following data is needed
Regional data:
Percent methane in the coal gas (%CH4)
Langmuir volume (VL, m3/tonne of coal)
Langmuir pressure (PL, MPa)
The total coal thickness (Including the mined seam) in the region within 160 to 200 meters
above and 40 to 70 meters below the mined seam (HTC, m)
Mine specific data:
The thickness of the mined seam (HMS, m)
Year of initial coal production
Year of mine closure

Methane Emissions from Abandoned Coal Mines in China Page 15
Mined area (A, m2)
Total coal produced over the life of the mine (CR, tonne)
Original gas content of the coal (GC, m3/tonne)
Geographic location of the shaft
The Regional data was obtained from the reference book “Shanxi CBM Resources Evaluation,
Development and Utilization” (Shanxi CBM Industrial Association and Shanxi Fenwei Energy Consulting
CO, Ltd., 2007).
The mine specific data was obtained from various government offices by Shanxi Fenwei Energy
Consulting Co, Ltd.
6.1 Original Methane In-Place The parameters used to determine this value are
The total coal thickness within 160 to 200 meters above and 40 to 70 meters below the mined
seam. Methane contained in coals within this zone may contribute to mine emissions where
longwall mining is performed (HTC, m)
Mining area. This is determined as the mine boundary upon completion of mining (A, m2)
Gas content expressed as normal (standard) cubic meters of gas adsorbed within one tonne of
coal. This is determined through an experimental process (GC, m3/tonne)
Percent methane in the coal seam gas (%CH4)
OMIP = HTC x A x GC x %CH4
6.2 Methane Liberated During Mining The amount of methane liberated during mining includes methane ventilated and drained from the
mine during operations. This includes methane contained in the coal that was removed as well as
methane that entered the mine workings from above and below the mined seam. This is generally a
measured value and is often reported as “specific” (or “relative”) emissions which is a function of coal
production.
Specific emissions (SE, m3/tonne of coal mined)
Tonne of coal mined over the life of the mine or coal recovered (CR, tonne)
MLM = CR x SE
If a credible value of specific emissions is not available an empirical relationship between the total coal
thickness (HTC), the thickness of the mined seam (HMS) and the original gas content can be used to
estimate the specific emissions.
SE = GC x (1.5 + LN(HTC / HMS))
This relationship takes into account the diminishing contribution of gas from coal remote from the
mined seam.

Methane Emissions from Abandoned Coal Mines in China Page 16
6.3 Methane Emitted Post Mining This is the volume of methane that is estimated to have been emitted to the atmosphere after mine
closure. This is a function of the average methane emission rate over the life of the mine, the adsorption
pressure at closure and the time since closure. A decay function was generated based on the adsorption
isotherm of the coal.
6.4 Average Emission Rate Average emission rate (ERAVG, m3/day)
Days of operation (TOP, days)
ERavg = MLM/TOP
6.5 Adsorption Pressure Knowing the adsorption isotherm of a coal; that is the methane storage capacity of the coal as a
function of pressure, allows the calculation of the adsorption pressure if the volume of methane and
mass of coal remaining in the system at closure has been determined.
Methane at abandonment (VMA, m3)
VMA = OMIP – GLM
Coal remaining at abandonment (CRIP, tonnes)
Density of coal (CDEN, tonne/m3)
CRIP = HTC x A x CDEN - CR
Adsorption pressure at abandonment (PAA, MPa)
Langmuir Pressure, experimentally derived (PL, MPa)
Langmuir Volume, experimentally derived (VL, m3/tonne of coal)
PAA = VMA x PL / (VL x CRIP - VMA)
6.6 Decay Function Methane flow through coal can be approximated by general rules of fluid flow through porous media.
For linear flow of an incompressible liquid, Darcy's law is of the form
q = (kA/µ)(dp/dl)
q = volumetric rate in cm3/sec
k = permeability in Darcys
A = the cross-sectional area perpendicular to flow in cm2
µ = the viscosity of the fluid in centipoises
dp/dl = the change in pressure per unit length or pressure gradient in atm/cm

Methane Emissions from Abandoned Coal Mines in China Page 17
The form of Darcy’s law must be modified for gases, for which both viscosity and volume are functions
of pressure. Key parameters for determining gas flow through a porous medium such as a coal mine
include the following:
Permeability, k, a property of the porous media (coal cleat system) plays a major role in the rate
at which gas can flow from the coal into the void space of the abandoned mine. Unfortunately,
measurements of the absolute permeability of coal are scarce.
The area, A, across which gas moves from the coal into the void space can be very large because
of the large areas of exposed coal in an underground mine. Determining the coal's surface area
in an abandoned mine is not feasible.
The partial pressure of methane in the mine void remains at or near atmospheric. The pressure
gradient from the coal to the void space of the mine decreases over time as the gas is released
and the pressure in the coal seam is reduced. As a result, the emissions rate from an abandoned
mine decreases over time.
Gas production from oil and gas wells is predicted using Darcy's Law together with material balance
equations. In this context, the well acts as a material sink whose rate of withdrawal (q) is a function of
the difference between a specified pressure at the well, (Pw), and the pressure at some outside
boundary of the gas reservoir (Pr). For a gas, this function takes the following form:
q = PI (Pw2 - Pr2)n
q = volumetric rate of gas production
Pw = pressure at the well
Pr = pressure of the gas reservoir
PI = Productivity Index
n = empirically derived exponent that accounts for turbulent flow in this case all flow is laminar
so n = 1
This equation is Darcy’s law, modified for a gas and combining the permeability of the rock, the viscosity
of the gas, the geometry and configuration of the pressure sink and outside gas reservoir, and the
thickness of the flow unit into the productivity index (PI) term.
By analogy, the coal mine and its connection to the atmosphere (via the vent shaft or overburden
fracture conduit) acts as the wellbore, and the coal within and peripheral to the mine is the reservoir of
the stored methane. The PI can be considered a constant at the low pressures involved in an abandoned
mine system.
To determine the PI of a coal mine the above equations can be reconfigured to:
PI = ERavg / PAA2
PAA is the methane adsorption pressure at abandonment. The Pw term is assumed zero because the
partial pressure of methane in the atmosphere is essentially zero.

Methane Emissions from Abandoned Coal Mines in China Page 18
Assuming PI to be constant we can now calculate the emission rate through time for the mine
Methane remaining at year (i), (VMA(i), m3)
Methane adsorption pressure at year (i), (PAA(i), MPa)
Emission rate for year (i), (ER(i), m3/year)
VMA(i) = VMA(i-1) – ER(i-1)
PAA(i) = VMA(i) x PL / (VL x CRIP - VMA(i))
ER(i) = PI x PAA(i)2
This results in a decay function (or decline curve) as shown in Figure 1.
Figure 1: Methane emission rate decline after closure
7. Gas Region Specific Data There are six coalfields in Shanxi province; Datong, Ningwu, Hedong, Xishan, Huozhou and Qinshui.
Mining in the Datong and Ningwu is primarily in the low gas content Datong group which consists of Mid
Jurassic and Lower Tertiary sediments. Mining in the Hedong, Xishan, Huoxi and Qinshui coalfields is
primarily in the high gas content coals of the Taiyuan group and Shanxi group of Permo-Carboniferous
age. The mines selected for this study are within the Hedong, Huozhou, Xishan and Qinshui coalfields.
Within each coalfield there are discreet gas regions defined by structural lines such as fault zones and
anticlines. The gas bearing characteristics and the thickness of the coal measures vary by region and are
described in the reference book “Shanxi CBM Resources Evaluation, Development and Utilization” as
previously cited.
0
5,000,000
10,000,000
15,000,000
20,000,000
25,000,000
0 20 40 60 80 100 120
m3/y
ear
Years since closure
阳泉一矿黄石板平峒
Huangshiban Portal of Yangquan #1 Mine

Methane Emissions from Abandoned Coal Mines in China Page 19
Figure 2 shows the coal fields and gassy mines (relative emissions greater than 10 m3/tonne mined) of
Shanxi province. The mining is restricted to the margins of the coal basins where the coal is relatively
shallow. Most of the mines are less than 600 meters deep with some between 600 and 1000 meters.
Basin center depths to coal range up to 2,000 meters.
Because the total coal thickness in each gas region contributes to the mines gas emissions the seam
specific values for gas composition and adsorption characteristics were averaged for use in the
calculations.
7.1 Qinshui Coalfield The Qinshiu coalfield is the largest structural coal basin in southeastern Shanxi province and includes the
Dongshe, Jiebei, Lindong, Shouping, Heshun, Wuxiang, Huodong, and Qinnan gas regions (Figure 3).
Mines in the Shouping and Qinnan regions were targeted because of the high density of gassy mines in
the area as shown in Figure 2. Anthracite is the primary coal type produced. The Shouping and Qinnan
gas regions have similar coal measure thickness and gas composition but different adsorption
characteristics
7.2 Shouping Gas Region The mines selected in the Shouping gas region are all within the prefecture city of Yangquan, a highly
developed coal mining area in the northeast of the Qinshui coal basin. This area has numerous active
mine methane drainage projects underway. Of the eleven mines selected in the Shouping gas region six
mined the #3 seam, two mined the #12 seam and three mined the #15 seam.
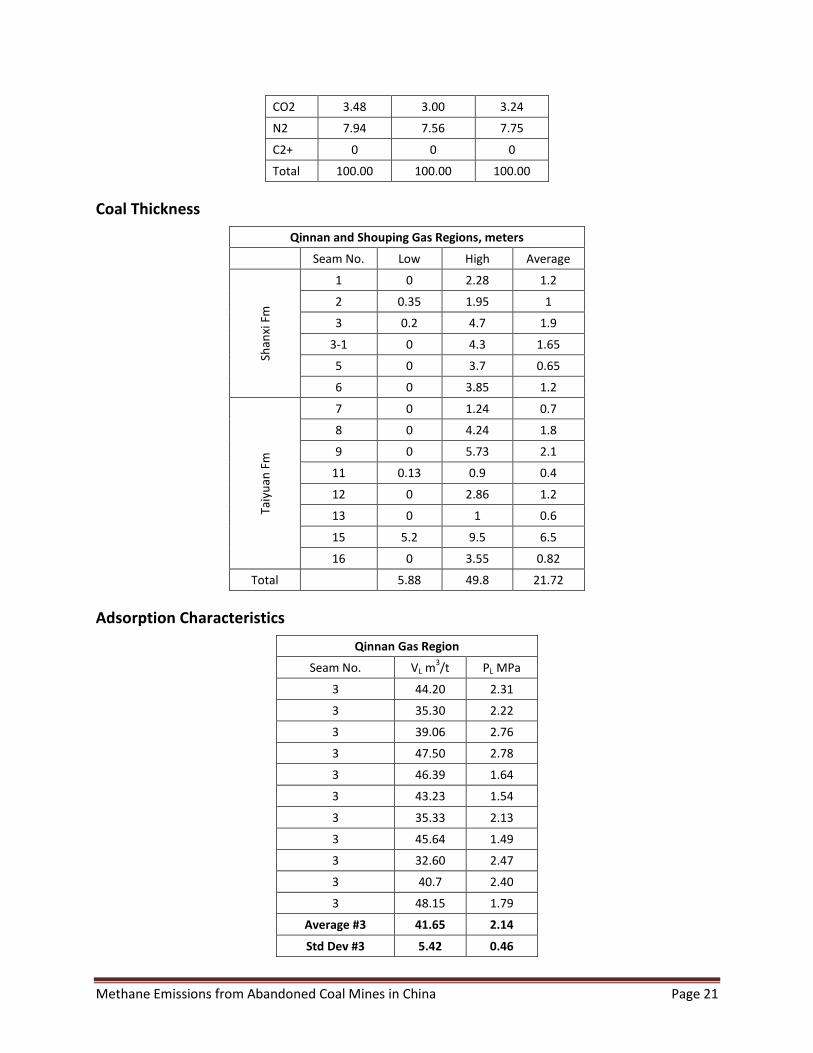
Gas Composition
Shouping and Qinnan Gas Regions
#3 Seam #15 Seam Average
CH4 88.58 89.44 89.01
CO2 3.48 3.00 3.24
N2 7.94 7.56 7.75
C2+ 0 0 0
Total 100.00 100.00 100.00
Coal Thickness
Qinnan and Shouping Gas Regions, meters
Seam No. Low High Average
Shan
xi F
m
1 0 2.28 1.2
2 0.35 1.95 1
3 0.2 4.7 1.9
3-1 0 4.3 1.65
5 0 3.7 0.65
6 0 3.85 1.2

Methane Emissions from Abandoned Coal Mines in China Page 20
Taiy
uan
Fm
7 0 1.24 0.7
8 0 4.24 1.8
9 0 5.73 2.1
11 0.13 0.9 0.4
12 0 2.86 1.2
13 0 1 0.6
15 5.2 9.5 6.5
16 0 3.55 0.82
Total
5.88 49.8 21.72
Adsorption Characteristics
Shouping and Xingjiashe Gas Regions
Seam No. VL m3/t PL MPa
3 31.28 1.85
3 37.16 2.78
3 37.10 2.78
3 24.81 1.93
Average #3 32.59 2.34
Std Dev #3 5.09 0.45
15 29.45 1.00
15 32.67 1.98
15 31.54 2.21
15 36.11 2.22
15 41.29 1.25
Average #15 34.21 1.73
Std Dev #15 4.14 0.51
Average All 33.49 2.00
Std Dev All 4.94 0.60
7.3 Qinnan Gas Region The mines selected in the Qinnan gas region are all within the prefecture city of Jincheng, also a highly
developed coal mining area in the southeast of the Qinshui coal basin. This area also has numerous
active mine methane drainage projects underway. Of the seventeen mines selected in the Qinnan gas
region fourteen mined the #3 seam, one mined the #3, #9 and #15 seams and two mined the #9 and #15
seams.
Gas Composition
Shouping and Qinnan Gas Regions
#3 Seam #15 Seam Average
CH4 88.58 89.44 89.01
Methane Emissions from Abandoned Coal Mines in China Page 21
CO2 3.48 3.00 3.24
N2 7.94 7.56 7.75
C2+ 0 0 0
Total 100.00 100.00 100.00
Coal Thickness
Qinnan and Shouping Gas Regions, meters
Seam No. Low High Average
Shan
xi F
m
1 0 2.28 1.2
2 0.35 1.95 1
3 0.2 4.7 1.9
3-1 0 4.3 1.65
5 0 3.7 0.65
6 0 3.85 1.2
Taiy
uan
Fm
7 0 1.24 0.7
8 0 4.24 1.8
9 0 5.73 2.1
11 0.13 0.9 0.4
12 0 2.86 1.2
13 0 1 0.6
15 5.2 9.5 6.5
16 0 3.55 0.82
Total
5.88 49.8 21.72
Adsorption Characteristics
Qinnan Gas Region
Seam No. VL m3/t PL MPa
3 44.20 2.31
3 35.30 2.22
3 39.06 2.76
3 47.50 2.78
3 46.39 1.64
3 43.23 1.54
3 35.33 2.13
3 45.64 1.49
3 32.60 2.47
3 40.7 2.40
3 48.15 1.79
Average #3 41.65 2.14
Std Dev #3 5.42 0.46

Methane Emissions from Abandoned Coal Mines in China Page 22
9 43.76 3.57
9 43.05 1.61
Average #9 43.41 2.59
Std Dev #9 0.50 1.39
15 51.80 2.19
15 49.60 2.95
15 38.31 2.19
15 35.40 2.39
15 50.40 2.31
Average #15 45.10 2.41
Std Dev #15 7.64 0.32
Average All 42.80 2.26
Std Dev All 5.79 0.54
7.4 Xishan Coalfield The Xishan coalfield lies to the northwest of the Qinshui coalfield and includes the Gujiao and Xingjiashe
gas regions. Anthracite is the primary coal type produced.
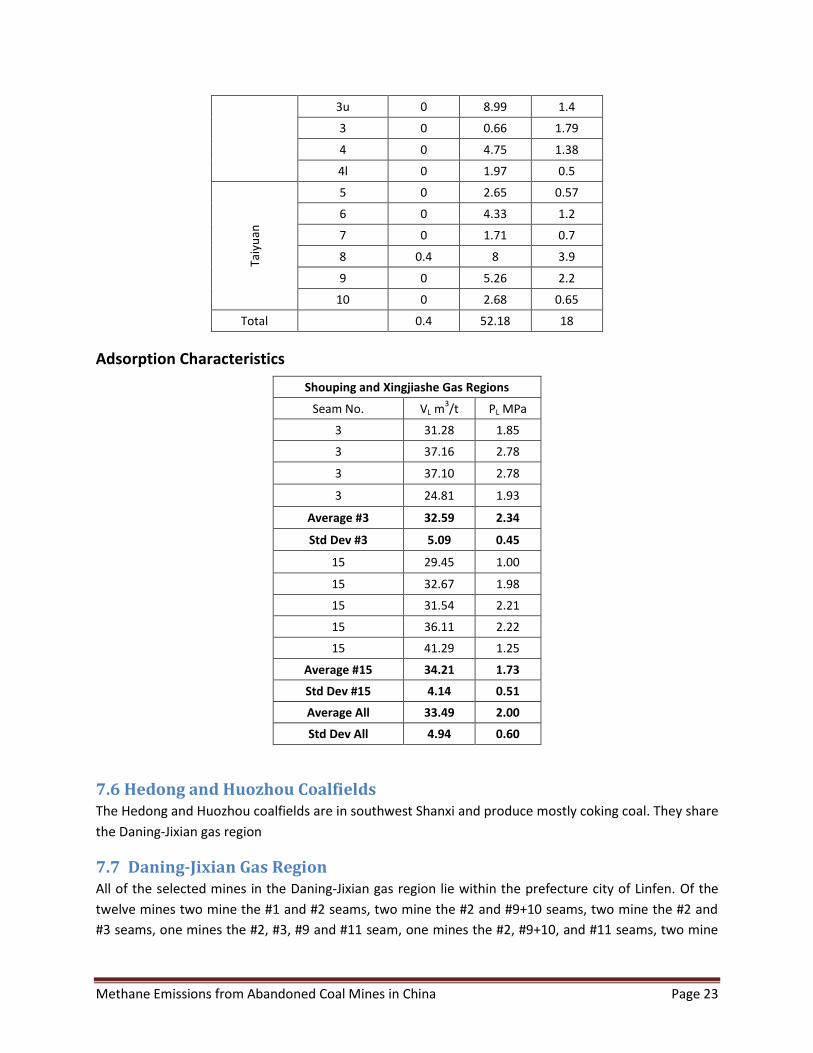
7.5 Xingjiashe Gas Region The Xingjiashe gas region is in the northern portion of the Xishan coalfield and the mines selected here
all lie within the prefecture city of Taiyuan which is also the provincial capital of Shanxi. The Xingjiashe
gas region shares adsorption characteristics with the Shouping gas region. Of the four mines selected in
the this gas region two mined the #2, one mined the #3 and one mined the #2, #8 and #9 seams.
Gas Composition
Xingjiashe Gas Region
#2 Seam #8 Seam #9 Seam Average
CH4 84.11 82.41 79.33 81.95
CO2 5.13 7.96 4.52 5.87
N2 5.76 4.63 11.15 7.18
C2+ 5.00 5.00 5.00 5
Total 100.00 100.00 100.00 100.00
Coal Thickness
Xingjiashe Gas Region, meters
Seam Low High Average
Shan
xi F
m
02 0 2.6 0.81
03 0 2.6 0.6
2 0 5.98 2.3
Methane Emissions from Abandoned Coal Mines in China Page 23
3u 0 8.99 1.4
3 0 0.66 1.79
4 0 4.75 1.38
4l 0 1.97 0.5
Taiy
uan
5 0 2.65 0.57
6 0 4.33 1.2
7 0 1.71 0.7
8 0.4 8 3.9
9 0 5.26 2.2
10 0 2.68 0.65
Total
0.4 52.18 18
Adsorption Characteristics
Shouping and Xingjiashe Gas Regions
Seam No. VL m3/t PL MPa
3 31.28 1.85
3 37.16 2.78
3 37.10 2.78
3 24.81 1.93
Average #3 32.59 2.34
Std Dev #3 5.09 0.45
15 29.45 1.00
15 32.67 1.98
15 31.54 2.21
15 36.11 2.22
15 41.29 1.25
Average #15 34.21 1.73
Std Dev #15 4.14 0.51
Average All 33.49 2.00
Std Dev All 4.94 0.60
7.6 Hedong and Huozhou Coalfields The Hedong and Huozhou coalfields are in southwest Shanxi and produce mostly coking coal. They share
the Daning-Jixian gas region
7.7 Daning-Jixian Gas Region All of the selected mines in the Daning-Jixian gas region lie within the prefecture city of Linfen. Of the
twelve mines two mine the #1 and #2 seams, two mine the #2 and #9+10 seams, two mine the #2 and
#3 seams, one mines the #2, #3, #9 and #11 seam, one mines the #2, #9+10, and #11 seams, two mine

Methane Emissions from Abandoned Coal Mines in China Page 24
the #2, #3, #7, and #10 seams and two mine the #2 and #9 seams. The mines in this gas region tend to
be smaller and in a less developed mining area. These coals also appear to have unusually high ethane
content for coal seam gas.
Gas Composition
Daning-Jixian Gas Region
#4 Seam #5 Seam #8 Seam #9 Seam Average
CH4 92.72 92.07 89.99 92.16 91.74
CO2 2.47 2.87 3.13 3.66 3.03
N2 0.03 0.22 0.04 0.10 0.10
C2+ 4.78 4.84 6.84 4.08 5.14
Total 100.00 100.00 100.00 100.00 100.00
Coal Thickness
Daning-Jixian Gas Region, meters
Seam Low High Average
Shan
xi F
m 1 0.1 2.3 0.56
2 0.1 2.31 0.77
3 0 2.1 1.36
4 0.7 6.5 4.5
Taiy
uan
Fm
5 0 1.6 0.8
8 0 2.7 1.14
9 0 5 1.6
10 0.7 7 3.5
Total 1.6 29.51 14.23
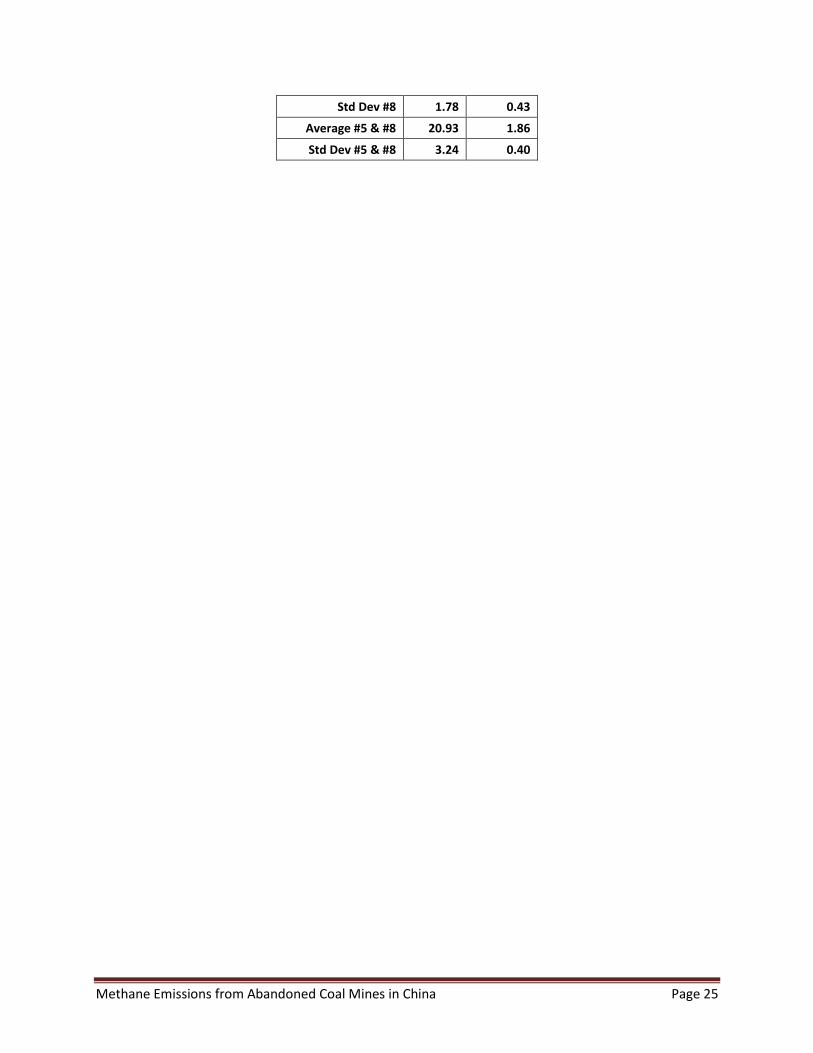
Adsorption Characteristics
Daning-Jixian Gas Region
Seam No. VL m3/t PL MPa
5 19.16 1.63
5 22.94 2.19
5 26.68 2.17
5 22.99 2.01
Average #5 22.94 2.00
Std Dev #5 2.66 0.22
8 19.93 2.16
8 16.29 2.12
8 21.04 1.34
8 18.43 1.22
Average #8 18.92 1.71
Methane Emissions from Abandoned Coal Mines in China Page 25
Std Dev #8 1.78 0.43
Average #5 & #8 20.93 1.86
Std Dev #5 & #8 3.24 0.40

Methane Emissions from Abandoned Coal Mines in China Page 26
Figure 2:

Qinnan Gas Region
Shouping Gas Region
Xingjiashe Gas Region
Daning-Jixian Gas Region
Figure 3:
Methane Emissions from Abandoned Coal Mines in China Page 28
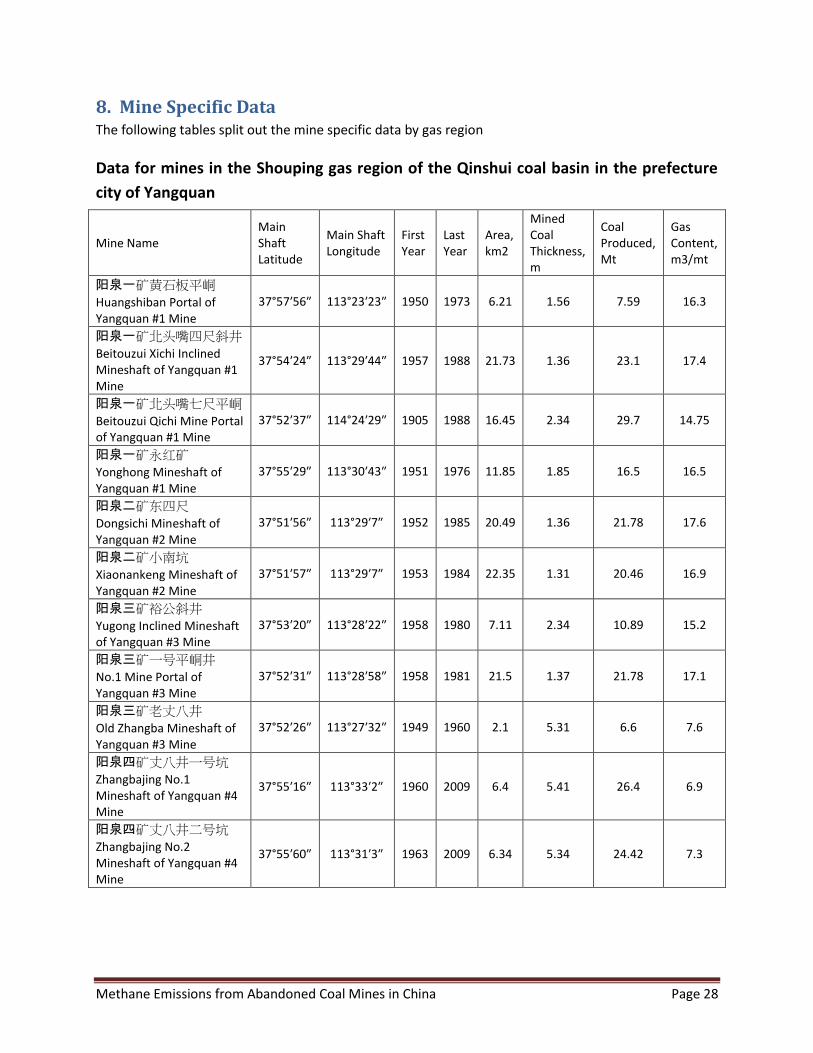
8. Mine Specific Data The following tables split out the mine specific data by gas region
Data for mines in the Shouping gas region of the Qinshui coal basin in the prefecture
city of Yangquan
Mine Name Main Shaft Latitude
Main Shaft Longitude
First Year
Last Year
Area, km2
Mined Coal Thickness, m
Coal Produced, Mt
Gas Content, m3/mt
阳泉一矿黄石板平峒
Huangshiban Portal of Yangquan #1 Mine
37°57′56″ 113°23′23″ 1950 1973 6.21 1.56 7.59 16.3
阳泉一矿北头嘴四尺斜井
Beitouzui Xichi Inclined Mineshaft of Yangquan #1 Mine
37°54′24″ 113°29′44″ 1957 1988 21.73 1.36 23.1 17.4
阳泉一矿北头嘴七尺平峒
Beitouzui Qichi Mine Portal of Yangquan #1 Mine
37°52′37″ 114°24′29″ 1905 1988 16.45 2.34 29.7 14.75
阳泉一矿永红矿
Yonghong Mineshaft of Yangquan #1 Mine
37°55′29″ 113°30′43″ 1951 1976 11.85 1.85 16.5 16.5
阳泉二矿东四尺
Dongsichi Mineshaft of Yangquan #2 Mine
37°51′56″ 113°29′7″ 1952 1985 20.49 1.36 21.78 17.6
阳泉二矿小南坑
Xiaonankeng Mineshaft of Yangquan #2 Mine
37°51′57″ 113°29′7″ 1953 1984 22.35 1.31 20.46 16.9
阳泉三矿裕公斜井
Yugong Inclined Mineshaft of Yangquan #3 Mine
37°53′20″ 113°28′22″ 1958 1980 7.11 2.34 10.89 15.2
阳泉三矿一号平峒井
No.1 Mine Portal of Yangquan #3 Mine
37°52′31″ 113°28′58″ 1958 1981 21.5 1.37 21.78 17.1
阳泉三矿老丈八井
Old Zhangba Mineshaft of Yangquan #3 Mine
37°52′26″ 113°27′32″ 1949 1960 2.1 5.31 6.6 7.6
阳泉四矿丈八井一号坑
Zhangbajing No.1 Mineshaft of Yangquan #4 Mine
37°55′16″ 113°33′2″ 1960 2009 6.4 5.41 26.4 6.9
阳泉四矿丈八井二号坑
Zhangbajing No.2 Mineshaft of Yangquan #4 Mine
37°55′60″ 113°31′3″ 1963 2009 6.34 5.34 24.42 7.3

Methane Emissions from Abandoned Coal Mines in China Page 29
Data for mines in the Xingjiashe gas region of the Xishan coal basin in the prefecture
city of Taiyuan
Mine Name Main Shaft
Latitude
Main Shaft Longitude
First Year
Last Year
Area, km2
Mined Coal
Thickness, m
Coal Produced,
Mt
Gas Content, m3/mt
西山煤电白家庄松树坑井
Baijiazhuang Songshu Coal Mine of Xishan Coal Electricity Group
37°57′10″ 112°35′24″ 1971 2002 5.35 3.6 14.85 9.6
太原煤气化长沟矿
Changgou Coal Mine 37°57′11″ 112°35′23″ 1998 2009 9.57 3.4 24 9.8
太原市平口矿
Pingkou Coal Mine 37°7′7″ 112°17′29″ 1956 2009 2.56 6.3 12.01 9.6
太原市桑树洼矿
Sangshuwa Coal Mine 37°39′15″ 112°10′55″ 1959 2009 4.8 3.41 11.32 9.5
Data for mines in the Qinnan gas region of the Qinshui coal basin in the prefecture city
of Jincheng
Mine Name
Main Shaft
Latitude
Main Shaft Longitude
First Year
Last Year
Area, km2
Mined Coal
Thickness, m
Coal Produced
Mt
Gas Content m3/mt
卧庄煤矿
Wozhuang Coal Mine 35°31′10″ 112°23′50″ 1955 2005 3.78 8.21 21.45 11.68
上孔煤矿义城坑口
Shangkong Yicheng Coal Mine
35°32′41″ 112°29′27″ 1995 2008 1.3 5.09 3.78 15.3
上孔煤矿上孔坑口
Shangkong Coal Mine 35°30′15″ 112°29′44″ 1971 2004 1.3 5.05 4.36 11.35
屯城煤矿
Tuncheng Coal Mine 35°31′47″ 112°31′37″ 1995 2007 1.3 5.14 4.62 11.65
申家庄矿上伏坑口
Shenjiazhuang Shangfu Coal Mine
35°54′60″ 112°53′50″ 1952 2008 4.95 5.3 18.48 15.2
申家庄矿段家沟坑口
Shenjiazhuang Duanjiagou Coal Mine
35°52′28″ 112°56′12″ 1952 2006 1.6 5.24 5.35 11.8
万山矿
Wanshan Coal Mine 35°40′32″ 112°13′22″ 1954 2002 2.38 5.11 7.92 11.9
祥和矿一号井
Xianghe Coal Mine #1 Mineshaft
35°34′44″ 111°9′20″ 1999 2008 0.8 4.84 1.8 14.1

Methane Emissions from Abandoned Coal Mines in China Page 30
七岭煤矿
Qiling Coal Mine 35°31′13″ 111°22′37″ 1998 2008 1.83 2.89 3.36 15.97
天户煤矿
Tianhu Coal Mine 35°32′18″ 111°9′57″ 1958 1989 4.8 5.16 16.74 11.78
牛山煤矿
Niushan Coal Mine 35°33′2″ 111°18′52″ 1958 2000 5.1 5.41 18.9 12.1
庄头煤矿
Zhuangtou Coal Mine 35°31′54″ 112°20′38″ 1956 1999 5.6 5.01 19.35 12.3
云泉煤矿
Yunquan Coal Mine 35°50′14″ 112°21′13″ 1954 1998 8.6 5.01 29.7 11.9
高良煤矿
Gaoliang Coal Mine 35°52′17″ 112°49′53″ 1962 1992 3.8 5.22 13.5 11.6
游仙山煤矿
Youxianshan Coal Mine 35°51′46″ 113°5′9″ 1952 1989 4.9 5.03 16.65 12.4
西沟煤矿
Xigou Coal Mine 35°32′3″ 112°22′7″ 1970 1993 7.8 2.95 15.53 16.3
伏岩山煤矿
Fuyanshan Coal Mine 35°38′10″ 112°17′32″ 1962 1986 3.2 5.04 10.8 11.84
Data for mines in the Daning-Jixian gas region of the Huozhou-Hedong coal basin in
the prefecture city of Linfen
Mine Name
Main Shaft
Latitude
Main Shaft Longitude
First Year
Last Year
Area, km2
Mined Coal Thickness,
m
Coal Produced,
Mt
Gas Content m3/mt
许村矿许村坑口
Xucun Coal Mine 35°37′47″ 111°40′43″ 1981 1998 5.9 2.94 11.48 13.33
许村矿老虎吉坑
Xucun Laohuji Coal Mine 35°37′43″ 111°40′37″ 1981 2000 4.2 2.93 8.55 13.79
水地庄矿
Shuidizhuang Coal Mine 35°58′35″ 111°55′41″ 1965 2008 2.6 9.31 12.9 14.1
昱洁煤业公司
Yujie Coal Company 35°59′30″ 111°56′17″ 1956 2009 3.25 9.34 23.85 11.5
古阳矿紫树围井
Guyang Zishuwei Coal Mine
36°25′7″ 112°3′33″ 1956 2007 5.8 5.1 16.07 8.6
古阳矿安吉井
Guyang Anji Coal Mine 36°25′5″ 112°1′33″ 1956 2007 5.79 5.14 19.28 9.2
古阳矿二坑口
Guyang Erkeng Coal Mine 36°25′8″ 112°2′15″ 1956 2007 3.39 9.38 20.35 8.4
南湾煤矿
Nanwan Coal Mine 36°13′43″ 111°13′41″ 1968 2008 3.31 9.24 17.16 8.1

Methane Emissions from Abandoned Coal Mines in China Page 31
毛则渠煤矿新口
Maozequ Coal Mine New Shaft
35°47′31″ 110°42′5″ 1976 2005 2.3 6.11 7.83 7.6
毛则渠煤矿老口
Maozequ Coal Mine Old Shaft
35°49′39″ 110°42′48″ 1965 2005 1.89 7.64 8.16 8.4
康和洼煤矿
Kanghewa Coal Mine 36°44′29″ 111°28′33″ 1969 2002 2.35 6.52 9.9 7.5
下岭煤矿
Xialing Coal Mine 36°45′5″ 111°28′57″ 1970 1998 2.28 6.43 8.4 6.4
Figure 4 shows that the Shouping gas region generally has the highest in-place gas contents followed by
Qinnan, Daning-Jixian and Xingjiashe gas regions.
Figure 4: Gas content by mine for the four Shanxi gas regions investigated
0
2
4
6
8
10
12
14
16
18
20
1 2 3 4 5 6 7 8 9 10 11 12 13 14 15 16 17
Gas
Co
nte
nt m
3/t
on
ne
Gas Content by Mine for the Shanxi Gas Regions
Shouping
Xingjiashe
Qinnan
Daning-Jixian
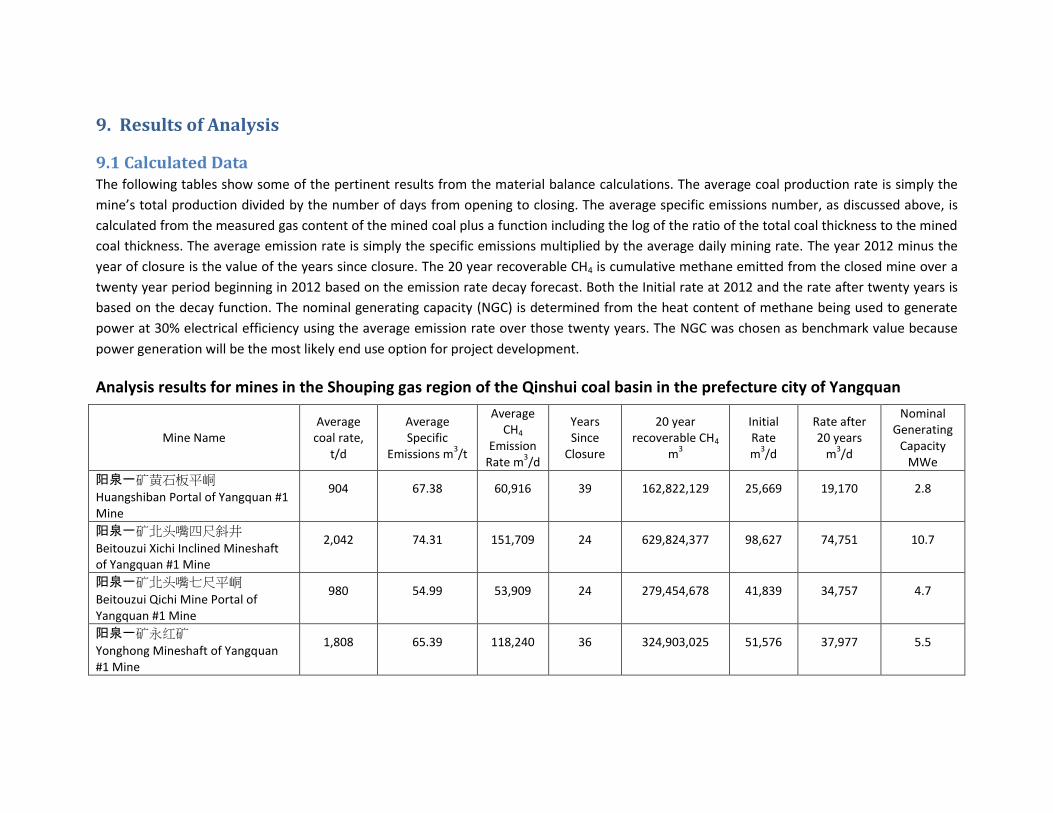
9. Results of Analysis
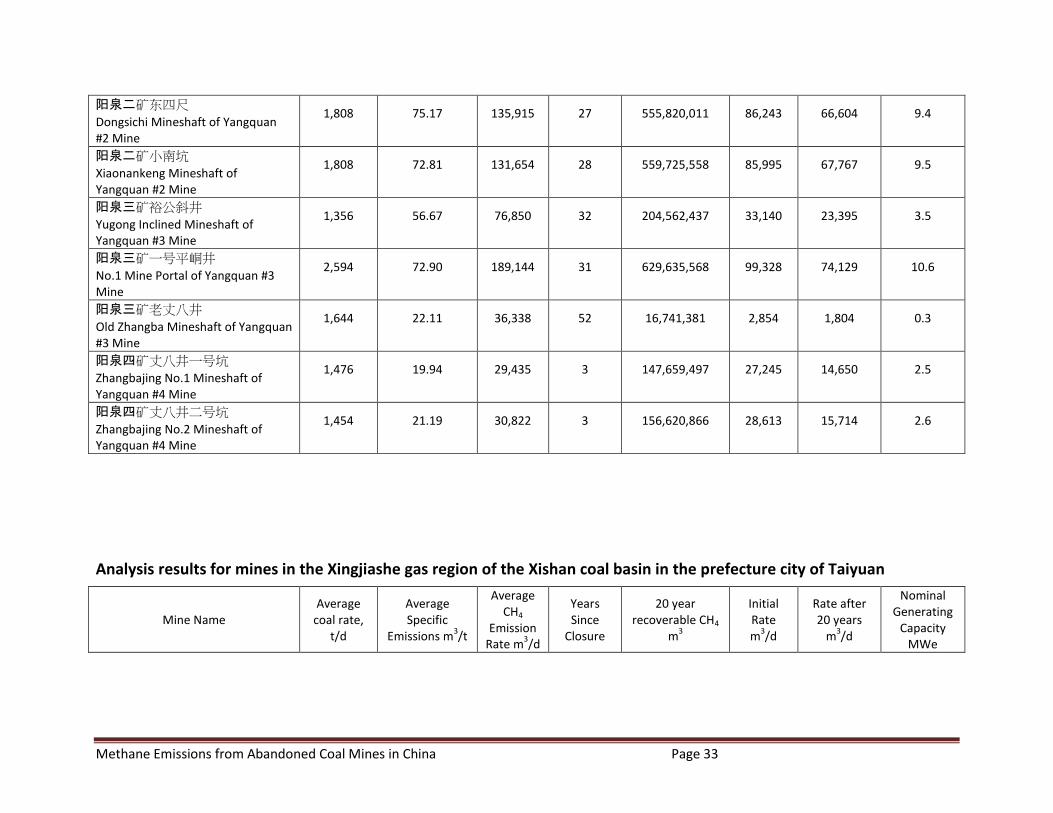
9.1 Calculated Data The following tables show some of the pertinent results from the material balance calculations. The average coal production rate is simply the
mine’s total production divided by the number of days from opening to closing. The average specific emissions number, as discussed above, is
calculated from the measured gas content of the mined coal plus a function including the log of the ratio of the total coal thickness to the mined
coal thickness. The average emission rate is simply the specific emissions multiplied by the average daily mining rate. The year 2012 minus the
year of closure is the value of the years since closure. The 20 year recoverable CH4 is cumulative methane emitted from the closed mine over a
twenty year period beginning in 2012 based on the emission rate decay forecast. Both the Initial rate at 2012 and the rate after twenty years is
based on the decay function. The nominal generating capacity (NGC) is determined from the heat content of methane being used to generate
power at 30% electrical efficiency using the average emission rate over those twenty years. The NGC was chosen as benchmark value because
power generation will be the most likely end use option for project development.
Analysis results for mines in the Shouping gas region of the Qinshui coal basin in the prefecture city of Yangquan
Mine Name Average
coal rate, t/d
Average Specific
Emissions m3/t
Average CH4
Emission Rate m
3/d
Years Since
Closure
20 year recoverable CH4
m3
Initial Rate m
3/d
Rate after 20 years
m3/d
Nominal Generating
Capacity MWe
阳泉一矿黄石板平峒
Huangshiban Portal of Yangquan #1 Mine
904 67.38 60,916 39 162,822,129 25,669 19,170 2.8
阳泉一矿北头嘴四尺斜井
Beitouzui Xichi Inclined Mineshaft of Yangquan #1 Mine
2,042 74.31 151,709 24 629,824,377 98,627 74,751 10.7
阳泉一矿北头嘴七尺平峒
Beitouzui Qichi Mine Portal of Yangquan #1 Mine
980 54.99 53,909 24 279,454,678 41,839 34,757 4.7
阳泉一矿永红矿
Yonghong Mineshaft of Yangquan #1 Mine
1,808 65.39 118,240 36 324,903,025 51,576 37,977 5.5
Methane Emissions from Abandoned Coal Mines in China Page 33
阳泉二矿东四尺
Dongsichi Mineshaft of Yangquan #2 Mine
1,808 75.17 135,915 27 555,820,011 86,243 66,604 9.4
阳泉二矿小南坑
Xiaonankeng Mineshaft of Yangquan #2 Mine
1,808 72.81 131,654 28 559,725,558 85,995 67,767 9.5
阳泉三矿裕公斜井
Yugong Inclined Mineshaft of Yangquan #3 Mine
1,356 56.67 76,850 32 204,562,437 33,140 23,395 3.5
阳泉三矿一号平峒井
No.1 Mine Portal of Yangquan #3 Mine
2,594 72.90 189,144 31 629,635,568 99,328 74,129 10.6
阳泉三矿老丈八井
Old Zhangba Mineshaft of Yangquan #3 Mine
1,644 22.11 36,338 52 16,741,381 2,854 1,804 0.3
阳泉四矿丈八井一号坑
Zhangbajing No.1 Mineshaft of Yangquan #4 Mine
1,476 19.94 29,435 3 147,659,497 27,245 14,650 2.5
阳泉四矿丈八井二号坑
Zhangbajing No.2 Mineshaft of Yangquan #4 Mine
1,454 21.19 30,822 3 156,620,866 28,613 15,714 2.6
Analysis results for mines in the Xingjiashe gas region of the Xishan coal basin in the prefecture city of Taiyuan
Mine Name Average
coal rate, t/d
Average Specific
Emissions m3/t
Average CH4
Emission Rate m
3/d
Years Since
Closure
20 year recoverable CH4
m3
Initial Rate m
3/d
Rate after 20 years
m3/d
Nominal Generating
Capacity MWe

Methane Emissions from Abandoned Coal Mines in China Page 34
西山煤电白家庄松树坑井
Baijiazhuang Songshu Coal Mine of
Xishan Coal Electricity Group
1,312 29.85 39,176 10 128,426,915 24,703 12,201 2.2
太原煤气化长沟矿
Changgou Coal Mine 5,978 31.03 185,500 3 489,626,399 140,051 30,961 8.3
太原市平口矿
Pingkou Coal Mine 621 24.48 15,197 3 62,850,231 13,377 5,360 1.1
太原市桑树洼矿
Sangshuwa Coal Mine 620 30.05 18,642 3 102,282,774 17,611 10,944 1.7
Analysis Results for mines in the Qinnan gas region of the Qinshui coal basin in the prefecture city of Jincheng
Mine Name Average
coal rate, t/d
Average Specific
Emissions m3/t
Average CH4
Emission Rate m
3/d
Years Since
Closure
20 year recoverable CH4
m3
Initial Rate m
3/d
Rate after 20 years
m3/d
Nominal Generating
Capacity MWe
卧庄煤矿
Wozhuang Coal Mine 1,175 28.88 33,948 7 129,358,454 25,105 12,173 2.2
上孔煤矿义城坑口
Shangkong Yicheng Coal Mine 797 45.15 35,967 4 115,185,736 27,186 8,969 1.9
上孔煤矿上孔坑口
Shangkong Coal Mine 362 33.58 12,156 8 49,492,891 9,106 4,935 0.8
屯城煤矿
Tuncheng Coal Mine 1,055 34.26 36,142 5 86,032,479 22,318 5,998 1.5
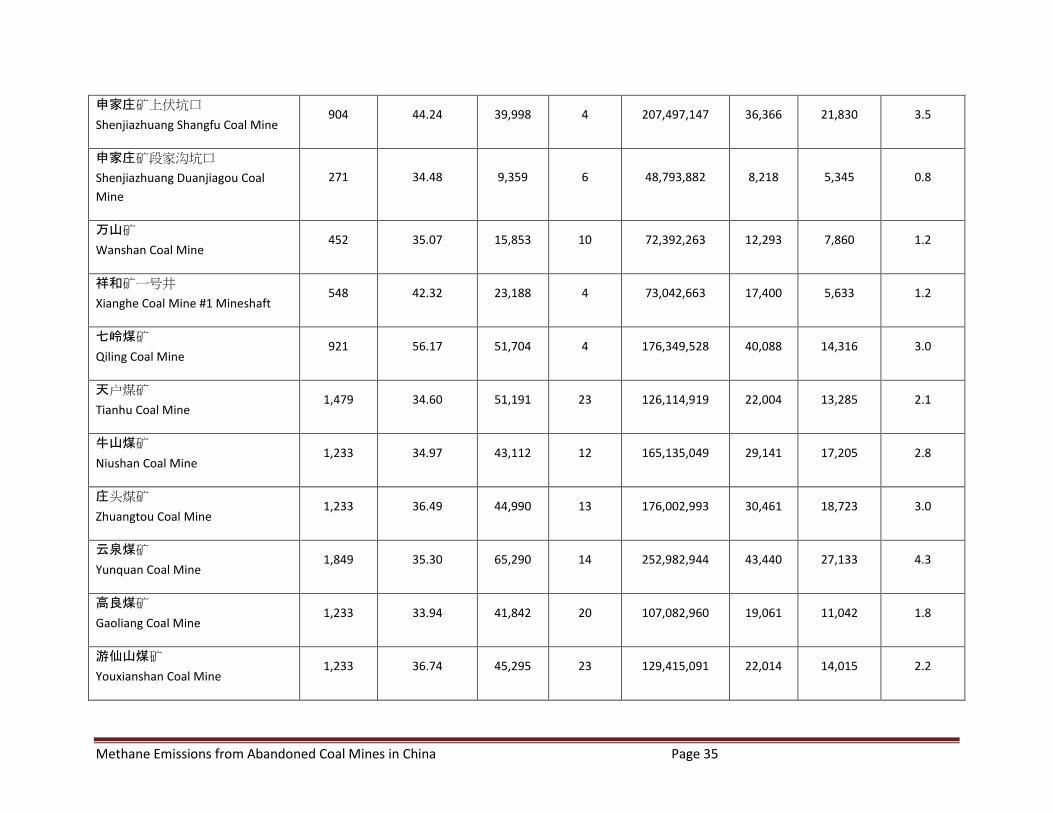
Methane Emissions from Abandoned Coal Mines in China Page 35
申家庄矿上伏坑口
Shenjiazhuang Shangfu Coal Mine 904 44.24 39,998 4 207,497,147 36,366 21,830 3.5
申家庄矿段家沟坑口
Shenjiazhuang Duanjiagou Coal
Mine
271 34.48 9,359 6 48,793,882 8,218 5,345 0.8
万山矿
Wanshan Coal Mine 452 35.07 15,853 10 72,392,263 12,293 7,860 1.2
祥和矿一号井
Xianghe Coal Mine #1 Mineshaft 548 42.32 23,188 4 73,042,663 17,400 5,633 1.2
七岭煤矿
Qiling Coal Mine 921 56.17 51,704 4 176,349,528 40,088 14,316 3.0
天户煤矿
Tianhu Coal Mine 1,479 34.60 51,191 23 126,114,919 22,004 13,285 2.1
牛山煤矿
Niushan Coal Mine 1,233 34.97 43,112 12 165,135,049 29,141 17,205 2.8
庄头煤矿
Zhuangtou Coal Mine 1,233 36.49 44,990 13 176,002,993 30,461 18,723 3.0
云泉煤矿
Yunquan Coal Mine 1,849 35.30 65,290 14 252,982,944 43,440 27,133 4.3
高良煤矿
Gaoliang Coal Mine 1,233 33.94 41,842 20 107,082,960 19,061 11,042 1.8
游仙山煤矿
Youxianshan Coal Mine 1,233 36.74 45,295 23 129,415,091 22,014 14,015 2.2
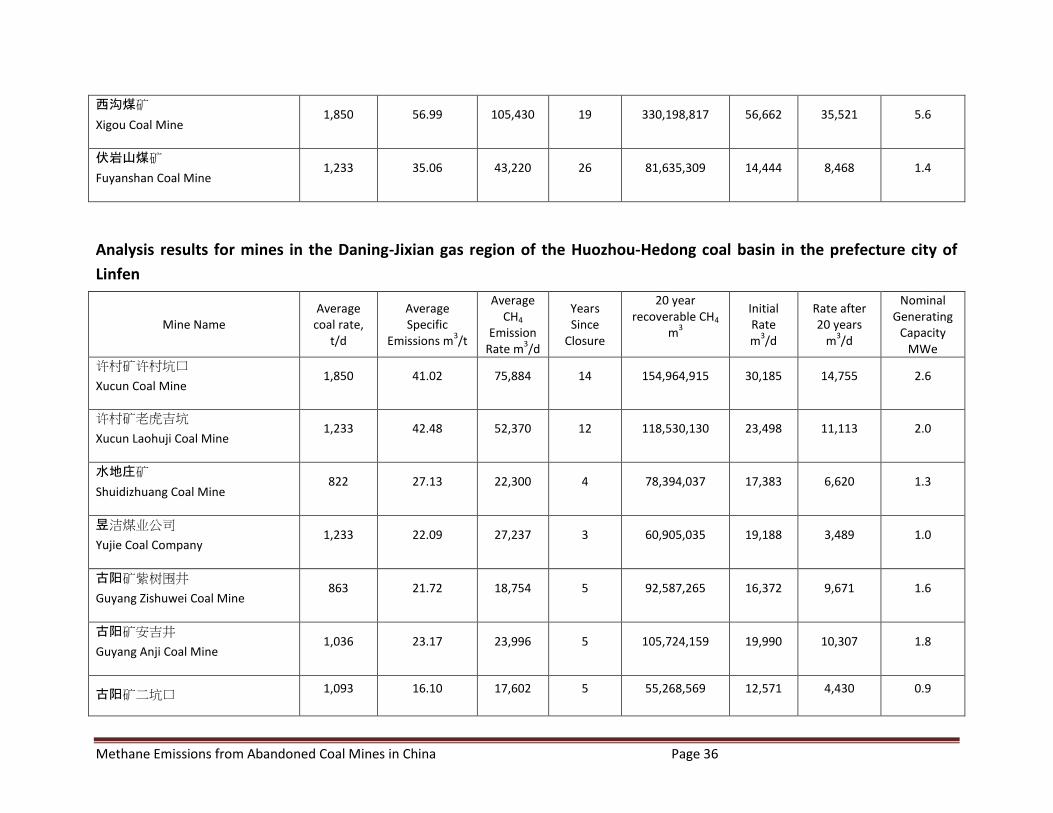
Methane Emissions from Abandoned Coal Mines in China Page 36
西沟煤矿
Xigou Coal Mine 1,850 56.99 105,430 19 330,198,817 56,662 35,521 5.6
伏岩山煤矿
Fuyanshan Coal Mine 1,233 35.06 43,220 26 81,635,309 14,444 8,468 1.4
Analysis results for mines in the Daning-Jixian gas region of the Huozhou-Hedong coal basin in the prefecture city of
Linfen
Mine Name Average
coal rate, t/d
Average Specific
Emissions m3/t
Average CH4
Emission Rate m
3/d
Years Since
Closure
20 year recoverable CH4
m3
Initial Rate m
3/d
Rate after 20 years
m3/d
Nominal Generating
Capacity MWe
许村矿许村坑口
Xucun Coal Mine 1,850 41.02 75,884 14 154,964,915 30,185 14,755 2.6
许村矿老虎吉坑
Xucun Laohuji Coal Mine 1,233 42.48 52,370 12 118,530,130 23,498 11,113 2.0
水地庄矿
Shuidizhuang Coal Mine 822 27.13 22,300 4 78,394,037 17,383 6,620 1.3
昱洁煤业公司
Yujie Coal Company 1,233 22.09 27,237 3 60,905,035 19,188 3,489 1.0
古阳矿紫树围井
Guyang Zishuwei Coal Mine 863 21.72 18,754 5 92,587,265 16,372 9,671 1.6
古阳矿安吉井
Guyang Anji Coal Mine 1,036 23.17 23,996 5 105,724,159 19,990 10,307 1.8
古阳矿二坑口 1,093 16.10 17,602 5 55,268,569 12,571 4,430 0.9
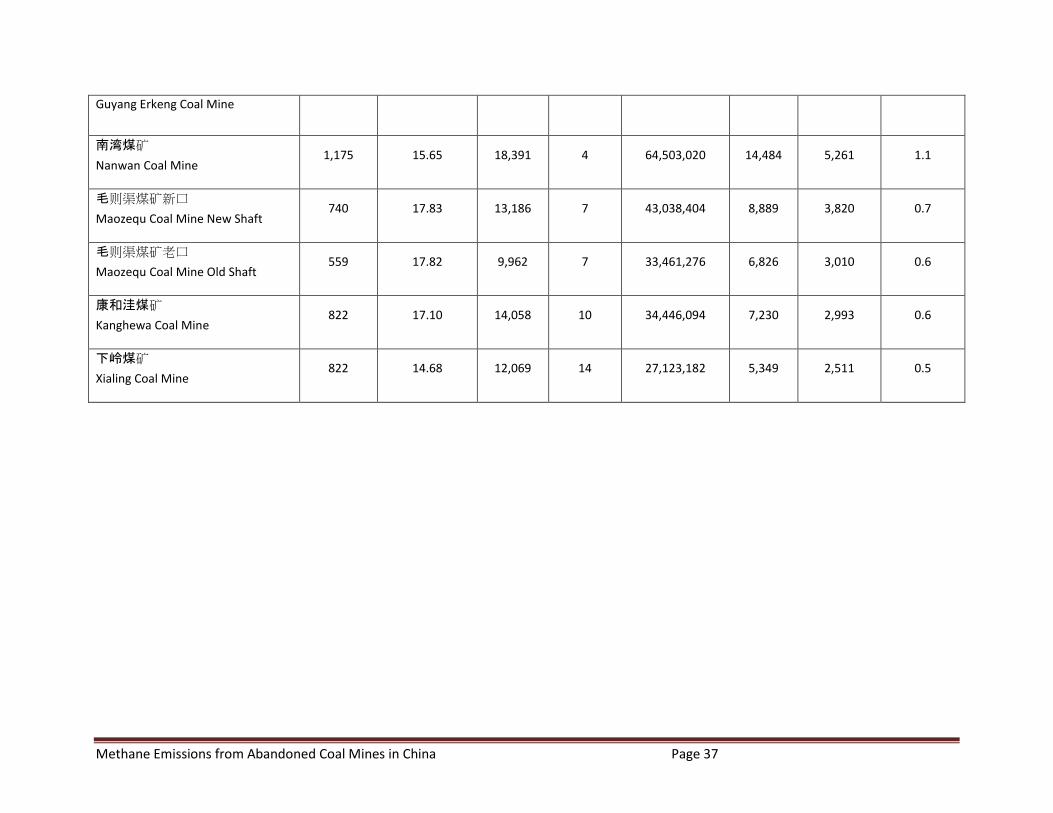
Methane Emissions from Abandoned Coal Mines in China Page 37
Guyang Erkeng Coal Mine
南湾煤矿
Nanwan Coal Mine 1,175 15.65 18,391 4 64,503,020 14,484 5,261 1.1
毛则渠煤矿新口
Maozequ Coal Mine New Shaft 740 17.83 13,186 7 43,038,404 8,889 3,820 0.7
毛则渠煤矿老口
Maozequ Coal Mine Old Shaft 559 17.82 9,962 7 33,461,276 6,826 3,010 0.6
康和洼煤矿
Kanghewa Coal Mine 822 17.10 14,058 10 34,446,094 7,230 2,993 0.6
下岭煤矿
Xialing Coal Mine 822 14.68 12,069 14 27,123,182 5,349 2,511 0.5

Figure 5 is a pareto chart of the NGC of each mine by gas region.
Figure 5: Pareto chart of the estimated NGC for mines within each gas region
This chart shows that the most prospective abandoned mines for development are in the Shouping gas
region followed by Qinnan, with Xingjiashe and Daning-Jixian being approximately equal. The Changgou
Coal Mine in the Xingjiashe gas region shows a nominal generation capacity of 8.3 MWe, however the
data relative to its mine life (11 years to produce 24 million tonnes of coal) and therefore its mining rate
and gas productivity is believed to be incorrect.
9.2 Correlation of Data to Highly Prospective Abandoned Mines Using the NGC as the benchmark against which to compare the prospects of successful AMM
development, plots were generated to compare the relative correlation of the NGC to other factors
(cumulative methane emissions over a 20 year project life could also be used as a benchmark).
0.0
2.0
4.0
6.0
8.0
10.0
12.0
1 2 3 4 5 6 7 8 9 10 11 12 13 14 15 16 17
Me
ga W
att E
lect
rica
l
Estimated Nominal Power Generation Capacity from Abandoned Mines in Each Shanxi Gas Region
Shouping
Xingjiashe
Qinnan
Daning-Jixian

Methane Emissions from Abandoned Coal Mines in China Page 39
Figure 6: NGC versus average coal rate Figure 7: NGC versus specific emissions
Note the outlier at a NGC of 8.3 in each graph. This is the mine noted above as having an anomalously
short producing life for the amount of coal produced. The start date for this mine is assumed to be
incorrect. The correlation of specific emissions with NGC has the best correlation (R2 = 0.61). Recall that
if a credible value of specific emissions is not available an empirical relationship between the total coal
thickness (HTC), the thickness of the
mined seam (HMS) and the original gas
content can be used to estimate the
specific emissions. That was done for this
study. The relationship used was
SE = GC x (1.5 + LN(HTC / HMS))
So the measured gas content multiplied
by LN(HTC / HMS) also called the SE factor
provides an estimation of the actual
specific emissions. This relationship has
been tested against abandoned mines in the Illinois basin of the United States that had historical specific
emissions values and was found to be in good agreement. This relationship takes into account the
diminishing contribution of gas from coal remote from the mined seam. Figure 7 shows the SE Factor as
function of total coal to mined coal thickness ratio.
Note the four mines in Figures 6 and 7 at the high end of the NGC scale. These four mines are within the
Shouping gas region. These mines along with having high measured gas content also have the highest SE
factors in the data set, all being above 4.25 which means that the mined coal thickness was small
compared to the total coal thickness contributing gas to the mine emissions. These mines appeared to
have only mined one seam because the total mined thickness ranged from 1.31 meter to 1.37 meter
where the total coal package averaged 21.7 meters. Even thought the coal thickness package of the
Qinnan and Shouping gas regions were not distinguished from each other, the specific emission factors
for the Qinnan gas region were almost all between 2.0 and 3.0. This is because the mined coal thickness
was higher, generally between 3 and 8 meters, probably indicating multiple seams being mined. This
results in less methane remaining after mining because more coal was extracted as a percentage of the
original coal in the system.
0.0
2.0
4.0
6.0
8.0
10.0
12.0
0 1,000 2,000 3,000 4,000 5,000 6,000 7,000
MW
e
Coal Rate, tonne/day
Nominal MWe vs Coal Rate
0.00
0.50
1.00
1.50
2.00
2.50
3.00
3.50
4.00
4.50
0 5 10 15
Fact
or,
dim
en
sio
nle
ss
HTC/HMS
SE Factor vs Total to Mined Coal Ratio
0.0
2.0
4.0
6.0
8.0
10.0
12.0
0.00 10.00 20.00 30.00 40.00 50.00 60.00 70.00 80.00
MW
e
SE, m3/tonne coal mined
Nominal MWe vs Specific Emission
Figure 8

Methane Emissions from Abandoned Coal Mines in China Page 40
Other factors influence the rate and amount of recoverable gas (and therefore NGC) from a particular
mine including the length of time since closure. Figures 9 and 10 show two mines; one closed for three
years and one closed for 36 years
Figure 9: Recently closed mine shows steep decline rate over project life
Figure 10: Older mine shows shallow decline rate over project life
0
5,000
10,000
15,000
20,000
25,000
30,000
35,000
2000 2020 2040 2060 2080 2100 2120
Emis
sio
n R
ate
, m3 /
d
Year From Closure
阳泉四矿丈八井二号坑
Zhangbajing No.2 Mineshaft of Yangquan #4 Mine
Baseline
Project Life
Mine Closure - 2009
Project start - 2012
Project end - 2031
0
20,000
40,000
60,000
80,000
100,000
120,000
140,000
1960 1980 2000 2020 2040 2060 2080 2100
Emis
sio
n R
ate
, m3 /
d
Year From Closure
阳泉一矿永红矿 Yonghong Mineshaft of Yangquan #1 Mine
Baseline Methane Emissions
Baseline
Project Life
Mine Closure 1976
Project start - 2012
Project end - 2031
Nominal Generating Capacity = 5.5 MWe

Methane Emissions from Abandoned Coal Mines in China Page 41
9.3 Sensitivity Analysis The above results and those displayed in the database are based on average values of total coal
thickness, methane content and Langmuir pressure and volume by gas region. Because there is a range
of data for various coal seams in the different gas regions (as shown in the section on Gas Region
Specific Data) it is prudent to test the sensitivity of the analysis results to the range of uncertainty of
those parameters. The following tables show the high, mid and low values used for each parameter in
order to test the sensitivity of the resulting NGC to this range of variation. Note that the extreme high
and low values of the parameter were not used but the values at the 5 and 95 percentile of each
distribution.
Shouping High Mid Low
Total Coal Thickness, m 41.89 21.72 11.76
Methane Content 0.97 0.89 0.75
Langmuir Volume, m3/mt 41.62 33.39 25.34
Langmuir Pressure, MPa 2.87 2.00 1.04
Xingjiashe High Mid Low
Total Coal Thickness, m 42.70 18.00 7.10
Methane Content 0.82 0.82 0.82
Langmuir Volume, m3/mt 41.59 33.39 25.34
Langmuir Pressure, MPa 2.86 2.00 1.04
Qinnan High Mid Low
Total Coal Thickness, m 41.89 21.72 11.76
Methane Content 0.97 0.89 0.75
Langmuir Volume, m3/mt 51.85 42.80 32.56
Langmuir Pressure, MPa 3.30 2.26 1.60
Daning-Jixian High Mid Low
Total Coal Thickness, m 24.88 14.23 5.79
Methane Content 0.99 0.92 0.74
Langmuir Volume, m3/mt 27.18 20.93 16.61
Langmuir Pressure, MPa 2.57 1.86 1.24
One coal mine from each gas region was selected to illustrate the results of this analysis which are
shown below where the percent high and low are relative to the mid case value.
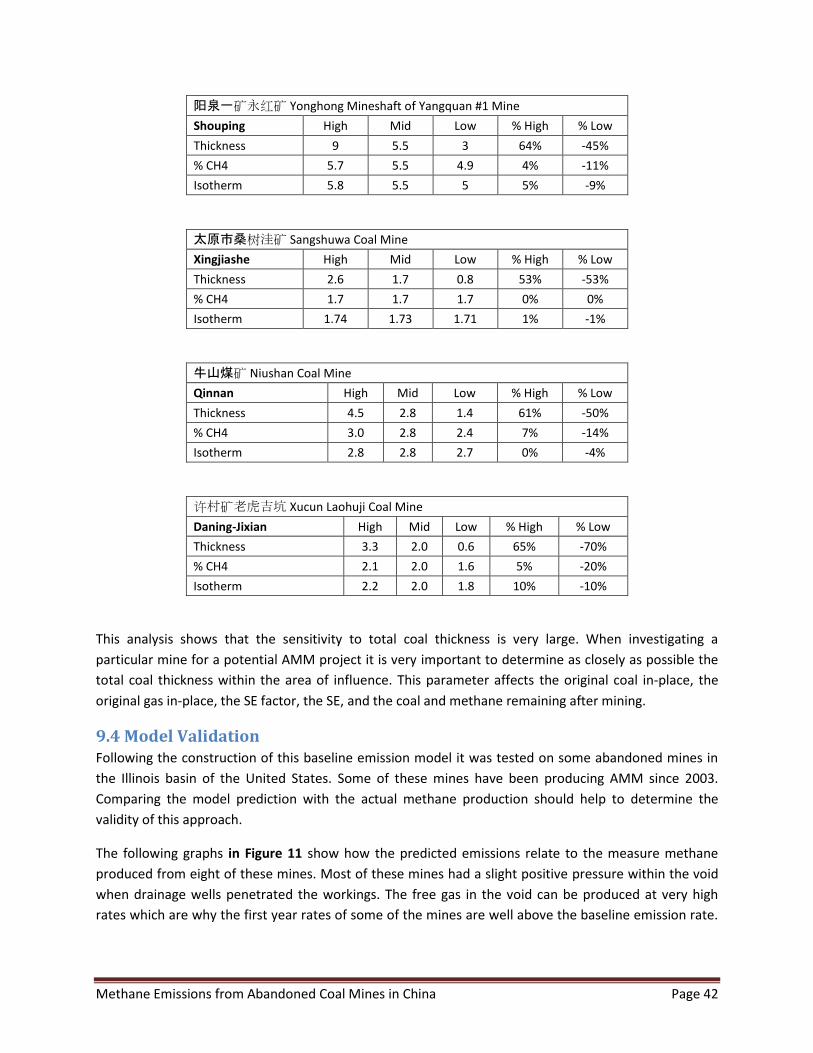
Methane Emissions from Abandoned Coal Mines in China Page 42
阳泉一矿永红矿 Yonghong Mineshaft of Yangquan #1 Mine
Shouping High Mid Low % High % Low
Thickness 9 5.5 3 64% -45%
% CH4 5.7 5.5 4.9 4% -11%
Isotherm 5.8 5.5 5 5% -9%
太原市桑树洼矿 Sangshuwa Coal Mine
Xingjiashe High Mid Low % High % Low
Thickness 2.6 1.7 0.8 53% -53%
% CH4 1.7 1.7 1.7 0% 0%
Isotherm 1.74 1.73 1.71 1% -1%
牛山煤矿 Niushan Coal Mine
Qinnan High Mid Low % High % Low
Thickness 4.5 2.8 1.4 61% -50%
% CH4 3.0 2.8 2.4 7% -14%
Isotherm 2.8 2.8 2.7 0% -4%
许村矿老虎吉坑 Xucun Laohuji Coal Mine
Daning-Jixian High Mid Low % High % Low
Thickness 3.3 2.0 0.6 65% -70%
% CH4 2.1 2.0 1.6 5% -20%
Isotherm 2.2 2.0 1.8 10% -10%
This analysis shows that the sensitivity to total coal thickness is very large. When investigating a
particular mine for a potential AMM project it is very important to determine as closely as possible the
total coal thickness within the area of influence. This parameter affects the original coal in-place, the
original gas in-place, the SE factor, the SE, and the coal and methane remaining after mining.
9.4 Model Validation Following the construction of this baseline emission model it was tested on some abandoned mines in
the Illinois basin of the United States. Some of these mines have been producing AMM since 2003.
Comparing the model prediction with the actual methane production should help to determine the
validity of this approach.
The following graphs in Figure 11 show how the predicted emissions relate to the measure methane
produced from eight of these mines. Most of these mines had a slight positive pressure within the void
when drainage wells penetrated the workings. The free gas in the void can be produced at very high
rates which are why the first year rates of some of the mines are well above the baseline emission rate.

Methane Emissions from Abandoned Coal Mines in China Page 43
The model does not take into account the free gas in the void; only the adsorbed gas in the remaining
coal and therefore under-predicts the actual initial production as well as the cumulative gas production
Figure 11: Predicted baseline methane emissions and actual production data from eight abandoned
coal mines in the Illinois basin of the United States
0
1,000,000
2,000,000
3,000,000
4,000,000
5,000,000
6,000,000
7,000,000
8,000,000
9,000,000
0 10 20 30 40 50 60 70
m3/y
ear
Years since closure
OBC #8
Baseline
Actual, m3/yr
0
1,000,000
2,000,000
3,000,000
4,000,000
5,000,000
6,000,000
7,000,000
0 10 20 30 40 50 60 70
m3/y
ear
Years since closure
OBC #14
Baseline
Actual, m3/yr
0
2,000,000
4,000,000
6,000,000
8,000,000
10,000,000
12,000,000
14,000,000
16,000,000
0 5 10 15 20 25 30 35
m3/y
ear
Years since closure
OBC #21
Baseline, m3/yr
Actual, m3/yr
0
1,000,000
2,000,000
3,000,000
4,000,000
5,000,000
6,000,000
7,000,000
8,000,000
0 10 20 30 40 50 60 70
m3/y
ear
Years since closure
OBC #22
Baseline
Actual, m3/yr
0
2,000,000
4,000,000
6,000,000
8,000,000
10,000,000
12,000,000
14,000,000
16,000,000
0 5 10 15 20 25 30 35
m3/y
r
Years since closure
OBC #24
Baseline m3/yr
Actual m3/yr
0
2,000,000
4,000,000
6,000,000
8,000,000
10,000,000
12,000,000
14,000,000
16,000,000
18,000,000
0 5 10 15 20 25 30 35
m3/y
r
Years Since Closure
OBC #26
Baseline m3/yr
0
1,000,000
2,000,000
3,000,000
4,000,000
5,000,000
6,000,000
7,000,000
8,000,000
0 20 40 60 80
m3/y
ear
Years since closure
Orient 1
m3/yr
Actual m3/yr
0
200,000
400,000
600,000
800,000
1,000,000
1,200,000
1,400,000
1,600,000
1,800,000
0 20 40 60 80 100 120
m3/y
ear
Years since closure
Blackstar
Baseline
Actual m3/yr

Methane Emissions from Abandoned Coal Mines in China Page 44
The older mines such as OBC 8, 14, 22 and Orient 1 and Blackstar were room and pillar mines. The
newer mines such as OBC 21, 24, and 26 were longwall mines. The extensive fracturing above and below
the mined seam in the longwall mines ensured that the entire coal section was contributing gas to the
mine whereas this may not be the case for the room and pillar mines. This multiple mine project
produced for about a year then was suspended after the initial high rates related to gas under pressure
in the void was depleted. A new operator restarted the project about a year later. After this point it
appears that production appears to follow the baseline emission rate fairly well and is, at least for the
newer mines and more recently closed mines, somewhat conservative.
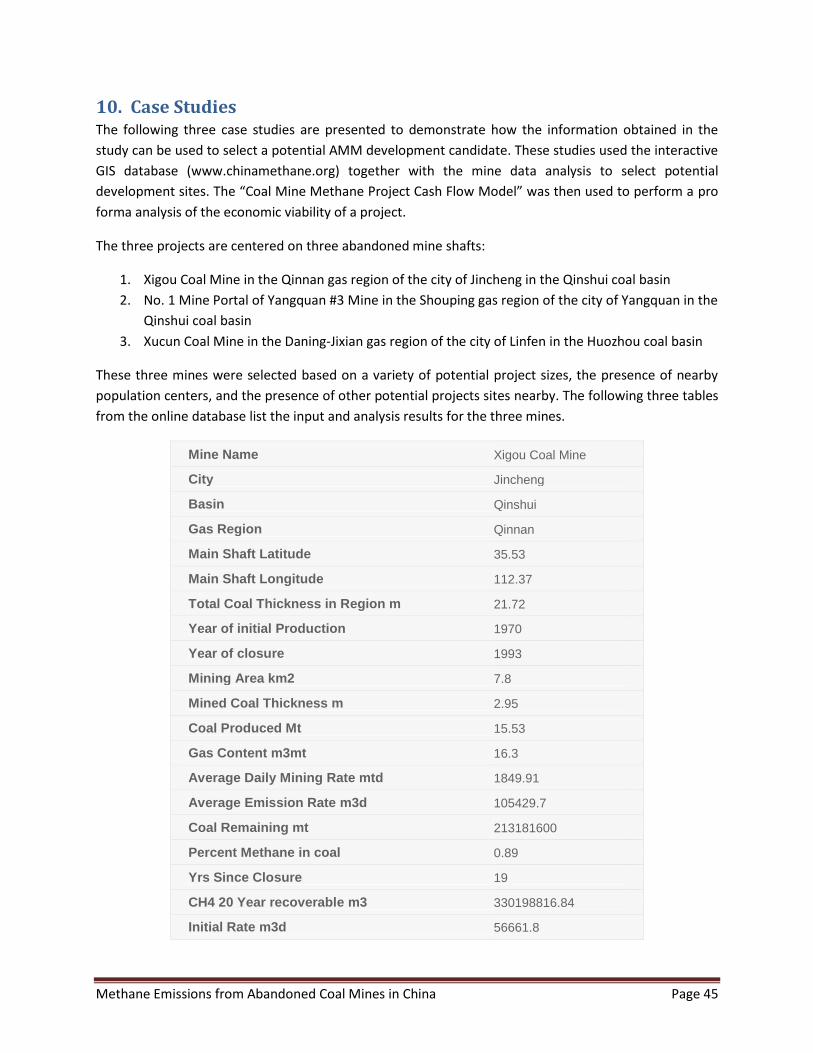
Methane Emissions from Abandoned Coal Mines in China Page 45
10. Case Studies The following three case studies are presented to demonstrate how the information obtained in the
study can be used to select a potential AMM development candidate. These studies used the interactive
GIS database (www.chinamethane.org) together with the mine data analysis to select potential
development sites. The “Coal Mine Methane Project Cash Flow Model” was then used to perform a pro
forma analysis of the economic viability of a project.
The three projects are centered on three abandoned mine shafts:
1. Xigou Coal Mine in the Qinnan gas region of the city of Jincheng in the Qinshui coal basin
2. No. 1 Mine Portal of Yangquan #3 Mine in the Shouping gas region of the city of Yangquan in the
Qinshui coal basin
3. Xucun Coal Mine in the Daning-Jixian gas region of the city of Linfen in the Huozhou coal basin
These three mines were selected based on a variety of potential project sizes, the presence of nearby
population centers, and the presence of other potential projects sites nearby. The following three tables
from the online database list the input and analysis results for the three mines.
Mine Name Xigou Coal Mine
City Jincheng
Basin Qinshui
Gas Region Qinnan
Main Shaft Latitude 35.53
Main Shaft Longitude 112.37
Total Coal Thickness in Region m 21.72
Year of initial Production 1970
Year of closure 1993
Mining Area km2 7.8
Mined Coal Thickness m 2.95
Coal Produced Mt 15.53
Gas Content m3mt 16.3
Average Daily Mining Rate mtd 1849.91
Average Emission Rate m3d 105429.7
Coal Remaining mt 213181600
Percent Methane in coal 0.89
Yrs Since Closure 19
CH4 20 Year recoverable m3 330198816.84
Initial Rate m3d 56661.8

Methane Emissions from Abandoned Coal Mines in China Page 46
Rate after 20 years m3d 35521.41
Nominal Mwe 5.59
Mine Name No.1 Mine Portal of
Yangquan #3 Mine
City Yangquan
Basin Qinshui
Gas Region Shouping
Main Shaft Latitude 37.88
Main Shaft Longitude 113.48
Total Coal Thickness in Region m 21.72
Year of initial Production 1958
Year of closure 1981
Mining Area km2 21.5
Mined Coal Thickness m 1.37
Coal Produced Mt 21.78
Gas Content m3mt 17.1
Average Daily Mining Rate mtd 2594.4
Average Emission Rate m3d 189143.61
Coal Remaining mt 608643000
Percent Methane in coal 0.89
Yrs Since Closure 31
CH4 20 Year recoverable m3 629635568.07
Initial Rate m3d 99327.95
Rate after 20 years m3d 74129.11
Nominal Mwe 10.65
Mine Name Xucun Coal Mine
City Linfen
Basin Huozhou
Gas Region Daning-Jixian
Main Shaft Latitude 35.63
Main Shaft Longitude 111.68
Total Coal Thickness in Region m 14.23
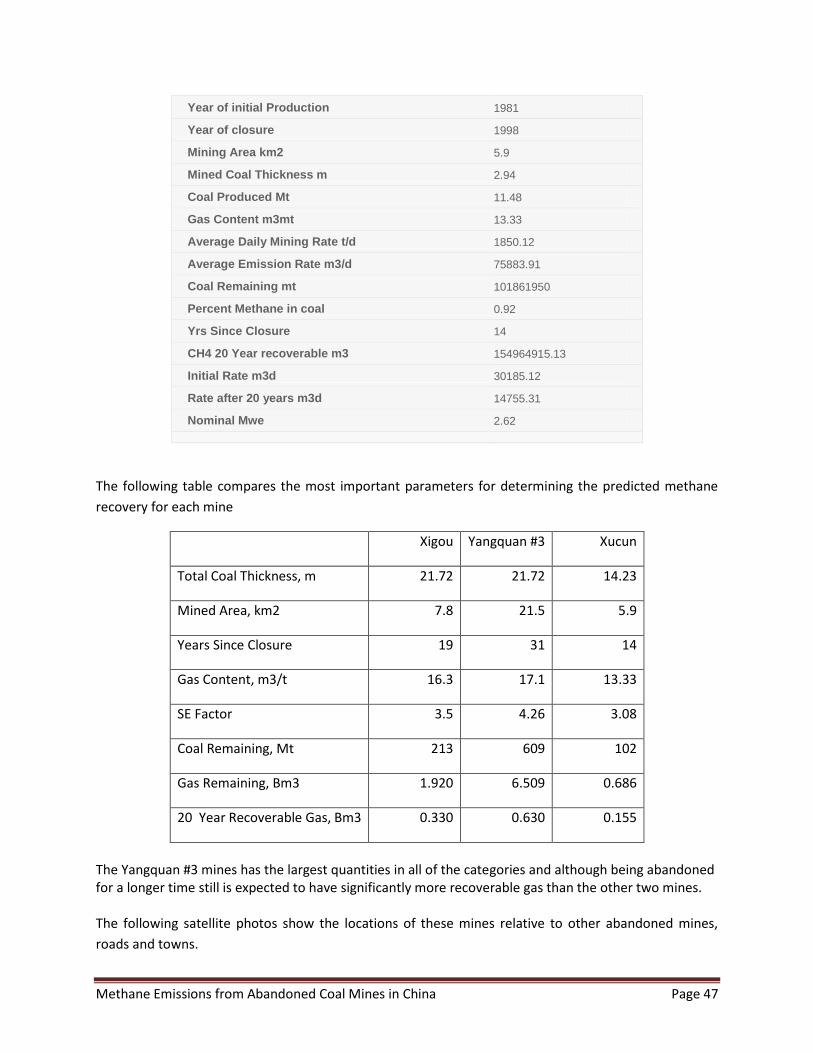
Methane Emissions from Abandoned Coal Mines in China Page 47
Year of initial Production 1981
Year of closure 1998
Mining Area km2 5.9
Mined Coal Thickness m 2.94
Coal Produced Mt 11.48
Gas Content m3mt 13.33
Average Daily Mining Rate t/d 1850.12
Average Emission Rate m3/d 75883.91
Coal Remaining mt 101861950
Percent Methane in coal 0.92
Yrs Since Closure 14
CH4 20 Year recoverable m3 154964915.13
Initial Rate m3d 30185.12
Rate after 20 years m3d 14755.31
Nominal Mwe 2.62
The following table compares the most important parameters for determining the predicted methane
recovery for each mine
Xigou Yangquan #3 Xucun
Total Coal Thickness, m 21.72 21.72 14.23
Mined Area, km2 7.8 21.5 5.9
Years Since Closure 19 31 14
Gas Content, m3/t 16.3 17.1 13.33
SE Factor 3.5 4.26 3.08
Coal Remaining, Mt 213 609 102
Gas Remaining, Bm3 1.920 6.509 0.686
20 Year Recoverable Gas, Bm3 0.330 0.630 0.155
The Yangquan #3 mines has the largest quantities in all of the categories and although being abandoned for a longer time still is expected to have significantly more recoverable gas than the other two mines. The following satellite photos show the locations of these mines relative to other abandoned mines,
roads and towns.

Methane Emissions from Abandoned Coal Mines in China Page 48
Xigou
Zhuangtou
Wozhuang
Yonghong shaft
Yangquan #1
Beitouzui Xichi
shaft Yangquan #1
Yugong shaft
Yangquan #3
Old Zhangba shaft
Yangquan #3
No. 1 Portal
Yangquan #3
Dongsichi shaft
Yangquan #2
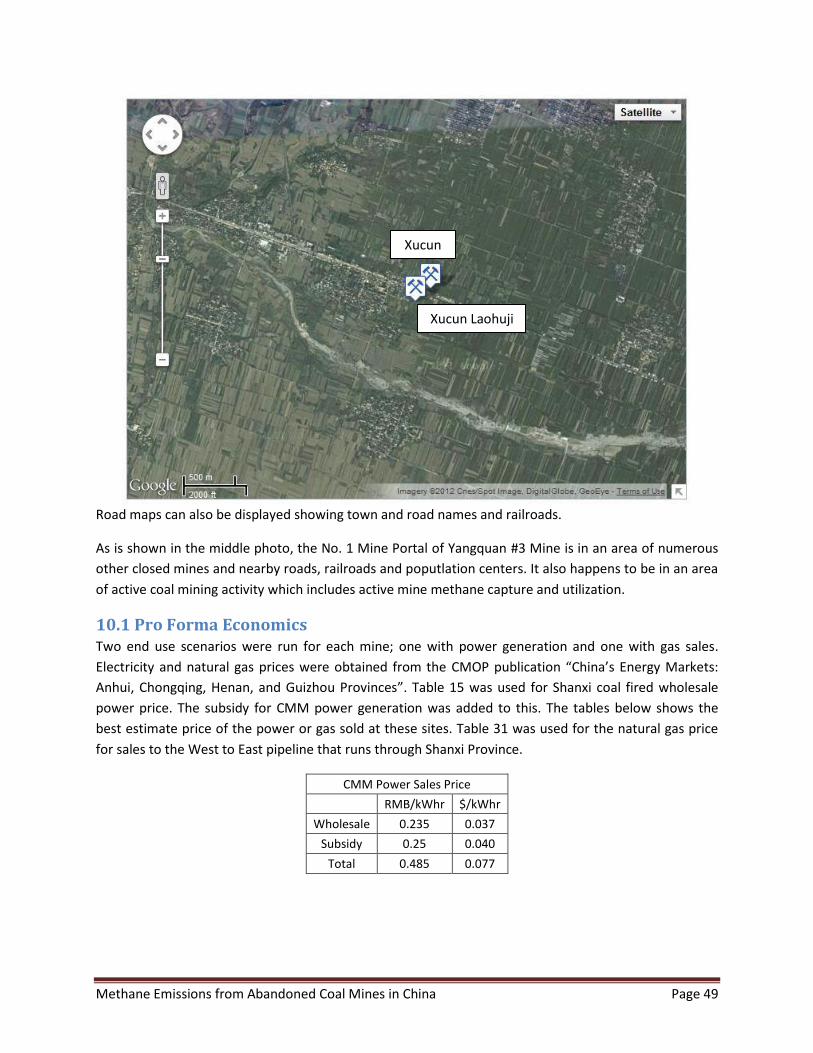
Methane Emissions from Abandoned Coal Mines in China Page 49
Road maps can also be displayed showing town and road names and railroads.
As is shown in the middle photo, the No. 1 Mine Portal of Yangquan #3 Mine is in an area of numerous
other closed mines and nearby roads, railroads and poputlation centers. It also happens to be in an area
of active coal mining activity which includes active mine methane capture and utilization.
10.1 Pro Forma Economics Two end use scenarios were run for each mine; one with power generation and one with gas sales.
Electricity and natural gas prices were obtained from the CMOP publication “China’s Energy Markets:
Anhui, Chongqing, Henan, and Guizhou Provinces”. Table 15 was used for Shanxi coal fired wholesale
power price. The subsidy for CMM power generation was added to this. The tables below shows the
best estimate price of the power or gas sold at these sites. Table 31 was used for the natural gas price
for sales to the West to East pipeline that runs through Shanxi Province.
CMM Power Sales Price
RMB/kWhr $/kWhr
Wholesale 0.235 0.037
Subsidy 0.25 0.040
Total 0.485 0.077
Xucun
Xucun Laohuji

Methane Emissions from Abandoned Coal Mines in China Page 50
Gas Sale Price
Gas Price RMB/m3 RMB/mmbtu $/mmbtu
Wholesale 1.20 34.0 5.39
Subsidy 0.20 5.7 0.90
Total 1.40 39.6 6.28
In order to determine the capital and operating cost of project development whether for power
generation or gas sales, the number and spacing of wells necessary to drain the mine at its estimated
average rate over the 20 year life of the project must be determined. Based on RCE’s experience with
AMM projects, wells drilled into abandoned mines are generally in pressure communication with each
other. This means that one well should be able to drain the entire mine. However every well drilled into
an abandoned mine will have a different productivity. That is, the production rate will vary even if the
static bottom-hole pressure is the same for each well. This is caused by the pressure loss due to the
tortuous path that the gas must travel in order to reach the wellbore. This tortuous path is related to
roof collapse, roadway seals that impede but don’t totally impede flow and partial flooding of areas of
the mine. Therefore multiple wells need to be drilled to achieve the full drainage potential of the mine.
In order to determine the expected number of wells needed to drain a mine, the average rate of
production per well needs to be estimated and this needs to be related to the estimated maximum
production from the mine. RCE’s experience with AMM wells suggests that an average per well rate of
400 Mcf/d (~11,000 m3/d) total gas is reasonable. Therefore if a mine is expected to drain an average of
2,300 Mcf/d of 70% methane gas, six wells will need to be drilled (rounding up). These wells will need to
be drilled in strategic locations based on mine maps developed at the closure of the mines so that areas
most connected to large drainage areas are targeted.
For economic analysis purposes these wells are assumed to be spaced equidistance apart based on the
area of the mine. Therefore if six wells are to be drilled on a 2,000 acre (7.8 km2) mine then each will be
expected to drain 320 acres (1.3 km2) and the distance between the wells will be 3,740 feet (1140 m).
This value will be used to calculate the cost of laying pipe between the wells. The number of wells and
depth to the mine will also be in the cost calculation. Therefore the number of wells and distance
between the wells will be dependent on the expected rate of recovery and the area of the mine.
10.2 Data Input and Results The input data and analysis results from the cash flow model are found in Appendix A. The tables below
summarize this by mine and for the power generation scenario.
Data input that is common among all mines for power generation
Gathering & Delivery System
Cost of satellite compressors 1000 $/HP
Distance from the drainage area to the onsite project 1000 ft
Cost of installing header pipe from the drainage area 40 $/ft
Compressor and blower efficiencies 0.035 HP/mcfd
Drainage Well & Blower Development Costs
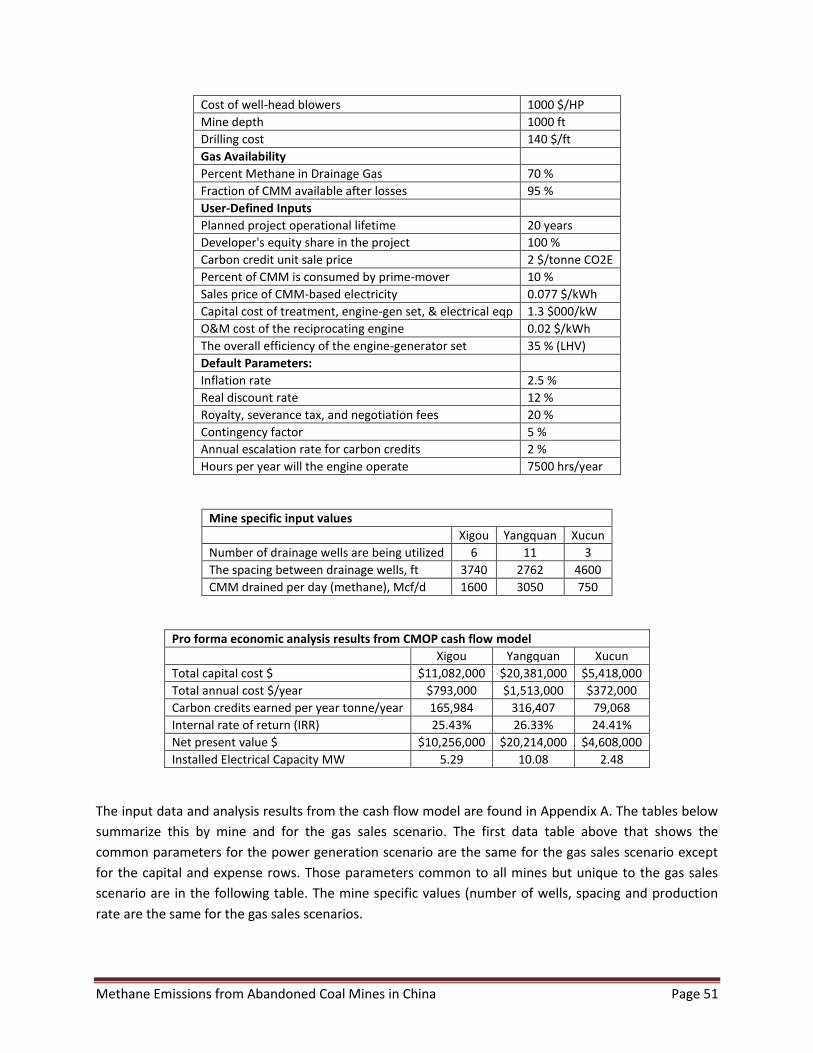
Methane Emissions from Abandoned Coal Mines in China Page 51
Cost of well-head blowers 1000 $/HP
Mine depth 1000 ft
Drilling cost 140 $/ft
Gas Availability
Percent Methane in Drainage Gas 70 %
Fraction of CMM available after losses 95 %
User-Defined Inputs
Planned project operational lifetime 20 years
Developer's equity share in the project 100 %
Carbon credit unit sale price 2 $/tonne CO2E
Percent of CMM is consumed by prime-mover 10 %
Sales price of CMM-based electricity 0.077 $/kWh
Capital cost of treatment, engine-gen set, & electrical eqp 1.3 $000/kW
O&M cost of the reciprocating engine 0.02 $/kWh
The overall efficiency of the engine-generator set 35 % (LHV)
Default Parameters:
Inflation rate 2.5 %
Real discount rate 12 %
Royalty, severance tax, and negotiation fees 20 %
Contingency factor 5 %
Annual escalation rate for carbon credits 2 %
Hours per year will the engine operate 7500 hrs/year
Mine specific input values
Xigou Yangquan Xucun
Number of drainage wells are being utilized 6 11 3
The spacing between drainage wells, ft 3740 2762 4600
CMM drained per day (methane), Mcf/d 1600 3050 750
Pro forma economic analysis results from CMOP cash flow model
Xigou Yangquan Xucun
Total capital cost $ $11,082,000 $20,381,000 $5,418,000
Total annual cost $/year $793,000 $1,513,000 $372,000
Carbon credits earned per year tonne/year 165,984 316,407 79,068
Internal rate of return (IRR) 25.43% 26.33% 24.41%
Net present value $ $10,256,000 $20,214,000 $4,608,000
Installed Electrical Capacity MW 5.29 10.08 2.48
The input data and analysis results from the cash flow model are found in Appendix A. The tables below
summarize this by mine and for the gas sales scenario. The first data table above that shows the
common parameters for the power generation scenario are the same for the gas sales scenario except
for the capital and expense rows. Those parameters common to all mines but unique to the gas sales
scenario are in the following table. The mine specific values (number of wells, spacing and production
rate are the same for the gas sales scenarios.

Methane Emissions from Abandoned Coal Mines in China Page 52
Data input that is common among all mines for gas sales
Distance to the natural gas pipeline 5000 ft
Cost of electric power used by the project 77 $/MWh
Price of the methane sold to the pipeline 6.28 $/mmBtu(HHV)
Installed cost of high pressure line from project to natural gas pipeline 40 $/ft
Pro forma economic analysis results from CMOP cash flow model
Xigou Yangquan Xucun
Total capital cost $ $7,856,000 $11,583,000 $5,481,000
Total annual cost $/year $1,115,000 $1,854,000 $682,000
Carbon credits earned per year tonne/year 165,984 316,407 79,068
Internal rate of return (IRR) 22.08% 30.76% 10.94%
Net present value $ $5,335,000 $15,320,000 -$,349,000
Quantity of exported methane Mcf/year 373,864 712,678 175,249
The pro forma economic analysis shows that gas sales bring about a better return than power
generation only for the largest of the projects, No. 1 Mine Portal Yangquan #3. This is because the
capital cost is for each mine in the gas sales case is fairly independent of the flow rate (for example the
high pressure pipeline to the sales line). This is also the reason for the relatively poor results for the two
smaller projects. It should be noted that the gas sale case includes removal of nitrogen and carbon
dioxide by pressure swing adsorption down to 4% and also includes high pressure compression (900
psig). In the case of gas sales in China, it might be at low pressure with no nitrogen removal necessary
because AMM gas is generally relatively high quality (>50%) and will be adequate for use as town gas or
boiler fuel.
The similar rates of return associated with the power generation projects is related to the capital and
operation costs being directly related to the volume of gas produced. Good rates of return in the mid
20% are shown for these projects based on the best estimate of the power sale price and the carbon
price. It takes a zero price for carbon and 0.055 $/kWhr to bring the power generation cases down to a
zero rate of return.
The wholesale price of 0.235 RMB/kWhr ( 0.37 $/kWhr) is not enough to provide a positive rate of
return so the subsidy is clearly necessary. It is also clear that at least 6,000,000 m3/year (212,000
Mcf/year) of methane is needed for a gas sales project to be successful.
Qualifying emission reductions from AMM projects has been done under a methodology accepted under
the Verified Carbon Standard but no methodology has yet been adopted under the Clean Development
Mechanism.

Methane Emissions from Abandoned Coal Mines in China Page 53
10.3 Recommendations The largest of the potential sites, the No. 1 Mine Portal of Yangquan #3 Mine appears to be the most
attractive for further evaluation as it had the best rate of return under both end use scenarios. It also
appears from the GIS mapping near population centers, road and rail transportation, other potential
AMM sites and is also near some large active mine power generation centers. Its potentially large size
will also provide economies of scale not captured in the pro forma analysis.
A recommended program going forward for a project at the No. 1 Mine Portal of Yangquan #3 Mine
includes:
Contacting the Yangquan Coal Mining Group who was the operator when active to determine if
they maintain ownership rights to workings and gas held within
Establish that CMM incentives for active mines also applies to abandoned mine methane
recovery
Establish a working relationship with the mine owner, local officials, grid power provider and
other stakeholders
Obtain more mine specific detailed information including mine maps, stratigraphic sections,
information on past emissions, possible flooding and shaft and in-mine sealing procedures in
order to test the assumptions used in this initial analysis
Test a vent pipe or drill a well to determine the in-mine gas pressure and gas composition
Perform a short (~1 week) open flow test at the vent pipe or drill hole to ensure sufficient mine
volume is in communication with the wellbore. Monitor rate, pressure and composition
throughout test.
Install a flare or a packaged power generation set of approximately 1 MW for extended constant
rate flow test and monitor gas composition and bottom-hole pressure through time
Investigate other possible wellbore locations based on the mine maps
Investigate other abandoned mine sites in the area
A phased approach to these types of projects is important in order to avoid over-building project
facilities based on high initial rates that may be associated with pressure buildup in the mine void which
does not reflect the long term gas deliverability from the adsorbed gas in the remaining coal.
11. Results and Conclusions This study was designed to help redress the lack of knowledge of, and focus on, abandoned mines by
producing a systematic inventory of abandoned mine methane emissions in China, with an initial focus
on the coal bearing regions of Shanxi Province. The following was developed during the course of this
study
A comprehensive set of government documents, both national and provincial, were
accumulated and summarized regarding policies on the closure and consolidation of coal mines
in China as well as policies regarding the incentives available to the coal mining industry for the
capture and utilization of CMM.

Methane Emissions from Abandoned Coal Mines in China Page 54
Coal characteristics relevant to methane content and production were cataloged for the various
gas regions of the Qinshui coal basin.
Specific information about the size, location, coal production, gas contents and opening and
closure dates for forty-four (44) abandoned mines in the Qinshui coal basin was gathered in
cooperation with the Shanxi Fenwei Energy Consulting Co. Ltd.
An approach was developed to estimate the AMM resource available for use and the probable
rate of recovery of that resource based on a combination of gas material balance, methane
emission rate during mining and a decline function based on an adsorption isotherm for the
relevant gas region. This methodology can be used to identify abandoned mines that may be
candidates for methane capture and use projects in any coal basin by providing estimates of the
remaining resource and possible methane production rates.
The Shanxi case study found that of the 44 abandoned mines studied 36 are expected to be able
to produce over 60 million m3 over a twenty year project life. The largest of these mines may
produce as much as 630 million m3.
Of the 44 mines analyzed three from different gas regions were selected for pro-forma
economic analysis case studies. These studies showed that power generation projects could be
economically instituted given that the current government power price incentives are obtained.
It was also found that only the largest of projects would be economically viable as gas treatment
and high pressure pipeline sales projects.
An online platform was created to present the above data and analysis. The online platform,
which is available at www.chinamethane.org, has three primary tools to facilitate interaction
with and analysis of project data: (1) a geographic information system that presents the
abandoned mine data using Google Maps API v3; (2) a relational MySQL database that enables
users to interact with the abandoned mine dataset using the GIS interface, the custom charting
system, or a separate search interface; and (3) a charting system that presents aggregate and
mine-specific data using dynamic HTML5 charts with data pulled from the MySQL database. In
addition to these tools, the platform contains reports and analysis generated throughout the
project. The system uses the extensible Joomla framework for content management and
administrative control. This framework allows different levels of users—e.g., administrators,
registered users, etc.—to easily interact with the underlying dataset and database. It also
provides an efficient and flexible backbone for tying the GIS system, MySQL database, and
custom charting tool together into a unified framework.
Abandoned Mine Geographic Information System
The GIS tool allows users to visually interact with the abandoned mine data using Google Maps
API v3. Abandoned mines are indicated by interactive markers on the map. Selecting a marker
triggers an information window containing the name of the mind, its longitude and latitude, and
a hyperlink to its record within the MySQL database. The GIS tool has several predefined views
that users can use to filter the abandoned mine data (Image 1). Users can, for instance, choose
to view only mines associated with a specific city—i.e., Jincheng, Linfen, Yangquan, or Taiyun;
those associated with a specific basin—i.e., Hedong, Xishan, Houzhou, or Quinshui; those
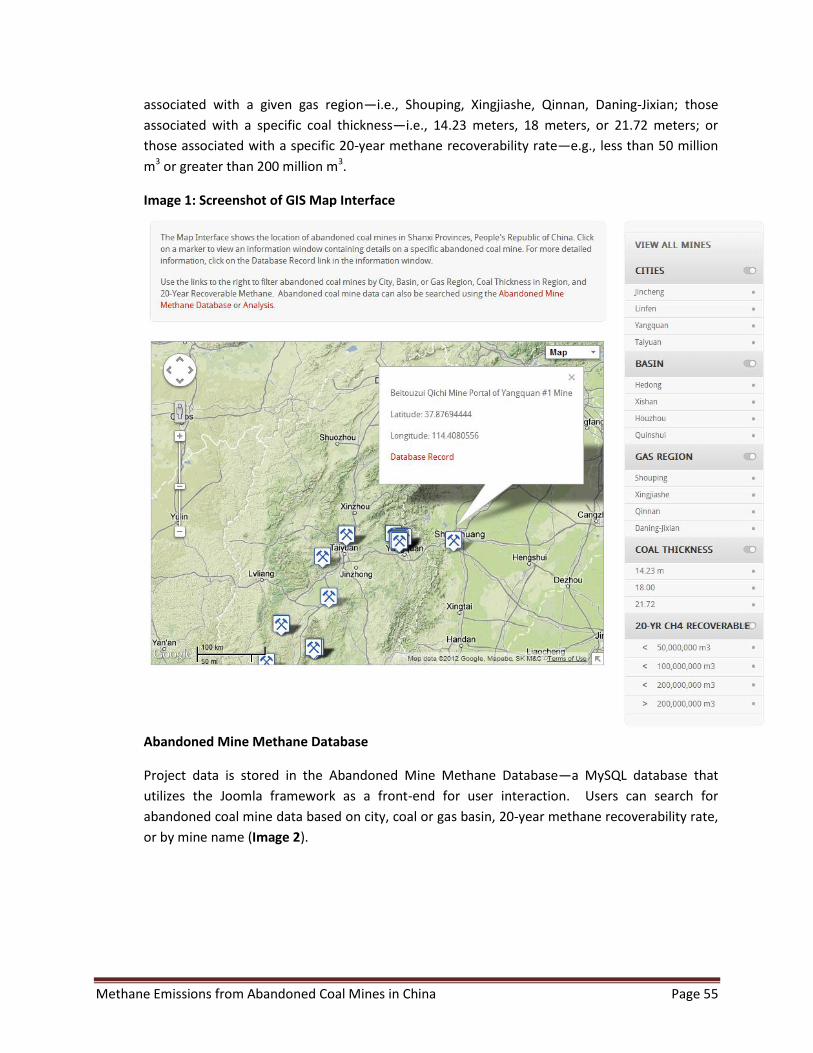
Methane Emissions from Abandoned Coal Mines in China Page 55
associated with a given gas region—i.e., Shouping, Xingjiashe, Qinnan, Daning-Jixian; those
associated with a specific coal thickness—i.e., 14.23 meters, 18 meters, or 21.72 meters; or
those associated with a specific 20-year methane recoverability rate—e.g., less than 50 million
m3 or greater than 200 million m3.
Image 1: Screenshot of GIS Map Interface
Abandoned Mine Methane Database
Project data is stored in the Abandoned Mine Methane Database—a MySQL database that
utilizes the Joomla framework as a front-end for user interaction. Users can search for
abandoned coal mine data based on city, coal or gas basin, 20-year methane recoverability rate,
or by mine name (Image 2).

Methane Emissions from Abandoned Coal Mines in China Page 56
Image 2: Screenshot of the Abandoned Mine Methane Database Search Interface
After the search parameters are selected, the database returns a list of mines that meet the
search criteria. This list page provides the users with a quick overview of the relevant mines,
including: mine name, city, basin, gas region, year of initial production, year of closure, 20 year
methane recoverability rate, and methane remaining after 20 years (Image 3). The data
contained in this overview can also be downloaded as a CSV file. The MySQL database
automatically generates this file and includes only the mines that meet the selected search
criteria.
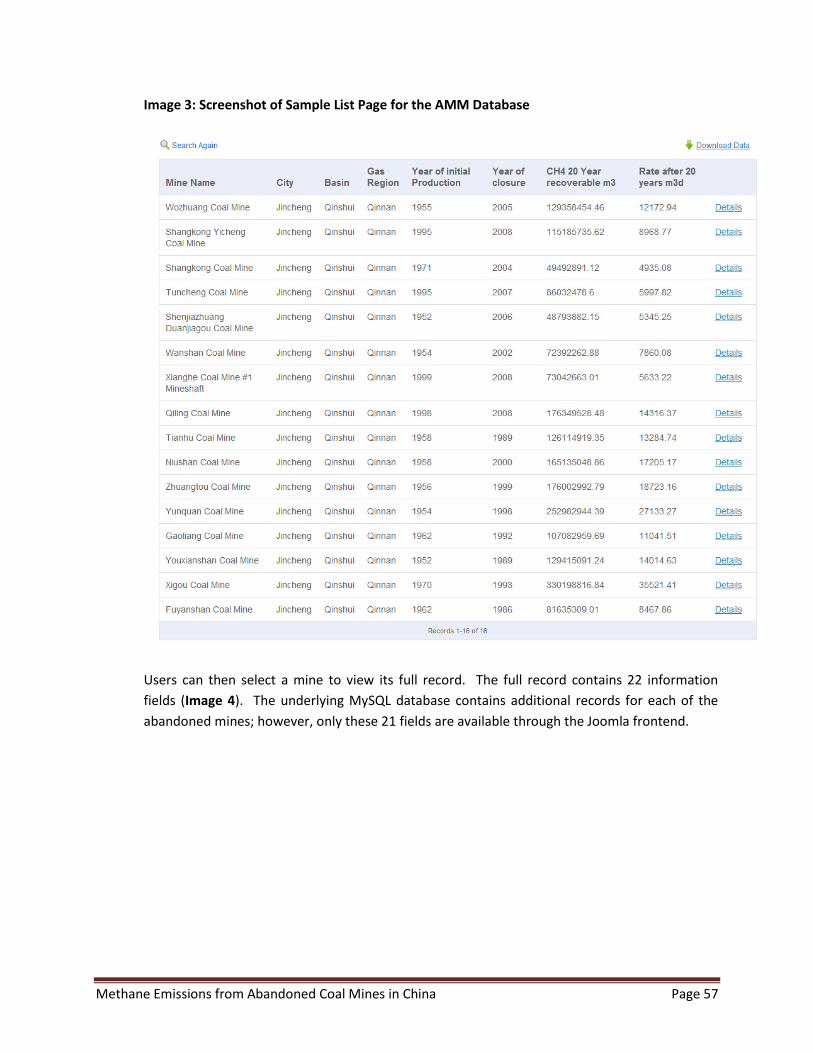
Methane Emissions from Abandoned Coal Mines in China Page 57
Image 3: Screenshot of Sample List Page for the AMM Database
Users can then select a mine to view its full record. The full record contains 22 information
fields (Image 4). The underlying MySQL database contains additional records for each of the
abandoned mines; however, only these 21 fields are available through the Joomla frontend.

Methane Emissions from Abandoned Coal Mines in China Page 58
Image 4: Screenshot of AMM Database Records Page for a Specific Mine
AMM Charting / Analysis System
The AMM charting system uses HTML5 to generate charts derived from database records in the
MySQL database.
Similar to the GIS tool, data for groups of mines or specific mines is visually rendered using
dynamically generated bar and pie charts; and the underlying data is made available as a CSV file
for users to download (Image 5). Links are auto-generated to the database records, allowing
uses to easily navigate from the charting application to the database record.
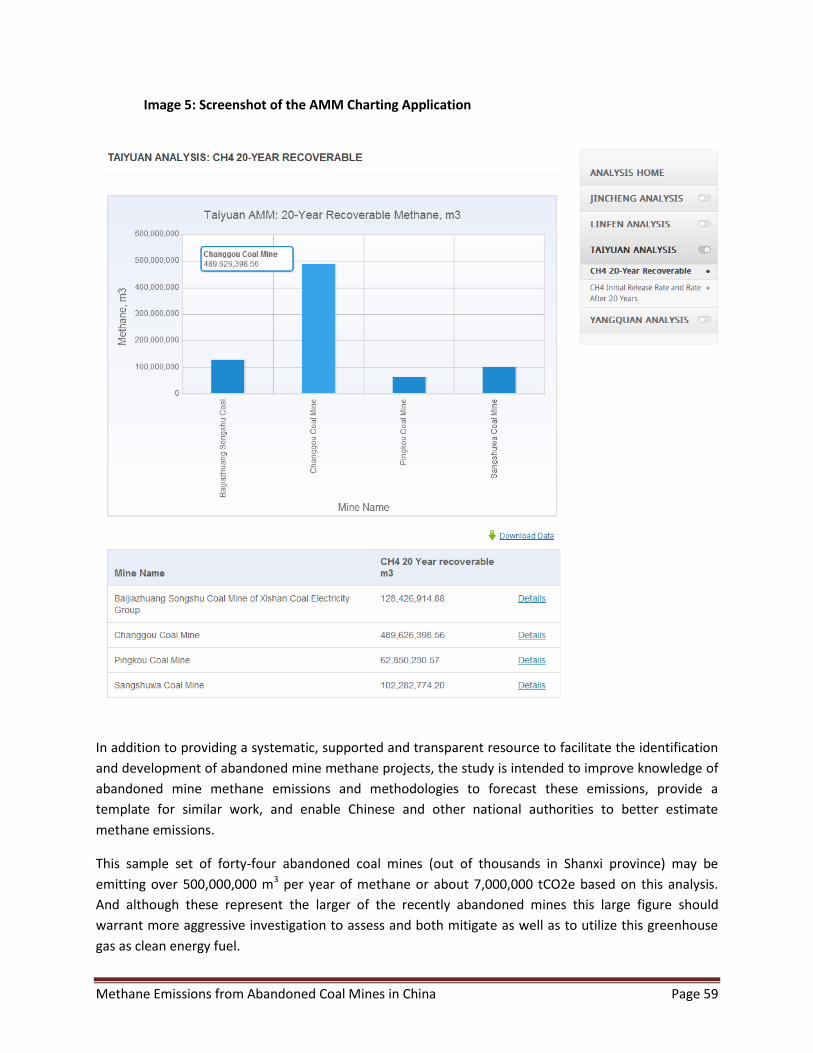
Methane Emissions from Abandoned Coal Mines in China Page 59
Image 5: Screenshot of the AMM Charting Application
In addition to providing a systematic, supported and transparent resource to facilitate the identification
and development of abandoned mine methane projects, the study is intended to improve knowledge of
abandoned mine methane emissions and methodologies to forecast these emissions, provide a
template for similar work, and enable Chinese and other national authorities to better estimate
methane emissions.
This sample set of forty-four abandoned coal mines (out of thousands in Shanxi province) may be
emitting over 500,000,000 m3 per year of methane or about 7,000,000 tCO2e based on this analysis.
And although these represent the larger of the recently abandoned mines this large figure should
warrant more aggressive investigation to assess and both mitigate as well as to utilize this greenhouse
gas as clean energy fuel.

Appendix A The following pages were extracted from the U.S. EPA Coalbed Methane Outreach Program’s Coal Mine Methane Project Cash Flow Model and present the input data and analysis results for the mines used as case studies in the GMI Report “Methane Emissions from Abandoned Coal Mines in China”. The results for both power generation and gas sales are presented for each mine.

Gathering & Delivery SystemWhat is the cost of satellite compressors? 1000 $/HPWhat is the distance from the drainage area to the onsite project? 1000 ftWhat is the cost of installing header pipe from the drainage area? 40 $/ftWhat are the compressor and blower efficiencies? 0.035 HP/mcfd
How many drainage wells are being utilized? 6What is the spacing between drainage wells? 3740 ft
Drainage Well & Blower Development CostsWhat is the cost of well-head blowers? 1000 $/HPWhat is the mine depth? 1000 ftWhat is the drilling cost? 140 $/ftWhat is the fraction of this project's drainage system cost that will be included in the analysis?
100 %
Gas AvailabilityWhat is the source of the coal mine methane? abandoned mine gas drainagePercent Methane in Drainage Gas 70 % What do you expect the CMM drained per day to be? 1600 mcf/dWhat is the fraction of CMM available after losses? 95 %
User-Defined InputsWhat is the planned project operational lifetime? 20 yearsWhat is the loan term? 5 yearsWhat interest rate is charged for the loan? 6 %
Coalbed Methane Scenario: Xigou Power Generation
What interest rate is charged for the loan? 6 %What is the developer's equity share in the project? 100 %What is the carbon credit unit sale price? 2 $/tonne CO2EWhat percent of CMM is consumed by prime-mover use? 10 %For what price can CMM-based electricity be sold? 0.077 $/kWhCapital cost of treatment, engine-gen set, & electrical eqp? 1.3 $000/kWWhat is the O&M cost of the reciprocating engine? 0.02 $/kWhWhat is the overall efficiency of the engine-generator set? 35 % (LHV)
Default Parameters:What is the inflation rate? 2.5 %What is the real discount rate? 12 %What are the royalty, severance tax, and negotiation fees? 20 %What is the contingency factor? 5 %What is the annual escalation rate for carbon credits? 2 %How many hours per year will the engine operate? 7500 hrs/year

Estimated Outputs:Available CMM for Other Projects 0 mcf/dTotal capital cost 11,082,000 $Total annual cost 793,000 $/yearEquity amount 11,082,000 $Loan amount 0,000 $Carbon credits earned per year 165,984 tonne/yearInternal rate of return (IRR) 25.43 %Net present value 10,256,000 $Installed Electrical Capacity 5.29 MW
-10,000.00
-8,000.00
-6,000.00
-4,000.00
-2,000.00
0.00
2,000.00
4,000.00
6,000.00
$000
Cash Flow Analysis
-12,000.00
-10,000.00
-8,000.00
Year of the Project Life

Gathering & Delivery SystemWhat is the cost of satellite compressors? 1000 $/HPWhat is the distance from the drainage area to the onsite project? 1000 ftWhat is the cost of installing header pipe from the drainage area? 40 $/ftWhat are the compressor and blower efficiencies? 0.035 HP/mcfd
How many drainage wells are being utilized? 6What is the spacing between drainage wells? 3740 ft
Drainage Well & Blower Development CostsWhat is the cost of well-head blowers? 1000 $/HPWhat is the mine depth? 1000 ftWhat is the drilling cost? 140 $/ftWhat is the fraction of this project's drainage system cost that will be included in the analysis?
100 %
Gas AvailabilityWhat is the source of the coal mine methane? abandoned mine gas drainagePercent Methane in Drainage Gas 70 % What do you expect the CMM drained per day to be? 1600 mcf/dWhat is the fraction of CMM available after losses? 95 %
User-Defined InputsWhat is the planned project operational lifetime? 20 yearsWhat is the loan term? 5 yearsWhat interest rate is charged for the loan? 6 %
Coalbed Methane Scenario: Xigou Gas Sales
What interest rate is charged for the loan? 6 %What is the developer's equity share in the project? 100 %What is the carbon credit unit sale price? 2 $/tonne CO2EWhat percent of CMM is consumed by prime-mover use? 10 %What is the distance to the natural gas pipeline? 5000 ftWhat is the cost of electric power used by the project? 77 $/MWhWhat is the price of the methane sold to the pipeline? 6.28 $/mmBtu(HHV)What is the installed cost of high pressure line from project to natural ga 40 $/ft
Default Parameters:What is the inflation rate? 2.5 %What is the real discount rate? 12 %What are the royalty, severance tax, and negotiation fees? 20 %What is the contingency factor? 5 %What is the annual escalation rate for carbon credits? 2 %How many hours per year will the project operate? 7500 hrs/year

Estimated Outputs:Available CMM for Other Projects 0 mcf/dTotal capital cost 7,856,000 $Total annual cost 1,115,000 $/yearEquity amount 7,856,000 $Loan amount 0,000 $Carbon credits earned per year 168,679 tonne/yearInternal rate of return (IRR) 22.08 %Net present value 5,335,000 $Quantity of exported Methane 373,864 Mcf/year
-8,000.00
-6,000.00
-4,000.00
-2,000.00
0.00
2,000.00
4,000.00
$000
Cash Flow Analysis
-10,000.00
-8,000.00
Year of the Project Life
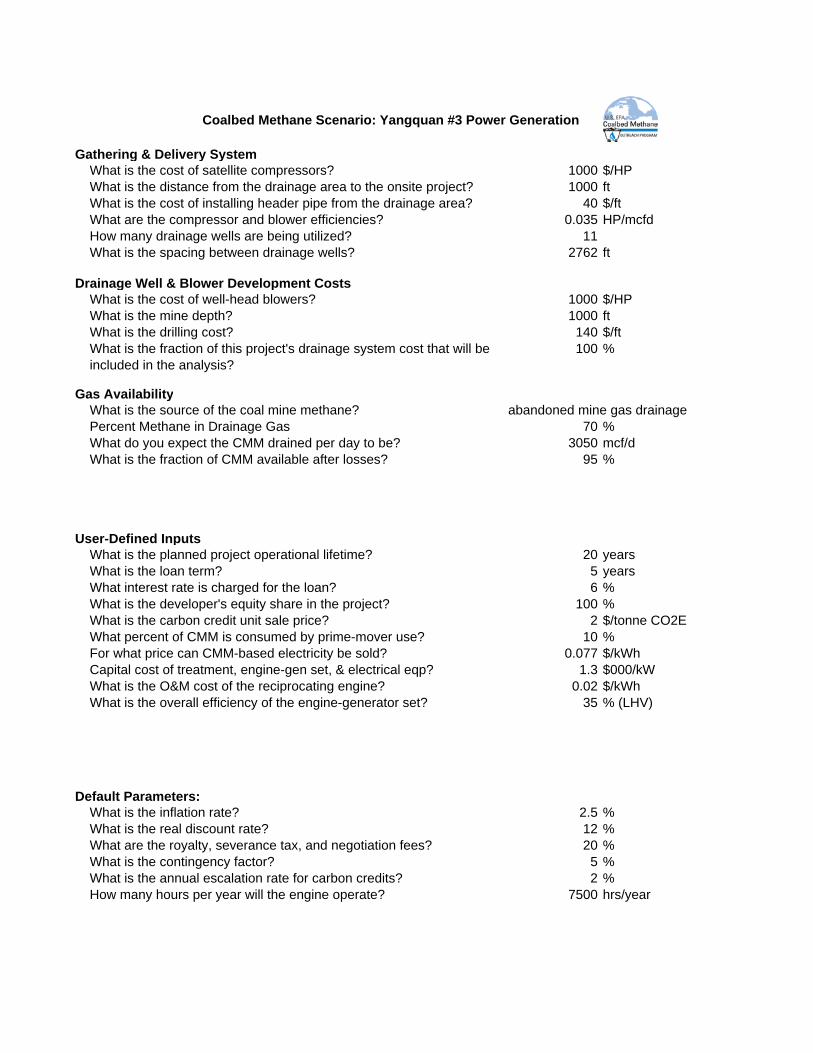
Gathering & Delivery SystemWhat is the cost of satellite compressors? 1000 $/HPWhat is the distance from the drainage area to the onsite project? 1000 ftWhat is the cost of installing header pipe from the drainage area? 40 $/ftWhat are the compressor and blower efficiencies? 0.035 HP/mcfd
How many drainage wells are being utilized? 11What is the spacing between drainage wells? 2762 ft
Drainage Well & Blower Development CostsWhat is the cost of well-head blowers? 1000 $/HPWhat is the mine depth? 1000 ftWhat is the drilling cost? 140 $/ftWhat is the fraction of this project's drainage system cost that will be included in the analysis?
100 %
Gas AvailabilityWhat is the source of the coal mine methane? abandoned mine gas drainagePercent Methane in Drainage Gas 70 % What do you expect the CMM drained per day to be? 3050 mcf/dWhat is the fraction of CMM available after losses? 95 %
User-Defined InputsWhat is the planned project operational lifetime? 20 yearsWhat is the loan term? 5 yearsWhat interest rate is charged for the loan? 6 %
Coalbed Methane Scenario: Yangquan #3 Power Generation
What interest rate is charged for the loan? 6 %What is the developer's equity share in the project? 100 %What is the carbon credit unit sale price? 2 $/tonne CO2EWhat percent of CMM is consumed by prime-mover use? 10 %For what price can CMM-based electricity be sold? 0.077 $/kWhCapital cost of treatment, engine-gen set, & electrical eqp? 1.3 $000/kWWhat is the O&M cost of the reciprocating engine? 0.02 $/kWhWhat is the overall efficiency of the engine-generator set? 35 % (LHV)
Default Parameters:What is the inflation rate? 2.5 %What is the real discount rate? 12 %What are the royalty, severance tax, and negotiation fees? 20 %What is the contingency factor? 5 %What is the annual escalation rate for carbon credits? 2 %How many hours per year will the engine operate? 7500 hrs/year
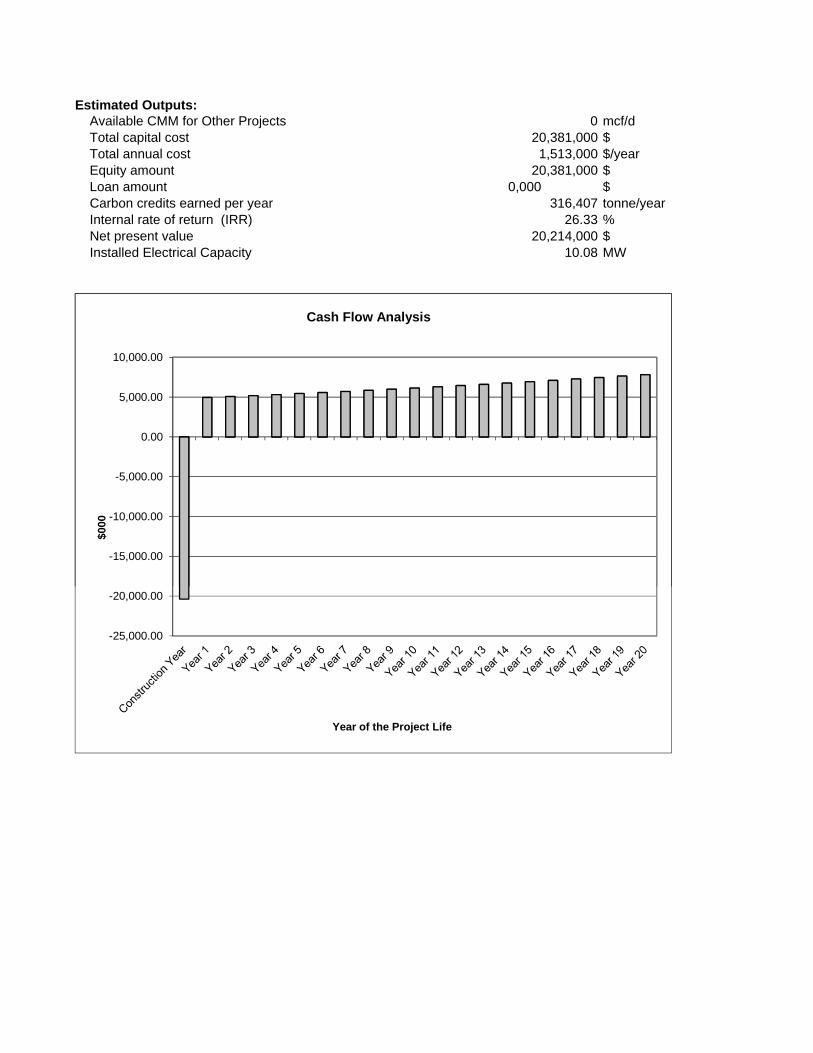
Estimated Outputs:Available CMM for Other Projects 0 mcf/dTotal capital cost 20,381,000 $Total annual cost 1,513,000 $/yearEquity amount 20,381,000 $Loan amount 0,000 $Carbon credits earned per year 316,407 tonne/yearInternal rate of return (IRR) 26.33 %Net present value 20,214,000 $Installed Electrical Capacity 10.08 MW
-20,000.00
-15,000.00
-10,000.00
-5,000.00
0.00
5,000.00
10,000.00
$000
Cash Flow Analysis
-25,000.00
-20,000.00
Year of the Project Life

Gathering & Delivery SystemWhat is the cost of satellite compressors? 1000 $/HPWhat is the distance from the drainage area to the onsite project? 1000 ftWhat is the cost of installing header pipe from the drainage area? 40 $/ftWhat are the compressor and blower efficiencies? 0.035 HP/mcfd
How many drainage wells are being utilized? 11What is the spacing between drainage wells? 2762 ft
Drainage Well & Blower Development CostsWhat is the cost of well-head blowers? 1000 $/HPWhat is the mine depth? 1000 ftWhat is the drilling cost? 140 $/ftWhat is the fraction of this project's drainage system cost that will be included in the analysis?
100 %
Gas AvailabilityWhat is the source of the coal mine methane? abandoned mine gas drainagePercent Methane in Drainage Gas 70 % What do you expect the CMM drained per day to be? 3050 mcf/dWhat is the fraction of CMM available after losses? 95 %
User-Defined InputsWhat is the planned project operational lifetime? 20 yearsWhat is the loan term? 5 yearsWhat interest rate is charged for the loan? 6 %
Coalbed Methane Scenario: Yangquan #3 Gas Sales
What interest rate is charged for the loan? 6 %What is the developer's equity share in the project? 100 %What is the carbon credit unit sale price? 2 $/tonne CO2EWhat percent of CMM is consumed by prime-mover use? 10 %What is the distance to the natural gas pipeline? 5000 ftWhat is the cost of electric power used by the project? 77 $/MWhWhat is the price of the methane sold to the pipeline? 6.28 $/mmBtu(HHV)What is the installed cost of high pressure line from project to natural ga 40 $/ft
Default Parameters:What is the inflation rate? 2.5 %What is the real discount rate? 12 %What are the royalty, severance tax, and negotiation fees? 20 %What is the contingency factor? 5 %What is the annual escalation rate for carbon credits? 2 %How many hours per year will the project operate? 7500 hrs/year
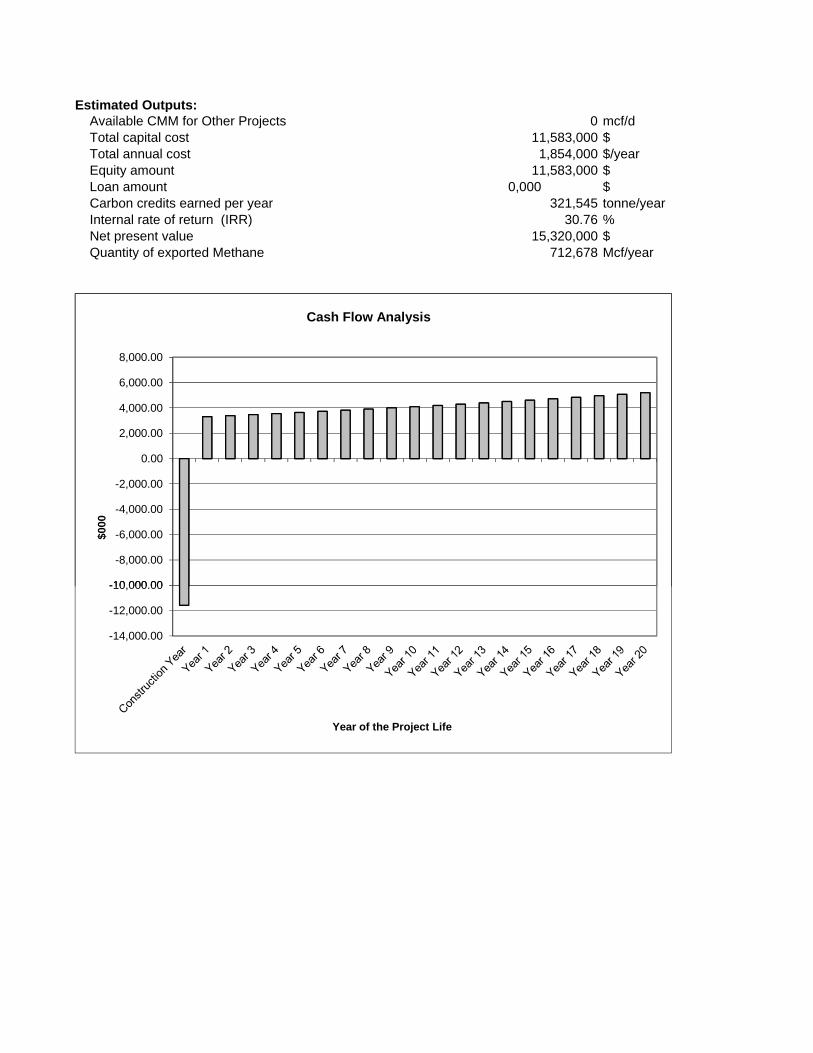
Estimated Outputs:Available CMM for Other Projects 0 mcf/dTotal capital cost 11,583,000 $Total annual cost 1,854,000 $/yearEquity amount 11,583,000 $Loan amount 0,000 $Carbon credits earned per year 321,545 tonne/yearInternal rate of return (IRR) 30.76 %Net present value 15,320,000 $Quantity of exported Methane 712,678 Mcf/year
-12,000.00
-10,000.00
-8,000.00
-6,000.00
-4,000.00
-2,000.00
0.00
2,000.00
4,000.00
6,000.00
8,000.00
$000
Cash Flow Analysis
-14,000.00
-12,000.00
-10,000.00
Year of the Project Life

Gathering & Delivery SystemWhat is the cost of satellite compressors? 1000 $/HPWhat is the distance from the drainage area to the onsite project? 1000 ftWhat is the cost of installing header pipe from the drainage area? 40 $/ftWhat are the compressor and blower efficiencies? 0.035 HP/mcfd
How many drainage wells are being utilized? 3What is the spacing between drainage wells? 4600 ft
Drainage Well & Blower Development CostsWhat is the cost of well-head blowers? 1000 $/HPWhat is the mine depth? 1000 ftWhat is the drilling cost? 140 $/ftWhat is the fraction of this project's drainage system cost that will be included in the analysis?
100 %
Gas AvailabilityWhat is the source of the coal mine methane? abandoned mine gas drainagePercent Methane in Drainage Gas 70 % What do you expect the CMM drained per day to be? 750 mcf/dWhat is the fraction of CMM available after losses? 95 %
User-Defined InputsWhat is the planned project operational lifetime? 20 yearsWhat is the loan term? 5 yearsWhat interest rate is charged for the loan? 6 %
Coalbed Methane Scenario: Xucun Power Generation
What interest rate is charged for the loan? 6 %What is the developer's equity share in the project? 100 %What is the carbon credit unit sale price? 2 $/tonne CO2EWhat percent of CMM is consumed by prime-mover use? 10 %For what price can CMM-based electricity be sold? 0.077 $/kWhCapital cost of treatment, engine-gen set, & electrical eqp? 1.3 $000/kWWhat is the O&M cost of the reciprocating engine? 0.02 $/kWhWhat is the overall efficiency of the engine-generator set? 35 % (LHV)
Default Parameters:What is the inflation rate? 2.5 %What is the real discount rate? 12 %What are the royalty, severance tax, and negotiation fees? 20 %What is the contingency factor? 5 %What is the annual escalation rate for carbon credits? 2 %How many hours per year will the engine operate? 7500 hrs/year

Estimated Outputs:Available CMM for Other Projects 0 mcf/dTotal capital cost 5,418,000 $Total annual cost 372,000 $/yearEquity amount 5,418,000 $Loan amount 0,000 $Carbon credits earned per year 77,805 tonne/yearInternal rate of return (IRR) 24.41 %Net present value 4,608,000 $Installed Electrical Capacity 2.48 MW
-5,000.00
-4,000.00
-3,000.00
-2,000.00
-1,000.00
0.00
1,000.00
2,000.00
3,000.00
$000
Cash Flow Analysis
-6,000.00
-5,000.00
-4,000.00
Year of the Project Life

Gathering & Delivery SystemWhat is the cost of satellite compressors? 1000 $/HPWhat is the distance from the drainage area to the onsite project? 1000 ftWhat is the cost of installing header pipe from the drainage area? 40 $/ftWhat are the compressor and blower efficiencies? 0.035 HP/mcfd
How many drainage wells are being utilized? 3What is the spacing between drainage wells? 4600 ft
Drainage Well & Blower Development CostsWhat is the cost of well-head blowers? 1000 $/HPWhat is the mine depth? 1000 ftWhat is the drilling cost? 140 $/ftWhat is the fraction of this project's drainage system cost that will be included in the analysis?
100 %
Gas AvailabilityWhat is the source of the coal mine methane? abandoned mine gas drainagePercent Methane in Drainage Gas 70 % What do you expect the CMM drained per day to be? 750 mcf/dWhat is the fraction of CMM available after losses? 95 %
User-Defined InputsWhat is the planned project operational lifetime? 20 yearsWhat is the loan term? 5 yearsWhat interest rate is charged for the loan? 6 %
Coalbed Methane Scenario: Xucun Gas Sales
What interest rate is charged for the loan? 6 %What is the developer's equity share in the project? 100 %What is the carbon credit unit sale price? 2 $/tonne CO2EWhat percent of CMM is consumed by prime-mover use? 10 %What is the distance to the natural gas pipeline? 5000 ftWhat is the cost of electric power used by the project? 77 $/MWhWhat is the price of the methane sold to the pipeline? 6.28 $/mmBtu(HHV)What is the installed cost of high pressure line from project to natural ga 40 $/ft
Default Parameters:What is the inflation rate? 2.5 %What is the real discount rate? 12 %What are the royalty, severance tax, and negotiation fees? 20 %What is the contingency factor? 5 %What is the annual escalation rate for carbon credits? 2 %How many hours per year will the project operate? 7500 hrs/year
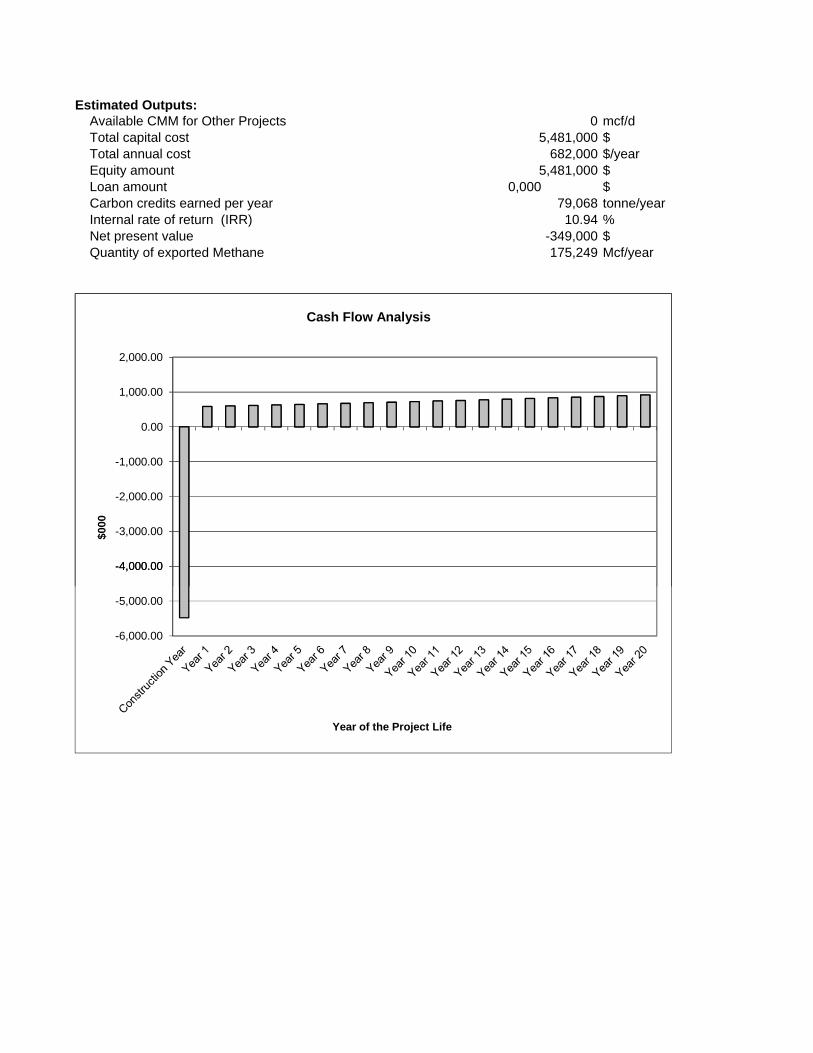
Estimated Outputs:Available CMM for Other Projects 0 mcf/dTotal capital cost 5,481,000 $Total annual cost 682,000 $/yearEquity amount 5,481,000 $Loan amount 0,000 $Carbon credits earned per year 79,068 tonne/yearInternal rate of return (IRR) 10.94 %Net present value -349,000 $Quantity of exported Methane 175,249 Mcf/year
-5,000.00
-4,000.00
-3,000.00
-2,000.00
-1,000.00
0.00
1,000.00
2,000.00
$000
Cash Flow Analysis
-6,000.00
-5,000.00
-4,000.00
Year of the Project Life