Embed Size (px)
DESCRIPTION
An Independent Assessment of Future Savings from Mitigation Activities. Project Management Committee Meeting April 2, 2004. Project Status Report. Track A. Project Status Report (cont’d.). Track B. Quality Control Process. Role of Internal Project Review Team - PowerPoint PPT Presentation
Citation preview

An Independent Assessment of An Independent Assessment of Future Savings from Mitigation Future Savings from Mitigation
ActivitiesActivities
Project Management Committee Meeting
April 2, 2004

Project Status ReportProject Status Report
Track ATrack A

Project Status Report Project Status Report (cont’d.)(cont’d.)
Track BTrack B

Quality Control ProcessQuality Control Process
Role of Internal Project Review TeamRole of Internal Project Review Team– Overarching, strategic, global inputOverarching, strategic, global input– Ensure that we remain focused on the Ensure that we remain focused on the
targettarget Quality checking functionQuality checking function
– Carried out for Track A by Track B Co-leaderCarried out for Track A by Track B Co-leader– Carried out for Track B by Track A co-leaderCarried out for Track B by Track A co-leader– Increasing the level of effort for each Increasing the level of effort for each
accordinglyaccordingly Proofing/technical editingProofing/technical editing
– Carried out by technical editor consultantCarried out by technical editor consultant

Track A - Status of Process-related Grants Track A - Status of Process-related Grants AnalysisAnalysis
Methodology Application Status Responsibility Status Responsibility A. Benefits 1. Simple Process Near Completion T, R, C Track A Pending R, P, B Track B Hayward M, T, C, B 2. Spinoff In Progress M, T, C Track A Pending R Track B Hayward M, T, C, B 3. Project Impact Starting T, R Track A Pending R Track B In Progress T, M, C, B. Costs 1. Simple Process Track A NEMIS data n.a. Completed P Track B Field data M, T Haywood M, T, C 2. Spinoff Track A In Progress R, P Pending R, P Track B In Progress M, T Hayward M, T, C 3. Project Impact Track A In Progress R Pending R Track B In Progress T, M In Progress T, M

Track A – Estimation of the Benefits of Track A – Estimation of the Benefits of Mitigation ProcessesMitigation Processes
Process Type
Purpose What to Measure
Major Sources of Uncertainty
How to Measure
Building Code improve
construction reduced losses # of structures compare with & without
using HAZUS Land Use Plan prohibit construction reduced losses # of structures compare with & without
using HAZUS Public Awareness modify behavior reduced losses measuring
self protection regression analysis w/ awareness variable
Community Organization
promote private/public action; modify behavior
reduced losses # of new activities self protection
measure activity effects; regression analysis
Interagency Cooperation
stimulate new mitig; improve effectiveness
reduced losses; cost reduction
# of new activities; effectiveness
measure activity effects; regression analysis
Risk Assessment improve
information; modify behavior
reduced losses # of new activities; self protection
measure activity effects; regression analysis
Specific Support of Existing Activity
a
improve effectiveness
reduced losses; cost reduction
effectiveness regression analysis; measure costs
General Support of Existing Activities
a
improve effectiveness
reduced losses; cost reduction
# of new activities; effectiveness
regression analysis; measure costs
Inducement of Future Single Activity
a
improve effectiveness
reduced losses over accelerated period
timing; effectiveness
measure timing
Inducement of Future Multiple Activities
a
improve effectiveness
reduced losses over accelerated period
# of new activities; timing; effectiveness
network analysis; measure timing
aIncludes subsidies, forming planning districts, providing technical assistance, etc.

Track A – Other ProgressTrack A – Other Progress
Assumptions and limitationsAssumptions and limitations
Data Management Plan (complete Data Management Plan (complete except worker field training)except worker field training)
Reconciliation of methodological Reconciliation of methodological differences with CBOdifferences with CBO

Track A - AssumptionsTrack A - AssumptionsOVERALL
Risk neutrality. This is a benefit-cost analysis, which requires the assumption of risk neutrality.
Seventeen categories of costs and benefits. Benefits are calculated as the expected present value of reduction in uncertain future losses. Costs are calculated as the expected present value of the cost to undertake a mitigation measure. Ten categories of benefit and seven categories of cost are considered, as listed in Tables 2 and 3 of [4]. We ignore other benefits and other costs.
Constant 50-year or 100-year planning period. Unless otherwise noted, property mitigation efforts will be assumed to be effective for 50 years for ordinary structures or 100 years for important structures and infrastructure, regardless of the age of the property mitigated. For convenience, mitigation efforts are treated as if they become effective on 1 January 2002 and remain effective until 31 Dec 2052.
Constant discount rates. Future economic values are brought to present value at time-constant discount rates of 2%, and are testing sensitivity of results to discount rates between 0% and 7%. Value of human health is not discounted.
Present value of past prices per CPI. All past prices are brought to present value (as of January 1, 2002) per [1].
1 U.S. Department of Labor, Bureau of Labor Statistics, 2004, Consumer Price Index, All Urban Consumers, U.S. City Average, All Items, Washington, D.C., ftp:/ / ftp.bls.gov/ pub/ special.requests/ cpi/ cpiai.txt
4 Applied Technology Council, 2003, Scoping Studies: Independent Study to Assess Future Savings from Mitigation Activities Track A - Selection of Methods to Estimate Nationwide Benefits and Costs of Mitigation.

Track A – Assumptions (cont’d.)Track A – Assumptions (cont’d.)
REPAIRS, CASUALTIES, AND ENVIRONMENTAL IMPACTS
Accuracy of FEMA data. This project uses as inputs three FEMA resources: the NEMIS database provided on 23 July 2003, geolocation information provided on 9 Feb 2004, and data we glean from grant applications. We assume these data are correct. (Note that we will perform limited QC of these data, per [1].)
Accuracy of USGS and CGS site soil data. The US Geological Survey and the California Geological Survey have compiled GIS maps of site soils in California and elsewhere. See, e.g., [2]. We assume these are accurate.
Accuracy of HAZUS-MH. We rely on the use of HAZUS-MH for estimates of mean annualized losses. While its accuracy remains to be fully proven over the course of time, it nonetheless represents the only national standard multi-hazard loss-estimation tool. We do not undertake to test or vet the software.
1 Porter, K.A., 2004, “ATC-61 quality control plan,” Applied Technology Council, Redwood City, CA.
2 Wills, C.J., M. Petersen, W.A. Bryant, M. Reichle, G.J. Saucedo, S. Tan, G. Taylor, and J. Treiman, 2000, A Site Conditions Map for California Based on Geology and Shear Wave Velocity, California Geological Survey, Sacramento, CA, 41 pp.

Track A – Assumptions Track A – Assumptions (cont’d.)(cont’d.)
Adequacy of assumed hazard strata. We have assumed that hazard can be stratified as low, medium, or high, for each of three perils: flood, earthquake, and wind. Our stratification scheme for wind and earthquake is defined in [1]; our flood hazard stratification scheme is defined in [2].
Value of human health per FHWA assumptions. Values are assumed for unpriced resources, most notably the environment and human health. For human health, we assume values for statistical deaths and injuries per [3].
Constant hazard levels. Unless otherwise noted, hazard levels are assumed to be time-invariant as codified in HAZUS-MH.
Projects approved before 1 January 1994 are ignored. Per [4], the present project excludes from its scope of work all projects with an approval date of 31 Dec 1993 or earlier.
1 Applied Technology Council, 2003, Scoping Studies: Independent Study to Assess Future Savings from Mitigation Activities Track A - Selection of Methods to Estimate Nationwide Benefits and Costs of Mitigation.
2 Porter, K.A., 2004, “Flood hazard stratification,” email to Adam Rose, Charles Huyck, Ron Eguchi, and Tom Mclane, 10 Feb 2004
3 Federal Highway Administration, 1994, Technical Advisory: Motor Vehicle Accident Costs, Technical Advisory #7570.2, U.S. Department of Transportation, Washington, D.C. http:/ / fhwa.dot.gov/ legsregs/ directives/ techadvs/ t75702.htm.
4 McLane, T., 2004, “Pre-1993 projects to be excluded from sampling and CBA by Track A,” email to Tom Tobin and Maria Vorel, 5 Feb 2004

Track A - LimitationsTrack A - Limitations
REPAIRS, CASUALTIES, AND ENVIRONMENTAL IMPACTS
Sociological benefits are probably underestimated. The major limitations in evaluating the sociological benefits of mitigation are: 1) sociological benefits are not easily quantifiable; 2) sociological benefits are very rarely including in cost-benefit analysis and as a result, there is not state of the art to build from; 3) sociological data are not readily and easily available; and 4) because of the difficulties of data collection, the quantifiable sociological benefits of mitigation will be limited to two major variable: casualties and displaced households. As a result, sociological benefits of mitigation are probably underestimated.
Environmental benefits may be underestimated because of lack of data. The major limitation in evaluating the environmental benefits is the lack of information on the environmental effects of any given mitigation project. Without this information, we assume that the environmental benefits are zero or a very small component of the total benefits. As a result, environmental benefits will tend to be underestimated.

Track A – Limitations Track A – Limitations (cont’d.)(cont’d.)
DIRECT BUSINESS INTERRUPTION
1-3 year old BI data. Most input data for direct business interruption calculations are 1-3 years old. The implications are unknown.
Several HAZUS default values used. The following variables will always require the use of HAZUS default values: relocation costs, repair duration, building recovery time, and recapture factor. See Table 2 of [1] for the location of HAZUS default values. The implications of using these default values are unknown.
Reliance on some recent IMPLAN I-O variables. The following variables are adapted (data transfer) from value-added composition of the most recent U.S. IMPLAN Input-Output Table: capital-related income, wages and salaries, and rental income. The implications are unknown.
Direct BI not applicable for residences. Direct business interruption losses are not applicable to residences directly impacted by the hazard. We do not believe this assumption biases the results.
1 Applied Technology Council, 2003, Track A Project Pilot Study: St Agnes Medical Center Seismic Retrofit, Redwood City, CA

Track A – Limitations Track A – Limitations (cont’d.)(cont’d.)
INDIRECT BUSINESS INTERRUPTION
Regional economy delineated by county or county group. The regional economy is delineated as a county or county group (metropolitan area) that incurs physical damage, when, in fact, most economic regions, or trading areas, do not conform precisely to political boundaries. Thus, in our analysis, indirect business interruption impacts are assumed to be limited to the county or county group. Areas beyond this are assumed to be able to readily absorb indirect impacts without significant loss. The result is that loss estimates are biased downward.
Transfer payments set to zero. To exclude transfer payments, outside aid (government aid, private philanthropy, and insurance payments) are set at zero. Note, this still allows for reconstruction spending, but it is offset as individuals and businesses repay loans or replenish savings. This is a controversial point; whether it produces any bias has not yet been determined.
Use of HAZUS Level-1 “synthetic” regional input-output tables. These tables were developed from a sample of actual IMPLAN regional I-O tables in three categories for earthquakes and wind hazards: (1) manufacturing/ service, (2) service/ manufacturing, and (3) service/ trade. Two additional categories relating to agriculturally-based economies are included in the HAZUS flood version. This improves the accuracy of the flood module. The HAZUS input-output (I-O) algorithm is superior to standard I-O formulations. It retains the standard limitations: (1) lack of input substitution, and (2) absence of the explicit role of prices. The effect is a bias toward higher indirect business interruption losses. The use of HAZUS Level-1 I-O tables offers greater accuracy than the standard I-O model, in two respects: (1) flexible import and export structures, as well as inventories, to eliminate shortages and surpluses, and (2) explicit constraints on capacity, especially with regard to construction.

Track A – Limitations Track A – Limitations (cont’d.)(cont’d.)
1-3 year-old I-O data. Most input data and the I-O tables are 1-3 years old. The implications are unknown.
Unemployment rate is used as a proxy for excess capacity. The result is a downward bias in indirect BI loss.
HAZUS default values used. The following variables will always require the use of default values (see Table 3 of [1]): (1) import capability (all sectors, though differentiated), (2) export capability (all sectors, though differentiated), (3) restoration of function (all sectors, though differentiated), and (4) rebuilding pattern (all sectors, though differentiated). The implications are unknown.
Best available data used for other parameters. The following variables are specified with best available data: (1) inventory demand (all sectors, though differentiated), (2) inventory supply (all sectors, though differentiated), and (3) discount rate. The implications are unknown.
Indirect business interruption losses are not applicable in several cases. These are where the mitigation grant is confined to: (1) residences (no bias) or (2) individual or small in-city groups schools, libraries, hospitals, and fire houses. In most cases they have no forward linkage to business and backward linkages are maintained by the absorption of their activity by similar units within the region (bias downward).
1 Applied Technology Council, 2003, Track A Project Pilot Study: St Agnes Medical Center Seismic Retrofit, Redwood City, CA

Sample sizeSample size
Peril Type Haz level Population Sample(1)
Wind Project H 287 25 + 10M 411 25 + 10L 508 25 + 10
Process N/A 382 25 + 10Flood Project H 1164 25 + 10
M 1965 25 + 10L 266 25 + 10
Process N/A 106 25 + 10Earthquake Project H 338 25 + 10
M 7 7 + 0L 0 0 + 0
Process N/A 47 25 + 10
Total 257+100
(1) Primary + backup samples

New sampling schemeNew sampling schemeS
chem
e A
(or
ig.)
Sch
eme
A (
orig
.)S
chem
e B
(ne
w)
Sch
eme
B (
new
)
i.e., select 1 mitigation from i.e., select 1 mitigation from each of each of NN equal-costequal-cost substrata substrata
of mitigations sorted by costof mitigations sorted by cost
i.e., select 1 mitigation from i.e., select 1 mitigation from each of each of NN equal-countequal-count substrata substrata
of mitigations sorted by costof mitigations sorted by cost

Processes sampled, by countProcesses sampled, by count
Project Impact, 30
Local Multihazard Mitigation Plan, 16Public Awareness and
Education, 14
Codes, Standards, Ordinances and Regulations, 11
Feasibility, Engineering and Design Studies, 7
Miscellaneous, 5
State Multihazard Mitigation Plan, 4
Applied Research and Development, 4
Other Non Construction, 4
Professional Education, 2

Sampling + benefit-est. Sampling + benefit-est. schemescheme
2 sampling schemes2 sampling schemes x2 ways to scale up to stratum x2 ways to scale up to stratum
benefitbenefit1.1. Apply sample-average benefitApply sample-average benefit
2.2. Apply sample-average BCRApply sample-average BCR
Use sampling & scale-up scheme Use sampling & scale-up scheme with: with:
– Unbiased estimate of stratum benefitUnbiased estimate of stratum benefit– Minimum uncertainty of stratum Minimum uncertainty of stratum
benefitbenefit

Tests of 4 schemesTests of 4 schemes
SamplingSampling Benefit estimateBenefit estimate BiasBias UncertUncert
A Equiprobable 1 Sample-avg benefit 0.001 0.55
2 Sample-avg BCR 0.82 NG 1.56
B Prefer high-cost 1 Sample-avg benefit -0.40 NG 0.05
2 Sample-avg BCR 0.023 0.39
“Bias” means avg error of benefit from selecting 25 mitgigation efforts from NEMIS, assuming correct benefit“Uncertainty” means standard deviation of error“Error” means fractional diff between true & estimated pop benefit

Summary of new sampling Summary of new sampling schemescheme
New selection & scale-up schemeNew selection & scale-up scheme– Prefer high-cost mitigationsPrefer high-cost mitigations– Yet sample low, medium, & high cost Yet sample low, medium, & high cost – Use sample-mean BCR for stratum Use sample-mean BCR for stratum
benefitbenefit Internally QC’d; informed 2 PMC Internally QC’d; informed 2 PMC
peoplepeople
Sample of 25/stratum yields unbiased, Sample of 25/stratum yields unbiased, low-uncertainty benefit estimatelow-uncertainty benefit estimate

Recent obstaclesRecent obstacles
Cutoff dateCutoff date– 11stst sample: no cutoff date sample: no cutoff date– 22ndnd sample: exclude mitigations approved < 1/1/1994 sample: exclude mitigations approved < 1/1/1994– 33rdrd sample: exclude only HMGP for disasters < 993 sample: exclude only HMGP for disasters < 993
PI PI – 11stst sample: excluded because no peril available sample: excluded because no peril available– 22ndnd sample: included based on ATC-assigned main peril sample: included based on ATC-assigned main peril– 33rdrd sample: included based on FEMA-assigned main sample: included based on FEMA-assigned main
perilperil– 36 of 105 process samples are PI36 of 105 process samples are PI
Flood hazard severityFlood hazard severity– 11stst sample: no flood hazard because sample: no flood hazard because
Lack of 500-yr FP mapsLack of 500-yr FP maps HAZUS-based assignments would have been too costlyHAZUS-based assignments would have been too costly
– 22ndnd sample: severity via stream and coastal distance sample: severity via stream and coastal distance
Track B StatusTrack B Status
Community
FEMA Projects (NEMIS/ Actual)
Vorel Schedule Call with Region State Visit Federal Visit
Date of FEMA Letter
Confirmation Letter
Received, Given OK to Start Calls
Initial Data
Analysis
Schedule and Conduct
Interviews Community
Visits Hayward, CA 4/4 11/25/03
DONE Sacramento
12/15/03 DONE
Oakland 12/16/03 DONE
12/19/03 DONE
1/8/04 DONE
1/22/04 DONE
1/12/04-2/19/04 3/12/04 DONE
2/23/04-2/24/04 DONE
Jefferson Co., AL Project Impact
10/3 1/5/04 DONE
Clanton Not Planned1
Atlanta 2/9-2/11/04
DONE
1/15/04 DONE
2/5/04 DONE
TBA 2/5/04-3/10/04 Tentatively
DONE pending visit.
Tentative: Apr, 04
Freeport, NY Project Impact
6/3 2/5/04 DONE
Albany Not Planned1
NYC 2/26/04-2/27/04
DONE
3/1/04 DONE
3/11/04 DONE
TBA 3/12/04- In Process
Tentative: Apr, 04
Horry Co., SC Project Impact
10/4 1/5/04 DONE
Columbia 2/17/04-2/18/04
DONE
Atlanta 2/11/04-2/13/04
DONE
1/15/04 DONE
2/7/04 DONE
TBA 2/13/04-3/2/04 Tentatively
DONE pending visit.
Tentative: Apr, 04
Jamestown, ND Project Impact
4/TBA 3/30/04 DONE
Bismarck Not Planned1
Denver TBA
TBA
TBA
TBA TBA TBA
Tuscola Co., MI 3/TBA 1/27/04 DONE
Lansing2 3/17/04 DONE
Chicago 2/17/04-2/18/04
DONE
3/4/04 DONE
3/10/04 DONE
DONE 3/11/04- In Process
3/16/04-3/17/04 DONE
NOTE: Field visits were completed only in those communities in which the initial data analysis had been completed and to give time for the preparation of the Hayward
Interim Report. 1 After visiting three state offices it was determined that the majority of information obtained was identical to that available in FEMA regional offices. 2 Meeting with State Officials while in Tuscola County.

Track B - Variables Associated With Successful Track B - Variables Associated With Successful Hazard Mitigation ProgramsHazard Mitigation Programs
Variables Identified at Tulsa Existence in Hayward Institutionalization Yes Maintenance of Mitigation Program Yes Capital Projects Yes Stringent Regulations Yes Enforced Stringent Regulations Yes Aggressive Citizen Awareness and Mobilization Programs
No
Champions Yes (Two Generations) Partners No (Few) Cooperation of Development Community
Yes (Commercial) No (Residential)

Track B – Synopsis of Hayward Track B – Synopsis of Hayward Community StudyCommunity Study
BCA of 4 HMGP grants indicates that Hayward benefited by BCA of 4 HMGP grants indicates that Hayward benefited by $10 in direct and indirect benefits along with $80 in spin-off $10 in direct and indirect benefits along with $80 in spin-off benefits for every dollar invested by FEMA. benefits for every dollar invested by FEMA.
The total benefit-cost ratio for all public and private activities The total benefit-cost ratio for all public and private activities associated with HMGP grants is estimated to be 4.9.associated with HMGP grants is estimated to be 4.9.
Following Loma Prieta, a Hayward Hazardous Building Following Loma Prieta, a Hayward Hazardous Building Mitigation Task Force developed a seismic program that Mitigation Task Force developed a seismic program that included the award of 4 HMGP grants and the initiation of 2 included the award of 4 HMGP grants and the initiation of 2 significant spin-off activities, the creation and implementation significant spin-off activities, the creation and implementation of ordinances requiring the seismic retrofit of all tilt-up of ordinances requiring the seismic retrofit of all tilt-up buildings and unreinforced masonry structures. buildings and unreinforced masonry structures.
An estimated 282 privately owned buildings have been An estimated 282 privately owned buildings have been retrofitted at an estimated private cost of $53.4M (2002 retrofitted at an estimated private cost of $53.4M (2002 dollars), 17.2 times the amount that was initially invested by dollars), 17.2 times the amount that was initially invested by FEMA ($3.1M in 2002 dollars) for all HMGP grant expenditures FEMA ($3.1M in 2002 dollars) for all HMGP grant expenditures evaluated.evaluated.

Track B – Study ProcessTrack B – Study Process Contacts were made with the California Seismic Safety Commission Contacts were made with the California Seismic Safety Commission
(CSSC) and the Association of Bay Area Governments (ABAG) for their (CSSC) and the Association of Bay Area Governments (ABAG) for their insights into mitigation activities in Hayward and for the names of insights into mitigation activities in Hayward and for the names of potential interviewees. potential interviewees.
FEMA initiated a conference call with mitigation personnel at FEMA FEMA initiated a conference call with mitigation personnel at FEMA Region IX to obtain their cooperation in supplying files for the 4 HMGP Region IX to obtain their cooperation in supplying files for the 4 HMGP grants grants
A letter was sent from FEMA to the community and the State Hazard A letter was sent from FEMA to the community and the State Hazard Mitigation Officer (SHMO) notifying them of the study and requesting Mitigation Officer (SHMO) notifying them of the study and requesting their assistance.their assistance.
Field visits to both the FEMA Region IX office and SHMO were made to Field visits to both the FEMA Region IX office and SHMO were made to obtain copies of relevant documents for the four HMGP grants. obtain copies of relevant documents for the four HMGP grants.
With the help of the community representative, interviews were set With the help of the community representative, interviews were set up and the arrangements for the community visit were undertaken.up and the arrangements for the community visit were undertaken.
Telephone interviews began with the name of the contact person and Telephone interviews began with the name of the contact person and names of others provided by the SHMO, the FEMA region, the CSSC, names of others provided by the SHMO, the FEMA region, the CSSC, and ABAG. and ABAG.
ATC made a community visit to collect additional data, to discuss the ATC made a community visit to collect additional data, to discuss the chronology of events to prepare the chronology of events to prepare the Inference MapInference Map, and to find , and to find additional people for interviews.additional people for interviews.
Telephone interviews were conducted.Telephone interviews were conducted. Benefit-cost analysis was completed. Benefit-cost analysis was completed.

Track B – Inference MapTrack B – Inference Map

Track B - HMGP Grants Awarded to Track B - HMGP Grants Awarded to HaywardHayward
Grant Number
Title Approved Cost Date of Approval
845-0014 Reconstruction of Wastewater Treatment Plant
$811,576 12/31/91
845-0015 Relocation of Fire Station #1 $3,186,000 5/3/94 845-0074 Seismic Retrofit of Fire Stations 2-5 and
Yard Building $980,000 4/9/92
845-0079 Public Awareness Handbook $20,800 4/9/92

Track B - Summary of Cost Estimates Track B - Summary of Cost Estimates (2002 Dollars) for HMGP Grants(2002 Dollars) for HMGP Grants
HMGP Grant Brief Description Year Actual Project Cost
Inflation Adjustment
Cost (2002 dollars)
845-0014 Sodium Hypochlorite Facility
1991 $801,576 1.32 $1.058M
845-0015 Replace Fire Station #1 1994 $3,186,000 1.21 $3.855M
845-0074 Seismic Retrofit of Four Fire Stations
1992 $980,000 1.28 $1.254M
845-0079 Public Brochure 1992 $20,000 1.28 $0.026M

Track B - Cost Per Sq. Ft. Estimates for Track B - Cost Per Sq. Ft. Estimates for Seismically Upgrading and Replacing URMs and Seismically Upgrading and Replacing URMs and
Tilt-up StructuresTilt-up Structures
Structural Frame System
Basic Seismic Upgrade Costs per sq. ft. (2002 dollars) (EQE, 1989)
Upper Bound Seismic Upgrade Costs per sq. ft. (2002 dollars) (EQE, 1989)
Medium Replacement Costs per sq. ft. (RSMeans uses “low,” “medium,” and “high”)
Masonry $19.14 $36.25 $68
Tilt-up $7.98 $14.50 $55

Track B - Estimated Seismic Upgrade Costs for Track B - Estimated Seismic Upgrade Costs for Sampled Seismic Retrofits for Masonry and Tilt-Sampled Seismic Retrofits for Masonry and Tilt-
up Structuresup Structures
Structural Frame System
Number of cases Average Square Footage
Average Basic Upgrade Cost (2002 dollars)
Total Estimated Basic Upgrade Expenditures (2002 dollars)
Masonry 92 5,954 $114K $10.5M
Tilt-up 190 28,271 $226K $42.9M

Track B - Annualized Dollar Estimates of Track B - Annualized Dollar Estimates of BenefitsBenefits
Facilities Assessed
Annual Injuries Reduced ($)
(1)
Annual Direct Damage Reduced ($)
(2)
Annual B.I. Losses Reduced ($)
(3)
Annual Indirect Losses (at 34% times direct B.I. losses: see Appendix)
(4)
Total Annual Losses Excluding Lives Saved (5)=(1)+(2)+(3)+(4)
Annual Lives Saved ($)
Wastewater facility
$425K N/C N/C N/C $425K N/C
Fire stations $361K $600K N/C N/C $961K $25K
Tilt ups $1.2M $1.27M $0.064M $0.021M $2.56M $3.08M
URMs $322K $213K $13K $5K $553K $733K
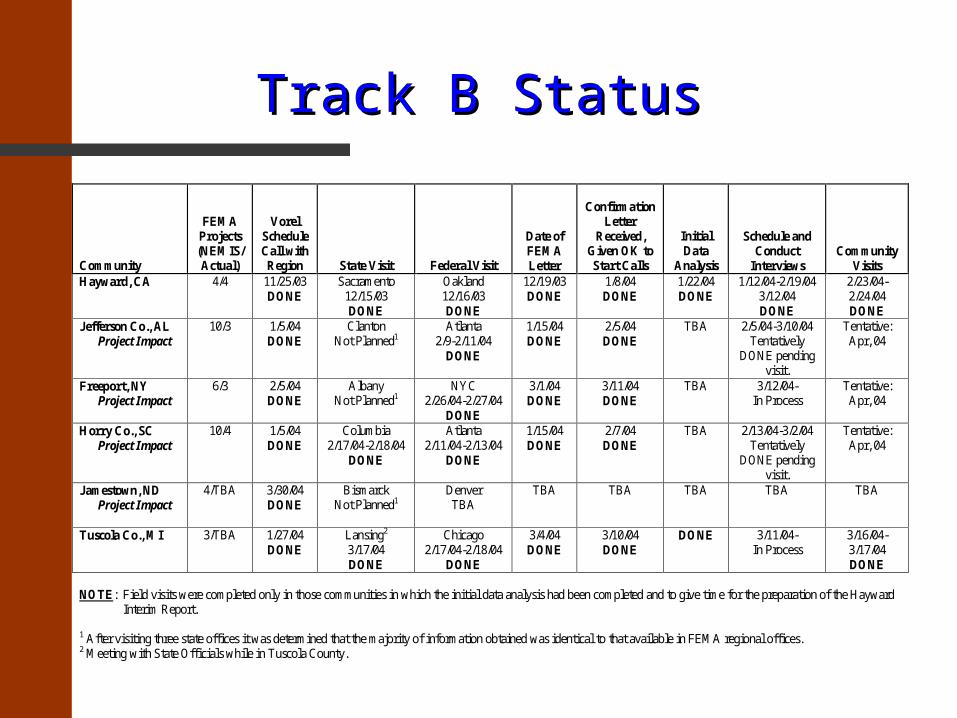
Track B - Summary of Benefit-Cost Estimates for Track B - Summary of Benefit-Cost Estimates for the 4 Main Mitigation Activities in Haywardthe 4 Main Mitigation Activities in Hayward
Present Value of Losses Excluding Lives Saved
Present Value of Benefits Facilities Assessed
Cost (2002 dollars)
7% (1)
3 ½ % (2)
3% (3)
0% (4)
7% (5)=(1)+(4)
3½% (6)=(2)+(4)
3% (7)=(3)+(4)
Wastewater facility
$1.06M $5.7M (lower bound)
$8.2M (lower bound)
$8.8M (lower bound)
N/A $5.7M $8.2M $8.8M
Fire stations $5.11M $14.2M $23.5M $25.7M $1.2M $15.4M $24.7M $26.9M
Tilt ups $42.9M $37.8M $62.5M $68.3M $154M $191.8M $216.5M $222.3M
URMs $10.5M $8.1M $13.5M $14.8M $36.6M $44.7M $50.1M $51.4M


![RESORT SAVINGS & LOANS PLC [RC:198901] ANNUAL REPORT … · 2019-01-02 · Report of the Audit Committee 15 b. Report of the Independent Auditors 16 ... Current Account, Savings and](https://img.pdfslide.net/doc/110x75/5e73a4f4ac17e6372932e24a/resort-savings-loans-plc-rc198901-annual-report-2019-01-02-report-of.jpg)