Embed Size (px)
Citation preview
SBERBANK (SAVINGS BANK OF THE RUSSIAN FEDERATION)
Financial Statements and Independent Auditors’ Report
For the year ended 31 December 2003

Sberbank (Savings Bank of the Russian Federation) Financial Statements and Independent Auditors’ Report
CONTENTS INDEPENDENT AUDITORS’ REPORT
Balance Sheets ....................................................................................................................................................... 1 Statements of Income ............................................................................................................................................. 2 Statements of Cash Flows....................................................................................................................................... 3 Statements of Changes in Shareholders’ Equity....................................................................................................... 4
NOTES TO THE FINANCIAL STATEMENTS 1 Principal Activities ...................................................................................................................................... 5 2 Operating Environment................................................................................................................................ 5 3 Basis of Presentation ................................................................................................................................... 5 4 Significant Accounting Policies ................................................................................................................... 6 5 Cash and Cash Equivalents ........................................................................................................................ 10 6 Trading Securities...................................................................................................................................... 11 7 Due from Banks ........................................................................................................................................ 11 8 Securities Available for Sale ...................................................................................................................... 12 9 Loans and Advances to Customers............................................................................................................. 12 10 Securities Acquired at Original Issuance .................................................................................................... 13 11 Premises and Equipment............................................................................................................................ 14 12 Other Assets .............................................................................................................................................. 15 13 Due to Banks............................................................................................................................................. 15 14 Deposits from Individuals and Customer Accounts..................................................................................... 15 15 Own Securities Issued................................................................................................................................ 16 16 Other Borrowed Funds............................................................................................................................... 16 17 Other Liabilities......................................................................................................................................... 17 18 Share Capital............................................................................................................................................. 17 19 Shareholders’ Equity ................................................................................................................................. 18 20 Interest Income and Expense...................................................................................................................... 18 21 Gains Less Losses from Securities and Derivatives .................................................................................... 19 22 Fee and Commission Income and Expense................................................................................................. 19 23 Other Operating Income ............................................................................................................................ 20 24 Payroll and Other Staff Expenses ............................................................................................................... 20 25 Operating Expenses ................................................................................................................................... 20 26 Income Taxes ............................................................................................................................................ 20 27 Earnings per Share..................................................................................................................................... 22 28 Dividends.................................................................................................................................................. 22 29 Analysis by Segment and Geography......................................................................................................... 23 30 Interest Rate, Currency, Liquidity, Market and Credit Risks ....................................................................... 29 31 Contingencies, Commitments and Derivative Financial Instruments ........................................................... 32 32 Fair Value of Financial Instruments ........................................................................................................... 35 33 Related Party Transactions......................................................................................................................... 35 34 Capital Adequacy ...................................................................................................................................... 36

INDEPENDENT AUDITORS' REPORT
To the Shareholders and Supervisory Board of Sberbank (Savings Bank of the Russian Federation) -
We have audited the accompanying balance sheet of Sberbank (Savings Bank of the Russian Federation) (the "Bank") as of 31 December 2003, and the related statements of income, changes in shareholders' equity and cash flows for the year then ended. These financial statements are the responsibility of the Bank's management. Our responsibility is to express an opinion on these financial statements based on our audit.
We conducted our audit in accordance with International Standards on Auditing. Those standards require that we plan and perform the audit to obtain reasonable assurance about whether the financial statements are free of material misstatement. An audit includes examining, on a test basjs, evidence supporting the amounts and disclosures in the financial statements. An audit also includes assessing the accounting principles used and significant estimates made by management, as well as evaluating the overall financial statement presentation. We believe that our audit provides a reasonable basis for our opinion.
In our opinion, the financial statements referred to above present fairly, in all material respects, the financial position of the Bank as of 31 December 2003, and the results of its operations and its cash flows for the year then ended in accordance with International Financial Reporting Standards.

Sberbank (Savings Bank of the Russian Federation) Balance Sheets as of 31 December (Thousands of Russian Rubles, unless otherwise indicated)
The accompanying notes are an integral part of these financial statements.
1
Note 2003 2002 Assets Cash and cash equivalents 5 45,615,928 67,608,513 Mandatory cash balances with the Central Bank of the Russian Federation 98,893,608 74,808,687 Trading securities 6 135,309,528 125,854,436 Due from banks 7 78,629,557 40,024,779 Securities available for sale 8 176,694,073 93,025,286 Loans and advances to customers 9 792,363,615 516,671,183 Securities acquired at original issuance 10 73,535,315 102,027,415 Tax asset 26 3,481,131 1,643,607 Premises and equipment 11 66,101,471 61,675,642 Other assets 12 6,877,032 3,673,820 Total assets 1,477,501,258 1,087,013,368 Liabilities Due to banks 13 37,889,470 4,053,218 Deposits from individuals 14 978,580,839 708,015,138 Customer accounts 14 211,561,162 187,745,057 Own securities issued 15 104,010,365 54,160,970 Other borrowed funds 16 1,053,151 1,467,509 Other liabilities 17 9,533,108 8,451,980 Total liabilities 1,342,628,095 963,893,872 Shareholders’ equity Share capital 18 20,980,583 20,980,583 Share premium 10,016,190 10,016,190 Treasury shares 18 (312) (411) Revaluation reserve for premises 11 474,987 497,605 Retained earnings and other reserves 103,401,715 91,625,529 Total shareholders’ equity 19 134,873,163 123,119,496 Total liabilities and shareholders’ equity 1,477,501,258 1,087,013,368
Signed on behalf of the Board on 25 June 2004.

Sberbank (Savings Bank of the Russian Federation) Statements of Income for the Years Ended 31 December (Thousands of Russian Rubles, unless otherwise indicated)
The accompanying notes are an integral part of these financial statements.
2
Note 2003 2002 Interest income on loans 20 102,637,027 94,794,887 Interest income on securities 20 25,872,758 36,785,503 Interest expense 20 (79,642,994) (58,729,018) Net interest income 48,866,791 72,851,372 Impairment of interest earning assets 7, 9 (16,509,860) (13,651,554) Net interest income after impairment of interest earning assets 32,356,931 59,199,818 Gains less losses arising from securities and derivatives 21, 31 40,979,241 19,344,898 Gains less losses arising from dealing in foreign currencies 4,274,093 2,886,561 Foreign exchange translation gains less losses (6,300,889) 3,579,901 Fee and commission income 22 22,096,989 16,929,637 Fee and commission expense 22 (644,722) (480,229) Other operating income 23 2,604,506 2,220,310 Net operating income 95,366,149 103,680,896 Payroll and other staff expense 24 (50,193,457) (43,462,154) Operating expenses 25 (28,981,804) (24,380,268) Provision for credit related commitments (30,993) (16,659) Monetary loss – (7,922,164) Profit before taxation 16,159,895 27,899,651 Income tax 26 (2,226,382) (7,641,373) Net profit 13,933,513 20,258,278 Earnings per share (expressed in Russian Rubles per share) 27 727 1,063

Sberbank (Savings Bank of the Russian Federation) Statements of Cash Flows for the Years Ended 31 December (Thousands of Russian Rubles, unless otherwise indicated)
The accompanying notes are an integral part of these financial statements.
3
Note 2003 2002 Cash flows from operating activities Interest received on loans 101,112,617 94,743,781 Interest received on securities 30,067,610 32,767,528 Interest paid (72,937,761) (56,817,683) Income received from dealing in securities and derivatives 43,442,442 11,713,336 Income received from dealing in foreign currencies 4,274,093 2,886,561 Fees and commissions received 22,096,989 16,929,637 Fees and commissions paid (644,722) (480,229) Other operating income received 2,305,534 2,190,166 Staff costs paid (47,149,134) (40,731,100) Operating expenses (19,696,543) (24,000,002) Income tax paid (4,056,763) (6,267,197) Operating profits before changes in operating assets and liabilities 58,814,362 32,934,798 Cash flows from operating assets and liabilities Net (increase)/decrease in assets:
Mandatory cash balances with the Central Bank of the Russian Federation (24,084,921) (22,852,002) Trading securities (15,772,527) (55,783,548) Due from banks (38,046,455) (41,378,278) Loans and advances to customers (292,737,858) (153,640,094) Securities available for sale (75,830,911) (8,141,134) Securities acquired at original issuance 21,684,994 4,985,996 Other assets (3,232,210) 1,584,261
Net increase/(decrease) in liabilities: Due to banks 30,707,858 (12,367,011) Deposits from individuals 265,228,588 212,790,671 Customer accounts 22,942,794 60,015,812 Own securities issued other than eurobonds 17,026,397 26,469,692 Other liabilities (4,949,074) 1,007,387
Net cash (used in) / provided by operating activities (38,248,963) 45,626,550 Cash flows used in investing activities Purchase of premises and equipment 11 (11,836,195) (9,661,646) Proceeds from sale of premises and equipment 1,061,772 448,660 Sales of other investments (53,232) – Dividend income received 23 110,174 30,144 Net cash used in investing activities (10,717,481) (9,182,842) Cash flows from financing activities Eurobond issuance 29,718,636 – Sale of treasury shares 99 800 Other borrowed funds repaid (427,447) (95,897) Dividends paid 28 (2,177,906) (1,115,484) Net cash provided by / (used in) financing activities 27,113,382 (1,210,581) Effect of exchange rate changes on cash and cash equivalents (139,523) 370,723 Effect of inflation on cash and cash equivalents – (8,066,210) Net (decrease)/increase in cash and cash equivalents (21,992,585) 27,537,640 Cash and cash equivalents at the beginning of the year 67,608,513 40,070,873 Cash and cash equivalents at the end of the year 5 45,615,928 67,608,513

Sberbank (Savings Bank of the Russian Federation) Statements of Changes in Shareholders’ Equity for the Years Ended 31 December (Thousands of Russian Rubles, unless otherwise indicated)
The accompanying notes are an integral part of these financial statements.
4
Share capital Share
premium Treasury
shares
Revaluation reserve for premises
Retained earnings and
other reserves
Total shareholders’
equity Balance at 31 December 2001 as previously reported 20,980,583 10,016,190 (1,211) 521,300 62,188,502 93,705,364
Restatement of deferred tax liability – – – – 10,263,037 10,263,037
Balance at 31 December 2001 as restated 20,980,583 10,016,190 (1,211) 521,300 72,451,539 103,968,401
Net profit – – – – 20,258,278 20,258,278 Sale of treasury shares, net – – 800 – – 800 Depreciation of revalued premises, net of tax – – – (23,695) 31,178 7,483
Dividends declared - Ordinary shares – – – – (1,055,688) (1,055,688) - Preference shares – – – – (59,778) (59,778) Balance at 31 December 2002 20,980,583 10,016,190 (411) 497,605 91,625,529 123,119,496 Net profit – – – – 13,933,513 13,933,513 Sale of treasury shares, net – – 99 – – 99 Depreciation of revalued premises, net of tax – – – (22,618) 29,761 7,143
Dividends declared - Ordinary shares – – – – (2,071,083) (2,071,083) - Preference shares – – – – (116,005) (116,005) Balance at 31 December 2003 20,980,583 10,016,190 (312) 474,987 103,401,715 134,873,163

Sberbank (Savings Bank of the Russian Federation) Notes to the Financial Statements – 31 December 2003 (Thousands of Russian Rubles, unless otherwise indicated)
5
1. Principal Activities
Sberbank (Savings Bank of the Russian Federation) (the “Bank”) is a joint stock commercial bank established in 1841 and having operated in various forms since then. The Bank’s principal shareholder, the Central Bank of the Russian Federation (“the Bank of Russia”), owns 63.76% of ordinary shares or 60.57% of the issued and outstanding shares at 31 December 2003. The Bank is registered in the Russian Federation to conduct banking activities and has operated under a full banking license issued by the Bank of the Russian since 1991. The Bank's principal business activity is retail and commercial banking operations within the Russian Federation. Deposits of individuals placed with the Bank are guaranteed by the Russian Federation (the “State”).
The Supervisory Board of the Bank is headed by the Chairman of the Bank of Russia and co-chaired by the Deputy Chairman of the Bank of Russia. The Supervisory Board also includes representatives of the Bank’s other shareholders.
The Bank has 17 regional head offices, 1 028 branches and 19 143 sub-branches within the Russian Federation. The main office of the Bank is located at 19 Vavilova St., 117 997 Moscow. The average number of the Bank’s employees during 2003 was 219,048 (2002: 205,477).
2. Operating Environment
The Bank’s financial position and results of operations are significantly influenced by the economic and social policies of the Russian Federation. The Bank has a significant level of lending operations with companies that are controlled by the State or where the State holds more than 25% of the voting shares. As of 31 December 2003, loans granted to such companies with exposure over 1% of the Bank’s loan portfolio represented 7.9% of the total loan portfolio (2002: 13.6%).
During 2003, Moody’s, the international rating agency assigned Russia an investment grade rating. Nevertheless, the Russian economy continues to display certain features consistent with those of a transitional economy. These attributes have in the past included higher than normal inflation rates, lack of liquidity in capital markets. The continued success and stability of the Russian economy will be significantly impacted by the Government’s continued actions with regard to supervisory, legal, and economic reforms.
Those uncertainties may affect the ability of the banking sector to conduct operations. The Bank could be affected, in the foreseeable future, by these risks and their consequences. As a result, these uncertainties may affect the Bank’s future operations, the recoverability of its assets, and the ability to maintain or pay its obligations as they mature. The Bank’s risk management processes give consideration to these uncertainties (please refer to Note 30).
3. Basis of Presentation
These financial statements have been prepared in accordance with International Financial Reporting Standards (“IFRS”) which comprise standards and interpretations approved by the International Accounting Standards Board, and International Accounting Standards (“IAS”) and Standing Interpretations Committee interpretations (“SIC”) approved by the International Accounting Standards Committee that remain in effect. The Bank maintains its accounting records in accordance with Russian banking regulations. These financial statements have been prepared from those accounting records and adjusted as necessary in order to comply with IFRS in all material aspects.
The preparation of financial statements requires management to make estimates and assumptions that affect reported amounts. These estimates are based on information available as of the financial statements date. Actual results, therefore, could differ from these estimates.
The financial statements are presented in the national currency of the Russian Federation, the Russian Ruble (“RR”), expressed in terms of the purchasing power of thousands of Russian Rubles as of 31 December 2003, unless otherwise indicated.
Sberbank (Savings Bank of the Russian Federation) Notes to the Financial Statements – 31 December 2003 (Thousands of Russian Rubles, unless otherwise indicated)
6
3. Basis of Presentation (continued)
Effective from 1 January 2003, international accounting and financial reporting bodies have determined that the Russian Federation no longer meets the criteria of IAS 29 for hyperinflation. Beginning in 2003, the Bank ceased applying IAS 29 to current periods and only recognizes the cumulative impact of inflation indexing on non-monetary elements of the financial statements through December 31, 2002. Monetary items and results of operations as of and for the year ended December 31, 2003, are reported at actual, nominal amounts.
The 2001 financial statements of the Bank were restated for the effect of a RR 10,263,037 fundamental error that resulted from the calculation of deferred taxes as of 31 December 2001. In 2002, the correction of this fundamental error was reflected in the 2002 financial statements as allowed under the alternative treatment in accordance with IAS 8, with presentation of pro-forma financial information for 2001 as if the correction had been made during 2001. During 2003, the Bank changed its accounting policy regarding the presentation of fundamental errors. Under the new accounting policy, the Bank will apply the benchmark treatment under IAS 8 with any fundamental error correction presented as an adjustment to the opening balance of retained earnings and restating the comparative information. Management believes that the use of the benchmark treatment will result in a more appropriate presentation of historical events and transactions in the financial statements. Following this change in accounting policy, the 2003 financial statements present the 2002 comparative information as if the historical 2002 and 2001 financial statements had been restated for correction of the 2001 fundamental error, without the presentation of pro-forma financial information.
4. Significant Accounting Policies
Cash and cash equivalents. Cash and cash equivalents are items, which can be converted into cash within a day. They include correspondent accounts (including accounts in precious metals) with the CBR, banks and non-banking institutions, as well as deposits, that mature not later than the first working day after the reporting date, and cash balances. Other interbank placements are included in due from banks. Amounts, which relate to funds that are of a restricted nature, are excluded from cash and cash equivalents.
Mandatory balances with the Central Bank of the Russian Federation. Mandatory balances with the Bank of Russia represent mandatory reserve deposits that are not available to finance the Bank’s day-to-day operations.
Precious metals. Gold and other precious metals are recorded at the balance sheet date at London Fixing. Precious metals are included in cash and cash equivalents.
Trading securities. Trading securities are securities that were either acquired for generating a profit from short-term fluctuations in price or dealer’s margin, or securities included in a portfolio in which a pattern of short-term profit taking exists. The Bank classifies securities into trading securities if it has an intention to sell them within 180 days after purchase.
Trading securities are initially recognised at cost (which includes transaction costs) and are subsequently re-measured at fair value based on their market value or after the application of various valuation methodologies, including assumptions as to the future ability to realise these securities. In determining market value, trading securities are valued at the last trade price if quoted on an exchange or, if traded over-the-counter, at the last bid price.
Changes in fair values are recorded within gains less losses arising from securities in the statements of income in the period in which the change occurs. Coupon and interest earned on trading securities are reflected in the statements of income as interest income on securities. Dividends received are included in other operating income.

Sberbank (Savings Bank of the Russian Federation) Notes to the Financial Statements – 31 December 2003 (Thousands of Russian Rubles, unless otherwise indicated)
7
4. Significant Accounting Policies (continued)
Sale and repurchase agreements. Sale and repurchase agreements (“repos”) are treated as secured financing transactions. Securities sold under repos are included into trading securities, securities available for sale or securities acquired at original issuance as appropriate. The corresponding liability is presented within due to banks.
Securities purchased under agreements to resell (“reverse repos”) are recorded as loans and advances to banks or customers, as appropriate. The difference between the sale and repurchase price is treated as interest income or expense and accrued over the life of the agreements using the effective interest method.
Securities purchased by the Bank under reverse repo are not recognised in the financial statements, unless they are sold to third parties, in which case the purchase and sale are recorded within gains less losses arising from securities and derivatives in the statements of income. The obligation to return them is recorded at fair value as a trading liability.
Originated loans and advances and allowance for loan impairment. Loans originated by the Bank by providing money directly to the borrower or to a sub-participation agent at draw down are categorised as loans originated by the Bank and are carried at amortised cost, less allowance for loan impairment.
Loans and advances are recognised when cash is advanced to borrowers. The allowance for loan impairment is established if there is objective evidence that the Bank will not be able to collect the amounts due. The allowance is the difference between the carrying value and estimated recoverable amounts based on discounted cash flows.
The allowance for loan impairment also covers losses where there is objective evidence that probable losses are present in components of the loan portfolio at the balance sheet date. These have been estimated based upon historical patterns of losses in each component, the credit ratings assigned to the borrowers, and reflecting the current economic environment in which the borrowers operate.
When a loan cannot be collected, it is written off against the related allowance for loan impairment. Such loans are written off after the necessary legal procedures have been completed and the amount of the loss has been determined. Recoveries of amounts previously written off are credited to the related impairment account in the statements of income.
Bills of exchange purchased. The Bank purchases bills of exchange from its customers or on the market. These bills of exchange are included in trading securities, securities available for sale, loans and advances to customers, or in due from banks, depending on their substance and subsequently re-measured and accounted in accordance with the accounting policies described above for those categories of assets.
Other credit related commitments. In the normal course of business, the Bank enters into other credit related commitments including loan commitments, letters of credit, and guarantees. The accounting policy and allowance methodology are similar to those for originated loans noted above. Specific allowances are raised against other credit related commitments when losses are considered probable.
Securities available for sale. This classification includes securities that the Bank intends to hold for an indefinite period of time but may be sold in response to needs for liquidity or changes in interest rates, exchange rates, or equity prices. The Bank determines the appropriate classification of securities at the time of purchase.
Securities available for sale include other investments, which represent equity investments in non-consolidated subsidiary companies, associated companies and investments held for resale.
Securities available for sale are initially recognised at cost (which includes transaction costs) and subsequently re-measured to fair value based on quoted bid prices. Certain securities available for sale, for which there is no available external independent quotation have been fair valued by the Bank. Fair value has been determined after the application of various valuation methodologies, including assumptions as to amounts to be realised on settlement. Realised and unrealised gains and losses arising from changes in the fair value of securities available for sale are included in the statement of income under gains less losses from securities in the period in which they arise. Coupon and interest earned on securities available for sale are reflected in the statements of income as interest income on securities. Dividends received are included in other operating income.
Sberbank (Savings Bank of the Russian Federation) Notes to the Financial Statements – 31 December 2003 (Thousands of Russian Rubles, unless otherwise indicated)
8
4. Significant Accounting Policies (continued)
Securities acquired at original issuance. The Bank classifies its investment securities acquired at original issuance directly from a debtor, other than those that are purchased with the intent to be sold in the short-term, as “securities acquired at original issuance.” Such securities are carried at amortized cost. Income arising from the accertion of these securities’ purchase discount are recognized in the statements of income as interest income from securities using the effective interest method.
Premises and equipment. Premises and equipment are stated at revalued amounts, restated to the equivalent purchasing power of the Russian Ruble at 31 December 2002, less accumulated depreciation and allowance for impairment, where required. Where the carrying amount of an asset is greater than its estimated recoverable amount, an allowance is provided to reduce it to the recoverable amount and the related provision is charged to the statements of income. The estimated recoverable amount is the higher of an asset’s net selling price and its value in use.
The revaluation reserve represents the difference between the restated net book amount of premises and their market value. The proportion of revaluation reserve, representing the amount depreciated, is transferred annually to retained earnings based on the estimated average useful life of the underlying premises.
Construction in progress is carried at cost, restated to the equivalent purchasing power of the Russian Ruble at 31 December 2002. Upon completion, assets are transferred to premises at their carrying value. Construction in progress is not depreciated until the asset is available for use.
Gains and losses on disposal of premises and equipment are determined by reference to their net book value. Repairs and maintenance are charged to the statement of income when the expenditure is incurred.
Depreciation and amortisation. Depreciation and amortisation are applied on a straight-line basis over the estimated useful lives of the assets using the following annual rates:
Premises 2.5% - 4.5%; Equipment 18% - 25%; Intangible assets 25%.
Depreciation and amortisation is calculated starting from the month following the month when the fixed / intangible asset has been placed into operation. Depreciation and amortisation for the reporting period are recorded in the statements of income under operating expenses.
Due to banks and customers. Amounts due to banks and to customers are initially recognized at cost, which amounts to the issue proceeds less transaction costs incurred. Subsequently, amounts due are stated at amortized cost and any difference between net proceeds and the redemption value is recognized in the statement of income over the maturity period of the borrowings using the effective interest method.
Own securities issued. Bills of exchange, deposit certificates, saving certificates, eurobonds are issued by the Bank to its customers and carry a fixed date of repayment. Bills of exchange may be issued against cash deposits or as a payment instrument, which the customer can discount in the over-the-counter secondary market. Own securities issued by the Bank are recognised initially at cost, being their issue proceeds, net of transaction costs incurred. Subsequently, own securities issued are stated at amortised cost and any difference between net proceeds and the redemption value is recognised in the statements of income over the period of the security issue using the effective interest method.
Share capital. Share capital is recognized at restated cost reflecting the cumulative impact of inflation indexing through December 31, 2002.
Share premium. Share premium represents the excess of contributions over the nominal value of the shares issued and is recognized at restated cost reflecting the cumulative impact of inflation indexing through December 31, 2002.
Preference shares. Preference shares are not redeemable, they guarantee payment of annual dividends of not less than 15% of their nominal value. Dividend payments in excess of that minimum are determined at the Bank’s Annual Shareholders Meeting. Preference shares are classified as a part of equity.
Sberbank (Savings Bank of the Russian Federation) Notes to the Financial Statements – 31 December 2003 (Thousands of Russian Rubles, unless otherwise indicated)
9
4. Significant Accounting Policies (continued)
Treasury shares. Shares of the Bank owned and held at the balance sheet date, are defined as treasury shares. The cost of such shares is shown as a reduction in shareholders’ equity.
Dividends. Dividends payable are not recognised until they have been ratified at the Bank’s Annual Shareholders Meeting. The statutory accounting reports of the Bank are the basis for profit distribution and other appropriations. Russian legislation identifies the basis of distribution as the current year net profit determined in accordance with statutory requirements.
Taxes. Taxation has been provided in accordance with Russian legislation currently in force. The charge for taxation in the statements of income comprises current taxes and changes in deferred tax assets and liabilities. Current tax is calculated on the basis of the expected taxable profit for the year, using the tax rates in force during the relevant period.
Deferred income tax is provided, using the balance sheet liability method, for temporary differences arising between the tax basis of assets and liabilities and their carrying values for financial reporting purposes. Deferred tax assets are recognised to the extent that it is probable that future taxable profit will be available against which the temporary differences can be utilised. Deferred tax assets and liabilities are measured at tax rates that are expected to apply in the period when the asset is realised or the liability is settled, based on tax rates that have been enacted or substantively enacted at the balance sheet date.
The deferred tax liability arising on the revaluation of premises is charged directly to the revaluation reserve. Any tax effect of subsequent impairment of the revaluation reserve is recognised through the statement of changes in shareholders equity; any deferred tax benefit beyond the remaining amount of revaluation reserve is reflected in the statements of income.
The Bank is subject to certain taxes, other than on net profit. These are recorded in operating expenses.
Income and expense recognition. Interest income and expense are recognised in the statements of income on an accrual basis calculated using the effective interest method. Interest income on loans is accrued only if delays of interest and principal payments are less than 90 days. Interest income is not recognised where the Bank believes it is not collectible.
Commissions and other income are credited to income when the related transactions are completed. Non-interest expenses are recognised at the time the products are received or the service is provided.
Foreign currency translation. Transactions denominated in foreign currencies are recorded at the CBR exchange rate prevailing on the transaction date. Exchange differences resulting from the settlement of transactions denominated in foreign currencies are included in the statements of income using the CBR official exchange rate prevailing on that date.
Monetary assets and liabilities denominated in foreign currencies are translated into Russian Rubles at the official exchange rate of the Bank of Russia at the balance sheet date. Foreign currency gains and losses arising from the translation of assets and liabilities are reflected in the statements of income as foreign exchange translation gains less losses. As of 31 December 2003, the CBR exchange rate used for translating USD balances was USD 1 = RR 29.4545 (2002: USD 1 = RR 31.7844). Exchange restrictions and controls exist relating to converting Russian Rubles into other currencies. At present, the Russian Ruble is not a convertible currency outside of the Russian Federation.
Derivative financial instruments. Derivative financial instruments including forward foreign exchange contracts, currency swaps, currency options, forwards with securities and precious metals and other derivative financial instruments are initially recognized in the balance sheet at cost (including transaction costs) and are subsequently re-measured at their fair value. Fair values are obtained from quoted market prices, discounted cash flow models, or using the spot rate at the year-end, as appropriate. Derivatives are carried as assets when fair value is positive and as liabilities when fair value is negative.
Sberbank (Savings Bank of the Russian Federation) Notes to the Financial Statements – 31 December 2003 (Thousands of Russian Rubles, unless otherwise indicated)
10
4. Significant Accounting Policies (continued)
Changes in the fair value of derivatives are included in gains less losses arising from securities and derivatives.
The Bank does not enter into derivative instruments for hedging purposes.
Offsetting. Financial assets and liabilities are offset and the net amount reported in the balance sheet only when there is a legally enforceable right to offset the recognised amounts, and there is an intention to either settle on a net basis, or to realise the asset and settle the liability simultaneously.
Provisions. Provisions are recognised when the Bank has a present legal or constructive obligation as a result of past events, it is probable that an outflow of resources embodying economic benefits will be required to settle the obligation, and a reliable estimate of the amount of the obligation can be made.
Social funds costs. The Bank contributes to the Russian Federation state pension, social insurance and obligatory medical insurance funds in respect of its employees. The Bank’s funds contributions are expensed as incurred. The contributions are included in staff costs.
Operating leases. Payments made under operating leases are charged against income in equal instalments over the period of the lease.
Segment reporting. A segment is a distinguishable component of the Bank that is engaged either in providing products or services (business segment) or in providing products or services within a particular economic environment (geographical segment) that is subject to risks and rewards that are different from those of other segments. The Bank determined that the primary segments for its activities are business segments (corporate and retail), and the secondary segments are the geographical areas of Russia.
Fiduciary assets: Fiduciary assets are not included in the Bank’s balance sheet as they are not assets of the Bank.
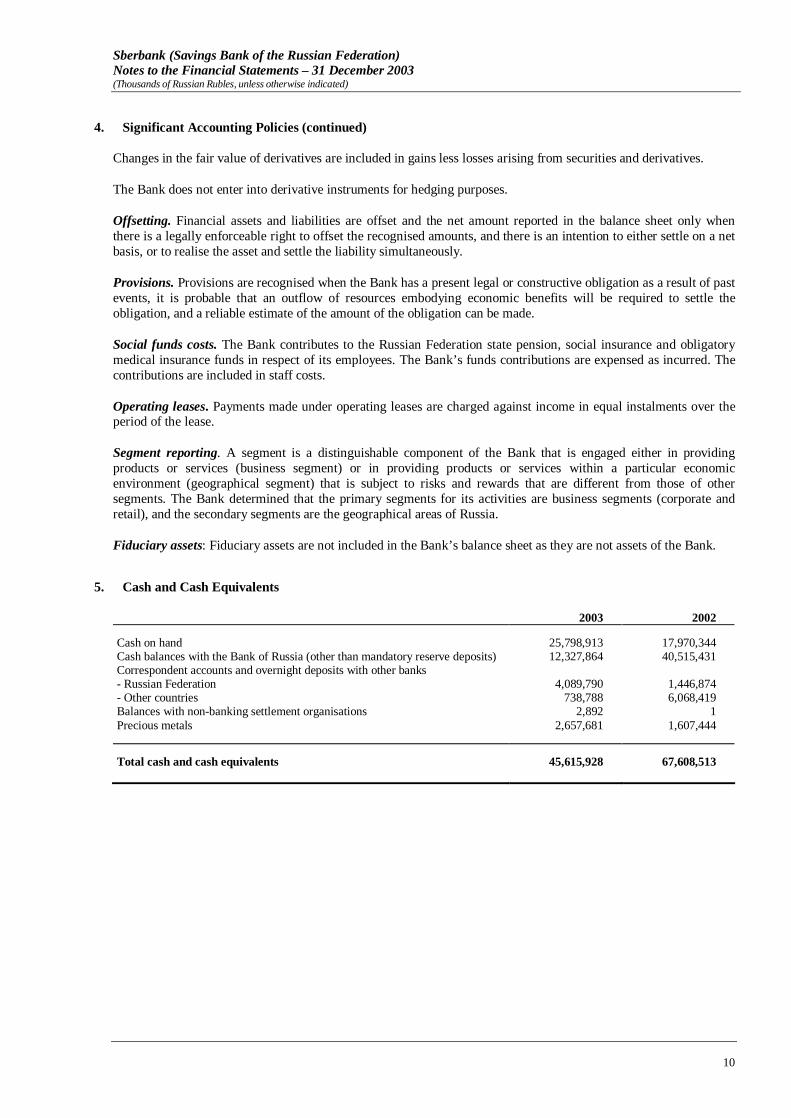
5. Cash and Cash Equivalents
2003 2002 Cash on hand 25,798,913 17,970,344 Cash balances with the Bank of Russia (other than mandatory reserve deposits) 12,327,864 40,515,431 Correspondent accounts and overnight deposits with other banks - Russian Federation 4,089,790 1,446,874 - Other countries 738,788 6,068,419 Balances with non-banking settlement organisations 2,892 1 Precious metals 2,657,681 1,607,444 Total cash and cash equivalents 45,615,928 67,608,513

Sberbank (Savings Bank of the Russian Federation) Notes to the Financial Statements – 31 December 2003 (Thousands of Russian Rubles, unless otherwise indicated)
11
6. Trading Securities
2003 2002 RR denominated securities Federal loan bonds (OFZ) and federal short term bonds (GKO) 57,546,097 55,300,224 Municipal bonds 16,556,880 6,688,279 Corporate shares 3,117,173 1,151,668 Corporate bonds 477,274 – Foreign currency denominated securities Russian Federation Eurobonds 31,273,191 54,179,583 Federal currency bonds (OVGVZ) 1,319,933 8,534,682 Foreign currency denominated securities sold under repo Russian Federation Eurobonds 25,018,980 – Total trading securities 135,309,528 125,854,436
Stated coupon rates and maturity of trading securities are as follows:
2003 2002 % Maturity % Maturity Federal loan bonds (OFZ) and federal short term
bonds (GKO) 8.00% - 14.00% 2004 - 2018 10.00% - 15.00% 2003 - 2008 Federal currency bonds (OVGVZ) 3.00% 2006 -2011 3.00% 2003 - 2011 Russian Federation Eurobonds 5.00% - 12.75% 2004 - 2030 5.00% - 12.75% 2003 - 2030 Municipal bonds 7.48% - 17.00% 2004 - 2011 8.48% - 20.00% 2003 - 2009 Corporate bonds 8.50% - 16.00% 2004 - 2006 − −
7. Due from Banks
2003 2002 Current loans to banks 47,520,681 40,024,779 Reverse repo deals with Bank of Russia 31,108,876 – Overdue loans to banks 76,900 81,537 Less: allowance for loan impairment (76,900) (81,537) Total due from banks 78,629,557 40,024,779
The Bank accepted 61.6% and 100% of two OFZ issues as collateral for reverse repo transactions with the Bank of Russia.
Movement in the allowances for loan impairment is as follows:
2003 2002 Allowance for loan impairment at 1 January (81,537) (324,158) Reversal of allowance for loan impairment 270 85,261 Due from banks written off as uncollectable 4,367 114,785 Effect of inflation – 42,575 Allowance for loan impairment at 31 December (76,900) (81,537)
Sberbank (Savings Bank of the Russian Federation) Notes to the Financial Statements – 31 December 2003 (Thousands of Russian Rubles, unless otherwise indicated)
12
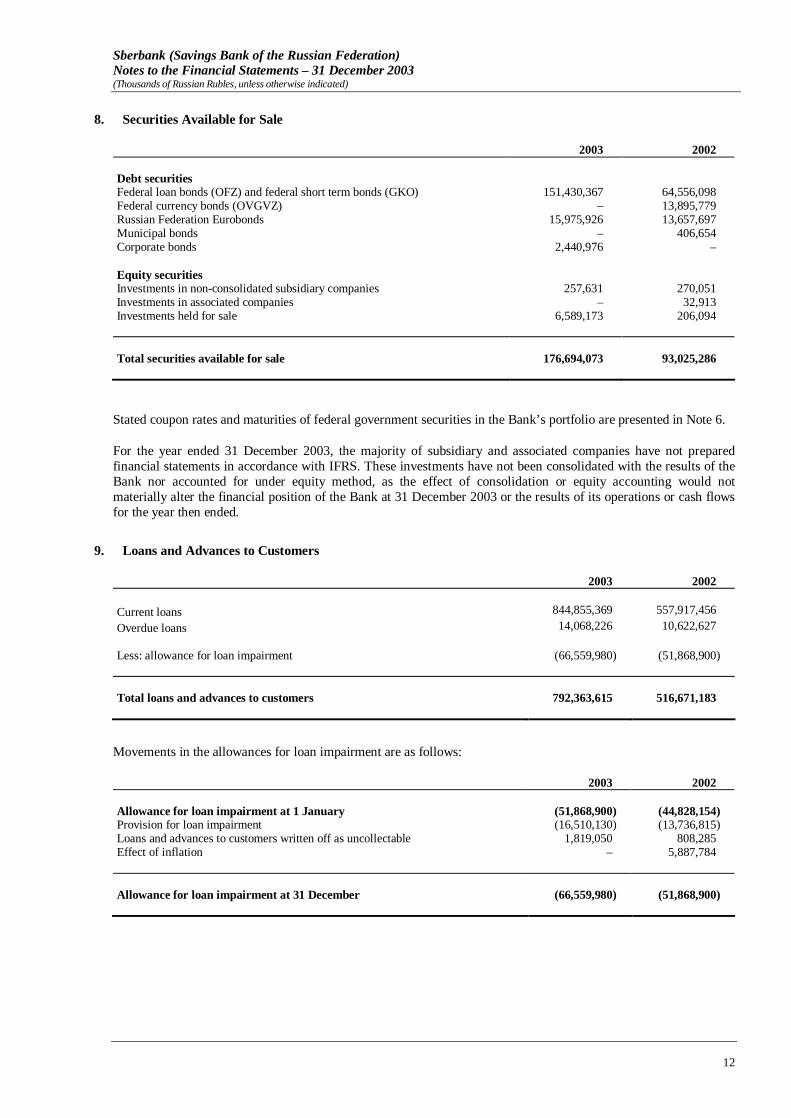
8. Securities Available for Sale
2003 2002 Debt securities Federal loan bonds (OFZ) and federal short term bonds (GKO) 151,430,367 64,556,098 Federal currency bonds (OVGVZ) – 13,895,779 Russian Federation Eurobonds 15,975,926 13,657,697 Municipal bonds – 406,654 Corporate bonds 2,440,976 – Equity securities Investments in non-consolidated subsidiary companies 257,631 270,051 Investments in associated companies – 32,913 Investments held for sale 6,589,173 206,094 Total securities available for sale 176,694,073 93,025,286
Stated coupon rates and maturities of federal government securities in the Bank’s portfolio are presented in Note 6.
For the year ended 31 December 2003, the majority of subsidiary and associated companies have not prepared financial statements in accordance with IFRS. These investments have not been consolidated with the results of the Bank nor accounted for under equity method, as the effect of consolidation or equity accounting would not materially alter the financial position of the Bank at 31 December 2003 or the results of its operations or cash flows for the year then ended.
9. Loans and Advances to Customers
2003 2002 Current loans 844,855,369 557,917,456 Overdue loans 14,068,226 10,622,627 Less: allowance for loan impairment (66,559,980) (51,868,900)
Total loans and advances to customers 792,363,615 516,671,183
Movements in the allowances for loan impairment are as follows:
2003 2002 Allowance for loan impairment at 1 January (51,868,900) (44,828,154) Provision for loan impairment (16,510,130) (13,736,815) Loans and advances to customers written off as uncollectable 1,819,050 808,285 Effect of inflation – 5,887,784 Allowance for loan impairment at 31 December (66,559,980) (51,868,900)
Sberbank (Savings Bank of the Russian Federation) Notes to the Financial Statements – 31 December 2003 (Thousands of Russian Rubles, unless otherwise indicated)
13
9. Loans and Advances to Customers (continued)
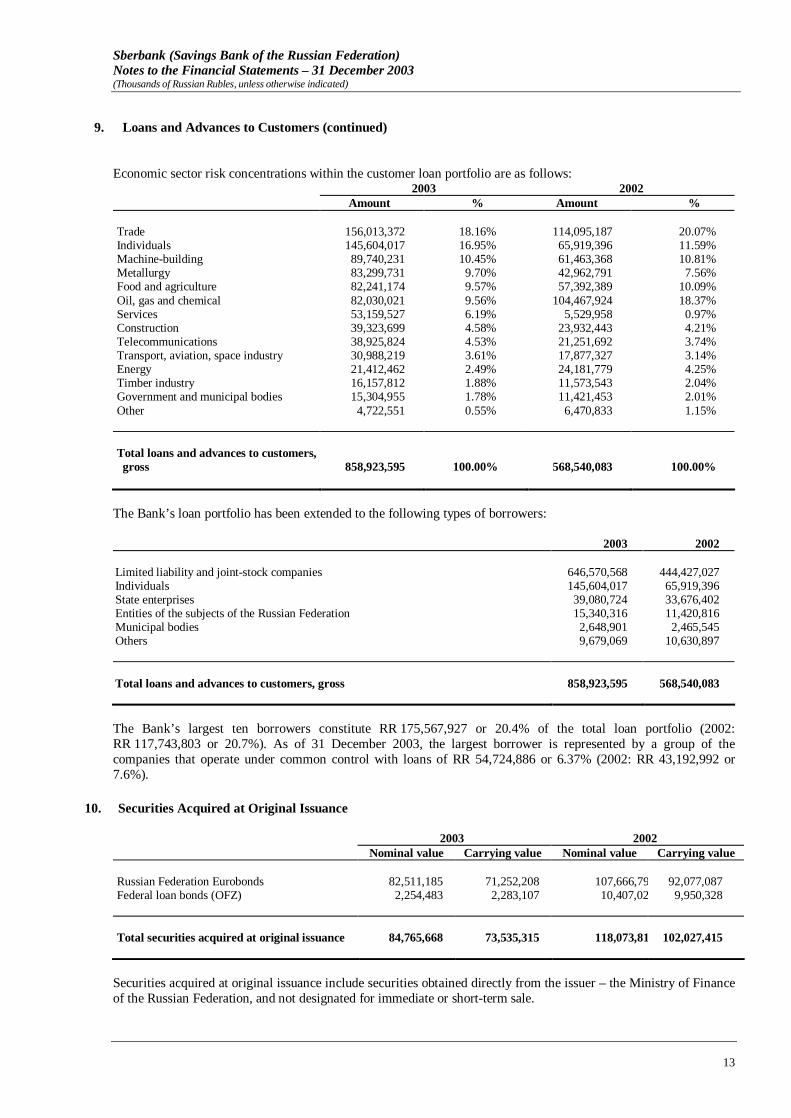
Economic sector risk concentrations within the customer loan portfolio are as follows: 2003 2002
Amount % Amount % Trade 156,013,372 18.16% 114,095,187 20.07% Individuals 145,604,017 16.95% 65,919,396 11.59% Machine-building 89,740,231 10.45% 61,463,368 10.81% Metallurgy 83,299,731 9.70% 42,962,791 7.56% Food and agriculture 82,241,174 9.57% 57,392,389 10.09% Oil, gas and chemical 82,030,021 9.56% 104,467,924 18.37% Services 53,159,527 6.19% 5,529,958 0.97% Construction 39,323,699 4.58% 23,932,443 4.21% Telecommunications 38,925,824 4.53% 21,251,692 3.74% Transport, aviation, space industry 30,988,219 3.61% 17,877,327 3.14% Energy 21,412,462 2.49% 24,181,779 4.25% Timber industry 16,157,812 1.88% 11,573,543 2.04% Government and municipal bodies 15,304,955 1.78% 11,421,453 2.01% Other 4,722,551 0.55% 6,470,833 1.15% Total loans and advances to customers, gross 858,923,595 100.00% 568,540,083 100.00%
The Bank’s loan portfolio has been extended to the following types of borrowers: 2003 2002 Limited liability and joint-stock companies 646,570,568 444,427,027 Individuals 145,604,017 65,919,396 State enterprises 39,080,724 33,676,402 Entities of the subjects of the Russian Federation 15,340,316 11,420,816 Municipal bodies 2,648,901 2,465,545 Others 9,679,069 10,630,897 Total loans and advances to customers, gross 858,923,595 568,540,083
The Bank’s largest ten borrowers constitute RR 175,567,927 or 20.4% of the total loan portfolio (2002: RR 117,743,803 or 20.7%). As of 31 December 2003, the largest borrower is represented by a group of the companies that operate under common control with loans of RR 54,724,886 or 6.37% (2002: RR 43,192,992 or 7.6%).
10. Securities Acquired at Original Issuance
2003 2002 Nominal value Carrying value Nominal value Carrying value
Russian Federation Eurobonds 82,511,185 71,252,208 107,666,794 92,077,087 Federal loan bonds (OFZ) 2,254,483 2,283,107 10,407,025 9,950,328 Total securities acquired at original issuance 84,765,668 73,535,315 118,073,819 102,027,415
Securities acquired at original issuance include securities obtained directly from the issuer – the Ministry of Finance of the Russian Federation, and not designated for immediate or short-term sale.
Sberbank (Savings Bank of the Russian Federation) Notes to the Financial Statements – 31 December 2003 (Thousands of Russian Rubles, unless otherwise indicated)
14
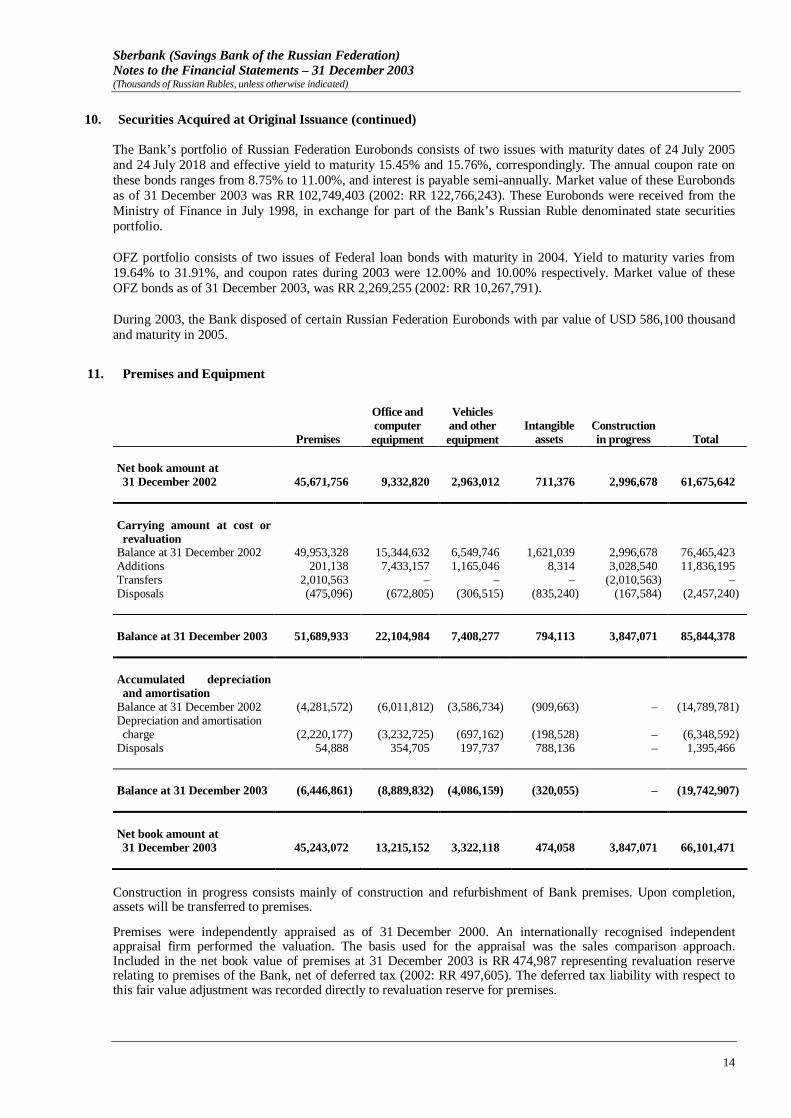
10. Securities Acquired at Original Issuance (continued) The Bank’s portfolio of Russian Federation Eurobonds consists of two issues with maturity dates of 24 July 2005 and 24 July 2018 and effective yield to maturity 15.45% and 15.76%, correspondingly. The annual coupon rate on these bonds ranges from 8.75% to 11.00%, and interest is payable semi-annually. Market value of these Eurobonds as of 31 December 2003 was RR 102,749,403 (2002: RR 122,766,243). These Eurobonds were received from the Ministry of Finance in July 1998, in exchange for part of the Bank’s Russian Ruble denominated state securities portfolio.
OFZ portfolio consists of two issues of Federal loan bonds with maturity in 2004. Yield to maturity varies from 19.64% to 31.91%, and coupon rates during 2003 were 12.00% and 10.00% respectively. Market value of these OFZ bonds as of 31 December 2003, was RR 2,269,255 (2002: RR 10,267,791).
During 2003, the Bank disposed of certain Russian Federation Eurobonds with par value of USD 586,100 thousand and maturity in 2005.
11. Premises and Equipment
Premises
Office and computer equipment
Vehicles and other equipment
Intangible assets
Construction in progress Total
Net book amount at 31 December 2002 45,671,756 9,332,820 2,963,012 711,376 2,996,678 61,675,642
Carrying amount at cost or revaluation Balance at 31 December 2002 49,953,328 15,344,632 6,549,746 1,621,039 2,996,678 76,465,423 Additions 201,138 7,433,157 1,165,046 8,314 3,028,540 11,836,195 Transfers 2,010,563 – – – (2,010,563) – Disposals (475,096) (672,805) (306,515) (835,240) (167,584) (2,457,240) Balance at 31 December 2003 51,689,933 22,104,984 7,408,277 794,113 3,847,071 85,844,378 Accumulated depreciation and amortisation Balance at 31 December 2002 (4,281,572) (6,011,812) (3,586,734) (909,663) – (14,789,781) Depreciation and amortisation charge (2,220,177) (3,232,725) (697,162) (198,528) – (6,348,592)
Disposals 54,888 354,705 197,737 788,136 – 1,395,466 Balance at 31 December 2003 (6,446,861) (8,889,832) (4,086,159) (320,055) – (19,742,907) Net book amount at 31 December 2003 45,243,072 13,215,152 3,322,118 474,058 3,847,071 66,101,471
Construction in progress consists mainly of construction and refurbishment of Bank premises. Upon completion, assets will be transferred to premises.
Premises were independently appraised as of 31 December 2000. An internationally recognised independent appraisal firm performed the valuation. The basis used for the appraisal was the sales comparison approach. Included in the net book value of premises at 31 December 2003 is RR 474,987 representing revaluation reserve relating to premises of the Bank, net of deferred tax (2002: RR 497,605). The deferred tax liability with respect to this fair value adjustment was recorded directly to revaluation reserve for premises.

Sberbank (Savings Bank of the Russian Federation) Notes to the Financial Statements – 31 December 2003 (Thousands of Russian Rubles, unless otherwise indicated)
15
12. Other Assets
2003 2002
Banking cards debtors 2,292,008 1,152,080 Settlements on operations with banknotes with non-resident banks 1,472,786 – Prepaid operating taxes 1,064,538 793,439 Trade debtors and prepayments 866,228 726,495 Deferred charges 771,482 856,295 Balances arising from derivative financial instruments 88,130 65,026 Settlements on operations with securities and conversion operations 1,561 1,994 Other 320,299 78,491
Total other assets 6,877,032 3,673,820
13. Due to Banks
2003 2002 Amounts on “LORO” accounts of other banks - Russian Federation 6,823,415 2,373,542 - Other countries 1,996,102 1,149,900 Short term deposits due to banks
- Russian Federation 683,903 529,776 - Other countries 28,386,050 – Total due to banks 37,889,470 4,053,218
14. Deposits from Individuals and Customer Accounts
2003 2002 Individuals - Current/demand accounts 130,375,539 104,035,718 - Term deposits 848,205,300 603,979,420 Total deposits from individuals 978,580,839 708,015,138 State and public organisations - Current/settlement accounts 39,206,809 36,159,495 - Term deposits 437,843 1,670,111 Other legal entities - Current/settlement accounts 154,510,183 119,369,794 - Term deposits 17,406,327 30,545,657 Total customer accounts 211,561,162 187,745,057 Total deposits from individuals and customer accounts 1,190,142,001 895,760,195

Sberbank (Savings Bank of the Russian Federation) Notes to the Financial Statements – 31 December 2003 (Thousands of Russian Rubles, unless otherwise indicated)
16
14. Deposits from Individuals and Customer Accounts (continued) Economic sector concentrations within customer accounts are as follows: 2003 2002 Amount % Amount % Individuals 978,580,839 82.22% 708,015,138 79.04% Trade 38,371,147 3.22% 28,401,492 3.17% Oil and gas 27,480,568 2.31% 36,726,001 4.10% Construction 17,468,521 1.47% 13,284,822 1.48% Food and agriculture 14,700,988 1.24% 12,158,487 1.36% Municipal bodies and state organisations 10,677,141 0.90% 27,656,439 3.09% Equipment manufacturing 8,602,025 0.72% 6,142,167 0.69% Telecommunications 7,741,794 0.65% 8,280,146 0.92% Transport, aviation and space 7,302,412 0.61% 5,041,506 0.56% Metallurgy 5,576,048 0.47% 5,164,900 0.58% Energy 4,363,940 0.37% 3,007,185 0.33% Other 69,276,578 5.82% 41,881,912 4.68% Total deposits from individuals and customer accounts 1,190,142,001 100.00% 895,760,195 100.00%
Included in customer accounts are deposits of RR 9,776,039 (2002: RR 4,139,811) held as collateral for irrevocable commitments under import letters of credit. Refer to Note 31.
15. Own Securities Issued
2003 2002 Bills of exchange 70,283,192 46,782,791 Eurobonds 29,429,729 – Deposit certificates 2,602,135 6,244,271 Savings certificates 1,695,309 1,133,908 Total own securities issued 104,010,365 54,160,970
In October 2003, the Bank issued floating rate (three month LIBOR + 1.75%) notes maturing in three years. The bonds have par value of USD 1,000,000 thousand, and carry 12 quarterly coupons. The bonds are accounted for at amortised cost of USD 999,159 thousand, or RR 29,429,729. The transaction was structured as an issue of notes by UBS Luxembourg S.A., for the purpose of financing a loan to the Bank.
16. Other Borrowed Funds
As of 31 December 2003, the Bank had borrowings of USD 32,740 thousand carried at amortised cost of USD 33,204 thousand, or RR 977,998 (2002: borrowings of USD 45,000 thousand carried at amortised cost of USD 46,171 thousand, or RR 1,467,509), and borrowings of EUR 2,038 thousand carried at amortised cost of EUR 2,041 thousand, or RR 75,153 (2002: none). The borrowings are attracted in the form of special purpose lines of credit from international and foreign banking institutions. The contractual maturities of the borrowings vary from one to 66 months (2002: from one to 38 months), the annual interest rate for USD borrowings ranges from LIBOR + 0.99% to LIBOR + 1.95% (2002: LIBOR + 1.95%) and for EUR borrowings − EURIBOR + 0.875%.

Sberbank (Savings Bank of the Russian Federation) Notes to the Financial Statements – 31 December 2003 (Thousands of Russian Rubles, unless otherwise indicated)
17
17. Other Liabilities
2003 2002 Accrued compensation expenses 5,441,370 4,461,367 Operating taxes payable 2,792,845 2,719,216 Trade creditors 520,917 196,260 Banking card creditors 138,434 58,623 Settlements on conversion operations and operations with securities 97,232 168,404 Provision for credit related commitments 57,232 26,239 Balances arising from derivative financial instruments 44,435 1,618 Dividends payable 23,602 14,420 Other accruals and deferred income 4,171 7,633 Other 412,870 798,200 Total other liabilities 9,533,108 8,451,980
18. Share Capital
As of 31 December 2003, authorised share capital of the Bank amounted to RR 1,000,000, including 19,000,000 ordinary shares and 50,000,000 preference shares. Share capital issued and fully paid comprised:
2003 2002
Number of shares Nominal value
Inflation adjusted amount
Number of share Nominal value
Inflation adjusted amount
Ordinary shares 19,000,000 950,000 19,525,646 19,000,000 950,000 19,525,646 Preference shares 50,000,000 50,000 1,454,937 50,000,000 50,000 1,454,937 Less: Treasury shares Ordinary shares (1,770) (89) (226) (1,772) (89) (275) Preference shares (1,780) (2) (86) (3,145) (3) (136) Total share capital 68,996,450 999,909 20,980,271 68,995,083 999,908 20,980,172
Ordinary shares have a nominal value of 50 Russian Rubles per share, rank equally and carry one vote.
The preference shares have a nominal value of 1 Russian Ruble and carry no voting rights, but rank ahead of the ordinary shares in event of liquidation of the Bank. Preference shares are not subject to obligatory redemption. They carry a minimum annual dividend equal to 15% of their nominal value.

Sberbank (Savings Bank of the Russian Federation) Notes to the Financial Statements – 31 December 2003 (Thousands of Russian Rubles, unless otherwise indicated)
18
19. Shareholders’ Equity
Shareholders’ equity and net profit are reconciled between Russian statutory books and IFRS as follows:
2003 2002 Shareholders’
equity Net Profit Shareholders’
equity Net Profit Russian statutory books 157,392,208 38,816,378 127,314,512 36,015,985 Inflation impact on: - share capital – – – (4,070,841) - other non-monetary items 39,539,689 – 39,576,676 (1,405,248) Premises revaluation reserve (36,593,231) – (36,693,322) – Additional allowance for impairment (21,244,705) (329,321) (20,915,384) (5,108,306) Depreciation and amortisation (10,044,679) (3,748,727) (6,295,952) (2,984,264) Fair value adjustment for securities 9,074,103 (2,691,122) 11,765,225 7,631,562 Accrued staff costs and administrative expenses (8,047,532) (2,395,438) (5,652,094) (3,072,762) Deferred tax 3,073,292 2,841,336 217,330 (1,940,381) Accrued interest income and expense, net 1,689,062 (10,687,166) 12,376,228 2,244,802 Expenses booked directly to shareholders’ funds – (7,922,551) – (7,934,039) Current tax – – 1,426,277 872,816 Other 34,956 50,124 – 8,954 International Financial Reporting Standards 134,873,163 13,933,513 123,119,496 20,258,278
In accordance with Russian banking regulations, the Bank must distribute profits as dividends or transfer them to reserves (fund accounts) on the basis of financial statements prepared in accordance with Russian Accounting Rules. The Bank’s reserves under Russian Accounting Rules as of 31 December 2003 were RR 79,963,340 (2002: RR 81,504,412) (non-inflated).
20. Interest Income and Expense
2003 2002 Interest income Loans and advances to customers 97,465,093 88,939,592 Interbank loans 5,171,934 5,855,295 Securities 25,872,758 36,785,503 Total interest income 128,509,785 131,580,390 Interest expense Term deposits from individuals (68,674,149) (53,560,404) Current/settlement accounts (3,928,430) (1,614,553) Term deposits of legal entities (1,253,296) (2,098,599) Own securities issued (5,359,259) (1,238,057) Term placements of banks and other borrowed funds (427,860) (217,405) Total interest expense (79,642,994) (58,729,018) Net interest income 48,866,791 72,851,372
As of 31 December 2003, the Bank had RR 16,608,757 of loans (2002: RR 14,323,686) that have been placed on non-performing status as to contractual interest in accordance with the Bank’s accounting policy. As of 31 December 2003, interest income not recognised for non-performing loans was RR 2,924,851.
Sberbank (Savings Bank of the Russian Federation) Notes to the Financial Statements – 31 December 2003 (Thousands of Russian Rubles, unless otherwise indicated)
19
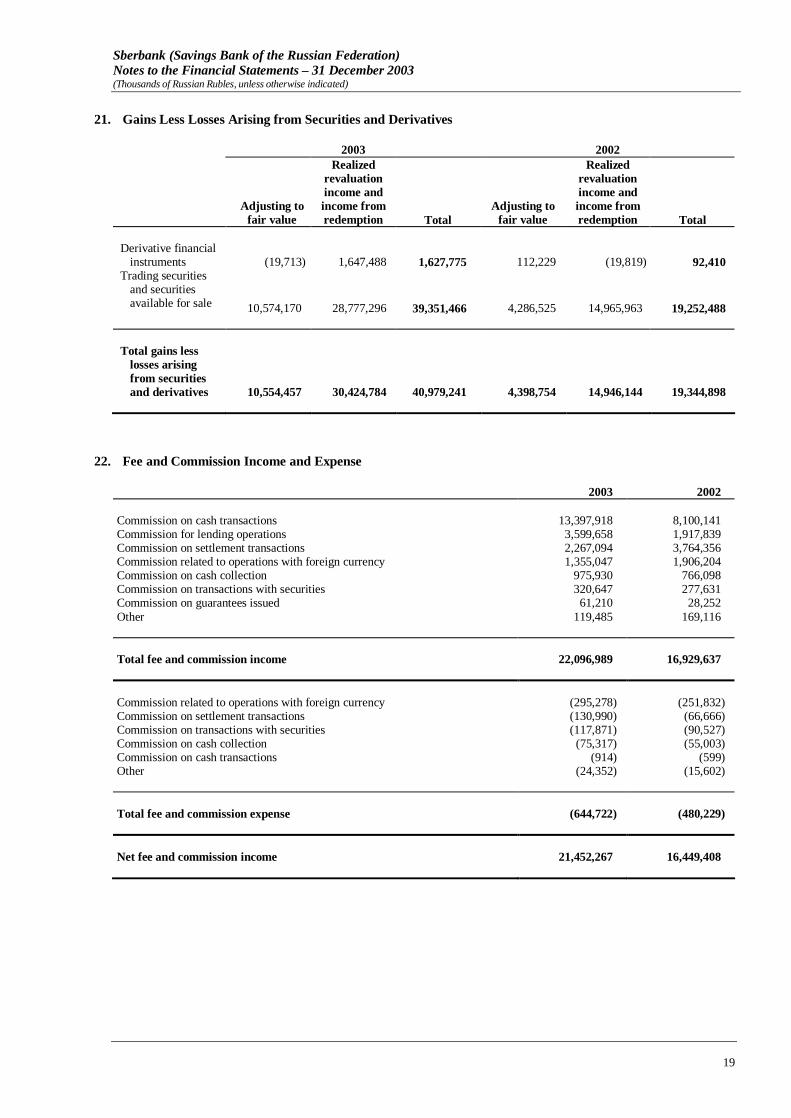
21. Gains Less Losses Arising from Securities and Derivatives
2003 2002
Adjusting to
fair value
Realized revaluation income and income from redemption Total
Adjusting to fair value
Realized revaluation income and income from redemption Total
Derivative financial
instruments (19,713) 1,647,488 1,627,775 112,229 (19,819) 92,410 Trading securities
and securities available for sale 10,574,170 28,777,296 39,351,466 4,286,525 14,965,963 19,252,488
Total gains less
losses arising from securities and derivatives 10,554,457 30,424,784 40,979,241 4,398,754 14,946,144 19,344,898
22. Fee and Commission Income and Expense
2003 2002 Commission on cash transactions 13,397,918 8,100,141 Commission for lending operations 3,599,658 1,917,839 Commission on settlement transactions 2,267,094 3,764,356 Commission related to operations with foreign currency 1,355,047 1,906,204 Commission on cash collection 975,930 766,098 Commission on transactions with securities 320,647 277,631 Commission on guarantees issued 61,210 28,252 Other 119,485 169,116 Total fee and commission income 22,096,989 16,929,637 Commission related to operations with foreign currency (295,278) (251,832) Commission on settlement transactions (130,990) (66,666) Commission on transactions with securities (117,871) (90,527) Commission on cash collection (75,317) (55,003) Commission on cash transactions (914) (599) Other (24,352) (15,602) Total fee and commission expense (644,722) (480,229) Net fee and commission income 21,452,267 16,449,408

Sberbank (Savings Bank of the Russian Federation) Notes to the Financial Statements – 31 December 2003 (Thousands of Russian Rubles, unless otherwise indicated)
20
23. Other Operating Income
2003 2002
Recoveries of amounts previously written off 932,325 11,085 Late charges on loans and other penalties 519,801 811,114 Leasing and other income on premises and equipment 449,409 495,079 Gains less losses arising from dealing in precious metals 188,798 239,671 Dividends received 110,174 30,144 Other 403,999 633,217 Total other operating income 2,604,506 2,220,310
24. Payroll and Other Staff Expenses
2003 2002 Payroll expenses (40,319,744) (33,997,979) Unified social tax expenses (9,873,713) (9,464,175) Total payroll and other staff expenses (50,193,457) (43,462,154)
25. Operating Expenses
2003 2002 Administrative expenses (6,516,071) (4,726,085) Taxes other than income tax (6,488,433) (7,159,688) Depreciation and amortisation (6,348,592) (5,574,910) Other expenses related to premises and equipment (3,953,789) (2,968,070) Advertising and marketing (674,354) (503,194) Expenses related to clients claims and court expenses (198,768) (87,417) Professional services (129,475) (97,076) Other (4,672,322) (3,263,828) Total operating expenses (28,981,804) (24,380,268)
26. Income Taxes
Income tax expense is comprised of the following:
2003 2002 Current tax expense (5,067,718) (5,700,992) Deferred tax benefit / (expense) 2,841,336 (1,940,381) Income tax expense (2,226,382) (7,641,373)

Sberbank (Savings Bank of the Russian Federation) Notes to the Financial Statements – 31 December 2003 (Thousands of Russian Rubles, unless otherwise indicated)
21
26. Income Taxes (continued)
Russian legal entities must individually report taxable income and remit profit taxes thereon to the appropriate tax authorities. The income tax rate for banks other than on state securities was 24%. The tax rate for interest income on state securities was 15% for Federal taxes.
The effective profit tax rate differs from the statutory income tax rates. A reconciliation of the income tax expenses based on statutory rates with the actual income tax expense follows.
2003 2002 IFRS profit before taxation 16,159,830 27,899,651 Statutory income tax rate 24% 24% Theoretical tax charge at the applicable statutory rate (3,878,359) (6,695,916) Income exempt from taxation 160,648 270,177 Income on government securities taxed at different rates 2,857,530 2,381,692 Non–temporary elements of monetary gains and losses – (2,886,061) Other non–temporary differences (556,223) (294,632) Non-deductible expenses (262,533) (416,633) Transfer-pricing adjustment for securities operations (547,445) – Income tax expense (2,226,382) (7,641,373)
Differences between IFRS and Russian statutory taxation regulations give rise to certain temporary differences between the carrying value of certain assets and liabilities for financial reporting purposes and for profit tax purposes. The tax effect of the movement on these temporary differences is recorded at the rate of 24%, except for income on state securities that is taxed at 15%. 2002 Change 2003 Tax effect of deductible temporary differences Allowance for impairment of interest earning assets 6,472,028 803,242 7,275,270 Premises and equipment depreciation and amortisation 1,420,916 101,553 1,522,469 Accruals 2,685,053 (179,344) 2,505,709 Other 103,370 (51,511) 51,859 Deferred tax asset 10,681,367 673,940 11,355,307 Tax effect of taxable temporary differences Fair valuation of securities (8,030,874) 2,552,391 (5,478,483) Premises and equipment (2,425,361) (346,608) (2,771,969) Other (7,802) (31,244) (39,046) Deferred tax liability (10,464,037) 2,174,539 (8,289,498) Net deferred tax asset 217,330 2,848,479 3,065,809
The tax effect of the movement in temporary differences for premises and equipment includes deferred tax reductions in respect of the depreciation of revalued premises of RR 7,143 (2002: RR 7,483). These amounts are recorded directly to revaluation reserve for premises. The Bank’s current tax asset related to prepaid income taxes is RR 415,322 (2002: RR 1,426,277).

Sberbank (Savings Bank of the Russian Federation) Notes to the Financial Statements – 31 December 2003 (Thousands of Russian Rubles, unless otherwise indicated)
22
27. Earnings per Share
Basic earnings per share are calculated by dividing the net profit attributable to ordinary shareholders by the weighted average number of ordinary shares outstanding during the year, excluding the average number of ordinary shares purchased by the Bank and held as treasury shares.
The Bank has no potentially diluted ordinary shares; therefore, the diluted earnings per share equal basic earnings per share.
2003 2002 Net profit attributable to shareholders 13,933,513 20,258,278 Less: dividends on preference shares (116,005) (59,778) Net profit attributable to ordinary shareholders 13,817,508 20,198,500 Weighted average number of ordinary shares outstanding (thousands) 18,998 18,998 Basic and diluted earnings per share (expressed in Russian Rubles per share) 727 1,063
28. Dividends
2003 2002 Ordinary Preference Ordinary Preference
Dividends payable at 1 January 13,647 773 15,749 873 Dividends declared during the year 2,071,083 116,005 1,055,688 59,778 Dividends paid during the year (2,062,380) (115,526) (1,055,721) (59,763) Effect of inflation – – (2,069) (115) Dividends payable at 31 December 22,350 1,252 13,647 773 Dividends per share declared during the year (expressed in Russian Rubles per share) 109.00 2.32 55.56 1.20
Dividends are declared and paid in Russian Rubles. On June 18, 2004, shareholders’ meeting of Sberbank made a decision to pay dividends for 2003 of RR 2,699,593.

Sberbank (Savings Bank of the Russian Federation) Notes to the Financial Statements – 31 December 2003 (Thousands of Russian Rubles, unless otherwise indicated)
23
29. Analysis by Segment and Geography
Geographical analysis. The geographical analysis of the Bank’s assets and liabilities as of 31 December 2003 is presented below:
Russia Other countries Total Assets Cash and cash equivalents 44,877,140 738,788 45,615,928 Mandatory cash balances with the Central Bank of the Russian Federation 98,893,608 – 98,893,608
Trading securities 135,309,528 – 135,309,528 Due from banks 78,409,077 220,480 78,629,557 Securities available for sale 176,694,073 – 176,694,073 Loans and advances to customers 791,066,031 1,297,584 792,363,615 Securities acquired at original issuance 73,535,315 – 73,535,315 Tax asset 3,481,131 – 3,481,131 Premises and equipment 66,101,471 – 66,101,471 Other assets 6,877,032 – 6,877,032 Total assets 1,475,244,406 2,256,852 1,477,501,258 Liabilities Due to banks (7,507,318) (30,382,152) (37,889,470) Deposits from individuals (975,781,705) (2,799,134) (978,580,839) Customer accounts (210,654,421) (906,741) (211,561,162) Own securities issued (74,580,636) (29,429,729) (104,010,365) Other borrowed funds – (1,053,151) (1,053,151) Other liabilities (9,533,108) – (9,533,108) Total liabilities (1,278,057,188) (64,570,907) (1,342,628,095) Net balance sheet position at 31 December 2003 197,187,218 (62,314,055) 134,873,163 Net balance sheet position at 31 December 2002 100,280,971 22,838,525 123,119,496
Other countries consist primarily of OECD member countries.

Sberbank (Savings Bank of the Russian Federation) Notes to the Financial Statements – 31 December 2003 (Thousands of Russian Rubles, unless otherwise indicated)
24
29. Analysis by Segment and Geography (continued)
Segment reporting. In accordance with requirements of IAS 14 “Segment reporting”, the Bank defined that its primary segments are business (corporate and retail). The secondary segments are geographical based on Russia regions where the Bank operates. Segment reporting per business segments as of 31 December 2003 follows:
Corporate Sector Retail Sector Unallocated Total Assets Trading securities 135,309,528 – – 135,309,528 Due from banks 78,629,557 – – 78,629,557 Securities available for sale 176,694,073 – – 176,694,073 Loans and advances to customers 651,171,267 141,192,348 – 792,363,615 Securities acquired at original issuance 73,535,315 – – 73,535,315 Unallocated assets – – 220,969,170 220,969,170 Total Assets 1,115,339,740 141,192,348 220,969,170 1,477,501,258 Liabilities Due to banks 37,889,470 – – 37,889,470 Deposits from individuals – 978,580,839 – 978,580,839 Customer accounts 211,561,162 – – 211,561,162 Own securities issued 95,782,043 8,228,322 – 104,010,365 Other borrowed funds 1,053,151 – – 1,053,151 Unallocated liabilities – – 9,533,108 9,533,108 Total Liabilities 346,285,826 986,809,161 9,533,108 1,342,628,095 Interest income on loans 84,011,921 18,625,106 – 102,637,027 Interest income on securities 25,872,758 – – 25,872,758 Fee and commission income 14,162,135 7,934,854 – 22,096,989 Fee and commission expense (644,722) – – (644,722)

Sberbank (Savings Bank of the Russian Federation) Notes to the Financial Statements – 31 December 2003 (Thousands of Russian Rubles, unless otherwise indicated)
25
29. Analysis by Segment and Geography (continued) Segment reporting per business segments as of 31 December 2002 follows: Corporate Sector Retail Sector Unallocated Total Assets Trading securities 125,854,436 - - 125,854,436 Due from banks 40,024,779 - - 40,024,779 Securities available for sale 93,025,286 - - 93,025,286 Loans and advances to customers 452,755,399 63,915,784 - 516,671,183 Securities acquired at original issuance 102,027,415 - - 102,027,415 Unallocated assets - - 209,410,269 209,410,269 Total Assets 813,687,315 63,915,784 209,410,269 1,087,013,368 Liabilities Due to banks 4,053,218 - - 4,053,218 Deposits from individuals - 708,015,138 - 708,015,138 Customer accounts 187,745,057 - - 187,745,057 Own securities issued 52,117,479 2,043,491 - 54,160,970 Other borrowed funds 1,467,509 - - 1,467,509 Unallocated liabilities - - 8,451,980 8,451,980 Total Liabilities 245,383,263 710,058,629 8,451,980 963,893,872 Interest income on loans 83,493,809 11,301,078 - 94,794,887 Interest income on securities 36,785,503 - - 36,785,503 Fee and commission income 16,183,357 746,280 - 16,929,637 Fee and commission expense (480,229) - - (480,229)

Sberbank (Savings Bank of the Russian Federation) Notes to the Financial Statements – 31 December 2003 (Thousands of Russian Rubles, unless otherwise indicated)
26
29. Analysis by Segment and Geography (continued)
Geographical segment reporting is based on the Bank’s activity among its central head office and 17 regional head offices. The Bank has defined five geographical segments:
Geographical segment Name of territorial bank Location of the regional head offices Moscow Central head office Moscow European Russia Severny Yaroslavl Severo-Zapadny Saint-Petersburg Tsentralno-Chernozemny Voronezh Volgo-Vyatsky Nizhniy Novgorod Povolzhsky Samara Srednerussky Moscow Severo-Kavkazsky Stavropol Yugo-Zapadny Rostov-on-Don Ural Zapadno-Uralsky Perm Uralsky Ekaterinburg Western Siberia Sibirsky Novosibirsk Altaisky Barnaul Zapadno-Sibirsky Tumen Eastern Siberia and Far East Severo-Vostochny Magadan Dalnevostochny Khabarovsk Vostochno-Sibirsky Krasnoyarsk Baikalsky Irkutsk

Sberbank (Savings Bank of the Russian Federation) Notes to the Financial Statements – 31 December 2003 (Thousands of Russian Rubles, unless otherwise indicated)
27
29. Analysis by Segment and Geography (continued)
The Bank’s reporting by geographical segments as of 31 December 2003 follows:
Moscow
European Russia Ural
Western Siberia
Eastern Siberia and Far East Unallocated Total
Assets: Cash and cash equivalents 21,969,883 14,833,773 4,363,452 2,107,196 2,341,624 – 45,615,928 Trading securities 73,430,220 43,538,426 6,783,415 5,360,631 6,196,836 135,309,528 Due from banks 78,626,610 2,947 – – – – 78,629,557 Securities available for sale 107,337,827 48,799,881 7,602,711 6,007,862 6,945,792 – 176,694,073 Loans and advances to
customers 304,909,766 294,220,945 74,076,365 67,657,164 51,499,375 – 792,363,615 Securities acquired at original
issuance 39,299,286 24,088,878 3,752,894 2,965,635 3,428,622 – 73,535,315 Premises and equipment 12,839,124 34,296,240 6,331,978 6,830,713 5,803,416 – 66,101,471 Unallocated assets – – – – – 109,251,771 109,251,771 Total assets 638,412,716 459,781,090 102,910,815 90,929,201 76,215,665 109,251,771 1,477,501,258 Liabilities: Due to banks 33,999,040 1,745,882 1,135,217 816,375 192,956 – 37,889,470 Deposits from individuals 263,237,951 469,477,799 87,222,495 77,394,316 81,248,278 – 978,580,839 Customer accounts 78,284,327 84,799,661 21,264,680 11,745,529 15,466,965 – 211,561,162 Own securities issued 48,200,993 28,986,992 13,757,251 9,492,559 3,572,570 – 104,010,365 Other borrowed funds 1,053,151 – – – – – 1,053,151 Unallocated liabilities – – – – – 9,533,108 9,533,108 Total liabilities 424,775,462 585,010,334 123,379,643 99,448,779 100,480,769 9,533,108 1,342,628,095
Moscow
European Russia Ural
Western Siberia
Eastern Siberia and Far East Total
Interest income on loans 32,062,325 42,394,560 10,162,534 10,062,772 7,954,836 102,637,027 Interest income on
securities 11,876,152 9,775,343 1,609,899 1,301,214 1,310,150 25,872,758 Interest expense (25,884,663) (35,382,260) (7,026,050) (5,767,114) (5,582,907) (79,642,994) Gains less losses arising
from securities and derivatives 30,601,875 7,719,215 875,758 922,214 860,179 40,979,241
Gains less losses arising from dealing in foreign currencies 1,324,558 1,958,444 265,813 268,566 456,712 4,274,093
Foreign exchange translation gains less losses (2,999,442) (2,236,906) (542,973) (313,159) (208,409) (6,300,889)
Fee and commission income 3,703,178 10,838,848 2,223,914 2,628,491 2,702,558 22,096,989
Fee and commission expense (513,475) (50,334) (14,218) (20,885) (45,810) (644,722)
Other operating income 261,569 1,359,576 507,162 234,065 242,134 2,604,506 Additionally acquired premises and equipment 2,298,986 6,141,119 1,133,810 1,223,115 1,039,165 11,836,195

Sberbank (Savings Bank of the Russian Federation) Notes to the Financial Statements – 31 December 2003 (Thousands of Russian Rubles, unless otherwise indicated)
28
29. Analysis by Segment and Geography (continued)
The Bank’s reporting by geographical segments as of 31 December 2002 follows:
Moscow
European Russia Ural
Western Siberia
Eastern Siberia and Far East Unallocated Total
Assets: Cash and cash equivalents 49,898,571 12,939,223 1,657,823 1,283,261 1,829,635 – 67,608,513 Trading securities 44,875,368 54,966,206 10,650,047 8,364,268 6,998,547 – 125,854,436 Due from banks 39,996,805 – 8,910 8,700 10,364 – 40,024,779 Securities available for sale 17,985,934 57,771,665 5,694,630 7,366,193 4,206,864 – 93,025,286
Loans and advances to customers 208,018,951 186,944,215 45,638,157 42,817,964 33,251,896 – 516,671,183
Securities acquired at original issuance 36,057,651 47,244,292 7,615,042 4,407,926 6,702,504 – 102,027,415
Premises and equipment 18,406,080 28,615,299 4,234,606 5,687,313 4,732,344 – 61,675,642 Unallocated assets – – – – – 80,126,114 80,126,114 Total assets 415,239,360 388,480,900 75,499,215 69,935,625 57,732,154 80,126,114 1,087,013,368 Liabilities: Due to banks 2,466,557 569,504 599,537 291,704 125,916 – 4,053,218 Deposits from individuals 176,218,624 350,957,363 65,402,880 56,865,437 58,570,834 – 708,015,138 Customer accounts 81,521,431 69,485,133 13,622,120 9,909,296 13,207,077 – 187,745,057 Own securities issued 18,552,766 18,604,856 9,543,091 5,176,988 2,283,269 – 54,160,970 Other borrowed funds 1,467,509 – – – – – 1,467,509 Unallocated liabilities – – – – – 8,451,980 8,451,980 Total liabilities 280,226,887 439,616,856 89,167,628 72,243,425 74,187,096 8,451,980 963,893,872
Moscow
European Russia Ural
Western Siberia
Eastern Siberia and Far East Total
Interest income on loans 38,620,918 34,305,155 7,959,380 7,947,483 5,961,951 94,794,887 Interest income on securities 13,141,451 16,312,662 2,929,191 2,071,327 2,330,872 36,785,503
Interest expense (16,038,187) (28,309,414) (5,584,494) (4,520,494) (4,276,429) (58,729,018) Gains less losses arising from securities and derivatives 14,141,172 3,610,013 712,808 470,507 410,398 19,344,898
Gains less losses arising from dealing in foreign currencies 798,752 1,355,322 209,680 185,612 337,195 2,886,561
Foreign exchange translation gains less losses 512,623 2,036,402 451,914 338,292 240,670 3,579,901
Fee and commission income 2,732,395 8,161,976 1,821,282 1,954,225 2,259,759 16,929,637
Fee and commission expense (264,276) (97,491) (24,111) (39,942) (54,409) (480,229)
Other operating income 539,861 983,617 345,248 113,909 237,675 2,220,310 Additionally acquired premises and equipment 2,883,359 4,482,659 663,362 890,932 741,334 9,661,646

Sberbank (Savings Bank of the Russian Federation) Notes to the Financial Statements – 31 December 2003 (Thousands of Russian Rubles, unless otherwise indicated)
29
30. Interest Rate, Currency, Liquidity, Market and Credit Risks
The Bank’s risk management processes give consideration to various uncertainties. The evaluation of these risks is based on balance sheet modelling and analysis of various scenarios. The results of such testing are measured by the exposure of the Bank’s equity capital to loss based upon the scenarios modelled.
Interest rate risk. The Bank is exposed to interest rate pricing risk, principally as a result of lending to customers and other banks, at fixed interest rates in amounts and for periods, which differ from those of term deposits and other borrowed funds at fixed interest rates.
In practice, interest rates are generally fixed on a short-term basis. Also, interest rates that are contractually fixed on both assets and liabilities are often renegotiated to reflect current market conditions.
The table below summarises the effective average year-end interest rate, by major currencies, for monetary financial instruments outstanding as of 31 December 2003. The analysis has been prepared on the basis of weighted average interest rates for the various financial instruments using year-end effective rates.
2003 2002
RR
Other currencies RR
Other currencies
Assets Cash and cash equivalents 0.40% 0.70% 0.50% 0.90% Trading securities 6.50% 5.62% 13.52% 8.24% Due from banks 0.90% 1.50% 12.10% 1.80% Securities available for sale 7.28% 7.47% 13.64% 8.47% Loans and advances to customers 15.31% 8.51% 19.05% 9.56% Securities acquired at original issuance 25.62% 15.64% 31.67% 15.60% Liabilities Due to banks 1.30% 2.80% 2.90% 5.50% Deposits from individuals 8.70% 5.00% 9.80% 4.50% Customer accounts 1.93% 3.61% 2.28% 3.04% Own securities issued 5.67% 3.25% 5.33% 5.70% Other borrowed funds – 3.01% – 5.27%
The sign “–” in the table above means, that the Bank does not have the respective assets or liabilities in the corresponding currency.
Liquidity risk. Liquidity risk is defined as the risk when the maturity of assets and liabilities does not match. Liquidity risk management at the Bank is performed on the basis of measuring liquidity surplus/deficit and liquidity ratios that are calculated using scenario analysis. Liquidity ratios limits are approved by the Committee on Interest Rates and Limits of the Bank at least once a year. The Bank has also developed an action plan to deal with liquidity issues in the event of an economic crisis. The table below shows assets and liabilities as of 31 December 2003 by their remaining contractual maturity. Some of the assets, however, may be of a longer-term nature; for example, loans are frequently renewed and accordingly short term loans can have a longer-term duration.
The matching and/or controlled mismatching of the maturities and interest rates of assets and liabilities is fundamental to the management of the Bank. It is unusual for banks ever to be completely matched since business transactions are often of an uncertain term and of different types. An unmatched position potentially enhances profitability, but can also increase the risk of losses.
The maturities of assets and liabilities and the ability to replace, at an acceptable cost, interest-bearing liabilities as they mature, are important factors in assessing the liquidity of the Bank and its exposure to changes in interest and exchange rates.

Sberbank (Savings Bank of the Russian Federation) Notes to the Financial Statements – 31 December 2003 (Thousands of Russian Rubles, unless otherwise indicated)
30
30. Interest Rate, Currency, Liquidity, Market and Credit Risks (continued)
The liquidity position of the Bank as of 31 December 2003 is set out below.
Demand and less than 1 month
From 1 to 6 months
From 6 to 12 months
From 1 to 3 years
More than 3 years
Overdue / no stated maturity Total
Assets Cash and cash equivalents 45,615,928 – – – – – 45,615,928 Mandatory cash balances with the Central Bank of the Russian Federation – – – – – 98,893,608 98,893,608
Trading securities 135,309,528 – – – – – 135,309,528 Due from banks 48,264,195 10,005,737 2,426,194 17,933,431 – – 78,629,557 Securities available for sale – – 17,268,339 82,118,735 70,460,197 6,846,802 176,694,073 Loans and advances to
customers 44,527,048 188,683,418 197,596,921 239,737,920 121,471,021 347,287 792,363,615 Securities acquired at original issuance 1,237,922 1,045,185 – 30,989,962 40,262,246 – 73,535,315
Tax asset – – – – – 3,481,131 3,481,131 Premises and equipment – – – – – 66,101,471 66,101,471 Other assets 4,646,491 1,029,848 149,104 207,643 25,506 818,440 6,877,032 Total assets 279,601,112 200,764,188 217,440,558 370,987,691 232,218,970 176,488,739 1,477,501,258 Liabilities Due to banks (14,245,682) (14,750,154) (8,893,634) – – – (37,889,470)Deposits from individuals (249,573,126) (272,732,366) (232,510,166) (197,430,835) (26,334,346) – (978,580,839)Customer accounts (196,657,061) (5,403,936) (5,316,072) (3,937,252) (246,841) – (211,561,162)Own securities issued (48,096,339) (18,139,586) (4,535,316) (33,229,731) (9,393) – (104,010,365)Other borrowed funds (13,413) (9,198) (15,883) (946,807) (67,850) – (1,053,151)Other liabilities (5,048,602) (1,108,840) (1,382,075) (979,284) (155,524) (858,783) (9,533,108) Total liabilities (513,634,223) (312,144,080) (252,653,146) (236,523,909) (26,813,954) (858,783) (1,342,628,095) Net liquidity gap (234,033,111) (111,379,892) (35,212,588) 134,463,782 205,405,016 175,629,956 134,873,163 Cumulative liquidity gap at 31 December 2003 (234,033,111) (345,413,003) (380,625,591) (246,161,809) (40,756,793) 134,873,163
Cumulative liquidity gap at 31 December 2002 (162,748,941) (231,433,765) (151,975,054) (123,563,943) (14,429,982) 123,119,496
The entire portfolio of trading securities is classified within demand and less than one month as the portfolio is of a dealing nature and the Bank believes this is the proper presentation of its liquidity position. Overdue loans and advances to customers represent overdue payments of loan principal.
The Bank is exposed to the effects of fluctuations in the prevailing levels of market interest rates on its financial position and cash flows. The Bank’s interest rate sensitivity analysis based on the re-pricing of the Bank’s assets and liabilities does not differ significantly from the maturity analysis disclosed in the table above. For certain interest sensitive instruments the Bank establishes limits of their respective maturities. The Bank evaluates its risk exposure under negative market conditions and considers these results in interest rate risk and asset and liability management. Interest rate limits and decisions in respect of interest rate policy are made by the Bank’s Committee on Interest Rates and Limits.
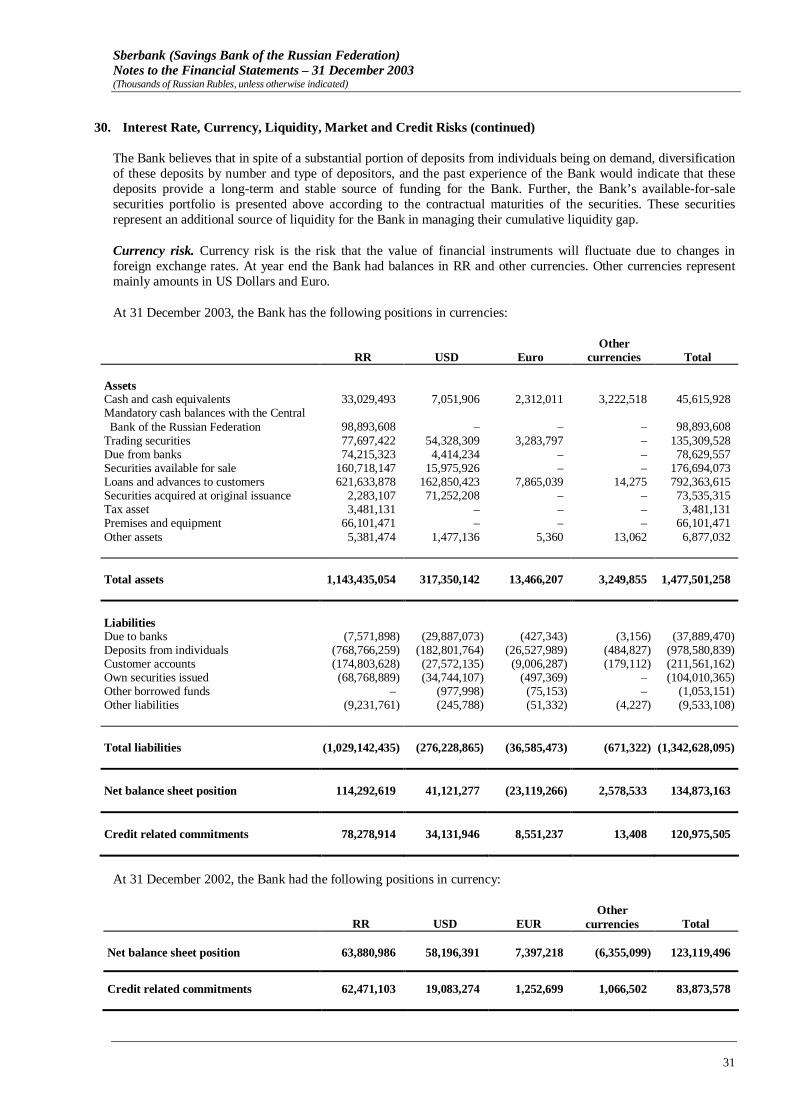
Sberbank (Savings Bank of the Russian Federation) Notes to the Financial Statements – 31 December 2003 (Thousands of Russian Rubles, unless otherwise indicated)
31
30. Interest Rate, Currency, Liquidity, Market and Credit Risks (continued)
The Bank believes that in spite of a substantial portion of deposits from individuals being on demand, diversification of these deposits by number and type of depositors, and the past experience of the Bank would indicate that these deposits provide a long-term and stable source of funding for the Bank. Further, the Bank’s available-for-sale securities portfolio is presented above according to the contractual maturities of the securities. These securities represent an additional source of liquidity for the Bank in managing their cumulative liquidity gap.
Currency risk. Currency risk is the risk that the value of financial instruments will fluctuate due to changes in foreign exchange rates. At year end the Bank had balances in RR and other currencies. Other currencies represent mainly amounts in US Dollars and Euro.
At 31 December 2003, the Bank has the following positions in currencies:
RR USD Euro
Other currencies Total
Assets Cash and cash equivalents 33,029,493 7,051,906 2,312,011 3,222,518 45,615,928 Mandatory cash balances with the Central Bank of the Russian Federation 98,893,608 – – – 98,893,608
Trading securities 77,697,422 54,328,309 3,283,797 – 135,309,528 Due from banks 74,215,323 4,414,234 – – 78,629,557 Securities available for sale 160,718,147 15,975,926 – – 176,694,073 Loans and advances to customers 621,633,878 162,850,423 7,865,039 14,275 792,363,615 Securities acquired at original issuance 2,283,107 71,252,208 – – 73,535,315 Tax asset 3,481,131 – – – 3,481,131 Premises and equipment 66,101,471 – – – 66,101,471 Other assets 5,381,474 1,477,136 5,360 13,062 6,877,032 Total assets 1,143,435,054 317,350,142 13,466,207 3,249,855 1,477,501,258 Liabilities Due to banks (7,571,898) (29,887,073) (427,343) (3,156) (37,889,470) Deposits from individuals (768,766,259) (182,801,764) (26,527,989) (484,827) (978,580,839) Customer accounts (174,803,628) (27,572,135) (9,006,287) (179,112) (211,561,162) Own securities issued (68,768,889) (34,744,107) (497,369) – (104,010,365) Other borrowed funds – (977,998) (75,153) – (1,053,151) Other liabilities (9,231,761) (245,788) (51,332) (4,227) (9,533,108) Total liabilities (1,029,142,435) (276,228,865) (36,585,473) (671,322) (1,342,628,095) Net balance sheet position 114,292,619 41,121,277 (23,119,266) 2,578,533 134,873,163 Credit related commitments 78,278,914 34,131,946 8,551,237 13,408 120,975,505
At 31 December 2002, the Bank had the following positions in currency:
RR USD EUR Other
currencies Total Net balance sheet position 63,880,986 58,196,391 7,397,218 (6,355,099) 123,119,496 Credit related commitments 62,471,103 19,083,274 1,252,699 1,066,502 83,873,578

Sberbank (Savings Bank of the Russian Federation) Notes to the Financial Statements – 31 December 2003 (Thousands of Russian Rubles, unless otherwise indicated)
32
30. Interest Rate, Currency, Liquidity, Market and Credit Risks (continued)
Market risk. The Bank takes an exposure to market risk due to price fluctuations in financial, currency and precious metals markets. The Bank sets limits on the value at risk that may be accepted in respect of the open positions in various financial products. The stop-loss limits are set by the Bank to prevent excessive losses when market conditions change significantly. Limits are monitored on a daily basis. Market risk limits are approved by the Committee on Interest Rates and Limits of the Bank. However, the use of this approach does not fully prevent losses outside of these limits in the event of more significant market movements.
Credit risk. The Bank takes an exposure to credit risk, which is the risk that a counterpart may not be able to pay amounts in full when due. The Bank has implemented an internal risk rating system in respect of its largest borrowers to assess probability of default on loans to these borrowers. To manage the level of credit risk, the Bank sets limits by one borrower, or a group of related borrowers, geographical and industry segments. Credit risk limits are approved by the Loans and Investments Committee, Interest rates and Limits Committee, and Credit Committees of regional head offices or branches within their authority. Procedures of risk limits setting, monitoring, usage, and control are governed by internal regulations. Such risks are monitored on a revolving basis and are subject to an annual or more frequent review: limits for resident banks are reviewed monthly, for non-resident banks and foreign countries – not less than once a year, for corporate borrowers and subjects of the Russian Federation – at least twice a year. In certain cases defined by internal regulations, the Bank can perform an unscheduled review of established limits. Exposure to credit risk is also managed, in part, by obtaining collateral and corporate or personal guarantees as well as by providing for loan losses.
The Bank’s maximum exposure to credit risk is generally reflected in the carrying amounts of financial assets on the balance sheet. The impact of possible netting of assets and liabilities to reduce potential credit exposure is not significant.
Credit risk for off-balance sheet financial instruments is defined as the possibility of sustaining a loss as a result of another party to a financial instrument failing to perform in accordance with the terms of the contract. The Bank uses the same credit policies in making conditional obligations as it does for on-balance sheet financial instruments through established credit approvals, risk control limits and monitoring procedures.
31. Contingencies, Commitments and Derivative Financial Instruments
Legal proceedings. From time to time and in the normal course of business, claims against the Bank are received. The Bank is of the opinion that no material losses will be incurred and accordingly no provision has been made in these financial statements.
Tax legislation. Due to the presence in Russian tax legislation of provisions allowing more than one interpretation, and also due to the practice developed in a generally unstable environment by the tax authorities of making arbitrary judgement of business activities, the Bank’s judgement of its business activities may not coincide with the interpretation of the same activities by tax authorities.
Transfer pricing legislation, which was introduced from 1 January 1999, provides the possibility for tax authorities to make transfer pricing adjustments and impose additional tax liabilities in respect to all controlled transactions, provided that the transaction price differs from the market price by more than 20%. Controlled transactions include transactions with related parties, and transactions with unrelated parties if the price differs on similar transactions with different counterparts by more than 20%. There is no formal guidance as to how these rules should be applied in practice.
If a particular treatment was to be challenged by the tax authorities, the Bank may be assessed additional taxes, penalties and interest, which can be significant. Tax years remain open to review by the tax authorities for three years.
Capital commitments. As of 31 December 2003, the Bank had capital commitments in respect of construction and computer equipment installation totalling RR 2,785,341 (2002: RR 1,347,947). The Bank has already allocated the necessary resources in respect of this commitment. The Bank believes that future net revenues and funding will be sufficient to cover this and any similar commitments.

Sberbank (Savings Bank of the Russian Federation) Notes to the Financial Statements – 31 December 2003 (Thousands of Russian Rubles, unless otherwise indicated)
33
31. Contingencies, Commitments and Derivative Financial Instruments (continued)
Operating lease commitments. In the course of its business the Bank enters into a number of lease agreements. The majority of these lease agreements are cancellable. Where the Bank is the lessee, the future minimum lease payments under non-cancellable operating leases are as follows:
2003 2002 Not later than 1 year 109 10,164 Later than 1 year and not later than 5 years 372 4,218 Later than 5 years 729 23,425 Total operating lease commitments 1,210 37,807
Credit related commitments. The credit related commitments comprise loan commitments, letters of credit and guarantees. The contractual amount of these commitments represents the value at risk should the contract be fully drawn upon, the client defaults, and the value of any existing collateral becomes worthless. In general, most of the Bank’s import letters of credit are collateralised with cash deposits or collateral pledged to the Bank and accordingly the Bank normally assumes minimal risk. Outstanding credit related commitments are as follows:
2003 2002 Undrawn credit lines and commitments to extend credit 107,725,413 76,671,021 Import letters of credit 10,546,724 5,178,953 Export letters of credit 8,410,654 4,119,624 Guarantees issued 2,861,601 1,311,960 Letters of credit for domestic settlements 1,264,384 758,070 Less: cash deposits held as collateral (9,776,039) (4,139,811) Less: provision for losses on credit related commitments (57,232) (26,239) Total credit related commitments 120,975,505 83,873,578
The Bank evaluated the likelihood of possible losses arising from other credit related commitments and concluded that a provision of RR 57,232 was necessary as of 31 December 2003 (2002: RR 26,239). This provision is accounted under other liabilities. The total outstanding contractual amount of guarantees, letters of credit, and undrawn credit lines does not necessarily represent future cash requirements, as these financial instruments may expire or terminate without being funded.
Derivatives. The Bank enters into derivative agreements that include forward, option and swap agreements with foreign currency, forward agreements with securities and precious metals and other derivatives. Currency-based and other derivatives are usually traded on the over-the-counter market on the basis of the standard contracts.

Sberbank (Savings Bank of the Russian Federation) Notes to the Financial Statements – 31 December 2003 (Thousands of Russian Rubles, unless otherwise indicated)
34
31. Contingencies, Commitments and Derivative Financial Instruments (continued)
The table below includes contracts with a maturity date subsequent to 31 December 2003. These contracts were entered into in 2003 and are short term in nature.
Domestic Foreign
Principal or agreed
amount of asset
purchased
Principal or agreed
amount of asset sold
Unrealised Loss
Unrealised Gain
Principal or agreed
amount of asset
purchased
Principal or agreed amount of asset sold
Unrealised Loss
Unrealised Gain
Spot transactions Foreign currency - purchase 147,273 147,073 – 200 22,698,314 22,690,908 (3,079) 10,485 - sale 2,228,816 2,236,706 (7,890) – 29,452 29,455 (3) - Term deals Foreign currency - sale 94,107 94,696 (589) – – – – – Precious metals - purchase 4,585,671 4,512,733 – 72,938 760,165 755,658 – 4,507 - sale – – – – 3,153,801 3,186,675 (32,874) – Total 7,055,867 6,991,208 (8,479) 73,138 26,641,732 26,662,696 (35,956) 14,992
Unrealised gains or losses in the table above reflect the fair value adjustment of outstanding derivatives as of each year-end. The Bank has recorded a net gain of RR 43,695 (2002: RR 63,408), which is included in gains less losses arising from securities and derivatives.
Fiduciary assets. These assets are not included in the Bank’s balance sheet as they are not the Bank’s assets. Nominal values disclosed below are normally different from the fair values of the respective securities. The fiduciary assets fall into the following categories:
2003 Nominal value
2002 Nominal value
Shares in companies held in other custodies 11,318,763 4,458,183 Debt securities of municipal authorities of RF 2,574,936 1,569,918 OVGVZ 1,595,698 2,484,173 Bills of exchange 1,495,452 1,467,555 GKO and OFZ 408,049 2,147,232 RF Eurobonds 2,945 3,178 Other securities 2,915,417 115,904
Assets pledged. As of 31 December 2003, the Bank has pledged securities with fair value of RR 36,938,861 as collateral against overnight interbank borrowings that the Bank takes on a regular basis from the Bank of Russia (2002: RR 4,965,348). As of 31 December 2003 and 2002, the Bank had no overnight borrowings from the Bank of Russia.

Sberbank (Savings Bank of the Russian Federation) Notes to the Financial Statements – 31 December 2003 (Thousands of Russian Rubles, unless otherwise indicated)
35
32. Fair Value of Financial Instruments
Fair value is the amount at which a financial instrument could be exchanged in a current transaction between willing parties, other than in a forced sale or liquidation, and is best evidenced by a quoted market price.
The estimated fair values of financial instruments have been determined by the Bank using available market information, where it exists, and appropriate valuation methodologies. While Management has used available market information in estimating the fair value of financial instruments, the market information may not be fully reflective of the value that could be realised in the current circumstances taking into account the existing volume of operations on the Russian financial markets.
The Bank has estimated that the fair value of certain balance sheet instruments is not materially different than their recorded values. These balance sheet instruments include cash, nostros and term deposits, placements with banks and other financial institutions, securities held for trading or available for sale purposes, loans and advances to customers, deposits from banks and other financial institutions, current accounts and deposits from customers, certificates of deposit and bills of exchange and other short-term assets and liabilities which are of a contractual nature. The Bank believes that the carrying amount of these particular financial assets and liabilities approximates their fair value, partially due to the fact that it is practice to renegotiate interest rates to reflect current market conditions (refer to Note 30). Fair values of securities acquired at original issuance have been disclosed in Note 10.
As set out in Note 4, external independent market quotations were not available for certain securities available for sale. These were fair valued by the Bank using relevant factors such as discounted cash flows and financial information of the underlying investments.
The fair values of equity securities in associated and subsidiary companies, share capital, premises and equipment, and other assets and liabilities which are not of a contractual nature are not calculated as they are not considered financial instruments under IAS 32, “Financial Instruments: Disclosure and Presentation”.
33. Related Party Transactions
For the purposes of these financial statements, parties are considered to be related if one party has the ability to control the other party or exercise significant influence over the other party in making financial or operational decisions as defined by IAS 24 “Related Party Disclosures”. In considering each possible related party relationship, attention is directed to the substance of the relationship, not merely the legal form.
Banking transactions are entered into in the normal course of business with significant shareholders, directors, subsidiaries and companies with which the Bank has significant shareholders in common. These transactions include settlements, loans, deposit taking, trade finance and foreign currency transactions. These transactions are priced predominantly at market rates.
The outstanding balances at the year-end and interest expense and income as well as other transactions for the year with related parties other than the Central Bank of the Russian Federation are as follows:
2003 2002 Correspondent accounts and overnight deposits with other banks 2,617 46,937 Due from banks Placements with the banks – 776,766 Interest income 3,264 17,600 Loans and advances to customers Loans outstanding 2,960,739 3,293,258 Allowance for loan impairment (1,203,242) (1,668,463) Interest income 171,958 109,672 Due to banks Correspondent accounts and overnight deposits of other banks 6,092 23,251 Interest expense 782 4,272 Customer deposits Current/settlement accounts 200,265 178,990 Interest expense 6,519 16,767

Sberbank (Savings Bank of the Russian Federation) Notes to the Financial Statements – 31 December 2003 (Thousands of Russian Rubles, unless otherwise indicated)
36
33. Related Party Transactions (continued)
The Bank of Russia is the majority shareholder of the Bank. As noted in the financial statements, the Bank maintains a number of balances, and carries out a range of transactions with the Bank of Russia, which are not included in the above analysis. These transactions included settlements, deposit placement and deposit taking, transfer of funds to the mandatory cash balances in accordance with the Russian banking regulations. These transactions were priced predominantly at market rates, where applicable.
The outstanding balances at the year-end and interest income and expense as well as other transactions for the year with the Bank of Russia are stated in the table below:
2003 2002 Mandatory cash balances with the Bank of Russia as of year end 98,893,608 74,808,687 Account with the Bank of Russia as of year end (other than mandatory cash
balances) 12,327,864 40,515,431 Loans and advances to the Bank of Russia as of year end (including reverse repo
transactions with the Bank of Russia) 74,215,323 15,276,822 Interest income 4,680,894 4,627,708 Interest expense (64,073) (5,503)
34. Capital Adequacy
The Central Bank of the Russian Federation requires banks to maintain a capital adequacy ratio of 10% (2002: 10%) of risk weighted assets, computed based on statutory rules for Banks with equity capital more than five million EUR. As of 31 December 2003 and 2002, the Bank’s capital adequacy ratio on this basis exceeded the statutory minimum.
As of 31 December 2003 and 2002 the Bank’s international risk based capital adequacy ratio exceeded the minimum ratio of 8% recommended by the Basle Accord:
2003 2002 Core capital adequacy ratio (Tier 1) 12.71% 14.66% Total capital adequacy ratio (Tier 1 and Tier 2) 13.75% 15.97%