Embed Size (px)
Citation preview

AN INFRARED REMOTE SENSING TECHNIQUE FOR
IMPROVED OIL SLICV, CLASSIFICATION
G. C. GerhardR. L. Bolus
Final ReportSeptember, 1974
UNH-SG-l49
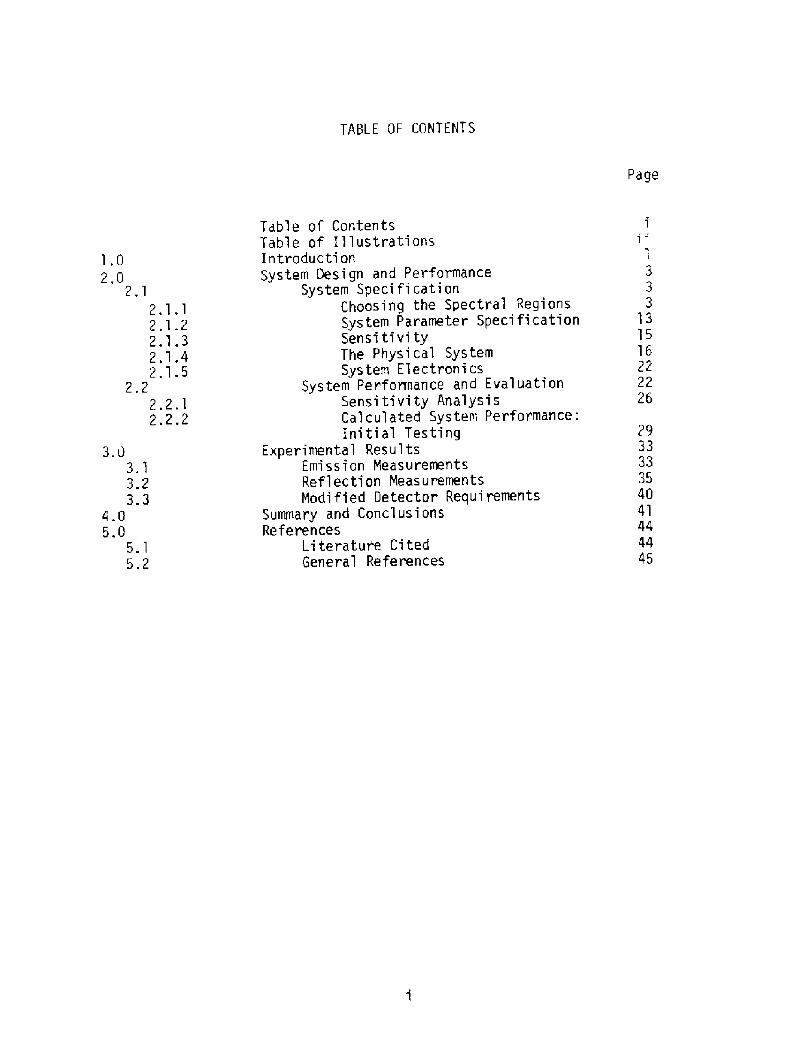
TABLE OF CONTENTS
Page
1.0
2,02,1
2.1.12.1.2
2.1.32.1.42.1. 5
2,2
2.2.12.2.2
29
33
33
35
40
4144
44
45
3.0
3.13.2
3.34.0
5.05.15.2
Table of ContentsTable of IllustrationsIntroductionSystem Design and Performance
System SpecificationChoosing the Spectral RegionsSystem Parameter SpecificationSensi tivi tyThe Physical SystemSystem Electronics
Sys tem Performance an d E va1 ua t i onSens i ti vi ty Anal ys i sCal cul ated System Performance:Initial Testing
Experimental ResultsEmission MeasurementsRe f 1 ec ti on Meas ur emen tsModified Detector Requirements
Summary and ConclusionsReferences
Literature CitedGeneral References
1
ll 1 3 3 31315
162222
26
TABLE OF ILLUSTRATIONS
Figure Page
12 a!
2 b!
3 a!
3 b!
4 a!10
4 b!1117
23
3437
10
39
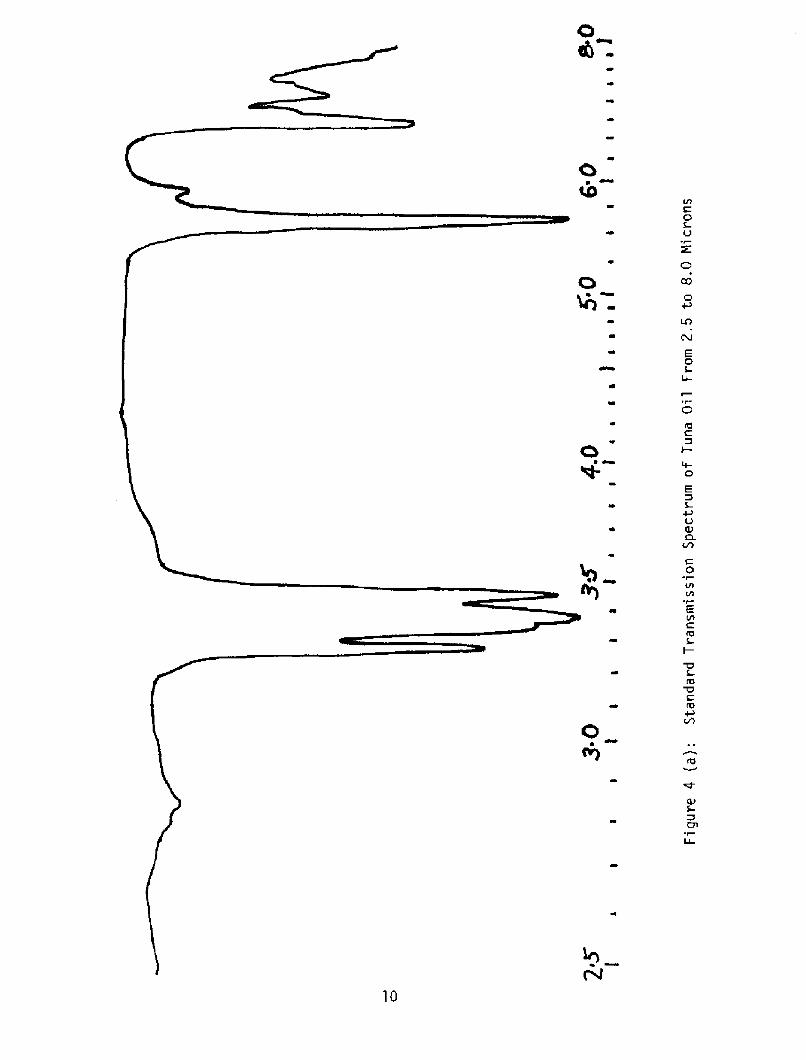
Conceptual Oil "Spectrogram"Standard Transmission Spectrum of Home HeatingOil From 2.5 to 8 MicronsStandard Transmission Spectrum of Home HeatingOil From 7,5 to 'I5 MicronsStandard Transmission Spectrum of No. 6 HeatingOil From 2.5 to 8 MicronsStandard Transmission Spectrum of No. 6 HeatingOil From 7.5 to l5 MicronsStandard Transmission Spectrum of Tuna OilFrom 2.5 to 8 MicronsStandard Transmission Spectrum of Tuna OilFrom 7.5 to 15 MicronsInfrared Spectrum AnalyzerClose-up of Experimental Spectrometer Componentson Base PlateDynamic Emission Spectrograms From 2.5 to 14 MicronsReflectance Spectrograms From 2.5 to 14 MicronsDifference Reflectance Spectrograms of a! No. 6Heating Oil and b! Tuna Oil on Aluminum Foil From2.5 to 14 Mi crons sensitivity xl!Dynamic Reflection Spectra of Films on Rater, RoomAmbient Temperature, From 2.5 to 14 Microns
1,0 Introduction
The potential effectiveness of ai rborne remote sensing as a diagnosti c
and information-gathering technique is a subject on which much has been
written during the previous five year period. This report is concerned with
one specific application of remote sensing - the use of the thermal infrared
portion of the spectrum to provide qualitative and quantitative information
on ocean surface slicks utilizing an airborne infrared spectrometer package.
An interim step in this program as a study of the sensing systems being
developed for the U. S. Coast Guard and their potential cost effectiveness
as compared with the direct visual slick determinations employed at the time.
This study was presented in an earlier report {1!. At that time, the final
specification of the prototype sensor system was not known as the contract
had not been awarded. The contract for the prototype system went to Aerojet
Electrosystems Company {AESC! under Contract No. DOT-CG-22170A. It provided
for the design and complete specification of a prototype Airborne Oil
Surveillance System {AOSS!. This is a multisensor airborne surveillance
system configured to assist the Coast Guard in enforcement of antipollution
legislation and assessmentjcleanup of accidental spills. Phase I of this
program was concerned with the system def~nition studies �!, overall system
design �!, and subsystem specifications �!. Phase II was concerned wi th
system fabri cation and bench checkout while Phase III, beginning January 1974,
was directed toward ai rcraft installation and operational flight testing.
While this prototype multisensor package was being assembled, a contract
for an interim sensor package off-the-shelf, so to speak! was awarded to
Bendix. This employed both ultraviolet and infrared scanners and was scheduled
for testing in May, 1973, based on Cape Cod. Eventually, six of these systems,
covering both coasts, the Gulf of Mexico and the Great Lakes, were to be flown.
Thus, the Coast Guard could gather data and utilize several types of sensors
whi1e the p roto type sys tern was unde r de ve 1 opment.
With this level of Coast Guard activity, it is natural to expect that
al1 possible avenues of research in this area have been covered and that 1ittle,
if any, useful information could be obtained from sensor system evaluation
outside this major effort. However, it was felt by this investigator that
one area of special interest had not been covered adequately. Spectral
signature recognition techniques have been developed for a number of applicat~ons,
notably crop and ground cover identification by workers at Purdue University �!.
Before one can employ either simple comparative or computer-based recognition
schemes, multispectral data must be obtained; i.e., the amount of radiation
emitted or reflected as a function of wavelength. It was the purpose of this
project to investigate the feasibility of obtaining emitted infrared spectral
signatures from the ocean surface to allow discrimination between various types
of surface slicks � petroleum, fish oi 1, windsli cks, etc.
This report describes the design, fabrication, and evaluation of an
inexpensi ve, relatively simple system. Emission and reflected radiation spectro-
grams are presented and discussed, and the inherent problems with the present
system are explored in detail. The requirements for increased detector
signal-to-noise ratio and opti cal system modifications are di scussed. A final
section deals with the rationale for greatly increasing the overall sensitivity,
and hence effectiveness, of this measurement system.
2.0 S stem Desi n and Performance
2.1 S stem S ecification
The purpose of the system, as previously stated, was to utilize emitted
infrared radiation, in the 3 to 14 micron wavelength region, to obtain a
spectroscopic record of emitted radiation u watts! as a function of wavelength
microns! for the surface of the ocean on which there may be a layer of
petroleum or fish oil or other material. Such a layer, due to its filtering
properties, may affect the spectral distribution of energy and hence have a
spectral signature as determined from a "spectrogram" as depicted in Figure 1.
Certain pronounced "dips" in the output energy at specific wavelengths may
correspond to peaks in the absorption spectral characteristic for a given type
of material, such as noted in the figure. !n order to utilize such a technique,
however, several conditions must be fulfilled.
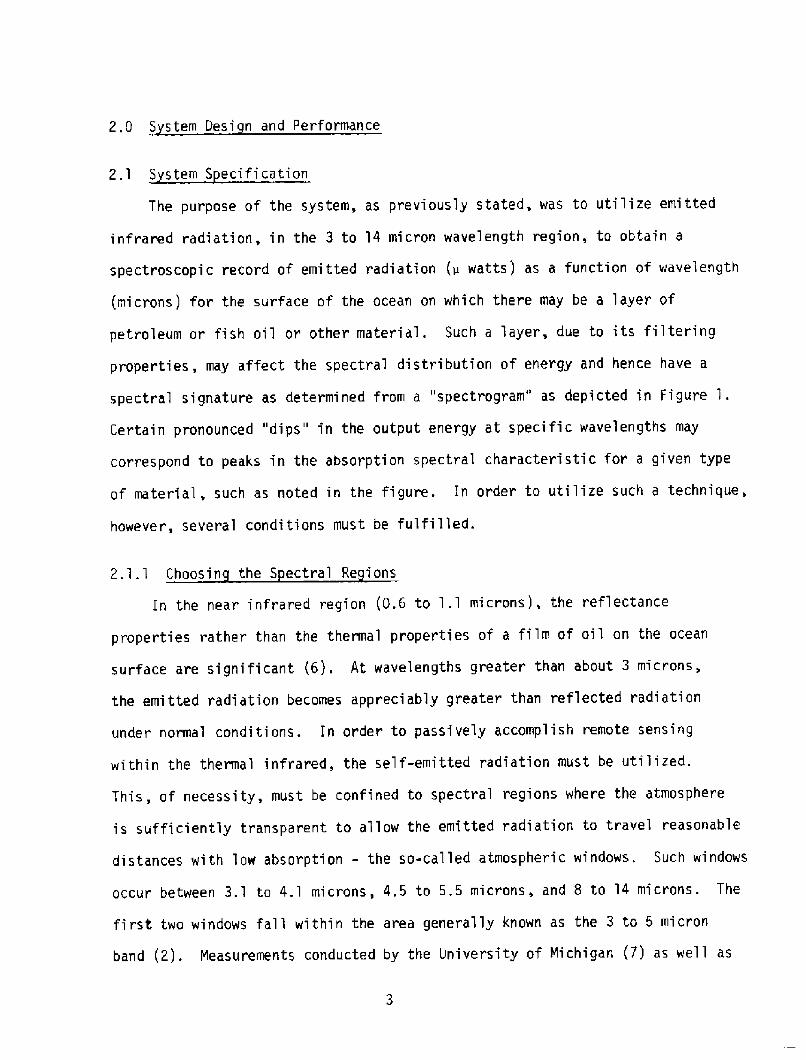
2.1.1 Choosin the S ectral Re ions
In the near infrared region �.6 to 1.1 microns!, the reflectance
properties rather than the thermal proper ties of a film of oil on the ocean
surface are significant �!. At wavelengths greater than about 3 microns,
the emi tted radiation becomes appreci ably greater than reflected radiati on
under normal conditions . In order to passively accomplish remote sensing
within the thermal infrared, the self-emitted radiation must be utilized.
This, of necessity, must be confined to spectral regions where the atmosphere
is sufficiently transparent to allow the emitted radi ation to travel reasonable
distances with low absorption - the so-called atmospheric windows. Such windows
occur between 3.1 to 4.1 microns, 4.5 to 5.5 microns, and 8 to 14 microns. The
fi rst two windows fall within the area generally known as the 3 to 5 micron
band �!. Measurements conducted by the University of Michigan �! as well as

0 C 0 CJ 4JO O
C O
uessaup shgo~ag
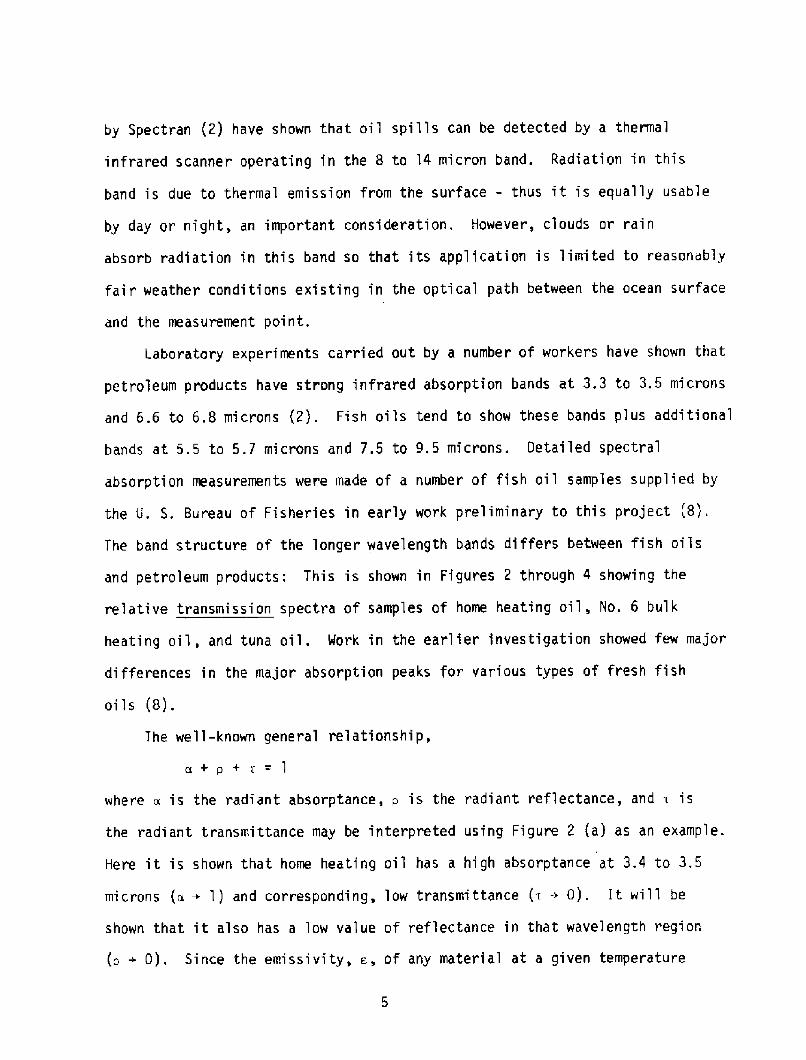
by Spectran �! have shown that oil spills can be detected by a thermal
infrared scanner operating in the 8 to l4 micron band. Radiation in this
band is due to thermal emissi on from the surface � thus it is equally usable
by day or night, an important consideration . However, clouds ar rain
absorb radi ati on in this band so that its application is limited to reasonably
fair weather conditions existing in the optical path between the ocean surface
and the measurement point.
Laboratory experiments carried out by a number of workers have shown that
petroleum products have strong infrared absorption bands at 3.3 to 3.5 microns
and 6 .6 to 6.8 mi crons �!. Fish oils tend to show these bands plus additional
bands at 5.5 to 5.7 microns and 7.5 to 9,5 microns. Detailed spectral
absorption measurements were made of a number of fish oil samples supplied by
the U. S. Bureau of Fisheries in early work preliminary to this project 8!.
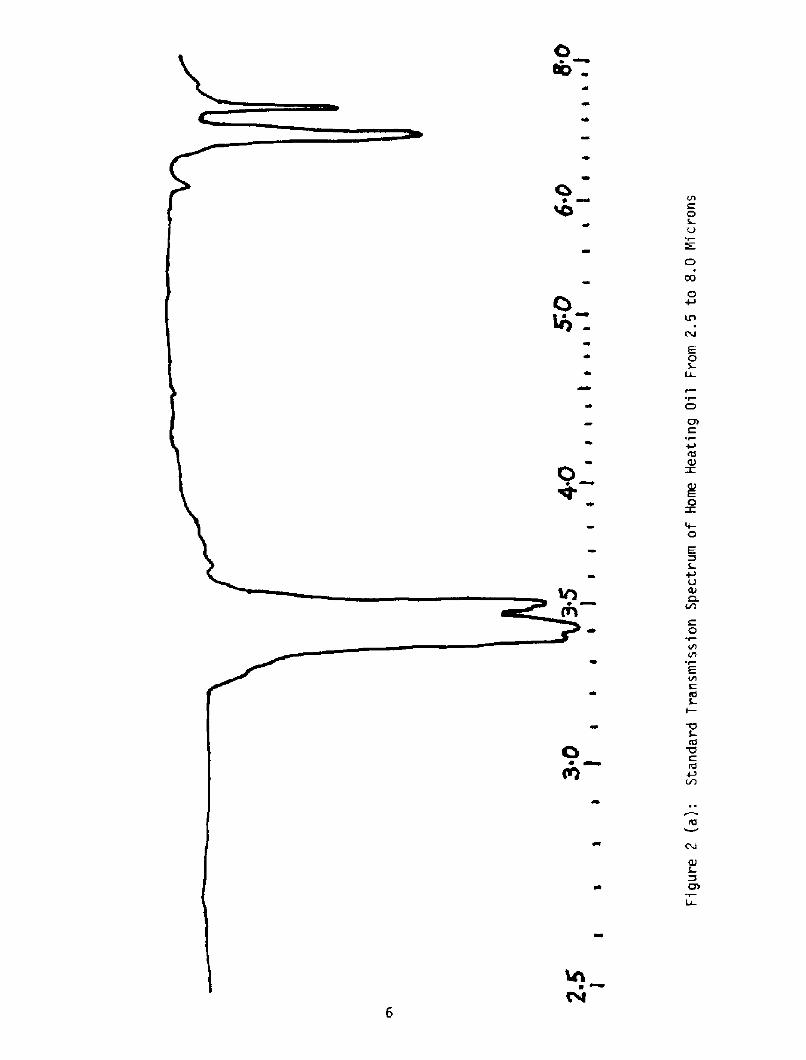
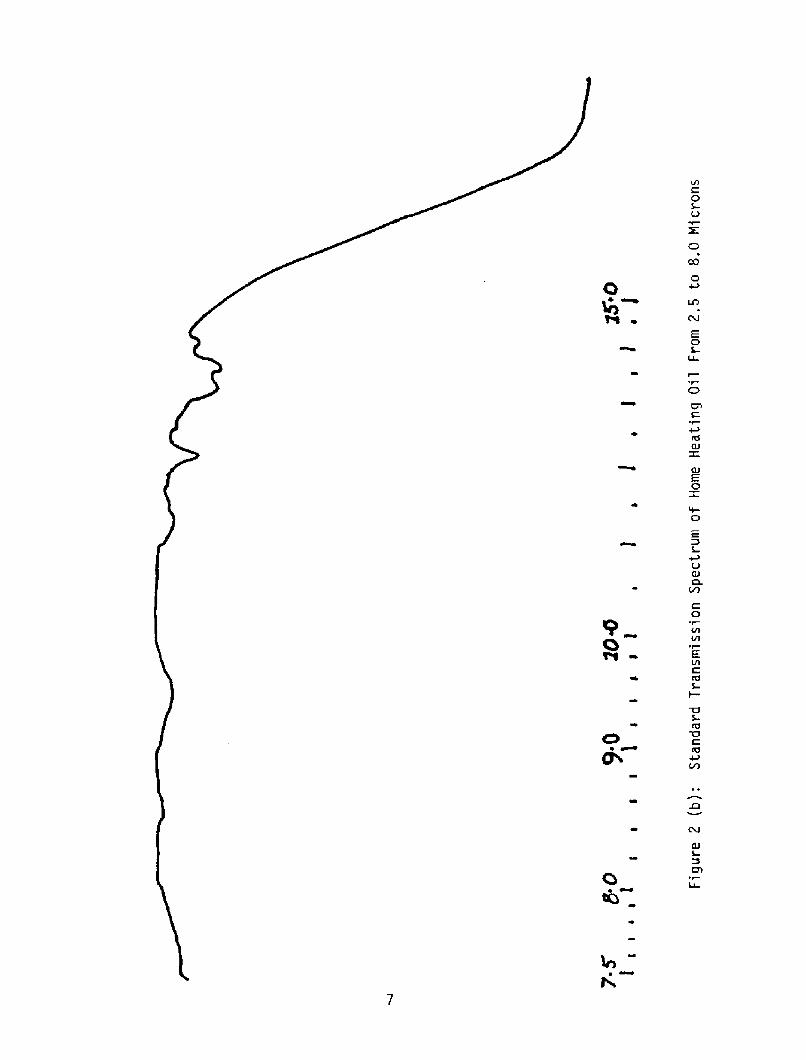
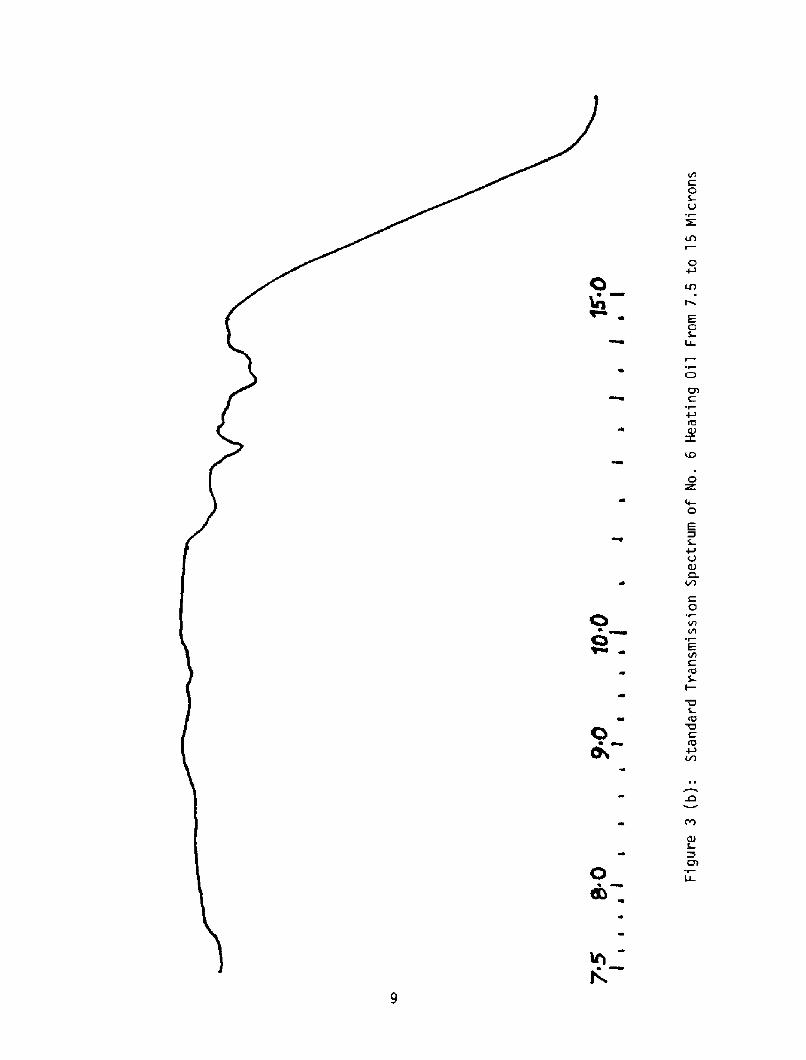
The band structure of the longer wavelength bands differs between fish oils
and petroleum products: This is shown in Figures 2 through 4 showing the
re'lative transmission spectra of samples of home heating oil, No. 6 bulk
heating oil, and tuna oil. Work in the earlier investigati on showed few major
differences in the major absorption peaks for various types of fresh fish
oils 8!.
The well-known general relationship,
a+p+ v = 1
where a is the radiant absorptance, p is the radiant reflectance, and T is
the radiant transmittance may be interpreted using Figure 2 a! as an example.
Here it is shown that home heating oil has a high absorptance at 3.4 to 3.5
microns m ~ l! and corresponding, low transmittance ~ ~ 0!. It will be
shown that it also has a low value of reflectance in that wavelength region
p ~ 0!. Since the emissivity, e, of any material at a given temperature
O O
I
CgCl
O
4-O
C 0 Vl'IE VltdI�
i.g$'D lg
QJS-
CAfU-
O
O
E O S-
E O
C3'P IE IJlCgS

O
4Q
O
a
O e
gF!
<D
C O B
S-
CfCf!
O
'I
'I�
4-O
E V CUQ
'IE
fgI�
S-Cg
O VlK VlreI�
O

OS
O O'I
V!
r E S-I�
a+
O !
11

is equal to its absorptance, a, at that temperature,
and there should be a spectral emission peak in the 3.4 to 3.5 micron region
since p and ~ are much higher and hence a is much lower for wavelengths
immediately adjacent to this region, However, oil film thickness will influence
whether the blackbody or filter properties of the film will predominate,
The same general statements may be made for longer wavelength absorption peaks.
Unfortunately, there is negligible thermal emission for typical earth
surface temperatures! around 3 microns and the bands around 5.5 microns and
6.6 microns do not fall in the so-called "windows" and hence radi ati on at these
wavelengths is attenuated rapidly by the atmosphere, Therefore, if infrared
spectrometry is to be utilized to distingui sh between fi sh oils, petroleum
oils, and features such as wind slicks, most of the useful information would
be obtained at wavelengths greater than 8 microns. However, for the purposes
of this investigati on, the spectrometer range was extended downward to 2 microns.
Thermodynamic studies of oil films on water were extensively carried out
by Horvath et al 9!. They, along with other investigators, determined that
only optically thi ck oil films can provi de useful information in the therma1
infrared wavelength bands. However, even if emission and absorption of
thermal radiation are not significant within the slick, certain thermal effects
are still significant in the water immediately beneath the film and would still
directly affect the apparent film temperature through heat transfer over the
small dimensions tens of microns! involved. Thus, a higher surface reflectance
produced by even the thinnest slick would still reduce the net thermal radiation
exchange from that present for a pure water surface. This would result, in
far thi cker slicks, as a warming tendency when the temperature of the water
was such that the blackbody irradiance of the water was greater than the thermal
12

irradiance of the atmosphere and, conversely, as a cooling tendency when the
water irradiance was less than that due to the atmosphere. A broad band
thermal infrared measurement over the 8-14 micron band, for example! would
indicate an apparent temperature shift of a slick, either plus or minus,
depending on the environmental conditions and type of oil, as compared with
the water surface. A detailed spectral analysis of the same band would show
the increased or decreased blackbody radiation due to an apparent temperature
change of the surface plus any fine structure due to the spectral absorption,
and hence, emission, of the particular oil film. Petroleum products have a
small amount of fine structure in the 11-14 micron region Figures 2 and 3!
while fish oils have quite pronounced fine structure in their absorption peaks
Figure 4!. Thus a fish oil slick should be readily determined from a petroleum
oil slick by an emission spectrogram. Additional information obtained from
a spectrogram at shorter wavelengths � fish oils also have a strong absorption
band around 5,5 microns, at the edge of one of the atmospheric windows. The
absorption bands around 3.5 microns which are present, for both types of oil
would be useful if the sensitivity of the spectrometer could be made high
enough to detect the relatively lower amount of blackbody radiation at that
wavelength. The sensitivity problem will be discussed in more detail in a
later secti on.
2.1.2 S stem Parameter S ecificati on
The parameters of the spectrometer system were thus determined to be:
1! Spectral coverage of atmospheric windows in the thermal
infrared in the 2 to 14 micron region.
2! Spatial resolution of a reasonably small portion of the
surface to allow pinpointing of a portion of a slick.
13
3! The time required for a spectral scan should be as short
as possible commensurate with the response time of the
detector.
4! Reasonable sensiti vi ty of the overall spectrometer optical system.
5! Optical bandwidth to allow reasonable spectral resolution, not
to exceed 0.1 micron a ! !.
The first parameter has been adequately discussed. The need for the
second is related to the desire to investigate narrow slicks close to their
source � the side or stern of a ship, for example, in order to better fix
legal responsibility. The initial design goal was set for a small diameter
circle �0 to 20 feet! to be viewed from an aircraft at a height of about
5000 feet. This requirement could be relaxed somewhat. The third parameter
is deri ved from the fact that it is diffi cult to mai ntain the alignment of a
telescopic-like device at a fixed point on the surface of the ocean for any
length of time from a moving aircraft. This is especially true over the ocean
surface where reference points may not exist on the surface, and the velocity
of the aircraft would cause the angle of view to constantly change anyway.
For the first experimental system, this was not considered as seriously
as it would have to be for a final operational system. The fourth parameter
involving sensitivity will be dealt wi th separately, The fifth consi deration
was that of spectral resolution. Since, as it turned out, the filter element
size was fixed by economic necessity, the onIy parameter of the system that
could be adjusted to affect spectral resolution was the beam diameter. The
initial design goal for that was set at 0.001 inch, but that was ultimately
limited by the telescope capability. A 0.001 inch beam diameter would have
provided an instantaneous bandwi dth z z! of not greater than 0.005 mi cron,
.1.3
The problem of system sensitivity deserves some amplification. There
are a number of factors which affect the sensitivity. Any energy absorption
in the optics or filters is obviously undesirable and must be kept to a
minimum. Therefore, reflective optics were indicated. This was advantageous
for several reasons, Interference factors which are often employed in narrow
bandwidth systems have transmissions between 20 and 40 percent. A reflective
grating can be quite efficient, but some filtration is still needed to suppress
the higher orders; the amount needed depends on the spectral characteristics
of the detector. The sensitivity is then ultimately determined by the detector
itself, the level of thermal background radiation, in the detector's field of
view and the noise in the initial preamplication stage of the signal processing
electronics.
For most detectors with fairly broad optical bandwi dth, and for reasonable
electrical bandwi dths, the %i mi ting noise is that due to the detector itself
as the preamplifier equivalent input noise can be many orders of magnitude
lower in amplitude. Likewise the use of cooled and/or low emissivity shields
around the detector can reduce the noise due to thermal background radiation.
In some cases the detector package itself can be cooled; in other cases it
must be part of a cryogenically operated package. The spectral requi rements
imposed the detector indicated the need for Usable sensitivity from 5 to 14
microns as a minimum. This could be best covered with an indium antimonide
InSb! photovoltaic cell, operated at 77' K and either a mercury-cadmium
telluride Hg� Cdl Te! or lead-tin teljuride Pb� Snl Te! photovoltaic
cell, also operated at 77' K. These detectors represent the most advanced
state-of-the-art for these wavelengths. Unfortunately the cost of a pair of
these detectors atong with the appropriate dewar and cooling system Joule-
15
Thompson open cycle being the optimum choice in terms of cost! would have
to be obtained at a cos t greater than twi ce that of the ini ti al equi pment
budget for the project. Since the overall budget of any new project must
fit into the overall coherent area program budget, this was not a trivial
consideration. Therefore it was decided to utilize broad-band thermal as
opposed to photon! detectors for this feasibility study. These devices did not
require cryogenic cooling, are moderate in cost, and typically have
detectivities �*! around 10 cm Hz! watt!, as compared with the*+ 8 1/2 -1
previously cited photovoltaic cells which have detectivities typically two
orders of magnitude greater. Examples of the thermal detectors include
thermocouples, thermopiles, pyroelectric detectors, and thermistor bolometers.
The theoretical effects of this choice will be evaluated in a tater section.
2.1.4 The Ph sical S stem
In order to efficiently utilize the relatively small amount of blackbody
radiation emitted from small area of ocean surface in a narrow optical!
spectral bandwidth, some type of collection optical system or lens was needed.
Such a lens would focus the radiation to a beam diameter compatable with the
requi rements of both the monochromator elements and the detector. Because
of the desired wide spectral scan capability, simplicity and the relatively
ease of harmoni c higher order! suppression, a circular vari able interference-
type filter was chosen as the basi s of the monochromator. Budget limi tations
precluded the use of any but stock filter elements and hence three standard
90 elements covering from 2.5 to 14.5 microns with a minimum peak transmittance
+For the reader who is unfamiliar wi th the term, detectivi ty, it wi 1 1be defined in a later section.

c y
j>
~J
C gC !
4
c! Cv-
! l
i!
C~ ~~
Q-
-L

of 30 percent were purchased from Optical Coating I aboratories. The band-
width varies somewhat with wavelength, being larger at longer wavelengths.
The use of such a filter system required that the beam be only a few mils
in diameter at the filter surface. Therefore the optical collection system
had to provide a converging beam to the chopper modulator! filter, and detector
assembly. Since it was desirable to have the optical system efficient over
a broad range of wavelengths, from the visible for alignment and observation
purposes! through the medium infrared, reflective optics were indicated. A
relatively simple Cassegrainian telescope of four inch nominal diameter with
the primary reflector having focal length of eight inches a nominal f/2! was
purchased from the 3B Optical Company. The specification indicated a focus
point about nine inches behind the backside of the primary reflector; thus
providing a total focal length of some twenty-four inches for an overall
aperture of' about f/6. The field of view was specified at one milliradian
which meant a 10 foot diameter circle of view at an altitude of 5000 feet
assuming the detector area point fill the beam diameter. Such a system would
be designed for spatial resolution somewhat at the expense of sensitivity; this
particular question will be specifically addressed further in this report.
A Bulova tuning fork type chopper was specified to provide an a,c. signal
as well as the blackbody reference point. Both reflective and black vane types
were considered with the latter chosen for simp'Iicity. An insulated temperature-
controlled cavity could be installed around such a chopper at a later time to
provide a more stable reference point.
The choice of a detector for a wide-band infrared system is a difficult
problem unless funds are relatively unlimited. A pyroelectric or a thermistor
bolometer detector has the broad optical bandwidth capability at the expense of
sensitivity and speed. Photodiodes, on the other hand incIuding photovoltaic-
18
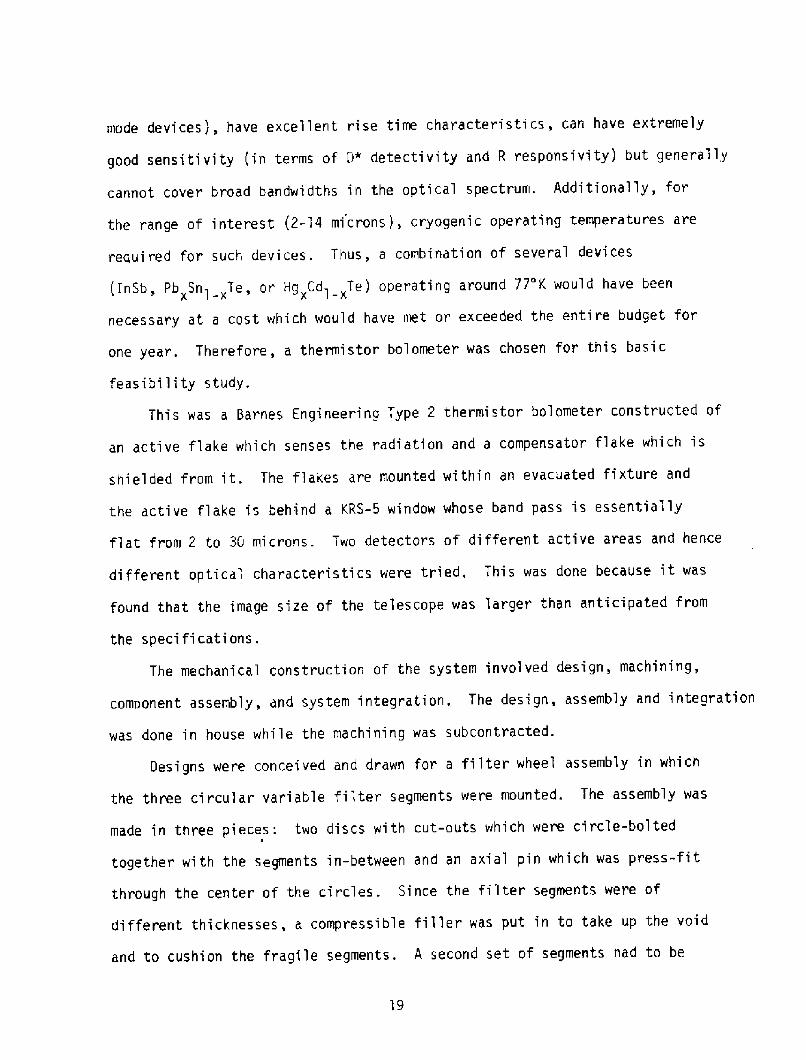
mode devices!, have excellent rise time characteristics, can have extremely
good sensitivity in terms of D» detectivity and R responsivity! but generally
cannot cover broad bandwidths in the optical spectrum. Additionally, for
the range of interest, �-14 microns!, cryogenic operating temperatures are
required for such devi ces. Thus, a combination of several devices
InSb, Pb Snl Te, or Hg Cd> �Te! operating around 77'K would have beennecessary at a cost which would have met or exceeded the enti re budget for
one year. Therefore, a thermistor bolometer was chosen for this basi c
feasibi 1 i ty study.
This was a Barnes Engineering Type 2 thermistor bo'lometer constructed of
an active flake which senses the radiation and a compensator flake which is
shielded from it. The flakes are mounted w~thin an evacuated fixture and
the active flake is behind a KRS-5 window whose band pass is essentially
f1at from 2 to 3G microns. Two detectors of different active areas and hence
different optical characteristics were tried, This was done because it was
found that the image size of the telescope was larger than anticipated from
the specifications.
The mechanical construction of the system involved design, machining,
component assembly, and system i ntegration . The desi gn, assembly and integration
was done in house while the machining was subcontracted.
Desi gns were conceived and drawn for a filter wheel assembly in whi ch
the three ci rcular variable filter segments were mounted. The assembly was
made in three pieces: two discs wi th cut-outs which were circle-bolted
together with the segments in-between and an axial pin which was press-fit
through the center of the circles� . Since the filter segments were of
different thicknesses, a compressible filler was put in to take up the void
and to cushion the fragile segments. A second set of segments had to be
19
purchased because several elements of the first set cracked under too
much pressure while in the wheel assembly,
Designs were conceived and drawn for mounti ng the detector, chopper,
motor, potentiometer, and filter wheel. The detector and chopper mountings
were designed such that they had 2 and 1 degrees of translational freedom
respectively. This was done to simplify the a'Iignment problem encountered
later during system integration. The motor, filter wheel, and potentiometer
mounts were made such that they could be coaxially positioned in the system.
System integration included mounting all components on a 1/4 inch
aluminum base plate, mounting the telescope, and aligning both optical and
mechanical components. Optical alignment was done in the visible range
of the spectrum with a collimated light source. The source was placed in
front of the telescope and an image point was focused on the detector
by adjusting the telescope length and by translating both chopper and detector.
Mechanical alignment of the motor, filter wheel and potentiometer was done
simply by shimming the mounting plates and by using a flexible heat shrinkable
plastic tubing for all couplings. All axIe shafts were mounted in ball bearings.
The electronics involved in the system were those planned for and some
not planned for. 8y far the most complex and obvious, were the specified
signa'i acquisition ci rcuits, consisting of a lock-in amplifier in the detector
output signal path and a power driver to run the light chopper. Those not
planned for, very simple but completely necessary, were a noise suppression
circuit and a soft turn-on circuit for the thermistor bolometer bias to prevent
burn-out. They will be discussed in more detail.
A Princeton Applied Research Model 126A lock-in amplifier was used as a
phase-sensitive demodulator. In the signal path there was a low noise
preamplifier, a selectable filter, a phase sensiti ve demodulator, another
20

filter, and both an output meter and an output electrical signal. There
i s, of course, necessary gain built i nto the signal path for reasonable output
levels. The type 185 preamplifier was on an extension cable so that it could
be placed next to the thermistor bolometer. This resulted in minimum
signal degradation, as the low level bolometer signal was immediately
amplified before being transmitted over any appreciable length of cable.
The selectable filter was used in the band pass mode with the center frequency
set to 100 hz and the bandwidth set to l hz. The phase sensitive demodulated
the modulated AC signai to a modulated DC signal. The second filter was a
low pass on the modulated DC signal. It's time constant was set at 1 second.
The output meter provided a visual indication of what was happening and the
electrical signal output in this case was connected to a chart recorder for
a permanent record of the output.
The light chopper power driver was a simple two-transistor oscillator,
using the tuning fork as the frequency regulating element. It is powered
from a 24 volt DC supply.
The noise suppression circuit consisted of two l microfarad capacitors
from the plus and minus terminals of the DC motor to ground. This effectively
removed the brush noise from the motor by shunting it directly to ground.
It is very simple, and yet without it, the spectra were completely masked
by noise.
The soft turn-on circuit was added as a result of bitter experience.
After the first relatively expensive detector had burned up from a turn-on
transient overvoltage, a simple circuit consisting of a resistor in series
with the bias battery and a capacitor in parallel with that combination was
used to soften the turn-on, The circuit allowed the voltage across the detector
to start from 0 volts and build up gradually along an RC discharge curve, with
21
a time constant of 3 seconds, to its final valve,
A photograph with the components of the spectrometer mounted on a
0.25 inch aluminum base plate during a test procedure is shown in Figure 6.
2.1.5 S stem Electronics
2.2 S stem Performance and Evaluation
Some definitions, symbols, and formulae needed for calculations are
gi ven here.
S ectral radiant emittance of a blackbody also denoted as Rbb !Wa- Cl watts
cm -micron
cal 1 ed P 1 anck ' s Law, i s the power per uni t area and wavelength
radiated from a blackbody source into a hemisphere, where
in K,
when cm and microns are used!,2
T = temperature
Cl = 3.74 x 10⁴
C2 = 1.44 x 10 when cm and microns are used!, and2
= wavelength in microns.
A precision potentiometer was connected to the shaft on which the
circular variable filter elements were connected. The purpose of this was
to provide an analog signal voltage which would be proportional to the angle of
rotati on of the filter. This would allow field calibration of the system
wi th respect to center wavelength. An analog to digital convector was designed
and tested. A decoder was also designed; the initial design was tested and
modified. However, the optical problems eventually demanded higher priority
and further development of the f'ield model electronics was halted. There are
many state-of-the-art designs for such electronic systems and further
discussion is not warranted here.
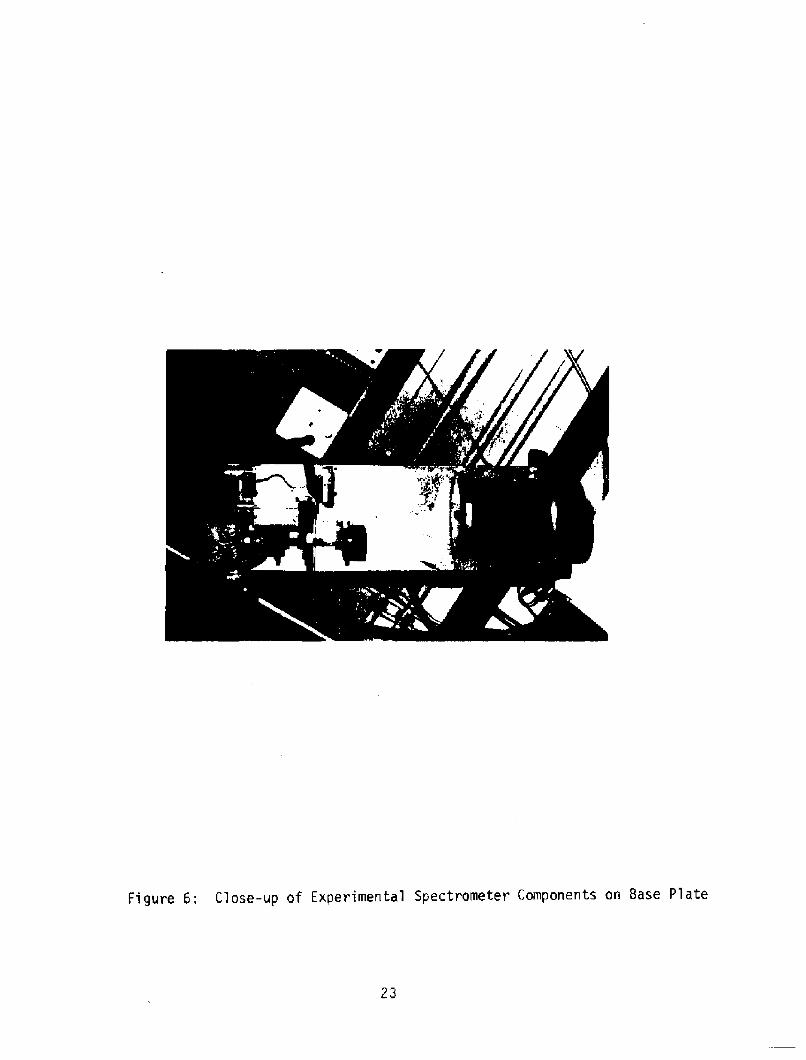
Figure 6: Close-up of Experimental Spectrometer Components on 8ase Plate
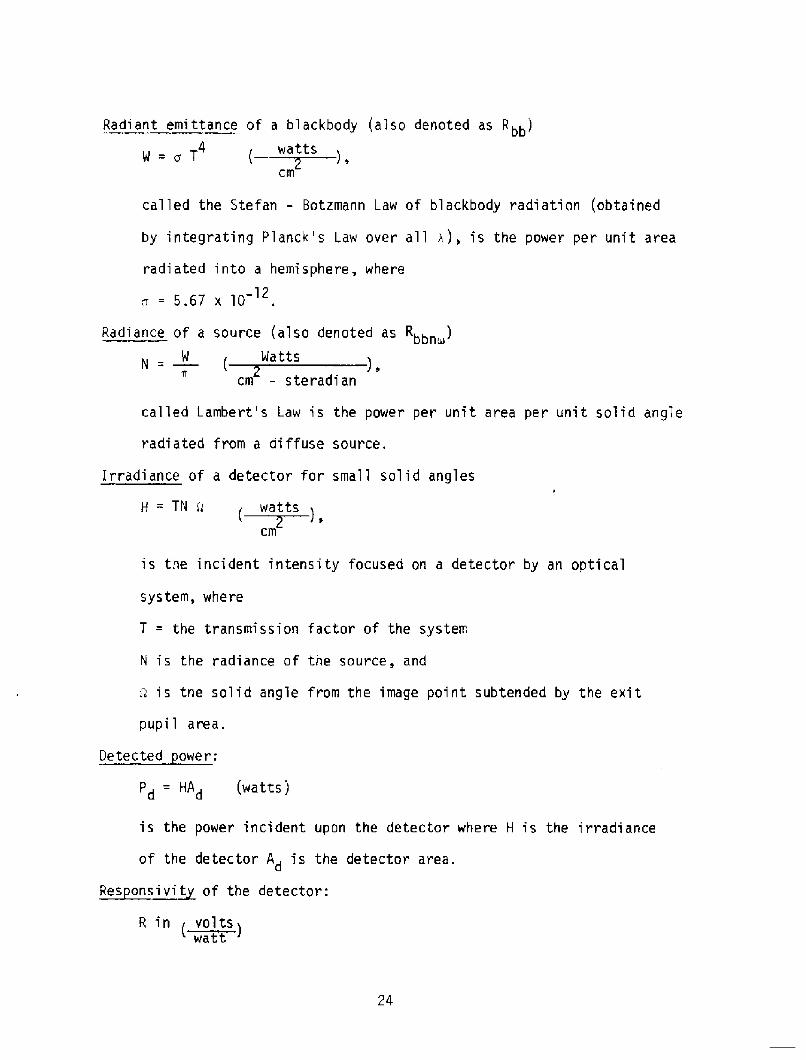
Radiant emittance of a blackbody also denoted as Rbb!4 watts
cm
called the Stefan - Botzmann Law of blackbody radiation obtained
by integrating Planck's Law over all a!, is the power per unit area
radiated into a hemisphere, where
= 5.67 x 10- I2
Radiance of a source also denoted as Rbbn�!
!,W Watts
cm � steradian
called Lambert's Law is the power per unit area per unit solid angle
radiated from a diffuse source.
irradiance of a detector for small solid angles
cm
is the incident intensity focused on a detector by an optical
system, where
T = the transmission factor of the system
N is the radiance of the source, and
a is the solid angle from the image point subtended by the exit
pupil area.
d � HAd watts!
is the power incident upon the detector where H is the irradiance
of the detector Ad is the detector area.
R in volts!watt
24
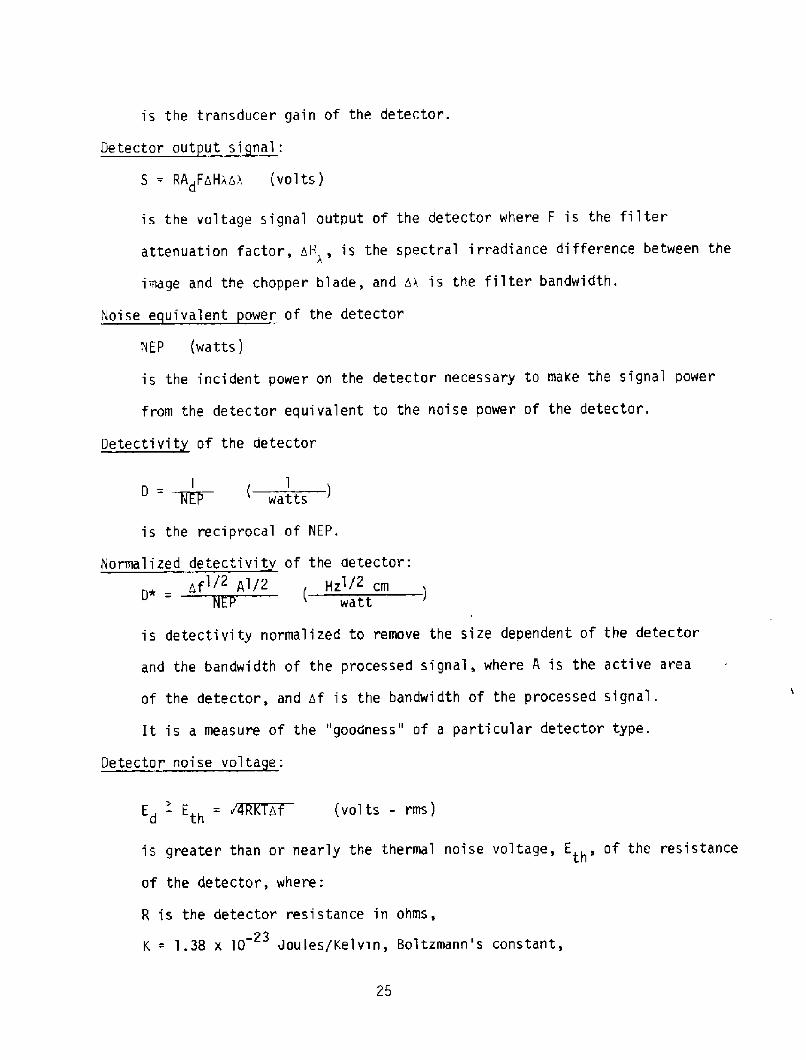
is the transducer gain of the detector.
Detector out ut si nal:
S = RAdFzHxzs volts!
is the voltage signal output of the detector where F is the filter
attenuation factor, aH�, is the spectral irradiance difference between the
image and the chopper blade, and A~ is the filter bandwidth.
Noise e uivaIent ower of the detector
NEP watts!
is the incident power on the detector necessary to make the signal power
from the detector equivalent to the noise power of the detector.
of the detector
1 1 -tts
is the reciprocal of NEP.
Normalized detectivit of the detector:
gf I/2 Al/2 Hzl/2 cm
is detectivity normalized to remove the size dependent of the detector
and the bandwidth of the processed signal, where A is the active area
of the detector, and af is the bandwi dth of the processed signal .
It is a measure of the "goodness" of a particular detector type.
Detector noise volta e:
Ed - E h = AlRThf volts - rms!
is greater than or nearly the thermal noise voltage, E, of the resistance
of the detector, where:
R is the detector resistance in ohms,
K = 1.38 x 10 Joules/Kelvin, Boltzmann's constant,-23

T is the temperature in K, and
af is the measurement bandwidth in cps or Hz.
Am lifier noise fi ure
Out ut noise volts!FN db! = 20 loglp t at part o output cause y sourcethermal noise!
is a measure of the noise internal to the amplifier in relation to the
source thermal noise. Noise figure can be obtained by measurement
or if supplied from noise fi gure contours of the manufacturer.
2.2.1 Sensitivit Anal sis
NET�
T A aeTAD T TfKo A o f
where: F = system focal length,
af = electrical noise bandwidth,n
a = S.67 x 10 watt m. 'K
~ = target emissivity,
T = target temperature in 'K,
A o a re a o f e n t r a n c e a p e r a t u re
ae = angular resolution in radians,
TA = atmospheric transmission,
D* = detectivity,
To = optics transmission,
26
The workers at Aerojet Electrosystems have used �! the noise equivalent
temperature NET! � the signal temperature whi ch will product unity signa'I
to noise ratio - as a figure of merit for passive infrared systems. The
relationship defining NET may be given as:
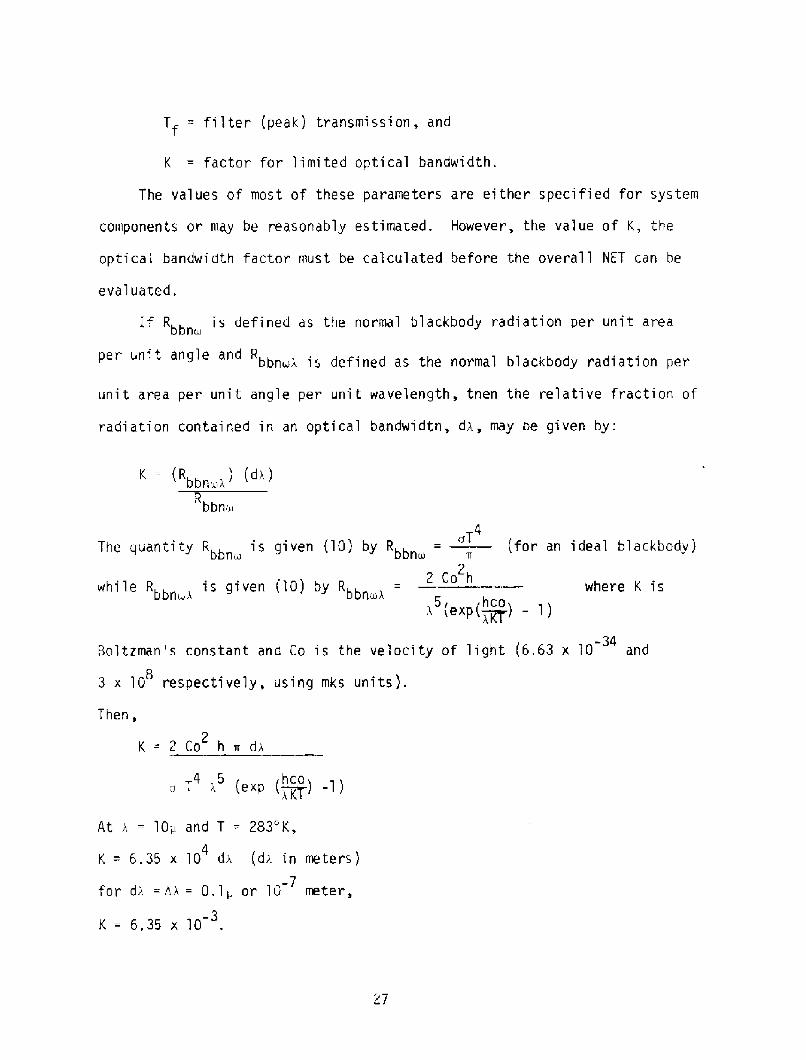
Tf = filter peak! transmission, and
K = factor for limited optical bandwidth.
K == Rbb ! dX!
4
The quantity R is given �0! by R aT
bbn~ bbn~
while R is, gi ven �0! by R Z Co h
bbn ~A bbn~!
for an ideal blackbody!
where K is
~ exp ~! � 1!-34
Boltzman's constant and Co is the velocity of light �.63 x 10 and
3 x 1 0 respectively, usi ng mks units!.8
Then,
K = 2 Co h ~ ds2
a T t exp ~! -1!
At! =10'
K= 6.35 x
for dk =Ax
and T = Z83'K,
10 da da in meters!4
-7= 0.1> or 10 meter,
K = 6.35 x 10⁻³
27
The values of most of these parameters are either specified for system
components or may be reasonably estimated. However, the value of K, the
optical bandwidth factor must be calculated before the overall NET can be
evaluated.
If R is defined as the normal blackbody radiation per unit areabbn~
bbn~~ is defined as the normal blackbody radiation perer unit an le and R
unit area per unit angle per unit wavelength, then the relative fraction of
radiation contained in an optical bandwidth, da, may be given by:
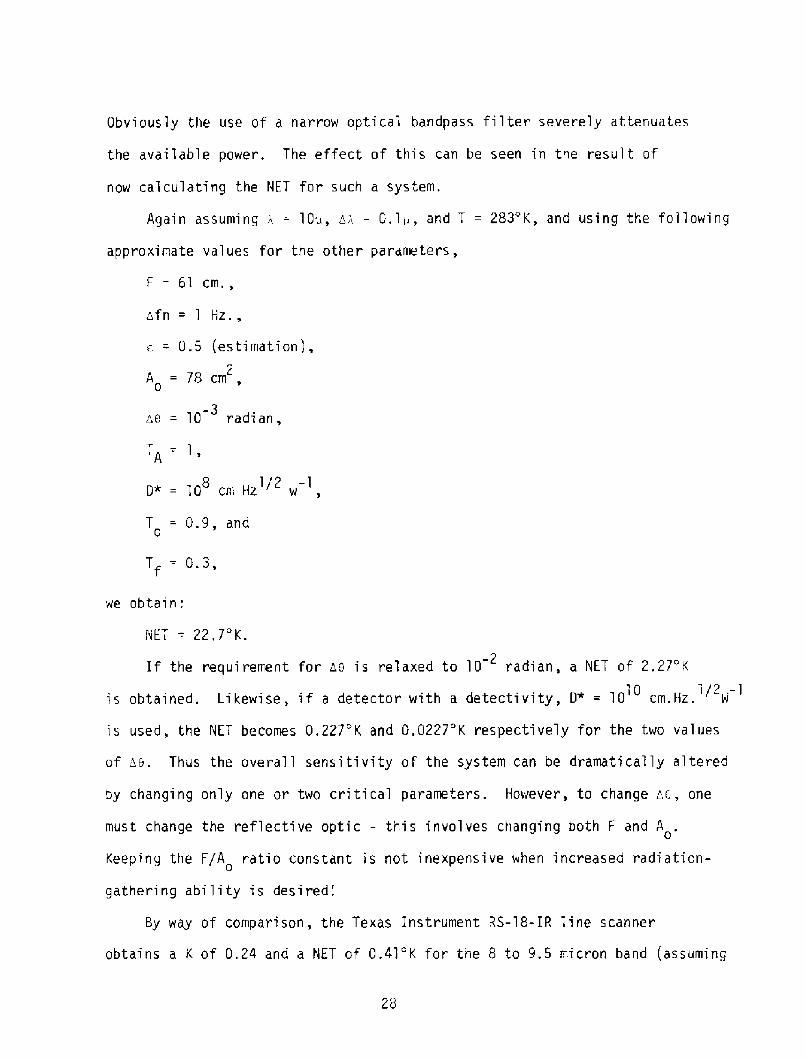
Obviously the use of a narrow optical bandpass filter severely attenuates
the available power. The effect of this can be seen in the result of
now calculating the NET for such a system.
Again assuming ~ = 10', a~ = 0.1,, and T = 283 K, and using the following
approximate values for the other parameters,
F = 6I cm,,
afn = l Hz.,
c = 0.5 estimation!,
A = 78 cm2
-3ae = 10 radi an,
10 cm Hz w
0.9, andT0
Tf = 0.3,
we obtain:
NET = 22.7'K.
is used, the NET becomes 0.227'K and 0.0227'K respectively for the two values
of a9. Thus the overall sensitivity of the system can be dramatically altered
by changing only one or two critical parameters. However, to change a6, one
must change the reflective optic - this involves changing both F and A .
Keeping the F/A ratio constant is not inexpensive when increased radiation-0
gathering ability is desired,'
By way of comparison, the Texas Instrument RS-18-IR line scanner
obtains a K of 0.24 and a NET of 0.41'K for the 8 to 9.5 micron band assuming
If the requirement for ae is relaxed to 10 radian, a NET of 2,27'K
is obtained. Likewise, if a detector with a detectivity, D* = 10 cm.Hz. W10 I/2 .-1
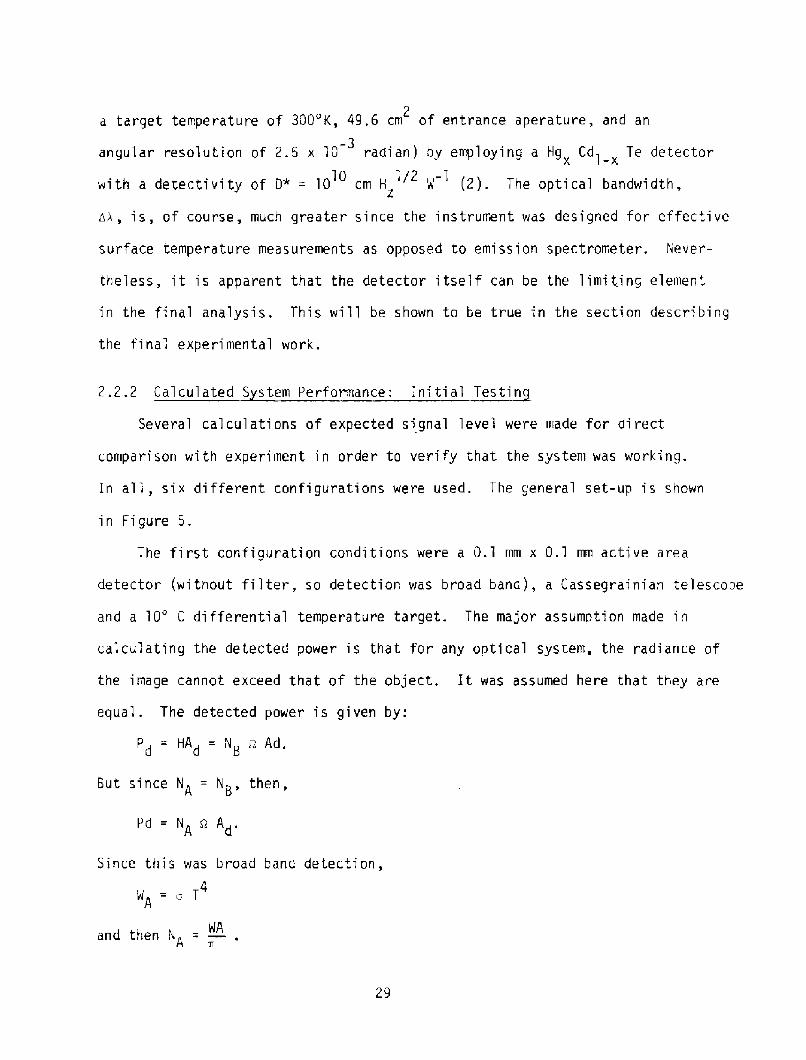
a target temperature of 300'K, 49.6 cm of entrance aperature, and an2
angular resolution of 2.5 x l0 radian! by employing a Hg Cd> Te detector-3
with a detectivity of 0* = 10 cm H hl �!. The optical bandwidth,]0 1/2 -1Z
s~, is, of course, much greater since the instrument was designed for effective
surface temperature measurements as opposed to emission spectrometer. Never-
theless, it is apparent that the detector itself can be the limiting element
in the final analysis. This wi Il be shown to be true in the section describing
the final experimental work.
2.2.2 Calculated S stem Performance: Initial Testin
Several calculations of expected signal level were made for direct
comparison with experiment in order to verify that the system was working.
In all, six different configurations were used. The general set-up is shown
in Figure 5.
The first configuration conditions were a 0.1 mm x 0.1 mm active area
detector without filter, so detection was broad band!, a Cassegrainian telescope
and a IO' C differential temperature target. The major assumption made in
calculating the detected power is that for any optical system, the radiance of
the image cannot exceed that of the object. It was assumed here that they are
equal. The detected power is given by:
Pd = HAd = N~ ~ Ad.
But since NA = N>, then,
Pd=N aA.
Since this was broad band detection,
4WA=c T
and then NWA
A
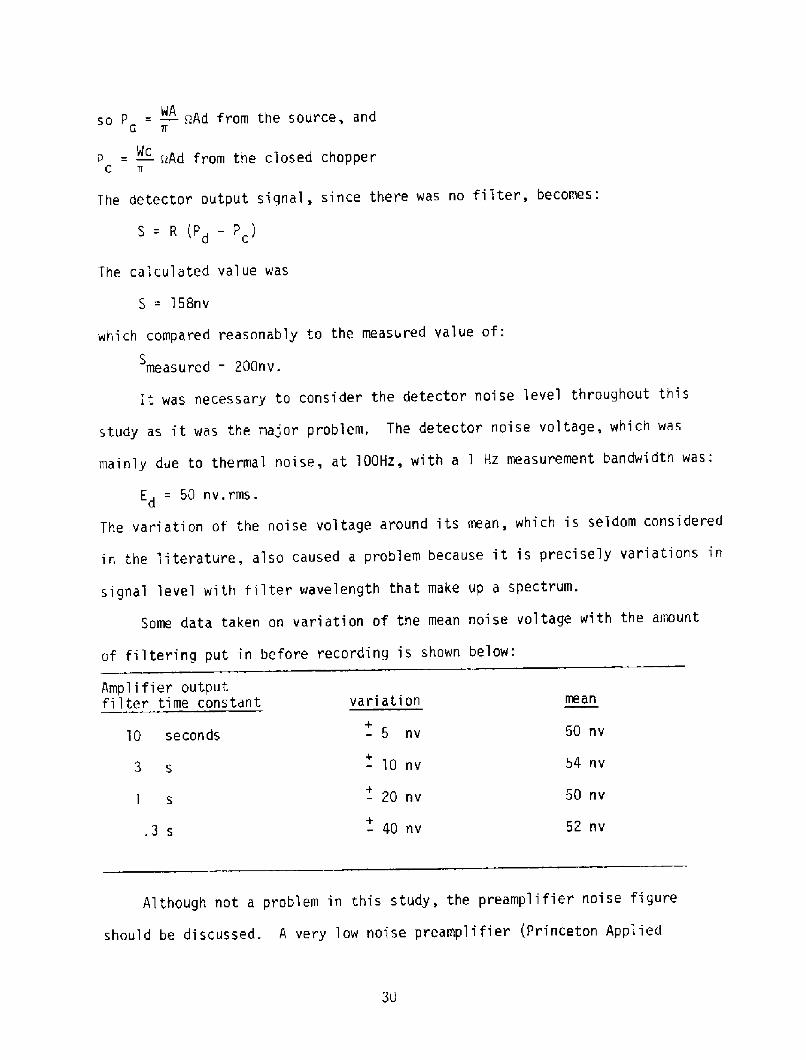
so Pd = � QAd from the source, andWA
P = � <!Ad from the closed chopperWc
c
The detector output signal, since there was no filter, becomes:
S=R Pd-P!
The calculated value was
S = 158nv
which compared reasonably to the measured value of:
S measured = 200nv.
It was necessary to consider the detector noise level throughout this
study as it was the major problem, The detector noise voltage, which was
mainly due to thermal noise, at 100kz, with a 1 kz measurement bandwidth was:
Ed = 50 nv.rms.
Amplifier outputf~lter time constant variation
+-5 nv
� 10 nv
+� 20 nv
+- 40nv
10 seconds 50 nv
3 s 54 nv
50 nv1 s
.3 s 52 nv
Although not a problem in this study, the preamplifier noise figure
should be discussed. A very low noise preamplifier Princeton Applied
The variation of the noi se voltage around its mean, which i s seldom considered
in the literature, also caused a problem because it is precisely variations in
signal level with filter wavelength that make up a spectrum.
Some data taken on variation of the mean noise voltage with the amount
of filtering put in before recording is shown below:
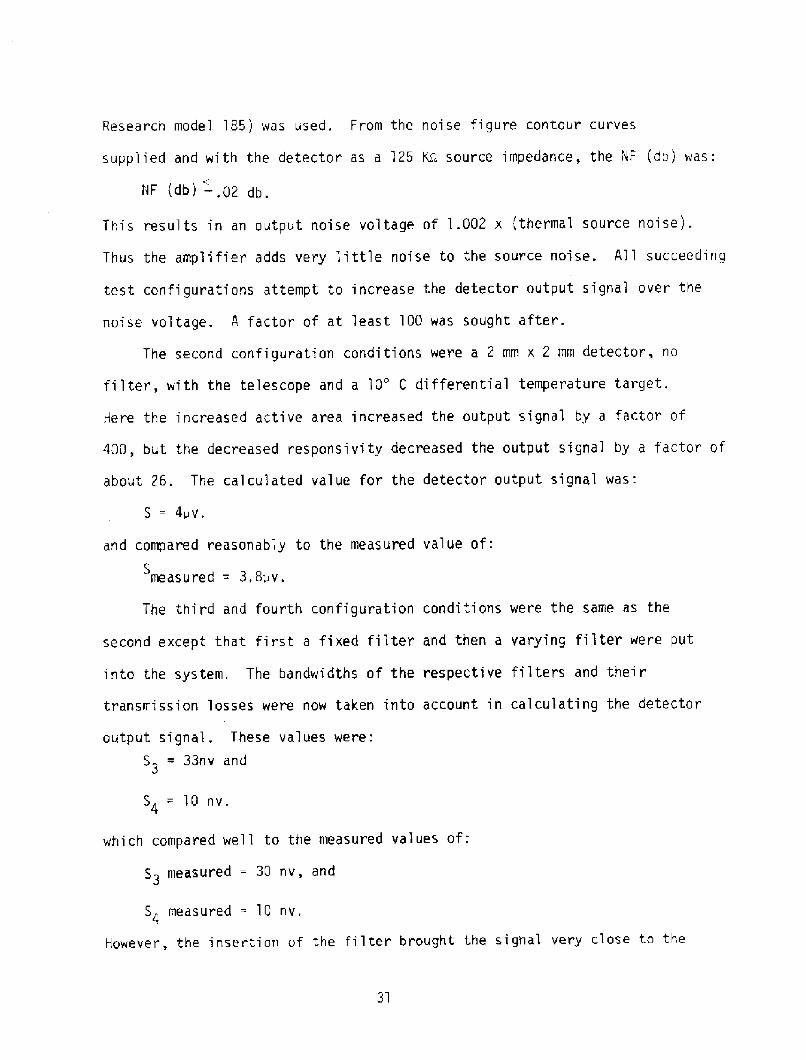
Research model 1B5! was used. From the noise figure contour curves
supplied and with the detector as a 125 Koi source impedance, the NF db! was:
HF db! �,02 db.
This results in an output noise voltage of 1.002 x thermal source noise!.
Thus the amplifier adds very little noise to the source noise. All succeeding
test configurations attempt to increase the detector output signal over the
noise voltage. A factor of at least 100 was sought after.
The second configuration conditions were a 2 mm x 2 mm detector, no
filter, with the telescope and a 10' C differential temperature target.
Here the increased active area increased the output signal by a factor of
400, but the decreased responsivity decreased the output signal by a factor of
about 26. The calculated value for the detector output signal was:
S = 4uv.
and compared reasonably to the measured value of:
Smeasured = 3,8~v.
The third and fourth confi gurati on conditions were the same as the
second except that fi rst a fi xed filter and then a varying filter were put
into the system. The bandwidths of the respective filters and their
transmission losses were now taken into account in calculating the detector
output signaI. These values were:
S = 33nv and3
S< = 10 nv.
which compared well to the measured values of:
S3 measured = 30 nv, and
S< measured = 10 nv,
However, the insertion of the filter brought the signal very close to the
31
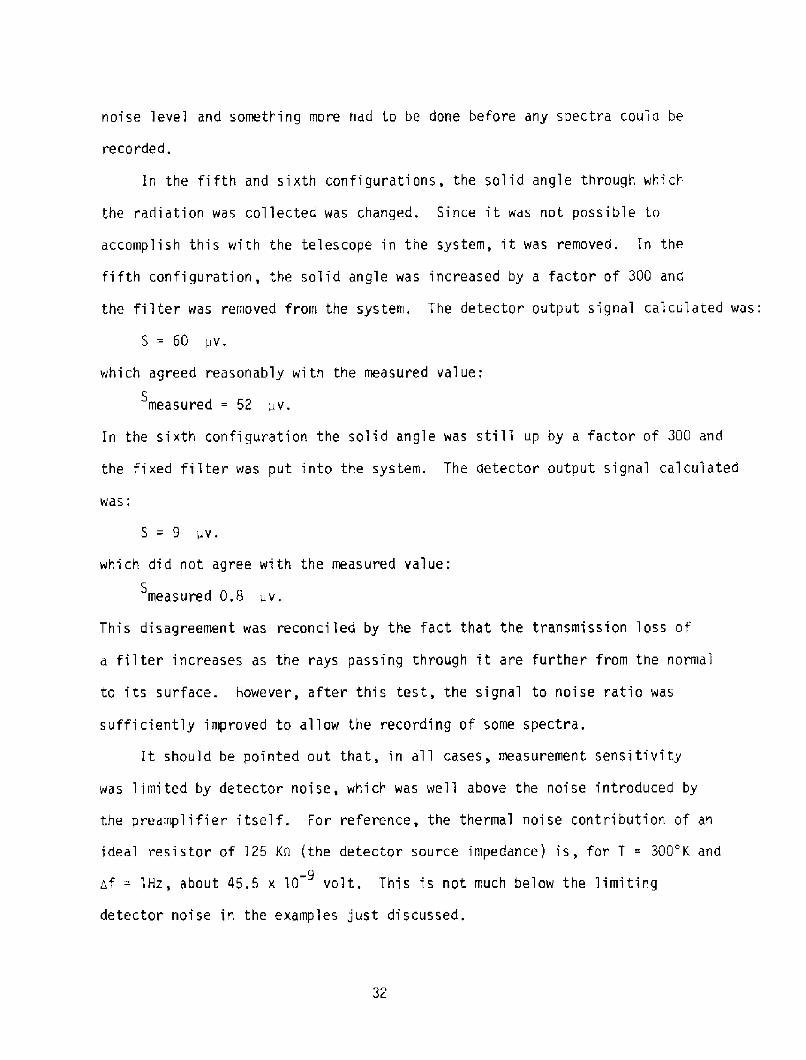
noise level and something more had to be done before any spectra could be
recorded.
In the fifth and sixth configurations, the solid angle through which
the radiation was collected was changed. Since it was not possible to
accomplish this with the telescope in the system, it was removed. !n the
fifth configuration, the solid angle was increased by a factor of 300 and
the filter was removed from the system. The detector output signal calculated was:
S = 60 pv.
which agreed reasonably wi th the measured value:
Smeasured = 52 I v.
In the si xth confi gurati on the soli d angle was sti lI up by a factor of 300 and
the fi xed fiIter was put into the system. The detector output signal calculated
was:
S = 9 vv.
which did not agree with the measured value;
Smeasured 0.8 uv.
This disagreement was reconci led by the fact that the transmission loss of
a filter increases as the rays passing through it are further from the normal
to its surface. However, after this test, the signal to noise ratio was
sufficiently i mproved to allow the recording of some spectra.
It should be pointed out that, in all cases, measurement sensitivity
was limited by detector noise, whi ch was well above the noise introduced by
the preamplifier itself. For reference, the thermal noise contribution of an
ideal resistor of 125 K~a the detector source impedance! is, for T = 300'K and
zf = 1Hz, about 45.5 x 10 volt. This is not much below the limiting
detector noise in the examples just discussed.
32
3. 0 Ex e ri men ta I Res ul ts
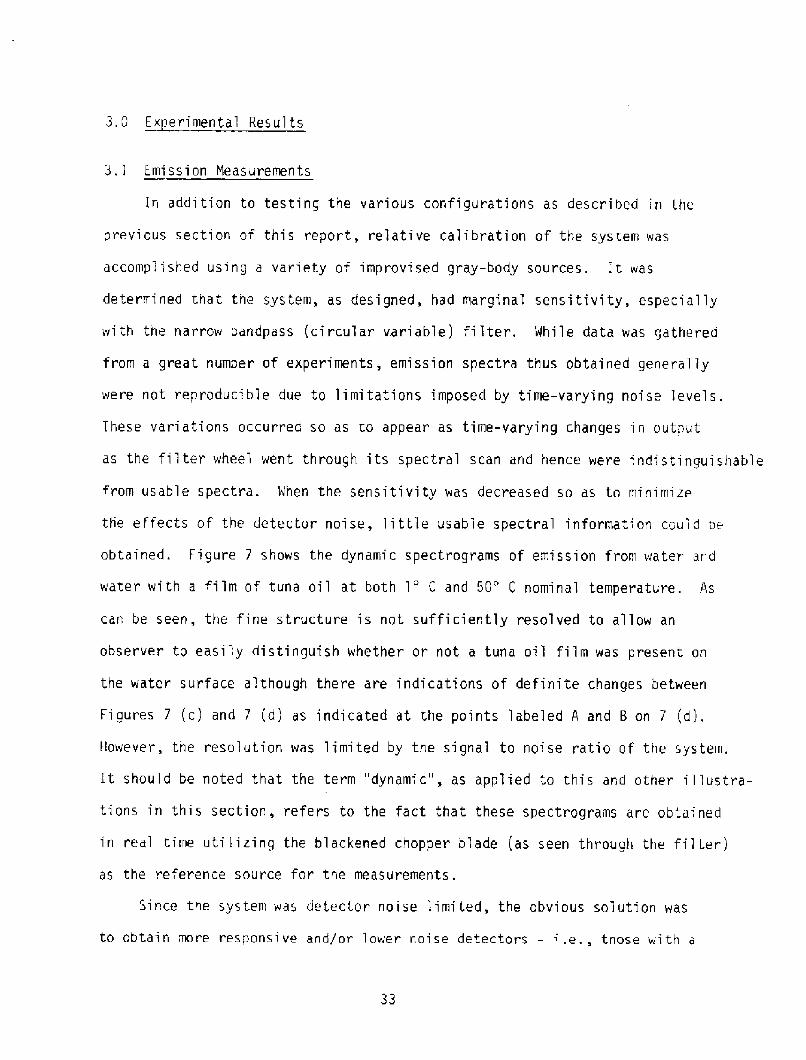
3. 1 Emi ss i on Neas uremen ts
In addition to testing the various configurations as described in the
previous section of this report, relative calibration of the system was
accomplished using a variety of improvised gray-body sources. It was
determined that the system, as designed, had marginal sensitivity, especially
with tne narrow bandpass circular variable! filter. Whi'le data was gathered
from a great number of experiments, emission spectra thus obtained general Iy
were not reproducible due to limitations imposed by time-varying noise levels.
These variations occurred so as to appear as time-varying changes in output
as the filter wheeI went through its spectral scan and hence were indistinguishable
from usable spectra. When the sensitivity was decreased so as to minimize
the effects of the detector noise, little usable spectral information coulid oe.
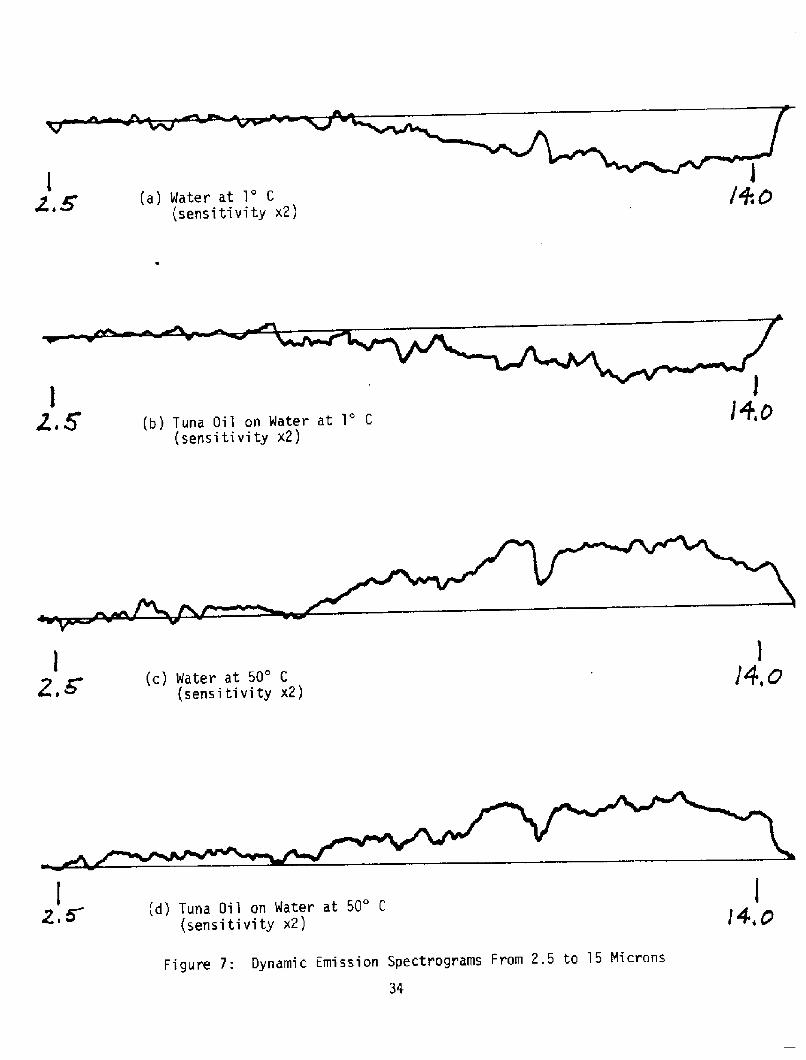
obtained. Figure 7 shows the dynamic spectrograms of emission from water arid
water with a film of tuna oil at both 1' C and 50' C nominal temperature. As
can be seen, the fine structure is not sufficiently resolved to allow an
observer to easily distinguish whether or not a tuna oil fi lm was present on
the water surface although there are indications of definite changes between
Figures 7 c! and 7 d! as indicated at the points labeled A and 8 on 7 d!.
However, the resolution was limited by the signaI to no~se ratio of the system,
It should be noted that the term "dynamic", as applied to this and other illustra-
tions in this section, refers to the fact that these spectrograms are obtained
in real time uti 1izing the blackened chopper blade as seen through the filter!
as the reference source for the measurements.
Since the system was detector noise 'Ii mi ted, the obvi ous solution was
to obtain more responsive and/or lower noise detectors � i .e., those with a
33
higher detectivity, 0*, as previously discussed. However, at this point
in the time scale of the project, it was felt that the rather substantial
additional costs involved in this option were not realizable in terms of
available funding for new equipment. Therefore, it was decided to utilize
other techniques in order to at least provide a better understanding of the
feasibility of utilizing this remote sensing technique.
3. 2 Ref'1 ecti on Measurements
Mattson et al �1! investigated the use of an infrared spectroradiometer
for use in the remote sensing of oil slicks. It was conceptually similar to
that designed for this project except that a chopped infrared silicon carbide
globar! source was employed and the reflectance spectra was then measured.
A Bendix spectroradiometer employing a liquid helium cooled mercury-doped
germanium detector was used and the entire system was controlled by a minicomputor.
The wavelength region from 8.5 to 12.5 microns was scanned. Using styrene and
deic acid films on water with averaging of a number of spectra, peaks of the
absorption spectra could be recognized, especially for thicker �00 ~! films.
! t was decided to utilize our emission spectrometer as a reflectance spectro-
radiometer to extend the work just described.
An infrared heating lamp was used, unfocused, to prov~de general il lumination
of the water tank. The angle of both the i11uminator and the telescope assembly
were variable and adjusted for optimum response, Initial experiments utiIized
heavy aluminum foil stretched on a flat surface as a reflective substrate.
The reflection spectra of the foi'! alone was used as a reference base for
point-by-point difference measurements with reflective spectra from the
aluminum reflector when it was covered with a thin film of oil. 4lhi le the
infrared lamp is by no means as efficient in producing radiation in the 8 to 12
micron region as the silicon carbide source, it was readi iy available and more
representative of natural infrared illumination.
Figure 8 shows the results af such a measurement. The data, point-by-
point, from the reference spectrum of 8 b! is subtracted from that of 8 c!
with the results shown in 8 a!. Definite structure can be seen in the near
infrared wavelength region while litt1e detail can be seen beyond 7.2 m~cron.
This may be due to the lack of radiation from the source; unfortunately the
only 1ong wavelength source on hand burned out before additional data could
be taken toward the end of the project.
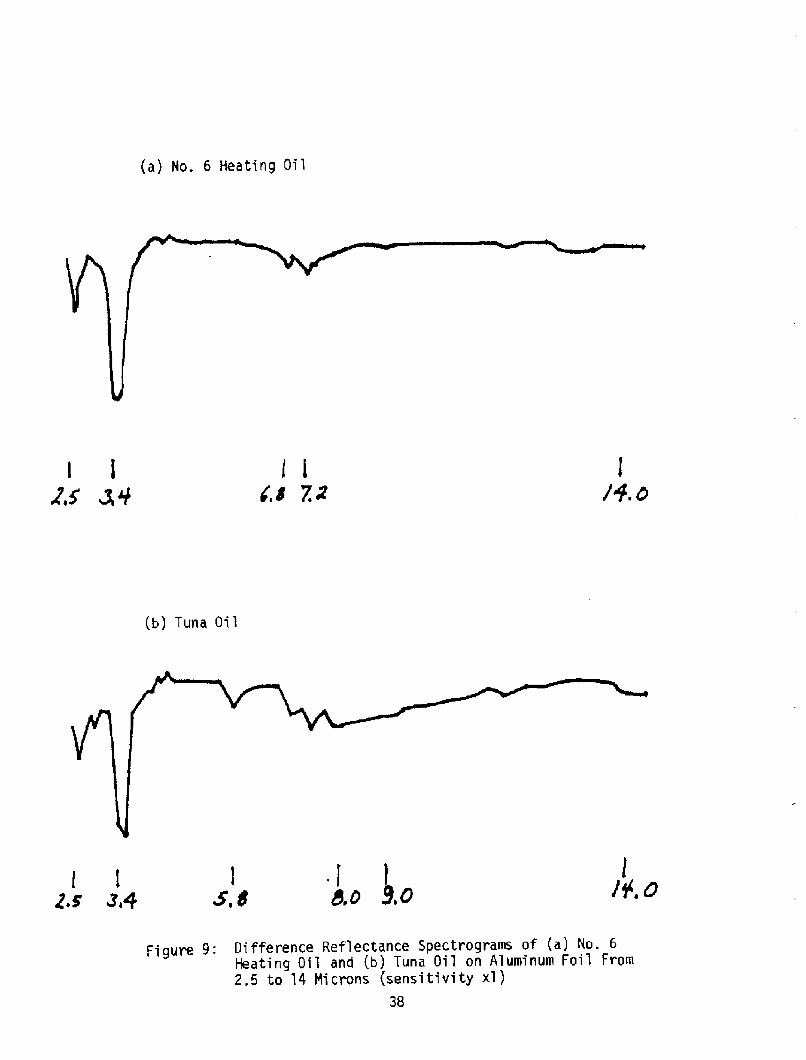
The same difference technioue was employed for No. 6 heating oil and tuna
oil. The results are shown on Figure 9. !t can be readi]y seen that there are
dist~net differences in the spectrograms for the various types of oils, Whi1e
it was di f fi cul t to control s uch parameters such as film thi ckness and uni formi ty,
these resu1ts did provide some encouragement. Again, most differences occurred
in the 2.5 - 8.0 micron region though the tuna oil spectrum exhibited some
addi ti onal structure at longer wavelengths.
A final series of experiments were conducted using water as the base.
order to increase measurement sensitivity, the base reference for calculations
not measurements! was the shiny surface of aluminum foil, floating on the
water surface after being appropriately flattened. However, this was somewhat
unnecessary as the spectra of Figure lD show b and c!. The sensitivity for
10 b! and 10 c! has been increased, by necessity, by an order of magnitude,
The reason for this requirement is quite simple: the reflection coefficient for
a polished aluminum surface is 0.83 while for calm seawater it is only 0.03. This
gives a ratio of 28: any radiation reflected from seawater is 1/28 of thatth
reflected from the aluminum. L~hi1e the values for the coefficients assume
radiation normal to the surface, the examp1e indicates the general attenuation
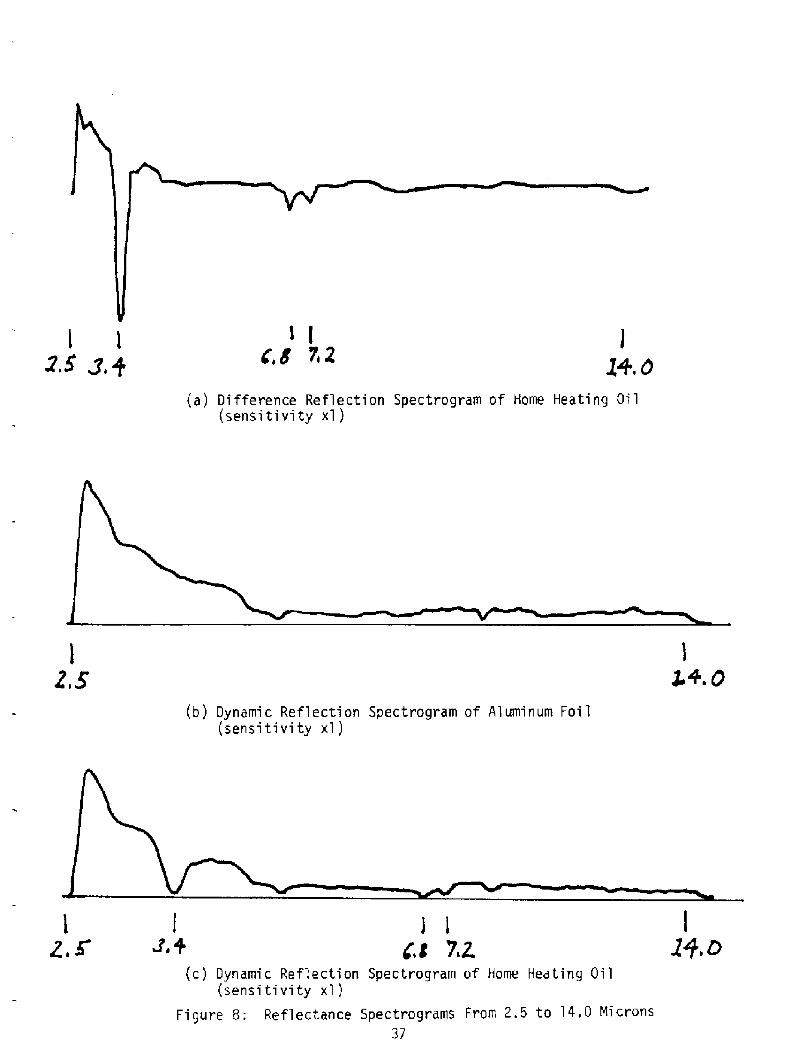
a! Difference Reflection Spectrogram of Home Heating Oil sensitivity xl !
�! Dynamic Reflection Spectrogram of Aluminum Foil sensi ti vi ty xl !
c! Dynamic Reflection Spectrogram of Home Heating Oil sensitivity xl!
Figure 8: Reflectance Spectrograms From 2.5 to 14,0 Microns37

a! Aluminum Foil on Water sensi ti vi ty xl !
b! No Film, Water Only sens i ti vi ty xl 0!
c } Home Hea ting Oi l on Water sens i ti vi ty xl 0}
Figure l0: Dynamic Reflection Spectra of Films on Water, RoomAmbient Temperature, From 2. 5 to l 4 Mi crons
39
of the reflected radiation when comparing Figure 10 a! with Figure 10 b!.
When the sensitivity was increased by a factor of 10 to partially compensate
for the loss of signal, noise problems were again encountered. The spectra
observed in Figures 10 b! and 10 c! were not consistent during subsequent
scans due to the fluctuations of the noise. Even though a narrow bandpass was
used prior to synchronous detection and averaging, the low frequency envelope
of the noise at 100 Hz proved again to be the limiting factor. Thus, additional
detector sensiti vi ty was agai n required to pursue the investi gation.
It should also be mentioned that various reflective shields and field-
of-view defining aperatures were utilized during the experiments to minimize the
effects of background radiation. While they proved helpful in several instances,
they did not address the major problem just discussed.
3.3 Modified 0etector Re ui rements
The detectors used for the experi ment work were Barnes Thermistor Bolometers
fabricated from Type 2 material with a resistance of 2.5 x 10 ohms per chip5
and a time constant of about 2.5 milliseconds. The detector chips initially
used see section 2.2.2! had dimensions of 0.1 mm x 0.1 mn with a responsivity,
R, of 750 volts/watt. However, during the trial and calibration experiments,
it was apparent that the telescope beam diameter was not completely utilized so
that, for a number of measurements, the larger chip size, 2.0 mm x 2.0 mm was
utilized. In addition to utilizing all of the telescope beam, it also
effectively increased the field-of-view for the system and provided a larger
optical bandwidth unless additional beam-narrowing aperatures were placed in front
of the detector window and/or circular variable filter. These effects more than
offset its reduced responsivity of 40 volts/watt and a slight increase in overall
sensitivity was obtained when looking at large area sources of radiation.
It is apparent that in order to reproduce the reflection measurements of
Figure 8 using the oil films on water, at least an order of magnitude of
improvement of detector signal to noise ratio is required. Nhen examining the
emission data, it is also obvious that a minimum of several orders of magnitude
of increase overall system sensitivity are required. Since the detectivity of
the bolometers was nomina'lly 0* = 10 cm Hz watt, the minimum requirement8 2 1/2
for this system would thus be a detector with a detectivity of l3* = 10 to 1010 11
cm Hz watt, Some additional sensitivity a factor of 4! may be obtained,2 1/2 -1
depending on the optical configuration, with a detector immersed in a germanium
lens. Additionally, the opti ca'l system could be redesigned to allow increased
efficiency and Jagger solid angle for the field-of-view. Since the power detected
by the bolometer, Pd, is given by
Pd=AQNA
where A is the active area, ha is the solid angle of view, and N A is theeA
effective source radiance I.N x filter factor! x transmission and optics losses! j,
it can be seen that v < is directly proportional to the field- fo-v iwewhen
a telescope is used and 0 is directly proportional to the aperature. Hence,
redesigning the system to increase these two parameters would provide increased
signal power to the detector.
4.0 Summar and Conclusions
As may be seen from the preceeding discussion, there are defini te
indications that spectral radiometry can produce oil sli ck signature information
if the system sensitivity is suffi cient to resolve the information . Since thi s
investigation was ultimately limited by detector signal to noise ratio, the
reader may legitimately note that the logical next step is to obtain more
41

sensitive detectors, redesign the optical system and repeat the experiment.
However, the question has been raised as to whether further pursuit of this
approach i s indeed worthwhile, parti cul arl y from the Sea Grant point of vi ew.
This question is particularly timely since the Coast Guard system has been
undergoing testing and refinement during the course of this investigation with
a substantial amount of technical effort and financial support. Several points
are worth mentioning with respect to this situation. First, the Coast Guard
program has produced a viable means of detecting and locating ocean surface
slicks. This has been especiatly true since side looking radar was added to the
sensor package; initially it was felt that this would not be feasible from a
cost, space, and weight standpoint �!. Secondly, miltifrequency passive
microwave radiometry has been successfully demonstrated to be able to measure
oi 1 slick thi cknesses down to 0.05 mm by Hol linger and his co-workers �2!,
Thirdly, the identification of a particular kind of slick still depends on
subjective and deductive reasoning after examining the inputs from the series
of sensors in the Coast Guard Aircraft mentioned earlier �!. Thus, there still
exists the need for quantative techniques for classifying types of slicks,
especially those caused by different types of petroleum and petroleum products.
The Department of Transportation - Coast Guard sponsored an investigation
of an active laser - excited! system employing oil florescence spectrometry
as an identifi cation and classifying technique l3!. Additionally, NASA has
sponsored some more recent work i n thi s area to allow for broad classification
of oil types wi th an airborne laser system �4!. Signal to noise ratio is the
major problem to be overcome here also.
Infrared spectroscopy is also currently being utiIized in two different
modes in an attempt to monitor oil films and to fingerprint them though not
from aircraft! by two teams of investigators. Absorption spectra from "grab

samples" are being utilized by University of Rhode Island chemists to attempt
to fingerprint oil spills. Closer to the subject of this report is a report
on an Infrared Oil Film Monitor �6! designed to be mounted on the bow of a
boat, about 6 feet above the water surface, This distance was small enough to
eliminate many of the atmospheric effects in the 2 to 4 micron wavelength region
and hence posed reduced requirements on the sensor system when compared to an
airborne system. The point is that a number of workers are still attempting
to address the oil classification problem utilizing optical techniques. Therefore,
the subject is still timely and further efforts in this area are warranted.
While general surveys �7! of applicable remote sensing techniques have
cited other spectrographic methods such as correlation spectroscopy, probably
the newest technique is Fourier transform spectroscopy which allows interferometric
spectrograms to generate with the advantages of increased sensitivity and decreased
sampl ing time. Such instruments are computer control led and, at the present
state of the art, limited to laboratory use. It is the opinion of these writers
that the application of advanced techniques such as this to the oil slick classifica-
tion prob'lem would advance the state of the art, both in the application, and
in the impetus for developing instrumentation more suitable for field usage.
43
5.O References
5.1 Literature Cited
G. C. Gerhard, "A Study of the Cost Effectiveness of Remote SensingSystems for Ocean Slick Detect~on and Classification", UNH Sea GrantReport No . UNHSG-'l01, University of New Hampshire, April, 1972.
"Development of a Prototype Airborne Oil Surveillance System:Volume I, System Definition Studies", Department of Transportation,U, S. Coast Guard, Report No. CG-D-45-74, June, 1973.
2.
"Development of a Prototype Airborne Oil Surveillance System:Volume II, Design Report", Department of Transportation, U. S. CoastGuard, Report No, CG-D-46-74, June, 1973.
"Development of a Prototype Airborne Oil Surveillance System:Volume III, Subsystem Specifications", Department of Transportation,U. S. Coast Guard, Report No. CG-D-47-74, June, 1973.
5.
P. G. White, "Remote Sensing of Ocean Color", Proceedin s of Inst.Soc. of America, October, l969.
C. T. Wezernak and F. C. Polcyn, "Technological Assessment of RemoteSensing Systems for Water Pollution Control ", Annual Re ort, Contract1602OFOY, University of Michigan, Ann Arbor, 3 pri
L. Beaudette, J. Rokl an, D. Finkey and D. Ross,695 Project, University of New Hampshire, Durham
R, Horvath, W. L. Morgan, and S. R, Stewart, "Optical Remote Sensingof Oil Slicks: Signature Analysis and Evaluation," Final Re ort,U. S. Coast Guard Project No. 724104.2/1, Willow Run aboratories,University of Michigan, October, 1971.
P. W. Kruse, L. D. McGlauchlin, and R. 8, Mcguistan, "Elements ofInfrared Technology: Generation, Transmission and Detection",John Wiley and Sons, New York, 1962,
10.
J, S. Mattson, H. B. Mark, Jr., A. Prostak, and C. E. Schutt,"Potential Application of an Infrared Spectroradiometer for RemoteDetection and Identification of Oil Slicks on Water", EnvironmentalScience and Technolo , 5, May, 1971, pp. 415-420.
"Oil Spill Thickness Measured from Aircraft", Washin ton Letter of0 ~V1.7,II. 1.0
R. A. Holmes and R. 8. MacDonald, "The Physical Basis of System Designfor Remote Sensing in Agriculture", Proc. I,E.E.E,, 57, April 1969,pp. 629-639.
13, J. F. Fantasia, T. M. Hard, and H. C. Ingrao, "An Investigation ofOil Florescence as a Technique for the Remote Sensing of Oil Spills",Report No. DOT-TSC-USCG-71-7, June 1971, Final Report, TransportationSystems Center, Cambridge, Massachusetts.
14. G. K. Schwemmer and H. H. Kim, "Mapping and Identification of Oilon Water by the Use of an Airborne Laser System", Marine PollutionMonitoring Symposium and Workshop, Washington, D. C., May, 1974.
15. C. W. Brown, M. Ahmadjian, and P. Lynch, "Sampling of Oil Spills andFingerprinting by Infrared Spectroscopy", Marine Pollution MonitoringSymposium and Workshop, Washington, D. C., May, 1974.
16. D. E. Wright and J. A. Wright, "A New Infrared Instrument for MonitoringOil Films on Water", Marine Pollution Monitoring Symposium and Workshop,Washington, D. C., May, 1974.
17. C. E. Catoe, "The Applicability of Remote Sensing Techniques for OilSlick Detection", Paper OTC 1606, Offshore Technology Conference,May, 1972.
5.2 General References
Smith, W. J ., "Modern Optical Engineering", McGraw Hill Inc., 1966.
Sverdrup, H. U., Johnson, M. W., Fleming, R, H., "The Oceans, TheirPhysics, Chemistry, and General Biology", Prentice Hall, Inc., 1942.Hudson, R. D., "Infrared Techniques", Clarendon Press, Oxford, 1973.
Drummond, A. J., "Advances in Geophysics - Precision Radiometry",Academic Press, 1970,
45