Embed Size (px)
Citation preview

Empirical Software Engineering, 5, 357–390, 2000.c© 2001 Kluwer Academic Publishers, Boston. Manufactured in The Netherlands.
An Instrument for Measuring the Key Factors ofSuccess in Software Process Improvement
TORE DYBÅ* [email protected] Telecom and Informatics
Abstract. Understanding how to implement SPI successfully is arguably the most challenging issue facing theSPI field today. The SPI literature contains many case studies of successful companies and descriptions of theirSPI programs. However, there has been no systematic attempt to synthesize and organize the prescriptions of-fered. The research efforts to date are limited and inconclusive and without adequate theoretical and psychometricjustification.
This paper provides a synthesis of prescriptions for successful quality management and process improvementfound from an extensive review of the quality management, organizational learning, and software process improve-ment literature. The literature review was confirmed by empirical studies among both researchers and practitioners.The main result is an instrument for measuring the key factors of success in SPI based on data collected from 120software organizations. The measures were found to have satisfactory psychometric properties. Hence, managerscan use the instrument to guide SPI activities in their respective organizations and researchers can use it to buildmodels to relate the facilitating factors to both learning processes and SPI outcomes.
Keywords: Software process improvement, success factors, measurement instrument.
Introduction
During the last decade, the software industry has been more and more concerned aboutsoftware process improvement (SPI). Consequently, we have witnessed a proliferation ofmodels and initiatives all claiming to increase the likelihood of succeeding with SPI ini-tiatives. The SPI literature is full of case studies and anecdotal evidence of successfulcompanies and descriptions of their SPI programs. Several authors repeatedly discuss theimportance of certain critical success factors. However, there has been no systematic at-tempt to synthesize and organize the prescriptions offered. The research efforts to date arelimited and inconclusive and without adequate theoretical and psychometric justification.Even for commonly recognized factors such as management commitment and employeeparticipation, no operational measures are available.
Despite an increasing focus on the nature and value of empirical software engineering (e.g.Basili et al., 1986; Basili and Selby, 1991; Basili, 1996; Harrisonet al., 1999; Jeffery andVotta, 1999), poor theory development and inadequate measurement of constructs seems tobe the norm for most studies regarding the key factors of success in SPI. The data collectiondevice (in this study a questionnaire) used for measurement is commonly referred to as aninstrument(Davis, 1996). However, instrument validation and reliability issues have beeninadequately addressed in software engineering research, with only a handful of researchers
* SINTEF is The Foundation for Scientific and Industrial Research at the Norwegian Institute of Technology.Mail address: N-7465 Trondheim, Norway. Tel +47 73 59 29 47, Fax +47 73 59 29 77

358 DYBÅ
(e.g. El Emam and Madhavji, 1995, 1996; Goldensonet al., 1999; Fusaroet al., 1998; ElEmam, 1998; El Emam and Birk, 2000) devoting serious attention to these issues.
Measurement instruments in both research and practice are expected to be valid andreliable (Straub, 1989; Anastasi and Urbina, 1997). The basic point is that users of agiven instrument should obtain similar results. Thus, psychologists and psychometrictheorists have developed rigorous methods for constructing reliable and valid instrumentsto measure variables in the social sciences (e.g. Cronbach, 1951; Likert, 1967; Nunnally,1978; Nunnally and Bernstein, 1994; Anastasi and Urbina, 1997).
Hence, for the present research we defineinstrument constructionas:
the process of developing the data collection device in order to define and obtainrelevant data for a given research question.
There are many reasons why researchers in SPI should pay closer attention to instrumenta-tion. First, concerns about instrumentation are closely connected with concerns about rigorin empirical research methods for SPI. Second, greater attention to instrumentation permitsconfirmatory, follow-up research to use a tested instrument, hence, promoting cooperativeresearch efforts (Hunter and Schmidt, 1990). Third, closer attention to instrumentationbrings greater clarity to the formulation and interpretation of research questions (Straub,1989). Finally, lack of validated measures in confirmatory research raises serious questionsabout the trustworthiness of the findings of the study.
In SPI research, as in social research and business research, we attempt to understand real-world phenomena through expressed relationships between research constructs (Blalock,1969). However, these constructs are neither directly measurable nor observable, but arebelieved to be latent in the phenomenon under investigation. In SPI, for example, ca-sual constructs like “organizational maturity” is thought to influence outcome constructslike “organizational performance.” Neither of these constructs is directly observable, butrelevant measures can be operationalized to serve as surrogates for these constructs.
Measurement of research constructs is neither simple nor straightforward. However,instrumentation techniques are available that allow us to construct research instrumentsthat constitutes acceptable levels of reliability and validity. The process of developing theresearch instrument for this study was based on generally accepted psychometric principlesof instrument design, and was carried out according to the nine steps shown in Figure 1.
The sections in this paper are arranged according to these steps. Section 1 presents theliterature review. Section 2 presents the process of identifying the key factors of SPI success.The identification of items for each factor is described in section 3, and the constructionof measurement scales is presented in section 4. In section 5, we present a pilot test ofthe measurement scales and the overall instrument before data was collected (section 6).Finally, sections 7, 8, and 9 are concerned with the reliability of the measurement scales,detailed item analysis, and validity of the measurement scales, respectively.
1. Literature Review
Software process improvement has its roots in quality management and it is closely relatedto “second generation” (French and Bell, 1999) organizational development approaches,

AN INSTRUMENT FOR MEASURING THE KEY FACTORS OF SUCCESS IN SPI 359
Figure 1. Instrument development process (adapted from Saraphet al., 1989).
specifically to organizational learning. Hence, this section reports from an extensive reviewof the quality management, organizational learning and software process improvementliterature regarding key factors for success. Nearly 200 prescriptions for success werederived from the literature.

360 DYBÅ
Table 1.Perspectives on TQM.
Deming’s 14 principles1 The Juran Trilogy2 Crosby’s 14 quality steps3
1. Constancy of purpose I. Quality Planning 1. Management commitment2. Adopt the new philosophy Establish quality goals 2. Quality improvement teams3. Cease dependence on Identify customers and 3. Quality measurement
inspection their needs 4. Cost of quality evaluation4. Don’t award business Develop products 5. Quality awareness
on price and processes 6. Corrective action5. Constant improvement II. Quality Control 7. Zero-defects committee6. Institute training on the job Evaluate performance 8. Supervisor training7. Institute leadership Compare to goals and acts 9. Zero-defects day8. Drive out fear III. Quality Improvement 10. Goal-setting9. Break down barriers Establish infrastructure 11. Error cause removal10. Eliminate slogans Identify improvement 12. Recognition11. Eliminate work standards projects and teams 13. Quality councils12. Pride of workmanship Provide resources 14. Do it over again13. Education and retraining and training15. Take action Establish controls
Sources:1Deming (1986),2Juran (1992),3Crosby (1979).
1.1. Critical Factors of Quality Management
Understanding the “quality revolution” is an important prerequisite for understanding soft-ware process improvement. However, quality management is often obscured by both con-fusion and misunderstanding. This potential for misunderstanding is partly related to quasi-religious and sectarian controversies, and partly related to the most important feature ofmodern quality management: it directs attention to the improvement of production pro-cesses, and not simply to the characteristics of the product (Winter, 1994). In this respect,modern quality management opposes the original quality control principles of assuring thatthe characteristics of the end product fall within preassigned tolerance limits.
The current state-of-the-art in quality management has more than anything else beenshaped by quality gurus such as William Edwards Deming (1982, 1986), Joseph M. Juran(1992, 1999), Philip Crosby (1979, 1984, 1996), and their quality frameworks. Table 1summarizes Deming’s 14 principles, the Juran trilogy, and Crosby’s 14 quality steps. Theseand other authors (e.g. Ahireet al., 1996; Black and Porter, 1996; Feigenbaum, 1991;Garvin 1983, 1984; Ishikawa, 1986, 1990; Powell, 1995; Saraphet al., 1989; Taguchi,1986; Taguchiet al., 1989; Yusof and Aspinwall, 1999) repeatedly discuss the importanceof critical factors such as leadership involvement, employee participation, measurement,and process management to improve the quality performance in organizations.
The recent revision of the ISO 9000 family of standards distances itself from the term“quality assurance,” encouraging the adoption of a process approach to “quality manage-ment.” In this revision, eight quality management principles (see Table 2) to facilitatethe achievement of quality objectives are identified (ISO/DIS 9000, 2000). Furthermore,each of the major clauses in ISO 9004, Quality Management Systems—Guidelines forPerformance Improvements, is based on these principles (ISO/DIS 9004, 2000).

AN INSTRUMENT FOR MEASURING THE KEY FACTORS OF SUCCESS IN SPI 361
Table 2.ISO 9000 quality management principles (ISO/DIS 9000, 2000).
ISO 9000 Quality Management Principles
a) Customer focus:organizations depend on e) System approach to management:their customers and therefore should identifying, understanding and managingunderstand current and future customer a system of interrelated processes forneeds, should meet customer requirements a given objective contributes to theand should strive to exceed customer effectiveness and efficiency of theexpectations. organization.
b) Leadership:leaders establish unity f) Continual improvement:a permanentof purpose, direction, and the internal objective of the organization isenvironment of the organization. They continual improvement.create the environment in which peoplecan become fully involved in achieving g) Factual approach to decision making:the organization’s objectives. effective decisions are based on the
logical or intuitive analysis of datac) Involvement of people:people at all levels and information.
are the essence of an organization andtheir full involvement enables their abilities h) Mutually beneficial supplier relationships:to be used for the organization’s maximum the ability of the organization and itsbenefit. suppliers to create value is enhanced
by mutually beneficial relationships.d) Process approach:a desired result is
achieved more efficiently when relatedresources and activities are managedas a process.
No single model has yet established itself as a basis for Total Quality Management (TQM)theory. As a result, there has been a trend in organizations to use TQM frameworks basedupon the assessment criteria from key quality awards such as the Deming Prize in Japan, theMalcolm Baldridge National Quality Award in the United States and the European QualityAward. Founded in 1988, The European Foundation for Quality Management (EFQM)has developed the EFQM Excellence Model, which is the basis for the European QualityAward. The EFQM Excellence Model is based on nine criteria (see Table 3), of which fiveare “enablers” and four are “results” (EFQM, 1999).
Despite TQM’s apparent widespread dissemination, and the claims by adherents that anyfirm can imitate TQM, there are powerful reasons to believe that TQM is imperfectly im-itable (Powell, 1995). Rogers (1995) has shown that the rate of adoption is determined bythe characteristics of an innovation asperceived by the potential adopter, and not whether ithas produced any advantages for competitors. His research has shown that the diffusion ofinnovations depend on the following five factors (Rogers, 1995): (1)relative advantage—the degree to which an innovation is perceived as being better than the idea it supersedes;(2) compatibility—the degree to which an innovation is perceived as consistent with the ex-isting values, past experience, and needs of potential adopters; (3)complexity—the degreeto which an innovation is perceived as relatively difficult to understand and use; (4)trial-ability—the degree to which an innovation may be experimented with on a limited basis;and (5)observability—the degree to which the results of an innovation are visible to others.

362 DYBÅ
Table 3.EFQM Excellence Model criteria and sub-criteria (EFQM 1999).
The 1999 EFQM Excellence Model Criteria
1. Leadership 4. Partnerships and Resources1a) Leaders develop the mission, vision and 4a) External partnerships are managed.
values and are role models of a culture 4b) Finances are managed.of Excellence. 4c) Buildings, equipment and materials are
1b) Leaders are personally involved in managed.ensuring the organization’s management 4d) Technology is managed.system is developed, implemented and 4e) Information and knowledge arecontinuously improved. managed.
1c) Leaders are involved with customers,partners and representatives of society. 5.Processes
1d) Leaders motivate, support and 5a) Processes are systematically designedrecognize the organization’s people. and managed.
5b) Processes are improved, as needed,2. Policy and Strategy using innovation in order to fully satisfy
2a) Policy and strategy are based on the and generate increasing value forpresent and future needs and customers and other stakeholders.expectations of stakeholders. 5c) Products and services are designed and
2b) Policy and strategy are based on developed based on customer needsinformation from performance and expectations.measurement, research, learning and 5d) Products and services are produced,creativity related activities. delivered and serviced.
2c) Policy and strategy are developed, 5e) Customer relationships are managedreviewed and updated. and enhanced.
2d) Policy and strategy are deployedthrough a framework of key processes. 6.Customer Results
2e) Policy and strategy are communicated 6a) Perception measures.6b) Performance indicators.
3. People3a) People resources are planned, 7.People Results
managed and improved. 7a) Perception measures.3b) People’s knowledge and competencies 7b) Performance indicators.
are identified, developed and sustained.3c) People are involved and empowered. 8.Society Results3d) People and the organization have 8a) Perception measures.
a dialogue. 8b) Performance indicators.3e) People are rewarded, recognized and
cared for. 9. Key Performance Results9a) Key performance outcomes.9b) Key performance indicators.
Furthermore, diffusion of innovation models emphasize the importance ofhomophily,which Rogers (1995) defined as the degree to which the innovator and the potential adopterare similar in certain attributes such as objectives, beliefs, norms, experience, and culture.Heterophily is the opposite of homophily, and, according to Rogers (1995),“one of themost distinctive problems in the diffusion of innovations is that the participants are usuallyquite heterophilous.”(p. 19, italics in original). Hence, vital difference between innovatorsand potential adopters act as key barriers to imitation (Powell, 1995).
Schaffer and Thomson (1992) argued that most “activity centered” change programs, suchas TQM, are based on a fundamentally flawed logic that confuses ends with means, and
AN INSTRUMENT FOR MEASURING THE KEY FACTORS OF SUCCESS IN SPI 363
processes for outcomes. They claimed that there are six reasons why quality improvementprograms fail: (1) process (rather than results) orientation; (2) too large scale and diffused;(3) bad results are excused for the sake of program success; (4) delusional measurementsof success; (5) staff- and consultant-driven; and (6) bias to orthodoxy, not cause and effect.
In contrast to the activity centered programs, Schaffer and Thomson (1992) argued fora “results-driven” approach to improvement. The results-driven approach, they claimed,have four key benefits that activity-centered programs generally miss: (1) they introducemanagerial and process innovations only as they are needed; (2) they are based on empiricaltesting that reveals what works; (3) they are focused on short-term, incremental projectsthat quickly yield tangible results; and finally (4) management creates a continuos learningprocess by building on the lessons of previous phases in designing the next phase of theprogram.
Even though we have witnessed a widespread research and industrial use of TQM, thereis still no general agreement on a set of operational measures of quality management interms of critical factors for success. Only a handful of researchers have made contributionstowards a scientific methodology for diagnostic assessments of TQM programs (e.g. Garvin,1983, 1984; Saraphet al., 1989; Powell, 1995; Ahireet al., 1996; Black and Porter, 1996).
Garvin (1983, 1984) conducted early empirical studies of quality practices and their im-pact on quality performance. He developed a set of critical factors based on systematicon-site observations and comparisons of quality management practices between manufac-turers in the United States and Japan. These studies concluded that the quality leadersperformed especially well in several areas of quality management. They had strong man-agement support for quality, a comprehensive goal-setting process, and a high level ofcross-functional participation.
Saraph, Benson and Schroeder (1989) developed a set of eight critical factors of qual-ity management based on the quality literature. They pioneered the development of validand reliable instruments, based on accepted psychometric principles, to measure qual-ity management practices. The following factors were included in their final instrument:Role of management leadership and quality policy, role of quality department, training,product/service design, supplier quality management, process management, quality dataand reporting, and employee relations.
Black and Porter (1996) identified ten critical factors of TQM based on an empiricalstudy among 204 managers with membership in the EFQM. The Baldridge Award modelwas taken as the basis for their study. However, the empirically derived factors did notmatch the categories suggested by the Baldridge model. Also, the factor analytic approachused in this study resulted in several highly complex factors, which makes them difficultto interpret. In practical terms, however, Black and Porter’s (1996) findings can be used toimprove existing self-assessment frameworks such as the Baldridge and European QualityAward criteria.
Through a detailed analysis of the literature, Ahire, Golhar and Waller (1996) identified,and empirically validated, 12 implementation constructs of integrated quality managementstrategies. However, in an empirical study of TQM as competitive advantage, Powell(1995) claimed that most features generally associated with TQM (e.g. quality training,process improvement, and benchmarking) do not generally produce advantage. On the

364 DYBÅ
other hand, he found that features such as open culture, employee empowerment, andexecutive commitment, could produce advantage.
1.2. Critical Factors of Organizational Learning
Studies of organizational learning has more than anything else been shaped by the works ofArgyris and Sch¨on (1978, 1996). Furthermore, Senge (1990; Sengeet al., 1994, 1999) haspopularized the concept of the “learning organization,” Nonaka (1991, 1994; Nonaka andTakeuchi, 1995) has emphasized the “knowledge creating company,” Choo (1995, 1998)has developed the notion of the “knowing organization,” Hunt and Buzan (1999) argued forcreating a “thinking organization,” and finally March (1999) has highlighted the pursuit of“organizational intelligence.”
Argyris and Sch¨on made an important distinction between the concepts ofsingle-loopanddouble-looplearning, what Senge (1990) has called the difference between adaptive andgenerative learning, or what others have called the difference between (1) maintenance andgrowth vs. (2) transformation. Similarly, March (1991, 1999) makes a distinction betweenthe exploitation of existing knowledge and the exploration of new knowledge. Commonto all of these constructs, is that the lower level involves improving existing behaviorsand making progress toward stated goals, while the higher level requires questioning theappropriateness of the goals, and recognizing the subjectivity of meaning.
Evolutionary learning strategies represent relatively small or incremental changes, in theorganization’s products, procedures, or services. They are new to the organization but reflectan adaptation or simple adjustment of existing practices, and their implementation rarelyrequires changes in organizational structures or processes. In contrast, radical learningstrategies represent larger changes in organizational products, procedures, or services. Theyreflect broader shifts in perspective and reorientation of existing practices and often requiremajor changes in organizational structures or processes to implement.
This distinction is also consistent with a characterization of learning strategies rangingfrom adaptive to innovative. Organizations with adaptive styles work within existing struc-tures to make incremental changes and “do things better.” In contrast, organizations withinnovative styles treat current structures as part of the problem and make more radicalchanges by “doing things differently.” In other words, software organizations can engagein two broad kinds of learning strategies. They can engage inexploitation—the adoptionand use of existing knowledge and experience, and they can engage inexploration—thesearch for new knowledge, either through imitation or innovation (Dyb˚a, 2000a).
Nonaka (1991, 1994) discussed five conditions required at the organizational level to pro-mote a knowledge spiral of these learning strategies, Senge (1990) proposed five disciplinesfor creating a learning organization, and Garvin (1993) emphasized five main activities thatlearning organizations are skilled at. Table 4 summarizes these prescriptions.
Furthermore, in an empirical study by Nevis, DiBella and Gould (1995), ten facilitatingfactors that expedite learning were identified: (1) Scanning imperative, (2) performance gap,(3) concern for measurement, (4) experimental mind-set, (5) climate of openness, (6) con-tinuous education, (7) operational variety, (8) multiple advocates, (9) involved leadership,and (10) systems perspective.

AN INSTRUMENT FOR MEASURING THE KEY FACTORS OF SUCCESS IN SPI 365
Table 4.Facilitating factors identified in organizational learning.
Nonaka’s enabling factors1 Senge’s five disciplines2 Garvin’s building blocks3
• Intention • Systems Thinking • Systematic problem solving• Autonomy • Personal Mastery • Experimentation• Fluctuation and Creative Chaos • Mental Models • Learning from past experience• Redundancy • Shared Vision • Learning from others• Requisite Variety • Team Learning • Transferring knowledge
Sources:1Nonaka (1994),2Senge (1990),3Garvin (1993).
Table 5.Facilitating factors identified in software process improvement.
Humphrey’s six principles1 Zahran’s 10 CSFs2 Basili’s paradigm3
• Major changes to the 1. Alignment with the business• Acquisition of core competenciessoftware process must strategy and goals through (1) a control cycle andstart at the top 2. Consensus and buy-in from (2) a capitalization cycle
• Ultimately, everyone must all stakeholders • Goal-oriented measurementbe involved 3. Management support • Experience reuse and
• Effective change is built on 4. Dedicated resources organizational sharingknowledge 5. Sensitivity to the
• Change is continuous organizational context• Software process changes 6. Management of change
won’t stick by themselves 7. Prioritization of actions• Software process 8. Support infrastructure
improvement requires 9. Monitoring the results of SPIinvestment 10. Learning from the feedback
results
Sources:1Humphrey (1989),2Zahran (1998),3Basili and Caldiera (1995).
1.3. Critical Factors of Software Process Improvement
Watts Humphrey (1989, 1997) and Victor R. Basili (e.g. Basili and Rombach, 1988) havebeen the pioneers and leaders in the field of software process improvement. Humphrey(1989) identified six basic principles of software process change. Zahran (1998) proposedten critical factors for successful implementation of software process improvement. Basiliand Caldiera (1995) focus on reuse of experience and learning by using the quality im-provement paradigm (QIP) for developing core competencies, and by supporting the QIPprocess with goal-oriented measurement (GQM) and an organizational infrastructure (EF).Table 5 summarizes these concepts.
Goldenson and Herbsleb (1995) conducted a survey of 138 individuals from 56 organi-zations in the United States and Canada to evaluate various organizational factors that werebelieved to promote or hinder successful SPI after a CMM-based assessment. The factorsthat were found to be statistically significant in their study are summarized in Table 6. ElEmamet al. (1998) made a reanalysis of Goldenson and Herbsleb’s (1995) study, usingmultivariate analysis instead of the simple statistical analytic methods used in the initial

366 DYBÅ
Table 6.Facilitating factors and barriers to SPI (Goldenson and Herbsleb, 1995).
Organizational Factors Barriers
• Senior management monitoring of SPI • Discouragement about SPI prospects• Compensated SPI responsibilities • SPI gets in the way of “real” work• SPI goals well understood • “Turf guarding” inhibits SPI• Technical staff involved in SPI • Existence of organizational politics• SPI people well respected • Assessment recommendations too• Staff time/resources dedicated to process ambitious
improvement • Need guidance about how to improve• Need more mentoring and assistance
report. Based on this reanalysis, they identified focused SPI effort, commitment to SPI,politics, respect, and turnover as the key factors.
Within the SPICE Trials, a similar study to that of Goldenson and Herbsleb (1995)was conducted by El Emam, Fusaro and Smith (1999) with 18 organizations in Europe,Canada and Australia that had performed assessments using the ISO/IEC 15504 standardfor software process assessment. In their study, three types of independent variables weretested: “organizational factors,” “process factors” and “barriers.” Results of the bivariaterelationship analysis showed that none of the identified barriers were related to success inaddressing the findings from an assessment. Of the organizational factors, only “SPI goalsbeing well understood” and “Technical Staff involvement in SPI” were found to be criticalfor addressing the findings from an assessment. Finally, only one process factor, “Creatingprocess action teams,” was found to be statistically significant in addressing the assessmentfindings.
Stelzer, Mellis and Herswurm (1996) identified the following key success factors in theirstudy of software process improvement via ISO 9000: (1) Definition and documentation ofthe status quo, (2) identification of best practices, (3) identification of business processes,(4) simplification of routine procedures, (5) internal audits, (6) impetus and incentive,(7) team spirit, (8) workshop and regular meetings, (9) definition of a common language,and (10) customer perception surveys.
Furthermore, Stelzer and Mellis (1998) analyzed published experience reports and casestudies of 56 software organizations that had implemented an ISO 9000 quality systemor that had conducted a CMM-based SPI initiative. The result of this meta-analysis wasa set of ten factors that affect organizational change in SPI. In rank order, these factorswere: (1) Management commitment and support, (2) staff involvement, (3) providing en-hanced understanding, (4) tailoring improvement initiatives, (5) managing the improvementproject, (6) change agents and opinion leaders, (7) stabilizing changed processes, (8) en-couraging communication and collaboration, (9) setting relevant and realistic objectives,and (10) unfreezing the organization.
Moreover, in a survey of 87 projects from different organizations, Deephouseet al. (1996)assessed the effectiveness of software processes on project performance. The results fromthis study showed that certain practices, such as project planning and cross-functional teams,were consistently associated with favorable outcomes, while other practices such as process

AN INSTRUMENT FOR MEASURING THE KEY FACTORS OF SUCCESS IN SPI 367
training, stable environment, user contact, design reviews, and prototyping had little impacton project outcomes.
Finally, ISO/IEC 15504-7 (1998) highlight cultural and management issues as fundamen-tal to succeed with software process improvement and organizational change. The standardargues that SPI should be strongly supported by leadership, communication and motiva-tion throughout the whole organization; that improvement actions only can be carried outefficiently if the appropriate cultural issues are acknowledged and addressed at all levels;and finally, that major problems found in software processes often arise from cultural is-sues. Consequently, cultural issues should be one of the factors considered in prioritizingimprovement actions.
In the rest of the paper the process of developing the instrument based on the literature-derived prescriptions and an extensive empirical research is described. Other sets of factorscould be developed or different aspects of the factors could have been defined. However,this set seems to capture most of the important aspects of successful SPI as espoused byleading practitioners and researchers. This is also, as we shall see, supported by the resultsof reliability and validity analyses that show that the instrument has desirable psychometricproperties.
2. Key Factors of SPI Success
The starting point for developing the instrument was the extensive literature review discussedin the preceding section. The above authors have emphasized slightly different sets oforganizational requirements for successful quality management and organizational changebased on their personal judgment and experience. With a few exceptions (e.g. Saraphetal., 1989; Powell, 1995; Ahireet al., 1996; Black and Porter, 1996; El Emamet al., 1998)their requirements were not formulated on the basis of systematic empirical research.
As a complement to the literature study, we conducted an extensive exploratory study offactors enabling SPI success in four Norwegian software companies. The data collectionmethod used to derive key factors for success was three questionnaire items and follow-up group interviews (feedback sessions) in each company. For the purpose of the resultspresented in this paper, data collection focused on answering one question:
In your opinion, what are the three most important factors enabling SPI success inyour organization?
In order to gain more background information about the key factors of SPI success, ourquestioning strategy included two additional questions. First we asked the subjects abouttheir most important argumentin favor of SPI in their organization. Second we askedthe subjects about their most important argumentagainstSPI in their organization. Theanswers to these questions gave us valuable information for interpreting the factors.
In total, 54 software managers, quality managers, software developers and customerrepresentatives answered the three questions and participated in the subsequent feedbacksessions. The outcome of this study was a set of five enabling factors for SPI success: man-agement commitment, participation, learning from experience, goal-/business orientationand measurement. Each of these five factors was mentioned by at least three subjects.

368 DYBÅ
Complementing the literature review and the exploratory study in the four software com-panies, we conducted a review process with eleven SPI experts in both academia andindustry. The single most important criteria for choosing experts to this panel was “hands-on experience with SPI projects in the software industry.” Thus, we included softwaremanagers, senior software engineers and researchers that actively participatedeither inthe largest software process improvement effort to date in Norway, called SPIQ (SoftwareProcess Improvement for better Quality) (see Dyb˚a, 2000b),or in a Process ImprovementExperiment (PIE) within the European Systems and Software Initiative (ESSI).
The experts were, thus, chosen from companies of different sizes with a wide range ofproducts and markets, developing either software or combined software and hardware prod-ucts. Some of the industry expert’s companies belonged to the traditional electronics basedIT-industry, while others belonged to the new dot-com industry. Besides SINTEF, expertsfrom academia were chosen from the Norwegian University of Science and Technology,and the University of Oslo, which made up the research partners in the SPIQ project. Of thepanel of eleven experts seven had a Ph.D. in computer science, six had project managementor SPI responsibility in industry, and five were researchers in software engineering and SPIin universities or research institutes.
The use of such an expert review process is common in instrument development, andthe particular process used in this study was similar to that of El Emam and Madhavji(1996). The review process consisted of three consecutive activities: (1) refinement ofthe literature-derived prescriptions, (2) prioritization of the hypothesized categories, and(3) prioritization of indicators within each category.
Each expert received a memorandum with a brief summary of the prescriptions for successfound from the literature review. Furthermore, as a result of this literature review, theexperts were presented with an initial list of seven key factors for SPI success and a setof potential indicators for each factor based on the author’s judgement. Nearly all of theauthors supported each of these factors; hence, together they were judged to define essentialaspects of SPI.
Each expert was asked to (1) review the findings from the literature and the initial list ofkey factors, (2) delete the factors considered to have secondary or no importance, (3) addnew factors considered to have high importance, and (4) give each of theremainingfactors apriority score. The experts were also asked to add any literature references that, according totheir judgement, was not represented by the review, i.e. that would add new prescriptions notcovered by the presented literature review. Subsequently, the list of factors was modified,refined, and reworded during the data collection.
A rank ordering was obtained using the total proportion of respondents who ranked afactor as critical for SPI success, as opposed to being of somewhat importance. During thisstep of the expert review process, it became clear that the experts placed similar levels ofemphasis on the SPI success factors. The results of this survey and the subsequent rankordering indicated which factors of SPI success were considered more important, and whichwere considered less important.
During this process, it was clear thatthe five factors that were ranked highest by theeleven SPI experts were the same factors that resulted from the exploratory study among the54 managers and developers in the four software companies. The two lowest ranking factors

AN INSTRUMENT FOR MEASURING THE KEY FACTORS OF SUCCESS IN SPI 369
from the expert review process (experimentation and operational variety) were combinedinto one factor (exploration of new knowledge). Hence, the result of this investigationwas the identification of six key facilitating factors for SPI success. These six factors aredescribed in Table 7.
In the next section, we describe the identification of indicators for each of the facilitatingfactors of SPI success.
3. Item Creation
Using the prescriptions found in the literature, several representative indicators were definedfor each factor. In total, 59 indicators were initially defined for the original set of sevenfacilitating factors. These indicators are presented in Appendix A.
A process similar to that of identifying the key factors of SPI success was used to definethe key indicators for each factor. Hence, for each factor, the eleven experts were askedto (1) delete indicators of secondary or no importance, or indicators that they consideredinappropriate as descriptions of the factor under consideration, (2) add new indicatorsaccording to their judgement, and (3) give each of theremainingindicators a priority score.
As for the factors, a rank ordering was now obtained for the indicators, based on theexperts’ judgement. During this step of the expert review process it became clear thatdifferent experts placed different levels of emphasis on the indicators. The results of thesubsequent rank ordering suggested which indicators that were considered more importantor less important. Furthermore, according to Bagozzi (1996): “for scales comprised of thesums of items, about 4 to 8 items are usually adequate” (p. 41). Thus, following the expertreview, the five to eight highest ranked indicators for each factor were chosen, for a total of38 indicators. These indicators are shown in rank order within each factor in Table 7.
4. Construction of Measurement Scales
Based on the results from the preceding step, we defined one question for each indicator suchthat the theoretical abstraction of each indicator could be related more closely to everydaywork situations. Furthermore, a subjective rating scale accompanied each question.
In selecting the number of points on a rating scale, Guilford (1954) suggested severalconsiderations. If too few scale points are used, the answer scale is obviously coarse,and much information is lost because the scale does not capture the discriminatory powersthat respondents are capable of making. Conversely, by using too many scale points, thescale can become graded so finely that it is beyond the respondents’ limited powers ofdiscrimination. Indeed, Miller (1956) argued that the average individual can process seven,plus or minus two (the “magical number”) chunks of information at a time.
Likert and Roslow (1934) investigated the reliability of attitude scales by using threevariations of the Likert scale. In addition to the original 5-point scale (Likert, 1932), theyalso used a 3-point and a 7-point scale. They concluded that the 5-point scale consistentlyyielded higher reliabilities than either of the two other scales.

370 DYBÅ
Table 7.Key factors of SPI success.
Key Factors of SPI Success Indicators for the Key Factors of SPI Success
Business Orientation • Extent of goal-orientation in SPI activities.• Extent to which SPI goals and policy are understood.• Degree of integrating SPI actions with “real” work.• Extent to which SPI goals are aligned with business goals.• Degree of balance between short-term and long-term goals.
Leadership Involvement • Degree of management support to SPI activities.• Acceptance of responsibility for SPI by management.• Degree to which management considers SPI as a way to
increase competitive advantage.• Degree of participation by management in the SPI process.• Amount of review of SPI issues in top management
meetings.Employee Participation • Extent of employee involvement in decisions about what
should best be done at their own level (co-determination).• Extent to which employees contribute with improvement
proposals.• Extent of developer participation in the formalization
of routines.• Extent of on-going dialogue and discussion about software
development.• Extent to which employees have responsibility for SPI.• Extent of developer participation in SPI goal setting.• Extent of on-going dialogue and discussion about SPI.• Extent of employee participation in development planning*.
Concern for Measurement • Importance of measuring performance.• Availability of quality data (defects, timeliness, etc).• Extent to which quality data is available to developers.• Extent to which quality data is available to managers.• Extent to which quality data is used in SPI work.• Amount of feedback provided to project teams on their
performance.Exploitation of existing knowledge • Extent to which existing knowledge is exploited.(learning by experience) • Extent of learning from past experience.
• Degree to which formal routines are based on pastexperience.
• Degree of systemization of past experience.• Degree of internal experience transfer.• Extent of risk aversion*.
Exploration of new knowledge • Degree of adaptability to rapid change, increasing(learning by experimentation) complexity and environmental uncertainty.
• Extent to which innovation/creativity is encouraged.• Extent of variety in the use of methods, techniques
and tools.• Degree of experimentation with new ideas, strategies,
and technologies.• Ability to question underlying values.• Degree of flexibility in task execution.• Degree of detail in task specifications (minimum critical
specification).• Importance of matching the variety and complexity of the
organization’s environment.
∗These items were eventually deleted to improve the reliability of the instrument.

AN INSTRUMENT FOR MEASURING THE KEY FACTORS OF SUCCESS IN SPI 371
More recently, Lissitz and Green (1975) conducted a Monte Carlo study of the effectsof the number of scale points and homogeneity upon reliability. Their study showed thatthere was an increase in reliability as the number of points increased from two to five.However, reliability leveled off beyond five scale points. Consequently, Lissitz and Green(1975) concluded that since respondents are fallible, even fewer than five scale points maybe necessary.
Qualitative studies by Van de Ven and Ferry (1980) support the presented conclusions byLikert and Roslow (1934) and Lissitz and Green (1975). Guided by these studies, 5-pointbipolar Likert scales were constructed for all questions in our final questionnaire. Responseswere scored from 1 to 5, with a value of 1 indicating “Strongly disagree” and a value of5 indicating “Strongly agree.” Thus, we refer to each question and its associated 5-pointscale as anitem. A typical item is presented below:
Strongly Neither agree Stronglydisagree Disagree nor disagree Agree agree
(1) (2) (3) (4) (5)
Management is activelysupporting SPI activities.
2 2 2 2 2
Random errors in single items will sometimes inflate and sometimes deflate the observedestimate of the true score. Therefore, when repeated measurements from the same respon-dents are taken over time, there will be inconsistencies in the observations. Consequently,single-item measures in questionnaires tend to be highly unreliable (Nunnally and Bern-stein, 1994; Spector, 1992). On the other hand, when multiple items are combined into anestimate of the true score, errors tend to average out, leaving a more accurate and consistent(reliable) measurement over time (Spector, 1992).
Hence, to reliably measure complex concepts such as SPI success and facilitating factors,we developed multiple-item scales where more than one question was used to measure eachconcept. The actual level of practice for each facilitating factor is, thus, represented by thesum of the item ratings for that factor. We refer to these sums asscale scores. A vector ofthe scale scores for the six factors can thus be used to predict the software organization’schances of success with its SPI program.
As an example of a scale (see Table 8) we present the scale developed for the facilitatingfactor “Leadership Involvement” based on the five indicators resulting from the expertreview process (the complete validated instrument is included in Appendix B).
5. Pilot Test of Measurement Scales
The next step in the instrument development process was a pilot test of the measurementscales and of the overall instrument. In general, the pilot sample should be as similar tothe target population as possible (Nunnally and Bernstein, 1994; Fink and Kosecoff, 1998).Since the primary objective of this research was to develop an instrument to measure asoftware organization’s score on the six facilitating factors of SPI success, developmentmanagers and quality managers were considered appropriate subjects. Including both of

372 DYBÅ
Table 8.Leadership involvement scale.
Strongly Neither agree StronglyLeadership Involvement disagree Disagree nor disagree Agree agree
(1) (2) (3) (4) (5)
Management is activelysupporting SPI activities. 2 2 2 2 2
Management acceptsresponsibilityfor SPI. 2 2 2 2 2
Management considersSPI as a way to increasecompetitive advantage. 2 2 2 2 2
Management is activelyparticipating in SPIactivities. 2 2 2 2 2
SPI issues are oftendiscussed in topmanagement meetings. 2 2 2 2 2
these management groups were also important in order to have a more balanced view, sincetheir attitudes may differ widely.
Furthermore, since this was a pilot test, the sample size was kept quite small. Question-naires were distributed to a convenient sample of twelve managers in eight companies thateither participated in the SPIQ program or were involved in an ESSI PIE. Each managerassessed his/her company by rating each measurement item using the scales described inthe previous section. The managers mailed the completed questionnaires directly to theauthor to ensure confidentiality and anonymity of each response.
The goals of the pilot test were twofold: (1) to ensure that the mechanisms of compilingthe questionnaire had been adequate, and (2) to make an initial reliability assessment ofthe measurement scales. The first aim of the pilot test was accomplished by having twoprofessors of SPI research and one professor in psychological testing review the completedquestionnaire, and comment on its length, wording, instructions, and format before it wassent out. Subsequently, each manager was asked to make the same kind of comments. Nonof the comments from this review implied a need to change the questionnaire.
Analyzing the correlation of items within each scale (item-item), the corrected item-to-total (item-scale) correlations, and the item standard deviation scores accomplished thesecond aim of the pilot test. Based on this analysis, we deleted one item in the “Employeeparticipation” scale (marked with an asterisk in Table 7). This item was also the lowestranked item in the previously described expert review of the “Employee participation” scale.
6. Subjects and Instrument Administration
Target respondents for the study were software managers and quality managers in Norwe-gian IT companies developing software. These managers were chosen since they serve

AN INSTRUMENT FOR MEASURING THE KEY FACTORS OF SUCCESS IN SPI 373
as a bridge between the visions of top management and the often chaotic reality of thedevelopers. Hence, they are the key knowledge engineers in their respective companies(Nonaka, 1991; Nonaka, 1994; Nonaka & Takeuchi, 1995). These managers were usedin this study to answer on behalf of their respective organizations. Thus the unit of anal-ysis, from which original data observations were obtained, was the software organization.Within this study,a software organization is defined as a whole company or an indepen-dent business unit inside a larger company that has software development as its primarybusiness.
The objective was to develop an instrument that could be used in companies of differentsizes, developing either software or combined software and hardware products. Therefore,managers were chosen from companies with corporate membership either in the Associationof the Norwegian Software Industry (PROFF) or the Norwegian IT Technology Forum(ITUF). Taken together, these two organizations were considered to be representative forsoftware development within the Norwegian IT industry.
Sample size is an important consideration in the discussion of the internal consistencyof measurement scales. Thus, for the purpose of constructing a measurement instrumentwith satisfactory psychometric properties, the item analysis is the dimensioning factor.Generally, the item analysis to choose a set of items that form an internally consistent scale,requires a sample size of about 100 to 200 respondents (Spector, 1992). Based on theseguidelines, our target sample size for ensuring adequate item analysis was aminimum of100 respondents.
A random sample of 154 software and quality managers from the membership lists ofthe two associations were contacted by telephone to request participation in the studyprior to mailing the questionnaires. All managers agreed to participate in the study. Weprovided the respondents with self-addressed, stamped return envelopes. Also, by keepingthe questionnaire as short as possible (the pilot study showed that respondents needed about10 minutes to complete it), we combined several well-proven techniques for improving theresponse rate of mailed questionnaires (e.g. Kanuk and Berenson, 1975; Fink and Kosecoff,1998; Neuman, 2000).
A total of 120 software and quality managers representing whole organizations or indepen-dent business units within 55 software companies completed and returned the questionnaire.This represents an effective response rate of 77.9 percent, which is well within the norm of60+/−20 for representatives of organizations and mid-level managers suggested for aca-demic studies by Baruch (1999), and considerably higher than prior mail surveys conductedin the Norwegian software and IT industry. As a comparison, a recent study by Larsen andKautz (1997) on the status of quality assurance and software process improvement in Nor-way obtained a response rate of 13.3 percent, while St˚alhane, Borgersen and Arnesen’s(1997) study of the customer’s view of software product quality achieved a response rateof 8.4 percent. Given the high response rate in this study, no further analysis was done onthe differences between respondents and non-respondents.
As shown in Table 9, the respondent’s companies represent a wide variety of industrysectors. However, the sample is, as expected, biased in favor of IT companies (56.7% ofthe sample). To a large extent, the organizations develop software for external customers(approximately 96% of the sample). Furthermore, the sample shows a mix of both small and

374 DYBÅ
Table 9.Characteristics of the survey sample.
Characteristic Frequency PercentI. Characteristics of the Respondent
Average number of years worked in the company 8.4Average number of years worked with software development 11.4Highest completed education
Bachelor’s degree 38 31.7%Master’s degree 74 61.7%Doctoral degree 5 4.2%Other 3 2.5%
Job functionSoftware manager 95 79.2%Quality manager 25 20.8%
II. Characteristics of the Respondent’s CompanyNumber of software developers
Less than or equal to 30 45 37.5%Between 30 and 200 31 25.8%More than or equal to 200 44 36.7%
Primary industry groupPublic sector 7 5.8%Banking/finance/insurance 12 10.0%Manufacturing 21 17.5%IT sector 68 56.7%Other 12 10.0%
Type of product businessStandard applications (shelfware) 31 25.8%Tailor made solutions for external customers 84 70.0%Tailor made solutions for internal company customers 5 4.2%
Quality system in useYes 86 71.7%No 34 28.3%
large organizations, with approximately one third (37.5%) of the organizations having 30 orless developers and approximately one third (36.7%) having 200 or more. A large majorityof the respondent’s organizations have a quality system in use (71.7%). The average lengthof the respondents’ job tenure at their current organization is 8.4 years, while professionaltenure (years in software development) is 11.4 years. Two thirds of the respondents (65.9%)holds a master’s or doctoral degree.
In the next two sections, we describe the reliability analysis performed to refine themeasurement items of the facilitating factors of SPI success.
7. Reliability of Measurement Scales
Reliability refers to the consistency and stability of a score from a measurement scale(Anastasi and Urbina, 1997). Since all types of reliability are concerned with the degree ofconsistency or agreement between two independently derived sets of scores, they can all beexpressed in terms of acorrelation coefficient. Essentially, the correlation coefficient (r )indicates the degree of correspondence, or relationship, between two sets of scores. The
AN INSTRUMENT FOR MEASURING THE KEY FACTORS OF SUCCESS IN SPI 375
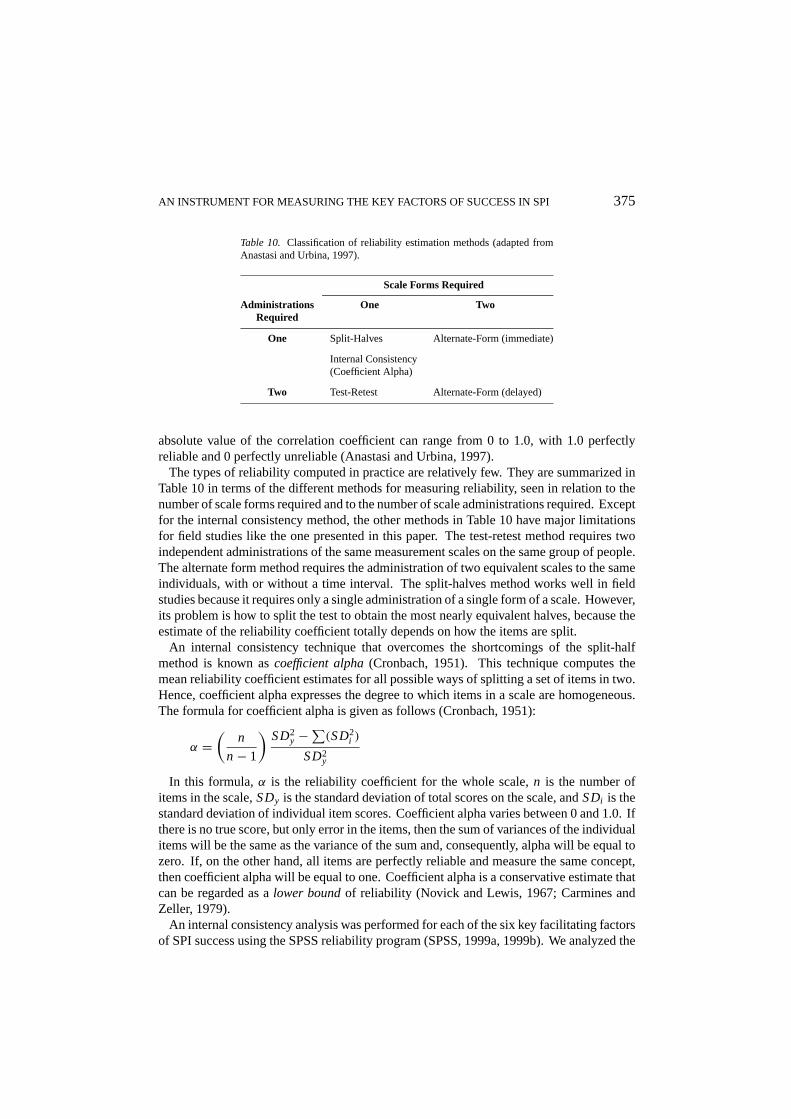
Table 10. Classification of reliability estimation methods (adapted fromAnastasi and Urbina, 1997).
Scale Forms Required
Administrations One TwoRequired
One Split-Halves Alternate-Form (immediate)
Internal Consistency(Coefficient Alpha)
Two Test-Retest Alternate-Form (delayed)
absolute value of the correlation coefficient can range from 0 to 1.0, with 1.0 perfectlyreliable and 0 perfectly unreliable (Anastasi and Urbina, 1997).
The types of reliability computed in practice are relatively few. They are summarized inTable 10 in terms of the different methods for measuring reliability, seen in relation to thenumber of scale forms required and to the number of scale administrations required. Exceptfor the internal consistency method, the other methods in Table 10 have major limitationsfor field studies like the one presented in this paper. The test-retest method requires twoindependent administrations of the same measurement scales on the same group of people.The alternate form method requires the administration of two equivalent scales to the sameindividuals, with or without a time interval. The split-halves method works well in fieldstudies because it requires only a single administration of a single form of a scale. However,its problem is how to split the test to obtain the most nearly equivalent halves, because theestimate of the reliability coefficient totally depends on how the items are split.
An internal consistency technique that overcomes the shortcomings of the split-halfmethod is known ascoefficient alpha(Cronbach, 1951). This technique computes themean reliability coefficient estimates for all possible ways of splitting a set of items in two.Hence, coefficient alpha expresses the degree to which items in a scale are homogeneous.The formula for coefficient alpha is given as follows (Cronbach, 1951):
α =(
n
n− 1
)SD2
y −∑(SD2
i )
SD2y
In this formula,α is the reliability coefficient for the whole scale,n is the number ofitems in the scale,SDy is the standard deviation of total scores on the scale, andSDi is thestandard deviation of individual item scores. Coefficient alpha varies between 0 and 1.0. Ifthere is no true score, but only error in the items, then the sum of variances of the individualitems will be the same as the variance of the sum and, consequently, alpha will be equal tozero. If, on the other hand, all items are perfectly reliable and measure the same concept,then coefficient alpha will be equal to one. Coefficient alpha is a conservative estimate thatcan be regarded as alower boundof reliability (Novick and Lewis, 1967; Carmines andZeller, 1979).
An internal consistency analysis was performed for each of the six key facilitating factorsof SPI success using the SPSS reliability program (SPSS, 1999a, 1999b). We analyzed the
376 DYBÅ
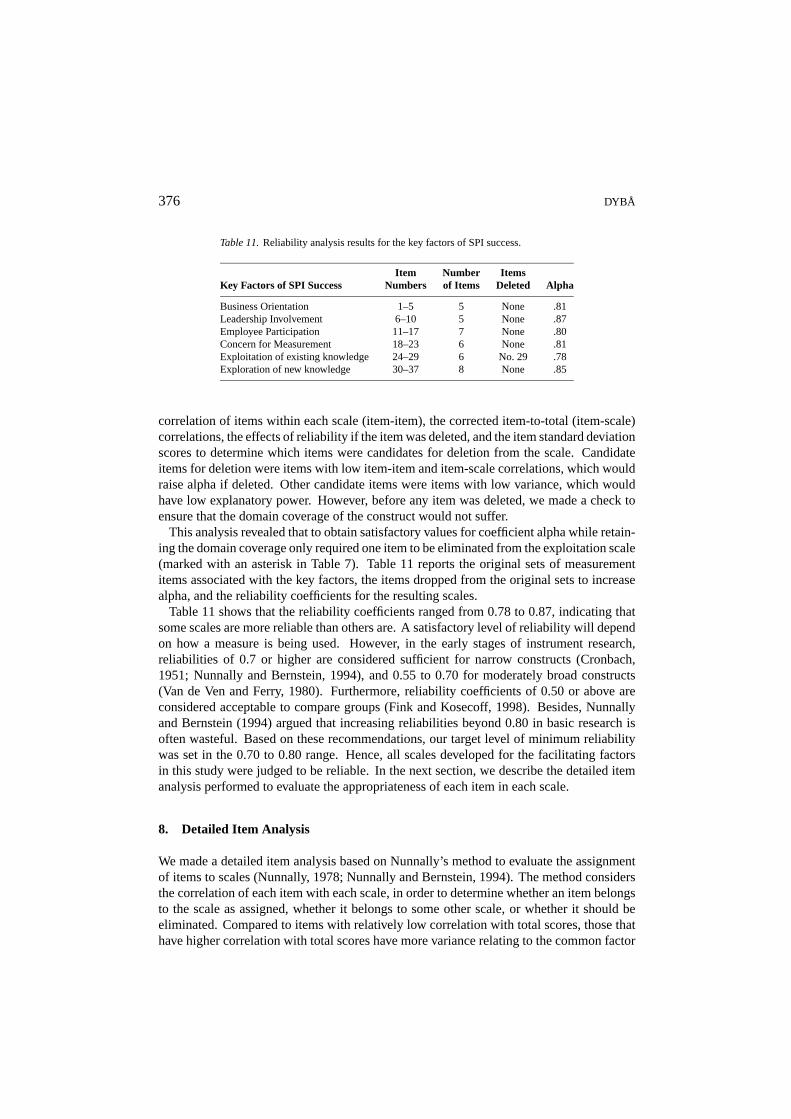
Table 11.Reliability analysis results for the key factors of SPI success.
Item Number ItemsKey Factors of SPI Success Numbers of Items Deleted Alpha
Business Orientation 1–5 5 None .81Leadership Involvement 6–10 5 None .87Employee Participation 11–17 7 None .80Concern for Measurement 18–23 6 None .81Exploitation of existing knowledge 24–29 6 No. 29 .78Exploration of new knowledge 30–37 8 None .85
correlation of items within each scale (item-item), the corrected item-to-total (item-scale)correlations, the effects of reliability if the item was deleted, and the item standard deviationscores to determine which items were candidates for deletion from the scale. Candidateitems for deletion were items with low item-item and item-scale correlations, which wouldraise alpha if deleted. Other candidate items were items with low variance, which wouldhave low explanatory power. However, before any item was deleted, we made a check toensure that the domain coverage of the construct would not suffer.
This analysis revealed that to obtain satisfactory values for coefficient alpha while retain-ing the domain coverage only required one item to be eliminated from the exploitation scale(marked with an asterisk in Table 7). Table 11 reports the original sets of measurementitems associated with the key factors, the items dropped from the original sets to increasealpha, and the reliability coefficients for the resulting scales.
Table 11 shows that the reliability coefficients ranged from 0.78 to 0.87, indicating thatsome scales are more reliable than others are. A satisfactory level of reliability will dependon how a measure is being used. However, in the early stages of instrument research,reliabilities of 0.7 or higher are considered sufficient for narrow constructs (Cronbach,1951; Nunnally and Bernstein, 1994), and 0.55 to 0.70 for moderately broad constructs(Van de Ven and Ferry, 1980). Furthermore, reliability coefficients of 0.50 or above areconsidered acceptable to compare groups (Fink and Kosecoff, 1998). Besides, Nunnallyand Bernstein (1994) argued that increasing reliabilities beyond 0.80 in basic research isoften wasteful. Based on these recommendations, our target level of minimum reliabilitywas set in the 0.70 to 0.80 range. Hence, all scales developed for the facilitating factorsin this study were judged to be reliable. In the next section, we describe the detailed itemanalysis performed to evaluate the appropriateness of each item in each scale.
8. Detailed Item Analysis
We made a detailed item analysis based on Nunnally’s method to evaluate the assignmentof items to scales (Nunnally, 1978; Nunnally and Bernstein, 1994). The method considersthe correlation of each item with each scale, in order to determine whether an item belongsto the scale as assigned, whether it belongs to some other scale, or whether it should beeliminated. Compared to items with relatively low correlation with total scores, those thathave higher correlation with total scores have more variance relating to the common factor

AN INSTRUMENT FOR MEASURING THE KEY FACTORS OF SUCCESS IN SPI 377
among items, and they add more to instrument reliability (Nunnally, 1978). Hence, an itemthat does not correlate highly with any of the scales, should be eliminated.
There are two types of item-scale correlation. Thecorrected item-scale correlationcorre-lates the item being evaluated with all the scale items, excluding itself, while theuncorrecteditem-scale correlationcorrelates the item in question with the entire set of candidate items,including itself. Although the uncorrected item-scale correlation makes good conceptualsense, the item’s inclusion in the scale can inflate the correlation coefficient, thus makingit spuriously high. The fewer the number of items in the scale, the bigger the differencethat the inclusion or exclusion of the item under examination will make. Therefore, wefollowed the general advice of examining the corrected item-scale correlations rather thanthe uncorrected (DeVellis, 1991; Nunnally and Bernstein, 1994).
After eliminating the items in the previous steps, the remaining items were correlatedwith the total scores of each scale, excluding itself. The corrected item-scale correlationmatrix for the facilitating factors of SPI success in Table 12 shows that all items havehigh correlations with the scales to which they were originally assigned. Furthermore, allcorrelations are above the cutoff of 0.3 recommended by Nunnally and Bernstein (1994).
With the exception of the “feedback” item (item no. 23), all item-scale correlations aresubstantially higher than the corresponding correlations with all other scales. However,based on the literature review, the expert review and our own experience, we decided tokeep the feedback item within the measurement scale as originally assigned. There are tworeasons for this. First, feedback is generally considered as being of utmost importance inall SPI work, and second, we regard feedback as conceptually closer to “Concern for Mea-surement” rather than to “Exploitation of Existing Knowledge.” Therefore, we concludedthat all items had been assigned to the appropriate scale, and that no additional items shouldbe deleted.
9. Validity of Measurement Scales
For a scale to be valid, it must also be reliable. Validity is differentiated from reliability inthat the former relates to accuracy, while the latter relates to consistency. A measurementscale is valid if it does what it is supposed to do and measures what it is supposed to measure(Cronbach, 1971; Anastasi and Urbina, 1997). If a scale is not valid, it is of little use becauseit is not measuring or doing what it is supposed to be doing. Three kinds of validity areof special concern for this study. These validity concerns are outlined in Table 13 anddiscussed next.
9.1. Content Validity
Content validity has to do with the degree to which the scale items represent the domain of theconcept under study. Essentially, procedures for content validation involve the systematicexamination of the instrument content to determine if it covers a representative sample ofthe behavior domain to be measured (Davis, 1996). Content validity is built into a test fromthe outset through the choice of appropriate items (Anastasi and Urbina, 1997).

378 DYBÅ
Table 12.Corrected item-scale correlation matrix.
Item ScaleKey Factors of SPI Success No. 1 2 3 4 5 6
Business Orientation 1 .61 .52 .47 40 .33 −.03(Scale 1) 2 .67 .43 .37 .36 .47 .18
3 .49 .40 .39 .29 .47 .184 .69 .53 .24 .28 .51 .215 .56 .51 .46 .40 .38 .15
Leadership Involvement 6 .45 .67 .24 .33 .42 .09(Scale 2) 7 .54 .81 .37 .41 .39 .05
8 .49 .69 .30 .33 .34 .139 .55 .70 .29 .35 .45 .18
10 .55 .65 .30 .25 .30 .00
Employee Participation 11 .09 .18 .47 −.01 .20 .35(Scale 3) 12 .15 .18 .55 .10 .28 .41
13 .28 .28 .58 .02 .39 .3114 .09 .12 .47 .07 .17 .3015 .52 .40 .54 .39 .45 .2516 .48 .34 .55 .34 .44 .3217 .16 .19 .53 .15 .24 .22
Concern for Measurement 18 .32 .32 .02 .40 .13 −.06(Scale 4) 19 .33 .26 .06 .61 .25 −.06
20 .33 .28 .16 .72 .36 .2021 .33 .33 .17 .77 .29 .1822 .43 .36 .34 .61 .39 .1323 .19 .19 .26 .31 .31 .16
Exploitation of existing knowledge 24 .34 .28 .35 .16 .55 .20(Scale 5) 25 .52 .38 .43 .34 .69 .15
26 .32 .33 .22 .28 .52 −.0527 .45 .32 .28 .51 .54 .1028 .44 .39 .41 .20 .47 .19
Exploration of new knowledge 30 .26 .26 .27 .09 .20 .59(Scale 6) 31 .13 .08 .41 .14 .17 .67
32 .15 .09 .30 .08 .16 .6633 .10 .05 .36 −.03 .13 .6134 .14 .14 .44 .30 .20 .5335 −.07 −.16 .24 −.06 −.13 .5736 .02 −.03 .15 −.07 −.11 .5037 .25 .20 .38 .28 .26 .54
Our procedure for instrument development followed the general recommendations ofCronbach (1971) and Straub (1989) and included:
1. An exhaustive search of the literature for all possible items to be included in the scales.
2. An exploratory study in representative companies to find possible items and scales.
3. Review of the proposed scales by experts of both psychological testing and SPI. Therewere also asked for suggestions as to any additions or deletions to the scales.

AN INSTRUMENT FOR MEASURING THE KEY FACTORS OF SUCCESS IN SPI 379
Table 13.Three basic types of validity in measurement instruments.
Types of Validity Definitions
Content validity The degree to which the items in the measurement instrumentrepresent the domain or universe of the processes under study.
Construct validity The degree to which the measurement instrument representsand acts like the processes being measured.
Criterion validity The degree to which the measurement instrument is able topredict a variable that is designated a criterion.
4. Pilot test of the scales on a set of respondents similar to the target population. Theserespondents were also encouraged to include suggestions and criticisms to the contentsand wording of the scales.
Hence, we argue that our six measurement scales representing the facilitating factors ofSPI success developed in this study have content validity since selection of measurementitems was based on generally accepted procedures to obtain content validation.
9.2. Construct Validity
Construct validity is an operational concept that examines whether the measurement scalesrepresent and act like the attributes being measured (Cronbach, 1971; Nunnally and Bern-stein, 1994). Assuming that the total score of a scale is valid, the extent to which anindividual item measures the same thing as the total score is an indicator of the validity ofthat item. Furthermore, factor analysis is considered to be “a powerful and indispensablemethod of construct validation” (Kerlinger, 1986). Thus, in addition to item-total correla-tions, the construct validity of the scales in the measurement instrument was assessed usingfactor analysis.
Although many investigators advocate the construction of measurement instrumentsthrough factor analysis, Spector (1992) and Nunnally and Bernstein (1994) argued thatfactor analysis should rather be usedafter the instrument is constructed. The main rea-son for this is that the construction of a measurement instrument should be guided bytheories, rather than by random efforts to relate things to one another through “shotgunstatistics.” This fits the approach in this research where the constructs of interest are basedon a substantial body of prior research and have been explicated prior to any item develop-ment.
The construct validity of the six measurement scales was evaluated by analyzing the itemsof each of the scales using principal components analysis. However, this analysis, as allfactor-analysis procedures, includes subjective judgement when it comes to determiningthe number of factors and their interpretation (Spector, 1992).
Several guidelines have been developed to assist in deciding how many factors to extract.The two most widely used criteria are Kaiser’s (1960, 1970)eigenvalue ruleand Cattell’s(1966)scree test. The eigenvalue rule is based on retaining only factors that explain morevariance than the average amount explained by one of the original items (i.e. components

380 DYBÅ
Table 14.Summary of factor matrices for each construct.
Item Loading Range # Items withScale Eigenvalue for Component 1 Loadings > 0.6
1. Business orientation 2.9 .72 to .82 5 (out of 5)
2. Leadership involvement 3.3 .78 to .89 5 (out of 5)
3. Participation 3.2 .62 to .72 7 (out of 7)
4. Measurement 3.1 .43 to .83 4 (out of 6)
5. Exploitation 2.7 .65 to .84 5 (out of 5)
6. Exploration 3.9 .61 to .78 8 (out of 8)
with eigenvalue> 1). However, when Zwick and Velicer (1986) examined the effect ofdifferent criteria for extracting factors, they found that Kaiser’s method tended to severelyoverestimate the number of components. Furthermore, Cliff (1988) called the rationalbehind the eigenvalue rule into question, and despite its wide use, Nunnally and Bernstein(1994) did not recommend it because it tends to suggest too many factors. The scree testis based on a subjective examination of the plot of eigenvalues for each successive factor,looking for an “elbow” in the plot. Cattell’s guidelines call for retaining those factors abovethe “elbow” and rejecting those below it.
Each item also has a final loading on each factor. These loadings are the correlationsbetween items and the factors, thus the square of a loading can be seen as the amount ofvariance common to both. Comrey (1973) suggested that loadings in excess of 0.45 couldbe considered fair, those greater than 0.55 as good, those of 0.63 very good, and those of0.71 as excellent. For a study with a relatively small number of cases, the quality of afactor must be assessed both in terms of the number and size of its loadings. Stevens (1992)suggested that a reliable factor must have four or more loadings of at least 0.6 when thenumber of cases is below 150.
We used a combination of eigenvalues, cut-off points of the scree plots and factor loadingsas a guide for interpreting the dimensionality of the scales. Furthermore, each scale wasassumed to be a separate construct. Table 14 shows the eigenvalues and item loadingranges for each scale. Analysis of the eigenvalues showed that five of the six scales formeda single factor. In the case of the exploration scale, two components seemed to emergewith eigenvalues greater than 1.0. However, the eigenvalue of the second factor was onlyslightly above this threshold (1.02).
Next, we examined both the scree plot and the item loadings in order to further interpretthe dimensionality of the exploration scale. The scree plot showed a clear break after thefirst component (see Figure 2). Furthermore, all item loadings for this component weregreater than 0.6. The combined result of these analyses indicates fairly strong support forthe hypothesis that the exploration scale can be considered as one construct.
In brief, the results of the factor analysis support the view that each of the measurementscales in the questionnaire has a high degree of unidimensionality. Hence, there is tentativeevidence of construct validity for all six scales.

AN INSTRUMENT FOR MEASURING THE KEY FACTORS OF SUCCESS IN SPI 381
Figure 2. Scree plot for the Exploration scale.
9.3. Criterion Validity
Criterion-related validity, sometimes called external validity, is concerned with the degree towhich the scales under study are related to an independent measure of the relevant criterion(Anastasi and Urbina, 1997).
Organizational performance is the ultimate criterion for any SPI activity. The six facili-tating factors, thus, have criterion-related validity if, taken collectively, they are highly andpositively correlated with performance in a software organization. Performance is a com-plex construct, however, reflecting the criteria and standards used by decision-makers toassess the functioning of a software organization. That is, performance is a value judgementon the results desired from an organization (Van de Ven and Ferry, 1980).
Investments in SPI share many features with research and development investments, fre-quently having corporate-wide, intangible and long lasting effects. Therefore, quantitativemeasures and financial estimates tend to be difficult to obtain and easy to manipulate. Themain distinction between the objectivity of different success measures is not a matter ofusing quantitative or financial figures as opposed to developers’ or managers’ perceptions.For example, the return on investment, net present value and payback periods are oftenregarded as objective measures. However, because of the many difficulties in predictingand assessing costs, and especially benefits, such investment analyses are usually based onexperts’ subjective judgement (Saarinen 1996; Zahran, 1998). In many cases, the subjectivemeasures may be better than the financial measures (Saarinen, 1996). This is mainly due tocomplicated contingencies that are best judged by those who are responsible for the objectof evaluation.
Furthermore, value judgements on desirable performance outcomes often change overtime in a way that threatens the applied relevance of longitudinal assessments of orga-

382 DYBÅ
nizations. Finally, decision makers often disagree on a given set of criteria to evaluateorganizational performance. However, performance measurement does not require a con-sensus on effectiveness goals, criteria, and standards. An organizational assessment simplyrequires that the definitions of performance be made explicit and that the researcher deter-mines whose value judgements and criteria will be operationalized and measured (Van deVen and Ferry, 1980).
Based on the preceding discussion, and that subjective performance measures are widelyused and accepted in organizational research (Lawrence and Lorsch, 1986; Powell, 1995),we considered a subjective evaluation approach with multi-item constructs as an appropriateway to assess organizational performance.
Generally, the intent of SPI is increased competitive advantage through improved softwarequality, increased productivity, and decreased lead-time for product development. In otherwords, SPI should lead to “better, faster, [and] cheaper software development” (Sanders,1998). Based on these general recommendations, we operationalized and measured SPIsuccess along two dimensions, based on two multi-item measures. Thus, each managerwas asked to rate, on 5-point bipolar Likert scales, (1) the level of perceived SPI successand (2) the performance of their organization for the past three years with respect to costreduction, cycle time reduction, and customer satisfaction. This is similar to the approachused by Teng, Jeong and Grover (1998) to measure reengineering project success and therelationship between characteristics of reengineering projects and implementation success.
Two items were used to measure the level of perceived SPI success, while three itemswere used to measure the level of organizational performance. As for the facilitating factors,all items were written specifically for this study. These items are included in the validatedmeasurement instrument in Appendix B. The ratings for the two performance dimensionswere averaged to form a single measure of overall SPI success. The reliability coefficientfor the five items of the SPI success measure was 0.76.
The criterion validity of the measurement instrument was found by computing the mul-tiple correlation (R) between SPI success and the measures of the six facilitating factors.The multiple correlation coefficient was 0.76 and the adjustedR-square was 0.56, thus,explaining 56 percent of the variation in SPI success. Furthermore, theF-value of 25.95was highly significant (p < 0.0005).
Cohen (1988) defined the effect size index,f 2, for the squared multiple correlationcoefficient,R2, where f 2 = R2/(1−R2). Also, he defined a large effect size asf 2 ≥ 0.35.Given the relationship between the effect size index and the squared multiple correlation, alarge effect size off 2 = 0.35 corresponds to a squared multiple correlation ofR2 = 0.26and a multiple correlation coefficient ofR = 0.51. In other words, the results indicatethata large amount of the variance in SPI success has been highly significantly explainedby the six facilitating factors. Thus, taken together, the six factors have a high degree ofcriterion-related validity.
10. Conclusions
In this paper we have described an extensive investigation for the development of an in-strument for measuring the key factors of success in SPI. The major premise was that it is

AN INSTRUMENT FOR MEASURING THE KEY FACTORS OF SUCCESS IN SPI 383
critical to understand the important factors affecting SPI success in order to improve soft-ware processes. However, central to this understanding is the development of an instrumentfor measuring these factors.
The results of reliability and validity analyses show that the instrument has desirablepsychometric properties. However, demonstrating validity is a continuous process, andvalidity is a matter of degree rather than an all-or-none property. Moreover, one validatestheuseto which a measurement instrument is put rather than the instrument itself (Nunnallyand Bernstein, 1994). Consequently, it is only through the accumulation of data frommultiple studies of instrument usage that we can make strong claims of validity.
Acknowledgments
This work was supported in part by the Research Council of Norway under Grant No.118206/221 and by SINTEF Telecom and Informatics. The author would like to thankReidar Conradi, Tor St˚alhane, Stan Rifkin and the anonymous reviewers for their valuablecomments on earlier drafts of this paper.
References
Ahire, S. L., Golhar, D. Y. and Waller, M. A. 1996 Development and Validation of TQM Implementation Constructs,Decision Sciences, 27(1), 23–56.
Anastasi, A. and Urbina, S. 1997Psychological Testing, Seventh edition, Upper Saddle River, New Jersey:Prentice-Hall.
Argyris, C. and Sch¨on, D. A. 1978Organizational Learning: A Theory of Action Perspective, Reading, Mas-sachusetts: Addison-Wesley.
Argyris, C. and Sch¨on, D. A. 1996Organizational Learning II: Theory, Method, and Practice, Reading, Mas-sachusetts: Addison-Wesley.
Bagozzi, R. P. 1996 Measurement in Marketing Research: Basic Principles of Questionnaire Design, in R. P.Bagozzi (Ed.),Principles of Marketing Research, Cambridge, Massachusetts: Blackwell, pp. 1–49.
Baruch, Y. 1999 Response Rate in Academic Studies—A Comparative Analysis,Human Relations, 52(4), 421–438.
Basili, V. R. 1996 The Role of Experimentation in Software Engineering: Past, Current, and Future,Proceedingsof the 18th International Conference on Software Engineering (ICSE-18), Berlin, Germany, March 25–29,pp. 442–449.
Basili, V. R. and Caldiera, G. 1995 Improve Software Quality by Reusing Knowledge and Experience,SloanManagement Review, 37, Autumn, pp. 55–64.
Basili, V. R. and Rombach, H. D. 1988 The TAME Project: Towards Improvement-Oriented Software Environ-ments,IEEE Transactions on Software Engineering, 14(6), 758–773.
Basili, V. R. and Selby, R. W. 1991 Paradigms for Experimentation and Empirical Studies in Software Engineering,Reliability Engineering and System Safety, 32(1–2), pp. 171–191.
Basili, V. R., Selby, R. W. and Hutchens, D. H. 1986 Experimentation in Software Engineering,IEEE Transactionson Software Engineering, 12(7), 733–743.
Black, S. A. and Porter, L. J. 1996 Identification of the Critical Factors of TQM,Decision Sciences, 27(1), 1–21.Blalock, H. M. 1969Theory Construction: From Verbal to Mathematical Formulations, Englewood Cliffs, N.J.:
Prentice-Hall.Carmines, E. G. and Zeller, R. A. 1979Reliability and Validity Assessment, Sage University Paper series on
Quantitative Applications in the Social Sciences, series no. 07-017, Newbury Park, CA: Sage.Cattell, R. B. 1966 The Scree Test for the Number of Factors,Multivariate Behavioral Research, 1, 245–276.

384 DYBÅ
Choo, C. W. 1995 The Knowing Organization: How Organizations Use Information to Construct Meaning CreateKnowledge and Make Decisions,International Journal of Information Management, 16(5), 329–340.
Choo, C. W. 1998The Knowing Organization: How Organizations Use Information to Construct Meaning, CreateKnowledge, and Make Decisions, New York: Oxford University Press.
Cliff, N. R. 1988 The Eigenvalues-greater-than-one Rule and the Reliability of Components,Psychological Bul-letin, 103, 276–279.
Cohen, J. 1988Statistical Power Analysis for the Behavioral Sciences, Second Edition, Hillsdale, New Jersey:Laurence Erlbaum.
Comrey, A. 1973A First Course on Factor Analysis, London: Academic Press.Cronbach, L. J. 1951 Coefficient Alpha and the Internal Consistency of Tests,Psychometrica, 16, 297–334,
September.Cronbach, L. J. 1971 Test Validation, inEducational Measurement, 2nd Edition, R. L. Thorndike (ed.), American
Council on Education, Washington, D.C, pp. 443–507.Crosby, P. B. 1979Quality is Free: The Art of Making Quality Certain, New York: McGraw-Hill.Crosby, P. B. 1984Quality Without Tears, New York: McGraw-Hill.Crosby, P. B. 1996Quality Is Still Free: Making Quality Certain in Uncertain Times, New York: McGraw-Hill.Davis, D. 1996Business Research for Decision Making, Fourth Edition, Belmont, California: Duxbury Press.Deming, W. E. 1982Quality, Productivity, and Competitive Position, Camebridge, Massachusetts: MIT Centre
for Advanced Engineering Study.Deming, W. E. 1986Out of the Crisis, Cambridge, Massachusetts: MIT Center for Advanced Engineering Study.Deephouse, C., Mukhopadhyay, T., Goldenson, D. R. and Kellner, M. I. 1996 Software Processes and Project
Performance,Journal of Management Information Systems, 12(3), 187–205.DeVellis, R. F. 1991Scale Development: Theory and Applications, Newbury Park, CA: Sage.Dyba, T. 2000a Improvisation in Small Software Organizations,IEEE Software, 17(5), Sept.-Oct.Dyba, T. (Ed.) 2000bSPIQ—Software Process Improvement for better Quality: Methodology Handbook, Version
3.0 (Final), IDI Report 2/2000, Norwegian University of Science and Technology, Trondheim, Norway (inNorwegian).
EFQM 1999The EFQM Excellence Model, Brussels: European Foundation for Quality Management.El Emam 1998 The Internal Consistency of the ISO/IEC 15504 Software Process Capability Scale,Proceedings
of the Fifth International Symposium on Software Metrics, IEEE Computer Society Press, pp. 72–81.El Emam, K. and Birk, A. 2000 Validating the ISO/IEC 15504 Measure of Software Requirements Analysis
Process Capability,IEEE Transactions on Software Engineering, 26(6), 541–566.El Emam, K. and Madhavji, N. H. 1995 The Reliability of Measuring Organizational Maturity,Software Process—
Improvement and Practice, 1, 3–25.El Emam, K. and Madhavji, N. H. 1996 An Instrument for Measuring the Success of the Requirements Engineering
Process in Information Systems Development,Empirical Software Engineering, 1(3), 201–240.El Emam, K., Fusaro, P. and Smith, B. 1999 Success Factors and Barriers for Software Process Improvement, in
R. Messnarz, and C. Tully (Eds.)Better Software Practice for Business Benefit: Principles and Experiences,Los Alamitos, California: IEEE Computer Society Press, pp. 355–371.
El Emam, K., Goldenson, D. R., McCurley J. and Herbsleb, J. 1998Success or Failure? Modeling the Likelihood ofSoftware Process Improvement, Technical Report, ISERN-98-15, International Software Engineering ResearchNetwork.
Feigenbaum, A. V. 1991Total Quality Control, Fortieth Anniversary Edition, New York: McGraw-Hill.Fink, A. and Kosecoff, J. 1998How to Conduct Surveys: A Step-By-Step Guide, Second Edition, Thousand Oaks,
California: Sage Publications.French, W. L. and Bell, C. H. Jr. 1999Organization Development: Behavioral Science Interventions for Organi-
zation Improvement, Sixth Edition, Upper Saddle River, New Jersey: Prentice-Hall.Fusaro, P., El Emam, K. and Smith, B. 1998 The Internal Consistency of the 1987 SEI Maturity Questionnaire
and the SPICE Capability Dimension,Empirical Software Engineering, 3(2), 179–201.Garvin, D. A. 1983 Quality on the Line,Harvard Business Review, 61(5), 65–75.Garvin, D. A. 1984 Japanese Quality Management,Columbia Journal of World Business, 19(3), 3–19.Garvin, D. A. 1993 Building a Learning Organization,Harvard Business Review, 71(4), 78–91.Goldenson, D. R. and Herbsleb, J. (1995)After the Appraisal: A Systematic Survey of Process Improvement,
its Benefits, and Factors that Influence Success, Technical Report, CMU/SEI-95-TR-009, Carnegie MellonUniversity, Software Engineering Institute.
Goldenson, D. R., El Emam, K., Herbsleb, J. and Deephouse, C. 1999 Empirical Studies of Software Process

AN INSTRUMENT FOR MEASURING THE KEY FACTORS OF SUCCESS IN SPI 385
Assessment Methods, in K. El Emam and N. H. Madhavji (Eds.),Elements of Software Process Assessment andImprovement, Los Alamitos, California: IEEE Computer Society Press, pp. 177–218.
Guilford, J. P. 1954Psychometric Methods, 2nd edition, New York: McGraw-Hill.Harrison, R., Badoo, N., Barry, E., Biffl, S., Parra, A., Winter, B. and Wuest, J. 1999 Directions and Methodologies
for Empirical Software Engineering Research,Empirical Software Engineering, 4(4), 405–410.Humphrey, W. S. 1989Managing the Software Process, Reading, Massachusetts: Addison-Wesley.Humphrey, W. S. 1997Managing Technical People: Innovation, Teamwork, and the Software Process, Reading,
Massachusetts: Addison-Wesley.Hunt, R. and Buzan, T. 1999Creating a Thinking Organization: Groundrules for Success, Hampshire, England:
Gower.Hunter, J. E. and Schmidt, F. L. 1990Methods of Meta-Analysis: Correcting Error and Bias in Research Findings,
Newbury Park, California: Sage Publications.Ishikawa, K. 1986Guide to Quality Control, Second Edition, New York: Quality Resources.Ishikawa, K. 1990Introduction to Quality Control, London: Chapman & Hall.ISO/DIS 9000 2000Quality Management Systems—Fundamentals and Vocabulary.ISO/DIS 9004 2000Quality Management Systems—Guidelines for Performance Improvements.ISO/IEC TR 15504-7 1998Information Technology—Software Process Assessment—Part 7: Guide for Use in
Process Improvement.Jeffery, D. R. and Votta, L. G. 1999 Guest Editor’s Special Section Introduction,IEEE Transactions on Software
Engineering, 25(4), 435–437.Juran, J. M. 1992Juran on Quality by Design: The New Steps for Planning Quality into Goods and Services, New
York: Free Press.Juran, J. M. and Godfrey, A. B. (Eds.) 1999Juran’s Quality Handbook, Fifth Edition, New York: McGraw-Hill.Kaiser, H. F. 1960 The Application of Electronic Computers to Factor Analysis,Educational and Psychological
Measurements, 20, 141–151.Kaiser, H. F. 1970 A Second Generation Little Jiffy,Psychometrika, 35, 401–417.Kanuk, L. and Berenson, C. 1975 Mail Surveys and Response Rates: A Literature Review,Journal of Marketing
Research, 12, 440–453.Kerlinger, F. 1986Foundations of Behavioral Research, Holt, Rinehart and Winston.Larsen, E. Å, and Kautz, K. 1997 Quality Assurance and Software Process Improvement in Norway,Software
Process—Improvement and Practice, 3(2), 71–86.Lawrence, P. R. and Lorsch, J. W. 1986Organization and Environment: Managing Differentiation and Integration,
2nd Edition, Boston: Harvard Business School Press.Likert, R. 1932 A Technique for the Measurement of Attitudes,Archives of Psychology, 22(140).Likert, R. 1967The Human Organization: Its Management and Value, New York: McGraw-Hill.Likert, R. and Roslow, S. 1934The Effects Upon the Reliability of Attitude Scales of Using Three, Five or Seven
Alternatives, Working Paper, New York University.Lissitz, R. W. and Green, S. B. 1975 Effects of the Number of Scale Points on Reliability: A Monte Carlo
Approach,Journal of Applied Psychology, 60, 10–13, February.March, J. G. 1991 Exploration and Exploitation in Organizational Learning,Organization Science, 2(1), 71–87.March, J. G. 1999The Pursuit of Organizational Intelligence, Malden, Massachusetts: Blackwell.Miller, G. A. 1956 The Magical Number Seven, Plus or Minus Two: Some Limits on Our Capacity for Processing
Information,Psychological Review, 63, 81–97.Neuman, W. L. 2000Social Research Methods: Qualitative and Quantitative Approaches, Fourth Edition, Boston:
Allyn and Bacon.Nevis, E. C., DiBella, A. J. and Gould, J. M. 1995 Understanding Organizations as Learning Systems,Sloan
Management Review, 37, 73–85.Nonaka, I. 1991 The Knowledge-Creating Company,Harvard Business Review, 69(6), 96–104.Nonaka, I. 1994 A Dynamic Theory of Organizational Knowledge Creation,Organization Science, 5(1), 14–37.Nonaka, I. and Takeuchi, H. 1995.The Knowledge-Creating Company: How Japanese Companies Create the
Dynamics of Innovation, New York: Oxford University Press.Novick, M. and Lewis, G. 1967 Coefficient Alpha and the Reliability of Composite Measurements,Psychometrika,
32, 1–13.Nunnally, J. C. 1978Psychometric Theory, Second edition, New York: McGraw-Hill.Nunnally, J. C. and Bernstein, I. A. 1994Psychometric Theory, Third edition, New York: McGraw-Hill.

386 DYBÅ
Powell, T. C. 1995 Total Quality Management as Competitive Advantage: A Review and Empirical Study,StrategicManagement Journal, 16, 15–37.
Rogers, E. M. 1995Diffusion of Innovations, Fourth Edition, New York: The Free Press.Sanders, M. (Ed.) 1998The SPIRE Handbook: Better, Faster, Cheaper Software Development in Small Organi-
sations, Dublin: Centre for Software Engineering Ltd.Saraph, J. V., Benson, P. G. and Schroeder, R. G. 1989. An Instrument for Measuring the Critical Factors of
Quality Management,Decision Sciences, 20(4), 810–829.Schaffer, R. H. and Thomson, H. A. 1992. Successful Change Programs Begin with Results,Harvard Business
Review, 70, 80–89.Senge, P. M. 1990The Fifth Discipline: The Art and Practice of the Learning Organization, New York: Doubleday.Senge, P. M., Kleiner, A., Roberts, C., Ross, R. and Smith, B. 1994The Fifth Discipline Fieldbook: Strategies
and Tools for Building a Learning Organization, New York: Currency/Doubleday.Senge, P. M., Kleiner, A., Roberts, C., Ross, R., Roth, G. and Smith, B. 1999The Dance of Change: The
Challenges of Sustaining Momentum in Learning Organizations, New York: Currency/Doubleday.Spector, P. 1992Summated Rating Scale Construction: An Introduction, Sage University Paper series on Quanti-
tative Applications in the Social Sciences, series no. 07-082, Newbury Park, CA: Sage.SPSS 1999aSPSS Base 9.0: User’s Guide, Chicago, IL: SPSS Inc.SPSS 1999bSPSS Base 9.0: Applications Guide, Chicago, IL: SPSS Inc.Stelzer, D. and Mellis, W. 1998 Success Factors of Organizational Change in Software Process Improvement,
Software Process—Improvement and Practice, 4(4), 227–250.Stelzer, D., Mellis, W. and Herzwurm, G. 1996 Software Process Improvement via ISO 9000? Results of Two
Surveys among European Software Houses,Proceedings of the 29th Hawaii International Conference on SystemsSciences, January 3–6, Wailea, Hawaii, USA.
Stevens, J. 1992Applied Multivariate Statistics for the Social Sciences, London: Lawrence Erlbaum.Straub, D. W. 1989 Validating Instruments in MIS Research,MIS Quarterly, 13(2), 147–169.Stalhane, T., Borgersen, P. C. and Arnesen, K. 1997 In Search of the Customer’s Quality View,Journal of Systems
Software, 38, 85–93.Saarinen, T. 1996 An Expanded Instrument for Evaluating Information System Success,Information & Manage-
ment, 31, 103–118.Taguchi, G. 1986Introduction to Quality Engineering: Designing Quality into Products and Processes, Tokyo:
Asian Productivity Organization.Taguchi, G., Elsayed, E. A. and Hsiang, T. C. 1989Quality Engineering in Production Systems, New York:
McGraw-Hill.Teng, J. T. C., Jeong, S. R. and Grover, V. 1998 Profiling Successful Reengineering Projects,Communications of
the ACM, 41(6), 96–102.Van de Ven, A. H. and Ferry, D. L. 1980Measuring and Assessing Organizations, New York: John Wiley & Sons.Winter, S. G. 1994 Organizing for Continuous Improvement: Evolutionary Theory Meets the Quality Revolution,
in J. A. C. Baum and J. Singh (Eds.)The Evolutionary Dynamics of Organizations, Oxford University Press.Yusof, S. M. and Aspinwall, E. 1999 Critical Success Factors for Total Quality Management Implementation in
Small and Medium Enterprises,Total Quality Management, 10(4&5), 803–809.Zahran, S. 1998Software Process Improvement: Practical Guidelines for Business Success, Harlow, England:
Addison-Wesley.Zwick, W. R. and Velicer, W. F. 1986 Comparison of Five Rules for Determining the Number of Components to
Retain,Psychological Bulletin, 99, 432–442.
Appendix A: Original List of Facilitating Factors and Indicators
The items marked by an asterisk (∗) were dropped after the expert review. Items markedby two asterisks (∗∗) were eventually deleted in order to improve the reliability of the finalinstrument.

AN INSTRUMENT FOR MEASURING THE KEY FACTORS OF SUCCESS IN SPI 387
Key Factors Potential Indicators
Business Orientation • amount of specific goals for SPI within thecompany*
• extent of goal-orientation in SPI activities• extent of long term planning of SPI activities∗• extent to which SPI goals and policy are
understood• degree of integrating SPI actions with “real” work• extent to which SPI goals are aligned with business
goals• thoroughness in the priority of improvement actions∗• degree of balance between short-term and long-term goals
Leadership Involvement • degree of participation by management in the SPIprocess
• acceptance of responsibility for SPI by management• extent to which top management has objectives for
software performance• degree to which top management is evaluated for
software performance*• degree to which management considers SPI as a way to
increase competitive advantage• amount of review of SPI issues in top management
meetings
Employee Participation • extent of employee involvement in decisions about whatshould best be done at their own level (co-determination)
• extent of employee participation in developmentplanning∗∗
• extent of developer participation in the formalization ofroutines
• extent to which employees contribute with improvementproposals
• extent of employee interaction with customers andsuppliers∗
• extent to which employees have responsibility for SPI• amount of training in SPI concepts∗• extent of developer participation in goal-setting, data-
analysis, and interpretation• extent of participatory management∗• extent of on-going dialogue and discussion about
software development• extent of on-going dialogue and discussion about SPI
Concern for Measurement• importance of measuring performance• availability of quality data (defects, timeliness, etc)• extent to which quality data are available to
developers• extent to which quality data are available to
managers• extent to which quality data, charts, etc. are
displayed in corridors etc∗• extent to which simple statistical tools are
used∗• amount of feedback provided to developers
on their performance

388 DYBÅ
Key Factors Potential Indicators
Exploitation of existing knowledge • extent to which existing knowledge is exploited• extent of learning from past experience• degree of elaboration of existing ideas,
strategies, and technologies∗• degree of systemization of past experience• importance of formulating experience into
explicit concepts∗• degree to which formal routines are based on
past experience• extent to which computerized organizational
memory are used∗• importance of narrow (specialized) skills∗• importance of maximum breakdown of task∗• extent of searching for stability∗• degree of internal experience transfer• extent of risk aversion∗∗
Experimentation • extent of exploration of new knowledge∗• degree of experimentation with new ideas,
strategies, and technologies• importance of exploring opportunities∗• extent to which innovation/change is encouraged• degree of learning from other organizations∗• extent to which risk taking is encouraged∗• importance of multiple broad skills∗• degree of adaptability to rapid change,
increasing complexity and environmental uncertainty• ability to question underlying values
Operational variety • importance of matching the variety and complexity ofthe organization’s environment
• extent of variety in the use of methods, techniques andtools
• extent to which diversity is appreciated∗• degree of detail in task specifications (minimum critical
specification)• degree of flexibility in task execution• importance of optimum variety in task performance∗• importance of optimum grouping of tasks∗
Appendix B: An Instrument for Measuring the Key Factors of Success in SoftwareProcess Improvement
Participants in the study were asked to mark or circle the best response to each statement onthe following 5-point scale: “Strongly disagree,” “Disagree,” “Neither agree nor disagree,”“Agree,” and “Strongly agree” for each of the following factors.
Business Orientation
1. We have established unambigous goals for the organization’s SPI activities.
2. There is a broad understanding of SPI goals and policy within our organization.

AN INSTRUMENT FOR MEASURING THE KEY FACTORS OF SUCCESS IN SPI 389
3. Our SPI activities are closely integrated with software development activities.
4. Our SPI goals are closely aligned with the organization’s business goals.
5. We have a fine balance between short-term and long-term SPI goals.
Leadership Involvement
6. Management is actively supporting SPI activities.
7. Management accepts responsibility for SPI.
8. Management considers SPI as a way to increase competitive advantage.
9. Management is actively participating in SPI activities.
10. SPI issues are often discussed in top management meetings.
Employee Participation
11. Software developers are involved to a great extent in decisions about the implementationof their own work.
12. Software developers are actively contributing with SPI proposals.
13. Software developers are actively involved in creating routines and procedures for soft-ware development.
14. We have an on-going dialogue and discussion about software development.
15. Software developers have responsibility related to the organization’s SPI activities.
16. Software developers are actively involved in setting goals for our SPI activities.
17. We have an on-going dialogue and discussion about SPI.
Concern for Measurement
18. We consider it as important to measure organizational performance.
19. We regularly collect quality data (e.g. defects, timeliness) from our projects.
20. Information on quality data is readily available to software developers.
21. Information on quality data is readily available to management.
22. We use quality data as a basis for SPI.
23. Our software projects get regular feedback on their performance.
Exploitation of Existing Knowledge
24. We exploit the existing organizational knowledge to the utmost extent.

390 DYBÅ
25. We are systematically learning from the experience of prior projects.
26. Our routines for software development are based on experience from prior projects.
27. We collect and classify experience from prior projects.
28. We put great emphasis on internal transfer of positive and negative experience.
29. To the extent we can avoid it, we do not take risks by experimenting with new ways ofworking.∗
Exploration of New Knowledge30. We are very capable at managing uncertainty in the organization’s environment.
31. In our organization, we encourage innovation and creativity.
32. We often carry out trials with new software engineering methods and tools.
33. We often conduct experiments with new ways of working with software development.
34. We have the ability to question “established” truths.
35. We are very flexible in the way we carry out our work.
36. We do not specify work processes more than what is absolutely necessary.
37. We make the most of the diversity in the developer’s skills and interests to manage thevariety and complexity of the organization’s environment.
Organizational Performance1. Our SPI work has substantially increased our software engineering competence.
2. Our SPI work has substantially improved our overall performance.
3. Over the past 3 years, we have greatly reduced the cost of software development.
4. Over the past 3 years, we have greatly reduced the cycle time of software development
5. Over the past 3 years, we have greatly increased our customer’s satisfaction.
Note:
∗ Starred items were removed from the final version of the instrument and should not be used.
Tore Dyba is a research scientist at Department of Computer Science at SINTEF (The Foundation for Scientificand Industrial Research at the Norwegian Institute of Technology). He is also a research fellow in computer scienceat the Norwegian University of Science and Technology working on a doctoral thesis investigating the key learningprocesses and factors for success in SPI. He received his M.Sc. in Computer Science from the Norwegian Instituteof Technology in 1986, and worked as a consultant both in Norway and in Saudi Arabia before he joined SINTEFin 1994. His current research interests include empirical software engineering, software process improvement,and organizational learning.