Embed Size (px)
Citation preview
An Intelligent Customer Care Assistant System for Large-ScaleCellular Network Diagnosis
Lujia Pan1, Jianfeng Zhang1, Patrick P. C. Lee2, Hong Cheng3, Cheng He1,Caifeng He1, Keli Zhang1
1Noah Ark’s Lab, Huawei Technologies2Department of Computer Science and Engineering, The Chinese University of Hong Kong
3Department of Systems Engineering and Engineering Management, The Chinese University of Hong Kong
ABSTRACTWith the advent of cellular network technologies, mobile Internetaccess becomes the norm in everyday life. In the meantime, thecomplaints made by subscribers about unsatisfactory cellular net-work access also become increasingly frequent. From a networkoperator’s perspective, achieving accurate and timely cellular net-work diagnosis about the causes of the complaints is critical forboth improving subscriber-perceived experience and maintainingnetwork robustness. We present the Intelligent Customer Care As-sistant (ICCA), a distributed fault classification system that exploitsa data-driven approach to perform large-scale cellular network di-agnosis. ICCA takes massive network data as input, and realizesboth offline model training and online feature computation to dis-tinguish between user and network faults in real time. ICCA iscurrently deployed in a metropolitan LTE network in China thatis serving around 50 million subscribers. We show via evaluationthat ICCA achieves high classification accuracy (85.3%) and fastquery response time (less than 2.3 seconds). We also report ourexperiences learned from the deployment.
CCS CONCEPTS•Information systems→ Data stream mining; •Networks→Network monitoring;
KEYWORDSFault classification; Sequential pattern mining; Cellular networkdiagnosis
1 INTRODUCTIONWith the advances of 3G and 4G cellular network technologies,we are witnessing the continuous growth of mobile data trafficworldwide [8]. By subscribing to a cellular carrier, users can usemobile devices (e.g., smartphones, tablets, or datacards) to accessdata services on the Internet anywhere and anytime through thecellular network. However, if they encounter any problem of ac-cessing the cellular network, such as network disconnection or slownetwork performance, they often call the customer service center
Permission to make digital or hard copies of all or part of this work for personal orclassroom use is granted without fee provided that copies are not made or distributedfor profit or commercial advantage and that copies bear this notice and the full citationon the first page. Copyrights for components of this work owned by others than ACMmust be honored. Abstracting with credit is permitted. To copy otherwise, or republish,to post on servers or to redistribute to lists, requires prior specific permission and/or afee. Request permissions from [email protected]’17, August 13--17, 2017, Halifax, NS, Canada.© 2017 ACM. 978-1-4503-4887-4/17/08. . .$15.00DOI: http://dx.doi.org/10.1145/3097983.3098120
to file complaints. A customer care assistant then needs to diagnosethe root cause of each received complaint, which can be classifiedas either a user fault or a network fault: a user fault is related to anyhardware or software problem of the subscriber’s mobile device(e.g., damages of phones or SIM card, incorrect phone configura-tions, malicious mobile apps, etc.), while a network fault is relatedto any failure in network elements (e.g., network hardware outagesor mis-configurations, weak coverage, signal interference, etc.). If itis classified as a user fault, the assistant will guide the complainingsubscriber step-by-step to resolve the problem, such as rebooting orreplacing the mobile device; if it is a network fault, the assistant willsubmit a trouble ticket to ask engineers to check network hardwareand localize and repair any failure or mis-configuration.
The scale of the complaints being processed by the customerservice center is overwhelming. As a case study, we consider acellular network in China that is currently serving around 50 mil-lion subscribers. Each day the customer service center receivesover a thousand of complaints regarding the unsatisfactory cellularnetwork access. Around 85% and 15% of the complaints are laterdiagnosed as user and network faults, respectively. According tothe statistics from network operators, a customer care assistantspends on average about two minutes to resolve a customer call; ifthe complaint is classified as a network fault, it will take anothertwo days to resolve.
From a network operator’s perspective, it is critical to diagnosecomplaints in an accurate and timely manner. Specifically, thispaper aims to address the following binary classification problem:Should a subscriber’s complaint be classified as a user fault or anetwork fault? Although the classification problem looks simple,providing an accurate and timely answer is critical for severalreasons: (1) it improves subscribers’ Quality-of-Experience (QoE)by correctly addressing their complaints; (2) it maintains networkdependability by quickly responding to any failure in networkelements; and (3) it saves unnecessary personnel hours of networkengineers to check falsely identified network faults.
Unfortunately, with the ever-growing volume and complexityof mobile data traffic we face today, achieving accurate and timelycellular network diagnosis becomes increasingly challenging. Tra-ditional diagnosis approaches heavily depend on human factors,including the experience and domain knowledge of customer careassistants as well as the information provided by subscribers whenthey file complaints. To improve both accuracy and efficiency ofdiagnosis, network operators have deployed an expert rule-based ap-proach, which pre-configures a set of rules defined by experts basedon their past experience to guide the diagnosis process. However,the rules still require manual configurations, need to be exhaustive,
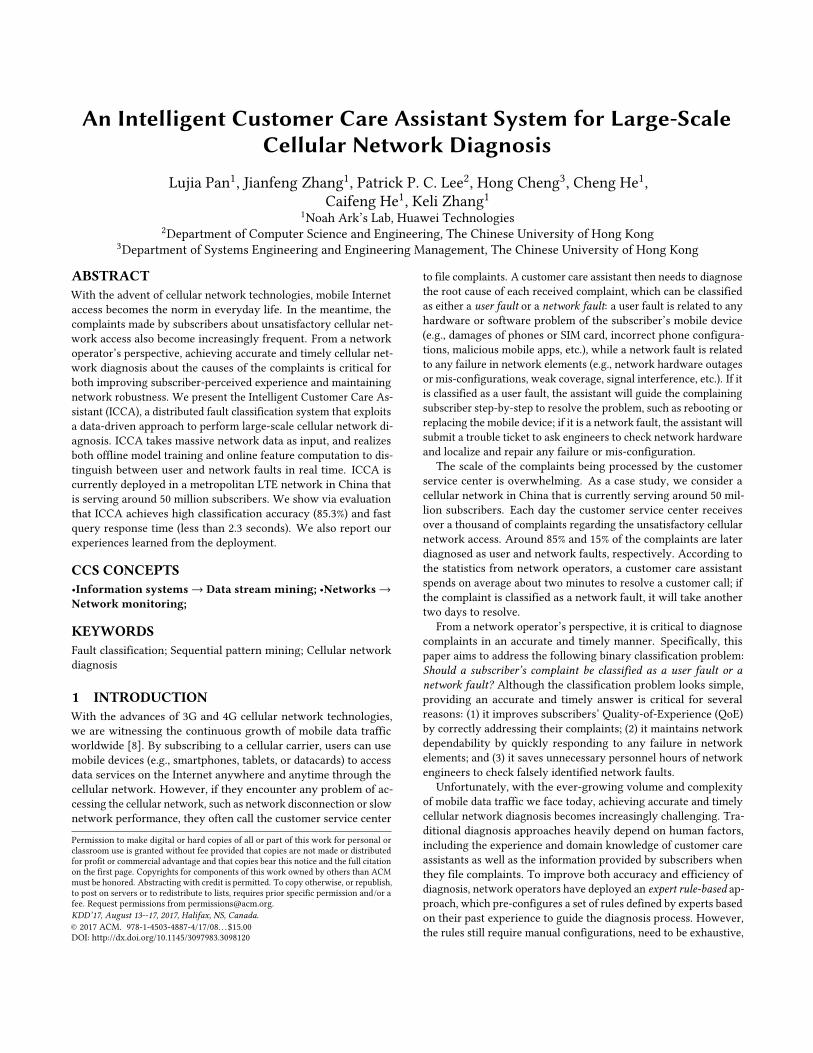
Ask many questions
Query expert rule-based system
User/network fault?
ICCA
Advice
Figure 1: Diagnosis workflow with ICCA.
and are difficult to adapt to the current network conditions. Clearly,minimizing the human factors in the diagnosis workflow will bebeneficial for network operators to manage cellular networks atscale.
This motivates us to take a data-driven approach, in which weanalyze the characteristics of massive network data to help ourdiagnosis. To this end, we aim for the following design goals forour diagnosis solution:• Compatibility with heterogeneous cellular network tech-
nologies: Today’s cellular networks serve a mix of cellular net-work technologies (e.g., 2G, 3G, 4G), each of which has differentsignaling protocols and signaling message formats. Our solu-tion should support heterogeneous types of input data for ouranalysis.
• Automatic feature engineering: Network data often has nopre-defined features, and its feature patterns vary over time.Our solution should automatically extract meaningful featurepatterns based on current input data.
• Accurate, real-time, and scalable analytics: Our solutionshould achieve high accuracy in our binary classification (e.g.,over 80%), achieve fast query response performance (e.g., in fewseconds), and scale to a large number of users (e.g., 50 millionsubscribers in the network we consider).In this paper, we design and implement Intelligent Customer
Care Assistant (ICCA), a distributed fault classification system thatperforms large-scale cellular network diagnosis. ICCA exploitsdata mining and machine learning techniques to analyze massivenetwork data spanning the entire cellular network and provideaccurate and timely answers towards subscribers’ complaints. Iteliminates the needs of customer care assistants to ask many ques-tions and query the expert rule-based system for answers (seeFigure 1).
To summarize, we make the following contributions.• We collect network data in a unified form called subscriber
records, which describe the details of both control-plane anddata-plane network data. Our analysis operates on subscriberrecords and is applicable for heterogeneous cellular networktechnologies.
• We formalize a fault classification model for ICCA, which buildson two types of features: (1) expert features, which are stat-ically defined by experts, and (2) sequential pattern features,which represent discriminative features with temporal depen-dency based on current network conditions and can be extractedby the model-based search tree (MbT) [10].
• We design and implement ICCA as a distributed architecturethat realizes both offline model training and online feature com-putation, so as to enable real-time fault classification betweenuser faults and network faults.
• ICCA is currently deployed in a metropolitan LTE network inChina that is serving around 50 million subscribers. Our eval-uation shows that ICCA achieves a classification accuracy of85.3% and a query response time of less than 2.3 seconds, and itoutperforms the traditional expert rule-based approach.
• We report our experiences learned from our deployment andprovide insights into large-scale cellular network diagnosis.
The remainder of this paper proceeds as follows. Section 2 de-scribes our data collection methodology. Section 3 formalizes thefault classification problem. Section 4 describes our feature en-gineering approach. Section 5 presents the design of ICCA. Sec-tion 6 presents evaluation results. Section 7 summarizes our lessonslearned from our deployment. Section 8 reviews related work, andfinally, Section 9 concludes the paper.
2 DATA COLLECTIONOur study targets a production LTE network in a metropolitan areain China that is serving around 50 million subscribers. We use thisnetwork to motivate the design of ICCA, yet our methodology isapplicable for general cellular networks. In this section, we firstprovide a general overview of an LTE network architecture, andthen describe the format of the data for our analysis.
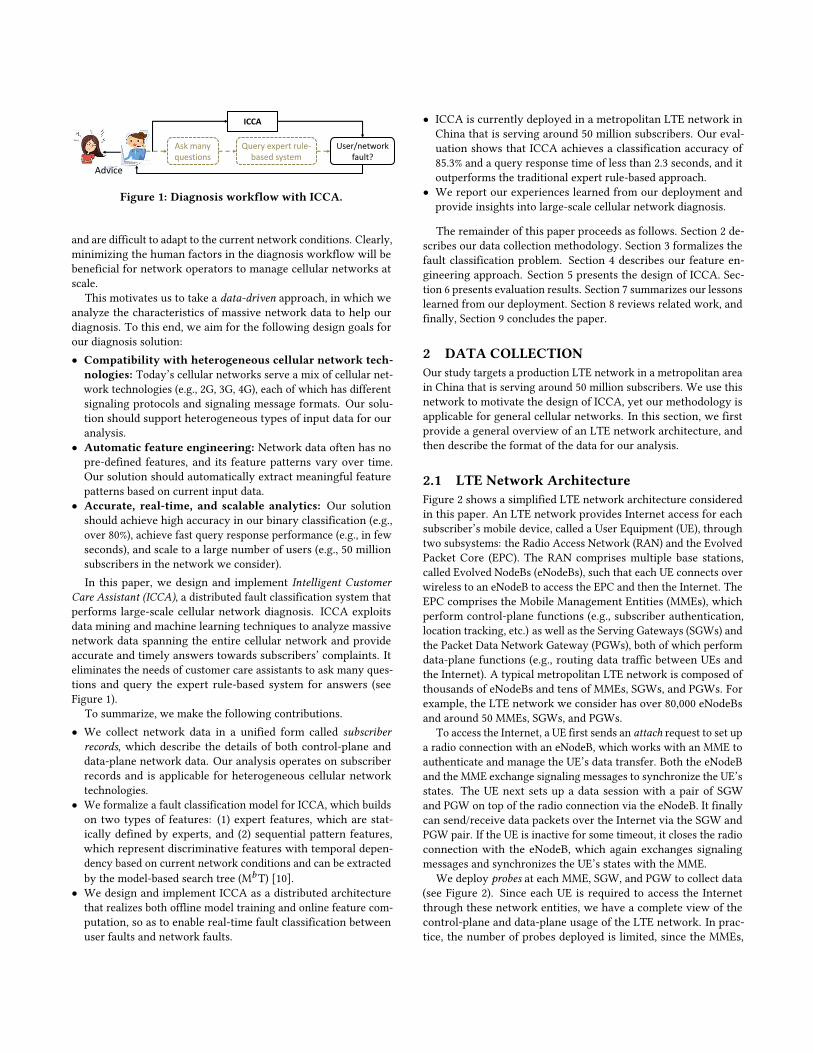
2.1 LTE Network ArchitectureFigure 2 shows a simplified LTE network architecture consideredin this paper. An LTE network provides Internet access for eachsubscriber’s mobile device, called a User Equipment (UE), throughtwo subsystems: the Radio Access Network (RAN) and the EvolvedPacket Core (EPC). The RAN comprises multiple base stations,called Evolved NodeBs (eNodeBs), such that each UE connects overwireless to an eNodeB to access the EPC and then the Internet. TheEPC comprises the Mobile Management Entities (MMEs), whichperform control-plane functions (e.g., subscriber authentication,location tracking, etc.) as well as the Serving Gateways (SGWs) andthe Packet Data Network Gateway (PGWs), both of which performdata-plane functions (e.g., routing data traffic between UEs andthe Internet). A typical metropolitan LTE network is composed ofthousands of eNodeBs and tens of MMEs, SGWs, and PGWs. Forexample, the LTE network we consider has over 80,000 eNodeBsand around 50 MMEs, SGWs, and PGWs.
To access the Internet, a UE first sends an attach request to set upa radio connection with an eNodeB, which works with an MME toauthenticate and manage the UE’s data transfer. Both the eNodeBand the MME exchange signaling messages to synchronize the UE’sstates. The UE next sets up a data session with a pair of SGWand PGW on top of the radio connection via the eNodeB. It finallycan send/receive data packets over the Internet via the SGW andPGW pair. If the UE is inactive for some timeout, it closes the radioconnection with the eNodeB, which again exchanges signalingmessages and synchronizes the UE’s states with the MME.
We deploy probes at each MME, SGW, and PGW to collect data(see Figure 2). Since each UE is required to access the Internetthrough these network entities, we have a complete view of thecontrol-plane and data-plane usage of the LTE network. In prac-tice, the number of probes deployed is limited, since the MMEs,
probes
MME
SGW/PGW Internet
eNodeBUE
RAN
EPC
Figure 2: Simplified LTE network architecture.
SGWs, and PGWs are often connected by a small number of net-work switches. We can deploy a probe per switch and let eachprobe monitor multiple network entities traversing the switch.Note that the probes do not reveal sensitive information, such aspayloads and subscriber identity information, and they return aunique anonymized subscriber ID to identify each subscriber.
2.2 Subscriber RecordsLTE mainly targets the latest 4G cellular technology. Note thatwhile an LTE network supports 4G connectivity, it can also fallback to legacy 2G/3G connectivity if 4G connectivity performanceis poor. Thus, we must have a unified format for our collected dataso that our analysis works for heterogeneous cellular technologies.
We collect data from the probes in the form of subscriber records,which capture the statistics of signaling and data sessions betweenUEs and the Internet at the granularity of individual subscribers.Each subscriber record is keyed by the subscriber ID, and is attachedwith the timestamp when the record is collected by the probes. Weclassify subscriber records into two categories: control-plane anddata-plane.
The probe at eachMME collects control-plane subscriber records,which store the key fields of signaling messages, such as radioconnection start/stop times, signaling message type, radio accesstypes (e.g., 2G/3G/4G), and error codes regarding radio connections.Note that there are hundreds of fields across different types ofsignaling messages. The probe only extracts around 30 of them forour analysis. Each signaling message will trigger a control-planesubscriber record.
The probe at each SGW/PGW collects data-plane subscriberrecords, which collect metrics of each subscriber’s data transfer,such as uplink/downlink throughput, number of retransmissions,TCP connection times, and error codes regarding data sessions. Thedata-plane subscriber records are periodically collected (currentlyat 5-minute intervals), and their metrics are the aggregate statisticssince the last collection time.
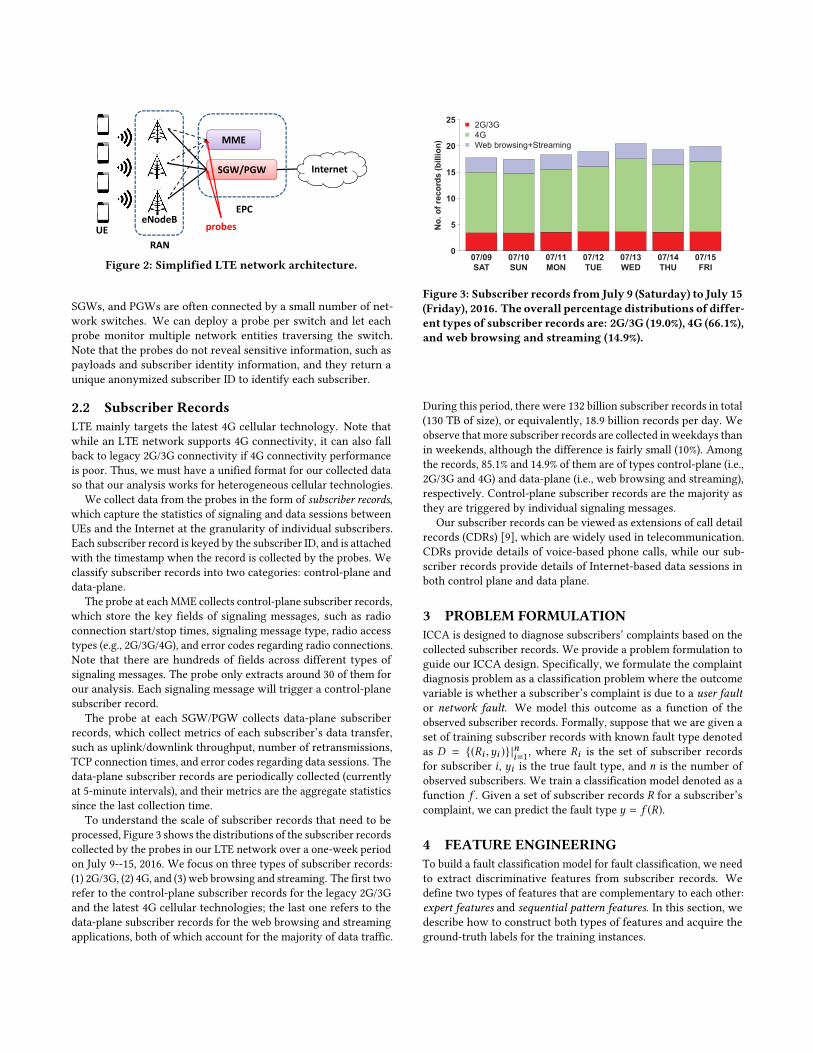
To understand the scale of subscriber records that need to beprocessed, Figure 3 shows the distributions of the subscriber recordscollected by the probes in our LTE network over a one-week periodon July 9--15, 2016. We focus on three types of subscriber records:(1) 2G/3G, (2) 4G, and (3) web browsing and streaming. The first tworefer to the control-plane subscriber records for the legacy 2G/3Gand the latest 4G cellular technologies; the last one refers to thedata-plane subscriber records for the web browsing and streamingapplications, both of which account for the majority of data traffic.
0
5
10
15
20
25
07/09
SAT
07/10
SUN
07/11
MON
07/12
TUE
07/13
WED
07/14
THU
07/15
FRI
No
. o
f re
co
rds (
bil
lio
n)
2G/3G
4G
Web browsing+Streaming
Figure 3: Subscriber records from July 9 (Saturday) to July 15(Friday), 2016. The overall percentage distributions of differ-ent types of subscriber records are: 2G/3G (19.0%), 4G (66.1%),and web browsing and streaming (14.9%).
During this period, there were 132 billion subscriber records in total(130 TB of size), or equivalently, 18.9 billion records per day. Weobserve that more subscriber records are collected in weekdays thanin weekends, although the difference is fairly small (10%). Amongthe records, 85.1% and 14.9% of them are of types control-plane (i.e.,2G/3G and 4G) and data-plane (i.e., web browsing and streaming),respectively. Control-plane subscriber records are the majority asthey are triggered by individual signaling messages.
Our subscriber records can be viewed as extensions of call detailrecords (CDRs) [9], which are widely used in telecommunication.CDRs provide details of voice-based phone calls, while our sub-scriber records provide details of Internet-based data sessions inboth control plane and data plane.
3 PROBLEM FORMULATIONICCA is designed to diagnose subscribers’ complaints based on thecollected subscriber records. We provide a problem formulation toguide our ICCA design. Specifically, we formulate the complaintdiagnosis problem as a classification problem where the outcomevariable is whether a subscriber’s complaint is due to a user faultor network fault. We model this outcome as a function of theobserved subscriber records. Formally, suppose that we are given aset of training subscriber records with known fault type denotedas D = {(Ri ,yi )}|ni=1, where Ri is the set of subscriber recordsfor subscriber i , yi is the true fault type, and n is the number ofobserved subscribers. We train a classification model denoted as afunction f . Given a set of subscriber records R for a subscriber’scomplaint, we can predict the fault type y = f (R).
4 FEATURE ENGINEERINGTo build a fault classification model for fault classification, we needto extract discriminative features from subscriber records. Wedefine two types of features that are complementary to each other:expert features and sequential pattern features. In this section, wedescribe how to construct both types of features and acquire theground-truth labels for the training instances.
4.1 Expert FeaturesExpert features are defined by experts based on their domain knowl-edge, expert rules, and 3GPP specifications [1]. For each complaintfiled by a subscriber, we define 164 expert features from subscriberrecords (both control-plane and data-plane) keyed by the subscriberID. Each feature value can be either numerical (discrete or continu-ous) or categorical. We classify the expert features into four groups,whose examples are shown in Table 1:• General: It describes a subscriber’s profile and usage behaviors
(e.g., whether the subscriber has restarted a phone or not). Itreveals key information about a user fault, such as phone misuseor service-level agreement issues.
• Signaling: It describes the features of signaling messages asso-ciated with the subscriber. For example, a high number of attachfailures (i.e., a UE fails to set up a radio connection with an eN-odeB) may indicate poor network coverage around the region inwhich the subscriber is located; the error code contained in thesignaling operation is useful to classify a network fault as it mayindicate a failure of connecting to the cellular network.
• Web browsing: It describes the performance of web browsingapplications perceived by a subscriber. For example, the pageresponse delay provides an indicator of web browsing perfor-mance. If the page response delay is significantly high (e.g., onthe order of seconds), it is more likely to be caused by a networkfault rather than a user fault.
• Streaming: It describes the performance of streaming applica-tions perceived by a subscriber.When a subscriber files a complaint, we extract the expert fea-
tures from the subscriber records keyed by the subscriber ID thatare within a time window before the complaint time. A long timewindow retrieves more features and hence improves classificationaccuracy, but needs more memory space for storing and processingthe features. Currently, we set the default time window as threehours.
Expert features aim to capture the most common cellular net-work usage patterns of subscribers. For example, mobile traffic isdominated by web browsing and streaming applications, so expertfeatures only focus on them and exclude other applications. Onthe other hand, since expert features are defined by human ex-perts, they are static by nature and cannot readily adapt to currentnetwork conditions.
4.2 Sequential Pattern FeaturesSequential pattern features aim to capture the dynamic patterns ofnetwork usage by subscribers. For example, expert features cannotcapture the detailed interaction process between the network anda subscriber in the form of a sequence of signaling messages. If weconsider a subscriber’s signaling messages in sequential order, wemay discover some anomalous signaling information with temporaldependency, which is indicative of a user fault or network fault.This kind of temporal information can be modeled as sequentialpatterns, which can be extracted to form classification features.
Thus, we propose to extract sequential patterns from the sig-naling message sequences. Specifically, we select three key fieldsfrom control-plane subscriber records: signaling message type,succeed flag, and radio access type. We denote them as a set
Table 1: Examples of expert features.
Types Examples
GeneralDid the subscriber restart his phone before?Does the subscriber use 4G?Does the subscriber use streaming services with 2G?
Signaling
Number of attach messagesNumber of attach failuresNumber of handoversError code of a signaling message
Web browsingNumber of out-of-sequence packetsConnection timePage response delay
StreamingNumber of retransmission packetsAverage number of pausesAverage number of stalls
I = {i1, i2, i3}. As an example, I={UE-triggered attach request,succeed, 4G} means that a user launched a successful attach re-quest with 4G connectivity. Similar to expert features, we col-lect the control-plane subscriber records that are within threehours before the subscriber’s complaint time, and form a sequenceS = 〈(I1, t1), (I2, t2), . . . , (Ik , tk )〉, where Ik is the set of the threeselected key fields at time tk , and t1 < t2 < . . . < tk .
From the sequence data collection for training, we mine discrim-inative sequential pattern features which can help classify the faulttype. A sequential pattern is discriminative if it appears in manysubscriber sequences from one class, but is very rare in subscribersequences from the other class. We can measure the discriminativedegree of a sequential pattern, for example, by information gain.Consider the following pattern as an example: P=〈{UE-triggeredattach request, succeed, 4G}, {Cell update, succeed, 4G}, {Network-triggered routing modification, succeed, 2G}〉. It means that a userfirst successfully requested the service with 4G connectivity, butthen the network side updated the cell connectivity and caused thenext signaling message to show routing information changes and afall-back to 2G connectivity. This sequential pattern shows that thesubscriber’s connectivity changed from 4G to 2G over time, whichindicates a network congestion problem that caused the fall-back.We find that this pattern appears in 38% of all network fault in-stances while only 6% of all user fault instances. Thus, it can beviewed as a discriminative feature of the network fault.
PrefixSpan [21] is a widely used algorithm for mining frequentsequential patterns in the literature. However, for mining discrimi-native sequential patterns, we cannot simply apply PrefixSpan onthe training subscriber sequences. This is because a discriminativesequential patternmay not have a high frequency in the whole train-ing set, whereas many frequent sequential patterns discovered byPrefixSpan are not discriminative. If we set the minimum supportthreshold very low in PrefixSpan in order not to miss the discrimi-native patterns, the mining process may be very long and producean explosive set of frequent patterns. To overcome this problem,we adopt the model-based search tree (MbT) [10], which takes atop-down data partition approach and integrates frequent patternmining and feature selection into a unified decision-tree-basedframework. The MbT procedure starts with the whole training
sequence set and mines a set of frequent sequential patterns fromthe data using PrefixSpan. The best sequential pattern is selectedaccording to information gain and used to divide the training setinto two subsets, one containing this sequential pattern and theother not. The mining and pattern selection procedure is repeatedon each of the subsets until the subset is small enough or the exam-ples in the subset have the same class label. After the procedurecompletes, a small set of discriminative sequential pattern features,i.e., the best feature selected at each node of the model-based searchtree, are discovered. Due to its ‘‘divide-and-conquer” nature, MbTcan efficiently discover discriminative features even with very lowsupport, but not overwhelm the mining process or the result set.
4.3 Feature Vector RepresentationGiven the set of extracted expert features and sequential patternfeatures, we transform the training subscriber records into thefeature vector representation, where each feature corresponds toa dimension in the feature vector. Specifically, for each expertfeature, we compute the feature value from a set of subscriberrecords of a subscriber; for each sequential pattern feature, thefeature value is 1 if the subscriber sequence contains the pattern,and 0 otherwise. The training set is thus transformed to the featurevector representation {(xi ,yi )}|ni=1, where xi is the feature vectorfor the set of subscriber records Ri for subscriber i , yi is the classlabel, and n is the number of observed subscribers.
4.4 Ground-Truth Label AcquisitionWe have two ways to acquire the ground-truth labels for the train-ing instances. First, network engineers, after receiving a troubleticket, check the network entities as depicted in Figure 2 and iden-tify the fault type, which in turn can be treated as the ground-truthlabel. Second, customer care assistants conduct feedback surveysby calling back complaining subscribers, whose responses can beused as the ground-truth labels as well.
5 ICCA DESIGNIn this section, we present the design details of the overall ICCAarchitecture and each of its components. The main idea of ICCA isto combine offline model training and online feature computationto achieve real-time fault classification. We demonstrate how ICCAprocesses subscriber records and preforms feature engineering in ascalable and real-time manner.
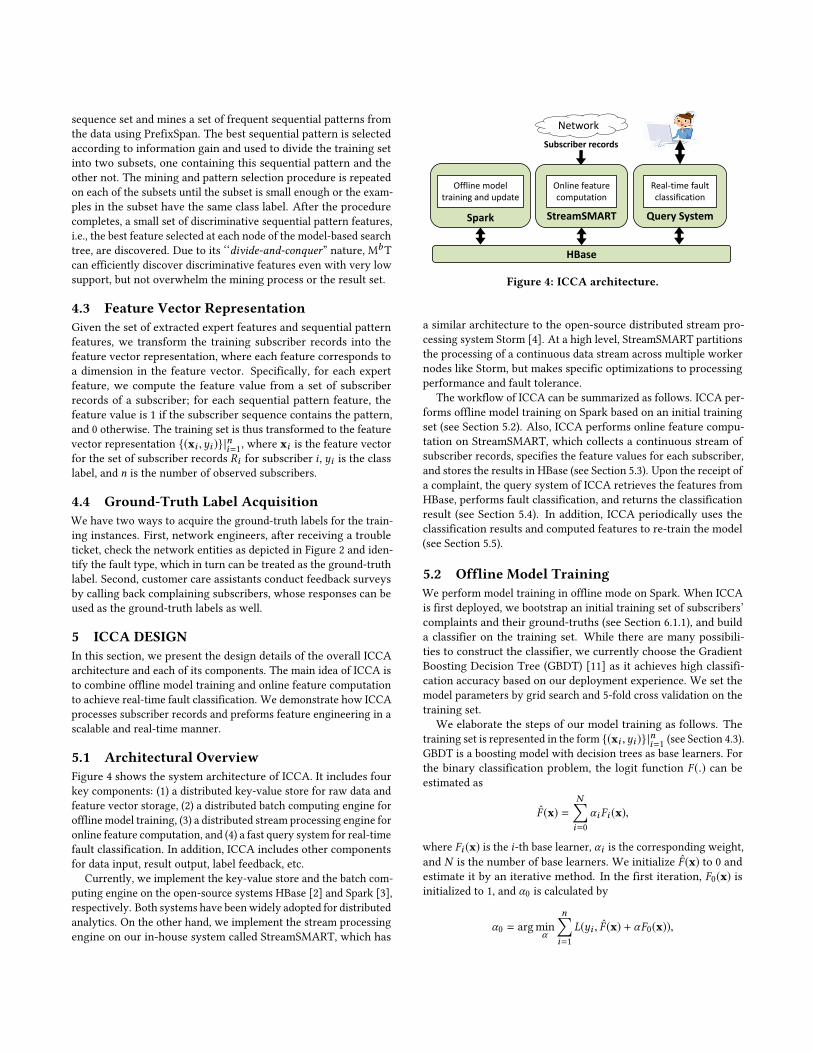
5.1 Architectural OverviewFigure 4 shows the system architecture of ICCA. It includes fourkey components: (1) a distributed key-value store for raw data andfeature vector storage, (2) a distributed batch computing engine foroffline model training, (3) a distributed stream processing engine foronline feature computation, and (4) a fast query system for real-timefault classification. In addition, ICCA includes other componentsfor data input, result output, label feedback, etc.
Currently, we implement the key-value store and the batch com-puting engine on the open-source systems HBase [2] and Spark [3],respectively. Both systems have beenwidely adopted for distributedanalytics. On the other hand, we implement the stream processingengine on our in-house system called StreamSMART, which has
Query System
HBase
Real-time fault classification
Network
StreamSMART
Online feature computation
Spark
Offline model training and update
Subscriber records
Figure 4: ICCA architecture.
a similar architecture to the open-source distributed stream pro-cessing system Storm [4]. At a high level, StreamSMART partitionsthe processing of a continuous data stream across multiple workernodes like Storm, but makes specific optimizations to processingperformance and fault tolerance.
The workflow of ICCA can be summarized as follows. ICCA per-forms offline model training on Spark based on an initial trainingset (see Section 5.2). Also, ICCA performs online feature compu-tation on StreamSMART, which collects a continuous stream ofsubscriber records, specifies the feature values for each subscriber,and stores the results in HBase (see Section 5.3). Upon the receipt ofa complaint, the query system of ICCA retrieves the features fromHBase, performs fault classification, and returns the classificationresult (see Section 5.4). In addition, ICCA periodically uses theclassification results and computed features to re-train the model(see Section 5.5).
5.2 Offline Model TrainingWe perform model training in offline mode on Spark. When ICCAis first deployed, we bootstrap an initial training set of subscribers’complaints and their ground-truths (see Section 6.1.1), and builda classifier on the training set. While there are many possibili-ties to construct the classifier, we currently choose the GradientBoosting Decision Tree (GBDT) [11] as it achieves high classifi-cation accuracy based on our deployment experience. We set themodel parameters by grid search and 5-fold cross validation on thetraining set.
We elaborate the steps of our model training as follows. Thetraining set is represented in the form {(xi ,yi )}|ni=1 (see Section 4.3).GBDT is a boosting model with decision trees as base learners. Forthe binary classification problem, the logit function F (.) can beestimated as
F̂ (x) =N∑i=0
αiFi (x),
where Fi (x) is the i-th base learner, αi is the corresponding weight,and N is the number of base learners. We initialize F̂ (x) to 0 andestimate it by an iterative method. In the first iteration, F0(x) isinitialized to 1, and α0 is calculated by
α0 = argminα
n∑i=1
L(yi , F̂ (x) + αF0(x)),
where L is a pre-defined loss function. Then F̂ (x) is updated asF̂ (x) ← F̂ (x)+α0F0(x) and the pseudo-residual or gradient of eachtraining instance is calculated by ri = − ∂L(yi ,F (xi ))
∂F (xi ) |F (xi )=F̂ (xi ). Inthe second iteration, the next base learner F1(x) is trained in data{(xi , ri )}|ni=1 using the decision tree model with the pre-definedmodel parameters. α1 is calculated in the same way as α0. Then weupdate F̂ (x) ← F̂ (x)+α1F1(x), and calculate the gradient ri of eachtraining instance similarly as above. We repeat this process until thenumber of decision trees is greater than N . In our implementation,the classifier is defined as f (x) = sign(F̂ (x) − c), where c is athreshold.
5.3 Online Feature ComputationThe probes at the cellular network continuously generate subscriberrecords that are streamed into ICCA via StreamSMART. One chal-lenge is that we do not know in advance which subscriber willfile complaints. Thus, we choose to compute feature values forall observed subscribers based on the input subscriber records andstore the computed feature values in HBase. This offloads the querysystem, which now simply leverages the computed feature valuesfor a given complaining subscriber and returns the classificationresult (see Section 5.4). Currently, StreamSMART distributes theprocessing of subscriber records by hashing a subscriber ID to oneof the worker nodes; how to more evenly distribute the workloadacross worker nodes is subject to future work.
StreamSMART computes the values of both expert featuresand sequential pattern features. For expert features, we computetheir feature values from subscriber records in discrete time inter-vals. Here, we set a one-minute time window to collect subscriberrecords, and compute the expert feature values from the subscriberrecords. The calculated feature values are then stored in HBasekeyed by the subscriber ID at the one-minute granularity. For thesequential pattern features, since they are mined from the trainingsequences within a three-hour time window of a complaint, wealso use a three-hour sliding time window to collect the incomingsubscriber records for pattern matching. For any sequence in thesliding window, if it contains a sequential pattern, the feature valueis set to 1. The feature values for the sequential pattern features arealso stored in HBase for efficient retrieval. Furthermore, the rawsubscriber records are stored in HBase as well for periodic modelupdate (see Section 5.5).
Since we compute the features for all observed subscribers, thestorage space for the features in HBase can grow significantly large.Thus, we regularly remove the outdated data of a subscriber ifit is not associated with any complaint to reclaim storage space.Currently, we perform the removal on a daily basis.
5.4 Real-Time Fault ClassificationWhen a subscriber files a complaint, a customer care assistant canissue a request to the query system of ICCA, which immediatelyretrieves the slices of feature vectors keyed by the subscriber ID forthe past three hours from HBase. The slices of feature vectors arecombined into one feature vector by the logic ‘‘OR” operator. Thenthe query system applies the classification model on the featurevector and predicts the fault type. The predicted fault type is thenreturned to the customer care assistant to help handle the subscriber
complaint. ICCA currently can handle 800 concurrent subscribers’complaints in less than 2.3 seconds (see Section 6.2).
5.5 Pattern and Model UpdateICCA updates the sequential pattern features and classificationmodel periodically on Spark, so as to adapt to the dynamic changesof subscribers’ network access behaviors and network conditions.Whenever some latest complaints have been properly handled andthe true fault types have been identified, the corresponding sub-scriber records are retrieved from HBase and treated as additionaltraining instances. On the enriched training set, ICCA performssequential pattern mining to update the sequential pattern features.The stored feature vectors in HBase are updated with the new se-quential pattern features. ICCA re-builds the classification modelbased on the new features and the enriched training set.
5.6 DeploymentWe have deployed ICCA in a metropolitan LTE network in Chinasince December 2016. ICCA currently runs on a cluster of 10commodity rack servers, each of which has two Intel Xeon E5-2450 2.1 GHz CPUs and 256 GB RAM. Each server runs in hyper-threading mode, and has 32 logical CPU cores in total. All serversare interconnected by a 10Gb/s network. We deploy Spark, StreamS-MART, and HBase in full distributed mode across all servers, anddeploy the query system on one of the servers. Such a deploymentsetting enables ICCA to process billions of subscriber records (seeSection 2.2).
6 EVALUATIONIn this section, we present evaluation results of ICCA. We compareICCAwith the traditional expert rule-based approach (see Section 1)in terms of classification accuracy and query performance.
6.1 Classification Accuracy6.1.1 E�ects of Features. We first study the classification accu-
racy due to expert features, sequential pattern features, and thecombination of both. To build the ground truths, we have collected3,458 subscribers’ complaints during December 2015 to July 2016.We obtain their ground-truth labels from network operators as thetraining set. We construct 164 expert features (see Section 4.1) andaround 350 sequential pattern features from the training set, andtrain the ensemble classifier using GBDT (see Section 5.2). We usegrid search and 5-fold cross validation to find the best parametersfor GBDT such that the accuracy is maximized.
We evaluate the classification accuracy of different types offeatures using 5-fold cross validation and the area under curve(AUC) as the metric. Table 2 shows the results of five runs in 5-fold cross validation. We observe that both expert features andsequential pattern features have comparable classification accuracy(0.791 and 0.795, respectively). Recall that expert features coverover a hundred of fields, while sequential pattern features onlycover three fields. Although expert features cover significantlymore fields, they are statically defined by experts based on domainknowledge. On the other hand, sequential pattern features are moreadaptive to the current network conditions as they are extracted bythe MbT algorithm on-the-fly. Nevertheless, the combined features
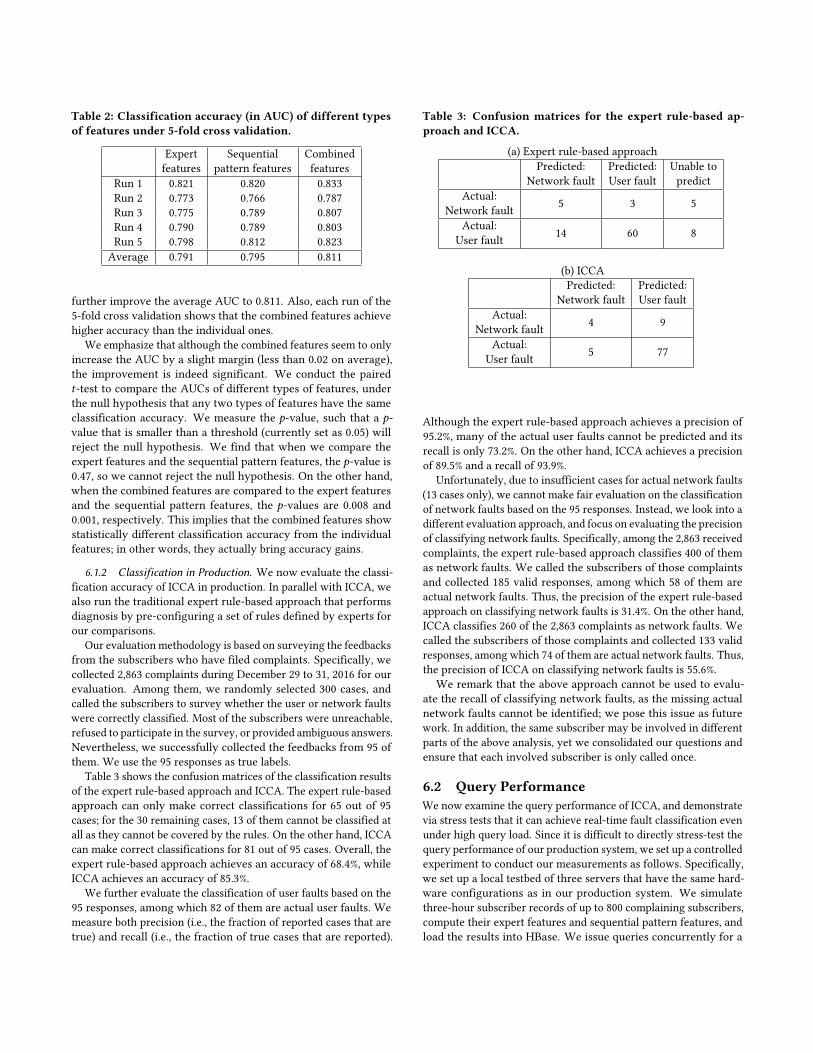
Table 2: Classification accuracy (in AUC) of different typesof features under 5-fold cross validation.
Expert Sequential Combinedfeatures pattern features features
Run 1 0.821 0.820 0.833Run 2 0.773 0.766 0.787Run 3 0.775 0.789 0.807Run 4 0.790 0.789 0.803Run 5 0.798 0.812 0.823
Average 0.791 0.795 0.811
further improve the average AUC to 0.811. Also, each run of the5-fold cross validation shows that the combined features achievehigher accuracy than the individual ones.
We emphasize that although the combined features seem to onlyincrease the AUC by a slight margin (less than 0.02 on average),the improvement is indeed significant. We conduct the pairedt-test to compare the AUCs of different types of features, underthe null hypothesis that any two types of features have the sameclassification accuracy. We measure the p-value, such that a p-value that is smaller than a threshold (currently set as 0.05) willreject the null hypothesis. We find that when we compare theexpert features and the sequential pattern features, the p-value is0.47, so we cannot reject the null hypothesis. On the other hand,when the combined features are compared to the expert featuresand the sequential pattern features, the p-values are 0.008 and0.001, respectively. This implies that the combined features showstatistically different classification accuracy from the individualfeatures; in other words, they actually bring accuracy gains.
6.1.2 Classification in Production. We now evaluate the classi-fication accuracy of ICCA in production. In parallel with ICCA, wealso run the traditional expert rule-based approach that performsdiagnosis by pre-configuring a set of rules defined by experts forour comparisons.
Our evaluation methodology is based on surveying the feedbacksfrom the subscribers who have filed complaints. Specifically, wecollected 2,863 complaints during December 29 to 31, 2016 for ourevaluation. Among them, we randomly selected 300 cases, andcalled the subscribers to survey whether the user or network faultswere correctly classified. Most of the subscribers were unreachable,refused to participate in the survey, or provided ambiguous answers.Nevertheless, we successfully collected the feedbacks from 95 ofthem. We use the 95 responses as true labels.
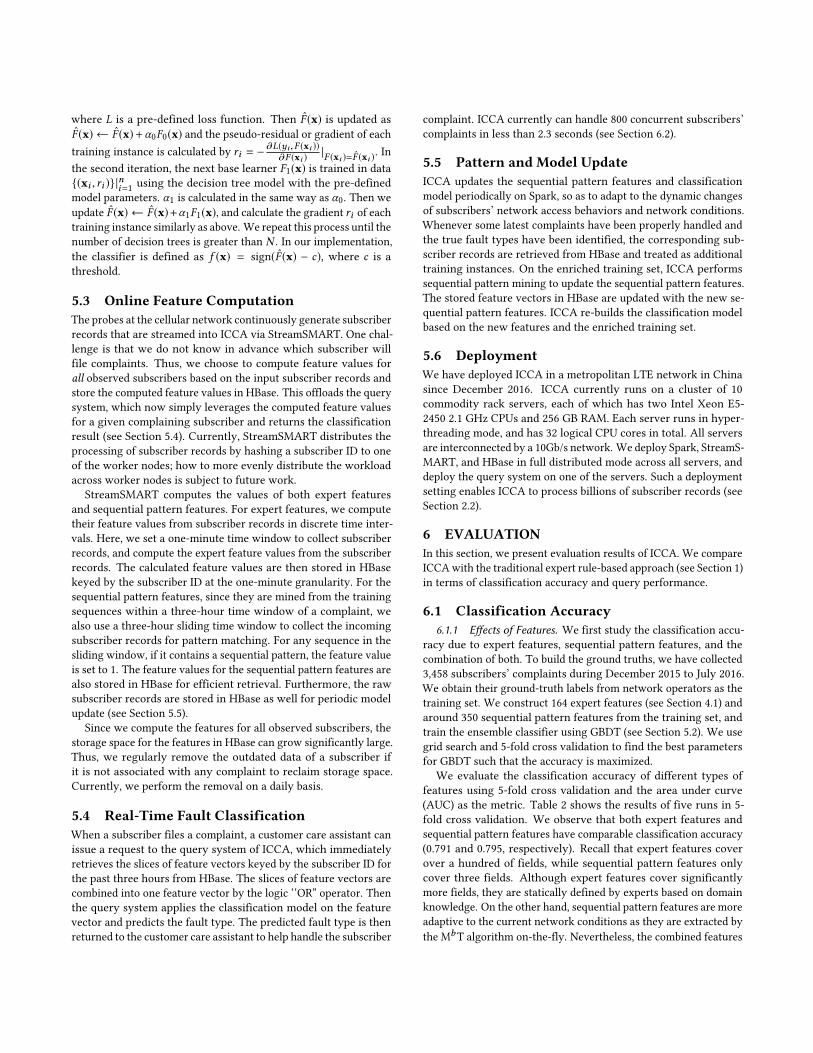
Table 3 shows the confusion matrices of the classification resultsof the expert rule-based approach and ICCA. The expert rule-basedapproach can only make correct classifications for 65 out of 95cases; for the 30 remaining cases, 13 of them cannot be classified atall as they cannot be covered by the rules. On the other hand, ICCAcan make correct classifications for 81 out of 95 cases. Overall, theexpert rule-based approach achieves an accuracy of 68.4%, whileICCA achieves an accuracy of 85.3%.
We further evaluate the classification of user faults based on the95 responses, among which 82 of them are actual user faults. Wemeasure both precision (i.e., the fraction of reported cases that aretrue) and recall (i.e., the fraction of true cases that are reported).
Table 3: Confusion matrices for the expert rule-based ap-proach and ICCA.
(a) Expert rule-based approachPredicted:
Network faultPredicted:User fault
Unable topredict
Actual:Network fault 5 3 5
Actual:User fault 14 60 8
(b) ICCAPredicted:
Network faultPredicted:User fault
Actual:Network fault 4 9
Actual:User fault 5 77
Although the expert rule-based approach achieves a precision of95.2%, many of the actual user faults cannot be predicted and itsrecall is only 73.2%. On the other hand, ICCA achieves a precisionof 89.5% and a recall of 93.9%.
Unfortunately, due to insufficient cases for actual network faults(13 cases only), we cannot make fair evaluation on the classificationof network faults based on the 95 responses. Instead, we look into adifferent evaluation approach, and focus on evaluating the precisionof classifying network faults. Specifically, among the 2,863 receivedcomplaints, the expert rule-based approach classifies 400 of themas network faults. We called the subscribers of those complaintsand collected 185 valid responses, among which 58 of them areactual network faults. Thus, the precision of the expert rule-basedapproach on classifying network faults is 31.4%. On the other hand,ICCA classifies 260 of the 2,863 complaints as network faults. Wecalled the subscribers of those complaints and collected 133 validresponses, among which 74 of them are actual network faults. Thus,the precision of ICCA on classifying network faults is 55.6%.
We remark that the above approach cannot be used to evalu-ate the recall of classifying network faults, as the missing actualnetwork faults cannot be identified; we pose this issue as futurework. In addition, the same subscriber may be involved in differentparts of the above analysis, yet we consolidated our questions andensure that each involved subscriber is only called once.
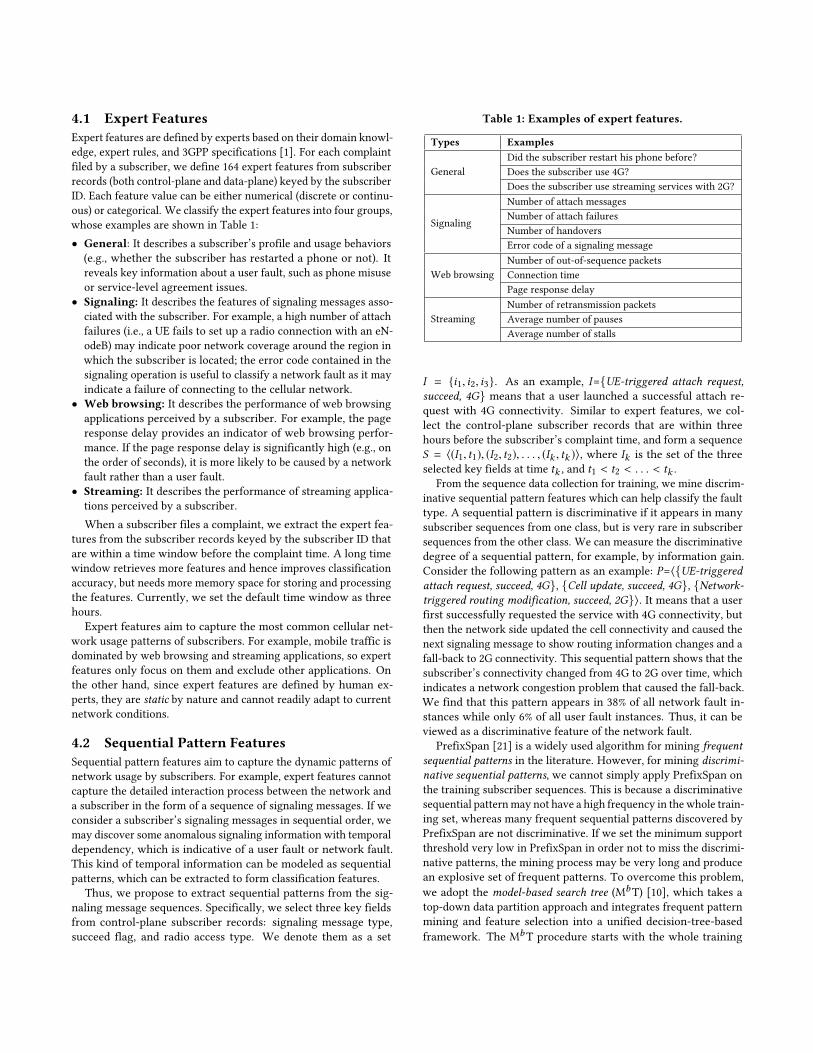
6.2 Query PerformanceWe now examine the query performance of ICCA, and demonstratevia stress tests that it can achieve real-time fault classification evenunder high query load. Since it is difficult to directly stress-test thequery performance of our production system, we set up a controlledexperiment to conduct our measurements as follows. Specifically,we set up a local testbed of three servers that have the same hard-ware configurations as in our production system. We simulatethree-hour subscriber records of up to 800 complaining subscribers,compute their expert features and sequential pattern features, andload the results into HBase. We issue queries concurrently for a
25 50 100 200 400 800
0500
1000
1500
2000
2500
Number of complaining subscribers
Res
pons
e tim
e (m
s)
Figure 5: Query performance of ICCA versus the number ofcomplaining subscribers.
number of complaining subscribers, varied from 25 to 800 in ourevaluation. We measure the query response time, defined as thetime from issuing a query for each complaining subscriber until theclassification result is obtained. We collect query time results over10 runs. We present boxplots for all obtained query time samples(i.e., 10 times the number of complaining subscribers); each boxplotshows the minimum, lower quartile, median, upper quartile, andmaximum query times.
Figure 5 shows the query performance of ICCA versus the num-ber of complaining subscribers. The query response time and itsvariance increase with the number of complaining subscribers,as more concurrent queries are issued to HBase. Nevertheless,each query can be completed quickly. Even for 800 complainingsubscribers, the worst-case query response time is no more than2.3 seconds.
We point out that ICCA performs much faster than our tradi-tional expert rule-based approach. Based on our evaluation resultsin production, the expert rule-based approach takes around 20 sec-onds to issue queries for 100 complaining subscribers. The reasonis that the expert rule-based approach configures a number of rules,each of which has one to many logical operations. It queries HBasemultiple times in order to obtain a classification result. In contrast,ICCA only queries HBase twice for fetching both expert featuresand sequential pattern features by subscriber ID, and performsimmediate matching to return the query result.
7 LESSONS LEARNEDThis paper presents our experiences of applying data mining andmachine learning techniques to process massive network data andachieve intelligent cellular network diagnosis at large scale, andrealize our ideas in a production system called ICCA.We summarizeour lessons learned from the deployment of ICCA.Data collection: Subscribers often file complaints based on theirexperiences, which are subjective by nature. Even though we canstandardize the procedures and questions for customer care ser-vices and feedback surveys, the answers provided by subscribers
may still have a high degree of variance and hence are not fullytrustworthy. Thus, we take a data-driven approach. By mining theuseful features from massive network data, we capture the char-acteristics of network conditions that help diagnose subscribers’complaints. One important lesson is that our collected data shouldbe complete and have full coverage of both the control plane andthe data plane of the cellular network, in order to achieve accuratediagnosis. Another important lesson is that since the collecteddata comes from various cellular network technologies, its formatshould be well-defined and unified, so as to facilitate cellular net-work diagnosis. In future work, we also examine the inclusion ofother data sources, such as subscriber profiles and network devicelogs, for more accurate diagnosis.Automatic sequential pattern mining: Traditional diagnosis isbased on the expert rule-based approach (see Section 1), whichheavily relies on the domain knowledge of network engineers toconfigure the right set of rules for cellular network diagnosis. Theseexpert rules can only address part of the fault classification problem,and ignore the dynamic features provided by the massive networkdata itself. In our case, the correlations of the control-plane signal-ing messages provide important hints for diagnosis, but they areignored by expert rules. Nevertheless, our system design does notexclude expert features as they still provide valuable information,but instead we complement them by adding sequential pattern fea-tures that are dynamically extracted from the network data. Animportant lesson is that combining both expert features and se-quential pattern features can provide more accurate diagnosis, asjustified by our evaluation (see Section 6.1.1).Large-scale system design: Processing data of up to 50 millionsubscribers online and providing accurate classification results forsubscribers’ complaints in real time are non-trivial tasks. We designICCA based on both public, well-proven distributed computing andstorage systems (Spark and HBase) and our in-house distributedstream processing system (StreamSMART). We also require thatICCA be deployable on commodity off-the-shelf rack servers andnetwork switches. This simplifies the deployment of ICCA if wewant to deploy it in a different cellular network. Also, we canreadily add or upgrade servers for ICCA if we want to scale itsresources.
Our experience is that the performance bottleneck of ICCA ismainly on CPU computations for feature extraction and patternmatching, compared to the disk I/Os or network communicationsamong the servers. Thus, if more subscribers need to be supported,we can increase the number of servers for more CPU resources.Generality and portability: Our ICCA system design is modular-ized to ensure that the components are general and portable. Whilesome components are specific for the fault classification problemsolved by ICCA (e.g., discriminative sequential pattern mining, en-semble learning algorithms, and online matching methods), manyother components are general and can be smoothly ported to otherapplications that perform analytics on subscriber records. Exam-ples include (1) the distributed stream processing engine, (2) thealgorithmic framework, and (3) the related API and other interfaces.In addition, the trained model parameters in one cellular networkcan be applied to other cellular networks or similar applicationswith the same data schema.
8 RELATEDWORKIn this section, we review related work, with emphasis on charac-terization and analytics of cellular networks.Cellular network characterization: Our work takes a networkoperator’s perspective by performing passive measurements (i.e.,without injecting measurement traffic to the network) and analyz-ing collected data at the cellular core. Several studies also followthis direction and focus on different cellular network characteristics.Examples include: achievable download throughput [12], radio re-source usage and power consumption [22], network gateway cover-age and impact of content placement [27], usage patterns of mobileapplications [26], control-plane signaling overheads due to IP-levelpackets [13, 20, 23], TCP flow characteristics in 3G UMTS [7] and4G LTE [14], web browsing quality-of-experience [5], etc. Our workdiffers from above by focusing on fault classification about cellularnetwork access. In addition, the above studies perform character-ization offline, while we emphasize real-time characterization ofnetwork data.Cellular network analytics: Machine learning and other ana-lytics techniques have been widely used to identify sophisticatedpatterns from network measurement (see survey [18]). Specificallyfor cellular networks, machine learning has been used to predictall drops [24] and diagnose performance anomalies [6, 7].
Some studies focus on building analytics systems for cellularnetwork analytics. For example, CellIQ [15] performs real-timegraph analytics to identify spatial-temporal traffic hotspots andhandoff sequences in cellular networks. CellScope [16] appliesmulti-task learning to study the trade-off between data collectiontime and analytics accuracy in cellular network diagnosis. Ourproposed ICCA is also designed for real-time large-scale analyticsin cellular networks, with a specific focus on fault classification.Note that some cellular carriers have also developed their ownlarge-scale analytics systems to manage cellular networks (e.g.,[19, 25]), but their design details are proprietary and cannot bedirectly compared with ICCA.Analysis of customer care calls: Customer care calls provideuseful information about network anomalies. Chen et al. [7] analyzecustomer care calls to detect anomaly events, and further leverageuser tweets on Twitter to recover more attributes of the detectedevents. TREAT [17] mines sentences and phrases from text-basedcustomer care calls and trouble tickets to classify reported issuesfrom customers. However, the content of customer care calls canbe highly subjective (see Section 7). Instead of only relying on thecontent of customer care calls, ICCA extracts patterns frommassivenetwork data to achieve timely and accurate fault classification.
9 CONCLUSIONWe design and implement Intelligent Customer Care Assistant(ICCA), a distributed fault classification system for large-scale cel-lular network diagnosis. ICCA takes a data-driven approach: itcombines traditional domain knowledge (i.e., expert features) anddynamic sequential patterns of control-plane and data-plane sub-scriber records (i.e., sequential pattern features) to achieve real-time fault classification between user faults and network faults.We demonstrate how ICCA realizes state-of-the-art data miningand machine learning techniques to achieve the goal. ICCA is
deployed in a metropolitan LTE network in China with around50 million subscribers. Evaluation shows that ICCA can achievehigh classification accuracy and high query performance.
REFERENCES[1] 3GPP. http://www.3gpp.org/.[2] Apache HBase. http://hbase.apache.org/.[3] Apache Spark. http://spark.apache.org/.[4] Apache Storm. http://storm.apache.org/.[5] A. Balachandran, V. Aggarwal, E. Halepovic, J. Pang, S. Seshan, S. Venkataraman,
and H. Yan. Modeling Web Quality-of-Experience on Cellular Networks. In Proc.of ACM MobiCom, 2014.
[6] P. Casas, P. Fiadinoy, and A. D’Alconzo. Machine-Learning Based Approachesfor Anomaly Detection and Classification in Cellular Networks. In Proc. of IFIPTMA, 2016.
[7] Y.-C. Chen, G. M. Lee, N. Duffield, L. Qiu, and J. Wang. Event Detection usingCustomer Care Calls. In Proc. of IEEE INFOCOM, 2013.
[8] Cisco. Cisco Visual Networking Index: Global Mobile Data Traffic ForecastUpdate, 2015 - 2020. http://www.cisco.com/c/en/us/solutions/collateral/service-provider/visual-networking-index-vni/mobile-white-paper-c11-520862.html,Feb 2016.
[9] Cisco. Understanding CDR. https://supportforums.cisco.com/document/53056/understanding-cdr-call-detail-records, 2016.
[10] W. Fan, K. Zhang, H. Cheng, J. Gao, X. Yan, J. Han, P. S. Yu, and O. Verscheure.Direct mining of discriminative and essential frequent patterns via model-basedsearch tree. In KDD, pages 230--238, 2008.
[11] J. H. Friedman. Greedy Function Approximation: A Gradient Boosting Machine.The Annals of Statistics, 29(5):1189--1232, 2001.
[12] A. Gerber, J. Pang, O. Spatscheck, and S. Venkataraman. Speed Testing withoutSpeed Tests: Estimating Achievable Download Speed from Passive Measure-ments. In Proc. of ACM IMC, 2010.
[13] X. He, P. P. C. Lee, L. Pan, C. He, and J. C. S. Lui. A Panoramic View of 3GData/Control-Plane Traffic: Mobile Device Perspective. In Proc. of IFIP Network-ing, 2012.
[14] J. Huang, F. Qian, Y. Guo, Y. Zhou, Q. Xu, Z. M. Mao, S. Sen, and O. Spatscheck.An In-depth Study of LTE: Effect of Network Protocol and Application Behavioron Performance. In Proc. of ACM SIGCOMM, 2013.
[15] A. P. Iyer, L. E. Li, and I. Stoica. CellIQ : Real-Time Cellular Network Analyticsat Scale. In Proc. of USENIX NSDI, 2015.
[16] A. P. Iyer, I. Stoica, M. Chowdhury, and L. E. Li. Fast and Accurate PerformanceAnalysis of LTE Radio Access Networks. Technical Report UCB/EECS-2016-114,EECS Dept, UC Berkeley, 2016.
[17] R. Li, X. Huang, S. Song, J. Wang, and W. Wang. Towards Customer TroubleTickets Resolution Automation in Large Cellular services: Demo. In Proc. ofACM MobiCom, 2016.
[18] T. T. Nguyen and G. Armitage. A Survey of Techniques for Internet TrafficClassification using Machine Learning. IEEE Comm. Surveys and Tutorials, 10(4),2008.
[19] Nokia. Nokia Wireless Network Guardian. https://resources.alcatel-lucent.com/?cid=163631, 2016.
[20] U. Paul, A. P. Subramanian, M. M. Buddhikot, and S. R. Das. UnderstandingTraffic Dynamics in Cellular Data Networks. In Proc. of IEEE INFOCOM, 2011.
[21] J. Pei, J. Han, B. Mortazavi-Asl, H. Pinto, Q. Chen, U. Dayal, and M. Hsu. Pre-fixspan: Mining sequential patterns by prefix-projected growth. In ICDE, pages215--224, 2001.
[22] F. Qian, Z. Wang, A. Gerber, Z. M. Mao, S. Sen, and O. Spatscheck. CharacterizingRadio Resource Allocation for 3G Networks. In Proc. of ACM IMC, 2010.
[23] L. Qian, E. W. W. Chan, P. P. C. Lee, and C. He. Characterization of 3G Control-Plane Signaling Overhead from a Data-Plane Perspective. In Proc. of ACMMSWiM, 2012.
[24] N. Theera-Ampornpunt, S. Bagchi, K. R. Joshi, and R. K. Panta. Using Big Datafor More Dependability: A Cellular Network Tale. In Proc. of HotDep, 2013.
[25] Verizon. Verizon Adds Cloudera’s Cloud-Based Big Data Analytics Solution toVerizon Cloud Ecosystem. http://www.verizon.com/about/news/verizon-adds-clouderas-cloudbased-big-data-analytics-solution-verizon-cloud-ecosystem/,2013.
[26] Q. Xu, J. Erman, A. Gerber, Z. M. Mao, J. Pang, and S. Venkataraman. IdentifyingDiverse Usage Behaviors of Smartphone Apps. In Proc. of ACM IMC, Nov 2011.
[27] Q. Xu, J. Huang, Z. Wang, F. Qian, A. Gerber, and Z. M. Mao. Cellular DataNetwork Infrastructure Characterization and Implication on Mobile ContentPlacement. In Proc. of ACM SIGMETRICS, 2011.