Embed Size (px)
Citation preview
1
An Intelligent Decision Support System to
Prevent and Control of Dengue
Daphne Lopez1, Gunasekaran Manogaran2*, R. Varatharajan3, Kaja M. Abbas4 1School of Information Technology and Engineering, VIT University, Vellore, India
2University of California, Davis, USA,* [email protected]
3Sri Ramanujar Engineering College, India 4 Department of Infectious Disease Epidemiology, London School of Hygiene and Tropical
Medicine, London, UK
Abstract
Demographic shifts, social behavior modification, and climate change enhance the risk of
dengue outbreaks globally. The Government of India has developed prevention and control
strategies for dengue fever. We propose an intelligent decision support system based on
multi-criteria decision analysis to improve strategic decision making among various
alternatives, such as vaccination, disease surveillance, vector control, improved sanitation and
access to safe drinking water, strengthening public health activities, awareness creation, and
improving nutrition for women and children. The proposed alternatives are selected based on
people, space and time criteria, such as low temperature and heavy rain, high temperature and
high humidity, rainfall and water accumulation, resources and facilities, sociocultural and
sociodemographic variables. The selection of alternatives based on multiple criteria is a
complex decision-making problem. Policy and decision makers use linguistic terms to give
their opinions and perspectives. We used the fuzzy logic based VIKOR (VIsekriterijumska
optimizacija i KOmpromisno Resenje) method to analyze the linguistic terms collected from
policy and decision makers to rank the optimal alternatives based on multiple criteria.
Keywords: Fuzzy logic, VIKOR, dengue, multi-criteria decision analysis, infectious disease
prevention and control
1. Introduction
Government and healthcare professionals manage dengue outbreaks using multiple
prevention and control strategies (Manogaran et al. 2017a; Manogaran et al. 2017b;
Manogaran et al. 2017c). Complex procedures and challenges are involved in the dengue
control strategies (Manogaran et al. 2017d; Thota et al. 2018), and the selection of the
optimal dengue prevention and control strategy depends on people, space and time. Medical
providers and health care administrators endeavor to reduce the operational and maintenance
costs for prevention and control of dengue fever (Varatharajan et al. 2017a; Varatharajan et
al. 2017b; Varatharajan et al. 2017c). The expenditure and demand for healthcare are also
increasing rapidly. Professionals and administrators from the healthcare and other industries
2
are jointly conducting various healthcare delivery procedures with the aim to enable efficient
disease control strategies using the limited resources (Manogaran et al. 2017e; D. Lopez et al.
2016). These considerations are used to develop a decision-making model based on multiple
criteria and alternatives (Cromwell et al. 2015). The goal of Multi Criteria Decision Making
(MCDM) models is to make an effective decision at various stages of healthcare planning,
such as strategic, tactical and operational. In every complex decision-making problem, there
could be an optimal solution though it is a challenging task to identify such a solution. In
general, strategic decisions are determined by the administrators or top-level management to
develop and sustain the organization. In addition, there are ambiguities in strategic decisions,
potential synergies among various alternatives, and uncertainties in the overall outcome
(Manogaran et al. 2016; Manogaran et al. 2017f). Once the strategic decisions are made, then
the organization determines tactical and operational planning decisions. Strategic, tactical and
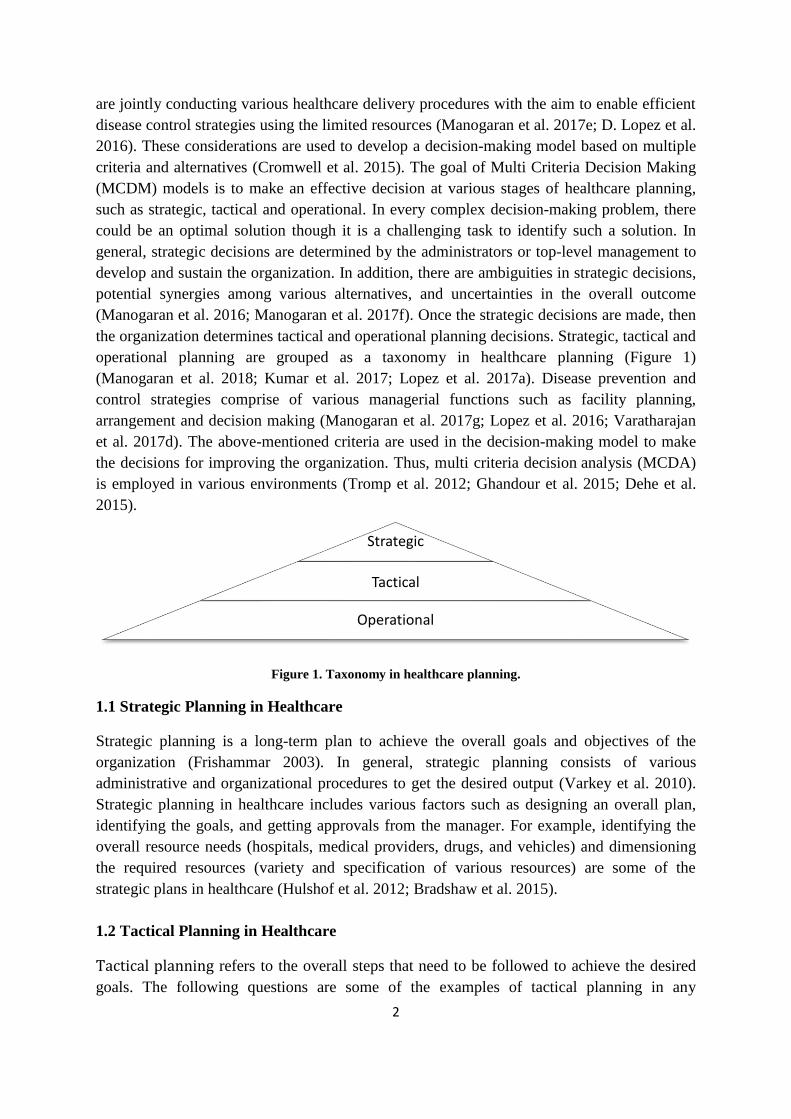
operational planning are grouped as a taxonomy in healthcare planning (Figure 1)
(Manogaran et al. 2018; Kumar et al. 2017; Lopez et al. 2017a). Disease prevention and
control strategies comprise of various managerial functions such as facility planning,
arrangement and decision making (Manogaran et al. 2017g; Lopez et al. 2016; Varatharajan
et al. 2017d). The above-mentioned criteria are used in the decision-making model to make
the decisions for improving the organization. Thus, multi criteria decision analysis (MCDA)
is employed in various environments (Tromp et al. 2012; Ghandour et al. 2015; Dehe et al.
2015).
Figure 1. Taxonomy in healthcare planning.
1.1 Strategic Planning in Healthcare
Strategic planning is a long-term plan to achieve the overall goals and objectives of the
organization (Frishammar 2003). In general, strategic planning consists of various
administrative and organizational procedures to get the desired output (Varkey et al. 2010).
Strategic planning in healthcare includes various factors such as designing an overall plan,
identifying the goals, and getting approvals from the manager. For example, identifying the
overall resource needs (hospitals, medical providers, drugs, and vehicles) and dimensioning
the required resources (variety and specification of various resources) are some of the
strategic plans in healthcare (Hulshof et al. 2012; Bradshaw et al. 2015).
1.2 Tactical Planning in Healthcare
Tactical planning refers to the overall steps that need to be followed to achieve the desired
goals. The following questions are some of the examples of tactical planning in any
Strategic
Tactical
Operational
3
organization i.e. where, what, which, how, who and when (Manogaran et al. 2017h).
Tactical planning in healthcare is followed in two steps – Step 1: Identifying and classifying
the individuals based on the disease and its severity and defining various required resources;
Step 2: Collecting and installing the resources (hospitals, medical providers, drugs, and
vehicles) that are identified in the strategic planning, and scheduling the workload, assigning
tasks to all workers and scheduling them over time. Tactical planning in the healthcare
industry includes staff shift scheduling and overtime scheduling in the surgical block
(Gunduz et al. 2015). Tactical planning is also named as a blueprint of operational planning.
1.3 Operational Planning in Healthcare
Operational planning refers to the short-term goal of the organization. The primary purpose
of the operational plan is to make a decision for desired healthcare delivery. Operational
planning is also used to execute the steps that are identified in the tactical planning. In other
words, blueprints are implemented at each resource level and individual patient level in the
operational planning to get the desired output (Hulshof et al. 2012). In this paper, operational
plan is done with the help of Fuzzy VIKOR Multi Criteria Decision Making (FMCDM). The
proposed system provides various alternatives to prevent and control dengue fever. The
proposed alternatives are selected based on people, space and time criteria, such as low
temperature and heavy rain, high temperature and high humidity, rainfall and water
accumulation, resources and facilities, sociocultural and sociodemographic variables. The
above-mentioned criteria are used to identify the optimal alternative from the list of
alternatives, such as vaccination, disease surveillance, vector control, improved sanitation and
access to safe drinking water, strengthening public health activities, awareness creation, and
improving nutrition for women and children.
1.4 Dengue Surveillance
Dengue fever is caused by Aedes aegypti and Aedes albopictus mosquitoes. Aedes aegypti
mosquitoes breed in manmade products such as water tanks, tyres, pitchers, discarded
containers, cement tanks, desert coolers and junk materials. Water stagnates in these places
for several days, which enhances the breeding of these mosquitoes. Aedes aegypti is a day
biting mosquito and breeds in dark areas such as inside the houses and storerooms
(Manogaran et al. 2017i; Lopez et al. 2017b; Gandhi et al. 2018). Aedes albopictus
mosquitoes breed in natural habitats such as gardens, inside grass, tree gaps and agricultural
estates. Dengue disease burden is greater than before due to improper water storage methods,
lack of awareness and rapid urbanization, and these root causes lead to increase in the
mosquito breeding sites. Dengue cases are not uniformly distributed during the year, and they
generally peak after the monsoon period. However, in the southern states of India, dengue
burden is constant for all months, and in Gujarat the transmission is permanent. The major
symptoms of dengue include fever, headache, rash, joint pains, muscle, nausea and vomiting
(Rawal et al. 2017).
4
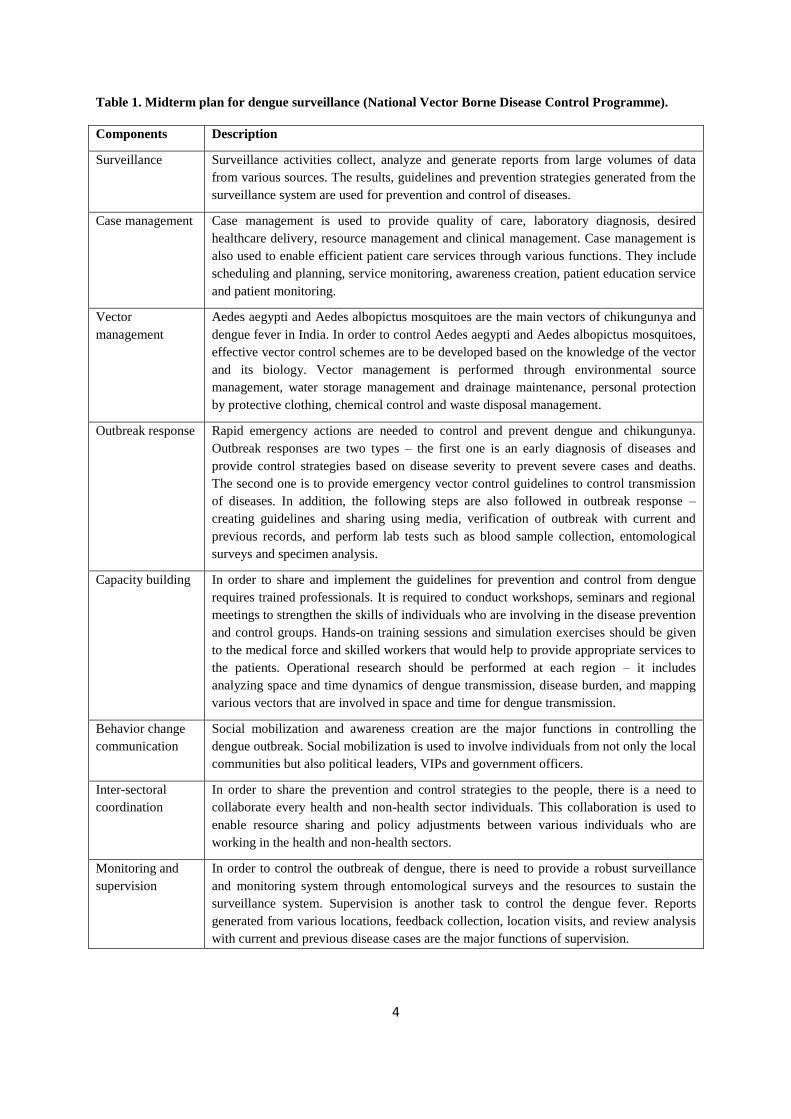
Table 1. Midterm plan for dengue surveillance (National Vector Borne Disease Control Programme).
Components Description
Surveillance Surveillance activities collect, analyze and generate reports from large volumes of data
from various sources. The results, guidelines and prevention strategies generated from the
surveillance system are used for prevention and control of diseases.
Case management Case management is used to provide quality of care, laboratory diagnosis, desired
healthcare delivery, resource management and clinical management. Case management is
also used to enable efficient patient care services through various functions. They include
scheduling and planning, service monitoring, awareness creation, patient education service
and patient monitoring.
Vector
management
Aedes aegypti and Aedes albopictus mosquitoes are the main vectors of chikungunya and
dengue fever in India. In order to control Aedes aegypti and Aedes albopictus mosquitoes,
effective vector control schemes are to be developed based on the knowledge of the vector
and its biology. Vector management is performed through environmental source
management, water storage management and drainage maintenance, personal protection
by protective clothing, chemical control and waste disposal management.
Outbreak response Rapid emergency actions are needed to control and prevent dengue and chikungunya.
Outbreak responses are two types – the first one is an early diagnosis of diseases and
provide control strategies based on disease severity to prevent severe cases and deaths.
The second one is to provide emergency vector control guidelines to control transmission
of diseases. In addition, the following steps are also followed in outbreak response –
creating guidelines and sharing using media, verification of outbreak with current and
previous records, and perform lab tests such as blood sample collection, entomological
surveys and specimen analysis.
Capacity building In order to share and implement the guidelines for prevention and control from dengue
requires trained professionals. It is required to conduct workshops, seminars and regional
meetings to strengthen the skills of individuals who are involving in the disease prevention
and control groups. Hands-on training sessions and simulation exercises should be given
to the medical force and skilled workers that would help to provide appropriate services to
the patients. Operational research should be performed at each region – it includes
analyzing space and time dynamics of dengue transmission, disease burden, and mapping
various vectors that are involved in space and time for dengue transmission.
Behavior change
communication
Social mobilization and awareness creation are the major functions in controlling the
dengue outbreak. Social mobilization is used to involve individuals from not only the local
communities but also political leaders, VIPs and government officers.
Inter-sectoral
coordination
In order to share the prevention and control strategies to the people, there is a need to
collaborate every health and non-health sector individuals. This collaboration is used to
enable resource sharing and policy adjustments between various individuals who are
working in the health and non-health sectors.
Monitoring and
supervision
In order to control the outbreak of dengue, there is need to provide a robust surveillance
and monitoring system through entomological surveys and the resources to sustain the
surveillance system. Supervision is another task to control the dengue fever. Reports
generated from various locations, feedback collection, location visits, and review analysis
with current and previous disease cases are the major functions of supervision.
5
Dengue mortality rates can be minimized by surveillance and early detection of symptomatic
infections. Government of India has developed various guidelines and prevention and control
strategies that are circulated to every state in India. In addition, Indian Committee of
Secretaries (CoS) have generated the midterm plan in May 2011 for prevention and control of
dengue that are shared among the various states in India. The midterm plan consists of
various guidelines and is also named as ‘Octalogue’, since it includes eight major
components as depicted in Table 1 (NVBDCP 2018).
1.5 Dengue Epidemiology
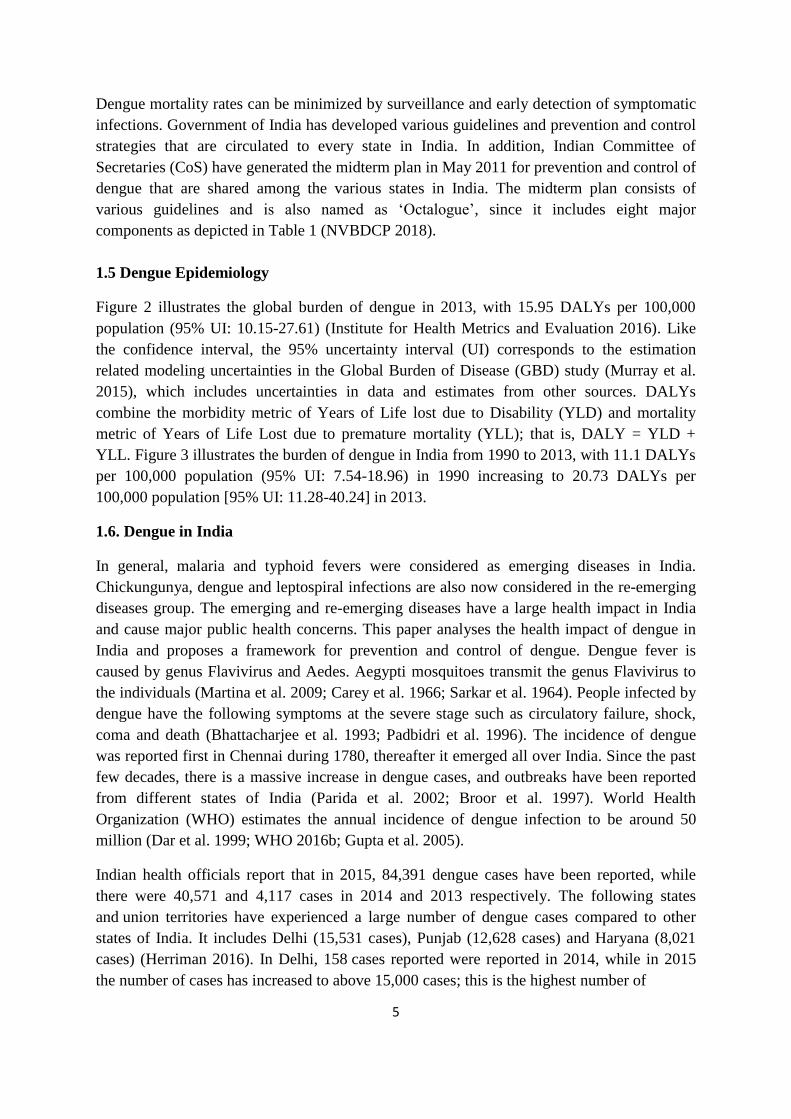
Figure 2 illustrates the global burden of dengue in 2013, with 15.95 DALYs per 100,000
population (95% UI: 10.15-27.61) (Institute for Health Metrics and Evaluation 2016). Like
the confidence interval, the 95% uncertainty interval (UI) corresponds to the estimation
related modeling uncertainties in the Global Burden of Disease (GBD) study (Murray et al.
2015), which includes uncertainties in data and estimates from other sources. DALYs
combine the morbidity metric of Years of Life lost due to Disability (YLD) and mortality
metric of Years of Life Lost due to premature mortality (YLL); that is, DALY = YLD +
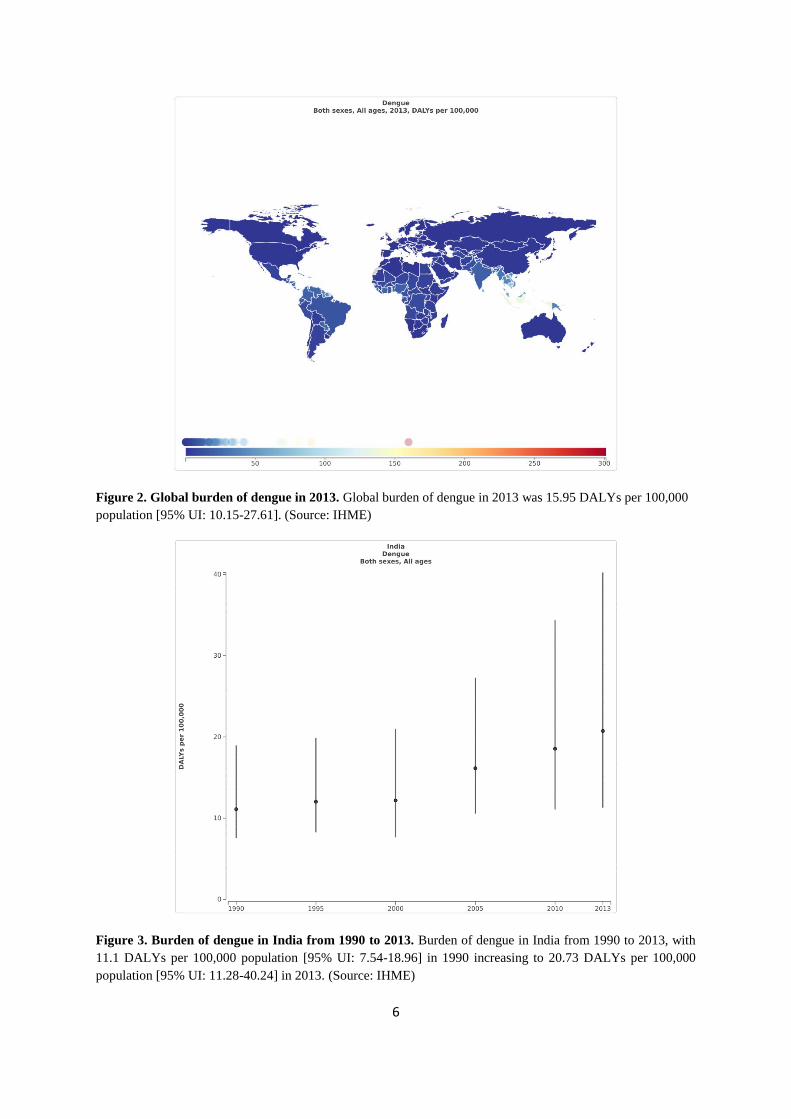
YLL. Figure 3 illustrates the burden of dengue in India from 1990 to 2013, with 11.1 DALYs
per 100,000 population (95% UI: 7.54-18.96) in 1990 increasing to 20.73 DALYs per
100,000 population [95% UI: 11.28-40.24] in 2013.
1.6. Dengue in India
In general, malaria and typhoid fevers were considered as emerging diseases in India.
Chickungunya, dengue and leptospiral infections are also now considered in the re-emerging
diseases group. The emerging and re-emerging diseases have a large health impact in India
and cause major public health concerns. This paper analyses the health impact of dengue in
India and proposes a framework for prevention and control of dengue. Dengue fever is
caused by genus Flavivirus and Aedes. Aegypti mosquitoes transmit the genus Flavivirus to
the individuals (Martina et al. 2009; Carey et al. 1966; Sarkar et al. 1964). People infected by
dengue have the following symptoms at the severe stage such as circulatory failure, shock,
coma and death (Bhattacharjee et al. 1993; Padbidri et al. 1996). The incidence of dengue
was reported first in Chennai during 1780, thereafter it emerged all over India. Since the past
few decades, there is a massive increase in dengue cases, and outbreaks have been reported
from different states of India (Parida et al. 2002; Broor et al. 1997). World Health
Organization (WHO) estimates the annual incidence of dengue infection to be around 50
million (Dar et al. 1999; WHO 2016b; Gupta et al. 2005).
Indian health officials report that in 2015, 84,391 dengue cases have been reported, while
there were 40,571 and 4,117 cases in 2014 and 2013 respectively. The following states
and union territories have experienced a large number of dengue cases compared to other
states of India. It includes Delhi (15,531 cases), Punjab (12,628 cases) and Haryana (8,021
cases) (Herriman 2016). In Delhi, 158 cases reported were reported in 2014, while in 2015
the number of cases has increased to above 15,000 cases; this is the highest number of
6
Figure 2. Global burden of dengue in 2013. Global burden of dengue in 2013 was 15.95 DALYs per 100,000
population [95% UI: 10.15-27.61]. (Source: IHME)
Figure 3. Burden of dengue in India from 1990 to 2013. Burden of dengue in India from 1990 to 2013, with
11.1 DALYs per 100,000 population [95% UI: 7.54-18.96] in 1990 increasing to 20.73 DALYs per 100,000
population [95% UI: 11.28-40.24] in 2013. (Source: IHME)
7
dengue cases ever in Delhi since 1996 (Nath 2015). In September 2015 alone, dengue disease
burden crossed 6,775 cases, and this is the highest number of reported cases since 2010 (India
2016). In the recent decade, 2010 was considered the deadliest year, with 4,375 cases. The
worst dengue outbreak in Delhi was in 1996 with 10,252 cases and 423 deaths. In 2015,
Punjab was affected by dengue with 13,731 cases and 18 deaths reported, while West Bengal
and Haryana had 6,822 and 8,066 cases reported respectively. Tamil Nadu was affected by
dengue with 128 cases and five deaths reported in 1998, while in 2003, 2005 and 2015, it
increased to 1,600 cases and 12 deaths, 1,150 cases and 8 deaths, and 3,841 cases and 6
deaths respectively (Victor et al. 2007). In 2012, Tamil Nadu had a high number of 12,826
cases and 66 deaths (NVBDCP 2016),
The main reasons for dengue outbreaks include climate change and global warming, large
population and population density, air and water pollution, land use change and rapid
urbanization, and low awareness among the people. In order to control the dengue outbreaks,
the Government of India has provided strategies to the public for prevention and control of
dengue. In addition to that, this paper provides seven preventive strategies – vaccination,
disease surveillance, vector control, improved sanitation and access to safe drinking water,
strengthening public health activities, awareness creation, and improving nutrition for women
and children. The proposed alternatives are selected based on people, space and time criteria,
such as low temperature and heavy rain, high temperature and high humidity, rainfall and
water accumulation, resources and facilities, and sociocultural and sociodemographic
variables. In order to resolve uncertainties in the decision-making process and select the best
alternative for prevention and control of dengue, this paper uses fuzzy logic based VIKOR
method.
1.7 Prevention and Control of Dengue
The increasing burden of dengue in India necessitates improvement in prevention and control
programs. Dengvaxia is a dengue vaccine that is licensed for use in 3 countries, including
Mexico, Philippines and Brazil, it is not currently licensed for use in India (WHO 2016b).
The prevention and control programs for dengue in India are awareness creation; improved
nutrition for women and children; improved water, sanitation and hygiene; strengthening
public health activities; surveillance; (potential) vaccination; and vector control. The different
interventions have variances in epidemiological effectiveness, access and cost, and expert
opinion of decision makers provide one viable option for public health decision making under
uncertainty. Since there will be variances in the prioritization of interventions among the
experts, we propose a fuzzy logic based VIKOR method to make objective decisions based
on subjective opinions of the decision makers.
1.7 Public Health Significance
This study addresses the significant public health problem of making an objective decision
based on subjective expert opinion of decision makers on dengue prevention and control in
India.
8
2. Multi-Criteria Decision Making
Multi-criteria decision making (MCDM) solves decision-making problems by using
qualitative and quantitative evaluation criteria to select the optimal solution in complex
environments (Bellman et al. 1970; Phuong et al. 2001). In the public health domain, MCDM
models have been used to prevent and control emerging and reemerging diseases (De et al.
2001; Massad et al. 1999).
The following MCDM models have been used, including the Grey System Theory (GST),
Goal Programming (GP), Analytic Network Process (ANP), Multi-Attribute Value Theory
(MAVT), Analytic Hierarchy Process (AHP) and Data Envelopment Analysis (DEA). Saaty
has developed AHP model to solve composite decision-making problems and are used to
formulate a decision in contractor prequalification (Al-Harbi et al. 2001). Analytic Network
Process (ANP) is similar to Analytic Hierarchy Process (AHP), but AHP forms a hierarchy
with an end whereas ANP forms a network (Lu et al. 2007). Data Envelopment Analysis
(DEA) is used to monitor various functions of an organization. For example, DEA is used to
schedule and monitor the bridge maintenance services (Ozbek et al. 2010). Technique for
Order of Preference by Similarity to Ideal Solution (TOPSIS) is used to make a better
decision based on the geometric distance between the events (Şimşek et al. 2013). Grey
System Theory (GST) is developed based on differential equations to evaluate decisions.
Hybrid decision making model is based on the above mentioned MCDM models (Jato-Espino
et al. 2014).
Opricovic had developed VIKOR (VIsekriterijumska optimizacija iKOmpromisno Resenje)
MCDM method to identify the optimal solution based on different criteria (Opricovic et al.
2007) by considering the variances in the preference values of different individuals involved
in the decision-making process (Wang et al. 2009). Clinical diagnosis and epidemiological
analysis have a high level of uncertainty and ambiguity (Broekhuizen et al. 2015, Lopez et al.
2015; Lopez et al. 2014), and decision-making models need to process and resolve this
uncertainty. Fuzzy logic based VIKOR method is used in this paper to resolve uncertainties
in decision making, with a focus on dengue prevention and control strategies.
3. Fuzzy Logic
3.1. Fuzzy Set Theory
3.1.1. Fuzzy sets
A fuzzy set is a set of objects and membership function valued between 0 and 1. Zadeh
(1965) has introduced fuzzy set theory to assess real time fuzzy phenomenon problems that
are vague, imprecise and unspecific (Zadeh et al. 1965). Fuzzy set theory is used to process
subjective and imprecise judgments. Assume that X be the universe of discourse, 𝑋𝑖(𝑖 =
1,2, … , 𝑛), a fuzzy set �̃�(𝑥) is denoted by a membership function 𝜇�̃�(𝑥) (Zadeh et al. 1975).
9
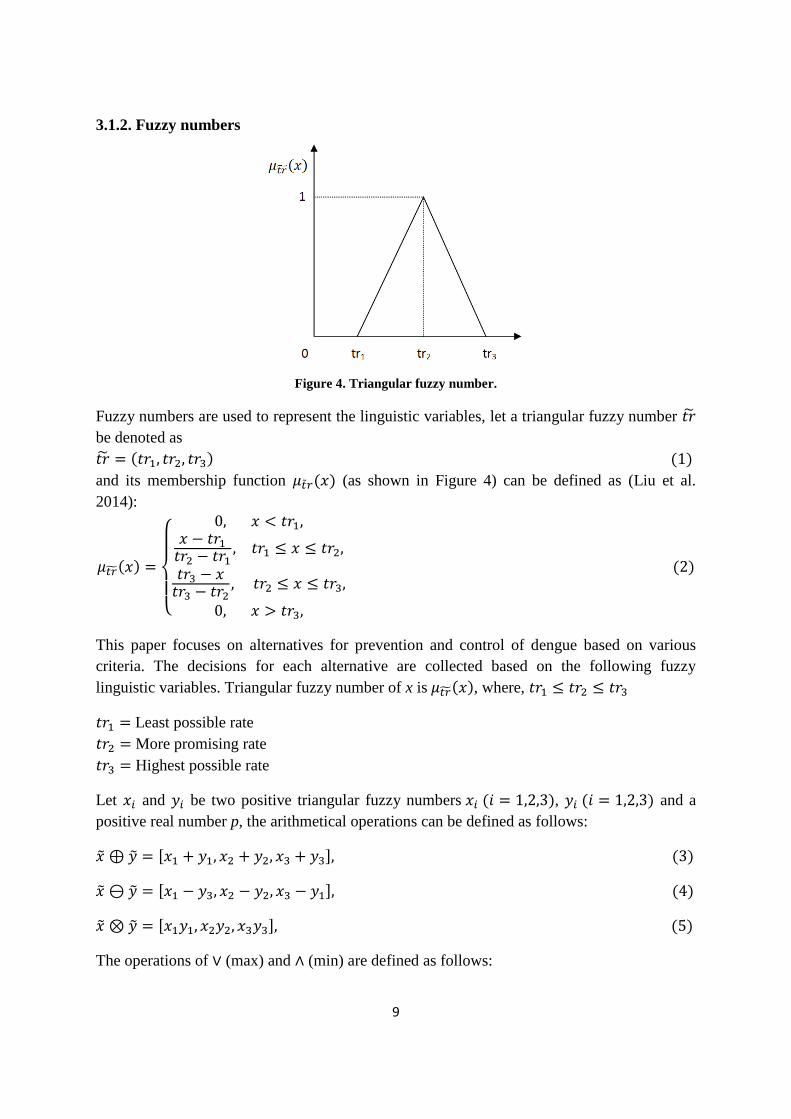
3.1.2. Fuzzy numbers
Figure 4. Triangular fuzzy number.
Fuzzy numbers are used to represent the linguistic variables, let a triangular fuzzy number 𝑡�̃�
be denoted as
𝑡�̃� = (𝑡𝑟1, 𝑡𝑟2, 𝑡𝑟3) (1)
and its membership function 𝜇�̃�𝑟(𝑥) (as shown in Figure 4) can be defined as (Liu et al.
2014):
𝜇𝑡�̃�(𝑥) =
{
0, 𝑥 < 𝑡𝑟1,𝑥 − 𝑡𝑟1𝑡𝑟2 − 𝑡𝑟1
, 𝑡𝑟1 ≤ 𝑥 ≤ 𝑡𝑟2,
𝑡𝑟3 − 𝑥𝑡𝑟3 − 𝑡𝑟2
, 𝑡𝑟2 ≤ 𝑥 ≤ 𝑡𝑟3,
0, 𝑥 > 𝑡𝑟3,
(2)
This paper focuses on alternatives for prevention and control of dengue based on various
criteria. The decisions for each alternative are collected based on the following fuzzy
linguistic variables. Triangular fuzzy number of x is 𝜇𝑡�̃�(𝑥), where, 𝑡𝑟1 ≤ 𝑡𝑟2 ≤ 𝑡𝑟3
𝑡𝑟1 = Least possible rate
𝑡𝑟2 = More promising rate
𝑡𝑟3 = Highest possible rate
Let 𝑥𝑖 and 𝑦𝑖 be two positive triangular fuzzy numbers 𝑥𝑖 (𝑖 = 1,2,3), 𝑦𝑖 (𝑖 = 1,2,3) and a
positive real number p, the arithmetical operations can be defined as follows:
�̃� ⊕ �̃� = [𝑥1 + 𝑦1, 𝑥2 + 𝑦2, 𝑥3 + 𝑦3], (3)
�̃� ⊖ �̃� = [𝑥1 − 𝑦3, 𝑥2 − 𝑦2, 𝑥3 − 𝑦1], (4)
�̃� ⊗ �̃� = [𝑥1𝑦1, 𝑥2𝑦2, 𝑥3𝑦3], (5)
The operations of ∨ (max) and ∧ (min) are defined as follows:
10
�̃� ∨ �̃� = [𝑥1 ∨ 𝑦1, 𝑥2 ∨ 𝑦2, 𝑥3 ∨ 𝑦3], (6)
�̃� ∧ �̃� = [𝑥1 ∧ 𝑦1, 𝑥2 ∧ 𝑦2, 𝑥3 ∧ 𝑦3], (7)
Scalar operations are defined as follows:
𝑟 ⊕ �̃� = [𝑟 + 𝑥1, 𝑟 + 𝑥2, 𝑟 + 𝑥3] (8)
𝑟 ⊖ �̃� = [𝑟 − 𝑥1, 𝑟 − 𝑥2, 𝑟 − 𝑥3], (9)
𝑟 ⊗ �̃� = [𝑟𝑥1, 𝑟𝑥2, 𝑟𝑥3], (10)
The Euclidean distance between two triangular fuzzy numbers 𝑥𝑖 (𝑖 = 1,2,3), 𝑦𝑖 (𝑖 = 1,2,3)
is defined as follows (Chen et al. 2008):
𝐷(𝑋𝑖, 𝑌𝑖) = √1
6[(𝑥1 − 𝑦1)2 + 4(𝑥2 − 𝑦2)2 + (𝑥3 − 𝑦3)2] (11)
The distance between the two triangular fuzzy numbers 𝑥𝑖 (𝑖 = 1,2,3), 𝑦𝑖 (𝑖 = 1,2,3) by
vertex method is defined as follows (Chen et al. 2000):
𝐷(𝑋𝑖, 𝑌𝑖) = √1
3[(𝑥1 − 𝑦1)2 + (𝑥2 − 𝑦2)2 + (𝑥3 − 𝑦3)2] (12)
3.1.3. Linguistic variables
Linguistic terms such as low, medium and high are used to represent the linguistic variables.
In general, linguistic variables are used to describe the imprecise or complex expressions.
This paper uses fuzzy linguistic terms to rate criteria and rank the various dengue prevention
and control strategies.
4. Fuzzy VIKOR Multi-Criteria Decision Making
VIKOR MCDM method is combined with fuzzy logic to solve various complex and
ambiguous decision-making problems. In general, VIKOR method identifies two solutions –
best and compromise solutions to rate the alternatives in MCDM process.
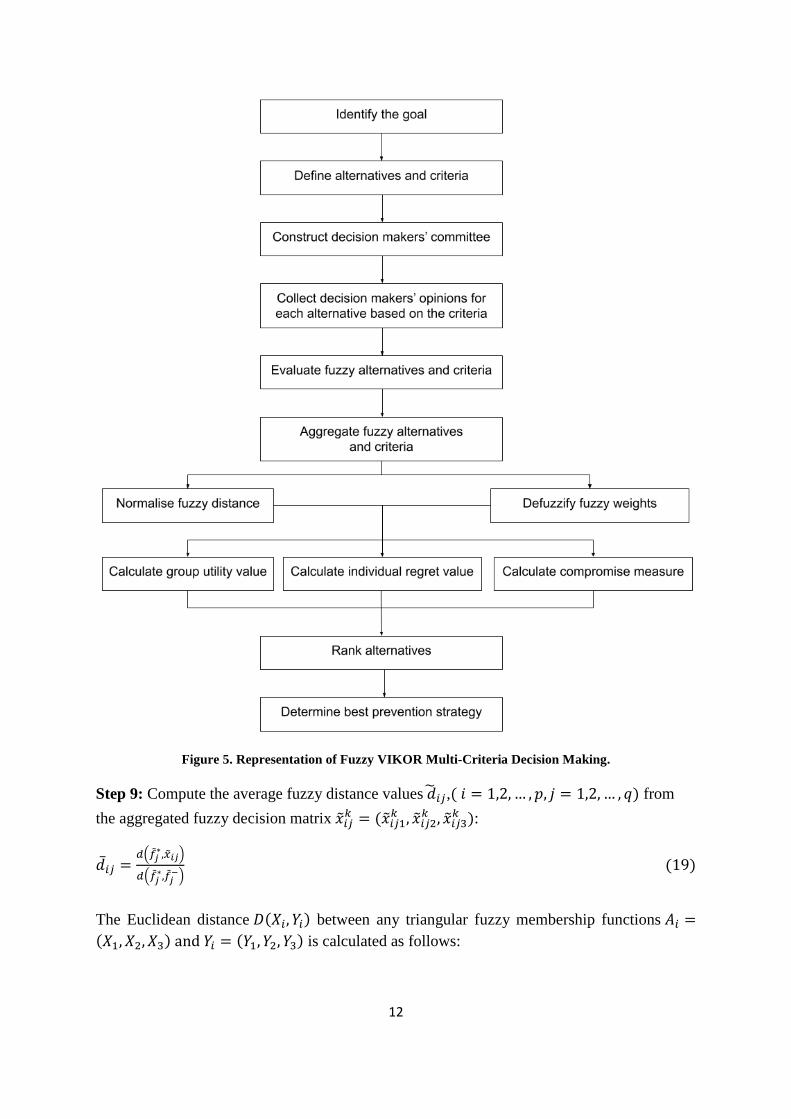
Fuzzy logic based VIKOR method consists of the following steps to rank the alternatives
(Figure 5):
Step 1: Identify the objective of the multi criteria decision making system.
Step 2: List the p alternative methods called 𝐴 = {𝐴1, 𝐴2, … , 𝐴𝑃}.
Step 3: List the q selection criteria called 𝐶 = {𝐶1, 𝐶2, … , 𝐶𝑞}.
11
Step 4: List the r decision-makers called 𝐷𝑀 = {𝐷𝑀1, 𝐷𝑀2, … , 𝐷𝑀𝑟} involved in the
decision-making process to identify the optimal alternative from p alternatives with respect to
each q criteria.
Step 5: Define the appropriate linguistic terms, fuzzy membership function 𝜇�̃�(𝑥) and
triangular fuzzy number �̃� = (𝑡1, 𝑡2, 𝑡3):
𝜇�̃�(𝑥) = {
0, 𝑥<𝑡1,𝑥−𝑡1
𝑡2−𝑡1, 𝑡1≤𝑥≤𝑡2,
𝑡3−𝑥
𝑡3−𝑡2, 𝑡2≤𝑥≤𝑡3,
0, 𝑥>𝑡3,
(13)
Step 6: Define the fuzzy criteria weights and collect the ratings for each alternative with
respect to each criterion.
Step 7: Calculate the fuzzy decision matrix based on aggregated ratings of fuzzy alternatives
and aggregated fuzzy weights of each criteria, let a set of fuzzy ratings of alternatives
𝐴𝑖(𝑖 = 1, 2, … , 𝑝) and criteria 𝐶𝑗(𝑗 = 1, 2, … , 𝑞), called 𝑋 = {𝑥𝑖𝑗 , 𝑖 = 1,2, … , 𝑝, 𝑗 =
1,2, … , 𝑞}.
Compute the normalized decision makers’ fuzzy assessment of alternatives
�̃�𝑖𝑗𝑘 = (�̃�𝑖𝑗1
𝑘 , �̃�𝑖𝑗2𝑘 , �̃�𝑖𝑗3
𝑘 ) and aggregated fuzzy weights of criteria �̃�𝑖𝑗𝑘 = (�̃�𝑖𝑗1
𝑘 , �̃�𝑖𝑗2𝑘 , �̃�𝑖𝑗3
𝑘 ):
�̃�𝑖𝑗 = ∑ 𝜗1�̃�𝑖𝑗𝑙𝑞𝑙=1 (14)
�̃�𝑗 =∑𝜗1�̃�𝑗𝑙 (15)
𝑞
𝑙=1
Where 𝜗1 ∈ [0,1] represents the weights given to the lth decision-maker, and ∑ 𝜗𝑙 = 1𝑞𝑙=1 .
The decision matrix �̃� for dengue prevention and control programs is defined as:
�̃� =
[ �̃�11�̃�21
�̃�12�̃�22
⋯�̃�1𝑞�̃�2𝑞
⋮ ⋮ … ⋮�̃�𝑝1 �̃�𝑝2 ⋯ �̃�𝑝𝑞]
, �̃� = (�̃�1, �̃�2, … , �̃�𝑞)𝑇 (16)
Step 8: Calculate the fuzzy best 𝑓𝑗∗ (𝑖 = 1,2, … , 𝑝) and fuzzy worst 𝑓𝑗
− (𝑗 = 1,2, … , 𝑞 )
values from the aggregated fuzzy decision matrix �̃�𝑖𝑗𝑘 = (�̃�𝑖𝑗1
𝑘 , �̃�𝑖𝑗2𝑘 , �̃�𝑖𝑗3
𝑘 ):
𝑓𝑗∗ = {
max𝑖�̃�𝑖𝑗 , for benefit criteria
min𝑖�̃�𝑖𝑗 , for cost criteria
} (17)
𝑓𝑗− = {
min𝑖�̃�𝑖𝑗 , for benefit criteria
max𝑖�̃�𝑖𝑗 , for cost criteria
} (18)
12
Figure 5. Representation of Fuzzy VIKOR Multi-Criteria Decision Making.
Step 9: Compute the average fuzzy distance values �̃�𝑖𝑗,( 𝑖 = 1,2, … , 𝑝, 𝑗 = 1,2, … , 𝑞) from
the aggregated fuzzy decision matrix �̃�𝑖𝑗𝑘 = (�̃�𝑖𝑗1
𝑘 , �̃�𝑖𝑗2𝑘 , �̃�𝑖𝑗3
𝑘 ):
�̅�𝑖𝑗 =𝑑(�̃�𝑗
∗,�̃�𝑖𝑗)
𝑑(�̃�𝑗∗,�̃�𝑗
−) (19)
The Euclidean distance 𝐷(𝑋𝑖, 𝑌𝑖) between any triangular fuzzy membership functions 𝐴𝑖 =
(𝑋1, 𝑋2, 𝑋3) and 𝑌𝑖 = (𝑌1, 𝑌2, 𝑌3) is calculated as follows:
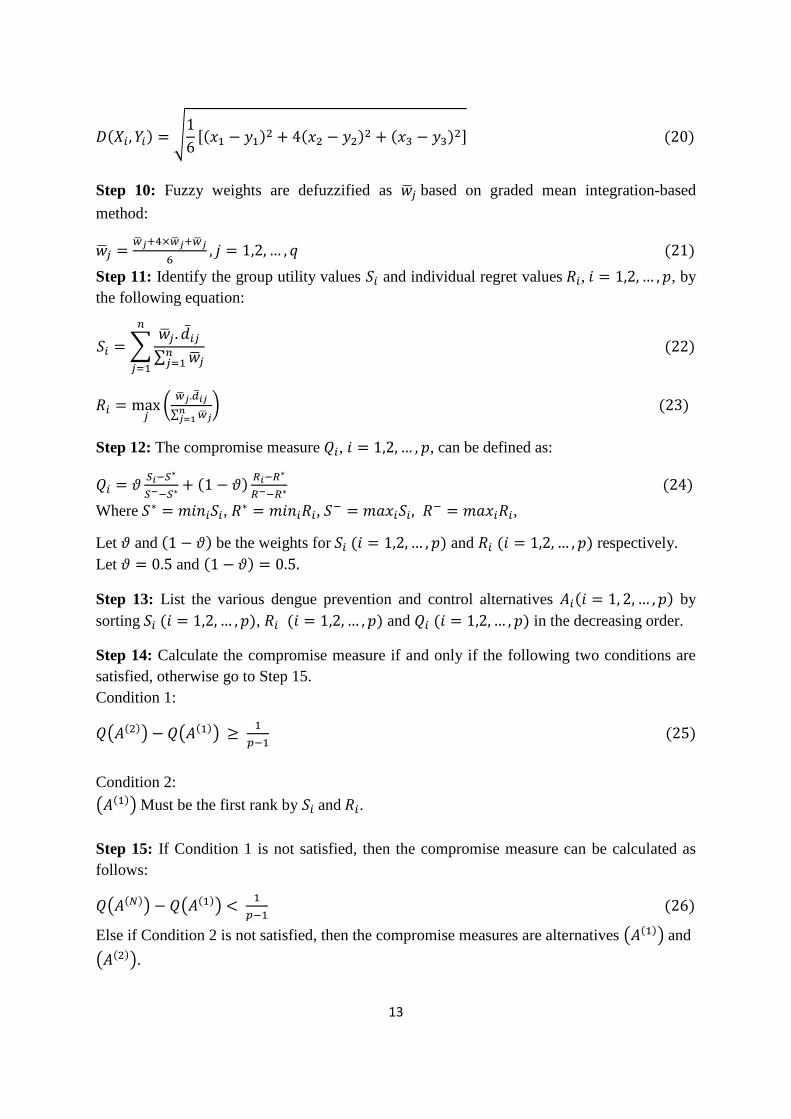
13
𝐷(𝑋𝑖, 𝑌𝑖) = √1
6[(𝑥1 − 𝑦1)2 + 4(𝑥2 − 𝑦2)2 + (𝑥3 − 𝑦3)2] (20)
Step 10: Fuzzy weights are defuzzified as �̅�𝑗 based on graded mean integration-based
method:
�̅�𝑗 =�̅�𝑗+4×�̅�𝑗+�̅�𝑗
6, 𝑗 = 1,2, … , 𝑞 (21)
Step 11: Identify the group utility values 𝑆𝑖 and individual regret values 𝑅𝑖, 𝑖 = 1,2, … , 𝑝, by
the following equation:
𝑆𝑖 =∑�̅�𝑗 . �̅�𝑖𝑗∑ �̅�𝑗𝑛𝑗=1
(22)
𝑛
𝑗=1
𝑅𝑖 = max𝑗(�̅�𝑗.�̅�𝑖𝑗
∑ �̅�𝑗𝑛𝑗=1
) (23)
Step 12: The compromise measure 𝑄𝑖, 𝑖 = 1,2, … , 𝑝, can be defined as:
𝑄𝑖 = 𝜗𝑆𝑖−𝑆
∗
𝑆−−𝑆∗+ (1 − 𝜗)
𝑅𝑖−𝑅∗
𝑅−−𝑅∗ (24)
Where 𝑆∗ = 𝑚𝑖𝑛𝑖𝑆𝑖, 𝑅∗ = 𝑚𝑖𝑛𝑖𝑅𝑖, 𝑆
− = 𝑚𝑎𝑥𝑖𝑆𝑖, 𝑅− = 𝑚𝑎𝑥𝑖𝑅𝑖,
Let 𝜗 and (1 − 𝜗) be the weights for 𝑆𝑖 (𝑖 = 1,2, … , 𝑝) and 𝑅𝑖 (𝑖 = 1,2, … , 𝑝) respectively.
Let 𝜗 = 0.5 and (1 − 𝜗) = 0.5.
Step 13: List the various dengue prevention and control alternatives 𝐴𝑖(𝑖 = 1, 2, … , 𝑝) by
sorting 𝑆𝑖 (𝑖 = 1,2, … , 𝑝), 𝑅𝑖 (𝑖 = 1,2, … , 𝑝) and 𝑄𝑖 (𝑖 = 1,2, … , 𝑝) in the decreasing order.
Step 14: Calculate the compromise measure if and only if the following two conditions are
satisfied, otherwise go to Step 15.
Condition 1:
𝑄(𝐴(2)) − 𝑄(𝐴(1)) ≥ 1
𝑝−1 (25)
Condition 2:
(𝐴(1)) Must be the first rank by 𝑆𝑖 and 𝑅𝑖.
Step 15: If Condition 1 is not satisfied, then the compromise measure can be calculated as
follows:
𝑄(𝐴(𝑁)) − 𝑄(𝐴(1)) < 1
𝑝−1 (26)
Else if Condition 2 is not satisfied, then the compromise measures are alternatives (𝐴(1)) and
(𝐴(2)).
14
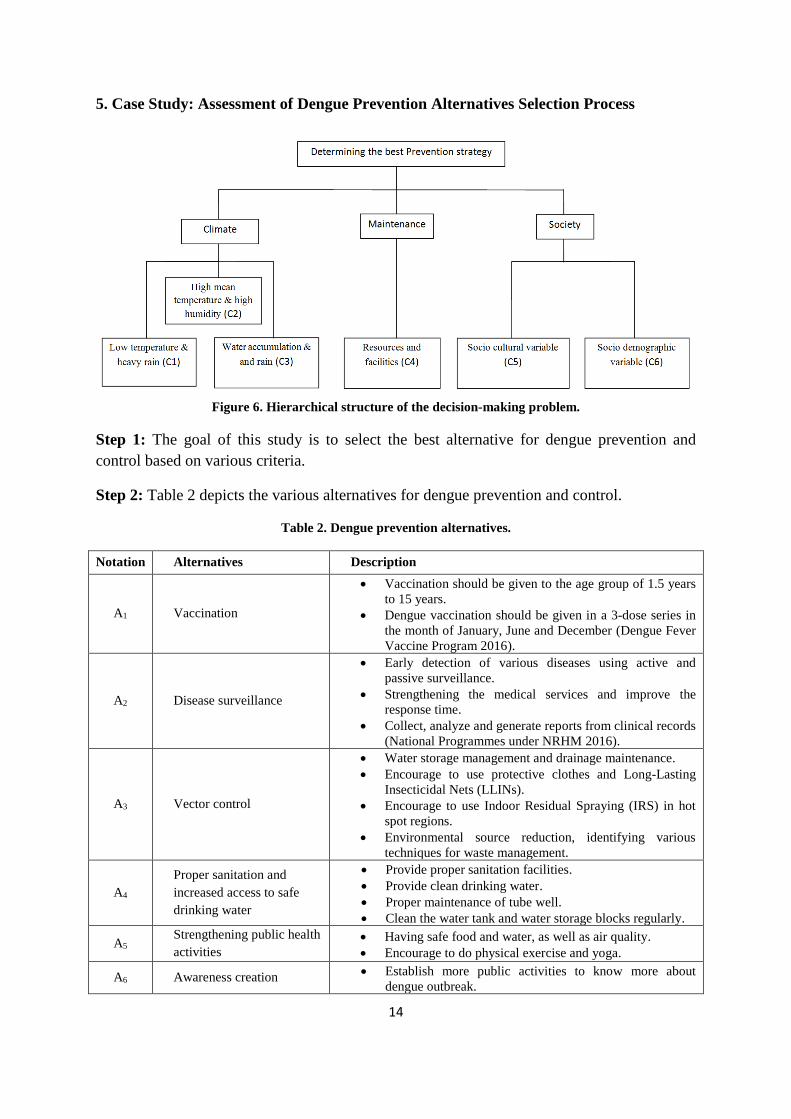
5. Case Study: Assessment of Dengue Prevention Alternatives Selection Process
Figure 6. Hierarchical structure of the decision-making problem.
Step 1: The goal of this study is to select the best alternative for dengue prevention and
control based on various criteria.
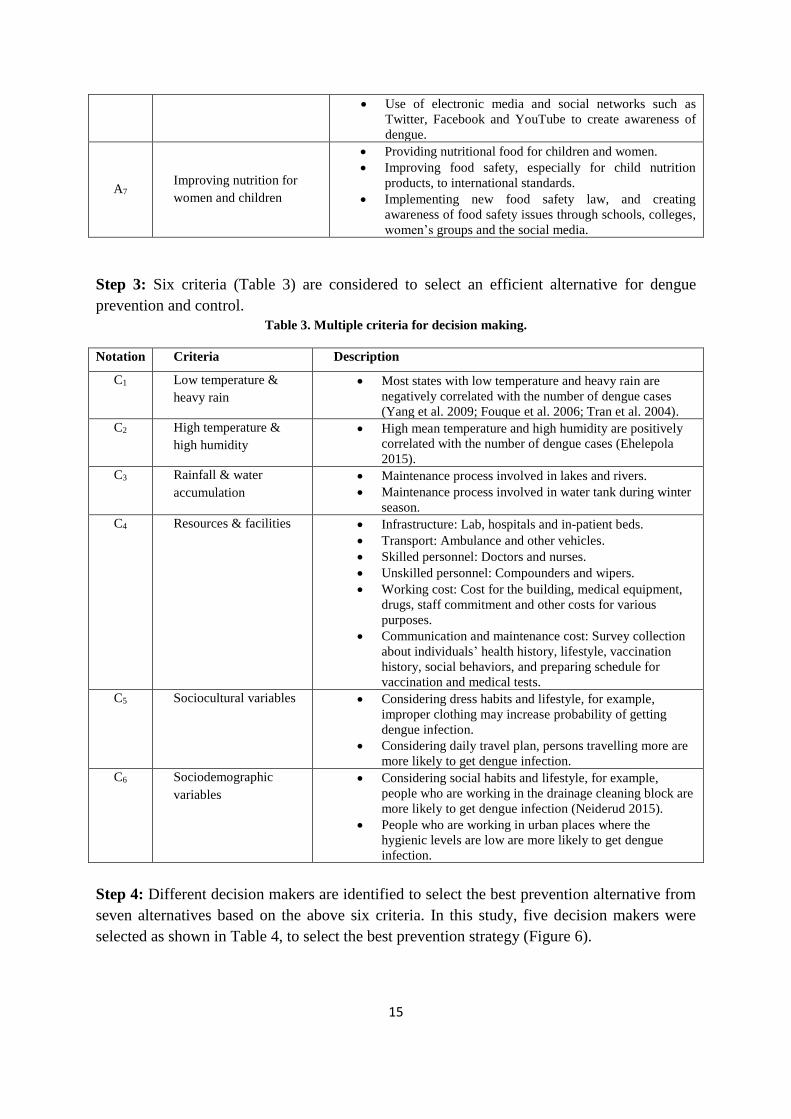
Step 2: Table 2 depicts the various alternatives for dengue prevention and control.
Table 2. Dengue prevention alternatives.
Notation Alternatives Description
A1 Vaccination
• Vaccination should be given to the age group of 1.5 years
to 15 years.
• Dengue vaccination should be given in a 3-dose series in
the month of January, June and December (Dengue Fever
Vaccine Program 2016).
A2 Disease surveillance
• Early detection of various diseases using active and
passive surveillance.
• Strengthening the medical services and improve the
response time.
• Collect, analyze and generate reports from clinical records
(National Programmes under NRHM 2016).
A3 Vector control
• Water storage management and drainage maintenance.
• Encourage to use protective clothes and Long-Lasting
Insecticidal Nets (LLINs).
• Encourage to use Indoor Residual Spraying (IRS) in hot
spot regions.
• Environmental source reduction, identifying various
techniques for waste management.
A4
Proper sanitation and
increased access to safe
drinking water
• Provide proper sanitation facilities.
• Provide clean drinking water.
• Proper maintenance of tube well.
• Clean the water tank and water storage blocks regularly.
A5 Strengthening public health
activities
• Having safe food and water, as well as air quality.
• Encourage to do physical exercise and yoga.
A6 Awareness creation • Establish more public activities to know more about
dengue outbreak.
15
• Use of electronic media and social networks such as
Twitter, Facebook and YouTube to create awareness of
dengue.
A7 Improving nutrition for
women and children
• Providing nutritional food for children and women.
• Improving food safety, especially for child nutrition
products, to international standards.
• Implementing new food safety law, and creating
awareness of food safety issues through schools, colleges,
women’s groups and the social media.
Step 3: Six criteria (Table 3) are considered to select an efficient alternative for dengue
prevention and control.
Table 3. Multiple criteria for decision making.
Notation Criteria Description
C1 Low temperature &
heavy rain
• Most states with low temperature and heavy rain are
negatively correlated with the number of dengue cases
(Yang et al. 2009; Fouque et al. 2006; Tran et al. 2004).
C2 High temperature &
high humidity
• High mean temperature and high humidity are positively
correlated with the number of dengue cases (Ehelepola
2015).
C3 Rainfall & water
accumulation
• Maintenance process involved in lakes and rivers.
• Maintenance process involved in water tank during winter
season.
C4 Resources & facilities • Infrastructure: Lab, hospitals and in-patient beds.
• Transport: Ambulance and other vehicles.
• Skilled personnel: Doctors and nurses.
• Unskilled personnel: Compounders and wipers.
• Working cost: Cost for the building, medical equipment,
drugs, staff commitment and other costs for various
purposes.
• Communication and maintenance cost: Survey collection
about individuals’ health history, lifestyle, vaccination
history, social behaviors, and preparing schedule for
vaccination and medical tests.
C5 Sociocultural variables • Considering dress habits and lifestyle, for example,
improper clothing may increase probability of getting
dengue infection.
• Considering daily travel plan, persons travelling more are
more likely to get dengue infection.
C6 Sociodemographic
variables
• Considering social habits and lifestyle, for example,
people who are working in the drainage cleaning block are
more likely to get dengue infection (Neiderud 2015).
• People who are working in urban places where the
hygienic levels are low are more likely to get dengue
infection.
Step 4: Different decision makers are identified to select the best prevention alternative from
seven alternatives based on the above six criteria. In this study, five decision makers were
selected as shown in Table 4, to select the best prevention strategy (Figure 6).
16
Table 4. Decision makers.
Decision Makers Profession
DM1 Medical Officer from Women & Child Development
DM2 Regional Officer from Health & Family Welfare
DM3 Head Officer from Housing and Urban Poverty Alleviation
DM4 Director from Ministry of Health & Family Welfare
DM5 Chief Officer from Ministry of Social Justice & Empowerment
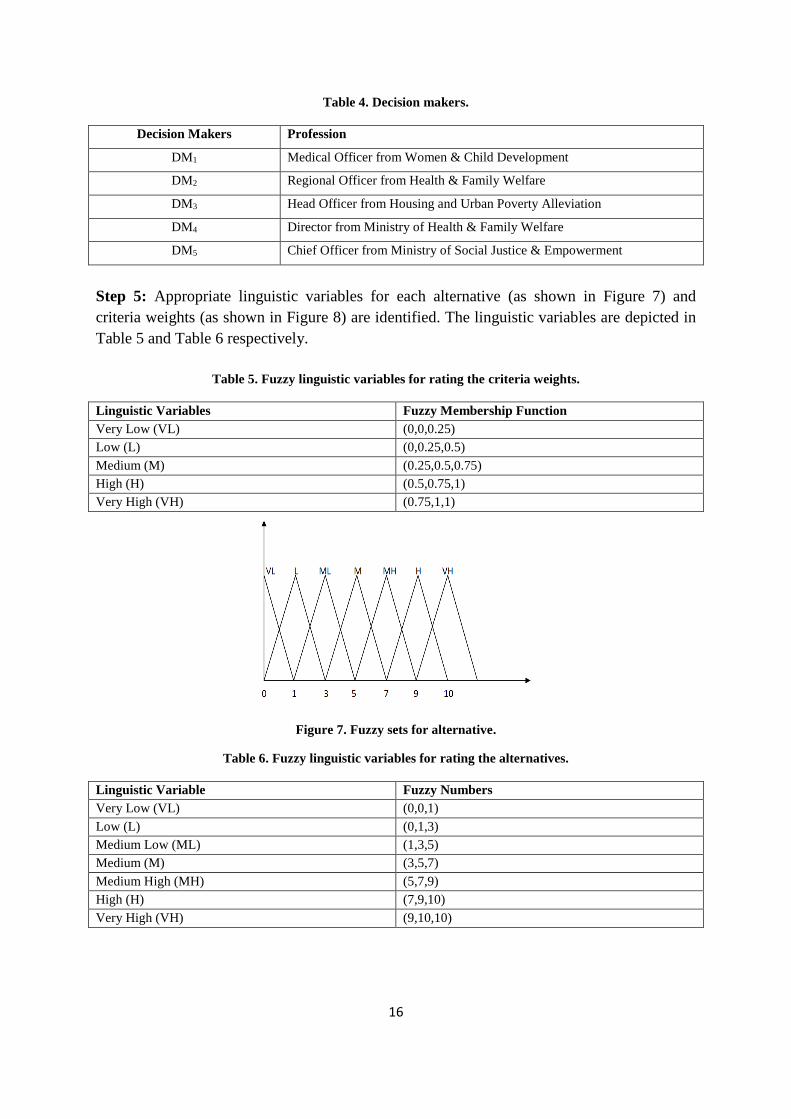
Step 5: Appropriate linguistic variables for each alternative (as shown in Figure 7) and
criteria weights (as shown in Figure 8) are identified. The linguistic variables are depicted in
Table 5 and Table 6 respectively.
Table 5. Fuzzy linguistic variables for rating the criteria weights.
Linguistic Variables Fuzzy Membership Function
Very Low (VL) (0,0,0.25)
Low (L) (0,0.25,0.5)
Medium (M) (0.25,0.5,0.75)
High (H) (0.5,0.75,1)
Very High (VH) (0.75,1,1)
Figure 7. Fuzzy sets for alternative.
Table 6. Fuzzy linguistic variables for rating the alternatives.
Linguistic Variable Fuzzy Numbers
Very Low (VL) (0,0,1)
Low (L) (0,1,3)
Medium Low (ML) (1,3,5)
Medium (M) (3,5,7)
Medium High (MH) (5,7,9)
High (H) (7,9,10)
Very High (VH) (9,10,10)
17
Figure 8. Fuzzy sets for criteria weights.
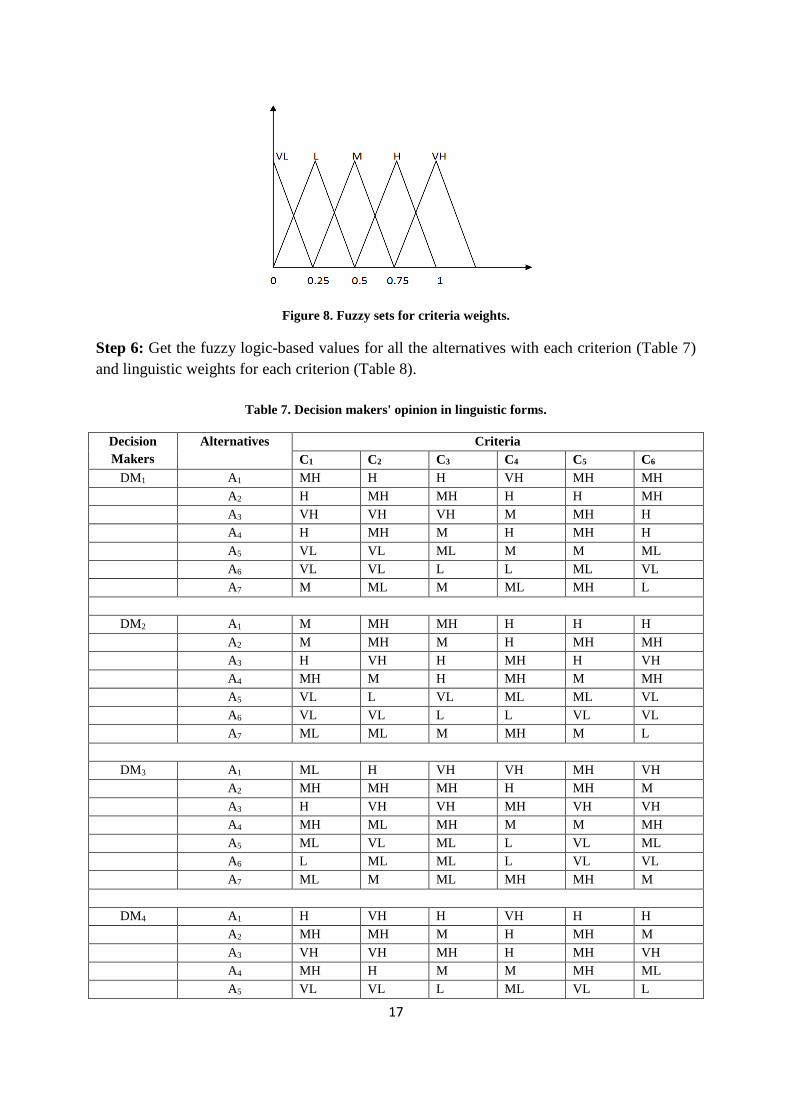
Step 6: Get the fuzzy logic-based values for all the alternatives with each criterion (Table 7)
and linguistic weights for each criterion (Table 8).
Table 7. Decision makers' opinion in linguistic forms.
Decision
Makers
Alternatives Criteria
C1 C2 C3 C4 C5 C6
DM1 A1 MH H H VH MH MH
A2 H MH MH H H MH
A3 VH VH VH M MH H
A4 H MH M H MH H
A5 VL VL ML M M ML
A6 VL VL L L ML VL
A7 M ML M ML MH L
DM2 A1 M MH MH H H H
A2 M MH M H MH MH
A3 H VH H MH H VH
A4 MH M H MH M MH
A5 VL L VL ML ML VL
A6 VL VL L L VL VL
A7 ML ML M MH M L
DM3 A1 ML H VH VH MH VH
A2 MH MH MH H MH M
A3 H VH VH MH VH VH
A4 MH ML MH M M MH
A5 ML VL ML L VL ML
A6 L ML ML L VL VL
A7 ML M ML MH MH M
DM4 A1 H VH H VH H H
A2 MH MH M H MH M
A3 VH VH MH H MH VH
A4 MH H M M MH ML
A5 VL VL L ML VL L
18
A6 VL L VL L VL VL
A7 ML ML M ML M M
DM5 A1 MH VH H H MH MH
A2 M H H MH M M
A3 VH MH VH VH MH MH
A4 MH M M MH MH M
A5 V`L L ML ML L VL
A6 L VL VL L VL VL
A7 ML M ML ML ML ML
Table 8. Fuzzy rating of criteria weights.
Decision
Makers
Criteria
C1 C2 C3 C4 C5 C6
DM1 H M VH M L H
DM2 VH H M M M M
DM3 VH H M L L H
DM4 H H H M M L
DM5 H M H H M M
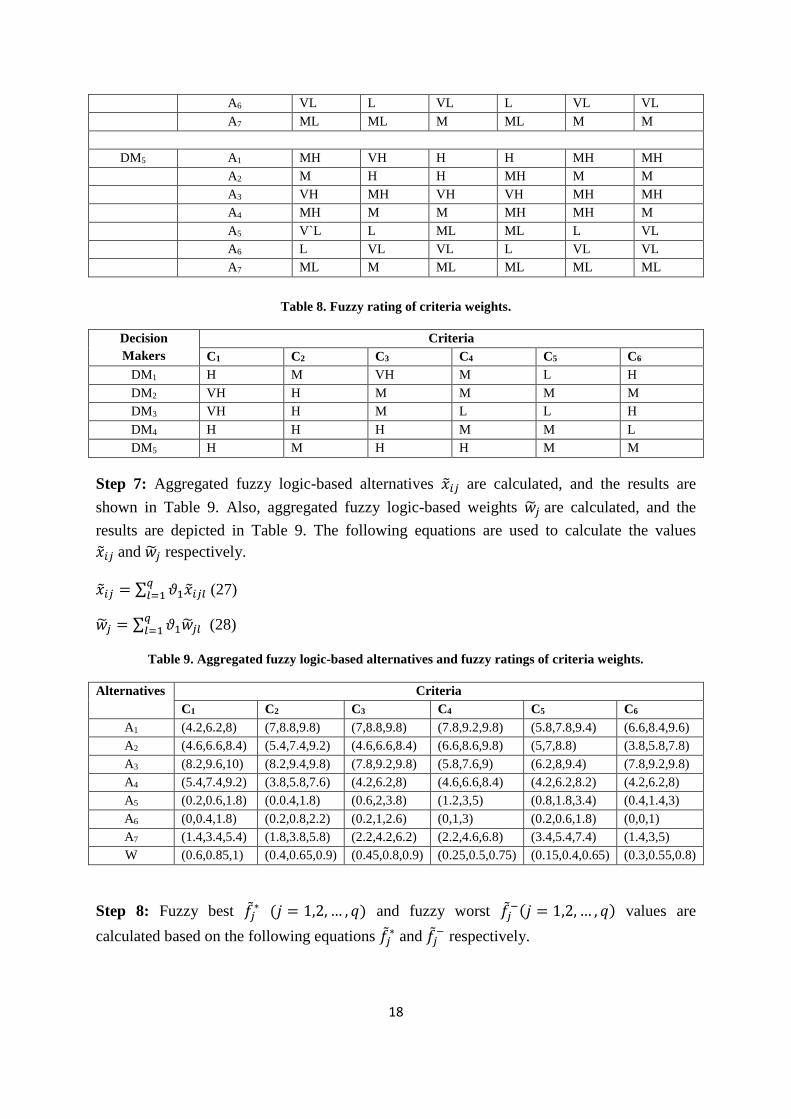
Step 7: Aggregated fuzzy logic-based alternatives �̃�𝑖𝑗 are calculated, and the results are
shown in Table 9. Also, aggregated fuzzy logic-based weights �̃�𝑗 are calculated, and the
results are depicted in Table 9. The following equations are used to calculate the values
�̃�𝑖𝑗 and �̃�𝑗 respectively.
�̃�𝑖𝑗 = ∑ 𝜗1�̃�𝑖𝑗𝑙𝑞𝑙=1 (27)
�̃�𝑗 = ∑ 𝜗1�̃�𝑗𝑙𝑞𝑙=1 (28)
Table 9. Aggregated fuzzy logic-based alternatives and fuzzy ratings of criteria weights.
Alternatives Criteria
C1 C2 C3 C4 C5 C6
A1 (4.2,6.2,8) (7,8.8,9.8) (7,8.8,9.8) (7.8,9.2,9.8) (5.8,7.8,9.4) (6.6,8.4,9.6)
A2 (4.6,6.6,8.4) (5.4,7.4,9.2) (4.6,6.6,8.4) (6.6,8.6,9.8) (5,7,8.8) (3.8,5.8,7.8)
A3 (8.2,9.6,10) (8.2,9.4,9.8) (7.8,9.2,9.8) (5.8,7.6,9) (6.2,8,9.4) (7.8,9.2,9.8)
A4 (5.4,7.4,9.2) (3.8,5.8,7.6) (4.2,6.2,8) (4.6,6.6,8.4) (4.2,6.2,8.2) (4.2,6.2,8)
A5 (0.2,0.6,1.8) (0.0.4,1.8) (0.6,2,3.8) (1.2,3,5) (0.8,1.8,3.4) (0.4,1.4,3)
A6 (0,0.4,1.8) (0.2,0.8,2.2) (0.2,1,2.6) (0,1,3) (0.2,0.6,1.8) (0,0,1)
A7 (1.4,3.4,5.4) (1.8,3.8,5.8) (2.2,4.2,6.2) (2.2,4.6,6.8) (3.4,5.4,7.4) (1.4,3,5)
W (0.6,0.85,1) (0.4,0.65,0.9) (0.45,0.8,0.9) (0.25,0.5,0.75) (0.15,0.4,0.65) (0.3,0.55,0.8)
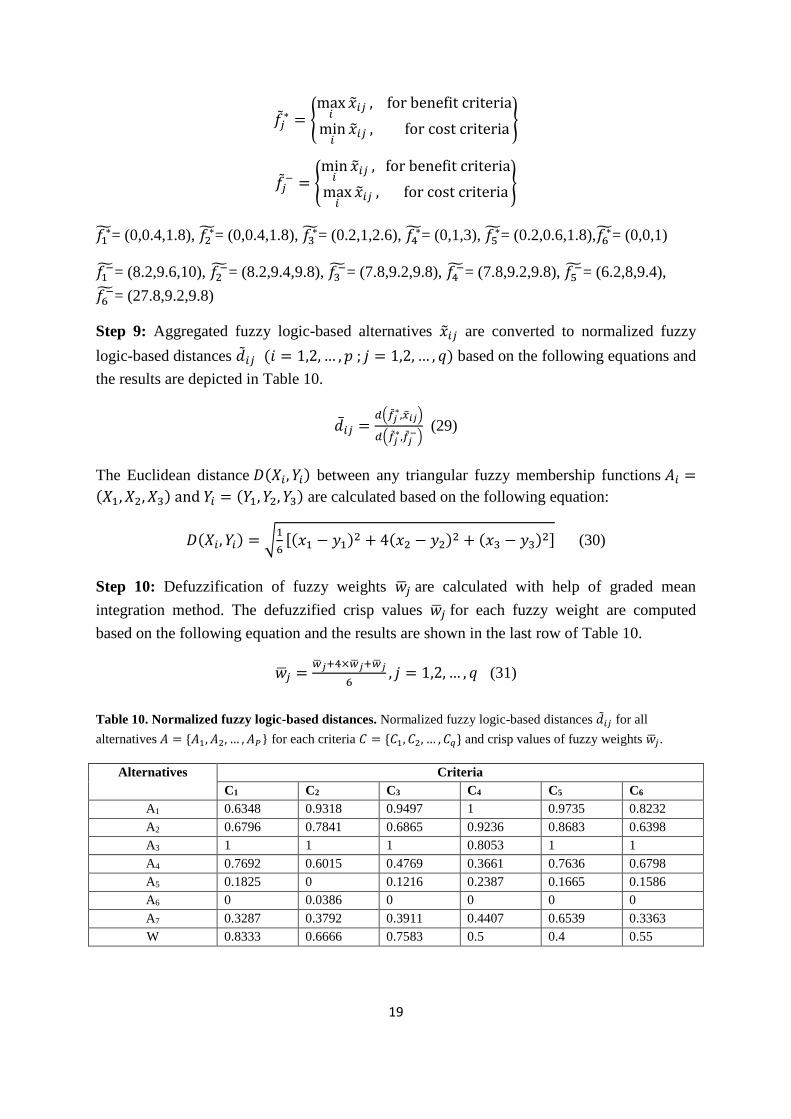
Step 8: Fuzzy best 𝑓𝑗∗ (𝑗 = 1,2, … , 𝑞) and fuzzy worst 𝑓𝑗
−(𝑗 = 1,2, … , 𝑞) values are
calculated based on the following equations 𝑓𝑗∗ and 𝑓𝑗
− respectively.
19
𝑓𝑗∗ = {
max𝑖�̃�𝑖𝑗 , for benefit criteria
min𝑖�̃�𝑖𝑗 , for cost criteria
}
𝑓𝑗− = {
min𝑖�̃�𝑖𝑗 , for benefit criteria
max𝑖�̃�𝑖𝑗 , for cost criteria
}
𝑓1∗̃= (0,0.4,1.8), 𝑓2
∗̃= (0,0.4,1.8), 𝑓3∗̃= (0.2,1,2.6), 𝑓4
∗̃= (0,1,3), 𝑓5∗̃= (0.2,0.6,1.8),𝑓6
∗̃= (0,0,1)
𝑓1−̃= (8.2,9.6,10), 𝑓2
−̃= (8.2,9.4,9.8), 𝑓3−̃= (7.8,9.2,9.8), 𝑓4
−̃= (7.8,9.2,9.8), 𝑓5−̃= (6.2,8,9.4),
𝑓6−̃= (27.8,9.2,9.8)
Step 9: Aggregated fuzzy logic-based alternatives �̃�𝑖𝑗 are converted to normalized fuzzy
logic-based distances �̃�𝑖𝑗 (𝑖 = 1,2, … , 𝑝 ; 𝑗 = 1,2, … , 𝑞) based on the following equations and
the results are depicted in Table 10.
�̅�𝑖𝑗 =𝑑(�̃�𝑗
∗,�̃�𝑖𝑗)
𝑑(�̃�𝑗∗,�̃�𝑗
−) (29)
The Euclidean distance 𝐷(𝑋𝑖, 𝑌𝑖) between any triangular fuzzy membership functions 𝐴𝑖 =
(𝑋1, 𝑋2, 𝑋3) and 𝑌𝑖 = (𝑌1, 𝑌2, 𝑌3) are calculated based on the following equation:
𝐷(𝑋𝑖, 𝑌𝑖) = √1
6[(𝑥1 − 𝑦1)2 + 4(𝑥2 − 𝑦2)2 + (𝑥3 − 𝑦3)2] (30)
Step 10: Defuzzification of fuzzy weights �̅�𝑗 are calculated with help of graded mean
integration method. The defuzzified crisp values �̅�𝑗 for each fuzzy weight are computed
based on the following equation and the results are shown in the last row of Table 10.
�̅�𝑗 =�̅�𝑗+4×�̅�𝑗+�̅�𝑗
6, 𝑗 = 1,2, … , 𝑞 (31)
Table 10. Normalized fuzzy logic-based distances. Normalized fuzzy logic-based distances �̃�𝑖𝑗 for all
alternatives 𝐴 = {𝐴1, 𝐴2, … , 𝐴𝑃} for each criteria 𝐶 = {𝐶1, 𝐶2, … , 𝐶𝑞} and crisp values of fuzzy weights �̅�𝑗.
Alternatives Criteria
C1 C2 C3 C4 C5 C6
A1 0.6348 0.9318 0.9497 1 0.9735 0.8232
A2 0.6796 0.7841 0.6865 0.9236 0.8683 0.6398
A3 1 1 1 0.8053 1 1
A4 0.7692 0.6015 0.4769 0.3661 0.7636 0.6798
A5 0.1825 0 0.1216 0.2387 0.1665 0.1586
A6 0 0.0386 0 0 0 0
A7 0.3287 0.3792 0.3911 0.4407 0.6539 0.3363
W 0.8333 0.6666 0.7583 0.5 0.4 0.55
20
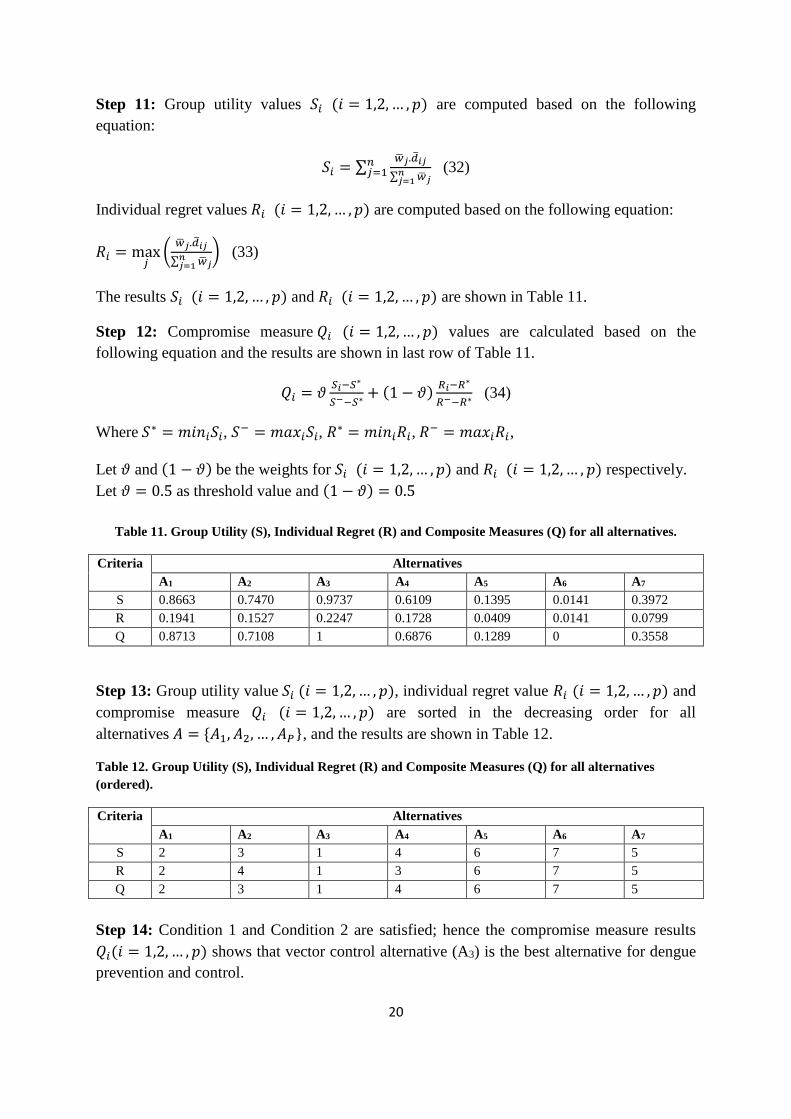
Step 11: Group utility values 𝑆𝑖 (𝑖 = 1,2, … , 𝑝) are computed based on the following
equation:
𝑆𝑖 = ∑�̅�𝑗.�̅�𝑖𝑗
∑ �̅�𝑗𝑛𝑗=1
𝑛𝑗=1 (32)
Individual regret values 𝑅𝑖 (𝑖 = 1,2, … , 𝑝) are computed based on the following equation:
𝑅𝑖 = max𝑗(�̅�𝑗.�̅�𝑖𝑗
∑ �̅�𝑗𝑛𝑗=1
) (33)
The results 𝑆𝑖 (𝑖 = 1,2, … , 𝑝) and 𝑅𝑖 (𝑖 = 1,2, … , 𝑝) are shown in Table 11.
Step 12: Compromise measure 𝑄𝑖 (𝑖 = 1,2, … , 𝑝) values are calculated based on the
following equation and the results are shown in last row of Table 11.
𝑄𝑖 = 𝜗𝑆𝑖−𝑆
∗
𝑆−−𝑆∗+ (1 − 𝜗)
𝑅𝑖−𝑅∗
𝑅−−𝑅∗ (34)
Where 𝑆∗ = 𝑚𝑖𝑛𝑖𝑆𝑖, 𝑆− = 𝑚𝑎𝑥𝑖𝑆𝑖, 𝑅
∗ = 𝑚𝑖𝑛𝑖𝑅𝑖, 𝑅− = 𝑚𝑎𝑥𝑖𝑅𝑖,
Let 𝜗 and (1 − 𝜗) be the weights for 𝑆𝑖 (𝑖 = 1,2, … , 𝑝) and 𝑅𝑖 (𝑖 = 1,2, … , 𝑝) respectively.
Let 𝜗 = 0.5 as threshold value and (1 − 𝜗) = 0.5
Table 11. Group Utility (S), Individual Regret (R) and Composite Measures (Q) for all alternatives.
Criteria Alternatives
A1 A2 A3 A4 A5 A6 A7
S 0.8663 0.7470 0.9737 0.6109 0.1395 0.0141 0.3972
R 0.1941 0.1527 0.2247 0.1728 0.0409 0.0141 0.0799
Q 0.8713 0.7108 1 0.6876 0.1289 0 0.3558
Step 13: Group utility value 𝑆𝑖 (𝑖 = 1,2, … , 𝑝), individual regret value 𝑅𝑖 (𝑖 = 1,2, … , 𝑝) and
compromise measure 𝑄𝑖 (𝑖 = 1,2, … , 𝑝) are sorted in the decreasing order for all
alternatives 𝐴 = {𝐴1, 𝐴2, … , 𝐴𝑃}, and the results are shown in Table 12.
Table 12. Group Utility (S), Individual Regret (R) and Composite Measures (Q) for all alternatives
(ordered).
Criteria Alternatives
A1 A2 A3 A4 A5 A6 A7
S 2 3 1 4 6 7 5
R 2 4 1 3 6 7 5
Q 2 3 1 4 6 7 5
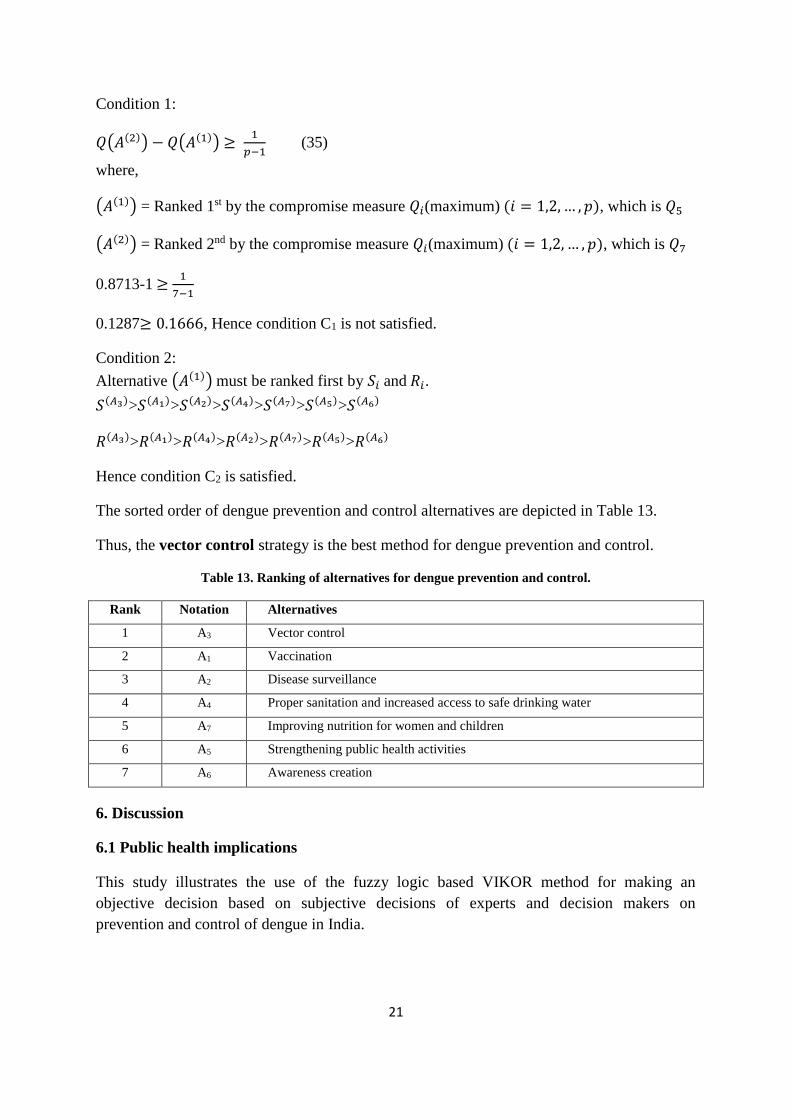
Step 14: Condition 1 and Condition 2 are satisfied; hence the compromise measure results
𝑄𝑖(𝑖 = 1,2, … , 𝑝) shows that vector control alternative (A3) is the best alternative for dengue
prevention and control.
21
Condition 1:
𝑄(𝐴(2)) − 𝑄(𝐴(1)) ≥ 1
𝑝−1 (35)
where,
(𝐴(1)) = Ranked 1st by the compromise measure 𝑄𝑖(maximum) (𝑖 = 1,2, … , 𝑝), which is 𝑄5
(𝐴(2)) = Ranked 2nd by the compromise measure 𝑄𝑖(maximum) (𝑖 = 1,2, … , 𝑝), which is 𝑄7
0.8713-1 ≥ 1
7−1
0.1287≥ 0.1666, Hence condition C1 is not satisfied.
Condition 2:
Alternative (𝐴(1)) must be ranked first by 𝑆𝑖 and 𝑅𝑖.
𝑆(𝐴3)>𝑆(𝐴1)>𝑆(𝐴2)>𝑆(𝐴4)>𝑆(𝐴7)>𝑆(𝐴5)>𝑆(𝐴6)
𝑅(𝐴3)>𝑅(𝐴1)>𝑅(𝐴4)>𝑅(𝐴2)>𝑅(𝐴7)>𝑅(𝐴5)>𝑅(𝐴6)
Hence condition C2 is satisfied.
The sorted order of dengue prevention and control alternatives are depicted in Table 13.
Thus, the vector control strategy is the best method for dengue prevention and control.
Table 13. Ranking of alternatives for dengue prevention and control.
Rank Notation Alternatives
1 A3 Vector control
2 A1 Vaccination
3 A2 Disease surveillance
4 A4 Proper sanitation and increased access to safe drinking water
5 A7 Improving nutrition for women and children
6 A5 Strengthening public health activities
7 A6 Awareness creation
6. Discussion
6.1 Public health implications
This study illustrates the use of the fuzzy logic based VIKOR method for making an
objective decision based on subjective decisions of experts and decision makers on
prevention and control of dengue in India.
22
6.2 Public health decision making under uncertainty
We have presented a solution for public health decision making under certainty, by using the
fuzzy logic based VIKOR method for prioritization of interventions based on experts’
opinion for dengue prevention and control. Dynamic modeling of dengue transmission
dynamics provides another option for estimating the effectiveness and cost-effectiveness of
different interventions, as done in the Disease Control Priorities (DCP-3) project to estimate
efficacy and effectiveness of interventions for leading causes of global disease burden (DCP
2016).
6.3 Limitations
The limitation of this study is that the proposed model identifies the best alternative based on
the input of five decision makers in a single setting. Future work can extend the decision-
making framework for identification of best alternatives based on the inputs of different
groups of decision-makers in varied settings.
6.4 Conclusions
Professionals and administrators from the healthcare and other industries are jointly
designing healthcare strategies with the aim to enable efficient disease control programs
using the available resources. To consider the individual preferences of various stakeholders,
we have presented a multi-criteria decision-making framework. In the context of dengue, the
prevention and control programs are vaccination, disease surveillance, vector control,
improved sanitation and access to safe drinking water, strengthening public health activities,
awareness creation, and improving nutrition for women and children. The proposed
alternatives are selected based on people, space and time criteria, such as low temperature
and heavy rain, high temperature and high humidity, rainfall and water accumulation,
resources and facilities, sociocultural and sociodemographic variables. We used fuzzy logic
based VIKOR method to analyze the linguistic terms collected from decision makers and
ranked the best alternatives based on multiple criteria for selecting the optimal dengue
prevention and control programs.
References
Al-Harbi, K. M. A. S. (2001). Application of the AHP in project management. International
journal of project management, 19(1), 19-27.
Bellman, R. E., & Zadeh, L. A. (1970). Decision-making in a fuzzy environment.
Management science, 17(4), B-141.
Bhattacharjee, N., Mukherjee, K. K., Chakravarti, S. K., Mukherjee, M. K., De, P. N.,
Sengupta, M., ... & Chakraborty, M. S. (1993). Dengue hemorrhagic fever (DHF)
outbreak in Calcutta--1990. The Journal of communicable diseases, 25(1), 10-14.
Bradshaw, K., & Urquhart, C. (2015). Theory and practice in strategic planning for health
information systems.
Broekhuizen, H., Groothuis-Oudshoorn, C. G., Til, J. A., Hummel, J. M., & IJzerman, M. J.
(2015). A review and classification of approaches for dealing with uncertainty in multi-
23
criteria decision analysis for healthcare decisions. Pharmacoeconomics, 33(5), 445-
455.
Broor, S., Dar, L., Sengupta, S., Chakaraborty, M., Wali, J. P., Biswas, A., ... & Seth, P.
(1997). Recent dengue epidemic in Delhi, India. Factors in the emergence of arbovirus
diseases. Paris: Elsevier, 123-7.
Carey, D. E., Myers, R. M., Reuben, R., & Rodrigues, F. M. (1966). Studies on dengue in
Vellore, South India. American journal of tropical medicine and hygiene, 15(4), 580-
87.
Chen, C. T. (2000). Extensions of the TOPSIS for group decision-making under fuzzy
environment. Fuzzy sets and systems, 114(1), 1-9
Chen, T. Y., Ku, T. C., & Tsui, C. W. (2008). Determining attribute importance based on
triangular and trapezoidal fuzzy numbers in (z) fuzzy measures. In The 19th
International Conference on Multiple Criteria Decision Making (pp. 75-76).
Cromwell, I., Peacock, S. J., & Mitton, C. (2015). ‘Real-world’ health care priority setting
using explicit decision criteria: a systematic review of the literature. BMC health
services research, 15(1), 1.
D. Lopez and G. Sekaran, "Climate change and disease dynamics - A big data perspective",
International Journal of Infectious Diseases, vol. 45, pp. 23-24, 2016.
Dar, L., Broor, S., Sengupta, S., Xess, I., & Seth, P. (1999). The first major outbreak of
dengue hemorrhagic fever in Delhi, India. Emerging infectious diseases, 5(4), 589.
DCP. Disease Control Priorities. http://dcp-3.org/. (Accessed 15 August 2016)
De, S. K., Biswas, R., & Roy, A. R. (2001). An application of intuitionistic fuzzy sets in
medical diagnosis. Fuzzy sets and Systems, 117(2), 209-213.
Dehe, B., & Bamford, D. (2015). Development, test and comparison of two Multiple Criteria
Decision Analysis (MCDA) models: A case of healthcare infrastructure location.
Expert Systems with Applications, 42(19), 6717-6727.
Dengue Fever Vaccine Program. (2016). Globalvaccines.org. Retrieved 16 September 2016,
from http://www.globalvaccines.org/content/dengue+fever+vaccine+program/19615
Ehelepola, N. D. B., Ariyaratne, K., Buddhadasa, W. M. N. P., Ratnayake, S., &
Wickramasinghe, M. (2015). A study of the correlation between dengue and weather in
Kandy City, Sri Lanka (2003-2012) and lessons learned. Infectious diseases of poverty,
4(1), 42.
Fouque F, Carinci R, Gaborit P, Issaly J, Bicout DJ, et al. (2006) Aedes aegypti survival and
dengue transmission patterns in French Guiana. J Vector Ecol 31: 390–399.
Frishammar, J. (2003). Information use in strategic decision making. Management Decision,
41(4), 318-326.
Gandhi, U. D., Kumar, P. M., Varatharajan, R., Manogaran, G., Sundarasekar, R., & Kadu, S.
(2018). HIoTPOT: Surveillance on IoT Devices against Recent Threats. Wireless
Personal Communications, 1-16.
Ghandour, R., Shoaibi, A., Khatib, R., Rmeileh, N. A., Unal, B., Sözmen, K., ... & Aissi, W.
(2015). Priority setting for the prevention and control of cardiovascular diseases: multi-
criteria decision analysis in four eastern Mediterranean countries. International journal
of public health, 60(1), 73-81.
Gunduz, H. I., Hempsch, C. K., & Sebastian, H. J. (2015). Recent Advances in Strategic and
Tactical Planning of Distribution Subnetworks for Letter Mail. In Quantitative
Approaches in Logistics and Supply Chain Management (pp. 105-128). Springer
International Publishing.
24
Gupta, E., Dar, L., Narang, P., Srivastava, V. K., & Broor, S. (2005). Serodiagnosis of
dengue during an outbreak at a tertiary care hospital in Delhi. Indian Journal of
Medical Research, 121(1), 36.
Herriman, R. (2016). India: Dengue cases double, malaria cases down in 2015 | Outbreak
News Today. Outbreaknewstoday.com. Retrieved 16 September 2016, from
http://outbreaknewstoday.com/india-dengue-cases-double-malaria-cases-down-in-2015-
2015/
Hulshof, P. J., Kortbeek, N., Boucherie, R. J., Hans, E. W., & Bakker, P. J. (2012).
Taxonomic classification of planning decisions in health care: a structured review of
the state of the art in OR/MS. Health systems, 1(2), 129-175.
India, P. (2016). Delhi Faces Worst Dengue Outbreak Since 1996. Over 12,000 Cases
Reported. NDTV.com. Retrieved 16 September 2016, from http://www.ndtv.com/delhi-
news/delhi-faces-worst-dengue-outbreak-since-1996-over-12-000-cases-reported-
1232700
Institute for Health Metrics and Evaluation (IHME). GBD Compare. Seattle, WA: IHME,
University of Washington, 2015. Available from http://vizhub.healthdata.org/gbd-
compare. (Accessed 15 August 2016)
Jato-Espino, D., Castillo-Lopez, E., Rodriguez-Hernandez, J., & Canteras-Jordana, J. C.
(2014). A review of application of multi-criteria decision-making methods in
construction. Automation in Construction, 45, 151-162.
Kumar, P. M., Gandhi, U., Varatharajan, R., Manogaran, G., Jidhesh, R., & Vadivel, T.
(2017). Intelligent face recognition and navigation system using neural learning for
smart security in Internet of Things. Cluster Computing, 1-12.
Liu, H. C., You, J. X., You, X. Y., & Shan, M. M. (2014). A novel approach for failure mode
and effects analysis using combination weighting and fuzzy VIKOR method. Applied
Soft Computing.
Lopez, D., & Gunasekaran, M. (2015). Assessment of Vaccination Strategies Using Fuzzy
Multi-criteria Decision Making. In Proceedings of the Fifth International Conference
on Fuzzy and Neuro Computing (FANCCO-2015) (pp. 195-208). Springer International
Publishing.
Lopez, D., & Manogaran, G. (2016). Big Data Architecture for Climate Change and Disease
Dynamics, Eds. Geetam S. Tomar et al. The Human Element of Big Data: Issues,
Analytics,
Lopez, D., & Manogaran, G. (2017a). Parametric Model to Predict H1N1 Influenza in
Vellore District, Tamil Nadu, India. In Handbook of Statistics (Vol. 37, pp. 301-316).
Elsevier.
Lopez, D., & Manogaran, G., Jagan, J. (2017b). Modelling the H1N1 influenza using
mathematical and neural network approaches, Biomedical Research, 28(8), 1-5.
Lopez, D., Gunasekaran, M., Murugan, B. S., Kaur, H., & Abbas, K. M. (2014, October).
Spatial big data analytics of influenza epidemic in Vellore, India. In Proceedings of the
2014 IEEE International Conference on Big Data (pp. 19-24). IEEE.
Lu, S. T., Lin, C. W., & Ko, P. H. (2007, September). Application of analytic network
process (ANP) in assessing construction risk of urban bridge project. In Second
International Conference on Innovative Computing, Information and Control (ICICIC
2007).
Manogaran, G., & Lopez, D. (2017b). Disease surveillance system for big climate data
processing and dengue transmission. International Journal of Ambient Computing and
Intelligence (IJACI), 8(2), 88-105.
25
Manogaran, G., & Lopez, D. (2017f). A survey of big data architectures and machine
learning algorithms in healthcare. International Journal of Biomedical Engineering and
Technology, 25(2-4), 182-211.
Manogaran, G., & Lopez, D. (2017h). Spatial cumulative sum algorithm with big data
analytics for climate change detection. Computers & Electrical Engineering.
Manogaran, G., & Lopez, D. (2017i). A Gaussian process based big data processing
framework in cluster computing environment. Cluster Computing, 1-16.
Manogaran, G., & Lopez, D., (2016). Health Data Analytics using Scalable Logistic
Regression with Stochastic Gradient Descent. International Journal of Advanced
Intelligence Paradigms, 9, 1-15.
Manogaran, G., Lopez, D., Thota, C., Abbas, K. M., Pyne, S., & Sundarasekar, R. (2017c).
Big data analytics in healthcare Internet of Things. In Innovative Healthcare Systems
for the 21st Century (pp. 263-284). Springer International Publishing.
Manogaran, G., Thota, C., & Lopez, D. (2018). Human-computer interaction with big data
analytics. In HCI Challenges and Privacy Preservation in Big Data Security (pp. 1-22).
IGI Global.
Manogaran, G., Thota, C., Lopez, D., Vijayakumar, V., Abbas, K. M., & Sundarsekar, R.
(2017a). Big Data Knowledge System in Healthcare. In Internet of Things and Big Data
Technologies for Next Generation Healthcare (pp. 133-157). Springer International
Publishing.
Manogaran, G., Varatharajan, R., & Priyan, M. K. (2017g). Hybrid Recommendation System
for Heart Disease Diagnosis based on Multiple Kernel Learning with Adaptive Neuro-
Fuzzy Inference System. Multimedia Tools and Applications, 1-21.
Manogaran, G., Varatharajan, R., Lopez, D., Kumar, P. M., Sundarasekar, R., & Thota, C.
(2017d). A new architecture of Internet of Things and big data ecosystem for secured
smart healthcare monitoring and alerting. Future Generation Computer Systems.
Manogaran, G., Vijayakumar, V., Varatharajan, R., Kumar, P. M., Sundarasekar, R., & Hsu,
C. H. (2017e) Machine Learning Based Big Data Processing Framework for Cancer
Diagnosis Using Hidden Markov Model and GM Clustering. Wireless Personal
Communications, 1-18.
Martina, B. E., Koraka, P., & Osterhaus, A. D. (2009). Dengue virus pathogenesis: an
integrated view. Clinical microbiology reviews, 22(4), 564-581.
Massad, E., Burattini, M. N., & Ortega, N. R. (1999). Fuzzy logic and measles vaccination:
designing a control strategy. International journal of epidemiology, 28(3), 550-557.
Murray CJL, Barber RM, Foreman KJ, et al. Global, regional, and national disability‐adjusted
lifeyears (DALYs) for 306 diseases and injuries and healthy life expectancy (HALE)
for 188 countries, 1990–2013: quantifying the epidemiological transition. The Lancet
2015; 386: 2145–91.
Nath, D. (2015). Dengue cases: Delhi sets record in 20 years. The Hindu. Retrieved 16
September 2016, from http://www.thehindu.com/news/cities/Delhi/dengue-cases-
capital-sets-record-in-20-years/article7767767.ece
National Programmes under NRHM, Annual Report 2013-14, (2016). MOHFW. Retrieved 16
September 2016, from http://www.mohfw.nic.in/WriteReadData/l892s/Chapter615.pdf
Neiderud, C. J. (2015). How urbanization affects the epidemiology of emerging infectious
diseases. Infection ecology & epidemiology, 5(1), 27060.
NVBDCP | National Vector Borne Disease Control Programme. (2016). Nvbdcp.gov.in.
Retrieved 16 September 2016, from http://nvbdcp.gov.in/den-cd.html
NVBDCP | National Vector Borne Disease Control Programme. (2018). Nvbdcp.gov.in.
Retrieved 31 January 2018, from http://nvbdcp.gov.in/iec.html
26
Opricovic, S., & Tzeng, G. H. (2007). Extended VIKOR method in comparison with
outranking methods. European journal of operational research, 178(2), 514-529.
Ozbek, M. E., de la Garza, J. M., & Triantis, K. (2010). Efficiency measurement of bridge
maintenance using data envelopment analysis. Journal of Infrastructure Systems, 16(1),
31-39.
Padbidri, V. S., Mahadev, P. V. M., Thakare, J. P., Pant, U., Ilkal, M. A., Varghese, G. G., ...
& et Athavale, S. S. (1996). Virological and entomological investigations of an
outbreak of dengue fever in Dhule district, Maharashtra. Indian Journal of Medical
Microbiology, 14(1), 25.
Parida, M. M., Dash, P. K., Upadhyay, C., Saxena, P., & Jana, A. M. (2002). Serological &
virological investigation of an outbreak of dengue fever in Gwalior, India. Indian
journal of medical research, 116, 248.
Phuong, N. H., & Kreinovich, V. (2001). Fuzzy logic and its applications in medicine.
International journal of medical informatics, 62(2), 165-173.
Rawal, B. S., Vijayakumar, V., Manogaran, G., Varatharajan, R., & Chilamkurti, N. (2018).
Secure Disintegration Protocol for Privacy Preserving Cloud Storage. Wireless
Personal Communications, 1-17.
Sarkar, J. K., Pavri, K. M., Chatterjee, S. N., Chakravarty, S. K., & Anderson, C. R. (1964).
Virological and Serological Studies of Cases of Haemorrhagic Fever in Calcutta.
Material Collected by the Calcutta School of Tropical Medicine. The Indian journal of
medical research, 52, 684.
Şimşek, B., İç, Y. T., & Şimşek, E. H. (2013). A TOPSIS-based Taguchi optimization to
determine optimal mixture proportions of the high strength self-compacting concrete.
Chemometrics and Intelligent Laboratory Systems, 125, 18-32.
Thota, C., Sundarasekar, R., Manogaran, G., Varatharajan, R., & Priyan, M. K. (2018).
Centralized Fog Computing Security Platform for IoT and Cloud in Healthcare System.
In Exploring the Convergence of Big Data and the Internet of Things (pp. 141-154).
IGI Global.
Tran A, Deparis X, Dussart P, Morvan J, Rabarison P, et al. (2004) Dengue spatial and
temporal patterns, French Guiana, 2001. Emerg Infect Dis 10: 615–621.
Tromp, N., & Baltussen, R. (2012). Mapping of multiple criteria for priority setting of health
interventions: an aid for decision makers. BMC health services research, 12(1), 1.
Varatharajan, R., Manogaran, G., & Priyan, M. K. (2017c). A big data classification approach
using LDA with an enhanced SVM method for ECG signals in cloud computing.
Multimedia Tools and Applications, 1-21.
Varatharajan, R., Manogaran, G., Priyan, M. K., & Sundarasekar, R. (2017b). Wearable
sensor devices for early detection of Alzheimer disease using dynamic time warping
algorithm. Cluster Computing, 1-10
Varatharajan, R., Manogaran, G., Priyan, M. K., Balaş, V. E., & Barna, C. (2017d). Visual
analysis of geospatial habitat suitability model based on inverse distance weighting
with paired comparison analysis. Multimedia Tools and Applications, 1-21.
Varatharajan, R., Vasanth, K., Gunasekaran, M., Priyan, M., & Gao, X. Z. (2017a). An
adaptive decision based kriging interpolation algorithm for the removal of high density
salt and pepper noise in images. Computers & Electrical Engineering.
Varkey, P., & Bennet, K. E. (2010). Practical techniques for strategic planning in health care
organizations. Physician Executive Journal, 36(2), 46-48.
Victor, T. J., Malathi, M., Asokan, R., & Padmanaban, P. (2007). Laboratory-based dengue
fever surveillance in Tamil Nadu, India. Indian Journal of Medical Research, 126(2),
112.
27
Wang, J., Xu, Y., & Li, Z. (2009). Research on project selection system of pre-evaluation of
engineering design project bidding. International Journal of Project Management,
27(6), 584-599.
WHO. (2016a). Who.int. Retrieved 16 September 2016, from
http://www.who.int/tdr/publications
WHO. Questions and Answers on Dengue Vaccines.
http://www.who.int/immunization/research/development/dengue_q_and_a/en/.
(Accessed 15 August 2016b)
Yang HM, Macoris MLG, Galvani KC, Andrighetti MTM, Wanderley DMV (2009)
Assessing the effects of temperature on the population of Aedes aegypti, the vector of
dengue. Epidemiol Infect 137: 1188–1202.
Zadeh, L. A. (1965). Fuzzy sets. Information and control, 8(3), 338-353.
Zadeh, L. A. (1975). The concept of a linguistic variable and its application to approximate
reasoning—II. Information sciences, 8(4), 301-357.