Embed Size (px)
Citation preview
An interferon-related gene signature for DNA damageresistance is a predictive marker for chemotherapyand radiation for breast cancerRalph R. Weichselbauma,b, Hemant Ishwaranc, Taewon Yoona,b, Dimitry S. A. Nuytend,e, Samuel W. Bakera,b,Nikolai Khodareva, Andy W. Sua,b, Arif Y. Shaikha,b, Paul Roachf, Bas Kreiked,e, Bernard Roizmang, Jonas Berghh,Yudi Pawitani, Marc J. van de Vijverd, and Andy J. Minna,b,1
aDepartment of Radiation and Cellular Oncology, bLudwig Center for Metastasis Research, fDepartment of Surgical Oncology, and gMarjorie B. Kovler ViralOncology Laboratories, University of Chicago, Chicago, IL 60637; cDepartment of Quantitative Health Sciences, Cleveland Clinic, Cleveland, OH 44195;dDepartments of Diagnostic Oncology and eRadiation Oncology, Netherlands Cancer Institute, 1066 CX Amsterdam, The Netherlands; and hDepartmentsof Oncology–Pathology and iMedical Epidemiology and Biostatistics, Karolinska Institutet, SE-171 77 Stockholm, Sweden
Contributed by Bernard Roizman, September 20, 2008 (sent for review August 1, 2008).
Individualization of cancer management requires prognostic mark-ers and therapy-predictive markers. Prognostic markers assess riskof disease progression independent of therapy, whereas therapy-predictive markers identify patients whose disease is sensitive orresistant to treatment. We show that an experimentally derivedIFN-related DNA damage resistance signature (IRDS) is associatedwith resistance to chemotherapy and/or radiation across differentcancer cell lines. The IRDS genes STAT1, ISG15, and IFIT1 all mediateexperimental resistance. Clinical analyses reveal that IRDS(�) andIRDS(�) states exist among common human cancers. In breastcancer, a seven–gene-pair classifier predicts for efficacy of adju-vant chemotherapy and for local-regional control after radiation.By providing information on treatment sensitivity or resistance,the IRDS improves outcome prediction when combined with stan-dard markers, risk groups, or other genomic classifiers.
A fter surgical resection of breast cancer, reducing the riskof death from metastasis with adjuvant chemotherapy
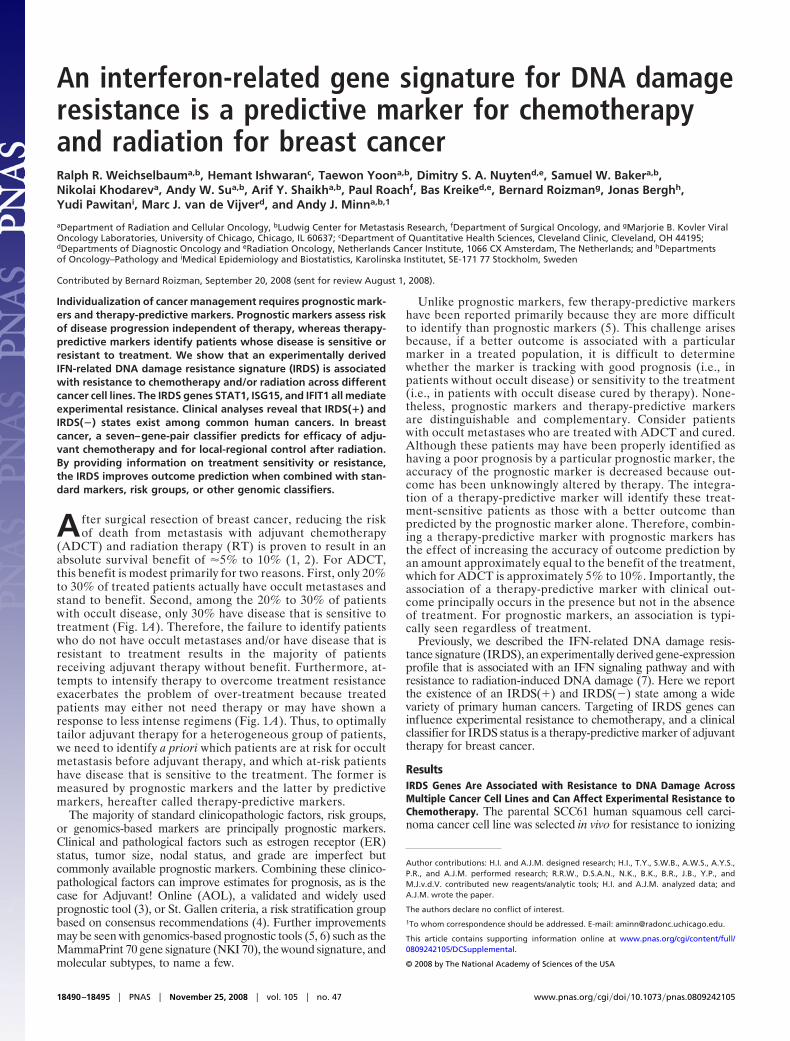
(ADCT) and radiation therapy (RT) is proven to result in anabsolute survival benefit of �5% to 10% (1, 2). For ADCT,this benefit is modest primarily for two reasons. First, only 20%to 30% of treated patients actually have occult metastases andstand to benefit. Second, among the 20% to 30% of patientswith occult disease, only 30% have disease that is sensitive totreatment (Fig. 1A). Therefore, the failure to identify patientswho do not have occult metastases and/or have disease that isresistant to treatment results in the majority of patientsreceiving adjuvant therapy without benefit. Furthermore, at-tempts to intensify therapy to overcome treatment resistanceexacerbates the problem of over-treatment because treatedpatients may either not need therapy or may have shown aresponse to less intense regimens (Fig. 1 A). Thus, to optimallytailor adjuvant therapy for a heterogeneous group of patients,we need to identify a priori which patients are at risk for occultmetastasis before adjuvant therapy, and which at-risk patientshave disease that is sensitive to the treatment. The former ismeasured by prognostic markers and the latter by predictivemarkers, hereafter called therapy-predictive markers.
The majority of standard clinicopathologic factors, risk groups,or genomics-based markers are principally prognostic markers.Clinical and pathological factors such as estrogen receptor (ER)status, tumor size, nodal status, and grade are imperfect butcommonly available prognostic markers. Combining these clinico-pathological factors can improve estimates for prognosis, as is thecase for Adjuvant! Online (AOL), a validated and widely usedprognostic tool (3), or St. Gallen criteria, a risk stratification groupbased on consensus recommendations (4). Further improvementsmay be seen with genomics-based prognostic tools (5, 6) such as theMammaPrint 70 gene signature (NKI 70), the wound signature, andmolecular subtypes, to name a few.
Unlike prognostic markers, few therapy-predictive markershave been reported primarily because they are more difficultto identify than prognostic markers (5). This challenge arisesbecause, if a better outcome is associated with a particularmarker in a treated population, it is difficult to determinewhether the marker is tracking with good prognosis (i.e., inpatients without occult disease) or sensitivity to the treatment(i.e., in patients with occult disease cured by therapy). None-theless, prognostic markers and therapy-predictive markersare distinguishable and complementary. Consider patientswith occult metastases who are treated with ADCT and cured.Although these patients may have been properly identified ashaving a poor prognosis by a particular prognostic marker, theaccuracy of the prognostic marker is decreased because out-come has been unknowingly altered by therapy. The integra-tion of a therapy-predictive marker will identify these treat-ment-sensitive patients as those with a better outcome thanpredicted by the prognostic marker alone. Therefore, combin-ing a therapy-predictive marker with prognostic markers hasthe effect of increasing the accuracy of outcome prediction byan amount approximately equal to the benefit of the treatment,which for ADCT is approximately 5% to 10%. Importantly, theassociation of a therapy-predictive marker with clinical out-come principally occurs in the presence but not in the absenceof treatment. For prognostic markers, an association is typi-cally seen regardless of treatment.
Previously, we described the IFN-related DNA damage resis-tance signature (IRDS), an experimentally derived gene-expressionprofile that is associated with an IFN signaling pathway and withresistance to radiation-induced DNA damage (7). Here we reportthe existence of an IRDS(�) and IRDS(�) state among a widevariety of primary human cancers. Targeting of IRDS genes caninfluence experimental resistance to chemotherapy, and a clinicalclassifier for IRDS status is a therapy-predictive marker of adjuvanttherapy for breast cancer.
ResultsIRDS Genes Are Associated with Resistance to DNA Damage AcrossMultiple Cancer Cell Lines and Can Affect Experimental Resistance toChemotherapy. The parental SCC61 human squamous cell carci-noma cancer cell line was selected in vivo for resistance to ionizing
Author contributions: H.I. and A.J.M. designed research; H.I., T.Y., S.W.B., A.W.S., A.Y.S.,P.R., and A.J.M. performed research; R.R.W., D.S.A.N., N.K., B.K., B.R., J.B., Y.P., andM.J.v.d.V. contributed new reagents/analytic tools; H.I. and A.J.M. analyzed data; andA.J.M. wrote the paper.
The authors declare no conflict of interest.
1To whom correspondence should be addressed. E-mail: [email protected].
This article contains supporting information online at www.pnas.org/cgi/content/full/0809242105/DCSupplemental.
© 2008 by The National Academy of Sciences of the USA
18490–18495 � PNAS � November 25, 2008 � vol. 105 � no. 47 www.pnas.org�cgi�doi�10.1073�pnas.0809242105
radiation, resulting in the Nu61 subline that differentially expressesthe 49 genes in the IRDS (7). To determine if IRDS genes are morebroadly associated with resistance to RT, we analyzed 34 cancer celllines from the NCI60 panel (8). Thirty-six IRDS genes were amongthe top 25% of all genes ranked by their correlation with thesurviving fraction after 2 Gy of radiation (SF2), a result that isstatistically significant based on the enrichment score calculatedfrom gene set enrichment analysis (Fig. 1B). Of these 36 genes, 32are a subset of the 40 genes up-regulated in the IRDS. Of the IRDSgenes, STAT1 showed the highest correlation to the SF2 and rankedin the top 1% of all genes considered (Fig. 1 B and C).
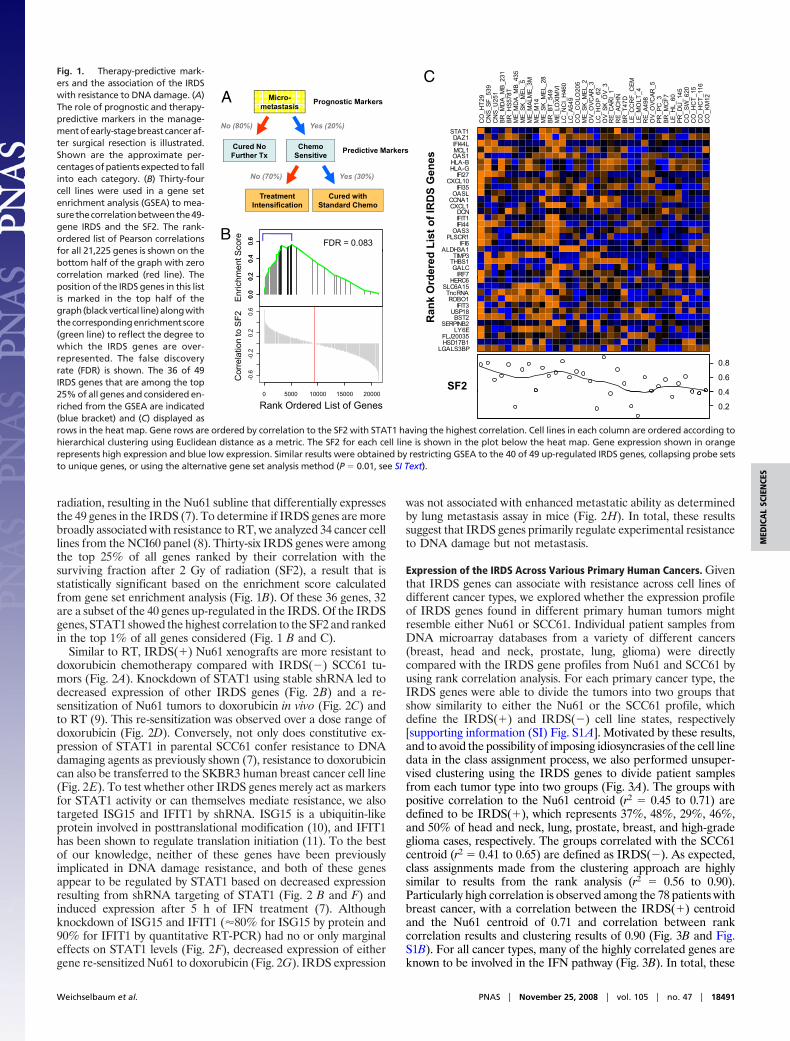
Similar to RT, IRDS(�) Nu61 xenografts are more resistant todoxorubicin chemotherapy compared with IRDS(�) SCC61 tu-mors (Fig. 2A). Knockdown of STAT1 using stable shRNA led todecreased expression of other IRDS genes (Fig. 2B) and a re-sensitization of Nu61 tumors to doxorubicin in vivo (Fig. 2C) andto RT (9). This re-sensitization was observed over a dose range ofdoxorubicin (Fig. 2D). Conversely, not only does constitutive ex-pression of STAT1 in parental SCC61 confer resistance to DNAdamaging agents as previously shown (7), resistance to doxorubicincan also be transferred to the SKBR3 human breast cancer cell line(Fig. 2E). To test whether other IRDS genes merely act as markersfor STAT1 activity or can themselves mediate resistance, we alsotargeted ISG15 and IFIT1 by shRNA. ISG15 is a ubiquitin-likeprotein involved in posttranslational modification (10), and IFIT1has been shown to regulate translation initiation (11). To the bestof our knowledge, neither of these genes have been previouslyimplicated in DNA damage resistance, and both of these genesappear to be regulated by STAT1 based on decreased expressionresulting from shRNA targeting of STAT1 (Fig. 2 B and F) andinduced expression after 5 h of IFN treatment (7). Althoughknockdown of ISG15 and IFIT1 (�80% for ISG15 by protein and90% for IFIT1 by quantitative RT-PCR) had no or only marginaleffects on STAT1 levels (Fig. 2F), decreased expression of eithergene re-sensitized Nu61 to doxorubicin (Fig. 2G). IRDS expression
was not associated with enhanced metastatic ability as determinedby lung metastasis assay in mice (Fig. 2H). In total, these resultssuggest that IRDS genes primarily regulate experimental resistanceto DNA damage but not metastasis.
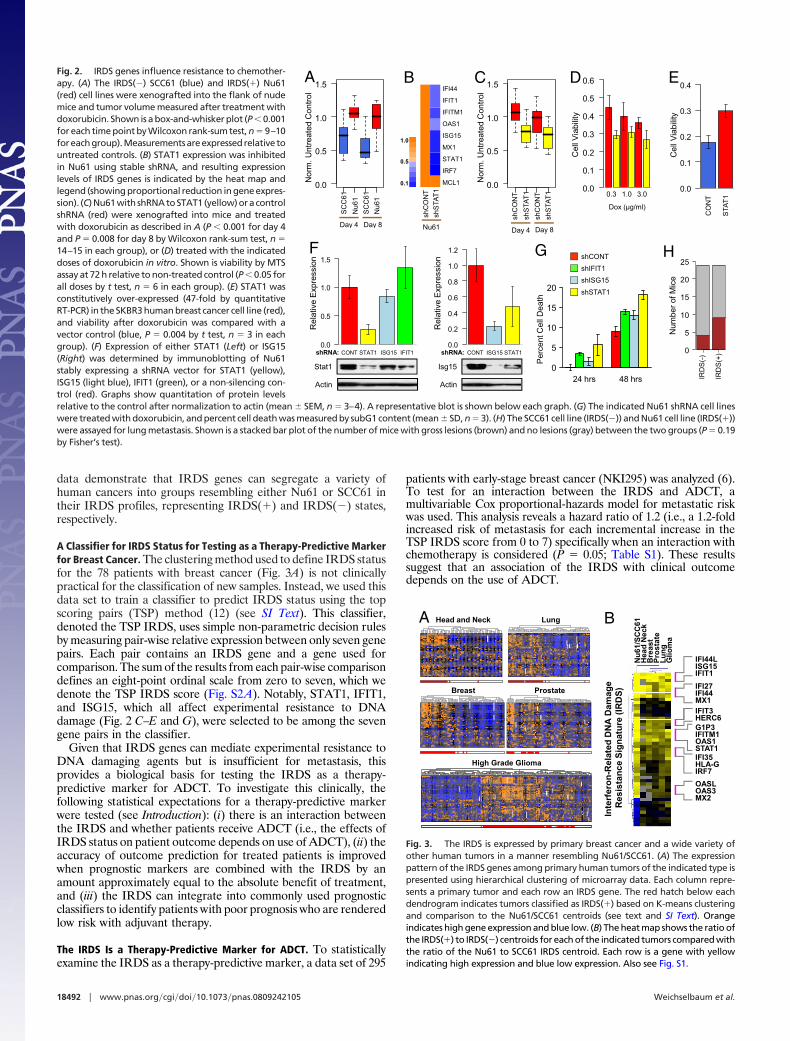
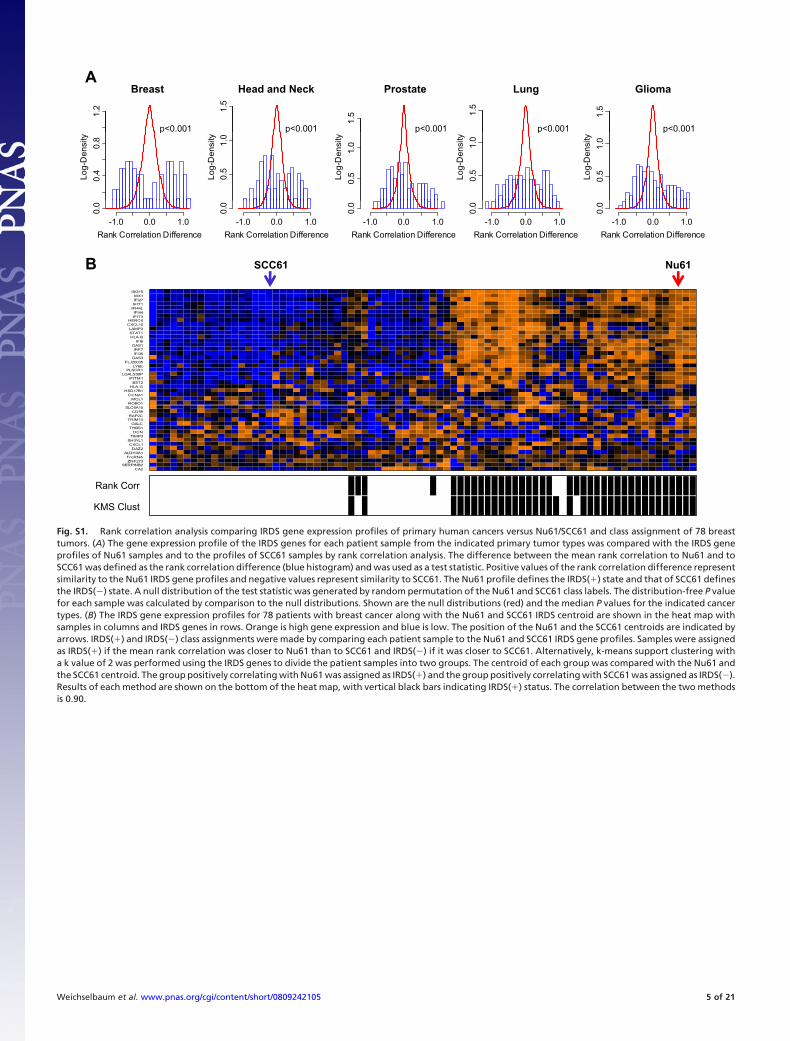
Expression of the IRDS Across Various Primary Human Cancers. Giventhat IRDS genes can associate with resistance across cell lines ofdifferent cancer types, we explored whether the expression profileof IRDS genes found in different primary human tumors mightresemble either Nu61 or SCC61. Individual patient samples fromDNA microarray databases from a variety of different cancers(breast, head and neck, prostate, lung, glioma) were directlycompared with the IRDS gene profiles from Nu61 and SCC61 byusing rank correlation analysis. For each primary cancer type, theIRDS genes were able to divide the tumors into two groups thatshow similarity to either the Nu61 or the SCC61 profile, whichdefine the IRDS(�) and IRDS(�) cell line states, respectively[supporting information (SI) Fig. S1A]. Motivated by these results,and to avoid the possibility of imposing idiosyncrasies of the cell linedata in the class assignment process, we also performed unsuper-vised clustering using the IRDS genes to divide patient samplesfrom each tumor type into two groups (Fig. 3A). The groups withpositive correlation to the Nu61 centroid (r2 � 0.45 to 0.71) aredefined to be IRDS(�), which represents 37%, 48%, 29%, 46%,and 50% of head and neck, lung, prostate, breast, and high-gradeglioma cases, respectively. The groups correlated with the SCC61centroid (r2 � 0.41 to 0.65) are defined as IRDS(�). As expected,class assignments made from the clustering approach are highlysimilar to results from the rank analysis (r2 � 0.56 to 0.90).Particularly high correlation is observed among the 78 patients withbreast cancer, with a correlation between the IRDS(�) centroidand the Nu61 centroid of 0.71 and correlation between rankcorrelation results and clustering results of 0.90 (Fig. 3B and Fig.S1B). For all cancer types, many of the highly correlated genes areknown to be involved in the IFN pathway (Fig. 3B). In total, these
0.6
0.6B
A
Scor
eFDR = 0.083
0.0
0.2
0.4
0.0
0.2
0.4
-0.6
-0.2
0.2
0.6
Micro-metastasis
No (80%)
No (70%)
Yes (20%)
Yes (30%)
Cured NoFurther Tx
ChemoSensitive
TreatmentIntensification
Cured withStandard Chemo
Prognostic Markers
Predictive Markers
Enr
ichm
ent S
Cor
rela
tion
to S
F2
0 5000 10000 15000 20000
Rank Ordered List of Genes
CO
_HT2
9C
NS_
SF_5
39C
NS_
U25
1BR
_MD
A_M
B_23
1BR
_HS5
78T
ME_
MD
A_M
B_43
5M
E_SK
_MEL
_5M
E_M
ALM
E_3M
ME_
M14
ME_
SK_M
EL_2
8BR
_BT_
549
ME_
LOXI
MVI
LC_N
CI_
H46
0LC
_A54
9C
O_C
OLO
205
ME_
SK_M
EL_2
OV_
OVC
AR_3
LC_H
OP_
62O
V_SK
_OV_
3R
E_C
AKI_
1R
E_AC
HN
BR_T
47D
LE_C
CR
F_C
EMLE
_MO
LT_4
RE_
A498
OV_
OVC
AR_5
PR_P
C_3
BR_M
CF7
LE_H
L_60
PR_D
U_1
45C
O_S
W_6
20C
O_H
CT_
15C
O_H
CT_
116
CO
_KM
12
OAS1MCL1IFI44LDAZ1
STAT1
C
es
IRF7GALC
THBS1TIMP3
ALDH3A1IFI6
PLSCR1OAS3
IFI44IFIT1DCN
CXCL1CCNA1OASL
IFI35CXCL10
IFI27HLA-GHLA-B
dere
d Li
st o
f IR
DS
Gen
e
LGALS3BPHSD17B1FLJ20035
LY6ESERPINB2
BST2USP18
IFIT3ROBO1
TncRNASLC6A15
HERC6
0.6
SF2SF2
0.8
0.6
0 4
Ran
k O
rd
0.2
0.4
0.2
Fig. 1. Therapy-predictive mark-ers and the association of the IRDSwith resistance to DNA damage. (A)The role of prognostic and therapy-predictive markers in the manage-mentofearly-stagebreastcanceraf-ter surgical resection is illustrated.Shown are the approximate per-centages of patients expected to fallinto each category. (B) Thirty-fourcell lines were used in a gene setenrichment analysis (GSEA) to mea-surethecorrelationbetweenthe49-gene IRDS and the SF2. The rank-ordered list of Pearson correlationsfor all 21,225 genes is shown on thebottom half of the graph with zerocorrelation marked (red line). Theposition of the IRDS genes in this listis marked in the top half of thegraph(blackvertical line)alongwiththecorrespondingenrichmentscore(green line) to reflect the degree towhich the IRDS genes are over-represented. The false discoveryrate (FDR) is shown. The 36 of 49IRDS genes that are among the top25% of all genes and considered en-riched from the GSEA are indicated(blue bracket) and (C) displayed asrows in the heat map. Gene rows are ordered by correlation to the SF2 with STAT1 having the highest correlation. Cell lines in each column are ordered according tohierarchical clustering using Euclidean distance as a metric. The SF2 for each cell line is shown in the plot below the heat map. Gene expression shown in orangerepresents high expression and blue low expression. Similar results were obtained by restricting GSEA to the 40 of 49 up-regulated IRDS genes, collapsing probe setsto unique genes, or using the alternative gene set analysis method (P � 0.01, see SI Text).
Weichselbaum et al. PNAS � November 25, 2008 � vol. 105 � no. 47 � 18491
MED
ICA
LSC
IEN
CES
data demonstrate that IRDS genes can segregate a variety ofhuman cancers into groups resembling either Nu61 or SCC61 intheir IRDS profiles, representing IRDS(�) and IRDS(�) states,respectively.
A Classifier for IRDS Status for Testing as a Therapy-Predictive Markerfor Breast Cancer. The clustering method used to define IRDS statusfor the 78 patients with breast cancer (Fig. 3A) is not clinicallypractical for the classification of new samples. Instead, we used thisdata set to train a classifier to predict IRDS status using the topscoring pairs (TSP) method (12) (see SI Text). This classifier,denoted the TSP IRDS, uses simple non-parametric decision rulesby measuring pair-wise relative expression between only seven genepairs. Each pair contains an IRDS gene and a gene used forcomparison. The sum of the results from each pair-wise comparisondefines an eight-point ordinal scale from zero to seven, which wedenote the TSP IRDS score (Fig. S2A). Notably, STAT1, IFIT1,and ISG15, which all affect experimental resistance to DNAdamage (Fig. 2 C–E and G), were selected to be among the sevengene pairs in the classifier.
Given that IRDS genes can mediate experimental resistance toDNA damaging agents but is insufficient for metastasis, thisprovides a biological basis for testing the IRDS as a therapy-predictive marker for ADCT. To investigate this clinically, thefollowing statistical expectations for a therapy-predictive markerwere tested (see Introduction): (i) there is an interaction betweenthe IRDS and whether patients receive ADCT (i.e., the effects ofIRDS status on patient outcome depends on use of ADCT), (ii) theaccuracy of outcome prediction for treated patients is improvedwhen prognostic markers are combined with the IRDS by anamount approximately equal to the absolute benefit of treatment,and (iii) the IRDS can integrate into commonly used prognosticclassifiers to identify patients with poor prognosis who are renderedlow risk with adjuvant therapy.
The IRDS Is a Therapy-Predictive Marker for ADCT. To statisticallyexamine the IRDS as a therapy-predictive marker, a data set of 295
patients with early-stage breast cancer (NKI295) was analyzed (6).To test for an interaction between the IRDS and ADCT, amultivariable Cox proportional-hazards model for metastatic riskwas used. This analysis reveals a hazard ratio of 1.2 (i.e., a 1.2-foldincreased risk of metastasis for each incremental increase in theTSP IRDS score from 0 to 7) specifically when an interaction withchemotherapy is considered (P � 0.05; Table S1). These resultssuggest that an association of the IRDS with clinical outcomedepends on the use of ADCT.
AN
u61/
SCC
61H
ead
Nec
kB
reas
tPr
osta
teLu
ng
Glio
ma
A D
amag
ee
(IRD
S)
IFI44LISG15IFIT1
IFIT3HERC6
IFI27IFI44MX1
B
ProstateBreast
Head and Neck LungIn
terf
eron
-Rel
ated
DN
AR
esis
tanc
e Si
gnat
ure HERC6
OASLOAS3MX2
IFI35HLA-GIRF7
G1P3IFITM1OAS1STAT1
High Grade Glioma
Fig. 3. The IRDS is expressed by primary breast cancer and a wide variety ofother human tumors in a manner resembling Nu61/SCC61. (A) The expressionpattern of the IRDS genes among primary human tumors of the indicated type ispresented using hierarchical clustering of microarray data. Each column repre-sents a primary tumor and each row an IRDS gene. The red hatch below eachdendrogram indicates tumors classified as IRDS(�) based on K-means clusteringand comparison to the Nu61/SCC61 centroids (see text and SI Text). Orangeindicates high gene expression and blue low. (B) The heat map shows the ratio ofthe IRDS(�) to IRDS(�) centroids for each of the indicated tumors compared withthe ratio of the Nu61 to SCC61 IRDS centroid. Each row is a gene with yellowindicating high expression and blue low expression. Also see Fig. S1.
0.0
0.5
1.0
1.5
SC
C61
Nu6
1S
CC
61N
u61
Day 4 Day 8
Nor
m. U
ntre
ated
Con
trol
0.0
0.1
0.2
0.3
0.4
0.5
0.6
0.3 1.0 3.0
Dox (μg/ml)
Cel
l Via
bilit
y
0.0
0.5
1.0
1.5
shC
ON
Tsh
STA
T1sh
CO
NT
shS
TAT1
Nor
m. U
ntre
ated
Con
trol
0.0
0.1
0.2
0.3
0.4
CO
NT
STA
T1
Cel
l Via
bilit
y
1.0
0.1
0.5
IFI44
IFIT1
IFITM1
OAS1
ISG15
MX1
STAT1
IRF7
MCL1
shC
ON
Tsh
STA
T1
N 61
A B C D E
HG
Day 4 Day 8
IRD
S(-)
IRD
S(+)
Num
ber o
f Mic
e
Day 4 Day 8Nu61
Per
cent
Cel
l Dea
th
24 hrs 48 hrs
shCONT
shIFIT1
shISG15
shSTAT1
F
51gsI1tatS
CONT STAT1 IFIT1 1TATSTNOC51GSI ISG15
nitcAnitcA
Rel
ativ
e E
xpre
ssio
n
Rel
ativ
e E
xpre
ssio
n
0
5
10
15
20
:ANRhs:ANRhs 0
5
10
15
20
25
0.0
0.5
1.0
1.5
0.0
0.2
0.4
0.6
0.8
1.0
1.2
Fig. 2. IRDS genes influence resistance to chemother-apy. (A) The IRDS(�) SCC61 (blue) and IRDS(�) Nu61(red) cell lines were xenografted into the flank of nudemice and tumor volume measured after treatment withdoxorubicin. Shown is a box-and-whisker plot (P � 0.001for each time point by Wilcoxon rank-sum test, n � 9–10foreachgroup).Measurementsareexpressedrelative tountreated controls. (B) STAT1 expression was inhibitedin Nu61 using stable shRNA, and resulting expressionlevels of IRDS genes is indicated by the heat map andlegend (showing proportional reduction in gene expres-sion). (C) Nu61 with shRNA to STAT1 (yellow) or a controlshRNA (red) were xenografted into mice and treatedwith doxorubicin as described in A (P � 0.001 for day 4and P � 0.008 for day 8 by Wilcoxon rank-sum test, n �14–15 in each group), or (D) treated with the indicateddoses of doxorubicin in vitro. Shown is viability by MTSassay at 72 h relative to non-treated control (P � 0.05 forall doses by t test, n � 6 in each group). (E) STAT1 wasconstitutively over-expressed (47-fold by quantitativeRT-PCR) in the SKBR3 human breast cancer cell line (red),and viability after doxorubicin was compared with avector control (blue, P � 0.004 by t test, n � 3 in eachgroup). (F) Expression of either STAT1 (Left) or ISG15(Right) was determined by immunoblotting of Nu61stably expressing a shRNA vector for STAT1 (yellow),ISG15 (light blue), IFIT1 (green), or a non-silencing con-trol (red). Graphs show quantitation of protein levelsrelative to the control after normalization to actin (mean � SEM, n � 3–4). A representative blot is shown below each graph. (G) The indicated Nu61 shRNA cell lineswere treated with doxorubicin, and percent cell death was measured by subG1 content (mean � SD, n � 3). (H) The SCC61 cell line (IRDS(�)) and Nu61 cell line (IRDS(�))were assayed for lung metastasis. Shown is a stacked bar plot of the number of mice with gross lesions (brown) and no lesions (gray) between the two groups (P � 0.19by Fisher’s test).
18492 � www.pnas.org�cgi�doi�10.1073�pnas.0809242105 Weichselbaum et al.
The TSP IRDS shows moderate association with some standardclinical prognostic markers and other genomic classifiers (Table S2and Fig. S2B). If the TSP IRDS is a therapy-predictive marker, itshould add unique information when combined with prognosticmarkers and improve prediction accuracy among treated patients.How to test this hypothesis is not straightforward. The use of Coxmodels has known limitations that include relying on restrictiveassumptions and concerns about the correct modeling of interac-tions and non-linear effects. Furthermore, for judging the predictivevalue of a new tumor marker, P values for calculated hazard ratiosderived from Cox regression are mathematically unrelated toprediction (13). Our analysis method of choice is a multivariablerandom survival forest (RSF) analysis (see SI Text). RSF is anon-parametric ensemble partitioning tree method for survivaldata that automatically estimates non-linear effects for variablesand multi-way interactions between variables, and is capable ofimputing missing data (14). To properly measure the effect of theTSP IRDS and other variables on prediction accuracy, we calculatean importance score, which is a metric of how much the error rateof a model is improved by addition of each variable (more influ-ential factors have higher scores). For comparison, results using Coxregression modeling are also shown throughout the article.
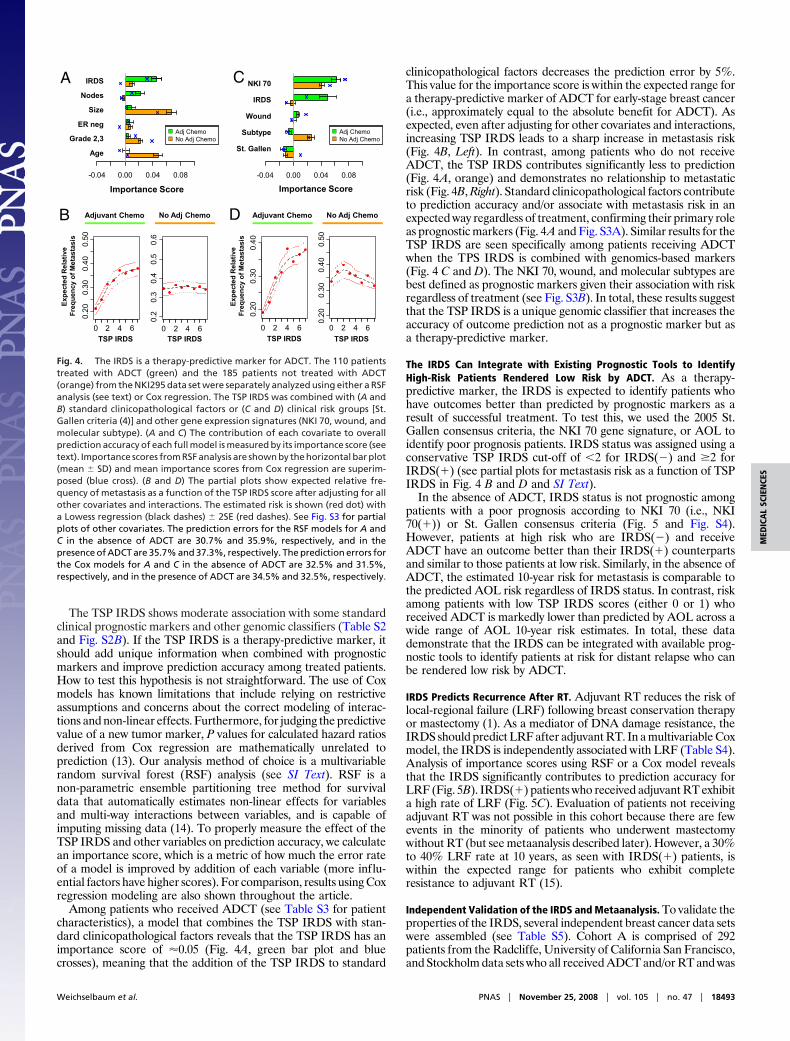
Among patients who received ADCT (see Table S3 for patientcharacteristics), a model that combines the TSP IRDS with stan-dard clinicopathological factors reveals that the TSP IRDS has animportance score of �0.05 (Fig. 4A, green bar plot and bluecrosses), meaning that the addition of the TSP IRDS to standard
clinicopathological factors decreases the prediction error by 5%.This value for the importance score is within the expected range fora therapy-predictive marker of ADCT for early-stage breast cancer(i.e., approximately equal to the absolute benefit for ADCT). Asexpected, even after adjusting for other covariates and interactions,increasing TSP IRDS leads to a sharp increase in metastasis risk(Fig. 4B, Left). In contrast, among patients who do not receiveADCT, the TSP IRDS contributes significantly less to prediction(Fig. 4A, orange) and demonstrates no relationship to metastaticrisk (Fig. 4B, Right). Standard clinicopathological factors contributeto prediction accuracy and/or associate with metastasis risk in anexpected way regardless of treatment, confirming their primary roleas prognostic markers (Fig. 4A and Fig. S3A). Similar results for theTSP IRDS are seen specifically among patients receiving ADCTwhen the TPS IRDS is combined with genomics-based markers(Fig. 4 C and D). The NKI 70, wound, and molecular subtypes arebest defined as prognostic markers given their association with riskregardless of treatment (see Fig. S3B). In total, these results suggestthat the TSP IRDS is a unique genomic classifier that increases theaccuracy of outcome prediction not as a prognostic marker but asa therapy-predictive marker.
The IRDS Can Integrate with Existing Prognostic Tools to IdentifyHigh-Risk Patients Rendered Low Risk by ADCT. As a therapy-predictive marker, the IRDS is expected to identify patients whohave outcomes better than predicted by prognostic markers as aresult of successful treatment. To test this, we used the 2005 St.Gallen consensus criteria, the NKI 70 gene signature, or AOL toidentify poor prognosis patients. IRDS status was assigned using aconservative TSP IRDS cut-off of �2 for IRDS(�) and �2 forIRDS(�) (see partial plots for metastasis risk as a function of TSPIRDS in Fig. 4 B and D and SI Text).
In the absence of ADCT, IRDS status is not prognostic amongpatients with a poor prognosis according to NKI 70 (i.e., NKI70(�)) or St. Gallen consensus criteria (Fig. 5 and Fig. S4).However, patients at high risk who are IRDS(�) and receiveADCT have an outcome better than their IRDS(�) counterpartsand similar to those patients at low risk. Similarly, in the absence ofADCT, the estimated 10-year risk for metastasis is comparable tothe predicted AOL risk regardless of IRDS status. In contrast, riskamong patients with low TSP IRDS scores (either 0 or 1) whoreceived ADCT is markedly lower than predicted by AOL across awide range of AOL 10-year risk estimates. In total, these datademonstrate that the IRDS can be integrated with available prog-nostic tools to identify patients at risk for distant relapse who canbe rendered low risk by ADCT.
IRDS Predicts Recurrence After RT. Adjuvant RT reduces the risk oflocal-regional failure (LRF) following breast conservation therapyor mastectomy (1). As a mediator of DNA damage resistance, theIRDS should predict LRF after adjuvant RT. In a multivariable Coxmodel, the IRDS is independently associated with LRF (Table S4).Analysis of importance scores using RSF or a Cox model revealsthat the IRDS significantly contributes to prediction accuracy forLRF (Fig. 5B). IRDS(�) patients who received adjuvant RT exhibita high rate of LRF (Fig. 5C). Evaluation of patients not receivingadjuvant RT was not possible in this cohort because there are fewevents in the minority of patients who underwent mastectomywithout RT (but see metaanalysis described later). However, a 30%to 40% LRF rate at 10 years, as seen with IRDS(�) patients, iswithin the expected range for patients who exhibit completeresistance to adjuvant RT (15).
Independent Validation of the IRDS and Metaanalysis. To validate theproperties of the IRDS, several independent breast cancer data setswere assembled (see Table S5). Cohort A is comprised of 292patients from the Radcliffe, University of California San Francisco,and Stockholm data sets who all received ADCT and/or RT and was
A IRDS C
-0.04 0.00 0.04 0.08
Importance Score
IRDS
Nodes
Size
ER neg
Grade 2,3
Age
-0.04 0.00 0.04 0.08
Importance Score
NKI 70
IRDS
Wound
Subtype
St. Gallen
Adj ChemoNo Adj Chemo
Adj ChemoNo Adj Chemo
0.20
0.30
0.40
0.50
Adjuvant Chemo No Adj Chemo
0 .2
0.3
0.4
0.5
0.6
Expe
cted
Rel
ativ
e Fr
eque
ncy
of M
etas
tasi
s
0.20
0.30
0.40
0.20
0.30
0.40
0.50
Expe
cted
Rel
ativ
e Fr
eque
ncy
of M
etas
tasi
s
Adjuvant Chemo No Adj ChemoD
0 2 4 6TSP IRDS
0 2 4 6
0
TSP IRDS 0 2 4 6
TSP IRDS 0 2 4 6
0
TSP IRDS
B
Fig. 4. The IRDS is a therapy-predictive marker for ADCT. The 110 patientstreated with ADCT (green) and the 185 patients not treated with ADCT(orange) from the NKI295 data set were separately analyzed using either a RSFanalysis (see text) or Cox regression. The TSP IRDS was combined with (A andB) standard clinicopathological factors or (C and D) clinical risk groups [St.Gallen criteria (4)] and other gene expression signatures (NKI 70, wound, andmolecular subtype). (A and C) The contribution of each covariate to overallprediction accuracy of each full model is measured by its importance score (seetext). Importance scores from RSF analysis are shown by the horizontal bar plot(mean � SD) and mean importance scores from Cox regression are superim-posed (blue cross). (B and D) The partial plots show expected relative fre-quency of metastasis as a function of the TSP IRDS score after adjusting for allother covariates and interactions. The estimated risk is shown (red dot) witha Lowess regression (black dashes) � 2SE (red dashes). See Fig. S3 for partialplots of other covariates. The prediction errors for the RSF models for A andC in the absence of ADCT are 30.7% and 35.9%, respectively, and in thepresence of ADCT are 35.7% and 37.3%, respectively. The prediction errors forthe Cox models for A and C in the absence of ADCT are 32.5% and 31.5%,respectively, and in the presence of ADCT are 34.5% and 32.5%, respectively.
Weichselbaum et al. PNAS � November 25, 2008 � vol. 105 � no. 47 � 18493
MED
ICA
LSC
IEN
CES
used to validate that the IRDS is a therapy-predictive marker forDNA damaging agents. For each of the three data sets in cohort A,a higher TSP IRDS is associated with a higher risk for distant failureand/or LRF, which is similar to results from the NKI295 (Table S6).Survival analysis of all patients from cohort A reveals that theIRDS(�) group has a markedly better recurrence-free survivalcompared with IRDS(�) patients (Fig. 6A). This improvement inrecurrence-free survival is a result of both fewer distant relapses
among the IRDS(�) patients treated with ADCT and lower LRFamong IRDS(�) patients treated with adjuvant RT (Fig. 6 B andC). Analysis using cohort B, which consists of 277 patients whoreceived only endocrine therapy as adjuvant systemic treatment(Fig. 6D), and cohort C, which is composed of 286 patients who didnot receive adjuvant systemic treatment (Fig. 6E), confirms that theIRDS is neither a therapy-predictive marker for endocrine therapynor prognostic for distant failure in the absence of ADCT. A similarlack of therapy-predictive effect with endocrine therapy or prog-nostic effect was noted for two additional cohorts (Fig. S5).
The NKI295, Radcliffe, University of California San Francisco,and Stockholm data sets were also used to validate the predictive-ness of the IRDS by using each individual data set as a test set fora model trained on the other three. The patients from these fourdata sets differed in treatment regimens (e.g., cyclophosphamide/methotrexate/5-fluorouracil vs. an anthracycline regimen; TableS7) and patient characteristics. Nonetheless, for each of these datasets, the TSP IRDS improves prediction accuracy for metastasis-free survival and local-regional control for patients treated withADCT or RT, respectively (Fig. S6). Importantly, as the TSP IRDSimproves prediction in each test set, these results are unlikely aresult of a confounding latent variable because it would have to bethe same latent variable in all of the cohorts.
To provide best estimates of importance scores and their sam-pling error, and to test for effects of cohort heterogeneity, all datasets used in validation were combined with the NKI295, resulting in1,573 patients. By using RSF we were able to perform a non-stratified metaanalysis whereby all 1,573 patients were analyzedsimultaneously but the effects of treatment were extracted. Unlikewith Cox regression, this non-stratified analysis is possible becauseof the ability of RSF to automatically model all possible interactionsbetween variables. Bootstrap means and SEs for variable impor-tance scores for metastasis-free survival confirm high values for theIRDS, specifically among patients treated with ADCT (Fig. 6F).Well established prognostic factors show importance scores ofcomparable magnitude regardless of treatment. Few or no cohorteffects were seen, indicating that an adequate level of homogeneityacross institutes was observed, and our analysis accounts fordifferences in these cohorts (Fig. S7A). Confirmation that the IRDSis a therapy-predictive marker is similarly seen with RT. Resultsfrom Cox regression, which are necessarily stratified by treatmentand devoid of interaction effects between variables, are shown forcomparison. Notable are the 3% to 8% gains in prediction accuracyfor RSF over Cox regression (Fig. S7B). In total, these resultssuggest that the IRDS is a therapy-predictive marker that performsacross patient populations that may differ in baseline characteristicsand treatment.
DiscussionWe and others have shown that STAT1 and IFN genes can normallybe induced as part of the cellular response to DNA damage (9, 16).In previous work, we demonstrated that sensitivity to DNA damageis coupled with sensitivity to IFNs such that selection for resistanceto one leads to resistance to the other (9). These observations haveled to the proposal that, under most situations, the STAT1/IFNpathway transmits a cytotoxic signal either in response to DNAdamage or to IFNs. In contrast, cells that are IRDS(�) showconstitutive activation of the STAT1/IFN pathway and may reflecta history of chronic stimulation. This chronically activated statemight have selected for the failure to transmit a cytotoxic signal andinstead results in pro-survival signals mediated by STAT1 and otherIRDS genes. Here, we further strengthen the notion that IRDS(�)tumors reflect this latter phenotype and demonstrate the impressivefrequency by which this pathway is distinguishable among the mostcommon human cancers.
The combined clinical and laboratory data strongly indicate thatthe IRDS is principally a therapy-predictive marker for DNAdamaging agents. How might the IRDS contribute to clinical
TSP IRDS ≥ 2TSP IRDS = 1dj
uvan
t Che
mot
hera
py
opor
tion
Met
asta
sis-
Free
0.2
0.4
0.6
0.8
1.0
p=0.75NKI 70(+)/IRDS(+)NKI 70(+)/IRDS(-)
70 Gene Signature Adjuvant! Online
ve F
req
of M
etas
tasi
s (1
0 Yr
)
1020
3040
5060
A
TSP IRDS 1TSP IRDS = 0
TSP IRDS ≥ 2TSP IRDS = 1TSP IRDS = 0
hem
othe
rapy
No
Ad Pro
etas
tasi
s-Fr
ee
0 5 10 15 20
0.0 NKI 70(-)
Years
0.6
0.8
1.0
AOL 10Y BrCa Mortality
Rel
ativ
Met
asta
sis
(10
Yr)
3 040
5060
0 20 40 60 80
0
Adju
vant
Ch
Pro
porti
on M
e
0 5 10 15 20
0.0
0.2
0.4
p=0.039
NKI 70(-)
NKI 70(+)/IRDS(+)NKI 70(+)/IRDS(-)
Years AOL 10Y BrCa Mortality
Rel
ativ
e Fr
eq o
f M
0 20 40 60 80
010
203
e
P 1.0
1.0
Con
trol
CIRDS
Age
m
N
g
o
3
y
e
-0.04 -0.02 0.00 0.02 0.04 0.06 0.08 0 5 10 15 20
0.0
0.2
0.4
0.6
0.8
0 5 10 15 20
0.0
0.2
0.4
0.6
0.8
Any RT/IRDS(+)Any RT/IRDS(-)
BCT/IRDS(+)BCT/IRDS(-)
p=0.002
p=0.006
Prop
ortio
n Lo
cal-R
egio
nal C
Years
Age
Mastectomy
Grade 2,3
Chemo
ER negative
Nodes
Size
Importance Score Yearsp
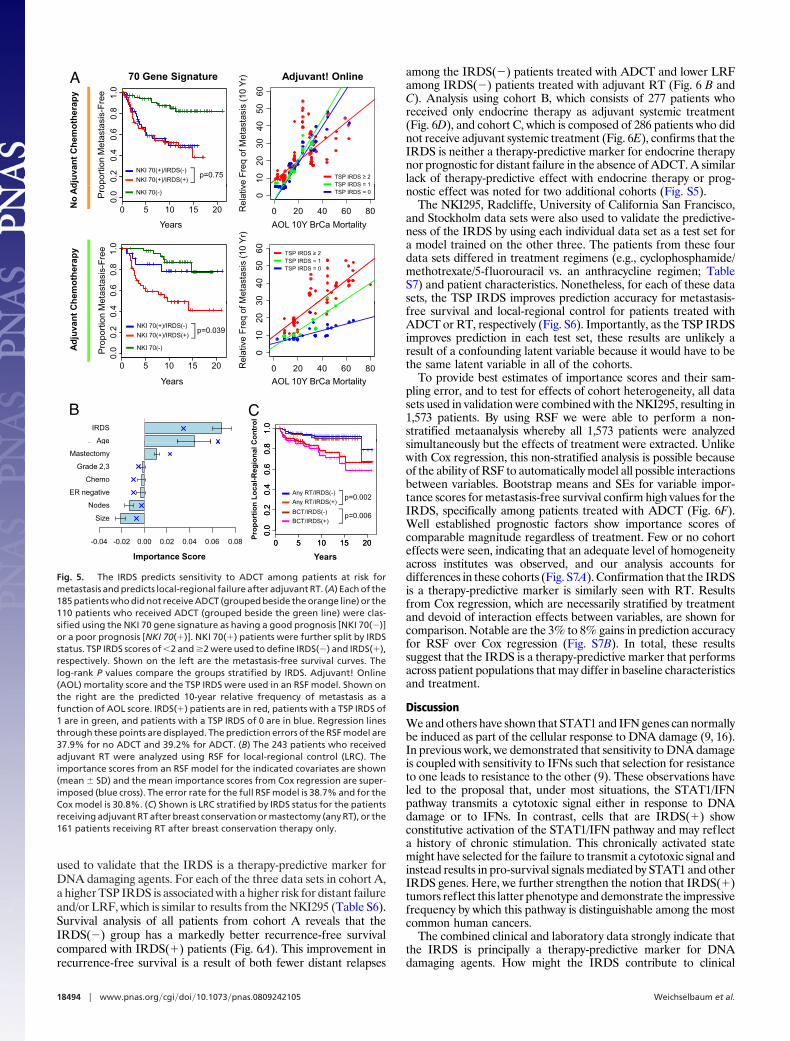
B
Fig. 5. The IRDS predicts sensitivity to ADCT among patients at risk formetastasis and predicts local-regional failure after adjuvant RT. (A) Each of the185 patients who did not receive ADCT (grouped beside the orange line) or the110 patients who received ADCT (grouped beside the green line) were clas-sified using the NKI 70 gene signature as having a good prognosis [NKI 70(�)]or a poor prognosis [NKI 70(�)]. NKI 70(�) patients were further split by IRDSstatus. TSP IRDS scores of �2 and �2 were used to define IRDS(�) and IRDS(�),respectively. Shown on the left are the metastasis-free survival curves. Thelog-rank P values compare the groups stratified by IRDS. Adjuvant! Online(AOL) mortality score and the TSP IRDS were used in an RSF model. Shown onthe right are the predicted 10-year relative frequency of metastasis as afunction of AOL score. IRDS(�) patients are in red, patients with a TSP IRDS of1 are in green, and patients with a TSP IRDS of 0 are in blue. Regression linesthrough these points are displayed. The prediction errors of the RSF model are37.9% for no ADCT and 39.2% for ADCT. (B) The 243 patients who receivedadjuvant RT were analyzed using RSF for local-regional control (LRC). Theimportance scores from an RSF model for the indicated covariates are shown(mean � SD) and the mean importance scores from Cox regression are super-imposed (blue cross). The error rate for the full RSF model is 38.7% and for theCox model is 30.8%. (C) Shown is LRC stratified by IRDS status for the patientsreceiving adjuvant RT after breast conservation or mastectomy (any RT), or the161 patients receiving RT after breast conservation therapy only.
18494 � www.pnas.org�cgi�doi�10.1073�pnas.0809242105 Weichselbaum et al.
management? The decision to undergo adjuvant treatment is oftenbased on the risk for recurrence and how much therapy will reducethis risk. Current methods to assess the reduction in risk fromadjuvant treatment are not individualized and generally based onproportional risk reductions from metaanalysis (2). Fig. 5A high-lights how the IRDS can influence decision making. For example,assuming a patient has an estimated 10-year risk of breast cancermortality of 20%, knowing that chemotherapy effectively reducesthis to approximately 5% will make the decision to undergotreatment easier for many. Furthermore, most patients identified bythe IRDS to be sensitive to ADCT were treated with cyclophos-phamide/methotrexate/5-fluorouracil, suggesting that the IRDScan help patients avoid the additional toxicities of anthracyclinesand taxanes. Conversely, knowledge that chemotherapy will beineffective may compel patients to accept more aggressive thera-pies. Others may forego adjuvant treatment altogether.
Materials and MethodsStudy Populations. See Tables S2 and S8 and SI Text for further details on allclinical and microarray data.
Cell Line and Animal Experiments. Derivation of Nu61 from the SCC61 cell line,analysis of the IRDS, and mouse xenografting have been described (7). Foradditional information, including Tables S9 and S10, please see SI Text.
Statistical Analysis. See SI Text for full details.
ACKNOWLEDGMENTS. We thank Samuel Hellman for his invaluable discussions.We also thank Ming-Chung Li, Vanessa Salcedo, Tony Wu, and Michael Beckett fortechnical assistance. This work was supported by a grant from the American Societyof Therapeutic Radiology and Oncology and the Schweppe Foundation (to A.J.M.),the Ludwig Institute for Cancer Research (A.J.M. and R.R.W.), and National Institutesof Health Grants HL-072771 (to H.I.), CA113662 (to R.R.W. and N.K.), CA071933 (toR.R.W. and N.K.), CA111423 (to R.R.W.), and CA090386 (to R.R.W.).
1. Clarke M, et al. (2005) Effects of radiotherapy and of differences in the extent ofsurgery for early breast cancer on local recurrence and 15-year survival: an overview ofthe randomised trials. Lancet 366:2087–2106.
2. Early Breast Cancer Trialists Collaborative Group (2005) Effects of chemotherapy andhormonal therapy for early breast cancer on recurrence and 15-year survival: anoverview of the randomised trials. Lancet 365:1687–1717.
3. Olivotto IA, et al. (2005) Population-based validation of the prognostic model ADJU-VANT! for early breast cancer. J Clin Oncol 23:2716–2725.
4. Goldhirsch A, et al. (2005) Meeting highlights: international expert consensus on theprimary therapy of early breast cancer 2005. Ann Oncol 16:1569–1583.
5. Sotiriou C, Piccart MJ (2007) Taking gene-expression profiling to the clinic: whenwill molecular signatures become relevant to patient care? Nat Rev Cancer 7:545–553.
6. van de Vijver MJ, et al. (2002) A gene-expression signature as a predictor of survival inbreast cancer. N Engl J Med 347:1999–2009.
7. Khodarev NN, et al. (2004) STAT1 is overexpressed in tumors selected for radioresis-tance and confers protection from radiation in transduced sensitive cells. Proc NatlAcad Sci USA 101:1714–1719.
8. Torres-Roca JF, et al. (2005) Prediction of radiation sensitivity using a gene expressionclassifier. Cancer Res 65:7169–7176.
9. Khodarev NN, et al. (2007) Signal transducer and activator of transcription 1regulates both cytotoxic and prosurvival functions in tumor cells. Cancer Res67:9214 –9220.
10. Zhao C, Denison C, Huibregtse JM, Gygi S, Krug RM (2005) Human ISG15 conjugationtargets both IFN-induced and constitutively expressed proteins functioning in diversecellular pathways. Proc Natl Acad Sci USA 102:10200–10205.
11. Hui DJ, Bhasker CR, Merrick WC, Sen GC (2003) Viral stress-inducible protein p56inhibits translation by blocking the interaction of eIF3 with the ternary complexeIF2.GTP.Met-tRNAi. J Biol Chem 278:39477–39482.
12. TanAC,NaimanDQ,XuL,WinslowRL,GemanD(2005)Simpledecisionrules for classifyinghuman cancers from gene expression profiles. Bioinformatics 21:3896–3904.
13. Katz EM, Kattan MW (2005) How to judge a tumor marker. Nat Clin Pract Oncol2:482–483.
14. Ishwaran H, Kogalur UB, Blackstone EH, Lauer MS (2008) Random survival forests. AnnAppl Stat 2:841–860.
15. Fisher B, et al. (1995) Reanalysis and results after 12 years of follow-up in a randomizedclinical trial comparing total mastectomy with lumpectomy with or without irradiationin the treatment of breast cancer. N Engl J Med 333:1456–1461.
16. Tsai MH, et al. (2007) Gene expression profiling of breast, prostate, and glioma cellsfollowing single versus fractionated doses of radiation. Cancer Res 67:3845–3852.
IRDS( ) IRDS( ) IRDS( )
0.6
0.8
1.0
curr
ence
-Fre
e
0.6
0.8
1.0
tast
asi s
-Fre
e
0.6
0.8
1.0
al-R
eg. C
ontro
lCBA
IRDS(-)IRDS(+)
IRDS(-)IRDS(+)
IRDS(-)IRDS(+)
IRDS(-)IRDS(+)
IRDS(-)IRDS(+)
0 5 10 15
0.0
0.2
0.4
Years
Prop
ortio
n R
e c
p<0.001
0 5 10 150.
00.
20.
4Years
Prop
orti o
n M
e
p=0.029
0 5 10 15
0.0
0.2
0.4
Years
Prop
ortio
n Lo
c a
p=0.035
0.4
0.6
0.8
1.0
n M
etas
tasi
s-Fr
ee
0.4
0.6
0.8
1.0
n M
etas
tas i
s-Fr
ee
D E
Adjuvant Chemo and/or RT TR tnavujdAomehC tnavujdA
0 5 10 15
0.0
0.2
Years
Prop
ortio
n
p=0.161
0 5 10 15
0.0
0.2
Years
Prop
ortio
n
p=0.998
Endocrine Therapy No Systemic Adjuvant Tx
Size
IRDS
Age
Nodes
Gr 2,3
IRDSAge
Nodes
ER
Horm
Chemo
F lortnoC lanoigeR-lacoLlavivruS eerF-sisatsateM
-0.02 0.02 0.06Importance Score
-0.02 0.02 0.06Importance Score
0.00 0.05 0.10Importance Score
0.00 0.05 0.10Importance Score
Gr 2,3
ER neg
Horm SizeGr 2,3
ER neg
ChemoNo Chemo
ChemoNo Chemo
RTNo RT
RTNo RT
xoCFSRxoCFSR
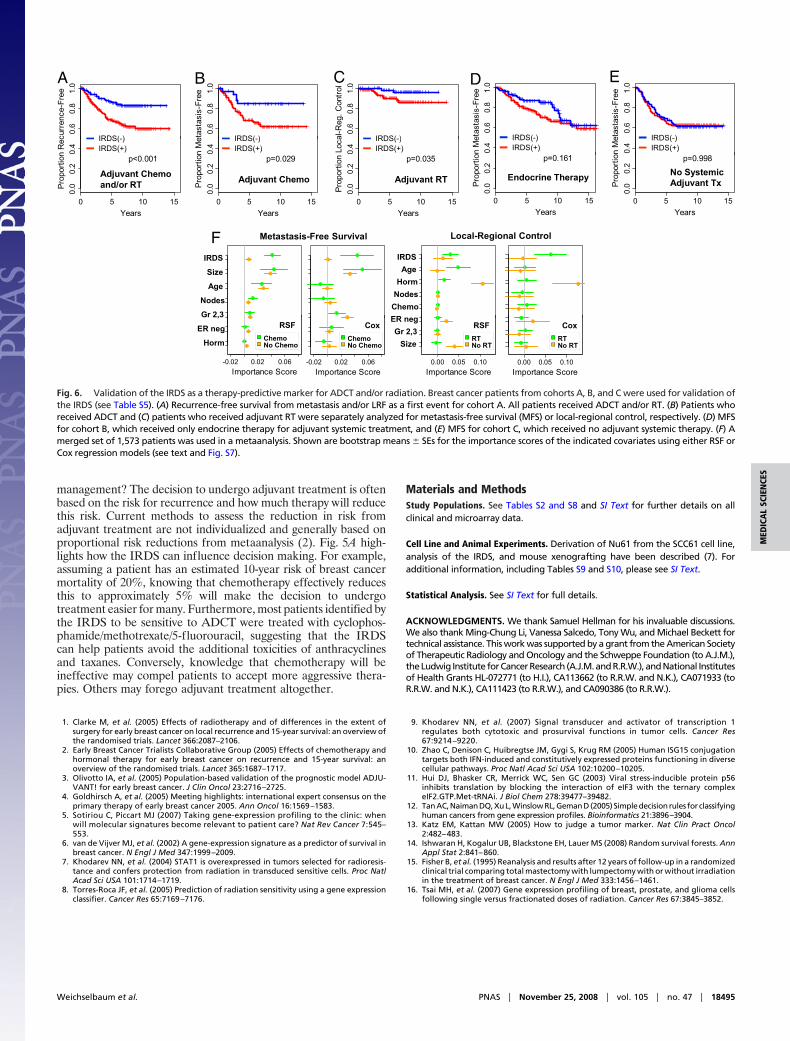
Fig. 6. Validation of the IRDS as a therapy-predictive marker for ADCT and/or radiation. Breast cancer patients from cohorts A, B, and C were used for validation ofthe IRDS (see Table S5). (A) Recurrence-free survival from metastasis and/or LRF as a first event for cohort A. All patients received ADCT and/or RT. (B) Patients whoreceived ADCT and (C) patients who received adjuvant RT were separately analyzed for metastasis-free survival (MFS) or local-regional control, respectively. (D) MFSfor cohort B, which received only endocrine therapy for adjuvant systemic treatment, and (E) MFS for cohort C, which received no adjuvant systemic therapy. (F) Amerged set of 1,573 patients was used in a metaanalysis. Shown are bootstrap means � SEs for the importance scores of the indicated covariates using either RSF orCox regression models (see text and Fig. S7).
Weichselbaum et al. PNAS � November 25, 2008 � vol. 105 � no. 47 � 18495
MED
ICA
LSC
IEN
CES
Supporting InformationWeichselbaum et al. 10.1073/pnas.0809242105SI TextStudy Populations. Previously, we reported on gene expressionprofiles of tumors from a series of 295 patients with stage I/IIbreast cancer (NKI295) treated at the Netherlands CancerInstitute between 1984 and 1995 (1). The clinical data used forthe earlier publications was updated until January 2001. For thisstudy, all patient charts were reviewed and clinical data wereupdated until January 1, 2005. The median follow-up times are10.2 years for all patients and 12 years for patients who werealive. Distant metastasis was analyzed as first event only. If apatient developed a local recurrence, axillary recurrence, con-tralateral breast cancer, or a second primary cancer (except fornon-melanoma skin cancer), the patient’s data were censored atthis time. An ipsilateral supraclavicular recurrence shortly pre-ceded distant metastasis in all but one patient; therefore, thesecases were not censored at time of ipsilateral supraclavicularrecurrence. There were 161 patients who underwent breastconservation that consisted of adjuvant external-beam radiationprimarily to 50 Gy (mean, 50.2 Gy; range, 50–54 Gy) followed bya boost (89% of patients) using photons, electrons, or iridium Ir192 (mean, 18 Gy; range, 14–26 Gy). There were 110 patientswho received adjuvant chemotherapy, which primarily consistedof cyclophosphamide/methotrexate/5-f luorouracil. Two patientswere treated with 5-fluorouracil/epirubicin/cyclophosphamide.Table S3 lists the patient characteristics.
Details on the clinical characteristics of other patients andmicroarray data used in the study along with accession numbershave been described. References for all microarray data used inthis study are listed in Table S8. Available patient characteristicsfor the patient data sets used in the validation studies are givenin Tables S5 and S7. For more information on the patients usedin the validation studies, see Validation of the IRDS.
Cell Line and Animal Experiments. For in vivo experiments, nudemice were treated by i.p. injection with 6 mg/kg of doxorubicin.For lung metastasis assays, gross lung lesions were scored afternecropsy at 9 to 12 weeks. In vitro growth inhibition wasmeasured by MTS assay and cell death was measured by subG1content using flow cytometry and confirmed by PARP cleavageassay (Invitrogen). For stable gene knockdowns, Nu61 wasretrovirally transduced with either the pSIREN-RetroQ-DsRed-Express (Clontech) to target STAT1 by shRNA (9). ThepSHAG-Magic v2.0 vector (Open Biosystems) was used toindependently target STAT1 and to target IFIT1 and ISG15 (seeTable S10 for sequences). For STAT1 over-expression, theSKBR3 human breast cancer cell line was transduced with thepQCXIP retroviral vector (Clontech) containing a humanSTAT1� cDNA.
Determination of Clinical Information, Prognostic Marker Status, andRisk Stratification. Most of the clinical and pathological informa-tion for the 295 patients has been previously published (2).Molecular subtype assignments are from Fan et al. (3). Estima-tion of Her2 amplicon expression using the microarray data weredone using the probes for Her2/ERBB2 and GRB7. For this,hierarchical clustering using Euclidean distance as the distancemetric and complete linkage was used, and the resulting tree wascut to give three groups. Cutting the tree at this level gave thehighest R-index of 0.867, which is a measure of robustness (4).Clusters 2 and 3 demonstrated the highest expression levels forHer2/ERBB2 and GRB7 and included 26% of the population,which is the expected approximate frequency for Her2 over-
expression by FISH and/or IHC. Survival analysis comparingclusters 2 and 3 versus cluster 1 revealed an expected differencein metastasis-free survival. Therefore, patients in clusters 2 and3 were used for an estimate for Her2 over-expression. Stratifi-cation into clinical risk groups was based on the 2005 St. Gallenconsensus criteria (5) and using the microarray data for Her2over-expression. Data on lymphovascular invasion were notavailable. For AOL 10-year breast cancer mortality estimates,clinicopathological factors were entered into the Web-basedtool, version 8.0. For co-morbidity status, ‘‘average for age’’ wasused.
Hierarchical clustering of clinical, pathological, and genomicmarkers was performed using the Heatplus package 1.2.0 (byAlexander Ploner) for the R language and environment forstatistical programming, versions 2.31 to 2.4.1 (R DevelopmentCore Team, R Foundation for Statistical Computing, Vienna,Austria). Statistical association between various prognosticmarkers and risk groups was calculated with a �2 test and/orCramer V statistic using the vcd package 1.0.4 for R (by DavidMeyer, Achim Zeileis, and Kurt Hornik).
Gene Set Enrichment Analysis of IRDS with SF2. Radiation resistancedata for 34 of the NCI60 cancer cell lines has been previouslydescribed (6). Affymetrix U133A microarray data processedusing the RMA method was downloaded from the NCI/LMPGenomics and Bioinformatics group (http://discover.nci.nih.gov/cellminer/home.do). Gene set enrichment analysis was per-formed using GSEA 2.0 downloaded from the GSEA Web site(http://www.broad.mit.edu/gsea/index.html). A Pearson correla-tion to the SF2 was used as the metric. Permutation of sampleswas used to calculate significance and false discovery rate.Analysis was performed by using all probe sets or by collapsingprobe sets to unique gene symbols with similar results. Similarresults were obtained with gene set analysis using the GSA 1.0package for R (by Brad Efron and R. Tibshirani). The max-meanstatistic was used and re-standardization was performed using allgenes in the data set.
Analysis of IRDS Expression in Primary Human Tumors. The humancell line SCC61 was xenografted into the flank of immunocom-promised nude mice and in vivo selected for resistance to DNAdamage as previously described (7). This selection resulted in theresistant Nu61 subline, which was compared with the SCC61 celllines for differential microarray gene expression analysis usingthe Affymetrix U133A GeneChip. From this, a 54-gene signatureassociated with DNA damage resistance was developed aspreviously described, and duplicate probes were removed to givea final list of 49 unique genes (Table S9). Using this gene list, theaverage signal intensity for each gene was computed fromtriplicate samples from SCC61 and Nu61 and transformed intolog base 2.
To relate a cell line-derived gene expression signature toprimary human tumor samples, we used similar methods de-scribed in our previous work (8). For non-Affymetrix platforms(i.e., breast, head and neck), the corresponding probes for eachof the 49 IRDS genes were matched based on gene symbols andUniGene accession numbers and duplicate probes removed(Table S9). Using the IRDS genes, k-means clustering wasperformed using TIGR MultiExperiment Viewer version 4.0 (9)for each of the microarray data sets with a k value of 2 andrequiring 90% consensus for each of the two clusters after 500runs. The average signal intensity for each of the IRDS genes was
Weichselbaum et al. www.pnas.org/cgi/content/short/0809242105 1 of 21
then averaged for each of the two consensus clusters. Thesecentroids were then compared with the Nu61 and SCC61 cell linecentroids by using a Pearson product moment correlation coef-ficient. The patients in the group with the centroid positivelycorrelating to the Nu61 centroid were defined as IRDS(�) andthose in the group positively correlating with the SCC61 centroidwere defined as IRDS(�). The few patients not assigned to aconsensus cluster were considered IRDS(�).
The gene expression profile of the IRDS genes for eachpatient sample from the various primary tumor types was alsodirectly compared with the IRDS gene profiles of Nu61 samples(n � 6) and to the profiles of SCC61 samples (n � 6) by rankcorrelation analysis on the median centered data. The differencebetween the mean rank correlation to Nu61 and to SCC61 wasused as a test statistic. A null distribution of the test statistic foreach patient sample was generated by 1,000 random permuta-tions of the Nu61 and SCC61 class labels, and the distribution-free P value for each sample was calculated by comparison to thenull distribution. The median P value for each tumor type wasless than 0.0001. To compare results from the rank correlationanalysis to the k-means support clustering method, samples wereassigned as IRDS(�) using the rank analysis if the mean rankcorrelation was closer to Nu61 than to SCC61 and IRDS(�) ifit was closer to SCC61. Although results from both approachesgave highly similar class assignment results, we chose the k-means support clustering method for the breast cancer data. Ourpreference for this method is because we did not want to imposepotential idiosyncrasies of the cell line data on the class assign-ment process and because of our previous success with themethod.
Determination of IRDS Status in Breast Cancer. The unsupervisedclustering method described earlier was used to define IRDSstatus for the 78 patients with breast cancer (NKI78) shown inFig. 3A and Fig. S1. However, this method is not well suited forclassification of new samples because it would require a re-analysis of all samples. Therefore, to classify the new samplesfrom the NKI295 data set, we wished to develop an IRDSclassifier using supervised class prediction methods trained onthe NKI78 data set with the k-means-derived IRDS class as-signments. We chose to develop two different classifiers.
Support Vector Machine Classifier. In the first approach, only the 49IRDS genes were used to develop a support vector machine(SVM) classifier. For this, BRB ArrayTools 3.4.1 and 3.5.0Beta�1 developed by Richard Simon and Amy Peng Lam (http://linus.nci.nih.gov/BRB-ArrayTools.html) was used with a linearkernel and default tuning parameters and misclassificationweights. Our previous work that developed a cell line signatureinto a clinical classifier using similar approaches as describedhere suggests that a SVM worked marginally better than othermethods such as nearest centroid or k-nearest neighbor (8);however, there is no strong rationale for this, and this decisionwas primarily arbitrary. Leave-one-out cross-validation resultedin 96% prediction accuracy. Of the 295 patients, 61 are from the78-patient data set previously described (1). Therefore, 235unique patients were classified using the SVM classifier and theoriginal IRDS status from the k-means clustering was used for60 overlapping patients. (Sample 54 from the NKI78 data set hada large proportion of missing values as previously described [8]and was not included in the k-means clustering; hence there were60 instead of 61 overlapping samples.) It is important to notethat, because clinical data were not used to model IRDS classmembership, this procedure does not bias analysis of clinicaloutcome using IRDS status as a factor.
Top Scoring Pairs Classifier. Statistical challenges, such as normal-ization issues and parameter tuning used in complex classifica-
tion methods, are potential obstacles to the routine use of geneexpression signatures in clinical management. We were moti-vated to implement a classifier that could facilitate cross-platform use both for validation studies and for clinical appli-cation. The TSP classifier (10, 11) has many desirable propertiesfor this purpose. This method uses few genes, has simple decisionrules, and is parameter-free because it measures relative geneexpression values from pair-wise comparisons.
Using the NKI78 breast cancer patient data set, we used theimplementation provided by BRB-ArrayTools 3.5.0 Beta�1 totrain a TSP classifier for the k-means-derived IRDS classassignments. Unlike with the SVM classifier, the TSP algorithmselects for gene pairs, necessitating genes besides the 49 IRDSgenes. Allowing for a false discovery of only one gene with 99%confidence, there are 162 genes that are differentially expressedbetween IRDS(�) and IRDS(�) tumors. Although 22 of the 49IRDS genes are among these 162 genes, even with stringentfiltering, the TSP algorithm would likely select gene pairs thatdid not contain IRDS genes. Indeed, when either no filtering wasused or a variance and/or fold change filter was applied, some ofthe top pairs selected by the TSP method were devoid of anIRDS gene. Therefore, as our goal was not gene discovery andwe wanted to avoid potential over-fitting or over-filtering, werestricted the TSP algorithm to using the 49 IRDS genes alongwith the ‘‘intrinsic’’ breast cancer genes (12). The intrinsic breastcancer genes are 534 genes used to define the molecular subtypesreported by Perou and colleagues (20). From their work, thesegenes were derived from unsupervised class discovery andshowed little variation within the same tumor but high variationbetween different tumors. The intrinsic genes have been shownto discriminate the different subtypes across different microar-ray studies and platforms. There were 635 intrinsic breast cancergenes on the NKI78 Agilent microarray platform (duplicateprobes were not removed). This was combined with the 49 IRDSgenes and probes with missing values in more than one samplewere excluded, leaving 648 genes. Thus, we rationalized that theintrinsic genes would be a small set of independent breast cancergenes previously tested across different studies/platforms thatcould be combined with the IRDS for gene pair selection by theTSP method.
Using the NKI78 as a training set, we selected the number ofgene pairs to use by evaluating prediction accuracy using 10-foldcross validation and evaluating an odd number of gene pairsfrom one to 19. A plateau in prediction accuracy of �97% wasobserved at seven gene pairs; therefore, seven gene pairs wereselected. Each gene pair contained an IRDS gene, with theseventh gene pair containing two IRDS genes. For each genepair, the probability that the IRDS gene has an expression valuegreater than the non-IRDS gene is greater for IRDS(�) sam-ples. With gene pair seven, in which both genes were from theIRDS, the probability that IFIT3 levels are greater than ZNF273is greater in IRDS(�) samples, which is consistent with the cellline data showing that ZNF273 is one of the minority ofdown-regulated genes in the IRDS. A majority vote method wasused to train the TSP classifier, meaning that if four of sevenIRDS genes scored positive (i.e., had an expression value greaterthan the non-IRDS gene in each pair), the sample would beclassified as IRDS(�). To assess the stability of these seven genepairs, we added Gaussian noise based on the calculated varianceof the training set and ran the TSP algorithm 100 times to selectfor seven gene pairs. The data were perturbed by sampling froma normal distribution with mean zero and variance equal to the25th percentile of the calculated variance from the entire dataset, and adding this noise to a random sample of 10% of thetraining set. We chose the 25th percentile rather than the medianbecause a significant proportion of genes were differentiallyexpressed. After 100 runs using the perturbed data sets, theproportion of times each or both of the genes from the original
Weichselbaum et al. www.pnas.org/cgi/content/short/0809242105 2 of 21
seven gene pairs were selected was calculated. These resultsdemonstrated that the IRDS genes are reasonably stable and donot significantly fall off until seven gene pairs. The non-IRDSgenes from each pair are less stable after the third pair asnon-IRDS genes from other pairs can substitute.
Comparison of Different Classifiers. As expected, classification ofthe NKI295 data set based on the binary TSP classifier was verysimilar to the SVM results (Cramer V statistic � 0.833). Usingan RSF analysis (discussed later), both binary classifiers pre-dicted for metastasis risk after adjusting for other covariates andinteractions, and both improved outcome prediction as part of afull model for patients who received adjuvant chemotherapy. Inpatients who did not receive adjuvant chemotherapy, both binaryclassifiers had little influence on prediction or accuracy. Thus,although both methods gave highly similar results, we focusedour efforts on the TSP because of its clinically desirable prop-erties of using few genes, having simple decision rules, and beingparameter-free.
The TSP IRDS Score. Because no clinical data were used in trainingof either the binary TSP or SVM classifiers, the ability to scalea classifier to clinical outcome could be useful to meet differentclinical goals. For example, for a therapy-predictive marker, onecould either identify patients most likely to be sensitive tostandard adjuvant therapy or patients who are most likelyresistant. The seven gene pairs used in the TSP IRDS classifiernaturally allows scaling for this purpose. Therefore, rather thanuse majority vote for binary classification of IRDS status, weused the number of gene pairs that scored positive (TSP IRDS)in the survival and RSF analysis described in the next section.
Survival and RSF Analysis. To preliminarily test the hypothesis thatthe TSP IRDS is a therapy-predictive marker rather than aprognostic marker, a Cox proportional-hazards regression modelwas used. In addition to standard clinicopathological factors, theuse of adjuvant chemotherapy and interaction terms was mod-eled to test for an interaction between the TSP IRDS and the useof adjuvant chemotherapy. The proportional-hazards assump-tion of a Cox regression was tested to ensure that the time-dependent coefficient �(t) has a slope of 0 (global P � 0.05).Survival analysis was done using the Kaplan-Meier method andthe log-rank test. All analysis was done using the survivalpackage 2.26 for R (by T. Therneau and ported by T. Lumley).
RSF Analysis. Recently, there have been several reports on theappropriateness of using a Cox proportional-hazards regressionmodel and reporting hazard ratios with P values to evaluate newtumor markers (13–15). A hazard ratio with a significant P valueimplies a relationship between the new marker and clinicaloutcome when other markers remain constant, but it does notdirectly address the issue of prediction, which is the primaryobjective. Thus, it has been proposed that models with reason-able assumptions be evaluated with standard markers with andwithout the new marker of interest. Then, a concordance indexor an error rate is used to evaluate prediction accuracy todetermine how much the new marker of interest influences theerror rate. To apply this paradigm, we used an RSF method toevaluate if the TSP IRDS improves upon outcome prediction.An RSF involves constructing survival trees from bootstrapsamples using randomly selected covariates for tree splitting todeliver an ensemble cumulative hazard estimate for survival. Itis virtually free of model assumptions and adjusts for eachcovariate and potential interactions. The RSF also allows thecontribution of each covariate to the overall prediction accuracyto be evaluated using an importance score, which measures thechange in prediction accuracy of the overall model when thefactor is not considered (this is done by permutation). For
analysis using RSF, we used randomSurvivalForest package 2.0(by Hemant Ishwaran and Udaya B. Kogalur) for R. In general,2,500 to 5,000 survival trees were evaluated. Each of the foursplitting rules was tested and the ‘‘logrankscore’’ was used basedon consistently better performance compared with the othermethods. The default number of predictors was randomly sam-pled at each split. To estimate prediction accuracy, an out-of-bagerror rate (1 � Harrell concordance index) was averaged over 50to 100 Monte Carlo runs. Importance scores were similarlydetermined. Models considered included the TSP IRDS withstandard clinicopathological markers (i.e., age, tumor size, num-ber of positive lymph nodes, grade, estrogen receptor status),Adjuvant! Online 10-year breast cancer mortality risk, or riskgroups determined by St. Gallen classification or genomicclassifiers (e.g., NKI 70, wound, molecular subtypes). Partialplots were used to evaluate the influence of each covariate on theexpected relative frequency of metastasis.
Determination of TSP IRDS Cut-Off and Survival Analysis. An impor-tant clinical goal for a therapy-predictive marker is to identifypatients whose disease is likely sensitive to standard adjuvanttreatment to avoid over-treatment but also to minimize denyingpatients with resistant disease more aggressive treatment. Fromthe RSF analysis of the TSP IRDS combined with standardclinicopathological factors or risk groups, a distinct separation inpredicted metastasis risk with increasing TSP IRDS is observedbetween scores less than two and scores of two or greater (Fig.4 B and D). When the estimated standard errors are considered,overlap is observed between scores of one and zero, and anexamination of the prediction error rate reveals that a score ofzero results in higher error than a score of one. Based on thesedata, a TSP IRDS of less than two was used as a conservativecut-off for Kaplan-Meier survival analysis to identify the patientswhose disease was most likely to be sensitive to adjuvant therapy.
The same TSP IRDS cut-off was used in multivariable Coxregression models for importance score calculations along withother covariates that were dichotomized, with the exceptionsbeing tumor size and age, which were treated as continuousvariables, and number of positive lymph nodes, if such informa-tion was available. Importance scores and prediction error rateswere determined using out-of-bag samples. Importance scoreswere calculated by a ‘‘noised-up’’ method whereby coefficientsfor each variable was set to zero and the difference in predictionerror from out-of-bag samples was measured.
Validation of the IRDS. To validate the properties of the IRDS,several independent breast cancer cohorts were assembled (seeTables S5 and S7). Cohort A is comprised of 292 patients fromthe Radcliffe, University of California San Francisco, and Stock-holm data set who all received adjuvant chemotherapy and/orradiation and was used to validate that the IRDS is a therapypredictive marker for DNA damaging agents, i.e., adjuvantchemotherapy and/or radiation. Recurrence-free survival wasused as the endpoint for patients treated with adjuvant chemo-therapy and/or radiation and defined as either an LRF or adistant failure as the first event. Distant metastasis-free survivalas a first event was used as the endpoint for patients treated withadjuvant chemotherapy, and LRF as a first event was used forpatients treated with adjuvant radiation therapy. Cohort B wasused to test if the IRDS is specifically a therapy-predictivemarker for DNA damaging agents and consists of 277 patientsfrom the Loi data set who received only endocrine therapy foradjuvant systemic treatment. Cohort C was used to validate thatthe IRDS does not act as a prognostic marker. Analysis ofprognostic markers is best done in a manner that minimizespotential influence of treatment on the endpoint studied. There-fore, for cohort C, only 286 patients from the Rotterdam data setwho did not receive adjuvant systemic treatment were included,
Weichselbaum et al. www.pnas.org/cgi/content/short/0809242105 3 of 21
and distant metastasis-free survival was used as the endpoint.For each of these assembled cohorts, all patients from each dataset with enough information were used. Patients were excludedonly if the analytic method does not support missing values.
For each data set, calculation of TSP IRDS scores wasperformed as described for the NKI295 data set. Gene expres-sion values were median centered. In cases in which there weregenes not expressed on the particular microarray platform, thecorresponding gene pair was omitted and the TSP IRDS scorewas scaled from zero to seven. For the cross-institute validationanalysis, each of four data sets was used as a test set for eithera RSF or a Cox model trained on the other three. Importancescores for each covariate were determined by the differencebetween the error rate using the full model and the error ratewith the covariate omitted. Other methods that used randomdaughter assignment for out-of-bag samples dropped downin-bag survival trees later became available when predictionusing separate tests sets was used. In practice, both methods
generally yield similar results. For Cox regression, we used thenoised-up method. At least 100 to 1,000 Monte Carlo runs wereused for each test set and the importance score was averaged.When using RSF, missing data were imputed. For Cox regres-sion, missing data were excluded.
To provide average importance score values and estimate theirsampling variability, all breast cancer data sets from Table S8were combined and overlapping patients were excluded. Thisresulted in 1,573 patients. Both RSF and Cox models wereused. However, with RSF missing, data were imputed andanalysis was non-stratified. Because all possible variable in-teractions were considered, treatment effect could be ex-tracted. Importance scores were calculated by random daugh-ter node assignment for out-of-bag samples dropped downin-bag survival trees. In contrast, Cox models were stratified bytreatment and no interactions were included. Bootstrap meansand SEs for both importance scores and prediction error rateswere determined using at least 100 to 1,000 bootstrap sam-plings with replacement.
1. van de Vijver MJ, et al. (2002) A gene-expression signature as a predictor of survival inbreast cancer. N Engl J Med 347:1999–2009.
2. Chang HY, et al. (2005) Robustness, scalability, and integration of a wound-responsegene expression signature in predicting breast cancer survival. Proc Natl Acad Sci USA102:3738–3743.
3. Fan C, et al. (2006) Concordance among gene-expression-based predictors for breastcancer. N Engl J Med 355:560–569.
4. McShane LM, et al. (2002) Methods for assessing reproducibility of clustering patternsobserved in analyses of microarray data. Bioinformatics 18:1462–1469.
5. Goldhirsch A, et al. (2005) Meeting highlights: international expert consensus on theprimary therapy of early breast cancer 2005. Ann Oncol 16:1569–1583.
6. Torres-Roca JF, et al. (2005) Prediction of radiation sensitivity using a gene expressionclassifier. Cancer Res 65:7169–7176.
7. Khodarev NN, et al. (2004) STAT1 is overexpressed in tumors selected for radioresis-tance and confers protection from radiation in transduced sensitive cells. Proc NatlAcad Sci USA 101:1714–1719.
8. Minn AJ, et al. (2005) Genes that mediate breast cancer metastasis to lung. Nature436:518–524.
9. Saeed AI, et al. (2003) TM4: a free, open-source system for microarray data manage-ment and analysis. Biotechniques 34:374–378.
10. Tan AC, Naiman DQ, Xu L, Winslow RL, Geman D (2005) Simple decision rules forclassifying human cancers from gene expression profiles. Bioinformatics 21:3896–3904.
11. Xu L, Tan AC, Naiman DQ, Geman D, Winslow RL (2005) Robust prostate cancer markergenes emerge from direct integration of inter-study microarray data. Bioinformatics21:3905–3911.
12. Sorlie T, et al. (2003) Repeated observation of breast tumor subtypes in independentgene expression data sets. Proc Natl Acad Sci USA 100:8418–8423.
13. Kattan MW (2004) Evaluating a new marker’s predictive contribution. Clin Cancer Res10:822–824.
14. Katz EM, Kattan MW (2005) How to judge a tumor marker. Nat Clin Pract Oncol2:482–483.
15. Simon R (2005) Roadmap for developing and validating therapeutically relevantgenomic classifiers. J Clin Oncol 23:7332–7341.
16. van ’t Veer LJ, et al. (2002) Gene expression profiling predicts clinical outcome of breastcancer. Nature 415:530–536.
17. Chin K, et al. (2006) Genomic and transcriptional aberrations linked to breast cancerpathophysiologies. Cancer Cell 10:529–541.
18. Korkola JE, et al. (2007) Identification of a robust gene signature that predicts breastcancer outcome in independent data sets. BMC Cancer 7:61.
19. Pawitan Y, et al. (2005) Gene expression profiling spares early breast cancer patientsfrom adjuvant therapy: derived and validated in two population-based cohorts. BreastCancer Res 7:R953–R964.
20. Sotiriou C, et al. (2003) Breast cancer classification and prognosis based on geneexpression profiles from a population-based study. Proc Natl Acad Sci USA 100:10393–10398.
21. Wang Y, et al. (2005) Gene-expression profiles to predict distant metastasis of lymph-node-negative primary breast cancer. Lancet 365:671–679.
22. Ma XJ, et al. (2004) A two-gene expression ratio predicts clinical outcome in breastcancer patients treated with tamoxifen. Cancer Cell 5:607–616.
23. Sotiriou C, et al. (2006) Gene expression profiling in breast cancer: understanding themolecular basis of histologic grade to improve prognosis. J Natl Cancer Inst 98:262–272.
24. Loi S, et al. (2007) Definition of clinically distinct molecular subtypes in estrogenreceptor-positive breast carcinomas through genomic grade. J Clin Oncol 25:1239–1246.
25. Desmedt C, et al. (2007) Strong time dependence of the 76-gene prognostic signaturefor node-negative breast cancer patients in the TRANSBIG multicenter independentvalidation series. Clin Cancer Res 13:3207–3214.
26. Chung CH, et al. (2004) Molecular classification of head and neck squamous cellcarcinomas using patterns of gene expression. Cancer Cell 5:489–500.
27. Bild AH, et al. (2006) Oncogenic pathway signatures in human cancers as a guide totargeted therapies. Nature 439:353–357.
28. Stephenson AJ, et al. (2005) Integration of gene expression profiling and clinicalvariables to predict prostate carcinoma recurrence after radical prostatectomy. Cancer104:290–298.
29. Freije WA, et al. (2004) Gene expression profiling of gliomas strongly predicts survival.Cancer Res 64:6503–6510.
30. Phillips HS, et al. (2006) Molecular subclasses of high-grade glioma predict prognosis,delineate a pattern of disease progression, and resemble stages in neurogenesis.Cancer Cell 9:157–173.
Weichselbaum et al. www.pnas.org/cgi/content/short/0809242105 4 of 21
Breast Head and Neck Prostate Lung Glioma1.
2 1.5
1.5 1.
5
1.5
p<0.001 p<0.001 p<0.001p<0.001 p<0.001
AL
og-D
ensi
ty
0.4
0.8
Log
-Den
sity
0.5
1.0
Log
-Den
sity
0.5
1.0
Log
-Den
sity
0.5
1.0
Log
-Den
sity
0.5
1.0
p p pp p
SCC61 Nu61
Rank Correlation Difference
-1.0 0.0 1.0
0.0
Rank Correlation Difference
-1.0 0.0 1.00.
0Rank Correlation Difference
-1.0 0.0 1.0
0.0
Rank Correlation Difference
-1.0 0.0 1.0
0.0
Rank Correlation Difference
-1.0 0.0 1.0
0.0
B
HLA BSTAT1LAMP3
CXCL10HERC6
IFIT3IFI44
IFI44LIFIT1IFI27MX1
ISG15
SCC6 u6B
ROBO1MCL1
CCNA1HSD17B1
HLA-GBST2
IFITM1LGALS3BP
PLSCR1LY6E
FLJ20035OAS3IFI35IRF7
OAS1IFI6
HLA-B
CA2SERPINB2
ZNF273TncRNA
ALDH3A1DAZ2
CXCL1SH3YL1
TIMP3DCN
THBS1GALC
TRIM14RAP2C
CD59SLC6A15
KMS
RankRank Corr
KMS Clust
Fig. S1. Rank correlation analysis comparing IRDS gene expression profiles of primary human cancers versus Nu61/SCC61 and class assignment of 78 breasttumors. (A) The gene expression profile of the IRDS genes for each patient sample from the indicated primary tumor types was compared with the IRDS geneprofiles of Nu61 samples and to the profiles of SCC61 samples by rank correlation analysis. The difference between the mean rank correlation to Nu61 and toSCC61 was defined as the rank correlation difference (blue histogram) and was used as a test statistic. Positive values of the rank correlation difference representsimilarity to the Nu61 IRDS gene profiles and negative values represent similarity to SCC61. The Nu61 profile defines the IRDS(�) state and that of SCC61 definesthe IRDS(�) state. A null distribution of the test statistic was generated by random permutation of the Nu61 and SCC61 class labels. The distribution-free P valuefor each sample was calculated by comparison to the null distributions. Shown are the null distributions (red) and the median P values for the indicated cancertypes. (B) The IRDS gene expression profiles for 78 patients with breast cancer along with the Nu61 and SCC61 IRDS centroid are shown in the heat map withsamples in columns and IRDS genes in rows. Orange is high gene expression and blue is low. The position of the Nu61 and the SCC61 centroids are indicated byarrows. IRDS(�) and IRDS(�) class assignments were made by comparing each patient sample to the Nu61 and SCC61 IRDS gene profiles. Samples were assignedas IRDS(�) if the mean rank correlation was closer to Nu61 than to SCC61 and IRDS(�) if it was closer to SCC61. Alternatively, k-means support clustering witha k value of 2 was performed using the IRDS genes to divide the patient samples into two groups. The centroid of each group was compared with the Nu61 andthe SCC61 centroid. The group positively correlating with Nu61 was assigned as IRDS(�) and the group positively correlating with SCC61 was assigned as IRDS(�).Results of each method are shown on the bottom of the heat map, with vertical black bars indicating IRDS(�) status. The correlation between the two methodsis 0.90.
Weichselbaum et al. www.pnas.org/cgi/content/short/0809242105 5 of 21
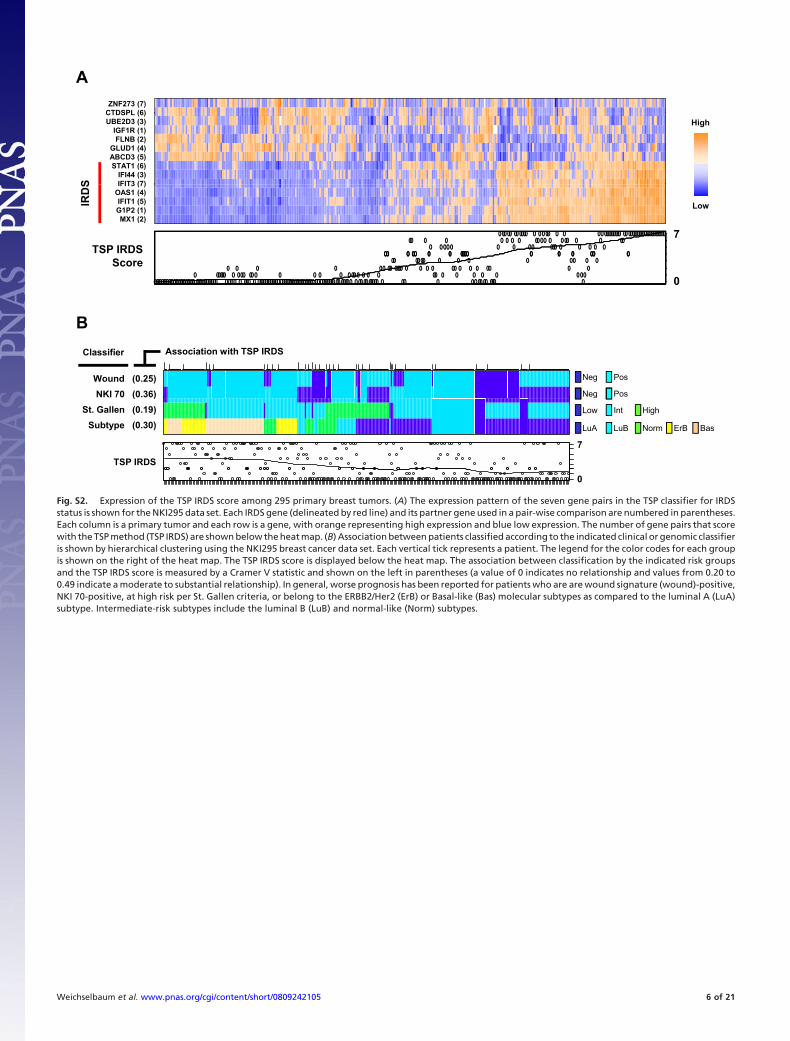
ZNF273 (7)CTDSPL (6)
A
CTDSPL (6)UBE2D3 (3)
IGF1R (1)FLNB (2)
GLUD1 (4)ABCD3 (5)STAT1 (6)
IFI44 (3)IFIT3 (7)S
High
IFIT3 (7)OAS1 (4)IFIT1 (5)G1P2 (1)MX1 (2)
IRD
S
TSP IRDS
Low
7
Score0
B
Neg Pos
Neg Pos
Wound (0.25)NKI 70 (0.36)
Association with TSP IRDSClassifier
B
g
Low Int High
LuA LuB Norm ErB Bas
( )St. Gallen (0.19)
Subtype (0.30)
TSP IRDS
7
0
Fig. S2. Expression of the TSP IRDS score among 295 primary breast tumors. (A) The expression pattern of the seven gene pairs in the TSP classifier for IRDSstatus is shown for the NKI295 data set. Each IRDS gene (delineated by red line) and its partner gene used in a pair-wise comparison are numbered in parentheses.Each column is a primary tumor and each row is a gene, with orange representing high expression and blue low expression. The number of gene pairs that scorewith the TSP method (TSP IRDS) are shown below the heat map. (B) Association between patients classified according to the indicated clinical or genomic classifieris shown by hierarchical clustering using the NKI295 breast cancer data set. Each vertical tick represents a patient. The legend for the color codes for each groupis shown on the right of the heat map. The TSP IRDS score is displayed below the heat map. The association between classification by the indicated risk groupsand the TSP IRDS score is measured by a Cramer V statistic and shown on the left in parentheses (a value of 0 indicates no relationship and values from 0.20 to0.49 indicate a moderate to substantial relationship). In general, worse prognosis has been reported for patients who are are wound signature (wound)-positive,NKI 70-positive, at high risk per St. Gallen criteria, or belong to the ERBB2/Her2 (ErB) or Basal-like (Bas) molecular subtypes as compared to the luminal A (LuA)subtype. Intermediate-risk subtypes include the luminal B (LuB) and normal-like (Norm) subtypes.
Weichselbaum et al. www.pnas.org/cgi/content/short/0809242105 6 of 21
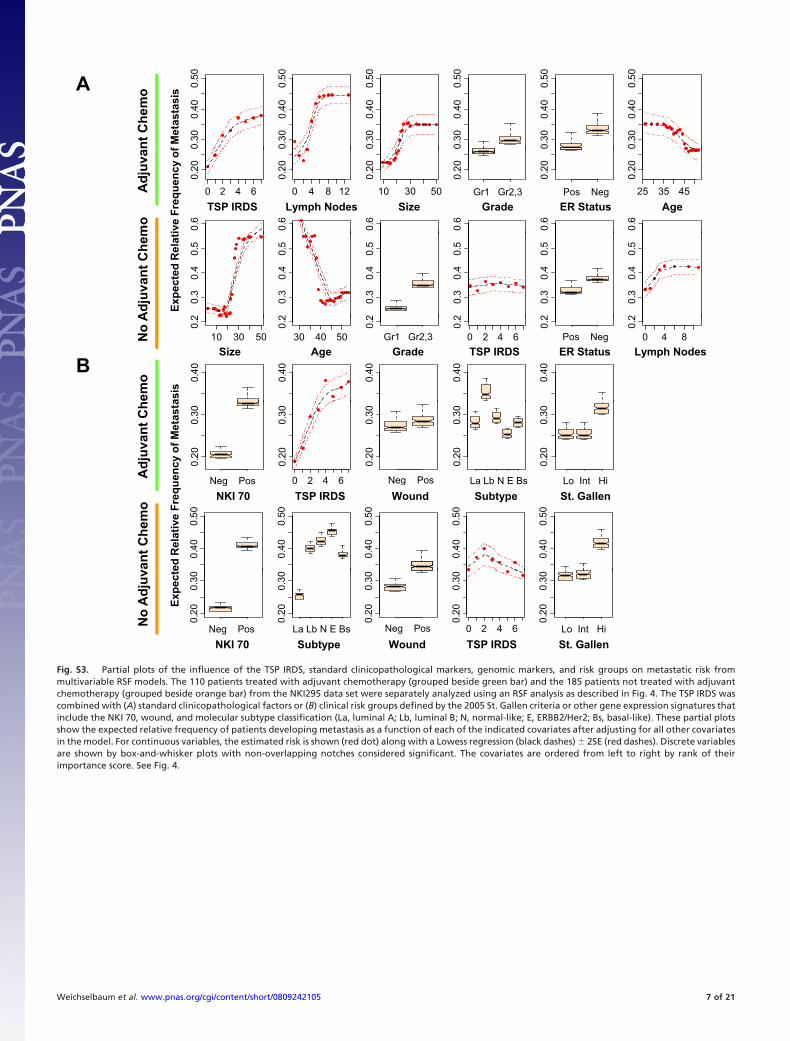
nt C
hem
o
0.3
00
.40
0.5
0
0.3
00
.40
0.5
0
0.3
00
.40
0.5
0
0.3
00
.40
0.5
0
0.3
00
.40
0.5
0
0.3
00
.40
0.5
0
f Met
asta
sisA
Adj
uva
mo
0 2 4 60
.20
0TSP.RSS.score.k7
0 4 8 12
0.2
00
LN
10 30 50
0.2
00
diam
0.2
00
gr23
0 1
0.2
00
ER_neg
0 1 25 35 45
0.2
00
age0
.6
0.6
0.6
0.6
0.6
0.6
TSP IRDS Lymph Nodes Size AgeGradeGr1 Gr2,3
ER StatusPos Neg
ive
Freq
uenc
y of
Adj
uvan
t Che
m
20
.30
.40
.5
20
.30
.40
.5
20
.30
.40
.5
20
.30
.40
.5
20
.30
.40
.5
20
.30
.40
.5
Expe
cted
Rel
ati
No
Aem
o
10 30 50
0.2
diam
30 40 50
0.2
age
0.2
gr23
0 1 0 2 4 6
0.2
TSP.RSS.score.k7
0.2
ER_neg
0 1 0 4 8
0.2
LN
0.4
0
0.4
0
0.4
0
0.4
0
0.4
0
ER StatusPos Neg
Lymph NodesTSP IRDS Size GradeGr1 Gr2,3
AgeB
asis
Adj
uvan
t Ch
0.2
00.
30
0 1 0 2 4 6
0.2
00.
30
0.2
00.
30
0 1
0.2
00.
30
1 2 3 4 5
0.2
00.
30
1 2 3Neg Pos La Lb N E Bs Lo Int Hiuenc
y of
Met
asta
Neg Pos
ant C
hem
o
NKI70 TSP.RSS.score.k7 Wound Subtype StGall.2005
0.4
00.
50
0.4
00.
50
0.4
00.
50
0.4
00.
50
0.4
00.
50
TSP IRDS NKI 70g
Subtype St. Gallen
ed R
elat
ive
Freq
u
Woundg
No
Adj
uv
0.2
00.
30
NKI70
0 1
0.2
00.
30
Subtype
1 2 3 4 5
0.2
00.
30
Wound
0 1 0 2 4 6
0.2
00.
30
TSP.RSS.score.k7
0.2
00.
30
StGall.2005
1 2 3
TSP IRDS TSP IRDS NKI 70Neg Pos La Lb N E Bs
SubtypeLo Int Hi
St. Gallen
Expe
cte
WoundNeg Pos
Fig. S3. Partial plots of the influence of the TSP IRDS, standard clinicopathological markers, genomic markers, and risk groups on metastatic risk frommultivariable RSF models. The 110 patients treated with adjuvant chemotherapy (grouped beside green bar) and the 185 patients not treated with adjuvantchemotherapy (grouped beside orange bar) from the NKI295 data set were separately analyzed using an RSF analysis as described in Fig. 4. The TSP IRDS wascombined with (A) standard clinicopathological factors or (B) clinical risk groups defined by the 2005 St. Gallen criteria or other gene expression signatures thatinclude the NKI 70, wound, and molecular subtype classification (La, luminal A; Lb, luminal B; N, normal-like; E, ERBB2/Her2; Bs, basal-like). These partial plotsshow the expected relative frequency of patients developing metastasis as a function of each of the indicated covariates after adjusting for all other covariatesin the model. For continuous variables, the estimated risk is shown (red dot) along with a Lowess regression (black dashes) � 2SE (red dashes). Discrete variablesare shown by box-and-whisker plots with non-overlapping notches considered significant. The covariates are ordered from left to right by rank of theirimportance score. See Fig. 4.
Weichselbaum et al. www.pnas.org/cgi/content/short/0809242105 7 of 21
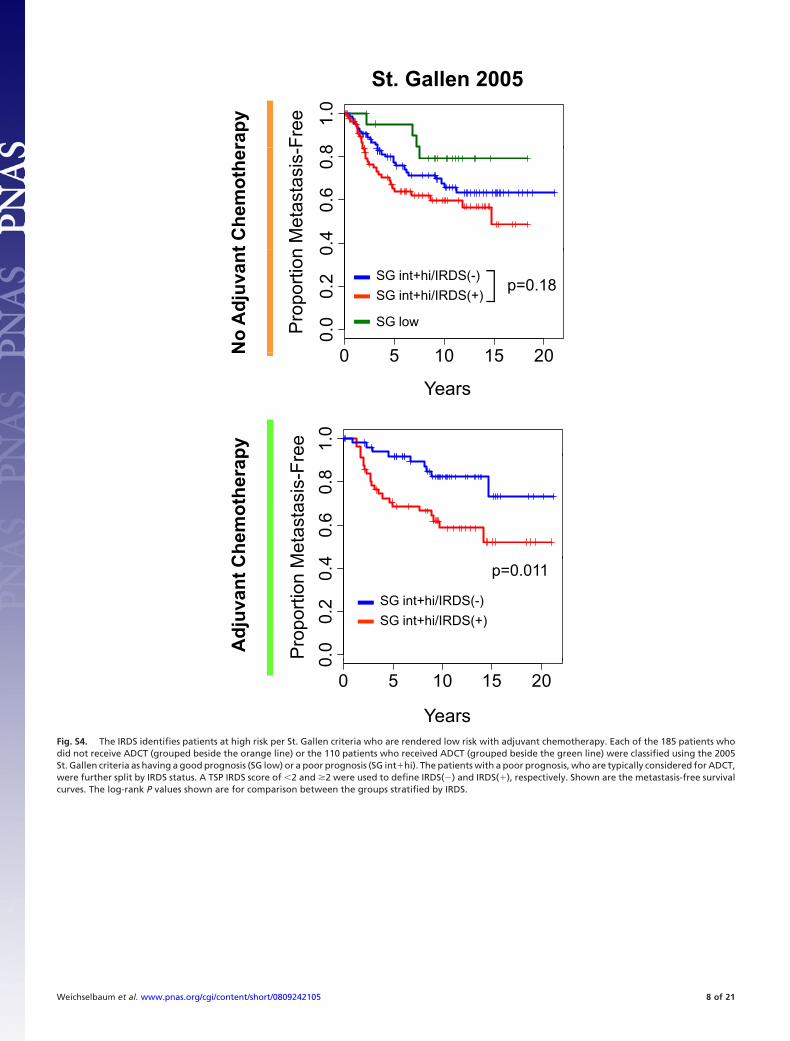
rapy
81.
0
Fre
e
St. Gallen 2005
t Che
mot
her
0.4
0.6
0.8
n M
etas
tasi
s-
No
Adj
uvan
t
0 5 10 15 20
0.0
0.2
0
p=0.18
SG low
SG int+hi/IRDS(+)
SG int+hi/IRDS(-)
Pro
port
ion
pyN 0 5 10 15 20
Years
1.0
ee
Che
mot
hera
p
40.
60.
8
Met
asta
sis-
Fre
Adj
uvan
t C
0.0
0.2
0.4
p=0.011
SG int+hi/IRDS(+)
SG int+hi/IRDS(-)
Pro
port
ion
M
0 5 10 15 20
0
YearsFig. S4. The IRDS identifies patients at high risk per St. Gallen criteria who are rendered low risk with adjuvant chemotherapy. Each of the 185 patients whodid not receive ADCT (grouped beside the orange line) or the 110 patients who received ADCT (grouped beside the green line) were classified using the 2005St. Gallen criteria as having a good prognosis (SG low) or a poor prognosis (SG int�hi). The patients with a poor prognosis, who are typically considered for ADCT,were further split by IRDS status. A TSP IRDS score of �2 and �2 were used to define IRDS(�) and IRDS(�), respectively. Shown are the metastasis-free survivalcurves. The log-rank P values shown are for comparison between the groups stratified by IRDS.
Weichselbaum et al. www.pnas.org/cgi/content/short/0809242105 8 of 21
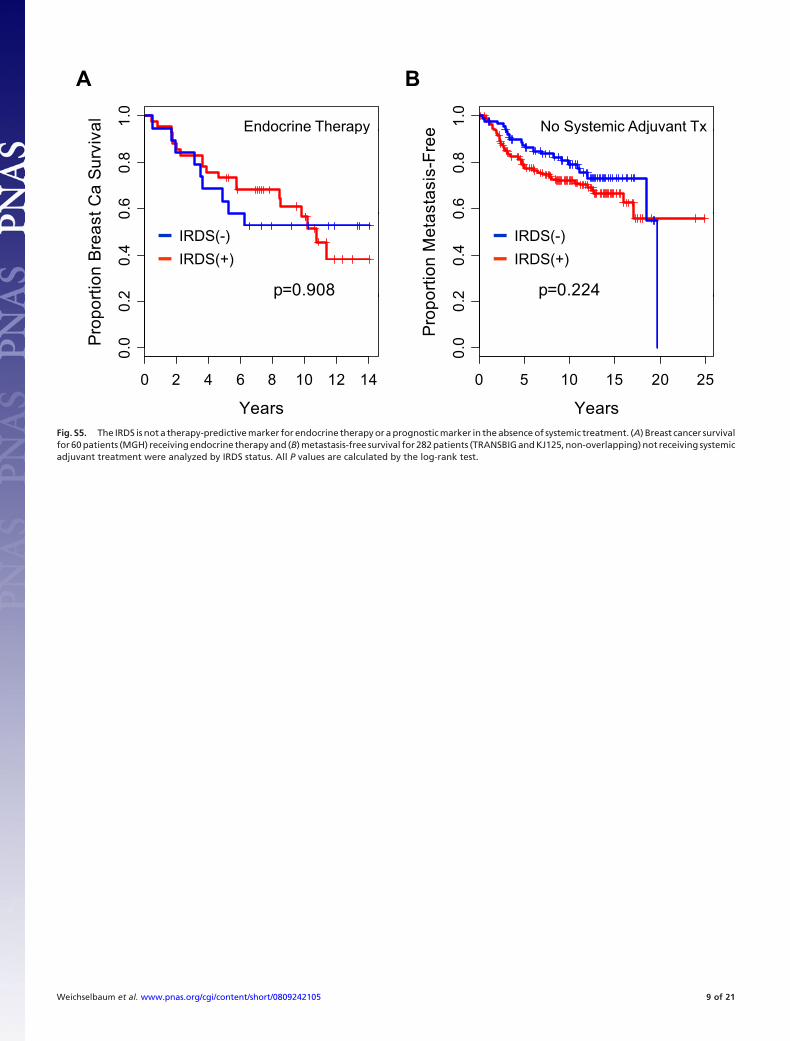
1.0
al 1.0
eEndocrine Therapy No Systemic Adjuvant Tx
BA
0.6
0.8
t C
a S
urv
iva
0.6
0.8
sta
sis-
Fre
eEndocrine Therapy No Systemic Adjuvant Tx2
0.4
0
rtio
n B
rea
st
p=0.908 20
.40
ort
ion
Me
ta
p=0.224
IRDS(-)
IRDS(+)
IRDS(-)
IRDS(+)
0 2 4 6 8 10 12 14
0.0
0.2
Pro
po
r p
0 5 10 15 20 25
0.0
0.2
Pro
po p
0 2 4 6 8 10 12 14
Years
0 5 10 15 20 25
YearsFig. S5. The IRDS is not a therapy-predictive marker for endocrine therapy or a prognostic marker in the absence of systemic treatment. (A) Breast cancer survivalfor 60 patients (MGH) receiving endocrine therapy and (B) metastasis-free survival for 282 patients (TRANSBIG and KJ125, non-overlapping) not receiving systemicadjuvant treatment were analyzed by IRDS status. All P values are calculated by the log-rank test.
Weichselbaum et al. www.pnas.org/cgi/content/short/0809242105 9 of 21
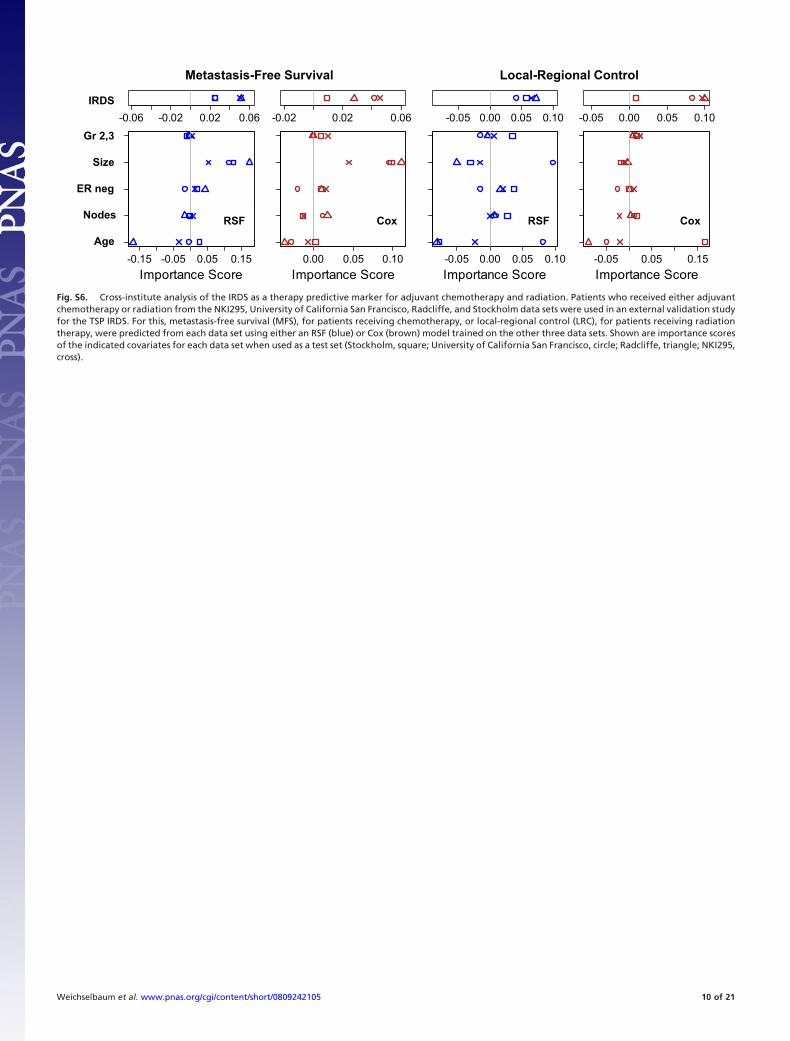
IRDS
G 2 3
Metastasis-Free Survival Local-Regional Control
-0.06 -0.02 0.02 0.06 -0.02 0.02 0.06 -0.05 0.00 0.05 0.10 -0.05 0.00 0.05 0.10
Size
Gr 2,3
ER neg
Age
Nodes xoCFSRxoCFSR
-0.15 -0.05 0.05 0.15
I t S0.00 0.05 0.10
I t S-0.05 0.00 0.05 0.10
I t S-0.05 0.05 0.15
I t SImportance Score Importance Score Importance Score Importance Score
Fig. S6. Cross-institute analysis of the IRDS as a therapy predictive marker for adjuvant chemotherapy and radiation. Patients who received either adjuvantchemotherapy or radiation from the NKI295, University of California San Francisco, Radcliffe, and Stockholm data sets were used in an external validation studyfor the TSP IRDS. For this, metastasis-free survival (MFS), for patients receiving chemotherapy, or local-regional control (LRC), for patients receiving radiationtherapy, were predicted from each data set using either an RSF (blue) or Cox (brown) model trained on the other three data sets. Shown are importance scoresof the indicated covariates for each data set when used as a test set (Stockholm, square; University of California San Francisco, circle; Radcliffe, triangle; NKI295,cross).
Weichselbaum et al. www.pnas.org/cgi/content/short/0809242105 10 of 21
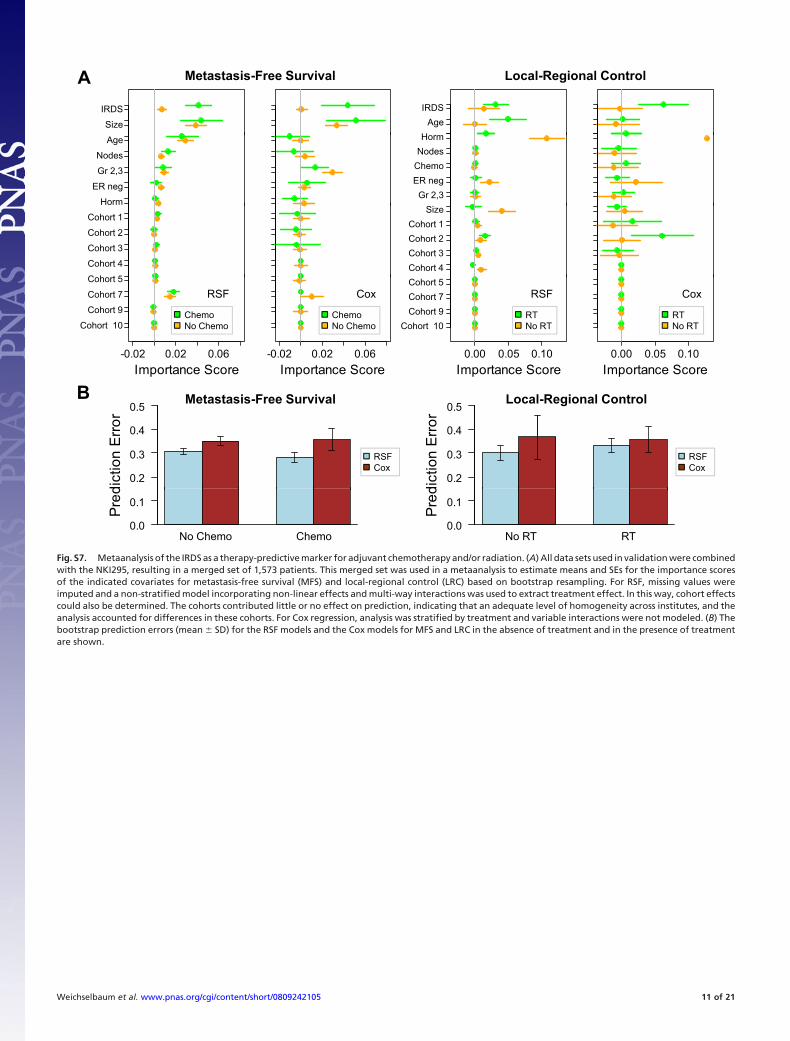
Size
IRDS IRDS
Age
H
Metastasis-Free Survival Local-Regional ControlA
Age
Nodes
Gr 2,3
ER neg
Horm
Nodes
Gr 2,3
ER neg
Horm
Chemo
HormSize
Cohort 2
Cohort 3
Cohort 4
C h 5
Cohort 1
Cohort 2
Cohort 3
Cohort 4
Cohort 1
Cohort 5
Cohort 7
Cohort 9
Cohort 10
Cohort 5
Cohort 7
Cohort 9
Cohort 10ChemoNo Chemo
ChemoNo Chemo
RTNo RT
RTNo RT
xoCFSRxoCFSR
-0.02 0.02 0.06
Importance Score-0.02 0.02 0.06
Importance Score0.00 0.05 0.10
Importance Score0.00 0.05 0.10
Importance Score
Metastasis-Free Survival Local-Regional ControlB
r 0.5 r 0.5
RSFCox
RSFCox
dic
tion
Err
or
0.2
0.3
0.4d
ictio
n E
rro
r
0.2
0.3
0.4
TRTR oNomehComehC oN
Pre
d
0.0
0.1
Pre
d
0.0
0.1
Fig. S7. Metaanalysis of the IRDS as a therapy-predictive marker for adjuvant chemotherapy and/or radiation. (A) All data sets used in validation were combinedwith the NKI295, resulting in a merged set of 1,573 patients. This merged set was used in a metaanalysis to estimate means and SEs for the importance scoresof the indicated covariates for metastasis-free survival (MFS) and local-regional control (LRC) based on bootstrap resampling. For RSF, missing values wereimputed and a non-stratified model incorporating non-linear effects and multi-way interactions was used to extract treatment effect. In this way, cohort effectscould also be determined. The cohorts contributed little or no effect on prediction, indicating that an adequate level of homogeneity across institutes, and theanalysis accounted for differences in these cohorts. For Cox regression, analysis was stratified by treatment and variable interactions were not modeled. (B) Thebootstrap prediction errors (mean � SD) for the RSF models and the Cox models for MFS and LRC in the absence of treatment and in the presence of treatmentare shown.
Weichselbaum et al. www.pnas.org/cgi/content/short/0809242105 11 of 21
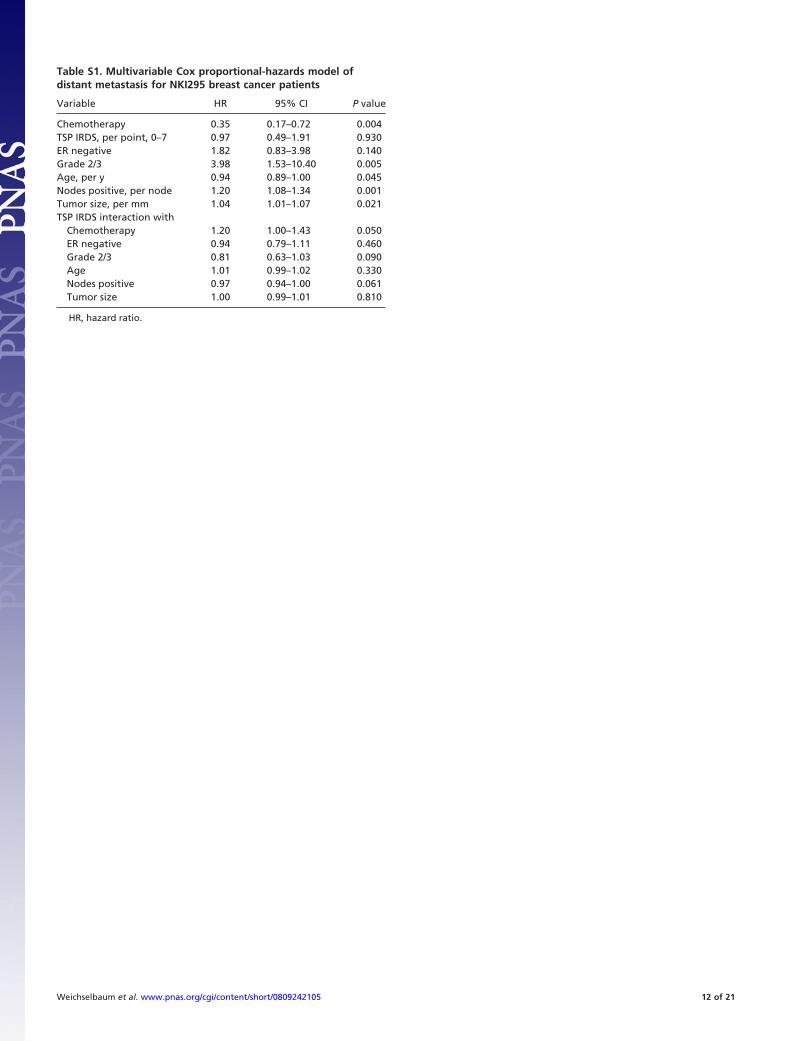
Table S1. Multivariable Cox proportional-hazards model ofdistant metastasis for NKI295 breast cancer patients
Variable HR 95% CI P value
Chemotherapy 0.35 0.17–0.72 0.004TSP IRDS, per point, 0–7 0.97 0.49–1.91 0.930ER negative 1.82 0.83–3.98 0.140Grade 2/3 3.98 1.53–10.40 0.005Age, per y 0.94 0.89–1.00 0.045Nodes positive, per node 1.20 1.08–1.34 0.001Tumor size, per mm 1.04 1.01–1.07 0.021TSP IRDS interaction with
Chemotherapy 1.20 1.00–1.43 0.050ER negative 0.94 0.79–1.11 0.460Grade 2/3 0.81 0.63–1.03 0.090Age 1.01 0.99–1.02 0.330Nodes positive 0.97 0.94–1.00 0.061Tumor size 1.00 0.99–1.01 0.810
HR, hazard ratio.
Weichselbaum et al. www.pnas.org/cgi/content/short/0809242105 12 of 21
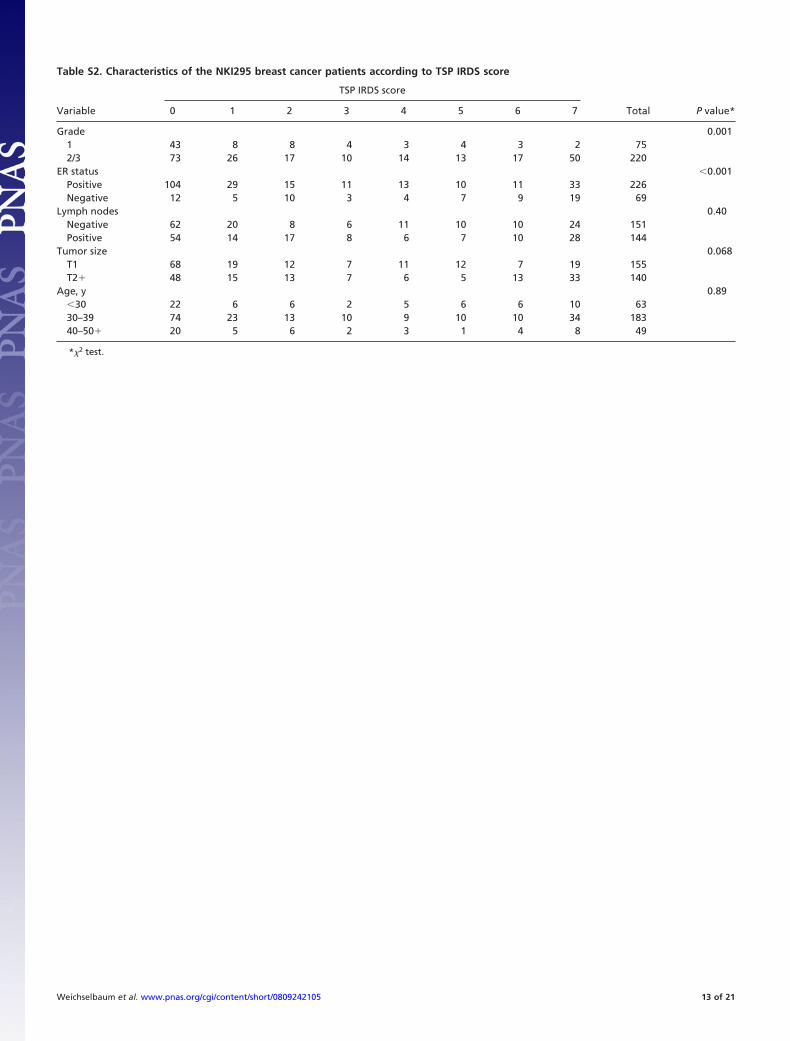
Table S2. Characteristics of the NKI295 breast cancer patients according to TSP IRDS score
Variable
TSP IRDS score
Total P value*0 1 2 3 4 5 6 7
Grade 0.0011 43 8 8 4 3 4 3 2 752/3 73 26 17 10 14 13 17 50 220
ER status �0.001Positive 104 29 15 11 13 10 11 33 226Negative 12 5 10 3 4 7 9 19 69
Lymph nodes 0.40Negative 62 20 8 6 11 10 10 24 151Positive 54 14 17 8 6 7 10 28 144
Tumor size 0.068T1 68 19 12 7 11 12 7 19 155T2� 48 15 13 7 6 5 13 33 140
Age, y 0.89�30 22 6 6 2 5 6 6 10 6330–39 74 23 13 10 9 10 10 34 18340–50� 20 5 6 2 3 1 4 8 49
*�2 test.
Weichselbaum et al. www.pnas.org/cgi/content/short/0809242105 13 of 21
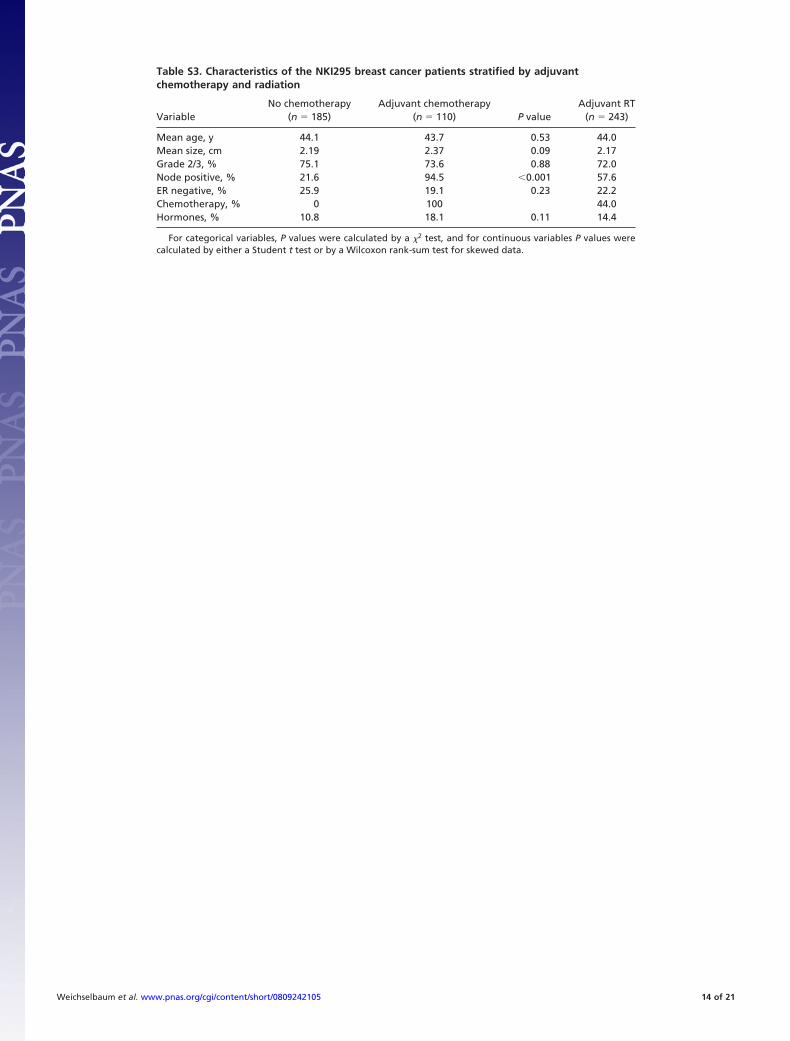
Table S3. Characteristics of the NKI295 breast cancer patients stratified by adjuvantchemotherapy and radiation
VariableNo chemotherapy
(n � 185)Adjuvant chemotherapy
(n � 110) P valueAdjuvant RT
(n � 243)
Mean age, y 44.1 43.7 0.53 44.0Mean size, cm 2.19 2.37 0.09 2.17Grade 2/3, % 75.1 73.6 0.88 72.0Node positive, % 21.6 94.5 �0.001 57.6ER negative, % 25.9 19.1 0.23 22.2Chemotherapy, % 0 100 44.0Hormones, % 10.8 18.1 0.11 14.4
For categorical variables, P values were calculated by a �2 test, and for continuous variables P values werecalculated by either a Student t test or by a Wilcoxon rank-sum test for skewed data.
Weichselbaum et al. www.pnas.org/cgi/content/short/0809242105 14 of 21
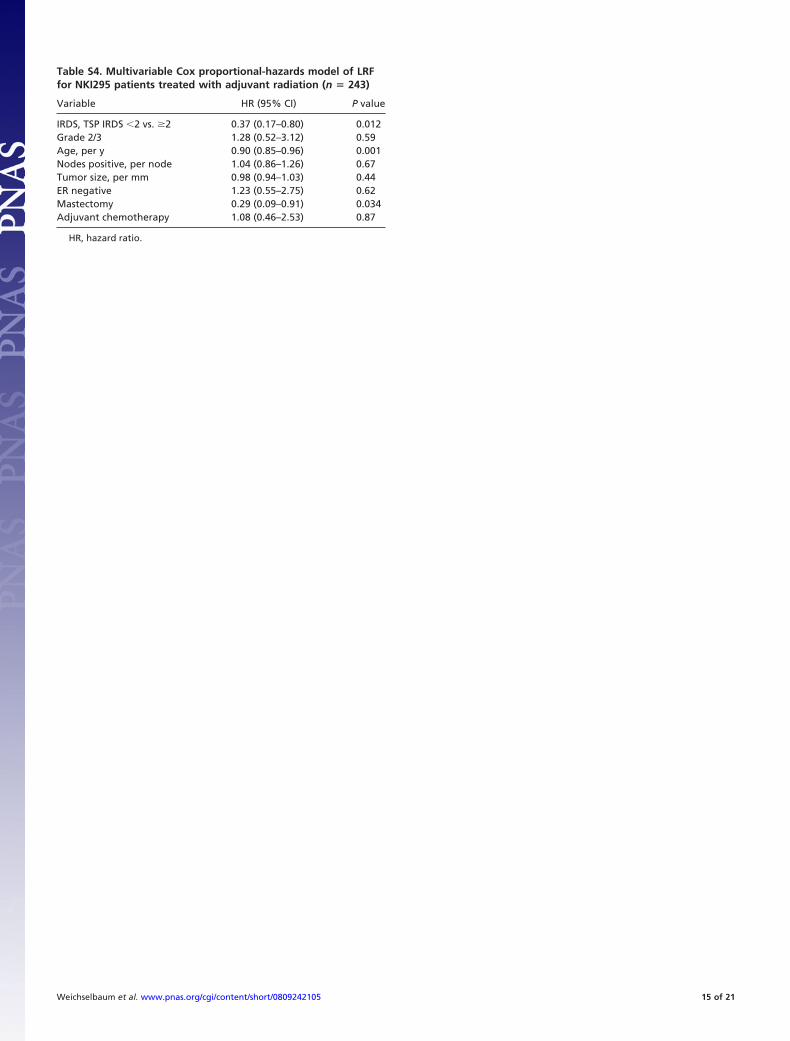
Table S4. Multivariable Cox proportional-hazards model of LRFfor NKI295 patients treated with adjuvant radiation (n � 243)
Variable HR (95% CI) P value
IRDS, TSP IRDS �2 vs. �2 0.37 (0.17–0.80) 0.012Grade 2/3 1.28 (0.52–3.12) 0.59Age, per y 0.90 (0.85–0.96) 0.001Nodes positive, per node 1.04 (0.86–1.26) 0.67Tumor size, per mm 0.98 (0.94–1.03) 0.44ER negative 1.23 (0.55–2.75) 0.62Mastectomy 0.29 (0.09–0.91) 0.034Adjuvant chemotherapy 1.08 (0.46–2.53) 0.87
HR, hazard ratio.
Weichselbaum et al. www.pnas.org/cgi/content/short/0809242105 15 of 21
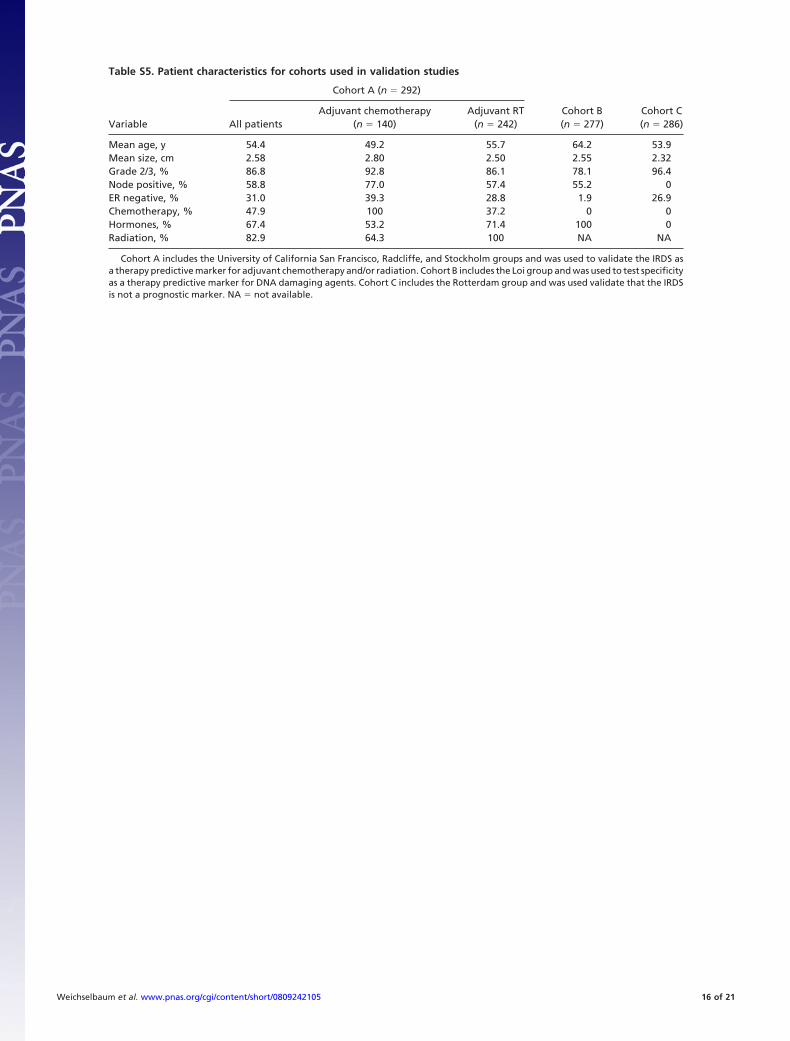
Table S5. Patient characteristics for cohorts used in validation studies
Variable
Cohort A (n � 292)
Cohort B(n � 277)
Cohort C(n � 286)All patients
Adjuvant chemotherapy(n � 140)
Adjuvant RT(n � 242)
Mean age, y 54.4 49.2 55.7 64.2 53.9Mean size, cm 2.58 2.80 2.50 2.55 2.32Grade 2/3, % 86.8 92.8 86.1 78.1 96.4Node positive, % 58.8 77.0 57.4 55.2 0ER negative, % 31.0 39.3 28.8 1.9 26.9Chemotherapy, % 47.9 100 37.2 0 0Hormones, % 67.4 53.2 71.4 100 0Radiation, % 82.9 64.3 100 NA NA
Cohort A includes the University of California San Francisco, Radcliffe, and Stockholm groups and was used to validate the IRDS asa therapy predictive marker for adjuvant chemotherapy and/or radiation. Cohort B includes the Loi group and was used to test specificityas a therapy predictive marker for DNA damaging agents. Cohort C includes the Rotterdam group and was used validate that the IRDSis not a prognostic marker. NA � not available.
Weichselbaum et al. www.pnas.org/cgi/content/short/0809242105 16 of 21
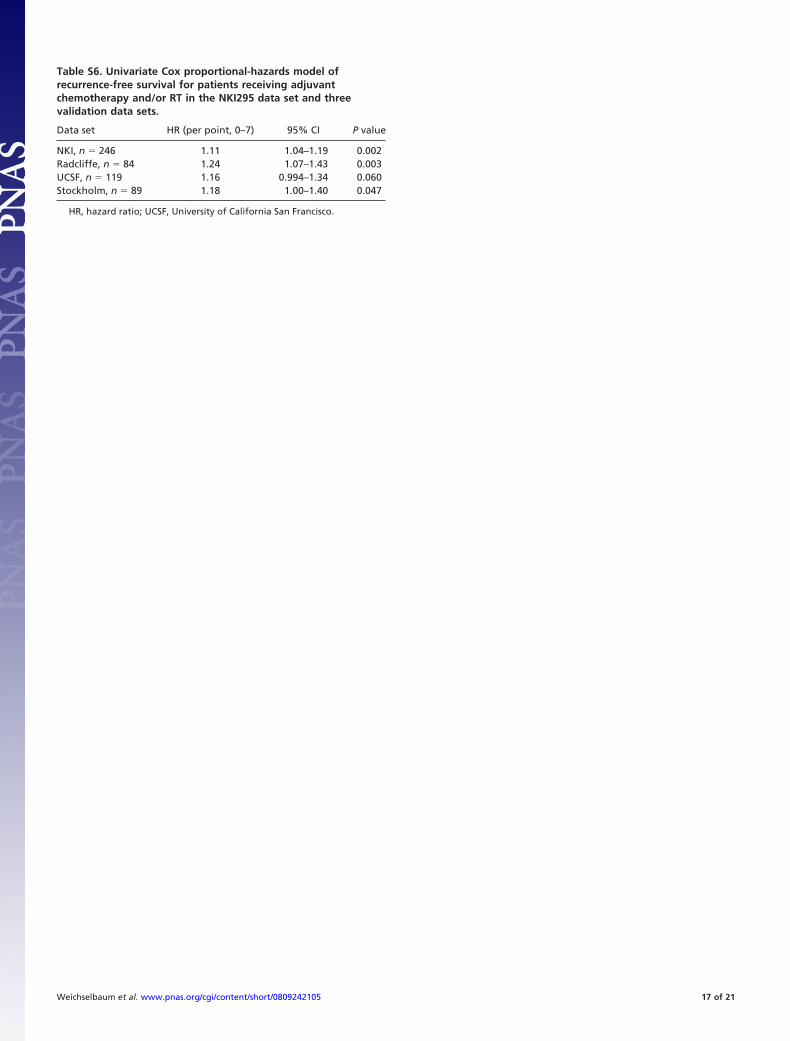
Table S6. Univariate Cox proportional-hazards model ofrecurrence-free survival for patients receiving adjuvantchemotherapy and/or RT in the NKI295 data set and threevalidation data sets.
Data set HR (per point, 0–7) 95% CI P value
NKI, n � 246 1.11 1.04–1.19 0.002Radcliffe, n � 84 1.24 1.07–1.43 0.003UCSF, n � 119 1.16 0.994–1.34 0.060Stockholm, n � 89 1.18 1.00–1.40 0.047
HR, hazard ratio; UCSF, University of California San Francisco.
Weichselbaum et al. www.pnas.org/cgi/content/short/0809242105 17 of 21
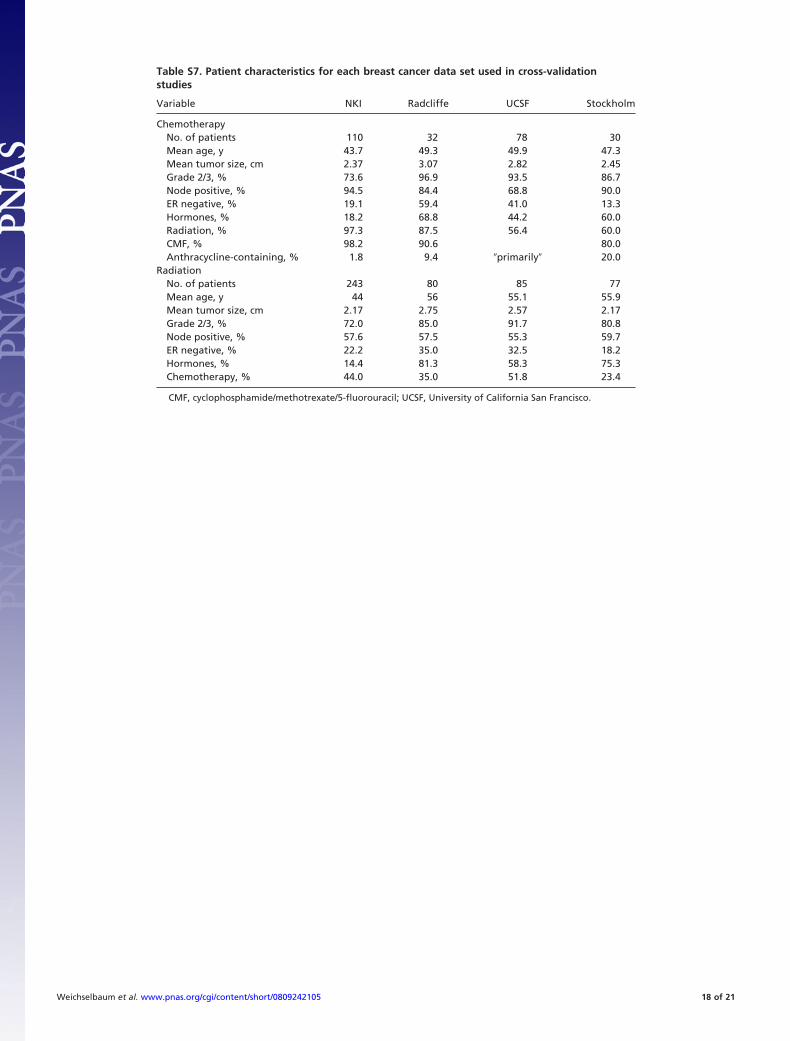
Table S7. Patient characteristics for each breast cancer data set used in cross-validationstudies
Variable NKI Radcliffe UCSF Stockholm
ChemotherapyNo. of patients 110 32 78 30Mean age, y 43.7 49.3 49.9 47.3Mean tumor size, cm 2.37 3.07 2.82 2.45Grade 2/3, % 73.6 96.9 93.5 86.7Node positive, % 94.5 84.4 68.8 90.0ER negative, % 19.1 59.4 41.0 13.3Hormones, % 18.2 68.8 44.2 60.0Radiation, % 97.3 87.5 56.4 60.0CMF, % 98.2 90.6 80.0Anthracycline-containing, % 1.8 9.4 �primarily� 20.0
RadiationNo. of patients 243 80 85 77Mean age, y 44 56 55.1 55.9Mean tumor size, cm 2.17 2.75 2.57 2.17Grade 2/3, % 72.0 85.0 91.7 80.8Node positive, % 57.6 57.5 55.3 59.7ER negative, % 22.2 35.0 32.5 18.2Hormones, % 14.4 81.3 58.3 75.3Chemotherapy, % 44.0 35.0 51.8 23.4
CMF, cyclophosphamide/methotrexate/5-fluorouracil; UCSF, University of California San Francisco.
Weichselbaum et al. www.pnas.org/cgi/content/short/0809242105 18 of 21
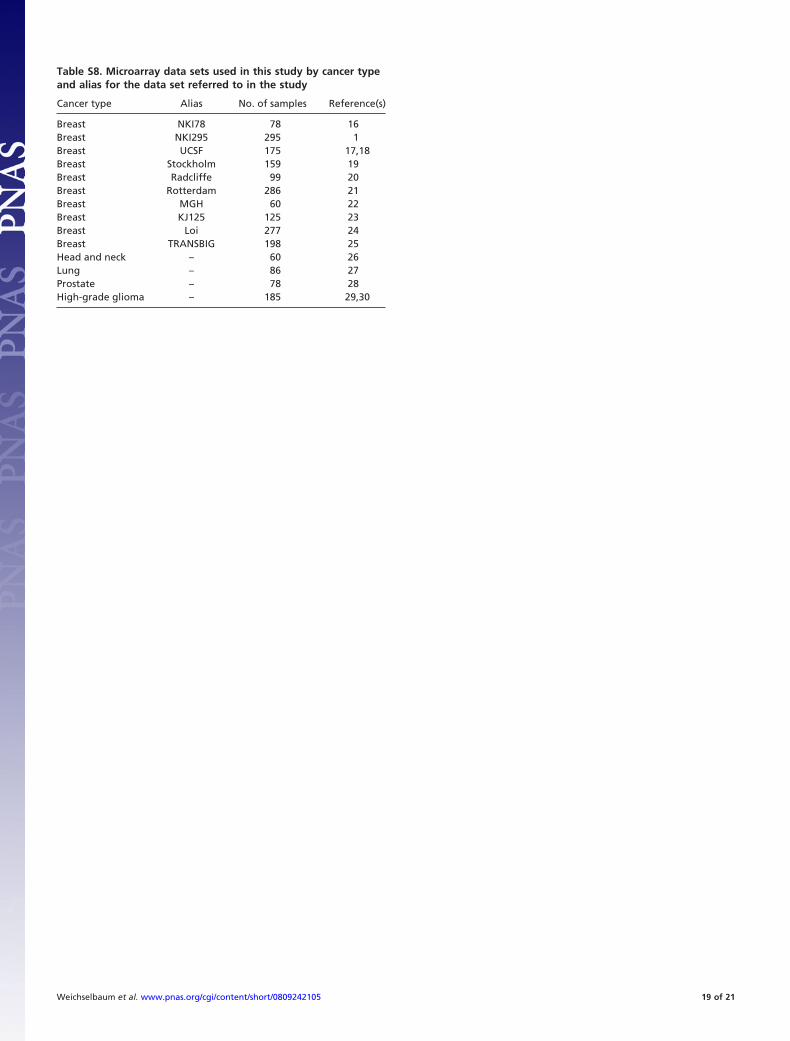
Table S8. Microarray data sets used in this study by cancer typeand alias for the data set referred to in the study
Cancer type Alias No. of samples Reference(s)
Breast NKI78 78 16Breast NKI295 295 1Breast UCSF 175 17,18Breast Stockholm 159 19Breast Radcliffe 99 20Breast Rotterdam 286 21Breast MGH 60 22Breast KJ125 125 23Breast Loi 277 24Breast TRANSBIG 198 25Head and neck – 60 26Lung – 86 27Prostate – 78 28High-grade glioma – 185 29,30
Weichselbaum et al. www.pnas.org/cgi/content/short/0809242105 19 of 21
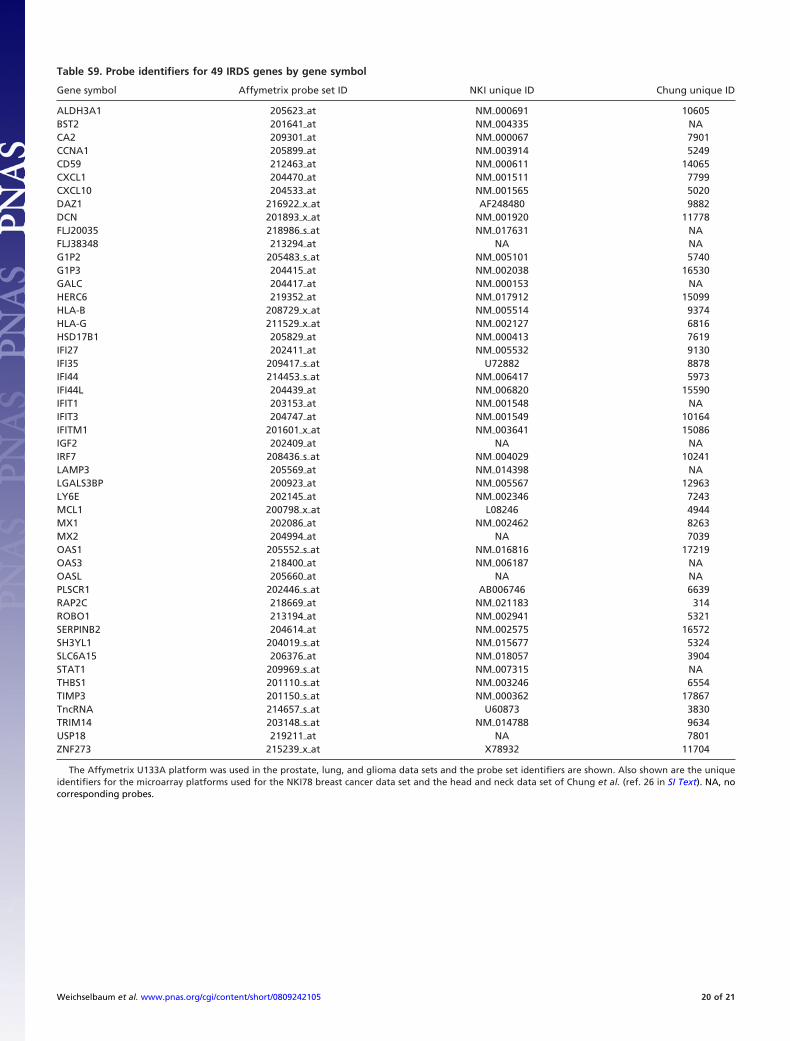
Table S9. Probe identifiers for 49 IRDS genes by gene symbol
Gene symbol Affymetrix probe set ID NKI unique ID Chung unique ID
ALDH3A1 205623�at NM�000691 10605BST2 201641�at NM�004335 NACA2 209301�at NM�000067 7901CCNA1 205899�at NM�003914 5249CD59 212463�at NM�000611 14065CXCL1 204470�at NM�001511 7799CXCL10 204533�at NM�001565 5020DAZ1 216922�x�at AF248480 9882DCN 201893�x�at NM�001920 11778FLJ20035 218986�s�at NM�017631 NAFLJ38348 213294�at NA NAG1P2 205483�s�at NM�005101 5740G1P3 204415�at NM�002038 16530GALC 204417�at NM�000153 NAHERC6 219352�at NM�017912 15099HLA-B 208729�x�at NM�005514 9374HLA-G 211529�x�at NM�002127 6816HSD17B1 205829�at NM�000413 7619IFI27 202411�at NM�005532 9130IFI35 209417�s�at U72882 8878IFI44 214453�s�at NM�006417 5973IFI44L 204439�at NM�006820 15590IFIT1 203153�at NM�001548 NAIFIT3 204747�at NM�001549 10164IFITM1 201601�x�at NM�003641 15086IGF2 202409�at NA NAIRF7 208436�s�at NM�004029 10241LAMP3 205569�at NM�014398 NALGALS3BP 200923�at NM�005567 12963LY6E 202145�at NM�002346 7243MCL1 200798�x�at L08246 4944MX1 202086�at NM�002462 8263MX2 204994�at NA 7039OAS1 205552�s�at NM�016816 17219OAS3 218400�at NM�006187 NAOASL 205660�at NA NAPLSCR1 202446�s�at AB006746 6639RAP2C 218669�at NM�021183 314ROBO1 213194�at NM�002941 5321SERPINB2 204614�at NM�002575 16572SH3YL1 204019�s�at NM�015677 5324SLC6A15 206376�at NM�018057 3904STAT1 209969�s�at NM�007315 NATHBS1 201110�s�at NM�003246 6554TIMP3 201150�s�at NM�000362 17867TncRNA 214657�s�at U60873 3830TRIM14 203148�s�at NM�014788 9634USP18 219211�at NA 7801ZNF273 215239�x�at X78932 11704
The Affymetrix U133A platform was used in the prostate, lung, and glioma data sets and the probe set identifiers are shown. Also shown are the uniqueidentifiers for the microarray platforms used for the NKI78 breast cancer data set and the head and neck data set of Chung et al. (ref. 26 in SI Text). NA, nocorresponding probes.
Weichselbaum et al. www.pnas.org/cgi/content/short/0809242105 20 of 21
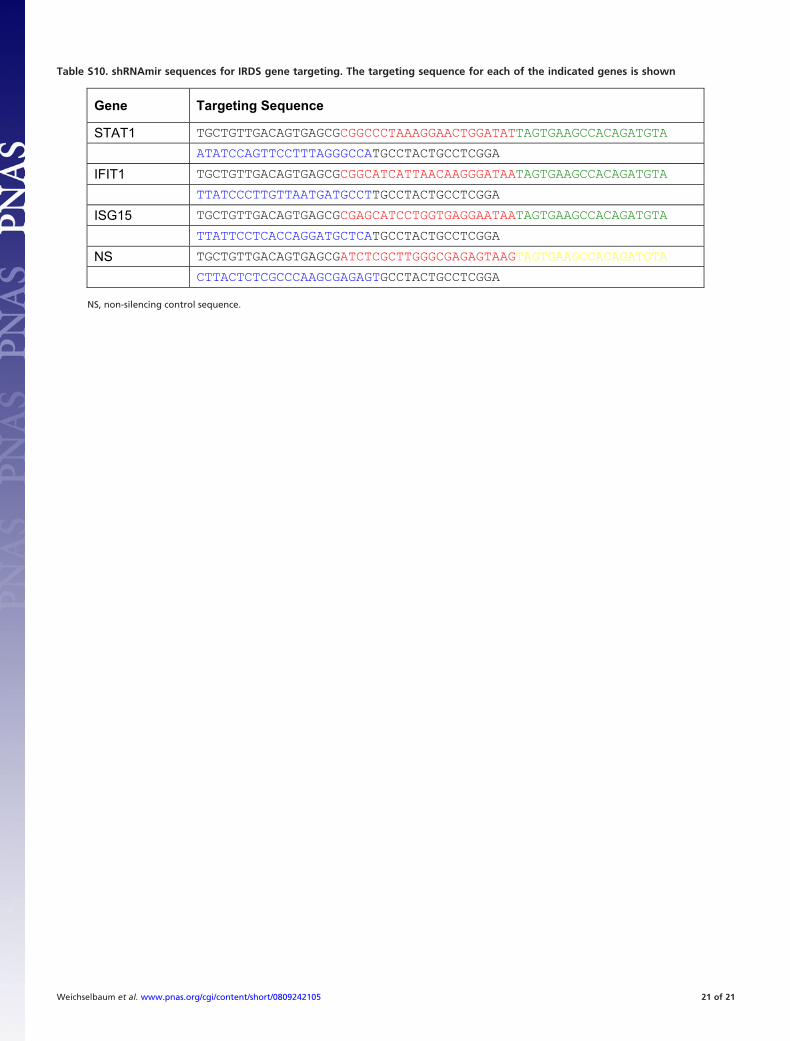
Table S10. shRNAmir sequences for IRDS gene targeting. The targeting sequence for each of the indicated genes is shown
NS, non-silencing control sequence.
Weichselbaum et al. www.pnas.org/cgi/content/short/0809242105 21 of 21
![Antiviraltherapywithnucleotide ...€¦ · for treating for CHB are interferon (IFN) and antiviral ther-apy [3, 4]. Over the past three decades, first with interferon alpha, and more](https://img.pdfslide.net/doc/110x75/5f7c3d6d1c630d000b05af1a/antiviraltherapywithnucleotide-for-treating-for-chb-are-interferon-ifn-and.jpg)


![Clinical Study Interferon Alpha Association with Neuromyelitis … · 2019. 7. 31. · such as interferon (IFN) release [ ]. However, the exact importance of IFNs in NMO disease pathogenesis](https://img.pdfslide.net/doc/110x75/60a46d497c346b1e2378fcde/clinical-study-interferon-alpha-association-with-neuromyelitis-2019-7-31-such.jpg)