Embed Size (px)
Citation preview
1
AN INTERLABORATORY COMPARISON OF NANOSILVER CHARACTERISATION
AND HAZARD IDENTIFICATION: HARMONISING TECHNIQUES FOR HIGH
QUALITY DATA
Anita Jemec1,*, Anne Kahru2, Annegret Potthoff3, Damjana Drobne1, Margit Heinlaan2, Steffi
Böhme4, Mark Geppert5, Sara Novak1, Kristin Schirmer5, Rohit R6, Shashi Singh6, Villem
Aruoja2, Mariliis Sihtmäe2, Katre Juganson2, Aleksandr Käkinen2, Dana Kühnel4
1University of Ljubljana, Biotechnical Faculty, Večna pot 111, 1000 Ljubljana, Slovenia
2National Institute of Chemical Physics and Biophysics, Laboratory of Environmental
Toxicology, Akadeemia tee 23, 12618 Tallinn, Estonia
3Fraunhofer Institute for Ceramic Technologies and Systems, Winterbergstrasse 28,
01277 Dresden, Germany
4Helmholtz-Centre for Environmental Research - UFZ, Department of Bioanalytical
Ecotoxicology, Permoserstr. 15, 04318 Leipzig, Germany
5Eawag: Swiss Federal Institute of Aquatic Science and Technology, Überlandstrasse 133
Postfach 611, 8600 Dübendorf, Switzerland
6The Centre for Cellular & Molecular Biology, Habsiguda, Hyderabad, Telangana 500007,
India
*corresponding author, [email protected]
Abstract:
Within the FP7 EU project NanoValid a consortium of six partners jointly investigated the
hazard of silver (Ag) nanoparticles (AgNPs) paying special attention to methodical aspects
that are important for providing high-quality ecotoxicity data. Laboratories were supplied
with the same original stock dispersion of AgNPs. All partners applied a harmonised
procedure for storage, and preparation of toxicity test suspensions. Altogether ten different
toxicity assays with a range of environmentally relevant test species from different trophic
levels were conducted in parallel to AgNP characterisation in the respective test media. The
paper presents a comprehensive dataset of toxicity values and AgNPs characteristics like
2
hydrodynamic sizes of AgNP agglomerates and the share (%) of Ag+-species (the
concentration of Ag+-species in relation to the total measured concentration of Ag prior to
separation). The studied AgNP preparation (20.4 ± 6.8 nm primary size, mean total Ag
concentration 41.14 mg/L, 46-68% of soluble Ag+-species in stock, 123.8 ± 12.2 nm mean z-
average value in dH2O) showed extreme toxicity to crustaceans Daphnia magna, algae
Pseudokirchneriella subcapitata and zebrafish Danio rerio embryos (EC50 <0.01 mg total
Ag/L), was very toxic in the in vitro assay with rainbow trout Oncorhynchus mykiss gut cells
(EC50: 0.01-1 mg total Ag/L); toxic to bacteria Vibrio fischeri, protozoa Tetrahymena
thermophila (EC50: 1-10 mg total Ag/L) and harmful to marine crustaceans Artemia
franciscana (EC50: 10-100 mg total Ag/L). Along with AgNPs, also the toxicity of AgNO3 was
analysed. The toxicity data revealed the same hazard ranking for AgNPs and AgNO3 (i.e. the
EC50 values were in the same order of magnitude) proving the importance of soluble Ag+-
species analysis for predicting the hazard of AgNPs. The study clearly points to the need for
harmonised procedures for the characterization of NMs. Harmonised procedures should
consider: (i) measuring the AgNP properties like hydrodynamic size and metal ions species in
each toxicity test medium at a range of concentrations, and (ii) including soluble metal salt
control both in toxicity testing as well as in Ag+-species measurements. The present study is
among the first nanomaterial interlaboratory comparison studies with the aim to improve
the hazard identification testing protocols.
Keywords: FP7 EU project NanoValid, nanomaterials’ aging, dissolution, hydrodynamic
diameter, toxicity, Ag salt
Abbreviations:
UL: University of Ljubljana, Slovenia
NICPB: National Institute of Chemical Physics and Biophysics, Estonia
CCMB: The Centre for Cellular & Molecular Biology, India
Eawag: Swiss Federal Institute of Aquatic Science and Technology, Switzerland
UFZ: The Helmholtz Centre for Environmental Research, Germany
FHG-IKTS: Fraunhofer Institute for Ceramic Technologies and Systems, Germany

3
1 INTRODUCTION
Hazard identification, i.e. the identification of the effects of concern, is an important step in
assessing nanomaterial risk and is required under multiple regulatory frameworks worldwide
(Hristozov et al., 2014). The first nanoecotoxicological studies emerged almost 10 years ago
and ever since the field has considerably proliferated (Kahru and Dubourguier, 2010; Kahru
and Ivask, 2013). For example, a search in the database Science Direct made in March 2009
yielded only 17 articles on keywords “silver nanoparticles and ecotoxicity” (Kahru and
Dubourguier, 2010) while the same search done in July 2015 already revealed 268 records.
According to Kahru and Ivask (2013), silver nanoparticles (AgNPs) are within the top five
nanomaterials studied for their (eco)toxicological properties when considering
nanomaterials listed in OECD Sponsorship Programme for the Testing of Manufactured
Nanomaterials (OECD, 2010). Moreover, given that applications utilizing antimicrobial
properties of AgNPs are likely to further increase, e.g., due to the applications related to
providing safe drinking water in large regions of the world such as India (Sharma, 2011) and
Africa (Simonis and Basson, 2011), the risk assessment of AgNPs must have a priority.
A number of comprehensive reviews have already been published with an attempt to
draw general conclusions on the environmental hazard of AgNPs (Fabrega et al., 2011;
Bondarenko et al., 2013; Chernousova and Epple, 2013; Ivask et al., 2013; 2014; Sharma et
al., 2014; Baker et al., 2014). The obtained toxicity values vary considerably. For example, a
275-fold variation in the toxicity values was observed for different mammalian cells in vitro
(25 values), 500-fold for different strains of bacteria (46 different median EC50, LC50or
Minimal inhibitory values) and 40-fold difference for Daphnia magna (13 different 48h EC50
values) (data taken from Bondarenko et al., 2013, Ribeiro et al., 2014). One reason for this
could be different types of AgNPs in terms of size, supplier and stabiliser/coating.
Furthermore, dispersion procedures and exposure conditions varied between the studies.
The current view of the risk assessors is that although the information on ecotoxicity
of various types of nanomaterials (NMs) is rapidly expanding, a limited number of high
quality data is available for univocal hazard and risk assessment of NMs (Jackson et al., 2013;
Oomen et al., 2014). There is an ongoing debate which criteria define high quality data and
unification of these criteria is still needed (Krug, 2014). Several attempts have been made to
define the criteria concerning physico-chemical characterisation (Mills et al., 2014; Kühnel et
4
al., 2014) and toxicity testing (Kühnel et al., 2014). The latter has been done by the DaNa
project (Data and knowledge on nanomaterials - processing of socially relevant scientific
facts; www.nanoobjects.info) which suggested the co-called Literature Criteria Checklist
(Kühnel et al., 2014). The term quality toxicity data in the present paper means that the
toxicity study has considered (i) the basic rules for toxicity study (relevant exposure
concentrations, reference controls, impurities…), (ii) specific NMs properties (interferences
with the assay, suitable dispersion agents,…), and (iii) sufficient and competent NM physico-
chemical characterisation data (Hristozov et al., 2014; Jackson et al., 2013; Oomen et al.,
2014; Kühnel and Nickel, 2014; Bondarenko et al., 2013; Krug, 2014).
To increase the quality of hazard identification data a number of international
initiatives has been undertaken to harmonise, and standardise the toxicity testing protocols.
Among these are: the OECD Working party on Manufactured Nanomaterials (Kühnel and
Nickel, 2014), ISO technical Committee 229, and the NanoSafety Cluster Working group 10
(Oomen et al., 2014). The EU FP7 large-scale integrated project NanoValid
(www.nanovalid.eu) aims to develop a set of reliable reference methods for hazard
identification and exposure assessment of engineered NMs. Within this scope, a consortium
of six NanoValid partners jointly investigated the hazard of AgNPs, paying special attention
to methodical aspects that are important for providing high-quality ecotoxicity data as
defined in the chapter above. To diminish the variability caused by different batches of
AgNPs and different storage and preparation of suspensions for toxicity tests, the partners
were supplied with the same original stock dispersion of AgNPs, and a harmonised
procedure for handling of AgNPs was applied. For bioassays, organisms from different
environments and trophic levels were chosen. In addition to the toxicity tests, the partners
were also responsible for in-house characterisation of the hydrodynamic size of AgNPs
agglomerates and the percentage (%) of Ag+ and Ag+-test medium ligand complexes in
comparison to total Ag prior to separation (hereafter referred to as the share of Ag+-species)
in the respective test media.
The aim of this paper is to deliver the experience and recommendations from FP7
NanoValid consortium to improve the hazard identification of nanomaterials. We focused on
the specific challenges associated with the characterisation of AgNP dispersion in toxicity
test media in parallel to the toxicity testing using a wide array of environmentally relevant
5
test species. In particular, we addressed the importance of harmonised procedures for AgNP
characterisation during the course of experiments.
2 MATERIALS AND METHODS
2.1 Case study set-up
Six NanoValid partner research institutions participated in the study: University of Ljubljana
(UL, Slovenia), National Institute of Chemical Physics and Biophysics (NICPB, Estonia), The
Centre for Cellular & Molecular Biology (CCMB, India), Swiss Federal Institute of Aquatic
Science and Technology (Eawag, Switzerland), Helmholtz Centre for Environmental Research
(UFZ, Germany), and Fraunhofer Institute for Ceramic Technologies and Systems (FHG-IKTS,
Germany). The experimental set-up is schematically presented in Fig. 1. The partners were
provided with the same stock dispersion of polyvinylpyrrolidone (PVP) stabilised AgNPs (see
chapter 3.1 for characteristics).
All partners used the same procedure for the storage and preparation of test
suspensions. First, the original stock was vortexed and then diluted to final tested
concentrations without prior sonication. Always freshly prepared dispersions were used for
the bioassays. Each partner performed the characterisation of AgNPs (hydrodynamic
diameter and the share of Ag+-species) in their respective test media as well as in dH2O using
different concentrations of AgNPs. Analyses of the share of Ag+-species and toxicity tests
were done at different time periods after the receipt of the stock dispersion. Details on the
time of analyses were carefully recorded and are presented in Fig.1.
2.2 Toxicity tests The following organisms from different taxonomic groups and a fish cell line were chosen:
the rainbow trout (Oncorhynchus mykiss) intestinal cells (RTgutGC) in vitro, the naturally
luminescent marine bacterium Vibrio fischeri, protozoa Tetrahymena thermophila,
freshwater green alga Pseudokirchneriella subcapitata, freshwater crustacean Daphnia
magna, marine crustacean Artemia franciscana, and freshwater zebrafish Danio rerio

6
(different early life stages). To investigate different toxicity of NPs for zebrafish due to
potential time changes in NPs (aging), the tests with zebrafish were done by the same
partner at two different time points: May 2013 and August 2014. All test media
compositions are described in Supplementary information (Table S1). In addition, in all
toxicity tests the AgNO3 was used as an ionic control for AgNP.
2.2.1 Rainbow trout intestinal cells in vitro The assay was performed by Eawag, Switzerland. Rainbow trout intestinal cells (RTgutGC
cells) were cultured as described previously (Kawano et al, 2001). For cytotoxicity
investigation, 150000 cells were seeded per well of a 24 well plate (polystyrene) in 1 mL
Leibovitz L-15 medium (L-15 supplemented with 5% FBS and 1% gentamycin) and grown for
48 h at 19°C. Prior to incubation with AgNPs, the cells were washed twice with 1 mL
exposure medium (L-15/ex, Schirmer et al, 1997) and then incubated with 1 mL L-15/ex
containing the indicated concentrations of AgNPs for 24 hours.
For determination of cytotoxicity, a combined assay involving three endpoints (metabolic
activity, lysosomal and membrane integrity) was used (Schirmer et al. 1998). After
incubation with AgNPs, the medium was removed and the cells washed twice with 1 mL
phosphate buffered saline (PBS). The cells were then incubated with 400 µL PBS containing
5% (v/v) Alamar Blue and 4 µM 5-Carboxyfluorescein Diacetate, Acetoxymethyl Ester (CFDA-
AM). After 30 min incubation, fluorescence (λex=530 nm λem=595 nm for Alamar Blue,
λex=493 nm λem=541 nm for CFDA-AM) was quantified using a multiwell plate reader (Infinite
M200, Tecan, Maennedorf, Switzerland). Cells were subsequently washed once with 1 mL
PBS and then incubated in 400 µL PBS containing 1% (v/v) Neutral Red solution (final
concentration of Neutral Red was 50 µg/mL). After 1 h incubation, cells were washed once
with 1 mL PBS and then incubated for 10 min with the Neutral Red extraction solution (50%
Ethanol absolute, 49% dH2O, 1% acetic acid) on a shaker. Fluorescence of the Neutral Red
was measured on a multiwell plate reader (λex=530 nm λem=645 nm).
2.2.2 Naturally luminescent marine bacteria Vibrio fischeri

7
The kinetic Vibrio fischeri bioluminescence inhibition assay was performed in NICPB, Estonia,
according to ISO 21338:2010 as described in Heinlaan et al. 2008. Briefly, the lyophilized
Vibrio fischeri NRRL-B 11177 Reagent (Aboatox, Turku, Finland) was rehydrated by adding 13
mL of cold (4°C) Reagent Diluent (NaCl 20 g/L; MgCl2*6H2O 2.035 g/L; KCl 0.3 g/L). Upon
rehydration, bacteria were stabilized (i.e. bacterial luminescence value is stable) first at 4°C
for 30 min and then at 20oC for another 30 minutes. Since V. fischeri is a marine organism,
the test medium is 2% NaCl (Supplementary information Table S1). Sample pH was not
adjusted since it did not fall beyond the range of 6.0 - 8.5 (i.e. not affecting the luminescence
of bacteria). The testing was performed in polypropylene cuvettes at 20°C on automatic
BioOrbit 1251 luminometer (ThermoLabsystems, Finland), connected to computer operated
by Multiuse software (BioOrbit, Finland). The test bacterium was automatically dispensed on
the sample using dispenser controller unit. Bacterial luminescence was measured every 0.6
seconds during 30 sec under continuous mixing. After 30 min of incubation, luminescence
was measured again for 30 sec. Due to continuous mixing and simultaneous kinetic
measuring of luminescence, every sample acts as its own reference and no color/turbidity
correction is needed. Controls, both negative (2% NaCl) and positive (3,5-dichlorophenol),
were always included in the runs. The inhibitory effects of chemicals on bacterial
luminescence were calculated according to the following equations:
30-min 100**
100%0
30
ITKF
ITINH ; ;
0
30
IC
ICKF
KF (correction factor) is characterising the natural loss of luminescence of the control (i.e.
bacterial suspension in 2% NaCl). IC0 and IT0 are the maximum values of luminescence during
first 5 seconds after dispensing of 100 µL of test bacteria to 100 µL of control or test sample,
respectively. IC30 and IT30 are respective values after 30 minutes. 30-min EC50 is the
concentration of a compound reducing the bioluminescence by 50% after 30 minute
incubation with the compound.
2.2.3 Freshwater protozoa Tetrahymena thermophila
The Tetrahymena thermophila viability assay was performed in NICPB, Estonia, by measuring
the ATP content in protozoa using the luciferin–luciferase method as described earlier
8
(Mortimer et al., 2010). Briefly, protozoan culture (T. thermophila strain BIII) was grown
axenically in SSP medium supplemented with 250 µg/mL each of streptomycin sulphate and
penicillin G. The cells were harvested during the exponential growth phase by centrifugation
at 300 g for 5 min at 4 °C and washed twice with deionized water. For toxicity testing, the
cell density was adjusted to 106 cells/mL (or OD600nm=2) by adding appropriate amount of
deionised water to the cells.
For toxicity analysis, 100 μL of harvested and washed T. thermophila cells suspension
(final density in the test 5×10⁵ cells/mL) in deionised water was added to 100 μL of Ag-
formulations (AgNP or AgNO3) in deionised water in 96-well polystyrene plates. Each
concentration was tested in at least triplicate. The test plates were incubated at 30 °C in the
dark. For ATP extraction, upon 2 and 24 h of exposure, 50 μL of 1% TCA, 4 mM EDTA solution
was added to 50 μL of cell suspension. The extracts were placed on ice for 5 minutes and
then stored at -18 °C until further analysis. Prior to analysis the samples were thawed and 20
μL of each sample was transferred onto white 96 well polypropylene microplate. 80 μL of
Tris-EDTA buffer (0.1 M Tris, 2 mM EDTA, adjusted to pH 7.75 with acetic acid) was added
into each well to reduce TCA concentration to 0.1%. After measuring the background
luminescence (RLUbackground), 100 μL of 500-fold diluted ATP assay mix (FLAAM, Sigma-
Aldrich) was added to each sample well, the plate was shaken and luminescence was
measured (RLUsample). Finally, 10 μL of thawed 10-5 M ATP standard (estimation of potential
quenching of luminescence by NPs) was added to each sample well, the plate was shaken
and luminescence was measured (RLUstd). Luminescence measurements were done by Orion
II plate luminometer (Berthold Detection Systems, Germany). The amount of the ATP in each
well was calculated according to the following equation:
* C µmol ATP,
std
backgroundsample
RLU
RLURLU RLU standard in test, µmol
The ATP concentrations in the samples were expressed as percentages of the non-treated controls.
9
2.2.4 Freshwater alga Pseudokirchneriella subcapitata
The algal growth inhibition assay was performed in NICPB, Estonia, according to OECD201
guidelines (OECD 2011) as initially described in Aruoja et al., 2009. The P. subcapitata stock
culture originated from the commercial test system Algal Toxkit F (MicroBioTests Inc.,
Nazareth, Belgium). Briefly, exponentially growing algae were exposed to Ag NNV-003 and
AgNO3 and incubated at 24 ± 1°C for up to 72 h in 20-mL glass scintillation vials containing 5
mL of algal growth medium (OECD, 2011, Supplementary information Table S1). All samples
were run in duplicate with four controls distributed evenly on the transparent table that was
constantly shaken and constantly illuminated from below with Philips TL-D 38W aquarelle
fluorescent tubes. Algal biomass was measured at least every 24 hours using fluorescence of
the algal pigment extract. For that, 50 μL of algal culture was transferred to 96-well black
polypropylene plate (Greiner Bio-One), 200 μL of ethanol was added into each sample well
and the plate was shaken for 3 h in the dark. Fluorescence was measured using microplate
fluorometer (excitation 440 nm, emission 670 nm; Fluoroscan Ascent, Thermo Labsystems,
Finland). The cell concentration of the control culture increased at least 16 times during 3
days. The variability between replicates was kept low by using the vials only once. The
coefficient of variation of biomass density in replicate control cultures throughout the
experiments did not exceed 5%. EC50 values (effective concentration leading to 50%
reduction of biomass) were calculated from dose-response data as described below.
2.2.5 Freshwater crustacean Daphnia magna Daphnia magna acute immobilisation assays were performed by two laboratories (UFZ and
NICPB) according to the OECD202 (2004) standard. In UFZ, the crustaceans were cultivated
under controlled conditions of 20 °C at a 16:8 h light:dark cycle. Daphnids were fed three
times a week with algae and yeast flakes. Daphnia aged less than 24 h (neonates) were
exposed to Ag and AgNO3 in ADaM (Aachener Daphnien medium) for 48 h (Supplementary
information Table S1). Dose-response relationships and EC50-values were determined by the
application of the log-normal model.
In NICPB, differently from the OECD 202 test procedure, neonates used for the
toxicity tests did not originate from a laboratory culture but were hatched from ephippia
(the product of MicroBio Tests, Inc., Mariakerke-Gent, Belgium). To obtain D. magna
10
neonates, D. magna ephippia were incubated in Petri dishes for 3-4 days at 20°C under
continuous illumination of 6000 lux. Hatched neonates were collected for further testing.
Prior to the initiation of exposure, the hatched neonates were “pre-fed” with living
microalgae Pseudokirchneriella subcapitata during two hours. Then, daphnids were
transferred into the samples via clean OECD202 test medium (Supplementary information
Table S1) to reduce the carry-over of alga and potential modification of the nanomaterial
toxicity to D. magna. Testing was conducted on 30-well polycarbonate test plate (MicroBio
Tests, Inc., Mariakerke-Gent, Belgium) with 4 technical parallels of 5 daphnids per 10 mL
sample. At least 3 independent assays were conducted. Upon 48 h of incubation at 21°C in
the dark, the immobilisation (mortality) of daphnids was recorded by visual observation.
The daphnid was considered immobilized if it did not resume swimming within 15 sec of
gentle agitation. Immobilisation (mortality) percentage for each concentration was
calculated as follows:
% dead/immobilized= dead/immobilized animals*100/total number of animals in the test
MS Excel macro Regtox was used for calculating the toxicity values.
2.2.6 Marine crustacean Artemia franciscana The Artemia sp. assay was performed by CCMB, India. For every 1 liter culture, 1.0 gram of
Artemia cysts were used (San Francisco Bay strain). These cysts are hydrated in distilled
water under aeration for 45 minutes and then ‘bleached’ to remove the cysts wall using 20%
sodium hypochlorite solution for 15 minutes. The ‘bleached’ Artemia eggs were then washed
and allowed to hatch in 2.5% salt water (pH 8.0, NaCl, with continuous light and aeration for
24 hours (Sorgeloos, 1973) in the presence and absence of Ag NPs. The temperature was
maintained at 28°C which is the optimum temperature for hatching of Artemia eggs.
The Artemia eggs were exposed to two different concentrations of nanomaterial
prepared in 2.5 % NaCl (Supplementary information Table S1) (100 mg/L and 10 mg/L). The
hatching rate and immobility (inability to swim after gentle agitation) were checked after 24
hours for each Artemia cultures exposed to nanoparticles. Three aliquots of 100 µL were
taken from each flask after thorough mixing and counted under the stereo-microscope.
Number of hatched Artemia (immotile vs. motile), umbrella stage and unhatched cyst were

11
counted. Hatching rate was expressed as percent of total number of fully hatched Artemia in
comparison to total Artemia in the aliquot. Criteria for validity was no mortality in control.
2.2.7 Zebrafish Danio rerio embryos Zebrafish (Danio rerio) embryos were cultivated and exposed to the respective nanoparticles
according to the OECD 236 (2013) guideline. To obtain the embryos, the fish were cultured
at 26 ± 1 °C at a 14:10 h light:dark cycle. Fish were fed daily with flake food and Artemia
spec. ad libitum. For the egg collection, spawn traps covered with a wire mesh were placed
into the fish tanks on the day prior to spawning. After selection of fertilised eggs, eggs were
transferred to ISO-water (294.0 mg/L CaCl2*2H2O, 123.3 mg/L MgSO4*7H2O, 63.0 mg/L
NaHCO3, and 5.5 mg/L KCl dissolved in deionised water) and exposure experiments were
started at a time point of 2, 28 and 72 hours post fertilisation (hpf) in ISO-water
(Supplementary information Table S1) up to 48 h. The 28 hpf embryos were mechanically
dechorionated with forceps prior to testing to estimate whether toxicity effects occur due to
an enrichment of NPs at the chorion. The following parameters were used as lethal
endpoints: coagulation, missing formation of somites, no detachment of tail and no
heartbeat. In total 10 individuals per concentration were investigated and a minimum of 3
replicates were performed.
2.2.8 Data analysis EC50 values for daphnids, algae, V. fischeri, T. thermophila and Artemia franciscana were
calculated from the concentration-effect curves by the application of the log-normal model
using REGTOX software for Microtox ExcelTM (MSExcel macro REGTOX EV7.0.5.xls) unless
stated otherwise. The REGTOX software is available online at:
http://eric.vindimian.9online.fr/ (Vindimian, E., 2005). For calculation of EC50 values the Hill-
model (non-linear fit) was used. The toxicity data obtained for the zebrafish embryos and
Artemia franciscana were evaluated using GraphPad Prism software. The toxicity of AgNPs
and Ag salt to test organisms was classified according to the EC50 values (based on
compound concentration in case of AgNPs and Ag+ concentration in case of AgNO3) as: <0.1
12
mg/L=extremely toxic; 0.1–1 mg/L = very toxic; 1–10 mg/L = toxic; 10–100 mg/L = harmful;
<100 mg/L = non-toxic to the aquatic organisms (CEC 1996; Sanderson, 2003).
2.3 Characterisation of the stock of AgNPs
The AgNPs (designated as NNV-003; batch number Parnasos_IG010305_Ag
NAMA39_1202_Ag) were supplied by Colorobbia Italia Spa (http://www.colorobbiaitalia.it/).
The NPs were supplied as aqueous suspension with a nominal particle concentration of 40 g
Ag/L stabilised with the surfactant polyvinylpyrrolidone (PVP).
The total amount of Ag in supplied stock was measured with inductively-coupled
plasma mass spectrometry (ICP-MS), and atomic absorption spectroscopy. Measurements
were done in at least 3 replicates.
The share of Ag+-species. Dissolution of NPs in general is assessed by separation of
the particles from the suspension. The latter contains what is most commonly referred to as
dissolved ionic Ag (Ag+) (Ivask et al., 2014) or dissolved Ag (Odzak et al., 2014). However, this
terminology is not entirely accurate, therefore we propose the term “the share of Ag+/Ag+-
ligand complexes (Ag+-species)” in comparison to the total Ag. This is because, not all
measured Ag+ dissolve from AgNPs, but some of it may remain from the synthesis via
controlled reduction of Ag salts (Behra et al., 2013). Secondly, in the test medium dissolved
Ag+ become complexed with various ligands (Herrin et al., 2001, Behra et al. 2013, Levard et
al., 2012) and the analytical instrumentation used in the current work does not differentiate
between Ag+ and Ag+-ligand complexes.
Two different approaches were used to separate Ag+ species from AgNPs in the stock
dispersion: (i) filtration through Amicon Millipore filter units with molecular weight cut off 3
kDa by centrifugation at 4000 g for 20 min, or (ii) ultra-centrifugation for 30-60 min in a spin-
out ultracentrifuge (Beckman L8-M) at 362 769 g. Ag+-species in the supernatant after
separation were measured using ICP-MS (after pore separation), and AAS after
ultracentrifugation (accredited laboratory using the method EVS-EN ISO/IEC 17025:2005).
Both approaches have previously been shown to be efficient in separation of NPs from ion
species (Ivask et al., 2014; Navarro et al. 2008, Odzak et al. 2014, Yue et al., 2015).
13
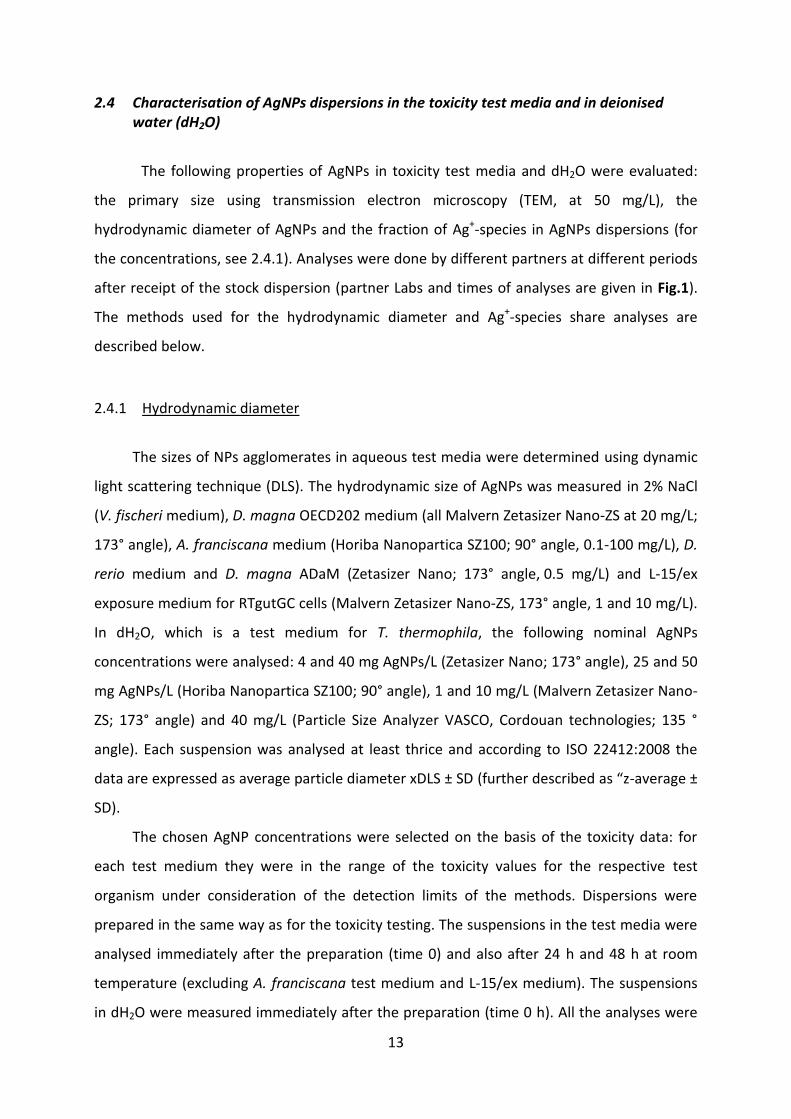
2.4 Characterisation of AgNPs dispersions in the toxicity test media and in deionised water (dH2O)
The following properties of AgNPs in toxicity test media and dH2O were evaluated:
the primary size using transmission electron microscopy (TEM, at 50 mg/L), the
hydrodynamic diameter of AgNPs and the fraction of Ag+-species in AgNPs dispersions (for
the concentrations, see 2.4.1). Analyses were done by different partners at different periods
after receipt of the stock dispersion (partner Labs and times of analyses are given in Fig.1).
The methods used for the hydrodynamic diameter and Ag+-species share analyses are
described below.
2.4.1 Hydrodynamic diameter
The sizes of NPs agglomerates in aqueous test media were determined using dynamic
light scattering technique (DLS). The hydrodynamic size of AgNPs was measured in 2% NaCl
(V. fischeri medium), D. magna OECD202 medium (all Malvern Zetasizer Nano-ZS at 20 mg/L;
173° angle), A. franciscana medium (Horiba Nanopartica SZ100; 90° angle, 0.1-100 mg/L), D.
rerio medium and D. magna ADaM (Zetasizer Nano; 173° angle, 0.5 mg/L) and L-15/ex
exposure medium for RTgutGC cells (Malvern Zetasizer Nano-ZS, 173° angle, 1 and 10 mg/L).
In dH2O, which is a test medium for T. thermophila, the following nominal AgNPs
concentrations were analysed: 4 and 40 mg AgNPs/L (Zetasizer Nano; 173° angle), 25 and 50
mg AgNPs/L (Horiba Nanopartica SZ100; 90° angle), 1 and 10 mg/L (Malvern Zetasizer Nano-
ZS; 173° angle) and 40 mg/L (Particle Size Analyzer VASCO, Cordouan technologies; 135 °
angle). Each suspension was analysed at least thrice and according to ISO 22412:2008 the
data are expressed as average particle diameter xDLS ± SD (further described as “z-average ±
SD).
The chosen AgNP concentrations were selected on the basis of the toxicity data: for
each test medium they were in the range of the toxicity values for the respective test
organism under consideration of the detection limits of the methods. Dispersions were
prepared in the same way as for the toxicity testing. The suspensions in the test media were
analysed immediately after the preparation (time 0) and also after 24 h and 48 h at room
temperature (excluding A. franciscana test medium and L-15/ex medium). The suspensions
in dH2O were measured immediately after the preparation (time 0 h). All the analyses were
14
done at laboratory ambient light conditions. The composition of test media is described in
Supplementary information (Table S1).
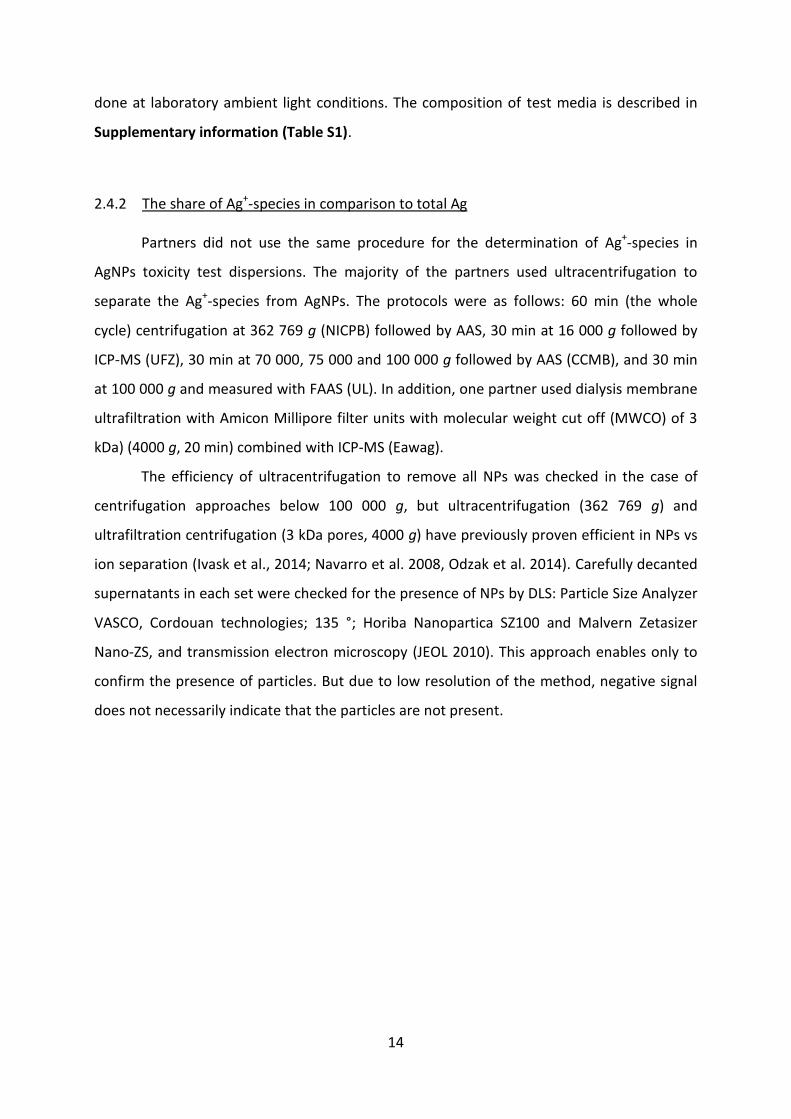
2.4.2 The share of Ag+-species in comparison to total Ag
Partners did not use the same procedure for the determination of Ag+-species in
AgNPs toxicity test dispersions. The majority of the partners used ultracentrifugation to
separate the Ag+-species from AgNPs. The protocols were as follows: 60 min (the whole
cycle) centrifugation at 362 769 g (NICPB) followed by AAS, 30 min at 16 000 g followed by
ICP-MS (UFZ), 30 min at 70 000, 75 000 and 100 000 g followed by AAS (CCMB), and 30 min
at 100 000 g and measured with FAAS (UL). In addition, one partner used dialysis membrane
ultrafiltration with Amicon Millipore filter units with molecular weight cut off (MWCO) of 3
kDa) (4000 g, 20 min) combined with ICP-MS (Eawag).
The efficiency of ultracentrifugation to remove all NPs was checked in the case of
centrifugation approaches below 100 000 g, but ultracentrifugation (362 769 g) and
ultrafiltration centrifugation (3 kDa pores, 4000 g) have previously proven efficient in NPs vs
ion separation (Ivask et al., 2014; Navarro et al. 2008, Odzak et al. 2014). Carefully decanted
supernatants in each set were checked for the presence of NPs by DLS: Particle Size Analyzer
VASCO, Cordouan technologies; 135 °; Horiba Nanopartica SZ100 and Malvern Zetasizer
Nano-ZS, and transmission electron microscopy (JEOL 2010). This approach enables only to
confirm the presence of particles. But due to low resolution of the method, negative signal
does not necessarily indicate that the particles are not present.

15
Fig.1. Experimental set-up of the NanoValid case study of AgNPs hazard identification. The yellow boxes present the institutions involved: 1 National Institute of Chemical Physics and Biophysics (NICPB, Estonia), Eawag; Swiss Federal Institute of Aquatic Science and Technology 2 (Switzerland), University of Ljubljana (UL, Slovenia); Helmholtz Centre for Environmental Research (UFZ, Germany); Fraunhofer Institute for 3 Ceramic Technologies and Systems (FHG-IKTS, Germany) and Centre for Cellular & Molecular Biology (CCMB, India). The toxicity and 4 characterisation studies performed by each partner are listed below (green boxes). Please note, that also the dates of performance are given in 5 pink boxes (corresponding month and year are given as numbers, for example 1-2014 indicates January 2014). Photos on test species are 6 illustrative (V. fischeri and P. subcapitata are from www.wikipedia.com). 7
The same stock of PVP- stabilised AgNPs supplied to partners
(batch number Parnasos_IG010305_Ag
NAMA39_1202_Ag from February 2012)
NICPB
TOXICITY:
V. fischeri T.thermophila D. magna P. subcapitata
9-, 10-2012
CHARACT.
DLS; NPs dissolution
7-2012; 9-2014
EAWAG
TOXICITY:
RTgutGC cells
5-2013
CHARACT.
DLS; NPs dissolution
4-2013; 11-2014
UL
CHARACT.
NPs dissolution
3-, 7-2014
UFZ
TOXICITY:
D. rerio D. magna
zebrafish: 5- 2013; 8-2014 daphnids: 1-2014
CHARACT. NPs
dissolution
1-, 10-2013, 7-2014
FHG-IKTS
CHARACT.
- DLS in dH2O; AdaM and zebrafish medium, conductivity in dH2O
6-2012; 5-2014
CCMB
TOXICITY
A. franciscana
3-2013
CHARACT.
DLS; NPs dissolution
dissolution: 5-2014, 9-2014 DLS: 2- and 10-2013; 3-2014;
characterisation of stock: total Ag and the share of Ag+
species

16
3 RESULT 8
9
3.1 Characteristics of AgNPs in supplied stock 10 11
The stock suspension of nanosilver that was distributed to the NanoValid consortium 12
contained PVP stabilised AgNPs dispersed in deionised water (dH2O) (nominal concentration 13
40 g/L) (designated as NNV-003; batch number Parnasos_IG010305_Ag NAMA39_1202_Ag, 14
February 2012; Colorobbia Italia Spa (Firenze, Italy). The concentration of PVP is considered 15
confidential and could not be disclosed by the producer. These AgNPs have been previously 16
characterised and the properties are described in Zou et al. (2015). In short, the X-ray 17
diffraction pattern for AgNPs confirmed the presence of metallic silver and the XPS analysis 18
on AgNPs without any sputtering indicated the presence of high amount of organic 19
molecules on the surface, which could be attributed to PVP. The actual measured total Ag in 20
AgNPs stock suspension (mean ± SD) obtained by three partners were: 38.3 ± 0.8 g/L 21
(EAWAG, ICP-MS), 42.7 ± 5.12 g/L (NICPB, AAS) and 42.44 ± 1.52 g/L (UL, FAAS). All values 22
are close to the nominal value provided by the supplier (40 g Ag/L). Two different 23
approaches (ultrafiltration and 362 769 g ultracentrifugation) were used to analyse the share 24
of Ag+-species in the provided stock: 46% of was measured by ultracentrifugation and 68% 25
by ultrafiltration approach (Fig.3). 26
27
3.2 Characteristics of different concentrations of AgNPs in dH2O 28 29
3.2.1 The size of AgNPs 30 31
According to TEM the AgNPs were highly faceted and polydisperse in shape. Mean 32
primary particle size (50 mg/L) was: 20.4 ± 6.8 nm determined by transmission electron 33
microscopy (Supplementary information Fig.S1). This is coherent with the data for the same 34
batch of AgNPs: mean TEM size 21 ± 8 nm reported by Zou et al. (2015). 35
The mean hydrodynamic diameters of AgNPs in dH2O are presented in Fig. 2. The 36
data were generally comparable between the laboratories with very low polydispersity 37
indexes (Supplementary information Table S2). However, one partner obtained values, 38
which were slightly higher and more variable than the others (CCMB). This partner used a 39
17
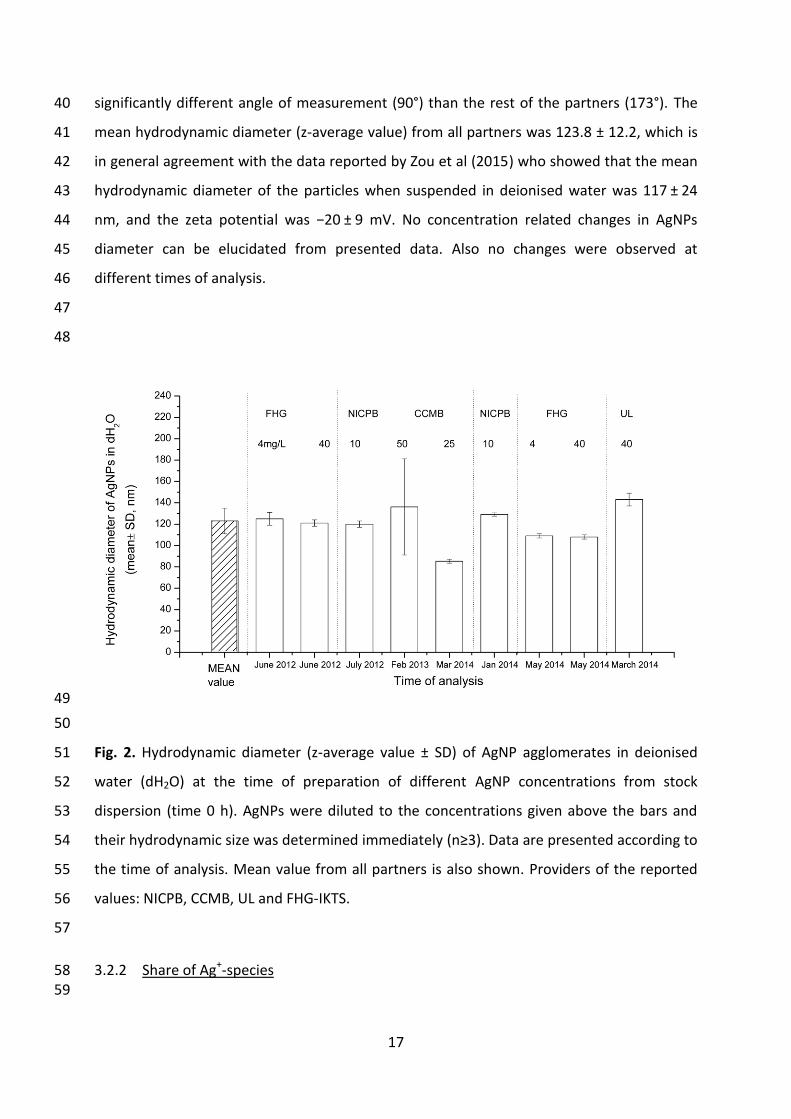
significantly different angle of measurement (90°) than the rest of the partners (173°). The 40
mean hydrodynamic diameter (z-average value) from all partners was 123.8 ± 12.2, which is 41
in general agreement with the data reported by Zou et al (2015) who showed that the mean 42
hydrodynamic diameter of the particles when suspended in deionised water was 117 ± 24 43
nm, and the zeta potential was −20 ± 9 mV. No concentration related changes in AgNPs 44
diameter can be elucidated from presented data. Also no changes were observed at 45
different times of analysis. 46
47
48
49
50
Fig. 2. Hydrodynamic diameter (z-average value ± SD) of AgNP agglomerates in deionised 51
water (dH2O) at the time of preparation of different AgNP concentrations from stock 52
dispersion (time 0 h). AgNPs were diluted to the concentrations given above the bars and 53
their hydrodynamic size was determined immediately (n≥3). Data are presented according to 54
the time of analysis. Mean value from all partners is also shown. Providers of the reported 55
values: NICPB, CCMB, UL and FHG-IKTS. 56
57
3.2.2 Share of Ag+-species 58 59
18
All the results on the share of Ag+-species are presented in Figure 3: they are ranged 60
according to the (a) concentration of total Ag, and b) to the time of analysis and by partner 61
labs to evaluate the influence of AgNPs aging on the Ag+-species. In Figure 3 all results on the 62
quantification of Ag+-species in AgNP suspensions in dH2O are grouped according to the 63
techniques used in different laboratories (four of them used centrifugation up to 100 000 g, 64
one partner applied ultracentrifugation above 300 000 g and one ultrafiltration for the 65
separation of the particulate silver from the Ag+-species). Each laboratory used several 66
dilutions of AgNPs as well as the assays were done at different time points during 1.5 years 67
using the same stock of AgNPs. Throughout the data are presented as the share of Ag+-68
species (%) in the AgNPs suspensions prepared in dH2O in relation to the total measured 69
concentration of Ag prior to separation (Fig. 3a and b). In the upper panel of Fig. 3 (a) the 70
data are arranged by increasing concentration of total Ag in the analysed suspension, i.e. 71
from 0.025 mg Ag/L to 115 mg/L. Also, the data for the stock suspension of the AgNPs (40 72
mg Ag/L) are added (Fig 3a). The same data are presented in the lower panel according to 73
the analysis time, from July 2012 till December 2014, i.e. the time-span of ‘aging’ of the 74
stock suspension was about 1.5 years (Fig.3b). It is known that the solubilisation rate of 75
metallic particles depends on the ratio of the particles and solvent (in our case dH2O) 76
(Kasemets et al., 2009). Indeed, there was a general tendency for increase of the share of 77
Ag+ species with lower particle: dH2O ratio, i.e. the share was decreasing with the increase of 78
the nominal concentration of the suspension of AgNPs, however the correlation was not 79
highly significant (R2=0.24) (Fig.4). 80
However, we observed that the same method used for particle separation usually 81
yielded the same share of Ag+-species even when the concentration of total silver in initial 82
suspensions largely varied. For example, when the data of different partners were analysed 83
separately (Supplementary information Fig. S2) we observed that UL (used 100 000 g 84
centrifugation as a separation step) obtained share of Ag+-species from 39-53 % (average 48 85
%) while the nominal total concentration of Ag in suspensions varied from 2.7 to 115 mg/L. 86
UFZ (16 000 g centrifugation) obtained almost the same share of Ag+ for 0.025 mg Ag/L, 2.7 87
mg/L as well as for 43 mg Ag/L (60-64%). NICPB obtained 46-49% share of Ag+-species for 9.8 88
mg Ag/L and 40 000 mg Ag/L suspensions when using the highest centrifugation force (362 89
769 g). Analogously, EAWAG team who used ultrafiltration and centrifugation as separation 90
techniques, obtained 52-68% share of Ag+-species for concentrations spanning from 1 to 91
19
40 000 mg Ag/L. This initiated further studies to find the source of variability. We found out, 92
that centrifugation up to 100 000 g (30 min) was insufficient to separate AgNPs from Ag+-93
species, because NPs were found in the supernatant. In this case the use of DLS to check the 94
efficiency of separation was appropriate, since we have detected NPs in the supernatant. In 95
the case of ultracentrifugation at 362 769 g (30-60 min) and 3 kDa pores a SP-ICP-MS 96
approach was used and no NPs were found after separation (Ivask et al., 2014, Navarro et 97
al. 2008, Odzak et al. 2014). However, the efficiency of NPs separation could not entirely 98
explain the variability of data obtained by different partners. For example, comparing the 99
data for 10 mg AgNPs/L the values obtained with the insufficient separation method (100 100
000 g) were lower (39 %) than those of ultracentrifugation (52 %), even though particles 101
remaining in the supernatant should lead to a higher silver share. Due to the reasons 102
described above, we conclude that the absolute values in Fig. 3 may be overestimated and 103
therefore a conclusions on the time- related modification of AgNPs in stock dispersion 104
(“aging”) cannot be deduced based on these data. 105

20
106
107
108
109
110

21
111
Fig 3. The share of Ag+-species in comparison to measured total Ag in dH2O performed by different partners: a) ranged according to the 112
concentration of total Ag, and b) ranged according to the time of analysis and by partner labs. Stock AgNPs suspension is also shown (Fig.3a). 113
The measured concentrations of total Ag (mg/L) are shown on x-axis. Mean values are shown on the top of the column. 114

22
115
116
Fig. 4. Share of Ag+-species versus total concentration of Ag in the suspension (log values). 117
Data are plotted from Fig. 3a whereas the data for stock suspensions (40 000 mg Ag/L) are 118
excluded. 119
120
3.3 Characteristics of different AgNPs concentrations in toxicity test media 121 122
3.3.1 The hydrodynamic size of AgNP agglomerates 123 124
The hydrodynamic diameters of the AgNPs agglomerates in different toxicity test media 125
were quite comparable, ranging from 103 nm to 136 nm (Fig.5). Similarly as in the case of 126
dH2O, the value provided by a partner using a significantly different angle of measurement 127
(90°) than the rest of the partners (173°) yields the data with higher SD. The sizes of AgNP 128
agglomerates in the toxicity test media were similar to those in dH2O (123.8 ± 12.2 nm). 129
-2 -1 0 1 2 3
0
10
20
30
40
50
60
70
80
Th
e s
ha
re o
f A
g+-s
pe
cie
s (
%)
Log (mg Ag/L)
-- --
-- --
-- --
-- -- -- --
-- -- -- --
23
130
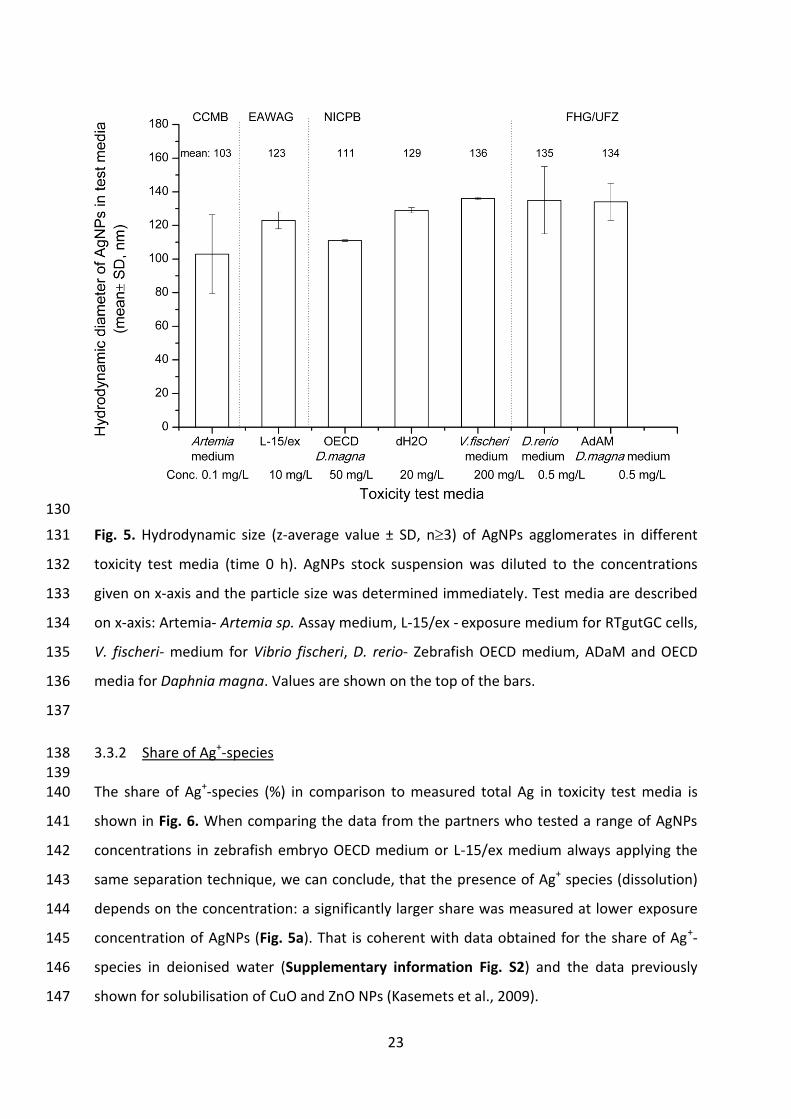
Fig. 5. Hydrodynamic size (z-average value ± SD, n3) of AgNPs agglomerates in different 131
toxicity test media (time 0 h). AgNPs stock suspension was diluted to the concentrations 132
given on x-axis and the particle size was determined immediately. Test media are described 133
on x-axis: Artemia- Artemia sp. Assay medium, L-15/ex - exposure medium for RTgutGC cells, 134
V. fischeri- medium for Vibrio fischeri, D. rerio- Zebrafish OECD medium, ADaM and OECD 135
media for Daphnia magna. Values are shown on the top of the bars. 136
137
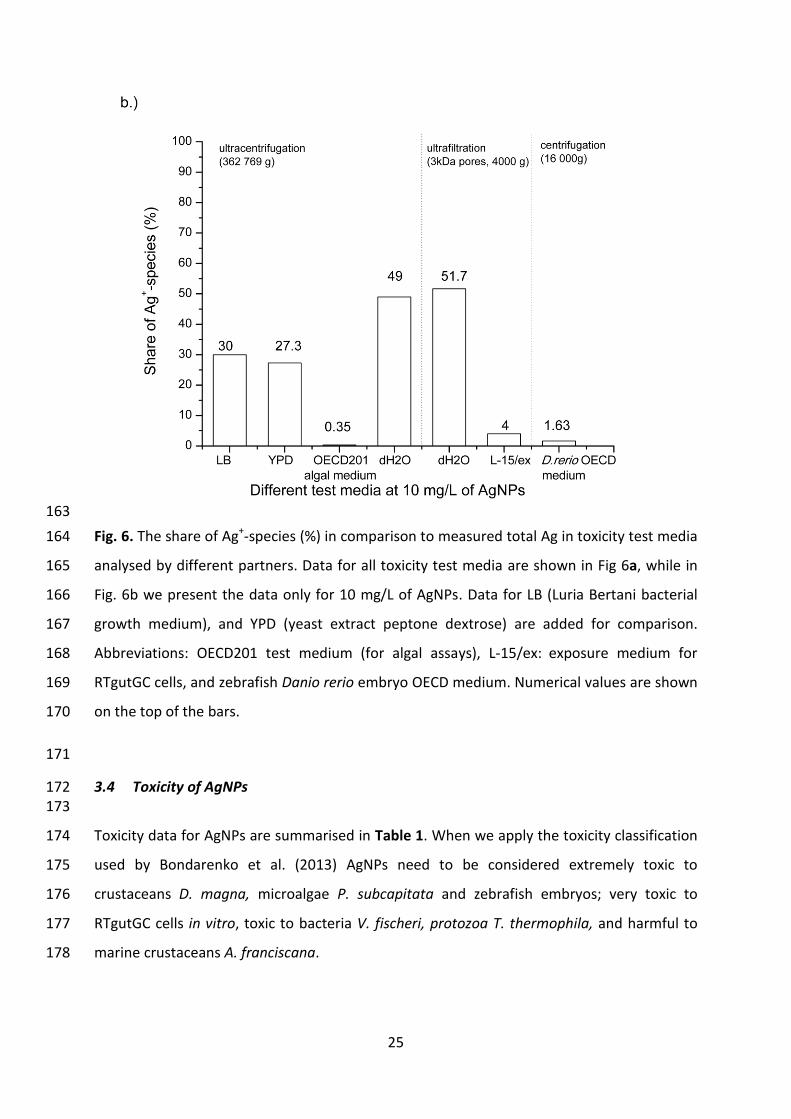
3.3.2 Share of Ag+-species 138 139 The share of Ag+-species (%) in comparison to measured total Ag in toxicity test media is 140
shown in Fig. 6. When comparing the data from the partners who tested a range of AgNPs 141
concentrations in zebrafish embryo OECD medium or L-15/ex medium always applying the 142
same separation technique, we can conclude, that the presence of Ag+ species (dissolution) 143
depends on the concentration: a significantly larger share was measured at lower exposure 144
concentration of AgNPs (Fig. 5a). That is coherent with data obtained for the share of Ag+-145
species in deionised water (Supplementary information Fig. S2) and the data previously 146
shown for solubilisation of CuO and ZnO NPs (Kasemets et al., 2009). 147

24
The effect of test medium composition on the amount of Ag+-species (%) can be 148
evaluated from Fig 5b, which shows the data obtained at approximately the same total Ag 149
concentration (10 mg/L of algal media, 14 mg/L for L-15/ex, 9.7 mg/L in zebrafish medium, 150
10 mg/L in dH2O). For discussion purposes, we also added the values for Luria Bertani 151
bacterial growth medium (LB medium: tryptone and yeast extract), and yeast peptone 152
dextrose (YPD medium: yeast extract, bactopeptone and glycose). The data show that 153
significantly less Ag+-species (%) were measured in complex algal, L-15/ex and zebrafish 154
embryo OECD medium in comparison to LB, YPD and dH2O. 155
The amount of Ag+-species in toxicity test media was analysed immediately after the 156
preparation (time 0 h), and also after 24 h and 48 h at room temperature. In none of the 157
cases (daphnia, algae and zebrafish media) the share of Ag+-species was different from those 158
at the beginning of the test (data not shown). This indicates that the total amount of Ag+-159
species does not change during the experimental exposure period used. 160
161
162
25
163
Fig. 6. The share of Ag+-species (%) in comparison to measured total Ag in toxicity test media 164
analysed by different partners. Data for all toxicity test media are shown in Fig 6a, while in 165
Fig. 6b we present the data only for 10 mg/L of AgNPs. Data for LB (Luria Bertani bacterial 166
growth medium), and YPD (yeast extract peptone dextrose) are added for comparison. 167
Abbreviations: OECD201 test medium (for algal assays), L-15/ex: exposure medium for 168
RTgutGC cells, and zebrafish Danio rerio embryo OECD medium. Numerical values are shown 169
on the top of the bars. 170
171
3.4 Toxicity of AgNPs 172 173
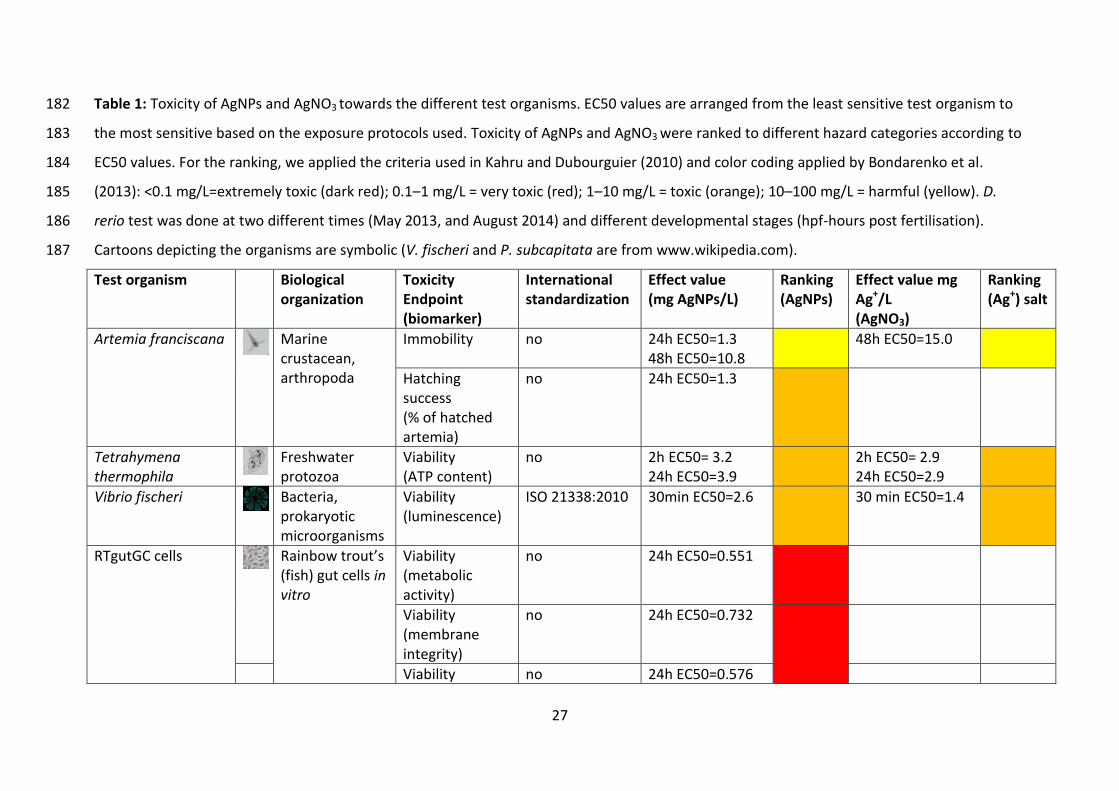
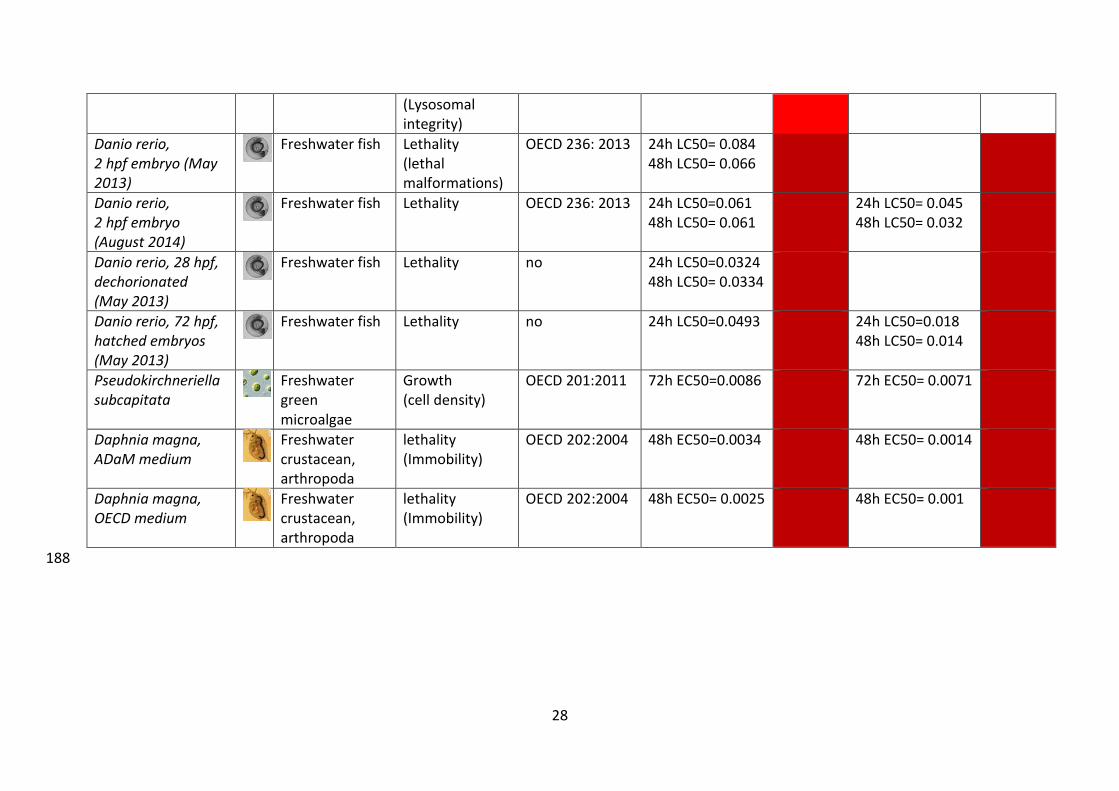
Toxicity data for AgNPs are summarised in Table 1. When we apply the toxicity classification 174
used by Bondarenko et al. (2013) AgNPs need to be considered extremely toxic to 175
crustaceans D. magna, microalgae P. subcapitata and zebrafish embryos; very toxic to 176
RTgutGC cells in vitro, toxic to bacteria V. fischeri, protozoa T. thermophila, and harmful to 177
marine crustaceans A. franciscana. 178

26
The toxicity to D. rerio embryo (age at exposure 2hpf) was tested at two different 179
times over the course of 15 months. The toxicity measured in August 2014 (48h EC50= 0.061 180
mg/L) was the same as in May 2013 (D. rerio) (48 h EC50= 0.066 mg/L). 181
27
Table 1: Toxicity of AgNPs and AgNO3 towards the different test organisms. EC50 values are arranged from the least sensitive test organism to 182
the most sensitive based on the exposure protocols used. Toxicity of AgNPs and AgNO3 were ranked to different hazard categories according to 183
EC50 values. For the ranking, we applied the criteria used in Kahru and Dubourguier (2010) and color coding applied by Bondarenko et al. 184
(2013): <0.1 mg/L=extremely toxic (dark red); 0.1–1 mg/L = very toxic (red); 1–10 mg/L = toxic (orange); 10–100 mg/L = harmful (yellow). D. 185
rerio test was done at two different times (May 2013, and August 2014) and different developmental stages (hpf-hours post fertilisation). 186
Cartoons depicting the organisms are symbolic (V. fischeri and P. subcapitata are from www.wikipedia.com). 187
Test organism Biological organization
Toxicity Endpoint (biomarker)
International standardization
Effect value (mg AgNPs/L)
Ranking (AgNPs)
Effect value mg Ag+/L (AgNO3)
Ranking (Ag+) salt
Artemia franciscana
Marine crustacean, arthropoda
Immobility no 24h EC50=1.3 48h EC50=10.8
48h EC50=15.0
Hatching success (% of hatched artemia)
no 24h EC50=1.3
Tetrahymena thermophila
Freshwater protozoa
Viability (ATP content)
no 2h EC50= 3.2 24h EC50=3.9
2h EC50= 2.9 24h EC50=2.9
Vibrio fischeri
Bacteria, prokaryotic microorganisms
Viability (luminescence)
ISO 21338:2010 30min EC50=2.6 30 min EC50=1.4
RTgutGC cells
Rainbow trout’s (fish) gut cells in vitro
Viability (metabolic activity)
no 24h EC50=0.551
Viability (membrane integrity)
no 24h EC50=0.732
Viability no 24h EC50=0.576
28
(Lysosomal integrity)
Danio rerio, 2 hpf embryo (May 2013)
Freshwater fish Lethality
(lethal malformations)
OECD 236: 2013 24h LC50= 0.084 48h LC50= 0.066
Danio rerio, 2 hpf embryo (August 2014)
Freshwater fish Lethality OECD 236: 2013 24h LC50=0.061
48h LC50= 0.061 24h LC50= 0.045
48h LC50= 0.032
Danio rerio, 28 hpf, dechorionated (May 2013)
Freshwater fish Lethality no 24h LC50=0.0324
48h LC50= 0.0334
Danio rerio, 72 hpf, hatched embryos (May 2013)
Freshwater fish Lethality no 24h LC50=0.0493
24h LC50=0.018
48h LC50= 0.014
Pseudokirchneriella subcapitata
Freshwater green microalgae
Growth (cell density)
OECD 201:2011 72h EC50=0.0086 72h EC50= 0.0071
Daphnia magna, ADaM medium
Freshwater crustacean, arthropoda
lethality (Immobility)
OECD 202:2004 48h EC50=0.0034 48h EC50= 0.0014
Daphnia magna, OECD medium
Freshwater crustacean, arthropoda
lethality (Immobility)
OECD 202:2004 48h EC50= 0.0025 48h EC50= 0.001
188

29
The relation between the toxicity of AgNPs and Ag+-species from salt (AgNO3) was evaluated
based on the comparison of hazard ranking (Table 1) and linear regression analysis (Fig.6).
The hazard ranking according to 24 h and 48 h EC50 values was for AgNPs and Ag+-species
was exactly the same (Table 1; Fig. 7). The linear fitting revealed significant correlation
between the effect values for AgNPs and Ag+-species with coefficient of determination of R2=
0.998 and a slope of 1.5 (Fig.7). From these data it is evident that the toxicity of AgNPs may
be explained by Ag+-species action in addition to AgNPs/AgNP-complexes.
Fig.7. The correlation between the toxicity of AgNPs and Ag+-species to different test
organisms. Those values from Table 1 were included, which were available for both AgNPs
and AgNO3 (eight of them) (for D. magna two values in two different test media are
reported). The numerical values for AgNPs toxicity are indicated for each test near the
pictogram. The hazard ranking criteria are as described in Kahru and Dubourguier (2010) and
color coding as in Bondarenko et al. (2013): <0.1 mg/L=extremely toxic (dark red); 0.1–1
mg/L = very toxic (red); 1–10 mg/L = toxic (orange); 10–100 mg/L = harmful (yellow).
Cartoons depicting the organisms are symbolic (V. fischeri and P. subcapitata are from
www.wikipedia.com).
30
4 DISCUSSION
In this paper, the experimental data on the hazard identification of AgNPs within the
NanoValid consortium have been systematically collected and analysed in terms of the
methodological approaches. The six involved partner laboratories investigated the toxicity of
the same stock of AgNP suspension using a set of test organisms from different
environments and trophic levels. Altogether, ten different tests with different exposure
regimes were performed. In parallel, all the partners assessed the characteristics of AgNPs in
test media, such as the hydrodynamic size of NPs and the share of Ag+-species (free and
ligand-complexed). Based on these data and the hazard ranking criteria used by some of the
authors earlier (Bondarenko et al., 2013) we demonstrate the sensitivities of different
organisms to nanosilver and compare that to silver ions. The prime focus of this paper,
however, is to give recommendations for hazard identification of NPs, and to demonstrate
the importance of using harmonised procedures for NPs characterisation.
The need for harmonised protocols for the share of Ag+ species in test media. The
toxicity of silver nanoparticles has frequently been associated to Ag ions (Bondarenko et al.,
2013; Ivask et al., 2014). Therefore, the share of Ag+-species in the exposure media is crucial
for the understanding of the mechanism of toxicity of different nanosilver preparations. In
several metal-based nanoparticles, the dissolution of metals plays a great role in the
interpretation of observed toxicity and solubility is a very important property of the
nanomaterials to be considered in nanoregulation (Tantra et al., 2015). In this work, we
adopted the term “the share of Ag+ species” instead of dissolved Ag to indicate that in
addition to “free” Ag+ also their soluble ligand complexes are quantified with the applied
techniques.
In this study very variable data on the share of Ag+-species in dH2O were obtained by
different partners (Figure 3), ranging from 4 to 73 %. The variability can be attributed to
different methods used to separate dissolved species from particles (Ivask et al., 2014;
Odzak et al., 2014). Two main separation approaches have been applied:
(ultra)centrifugation and ultrafiltration. We confirmed that among the protocols tested, only
two approaches are efficient in AgNPs separation from Ag+-species: the ultracentrifugation
(362 769 g; 30-60 min) (Ivask et al, 2014) and 3 kDa pores ultrafiltration (4000 g, 20 min)
(Navarro et al. 2008). However, the efficiency of separation alone could not explain the
31
observed variability of Ag+-species data, since different results were observed by
ultrafiltration and ultracentrifugation approaches: ultracentrifugation of stock Ag suspension
(40 g/L) resulted in significantly lower share of Ag+ species (46 %) than ultrafiltration (68%).
This indicates that also other factors influence the outcome of the soluble Ag+-species
measurement. Tantra et al. (2015) recently concluded that the nanoparticle dissolution
process is governed by dynamic relationships between a number of variables. Among these
surface tensions, hydrodynamic conditions in terms of mechanical agitation, and mass of the
particle exposed (aggregation/agglomeration) may significantly differ depending on the
separation method applied. In fact, Odzak et al. (2014) suggested that the force applied
during the process of ultrafiltration may increase the separation of the Ag-NPs and their PVP
coating, thus exposing more Ag-NPs and increasing the release of Ag ions from the particles.
The experience obtained in this study clearly implies the need for a harmonised
protocol for metal species measurements in NPs dispersions. Our suggestion is to check the
efficiency of separation techniques prior to quantification, both for the (i) impact of the
procedure on the particle dissolution itself, and (ii) the kind of metal species separated from
each other (free ions, complexes and particles) (the latter may be done by application of
electrochemical approaches, Romih et al., 2015). Another option is to use a quantification
method which is able to clearly distinguish between particles from the background, such as
for example single particle ICP-MS. It is far beyond this paper to discuss the suitability of
certain separation and detection techniques (this has been reviewed elsewhere, Tantra et
al., 2015), but we support the recommendation that a complementary approach applying a
suite of techniques is needed.
Test medium composition alters Ag+-species concentration. Our data showed that
the medium composition significantly altered the presence of Ag+-species in the AgNPs
suspension. Namely, less Ag+-species was measured in complex algal medium, L-15/ex and
zebrafish embryo medium in comparison to LB, YPD and dH2O. Since Ag+ was already present
in the stock dispersion (68% and 46%, depending on the analytical method used for
separation of NPs and soluble Ag-species) we would expect that even without additional
dissolution of AgNPs more Ag+ would be present in algal medium, L-15/ex and zebrafish
embryo. This suggests that Ag+ is ligand- complexed in L-15/ex, algal and zebrafish embryo
medium and these complexes are settled out during ultracentrifugation and ultrafiltration
(L-15/ex). For L-15/ex medium, such a complexation of Ag+ was recently shown by Yue et al.
32
(2015). When 1 µM of silver is introduced in L-15/ex medium, only 0.03% of the total silver is
present as free Ag+, while most of the silver is complexed by chloride forming AgCl2− and
AgCl32− complexes. L-15/ex, algal and zebrafish embryo medium have both high sulfate (SO-
4)
and chloride (Cl-) content, while this is not the case for in LB, YPD and dH2O. It is well known,
that depending on the Cl/Ag ratio, Ag+ react with chloride to form solid or aqueous Ag−Cl
species (Levard, 2012, Behra et al., 2013, Yue et al., 2015). Sulfate (SO-4) is also a possible
ligand for Ag+ (Xiu et al., 2011, Choi et al., 2009), however it has a lower stability constant to
form Ag-ligand complexes or precipitates and hence are less likely to occur (Choi et al., 2008,
Levard et al., 2012). Algal medium also contains EDTA, which chelates Ag+ (Fiorucci et al.,
2000). Our results are in accordance with those by Ivask et al. (2014), who found, that 48 h
and 72 h incubation of AgNO3 in OECD 202 artificial freshwater (daphnids medium) and algal
medium significantly decreased the amount of measured Ag by 78% and 18%, respectively,
while a 100% recovery was found in the case of Ag-salt in dH2O (at 390 000 g, 30-60 min).
Based on these data we conclude that extrapolation of metal species data across toxicity test
media is not possible and suggest that metal species measurements should be done in each
respective toxicity media. Soluble metal controls should be included in parallel to account
for the metal complexing by the media components.
The need for harmonised protocols for the NPs hydrodynamic size. All
hydrodynamic size measurements of AgNPs were done using a DLS technique and were
comparable. The angle of measurement and the concentration of particles in the range of 4-
50 mg/L did not significantly change the z-average values obtained for the diameter of
particles. This is the case only for dispersions with narrow size distributions. Hence, in
general, the effect of the angle on the measurement needs to be further elaborated. It is
considered, that the scattering angle used for measuring the particle size affects the size
determination; e.g. the measure of particle size will be smaller at higher angle (Takahash et
al., 2008).
The consideration for the aging of nanomaterials. One of the important properties
of nanomaterials is their modification, e.g. aging; during the storage and the toxicity testing
(Kittler et al. 2010, Tejamaya et al., 2012). In the present study, we were unable to estimate
the time-dependent modification of AgNPs (in terms of Ag+-species concentration) during
the storage period (between January 2013 and September 2014) due to different separation
methods applied. We have shown that AgNPs do not provoke different toxic effect on D.

33
rerio embryo within a 1.5 years difference, but still further experiments using appropriate
techniques are needed to confirm that the AgNPs have not aged. The tests on the different
Ag+- species ratios should be done. Aging of AgNPs has previously been evidenced by other
authors. Tejamaya et al. (2011) found significant changes in surface chemistry, shape,
aggregation and dissolution of monodisperse (10 nm) citrate, PVP and polyethylene glycol
(PEG) capped AgNPs in OECD Daphnia sp. medium after 21 days. We therefore suggest that
NP characteristics are carefully monitored throughout the experimental period and the
characterisation should be done at the same time as the performance of toxicity test to take
into consideration the potential aging of stock NPs. Within the NanoValid project several
activities aim at harmonising test procedures. One example is the development of decision
trees to better structure test procedures, where the aging will be considered (Kühnel and
Nickel, 2014).
Comprehensive set of toxicity data obtained confirms that toxicity of AgNPs is
governed by Ag+-species. This paper provides a comprehensive set of toxicity data on the
AgNPs using a set of environmentally relevant aquatic test species from different food-web
levels. AgNPs were found to be extremely toxic to crustacean D. magna, microalgae P.
subcapitata and zebrafish embryo D. rerio; very toxic to RTgutGC cells, toxic to V. fischeri, T.
thermophila, and harmful to A. franciscana (Table 1, Fig.7.). This is in line with previous
reports, which found D. magna and algae to be very sensitive regarding silver NP toxicity
(Kahru and Dubourguier, 2010, Bondarenko et al. 2013, Ivask et al., 2014). The linear
regression analysis revealed that the toxicity of AgNPs was significantly correlated to those
observed for Ag+-species from Ag-salt as was also previously reported (Bondarenko et al.,
2013; Ivask et al., 2014; Xiu et al., 2012, Groh et al., 2015). This finding supports the
necessity of metal species measurements in NPs dispersions. Preferably, the share of
different silver species (free ions, different complexes, particles) should be determined in
the respective test medium. The data also indicate that in the case of metallic NPs, the
toxicity testing should include the corresponding soluble metal salt. This information could
serve as a reference for the estimation of the bioavailable metal ions and/or ligand metal-
complexes that induce certain effect.
34
CONCLUSIONS
The NanoValid consortium concludes that high quality hazard identification of nanomaterials
should be based on harmonised protocols for toxicity testing as well as characterisation of
nanomaterials. We find it important that the measurement of metal ion-species is done for
each toxicity test medium separately and measured at a range of toxicity test
concentrations. Also data on metal species (free ions, different complexes, particles) in the
respective test medium should be provided. Soluble metal salt control should be an integral
part of nanomaterial testing, both during toxicity testing as well as for Ag+-species
measurements.
Acknowledgement
This research was funded under the EU FP7 project NanoValid (Development of reference
methods for hazard identification, risk assessment and LCA of engineered nanomaterials;
grant no. 263147). A number of people contributed to the data generation presented in this
paper and are not the co-authors of the paper. We would like to acknowledge Tea Romih
and Monika Kos from the University of Ljubljana, Angela Ivask, Monika Mortimer from
National Institute of Chemical Physics and Biophysics (Tallinn, Estonia).
References:
Aruoja, V., Dubourguier, H.C., Kasemets, K., Kahru, A., 2009. Toxicity of nanoparticles of
CuO, ZnO and TiO2 to microalgae Pseudokirchneriella subcapitata. Sci. Total Environ. 407:
1461-1468.
Baker, T.J., Tyler, C.R., Galloway, T.S., 2014. Impacts of metal and metal oxide
nanoparticles on marine organisms. Environ. Pollut. 186:257-71.
Behra, R., Sigg, L., Clift, M.J., Herzog, F., Minghetti, M., Johnston, B., et al, 2013.
Bioavailability of silver nanoparticles and ions: from a chemical and biochemical perspective.
J. R. Soc. Interface. 10:20130396.

35
Bondarenko, O., Juganson, K., Ivask, A., Kasemets, K., Mortimer, M., Kahru, A., 2013.
Toxicity of Ag, CuO and ZnO nanoparticles to selected environmentally relevant test
organisms and mammalian cells in vitro: a critical review. Arch.Toxicol. 87: 1181-1200.
CEC (1996): CEC (Commission of the European Communities) technical guidance
document in support of commission directive 93/67/EEC on risk assessment for new notified
substances. Part II, Environmental Risk Assessment. Office for official publications of the
European Communities, Luxembourg
Chernousova, S., Epple, M., 2013. Silver as antibacterial agent: ion, nanoparticle, and
metal. Angew. Chem. In.t Ed. Engl. 52:1636-53.
Choi, O., Clevenger, T.E., Deng, B., Surampalli, R.Y., Ross, L. Jr, Hu, Z.,2009. Role of sulfide
and ligand strength in controlling nanosilver toxicity. Water Res. 43:1879-86.
Fabrega, J., Luoma, S.N., Tyler, C.R., Galloway, T.S., Lead, J.R., 2011. Silver nanoparticles:
behaviour and effects in the aquatic environment. Environ. Int. 37:517-31.
Fiorucci, A.R., Saran, L.M., Cavalheiro, E.T.G, Neves, E.A., 2000. Thermal stability and
bonding in the silver complexes of ethylenediaminetetraacetic acid. Thermochim. Acta 356:
71-78.
Groh, K.J., Dalkvist, T., Piccapietra, F., Behra, R., Suter, M.J., Schirmer, K., 2015. Critical
influence of chloride ions on silver ion-mediated acute toxicity of silver nanoparticles to
zebrafish embryos. Nanotoxicology 9:81-91.
Heinlaan, M., Ivask, A., Blinova, I., Dubourguier, H-C., Kahru, A., 2008. Toxicity of
nanosized and bulk ZnO, CuO and TiO2 to bacteria Vibrio fischeri and crustaceans Daphnia
magna and Thamnocephalus platyurus. Chemosphere 71:1308 – 1316.
Herrin, R.T., Andren, A.W., Shafer, M.M., Armstrong, D.E., 2001. Determination of silver
speciation in natural waters. 2. Binding strength of silver ligands in surface freshwaters.
Environ. Sci. Technol. 35:1959-66.
Hristozov, D.R., Zabeo, A., Foran, C., Isigonis, P., Critto, A., Marcomini, A., et al., 2014. A
weight of evidence approach for hazard screening of engineered nanomaterials.
Nanotoxicology 8:72-87.
ISO 21338:2010(E). Water quality - Kinetic determination of the inhibitory effects of
sediment, other solids and coloured samples on the light emission of Vibrio fischeri (kinetic
luminescent bacteria test).

36
Ivask, A., Juganson, K., Bondarenko, O., Mortimer, M, Aruoja, V., Kasemets, K., et al. 2013.
Mechanisms of toxic action of Ag, ZnO and CuO nanoparticles to selected ecotoxicological
test organisms and mammalian cells in vitro: A comparative review. Nanotoxicology 8: 57-71
Ivask, A., Kurvet, I., Kasemets, K., Blinova, I., Aruoja, V., Suppi, S., et al., 2014. Size-
Dependent Toxicity of Silver Nanoparticles to Bacteria, Yeast, Algae, Crustaceans and
Mammalian Cells In Vitro. PLoS ONE 9: 102-108.
Jackson, P., Jacobsen, N.R., Baun, A., Birkedal, R., Kühnel, D., Jensen, K.A., et al., 2013.
Bioaccumulation and ecotoxicity of carbon nanotubes. Chem. Cent. J. 7: 154.
Kahru, A., Dubourguier, H-C., 2010. From ecotoxicology to nanoecotoxicology. Toxicology
269:105-119
Kahru, A. Ivask, A., 2013. Mapping the Dawn of Nanoecotoxicological Research. Accounts
of Chemical Research. Acc. Chem. Res. 46:823-833
Kasemets, K., Ivask, A., Dubourguier, H.C., Kahru, A., 2009. Toxicity of nanoparticles of
ZnO, CuO and TiO2 to yeast Saccharomyces cerevisiae. Toxicology in vitro 23: 1116-1122
Kawano, A., Haiduk, C., Schirmer, K., Hanner, R., Lee, L.E.J., Dixon, B., Bols, N.C., 2011.
Development of a rainbow trout intestinal epithelial cell line and its response to
lipopolysaccharide. Aquacult. Nutr. 17, 241–252.
Kittler, S., Greulich, C., Diendorf, J. , 2010. Toxicity of silver nanoparticles increases during
storage because of slow dissolution under release of silver ions. Chem. Mater. 22:
4548:4554.
Krug, H.F., 2014. Nanosafety research-are we on the right track? Angew Chem Int Ed Engl.
53:12304-19.
Kühnel, D. and Nickel, C., 2014. The OECD expert meeting on ecotoxicology and environ-
mental fate - towards the development of improved OECD guidelines for the testing of na-
nomaterials. Sci. Total Environ. 472:347-53
Kühnel, D., Marquardt, C., Nau, K., Krug, H.F., Mathes, B., Steinbach, C., 2014.
Environmental impacts of nanomaterials: providing comprehensive information on
exposure, transport and ecotoxicity - the project DaNa2.0. Environmental Sciences Europe
26:21.
Levard, C., Hotze, E.M., Colman, B.P., Dale, A.L., Truong, L., Yang, X.Y., et al. 2013.
Sulfidation of silver nanoparticles: natural antidote to their toxicity. Environ Sci Technol.
47:13440-8
37
Mills, K.C., Murry, D.A., Guzan, K. A., Ostraat, M. 2014. Nanomaterial Registry: database
that captures the minimal information about nanomaterial physico-chemical characterisitcs.
J. Nanopart. Res. 16:2219.
Misra, S.K., Dybowska, A., Berhanu, D., Luoma, S.N., Valsami-Jones, E., 2012. The
complexity of nanoparticle dissolution and its importance in nanotoxicological studies. Sci
Total Environ. 438:225-32.
Mortimer, M., Kasemets, K., Kahru, A., 2010. Toxicity of ZnO and CuO nanoparticles to
ciliated protozoa Tetrahymena thermophila. Toxicology. 269:182-189
Navarro, D.A., Watson, D.F., Aga, D.S., Banerjee, S., 2009. Natural organic matter-
mediated phase transfer of quantum dots in the aquatic environment. Environ. Sci. Technol.
43:677-82.
Odzak, N., Kistler, D., Behra, R., Sigg, L., 2014. Dissolution of metal and metal oxide
nanoparticles in aqueous media. Environ. Pollut. 191:132-8.
Oomen, A.G., Bos, P.M., Fernandes, T.F., Hund-Rinke, K., Boraschi, D., Byrne, H.J.,
Aschberger, K., Gottardo, S., von der Kammer, F., Kühnel, D., Hristozov, D., Marcomini, A. et
al., Migliore, L., Scott-Fordsmand, J., Wick, P., Landsiedel, R. 2014. Concern-driven integrated
approaches to nanomaterial testing and assessment--report of the NanoSafety Cluster
Working Group 10. Nanotoxicology. 8:334-48.
OECD 2004: Guidelines for the testing of chemicals. Section 2: Effects on Biotic Systems.
Test No. 202: Daphnia sp. acute immobilisation test. Organisation for Economic Co-operation
and Development, Paris, France.
OECD 2011. Guideline 201 for the Testing of Chemicals, Alga, Growth Inhibition Test.
Organisation for Economic Cooperation and Development, Paris, France.
OECD 2013: Guidelines for the testing of chemicals. Section 2: Effects on Biotic Systems.
Test No. 236: Fish Embryo Acute Toxicity (FET) Test. Organisation for Economic Co-operation
and Development, Paris, France.
OECD, 2010. List of Manufactured Nanomaterials and List of Endpoints for Phase One of
the Sponsorship Programme for the Testing of Manufactured Nanomaterials:
Revision.ENV/JM/MONO(2010)46.
OECD 2014. Ecotoxicology and Environmental Fate of Manufactured Nanomaterials: Test
Guidelines. Series on the Safety of Manufactured Nanomaterials No. 40, available online,
accessed 28-6-2015.
38
http://www.oecd.org/science/nanosafety/publicationsintheseriesonthesafetyofmanufacture
dnanomaterials.htm
Ribeiro, F., Gallego-Urrea, J.A., Jurkschat, K., Crossley, A., Hassellöv, M., Taylor, C., et al.
2014. Silver nanoparticles and silver nitrate induce high toxicity to Pseudokirchneriella
subcapitata, Daphnia magna and Danio rerio. Sci. Total Environ. 466-467:232-41.
Romih, T., Drašler, B., Jemec, A., Drobne, D., Novak, S., Golobič, M., et al. 2015.
Bioavailability of cobalt and iron from citric-acid-adsorbed CoFe2O4 nanoparticles in the
terrestrial isopod Porcellio scaber. Sci. Total Environ. 508:76-84.
Sanderson, H., Johnson, D.J., Wilson, C.J., Brain, R.A., Solomon, K.R., 2003. Probabilistic
hazard assessment of environmentally occurring pharmaceuticals toxicity to fish, daphnids
and algae by ECOSAR screening. Toxicol Lett 144:383–395
Sarm, S.D, 2011. Life cycle of a nanosilver based water candle filter: examining issues of
toxicity, risks, challenges and policy implications. J. Biomed Nanotechnol. 7:83-84.
Schirmer, K., Chan, A.G., Greenberg, B.M., Dixon, D.G., Bols, N.C. 1997. Methodology for
demonstrating and measuring the photocytotoxicity of fluoranthene to fish cells in culture.
Toxicol. in vitro 11:107-119.
Schirmer, K., Dixon, D.G., Greenberg, B.M., Bols, N.C., 1998. Ability of 16 priority PAHs to
be directly cytotoxic to a cell line from the rainbow trout gill. Toxicology 127:129-41.
Sharma, V.K., Siskova, K.M., Zboril, R., Gardea-Torresdey, J.L. 2014. Organic-coated silver
nanoparticles in biological and environmental conditions: fate, stability and toxicity. Adv
Colloid Interface Sci. 204:15-34.
Simonis, J.J., Basson, A., 2011. Evaluation of a low-cost ceramic micro-porous filter for
elimination of common disease microorganisms. Phys. Chem. Earth 36, 1129-1134.
Sorgeloos, P. 1973. First report on the triggering effect of light on the hatching
mechanism of Artemia salina dry cyst. Mar. Biol. 22:75-76.
Takahash, K., Kato, H., Saito, T., Matsuyama, S., Kinugasa, S., 2008. Precise
Measurement of the Size of Nanoparticles by Dynamic Light Scattering with Uncertainty
Analysis. Part. . Part. Syst. Char. 25, 1: 31–38.
Tantra, R., Bouwmeester, H., Bolea, E., Rey-Castro, C., David, C.A., Dogné, J.M. et al.,
2015. Suitability of analytical methods to measure solubility for the purpose of
nanoregulation. Nanotoxicology 22:1-12

39
Tejamaya, M., Römer, I., Merrifield, R.C., Lead, J.R., 2012. Stability of citrate, PVP, and
PEG coated silver nanoparticles in ecotoxicology media. Environ. Sci. Technol. 46:7011-7.
Xiu, Z.M., Zhang, Q.B., Puppala, H.L., Colvin, V.L., Alvarez, P.J., 2012. Negligible particle-
specific antibacterial activity of silver nanoparticles. Nano Lett. 12 :4271-5
Xiu, Z.M., Ma, J., Alvarez, P.J., 2011. Differential effect of common ligands and molecular
oxygen on antimicrobial activity of silver nanoparticles versus silver ions. Environ. Sci.
Technol. 45:9003-8.
Yue, Y., Behra, R., Sigg, L., Freire, P.F., Pillai, S., Schirmer, K., 2015. Toxicity of silver
nanoparticles to a fish gill cell line: Role of medium composition. Nanotoxicity 9, 54-63.
Zou, J., Hannula, M., Misra, S., Feng, H., Labrador, R.H, Aula, A.S., et al, 2015. Micro CT
visualization of silver nanoparticles in the middle and inner ear of rat and transportation
pathway after transtympanic injection. J. Nanobiotechnology 27:5
Vindimian, E., 2005. MSExcel macro REGTOX EV7.0.5.xls. Online available at:
http://eric.vindimian.9online.fr/


![Solid State Lighting Annex: Interlaboratory Comparison ... · Solid State Lighting Annex: Interlaboratory Comparison Test Method . ... 100 Bureau Drive, MS 8442 ... , IEC 62504 [8],](https://img.pdfslide.net/doc/110x75/5b48bcf97f8b9a5e5f8cfc75/solid-state-lighting-annex-interlaboratory-comparison-solid-state-lighting.jpg)