Embed Size (px)
Citation preview
NCSL Interlaboratory Comparison of a One Ohm Resistance Standard, 1998 - 2000
Author and Presenter: Jeff Gust GTE Electronic Repair Services
3301 Wayne Trace Fort Wayne, IN 46806
(219) 428-6504 [email protected]
Abstract
This paper reports the results of measurements performed on an artifact resistance standard of one ohm by 19 metrology laboratories throughout the United States. The goal of the Inter-laboratory Comparison (ILC) was to provide verification of each participating laboratory’s measurement capability by obtaining a measurement that agrees with the Pivot Laboratory to within two parts per million. The ILC was organized using the guidelines provided by NCSL RP-15, Guide for Interlaboratory Comparisons. The costs associated with the Pivot Laboratory Measurements (NIST) were sponsored by the NCSL.
Introduction
Interlaboratory Comparisons are defined as’ “Organization, performance and evaluation of calibrations on the same or similar items by two or more laboratories in accordance with predetermined conditions.” Before 1990, the term “Interlaboratory Comparison” was seldom heard beyond the confines of National Metrology Institutes. Even today, this term conjures the image of scientists in pristine white lab coats performing laboratory experiments of the utmost precision.
The publication of ISO/IEC Guide 25, General requirements for the competence of calibration and testing laboratories, brought this term to the level of commercial calibration laboratories when many customers began requiring IS0 Guide 25 compliance of their calibration service provider. In order to assure the quality of test and calibration results, IS0 Guide 25 requires that’
“In addition to periodic audits the laboratory shall ensure the quality of results provided to clients by implementing checks. These checks shall be reviewed and shall include, as appropriate, but not
2000 NCSL Workshop & Symposium
be limited to.....(b) participation in proficiency testing or other interlaboratory comparisons;”
The requirement for interlaboratory comparisons remains in place today, and has been further entrenched into metrology quality systems by its installment in the requirements of IS0 17025, the intended replacement of IS0 Guide 25.
In order to aid in organizing and conducting Interlaboratory Comparisons, the NCSL published Recommended Practice RP-15, Guide for Interlaboratory Comparisons in March of 199g3. The intent of this document was to provide details on the planning and executing of an ILC for general disciplines of metrology.
It is the intent of this paper to provide details specific to the organization of an ILC for resistance measurement. The uncertainty requirements for this resistance ILC were selected to target calibration laboratories one level below that of national metrology institutes. The information presented in this paper may be used as the first component of a bridge between ILCs conducted at production calibration laboratories and those conducted at national metrology institutes.
Further details on the organization and execution of this ILC are presented in the format of NCSL RP-15, Appendix B., Checklist for Interlaboratory Comparisons.
Determining the Need for an ILC
As GTE began the process of obtaining accreditation to ISO/IEC Guide 25 for the field of calibration, it was decided the laboratory should participate in an ILC in order to verify their measurement capability to the level of uncertainty that was indicated in their application for accreditation. GTE chose to focus its initial application in DC/Low Frequency, and therefore desired to participate in an ILC within this field. The focus was narrowed to DC resistance, because it was a key measurement discipline within the DC/Low Frequency field. The decision was made to participate in a resistance ILC for a one-ohm standard resistor. The value of one-ohm is used to directly calibrate other resistors from one milliohm to ten ohms. An ILC for a standard resistor would provide the opportunity to verify the laboratory’s best measurement capability, and a tentative uncertainty goal of 2 parts per million (ppm) was established.
At this point, GTE began searching the metrology community to see if an ILC for a one-ohm standard resistor was currently being conducted. During the timeframe of early 1998, no such ILC was being conducted. GTE decided that it would be in its best interest to organize and conduct such an ILC. A list of potential candidates was developed and interviewed in order to determine their level of interest in participating in a one-ohm resistance ILC. All of the labs
2000 NCSL Workshop & Symposium
interviewed were very interested, agreeing that the measurement of a one-ohm standard resistor was a key component of many metrology laboratories.
Jim Wheeler, NCSL committee chairman of measurement comparison programs was contacted for further assistance. Jim also agreed that such an ILC was needed within the metrology community and noted the NCSL would assist in advertising the ILC, and would also aid in obtaining a grant from NIST to perform measurements on the artifact.
Organize the ILC
Participants for the ILC were formally recruited from the list of potential candidates and advertisements in the NCSL Newsletter. In order to develop the goals and objectives of the ILC, each potential participant was sent a survey (see attachment 1). The survey covered topics such as path of traceability for resistance, basic measurement processes, and uncertainty of measurement statements. The survey also served as part of the qualification process, ensuring that all of the ILC participants had similar measurement capabilities and processes.
In order to plan for an appropriate length of time from start to finish for the ILC, the ILC was restricted to the first twenty laboratories to contact the ILC coordinator. More than twenty laboratories did contact the ILC coordinator. The laboratories that were not able to participate because of the size restriction of the ILC were placed on a standby list, and would be contacted if one of the original twenty laboratories had to withdraw from the ILC. In order to maintain fairness in the laboratory participation/selection process, laboratories that were still on the standby list upon completion of the ILC would be the first laboratories contacted for participation in the next ILC organized by this coordinator.
The organization of the ILC was formalized by the creation of an Interlaboratory Comparison Charter (see attachment 2). In order to participate in the ILC, each laboratory was asked to sign the ILC charter. The charter defined the following parameters of the ILC
Goal: This ILC is intended to provide verification of present measurement capability for each of the participating laboratories. Additionally, the ILC shall investigate the question: Does different paths of traceability to internationally accepted standards create a significant amount of measurement uncertainty amongst the group? The ILC shall provide each participant with independent quantitative information about their processes that can be used to improve their capability.
Participating Laboratories: The following list describes the participating laboratories and the laboratory’s local coordinator:
2000 NCSL Workshop & Symposium
LABORATORY CONTACT
Boeing Metrology Laboratories Detroit Edison Customer Service Engineering GTE Electronic Repair Services Fort Wayne, IN GTE Electronic Repair Services Ontario, CA Guildline Calibration Services Hart Scientific Keithley Instruments Los Alamos National Laboratory Lockheed Martin Idaho Technologies Company Lockheed Martin Missiles and Space, Metrology Labs Measurements International, USA Northwest Calibration Systems, Inc. Kennedy Space Center Reference Standards Laboratory Process Instruments Inc. Sandia National Laboratories Tektronix, Beaverton, OR Transcat U.S. Navy Primary Standards Laboratory Washington Public Power Supply System Standards Lab
Jason Tang
Byron Chartrand
Dan Rumbold
Sunja Koh John Joynt Tom Wiandt Jim Crane Tom Moxley
Harry Moody
Dennis Plowman Jeff Willey Peter G. Bartlett
Perry King Karl Klevens Stuart Kupferman Al Caravone Roger Petry Barry Vincent
John Atkins
ILC Coordinator and Data Processor: Jeff Gust
Pivot Laboratory/Sponsorship: This interlaboratory comparison was sponsored in part through the National Conference of Standards Laboratories (NCSL) and the National Institute of Standards and Technology (NIST). The NCSL was petitioned to apply for funding from NIST for the measurement services involved in this ILC. The funding was approved. NIST shall provide the beginning and ending measurement for the interlaboratory comparison. In addition, NIST shall measure the pressure coefficient for the artifact during the beginning measurement. GTE Electronic Repair Services, Fort Wayne, IN, shall assume all other pivot laboratory responsibilities.
Parameter, Range, and Target Uncertainty: The parameter for this ILC is DC Resistance, the range shall be one ohm, and the target
2000 NCSL Workshop & Symposium
uncertainty is two ppm or lower for measurement uncertainty. The ILC shall consist of a single artifact Thomas type one-ohm resistor.
Time Frame: The artifact shall be sent to NIST in August 1998. The estimated completion is December 1999. Schedule details for individual laboratories shall be provided at a later date.
Financial Considerations: Due to the sponsorship of NIST, the only direct costs to each laboratory shall be shipping the artifact from their laboratory to GTE Electronic Repair Services, Fort Wayne, IN Each laboratory shall assume all indirect costs involved with providing measurement and data for the ILC.
Confidentiality: The participants of this ILC shall be publicly identified, but their data and associated results are to remain confidential. Any published data will be coded so only the laboratory associated with the code shall know who they are.
All data gathered in this ILC shall be treated as confidential. There will be no disclosure or discussion regarding data gathered in this ILC with anyone except for the organization in which the data originated. Every effort shall be made to protect the confidentiality of each participating laboratory during this ILC.
Publication of Results: A formal report of the ILC shall be published and presented to the NCSL Measurement Comparison Program Committee. This report shall identify the participating laboratories, but all data will be coded. A summary of this report will be presented at either the NCSL annual conference or the Measurement Science Conference.
Each participating laboratory shall receive the formal report, and a customized report to present findings that are specific to the participating laboratory.
Plan the ILC
Many aspects of planning the ILC were completed during the organization phase. At this point, the goals, objectives, value to be measured, and target uncertainty has been established, leaving design of experiment as the next major task.
The experiment’s measurement protocols were left as ambiguous as possible. The intent of minimizing the measurement process constraints was to allow each laboratory to perform a measurement on the artifact utilizing as much of their routine measurement process as possible. In order for the ILC to meet the goal of verifying their present measurement capability, the lab must use the same
2000 NCSL Workshop & Symposium
process that is applied in a typical measurement of a standard resistor. The only measurement constraints of the ILC were:
1) The ability to perform correction of the resistance measurement to 25 degrees Celsius. This could also be accomplished by maintaining the artifact in a temperature bath of sufficient accuracy.
2) Measure the artifact in a method that compares a single reference standard’s resistance to the resistance of the artifact. The use of a design scheme will also be acceptable but was not required for this interlaboratory comparison.
3) Test current is 100 mA or a current that will generate 10 mW of power dissipation across the artifact.
4) A measurement shall be defined as either a single measurement for users of a manual-type resistance bridge, or as the mean of a series of n measurements using an automatic- type resistance bridge. NOTE: If laboratories using an automatic bridge would like to change their configuration of their run to n=l, that is acceptable for this interlaboratory comparison.
The planned time allotment for each laboratory was approximately two weeks. The laboratory was to receive the artifact on a Thursday or Friday, and unpack the artifact and place in temperature bath or chamber for stabilization for a period of approximately 96 hours. The measurements would proceed on the next Monday or Tuesday for three consecutive days. In order to safeguard the artifact from prolonged periods of extreme environmental conditions, the artifact was not to be shipped on a Thursday or Friday, where it had the potential to spend the weekend in an environment that would have adverse affects on the artifact.
GTE Electronic Repair Services, Fort Wayne Indiana acted as the administrative pivot laboratory. Each lab was to return the artifact to GTE in order for the ILC coordinator to collect the measurement information, review the condition of the artifact, and to prepare the artifact for the next participating laboratory. Another reason for shipping the artifact back to GTE after each measurement was to maintain confidentiality of the ILC. Shipping the artifact back to GTE after every measurement prevents a laboratory from discovering the identity of another participant during the shipping process.
Written instructions were developed based upon the experiment design (See attachment 3). A simple Excel spreadsheet was also developed for each laboratory to complete for result reporting purposes (See attachment 4). The spreadsheet also provided an easy way to perform temperature and pressure corrections for the artifact.
2000 NCSL Workshop & Symposium
The selected artifact for the ILC was a Thomas-type one-ohm standard resistor. This resistor is known to exhibit small corrections from nominal value, high stability, and a low temperature coefficient of resistance4. Because of these desirable characteristics, NIST is able to assign the best possible measurement uncertainty to this type of resistor4. A Thomas-type one-ohm resistor, an L&N 4210, was purchased from a used equipment dealer. Because the ILC coordinator’s laboratory participated in the ILC, an artifact was purchased to ensure that no lab would have an unfair advantage by having previous knowledge of any of the characteristics of the artifact.
Several processes were implemented in order to safeguard the artifact during transportation. First, the artifact was placed into its metal shipping case that was designed by the manufacturer of the artifact. Next, a shipping case was designed that would encapsulate the metal case. This case was constructed with a rigid frame, high-impact plastic, and recessed handles. Originally, the ILC was to use this configuration to transport the artifact. Upon review by the GTE shipping department, a flaw in the design was pointed out. The shipping case configuration was approximately a 12-inch tall case, weighing fifteen pounds, and possessing handles. The shipping department personnel provided anecdotal evidence that the overnight shipping company employees would attempt to use the artifact to “set the throwing distance record.”
In order to remedy this design flaw, the case was then placed in a 16X20X20 inch cardboard box, without handles. The shipping case was packed with foam- in-place packing material. During the foam-in-place packing process, the metal case and artifact were removed from the shipping case in order to safeguard the artifact from the significant temperatures that occur during the foam-in-place process.
In order to monitor the effects of transporting the artifact, Shockwatch@ labels
were applied to each axis of the box. The Shockwatch@ would indicate if the box had undergone a force equivalent to a drop of greater than 12 inches at any time during the shipping process. Finally, a temperature-recording device was purchased, so that it could monitor the temperature of the artifact during transport. The temperature-recording device is the size of a g-volt battery, has temperature resolution of 0.1 degree Celsius (thermistor based), and has the ability to record the temperature of the artifact every 5 minutes for approximately one month.
Plan the ILC Execution
When the time came to execute the ILC, all that was required was to utilize the processes developed during the planning phase of the ILC. A rigid schedule was not developed for the ILC because each participating laboratory had customer commitments to meet in addition to participation in the ILC. Each participating laboratory was contacted approximately one week prior to proposed ship date. If
2000 NCSL Workshop & Symposium
the laboratory was not able to participate at that particular time because of workload requirements or due to a lab standard being repaired/calibrated, they would be passed over and scheduled at a later date.
During the execution of the ILC, two laboratories that had initially expressed interest in participating in the ILC later withdrew from the study. One laboratory was replaced from the laboratories on the standby list. Due to the time constraints associated with the publication of this paper, the last laboratory was not replaced, leaving a total of nineteen laboratories reporting measurement results.
Analysis and Report of Data
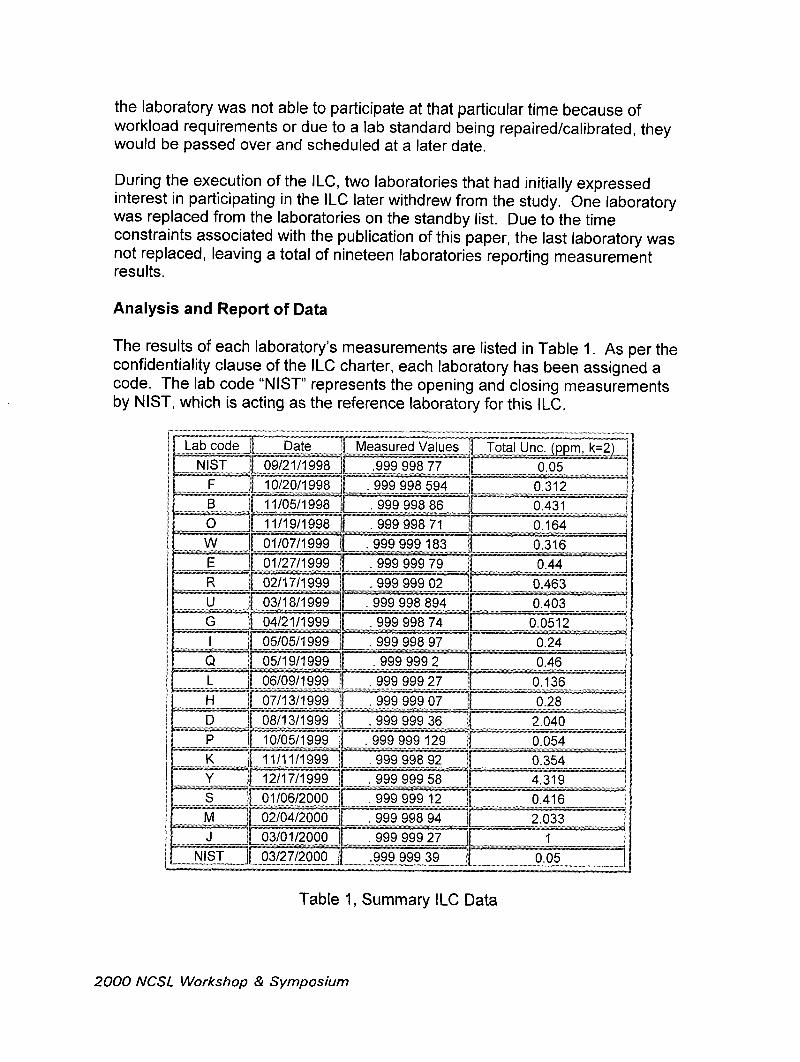
The results of each laboratory’s measurements are listed in Table 1. As per the confidentiality clause of the ILC charter, each laboratory has been assigned a code. The lab code “NIST” represents the opening and closing measurements by NIST, which is acting as the reference laboratory for this ILC.
399 998 97 f 0.24
Table 1, Summary ILC Data
2000 NCSL Workshop & Symposium
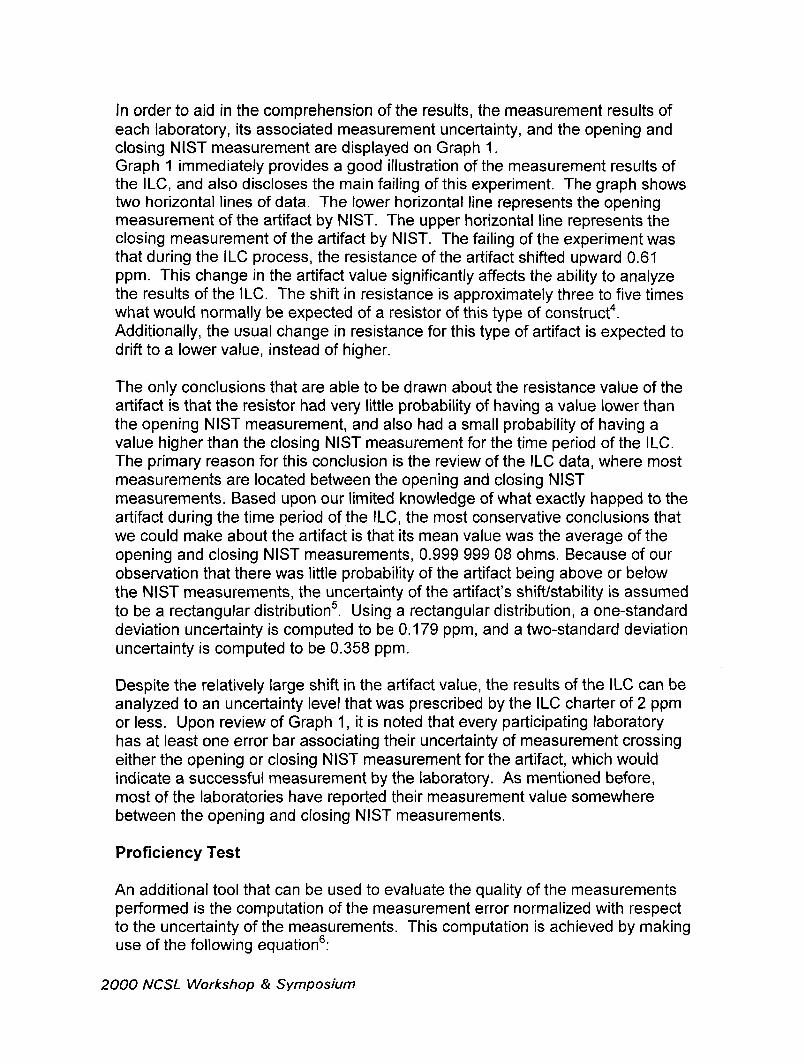
In order to aid in the comprehension of the results, the measurement results of each laboratory, its associated measurement uncertainty, and the opening and closing NIST measurement are displayed on Graph 1. Graph 1 immediately provides a good illustration of the measurement results of the ILC, and also discloses the main failing of this experiment. The graph shows two horizontal lines of data. The lower horizontal line represents the opening measurement of the artifact by NIST. The upper horizontal line represents the closing measurement of the artifact by NIST. The failing of the experiment was that during the ILC process, the resistance of the artifact shifted upward 0.61 ppm. This change in the artifact value significantly affects the ability to analyze the results of the ILC. The shift in resistance is approximately three to five times what would normally be expected of a resistor of this type of construct4. Additionally, the usual change in resistance for this type of artifact is expected to drift to a lower value, instead of higher.
The only conclusions that are able to be drawn about the resistance value of the artifact is that the resistor had very little probability of having a value lower than the opening NIST measurement, and also had a small probability of having a value higher than the closing NIST measurement for the time period of the ILC. The primary reason for this conclusion is the review of the ILC data, where most measurements are located between the opening and closing NIST measurements. Based upon our limited knowledge of what exactly happed to the artifact during the time period of the ILC, the most conservative conclusions that we could make about the artifact is that its mean value was the average of the opening and closing NIST measurements, 0.999 999 08 ohms. Because of our observation that there was little probability of the artifact being above or below the NIST measurements, the uncertainty of the artifact’s shift/stability is assumed to be a rectangular distributior?. Using a rectangular distribution, a one-standard deviation uncertainty is computed to be 0.179 ppm, and a two-standard deviation uncertainty is computed to be 0.358 ppm.
Despite the relatively large shift in the artifact value, the results of the ILC can be analyzed to an uncertainty level that was prescribed by the ILC charter of 2 ppm or less. Upon review of Graph 1, it is noted that every participating laboratory has at least one error bar associating their uncertainty of measurement crossing either the opening or closing NIST measurement for the artifact, which would indicate a successful measurement by the laboratory. As mentioned before, most of the laboratories have reported their measurement value somewhere between the opening and closing NIST measurements.
Proficiency Test
An additional tool that can be used to evaluate the quality of the measurements performed is the computation of the measurement error normalized with respect to the uncertainty of the measurements. This computation is achieved by making use of the following equation?
2000 NCSL Workshop & Symposium
,999 998
,999 996
Graph 1
ILC Data with Measurement Uncertainty and NET Measurement Information
1017/l 998 1 /I 511999 4l25/1999 11/11/1999
i- ~6 Measured Values .- - Opening NIST Value - -Closing NIST Value - - - - - - NIST MEAN 1 -__
2/l 9/2000
_ - .- - ..-
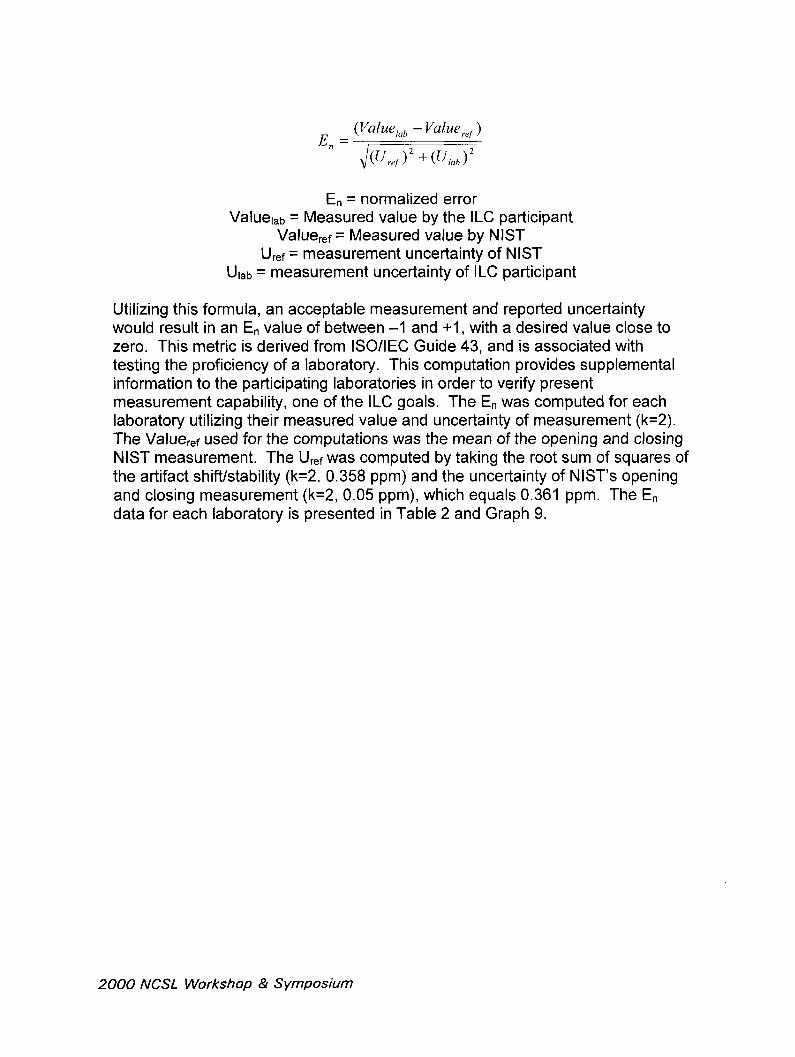
hl = normalized error Valuelab = Measured value by the ILC participant
Value,r = Measured value by NIST U rer = measurement uncertainty of NIST
Urab = measurement uncertainty of ILC participant
Utilizing this formula, an acceptable measurement and reported uncertainty would result in an E, value of between -1 and +I, with a desired value close to zero. This metric is derived from ISOAEC Guide 43, and is associated with testing the proficiency of a laboratory. This computation provides supplemental information to the participating laboratories in order to verify present measurement capability, one of the ILC goals. The E, was computed for each laboratory utilizing their measured value and uncertainty of measurement (k=2). The Valuerer used for the computations was the mean of the opening and closing NIST measurement. The Urer was computed by taking the root sum of squares of the artifact shift/stability (k=2. 0.358 ppm) and the uncertainty of NIST’s opening and closing measurement (k=2, 0.05 ppm), which equals 0.361 ppm. The E, data for each laboratory is presented in Table 2 and Graph 9.
2000 NCSL Workshop & Symposium
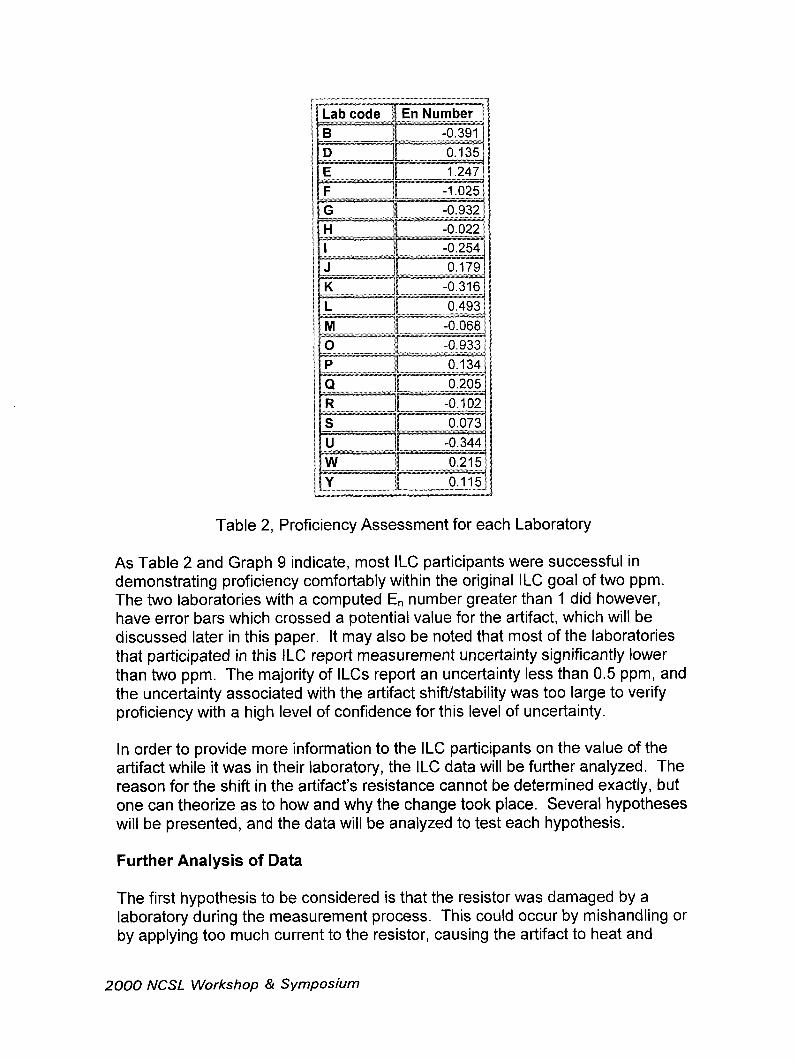
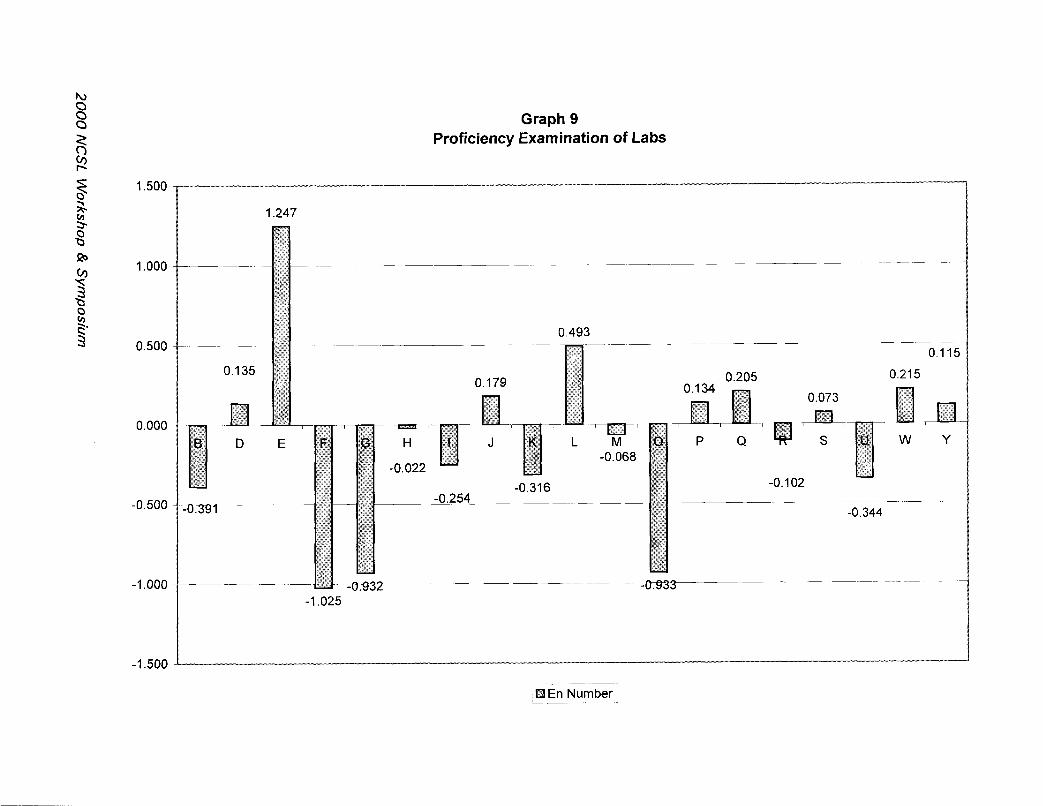
Table 2, Proficiency Assessment for each Laboratory
As Table 2 and Graph 9 indicate, most ILC participants were successful in demonstrating proficiency comfortably within the original ILC goal of two ppm. The two laboratories with a computed E, number greater than 1 did however, have error bars which crossed a potential value for the artifact, which will be discussed later in this paper. It may also be noted that most of the laboratories that participated in this ILC report measurement uncertainty significantly lower than two ppm. The majority of ILCs report an uncertainty less than 0.5 ppm, and the uncertainty associated with the artifact shift/stability was too large to verify proficiency with a high level of confidence for this level of uncertainty.
In order to provide more information to the ILC participants on the value of the artifact while it was in their laboratory, the ILC data will be further analyzed. The reason for the shift in the artifact’s resistance cannot be determined exactly, but one can theorize as to how and why the change took place. Several hypotheses will be presented, and the data will be analyzed to test each hypothesis.
Further Analysis of Data
The first hypothesis to be considered is that the resistor was damaged by a laboratory during the measurement process. This could occur by mishandling or by applying too much current to the resistor, causing the artifact to heat and
2000 NCSL Workshop & Symposium
Graph 9
Proficiency Examination of Labs
1.500
1.000
0.500
0.000
-0.500
-1.000
-1.500
1.247
0.493 ~-~
O.llE
0.179 0.215
/EIEn Number’
change its resistance value. If this did in fact happen, one should be able to see significant shift in the measured values of the artifact. The graphed data would most likely resemble a “step” if this were in fact what happened to the artifact. If this were the case, the measurements should be very close to the opening value until the damage occurred, and then the rest of the measurements should be very close to the closing value of the artifact.
The second hypothesis to consider is the shipping company damaged the artifact by rough treatment during the shipping process. An indication of this hypothesis would be similar to that of the first hypothesis, the observation of a step in the measurement data.
The third hypothesis is that twenty-one round trip shipments across the United States (nineteen laboratories and two trips to NIST) induced stress into the artifact, changing its value from the opening NIST measurement to the closing NIST measurement. This hypothesis differs from the second theory in that, instead of the artifact resistance value changing all at once, each shipment of the artifact induced a very small amount of stress, and the stress induced by each trip is approximately equal in magnitude. If this were the case the measured values should appear to have a linear drift trend. Additional information that supports this hypothesis is that one laboratory measured the artifact for a period of eight weeks to ensure that the artifact was sufficiently stable. During the eight- week period, the total variability of the artifact was 0.014 ppm. This would indicate that the resistor had no observable stability problems when it arrived in the particular laboratory for measurement, leaving only transportation as a potential cause for the observed shift. Before further analysis is performed on the measurements, the theories regarding the shift in the artifact will be tested.
These are the only three hypotheses developed at the time of paper publishing. This may not be an all inclusive set of hypotheses regarding the change in resistance of the artifact, but they are the only ones to be discussed during this paper.
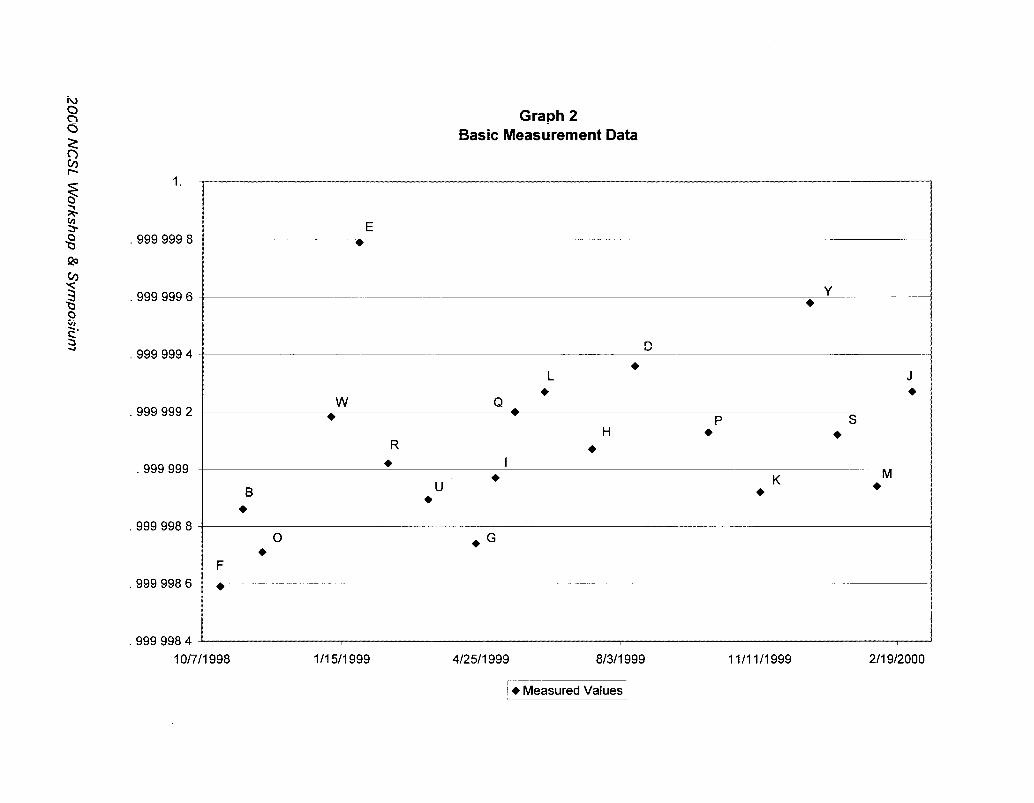
In order to better observe the data for a particular trend, Graph 2 has been created. Graph 2 only displays the measured values from each laboratory. At this point, it does not appear to the ILC coordinator that the data supports either of the first two hypotheses. Instead of observing a flat set of measurements, and then a step in the measured values, it appears the data drifts gradually upward over time. The notable exception to the data is laboratory E, which appears to be an outlying data point.
At this point, it appears hypothesis three is most likely what seems to have happened to the artifact. We can perform further tests on the data in order to place more confidence in this conclusion. One such test would be to perform a regression analysis on the ILC data, in order to determine the slope of the ILC measurements. If the slope of the ILC data closely agrees with the slope
2000 NCSL Workshop & Symposium
Graph 2
Basic Measurement Data
999 999 8 E
l
999 999 6 Y l
999 999 4
999 999 2
,999 999
999 998 8
9999986
999 998 4
1 O/7/1 998 l/l 5/l 999 4/25/I 999 8/3/l 999 1 l/l l/1999 2/l 9/2000
/ + Measured Values i
between the opening and closing NIST measurement, it would give more credence to hypothesis three.
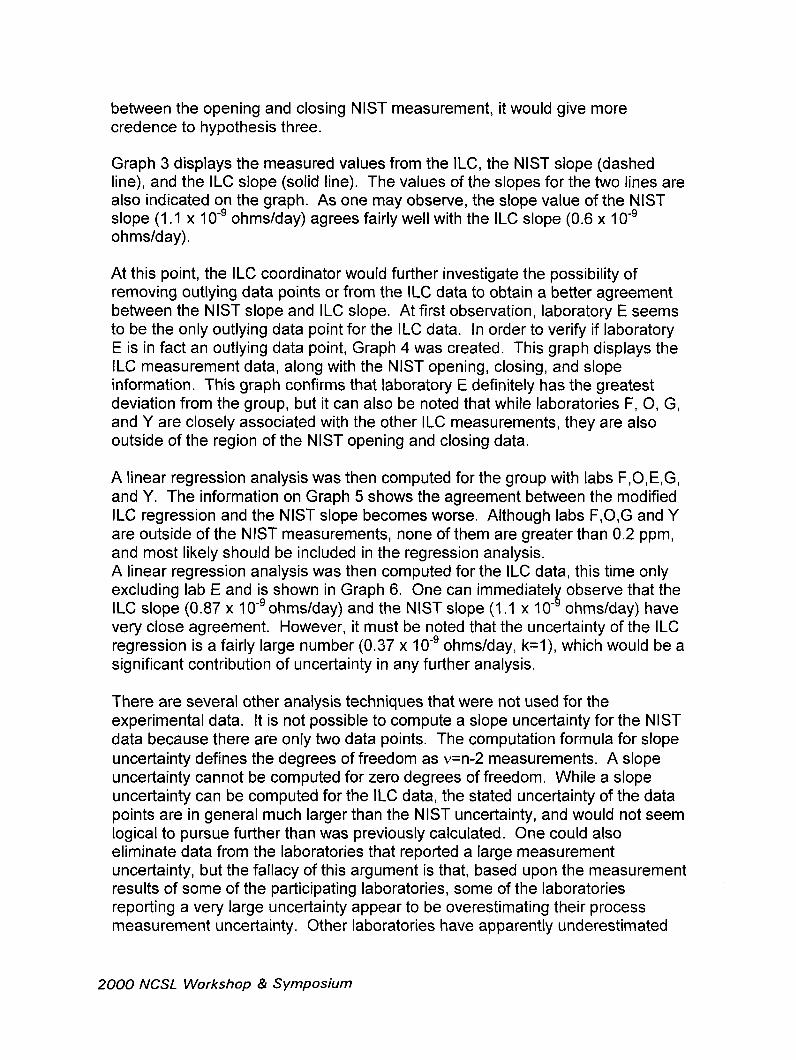
Graph 3 displays the measured values from the ILC, the NIST slope (dashed line), and the ILC slope (solid line). The values of the slopes for the two lines are also indicated on the graph. As one may observe, the slope value of the NIST slope (1 .I x IO-’ ohms/day) agrees fairly well with the ILC slope (0.6 x IO-’ ohms/day).
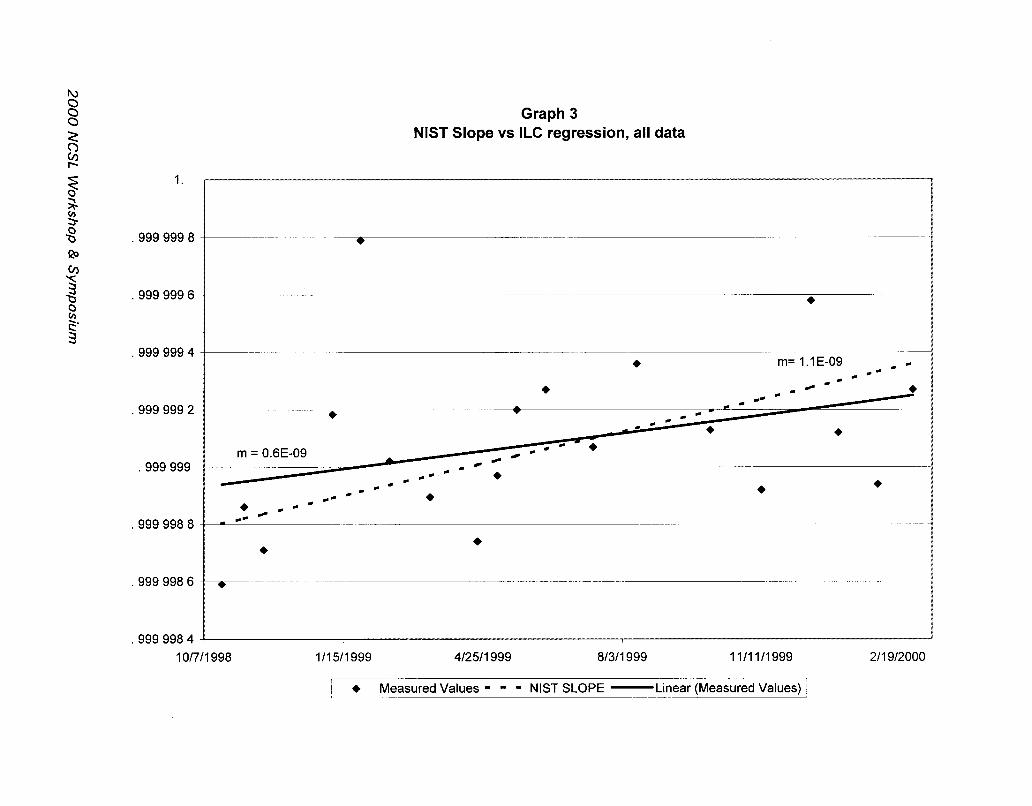
At this point, the ILC coordinator would further investigate the possibility of removing outlying data points or from the ILC data to obtain a better agreement between the NIST slope and ILC slope. At first observation, laboratory E seems to be the only outlying data point for the ILC data. In order to verify if laboratory E is in fact an outlying data point, Graph 4 was created. This graph displays the ILC measurement data, along with the NIST opening, closing, and slope information. This graph confirms that laboratory E definitely has the greatest deviation from the group, but it can also be noted that while laboratories F, 0, G, and Y are closely associated with the other ILC measurements, they are also outside of the region of the NIST opening and closing data.
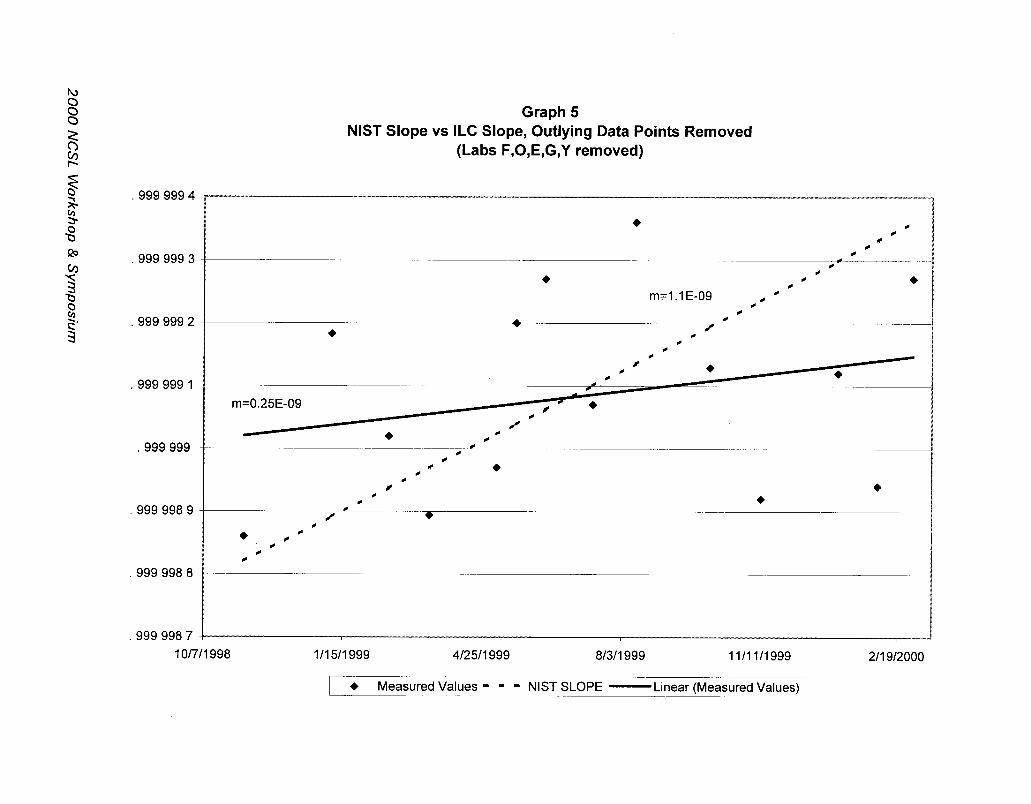
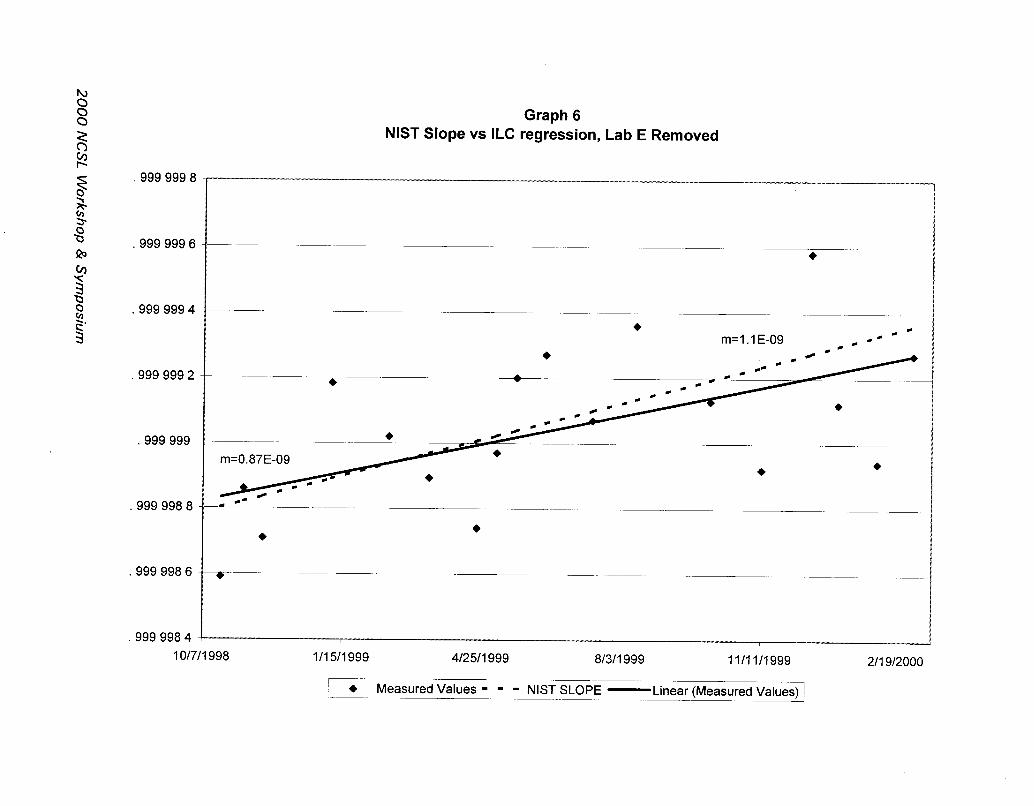
A linear regression analysis was then computed for the group with labs F,O,E,G, and Y. The information on Graph 5 shows the agreement between the modified ILC regression and the NIST slope becomes worse. Although labs F,O,G and Y are outside of the NIST measurements, none of them are greater than 0.2 ppm, and most likely should be included in the regression analysis. A linear regression analysis was then computed for the ILC data, this time only excluding lab E and is shown in Graph 6. One can immediate1 ILC slope (0.87 x IO-’ ohms/day) and the NIST slope (1 .I x i!l
observe that the IO- ohms/day) have
very close agreement. However, it must be noted that the uncertainty of the ILC regression is a fairly large number (0.37 x IO-’ ohms/day, k=l), which would be a significant contribution of uncertainty in any further analysis.
There are several other analysis techniques that were not used for the experimental data. It is not possible to compute a slope uncertainty for the NIST data because there are only two data points. The computation formula for slope uncertainty defines the degrees of freedom as v=n-2 measurements. A slope uncertainty cannot be computed for zero degrees of freedom. While a slope uncertainty can be computed for the ILC data, the stated uncertainty of the data points are in general much larger than the NIST uncertainty, and would not seem logical to pursue further than was previously calculated. One could also eliminate data from the laboratories that reported a large measurement uncertainty, but the fallacy of this argument is that, based upon the measurement results of some of the participating laboratories, some of the laboratories reporting a very large uncertainty appear to be overestimating their process measurement uncertainty. Other laboratories have apparently underestimated
2000 NCSL Workshop & Symposium
,999 999 8
,999 999 6
,999 999
,999 998 8
999 998 6
,999 998 4
Graph 3
NIST Slope vs ILC regression, all data
-*
l m= l.lE-09
+
* l
m = 0.6E-09
1 O/7/1 998 1 II 511999 4/25/l 999 8/3/I 999 11/1111999 2119/2000
~ + Measured Values - - - NIST SLOPE -Linear (Measured Values) L---- ~~- --
1.
.9999998
.9999996
.9999994
.9999992
,999 999
.9999988
.9999986
.9999984
Graph 4
ILC Data with NIST measurement Information
-------I m -w-R - -- - - ------ -I
L
Q l
1 O/7/1 998 l/15/1999 412511999 81311999 11/11/1999 2/19/2000
L -c- Measured Values - - Opening NIST Value - -Closing NIST Value - - - NIST SLOPE ~
.999 999 4
,999 999 3
999 998 9
999 998 8
,999 998 7
Graph 5
NIST Slope vs ILC Slope, Outlying Data Points Removed
(Labs F,O,E,G,Y removed)
lOl7ll998 l/l 5/I 999 4/25/I 999 11111/1999
r-- l Measured Values - - - NIST SLOPE -Linear (MeasuredValuesjl
2/l 912000
Graph 6
NIST Slope vs ILC regression, Lab E Removed
999 999 8
.999 999 6
,999 999 4
,999 999 2
,999 999
.999 998 8
9999986
999 998 4
1 Oh'll998 l/l 5/l 999 4/25/I 999 8/3/l 999 11/11/1999
l Measured Values - - - NIST SLOPE -Linear (Measured Values) 1
their uncertainty, and as a result, it is not possible to base the quality of a measured value strictly upon its associated reported uncertainty.
While it can be argued that hypothesis one or two are still valid, the analysis of the data provides the strongest support for hypothesis three - the artifact drifted in an approximate linear fashion from its opening measurement to its closing measurement (using the NIST slope). At this point, it is important to state that the model described in hypothesis three is only an approximation to what may have actually happened to the artifact during the time period of the ILC. However, the regression coefficient7 r, shows a weak linear trend, and provides further support for hypothesis three. Since this estimate reduces the variability (uncertainty) associated with the linear hypothesis that was previously used to evaluate proficiency of the laboratory’s measurements, the NIST slope data can be used to further analyze the quality of the ILC measurement results. As the analysis upon each individual laboratory is investigated, the quality of their measurement result may be compared to the predicted value of the artifact based upon the NIST slope value.
Analysis of Individual Laboratory Data
Graph 1 can also be used to assess the quality for each laboratory’s results. While it is difficult to assess every laboratory, it is clear that for any of the hypotheses, labs D, Y and M have provided a measurement in which their uncertainty bars cross all potential values for the artifact. These labs are proficient to the level of their advertised measurement uncertainty.
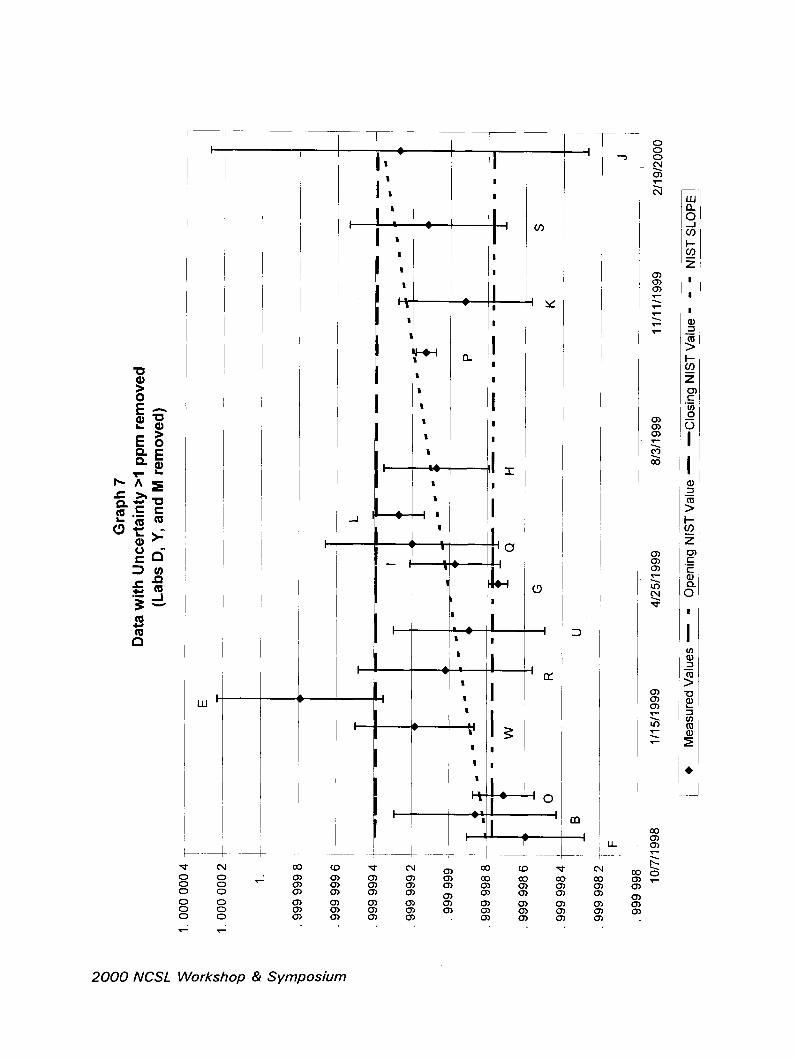
In order to better analyze the other laboratory’s measurement data, Graph 7 was created, which is essentially the same as Graph 1, except the data associated with labs D, Y, and M have been removed to allow the vertical scale of the graph to be expanded.
Using the NIST slope to assess proficiency in Graph 7, labs F, B, 0, W, R, U, I, H, K, S, and J have measured values with a stated uncertainty that intersects with the NIST slope value for the time of measurement. It is clear that all of these laboratories have successfully measured the artifact. Using this criterion also indicates that labs E, G, L, and P have not successfully measured the artifact. At this point the ILC coordinator must also point out that most of these laboratories have successfully measured the artifact to the original goal of the ILC to within the uncertainty determined by the opening and closing NIST data. It is important to note that Laboratory P reports an extremely small uncertainty and while its error bars do not intersect the NIST slope, it is very close. Laboratory P as well as E, G, and L have an argument for either the first or second hypothesis, as well as for refuting the third hypothesis. The error bars associated with their measurement uncertainty intersects with either the opening or closing NIST measurement, so one cannot draw the conclusion these laboratories have failed in the ILC.
2000 NCSL Workshop & Symposium
UY
Y
3
-I
IY
‘0
__(
-I
I-
L 3
m - c’ +
Tr (v
-t-
2000 NCSL Workshop & Symposium
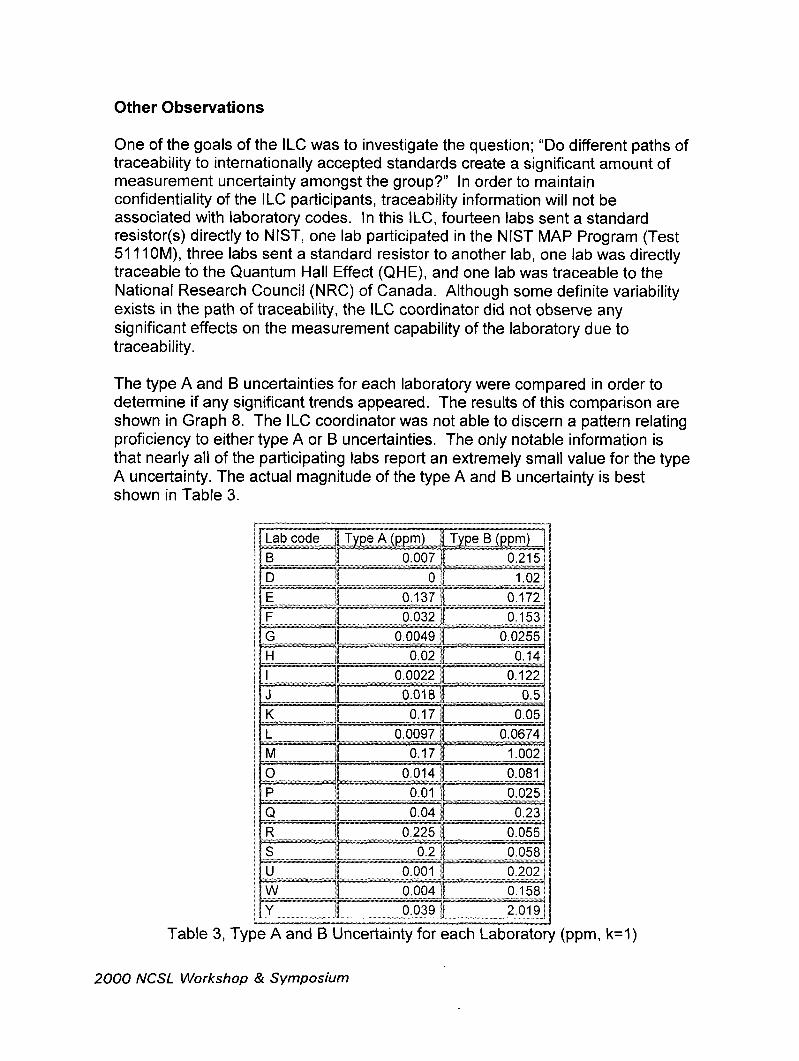
Other Observations
One of the goals of the ILC was to investigate the question; “Do different paths of traceability to internationally accepted standards create a significant amount of measurement uncertainty amongst the group?” In order to maintain confidentiality of the ILC participants, traceability information will not be associated with laboratory codes. In this ILC, fourteen labs sent a standard resistor(s) directly to NIST, one lab participated in the NIST MAP Program (Test 5111 OM), three labs sent a standard resistor to another lab, one lab was directly traceable to the Quantum Hall Effect (QHE), and one lab was traceable to the National Research Council (NRC) of Canada. Although some definite variability exists in the path of traceability, the ILC coordinator did not observe any significant effects on the measurement capability of the laboratory due to traceability.
The type A and B uncertainties for each laboratory were compared in order to determine if any significant trends appeared. The results of this comparison are shown in Graph 8. The ILC coordinator was not able to discern a pattern relating proficiency to either type A or B uncertainties. The only notable information is that nearly all of the participating labs report an extremely small value for the type A uncertainty. The actual magnitude of the type A and B uncertainty is best shown in Table 3.
Table 3, Type A and B Uncertarnty tor each Laboratory (ppm, k=l)
2000 NCSL Workshop & Symposium
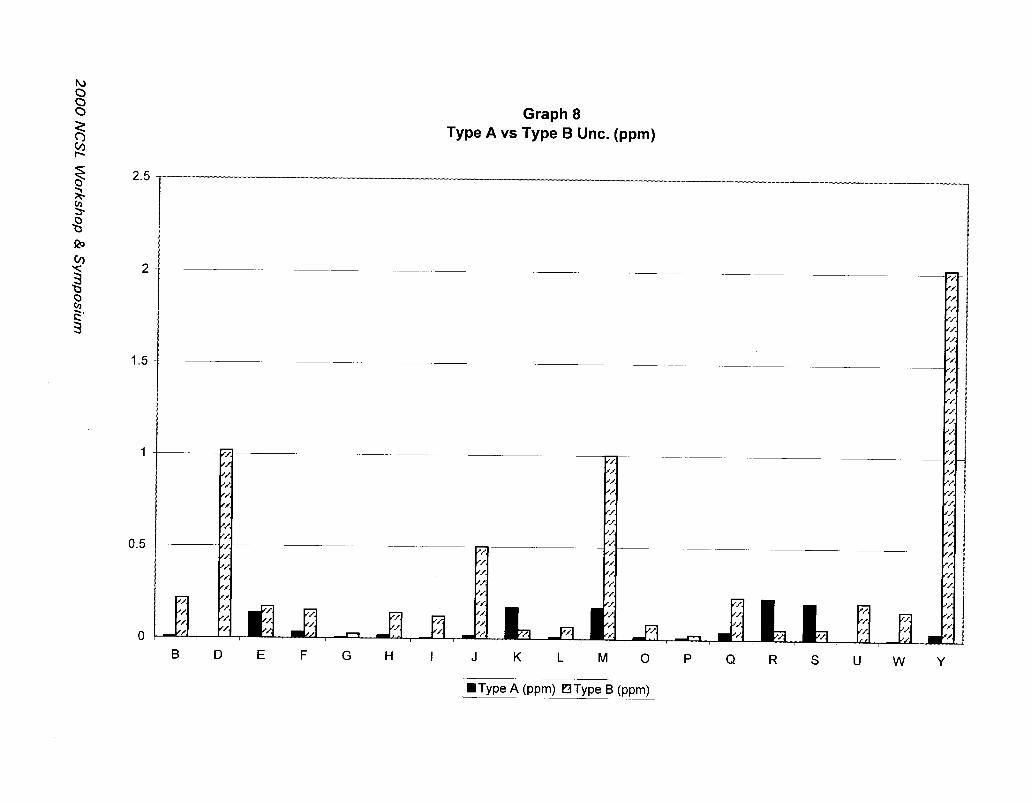
Graph 8
Type A vs Type B Unc. (ppm)
2.5
2
1.5
1
0.5
0
B D E F G H I JKLMOPQRSUWY
1 WType A (wm) Ewe B (ppm) i
The data relating to the Shockwatch@ labels was not successfully collected for each participating laboratory. Often the labels were torn off during shipment, or the artifact was removed from the cardboard box before it was received at the laboratory, losing all data. However, all of the data indicates that during all shipments, at least one axis of the box underwent a force equal to or greater than a 12 inch drop. Although the force was applied to the outside of the shipping box, the artifact was protected in several layers of packing. It is suspected that the artifact, itself may not have been subjected to the same force present on the outside of the box. Suggestions to improve the monitoring of mechanical shock for future ILCs would be to send additional Shockwatch@ labels with the artifact to replace the ones broken/removed on the trip to the participating laboratory. If possible, force-measuring devices should be attached as close to the artifact as possible, in order to more accurately determine the force that the artifact is subject to during shipment. Presently, even the best shipping companies do not handle laboratory standards with enough care for precision metrology applications. We can conclude that more efforts need to be applied to the safeguarding of the artifact by designing better shipping containers.
The full set of temperature data associated with shipping the artifact was also not successfully collected. The temperature-recording device was set to take measurements every five minutes for approximately one month. Several participating laboratories held the artifact for over one month, filling the memory of the temperature-recording device, which turned it off. Upon general review of the data, it does not appear that the artifact underwent an extreme temperature change during travel. The highest observed temperature from the temperature recorder was 90.5 degrees F, and the lowest observed temperature was 47.3 degrees F. The reason for the high temperature recording was not due to environment as much as it was to the heat that was expended due to the foam- in-place packing material. During the packing process, the artifact and metal shipping case was removed from the larger shipping case, but it is clear that the ILC coordinator should have planned for the shipping case to completely stabilize before completing the packing and shipping process. A table with all of the peak temperature conditions recorded is listed in Table 4.
2000 NCSL Workshop & Symposium
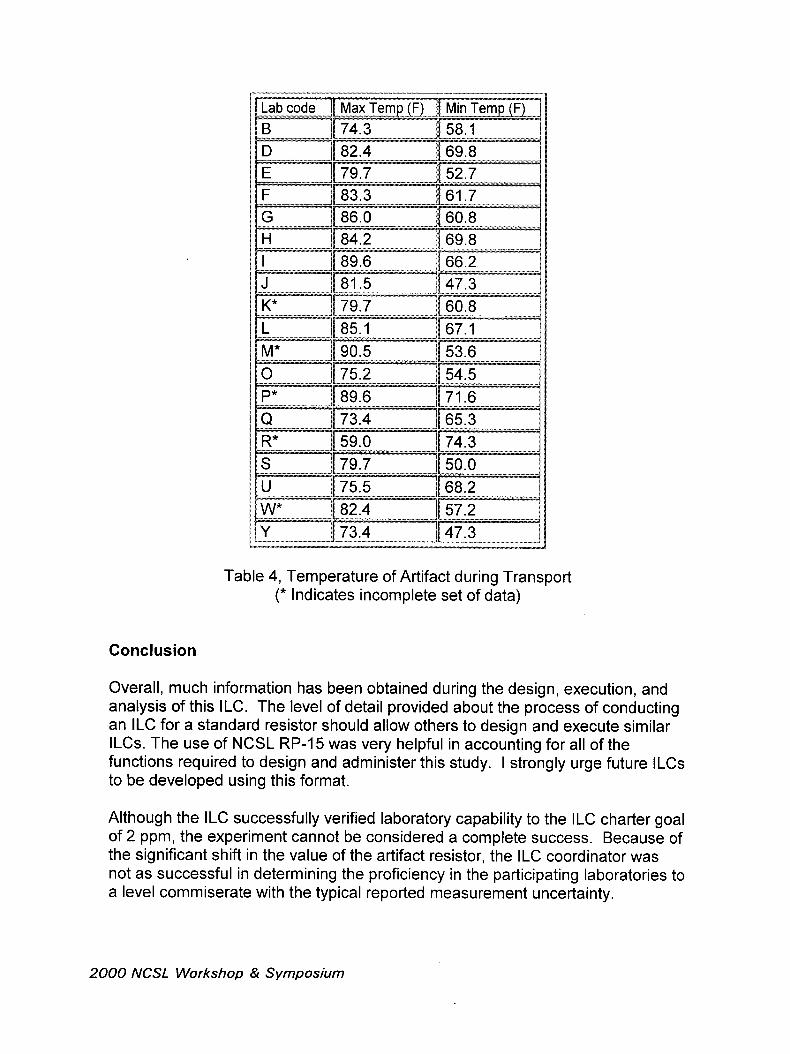
Table 4, Temperature of Artifact during Transport (* Indicates incomplete set of data)
Conclusion
Overall, much information has been obtained during the design, execution, and analysis of this ILC. The level of detail provided about the process of conducting an ILC for a standard resistor should allow others to design and execute similar ILCs. The use of NCSL RP-15 was very helpful in accounting for all of the functions required to design and administer this study. I strongly urge future ILCs to be developed using this format.
Although the ILC successfully verified laboratory capability to the ILC charter goal of 2 ppm, the experiment cannot be considered a complete success. Because of the significant shift in the value of the artifact resistor, the ILC coordinator was not as successful in determining the proficiency in the participating laboratories to a level commiserate with the typical reported measurement uncertainty.
2000 NCSL Workshop & Symposium
Several lessons were learned however, for conducting future ILCs in this parameter that may improve the quality of results. One suggestion would be to reduce the number of participating laboratories by half, in order to reduce the effects of transportation during the ILC. The actual transportation could be reduced if the next ILC was a public one, where confidentiality was not an issue. It would probably be a good idea to send the artifact back to a pivot lab for at least two more measurements to more accurately monitor the state of the artifact. For the level of capability of this group of participants, I would recommend that NIST remain the pivot laboratory. When using foam-in-place packing material, the shipping container needs approximately 12 hours to stabilize before placing the artifact into the container and shipping. This will further reduce risks associated with excessive heating of the artifact. A better means of measuring the mechanical shock to the artifact during transport should be developed.
It is the authors endeavor to also demonstrate that both conducting and participating in ILCs are not as intimidating of a process as one might think. Participation in ILCs is not only important to demonstrate compliance to metrology quality standards, but is extremely important for individual laboratories to assess their present capability and make improvements upon the quality of their processes. There currently are not enough ILC’s operating throughout the United States to verify the myriad of measurement disciplines and levels of uncertainty that exist today in the field of metrology. I would strongly encourage all laboratories to become involved in the process of both participating and conducting Interlaboratory Comparisons.
Acknowledgements
I would like to thank all individuals who volunteered their personal time in the development of NCSL RP-15. Their efforts have made an invaluable contribution to the field of metrology.
I would also like to thank Dr. Ron Dzuiba, and Dr. Dave Braudaway for providing their extensive technical expertise in the design of this ILC and technical review of the paper. Special thanks go out to Julie Schock of GTE for editing the paper and Dr. Stuart Kupferman of Sandia National National Laboratories for providing extensive technical and editorial review of this paper.
References:
’ ANSVNCSL 2540-1-l 994, Section 3, Definitions, part 3.5 * ISO/IEC Guide 25 : 1990, Section 5, Quality System, Audit and Review part 5.6 3 NCSL RP-15, Guide for Interlaboratory Comparisons. National Conference of Standards Laboratories. March 1999
2000 NCSL Workshop & Symposium
4 Dzuiba, Ronald F., Boynton, Paul A., Elmquist, Randolph E., Jarrett, Dean G., Moore, Theodore P., Neal, Jack D. NIST Technical Note 1298. NIST Measurement Service for DC Standard Resistors. U.S. Department of Commerce, National Institute of Standards and Technology. November 1992. 5 Guide to the Expression of Uncertaintv in Measurement. ISO. 1995 6 ISO/IEC Guide 43, 1984 ’ Eicke, W.G., Reiley, J.P., Reiley, K.J., Metrologv-Measurement Assurance Prow-am Guidelines. NASA Rerence Publication 1364. March 1995, pgs 24-25.
2000 NCSL Workshop 31 Symposium
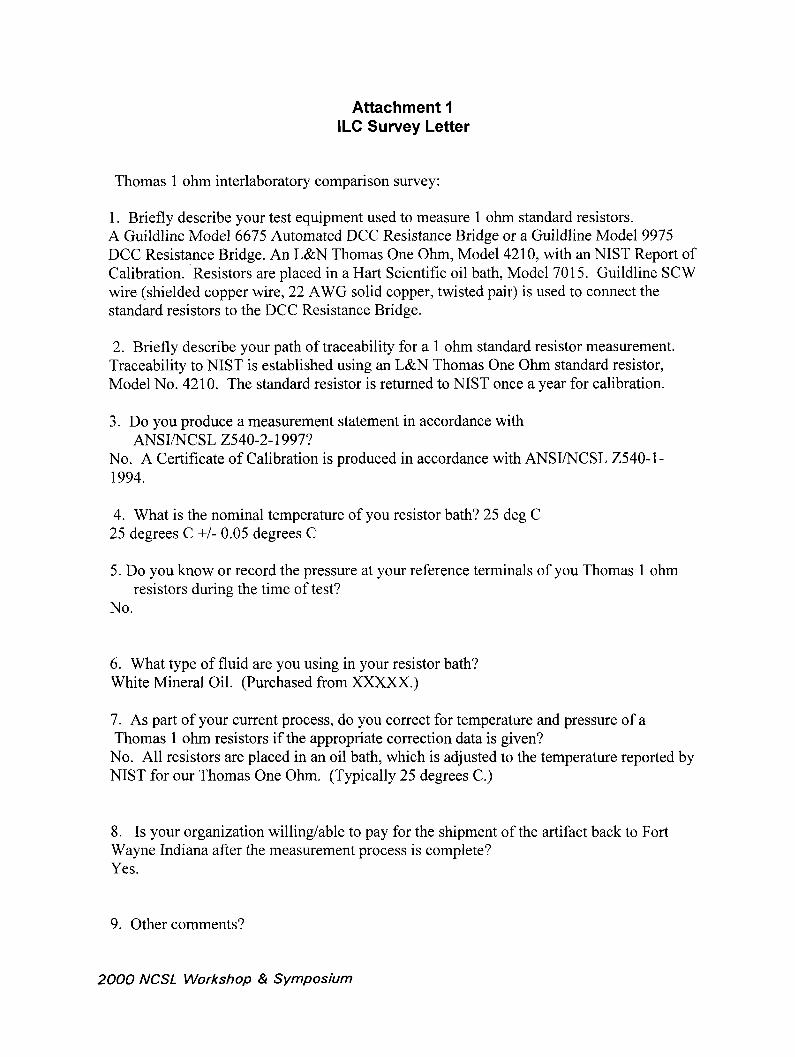
Attachment 1 ILC Survey Letter
Thomas 1 ohm interlaboratory comparison survey:
1. Briefly describe your test equipment used to measure 1 ohm standard resistors. A Guildline Model 6675 Automated DCC Resistance Bridge or a Guildline Model 9975 DCC Resistance Bridge. An L&N Thomas One Ohm, Model 42 10, with an NIST Report of Calibration. ‘Resistors are placed in a Hart Scientific oil bath, Model 7015. Guildline SCW wire (shielded copper wire, 22 AWG solid copper, twisted pair) is used to connect the standard resistors to the DCC Resistance Bridge.
2. Briefly describe your path of traceability for a 1 ohm standard resistor measurement. Traceability to NIST is established using an L&N Thomas One Ohm standard resistor, Model No. 42 10. The standard resistor is returned to NIST once a year for calibration.
3. Do you produce a measurement statement in accordance with ANSIINCSL Z540-2- 1997?
No. A Certificate of Calibration is produced in accordance with ANSUNCSL 2540-l - 1994.
4. What is the nominal temperature of you resistor bath? 25 deg C 25 degrees C +/- 0.05 degrees C
5. Do you know or record the pressure at your reference terminals of you Thomas 1 ohm resistors during the time of test?
No.
6. What type of fluid are you using in your resistor bath? White Mineral Oil. (Purchased from XXXXX.)
7. As part of your current process, do you correct for temperature and pressure of a Thomas 1 ohm resistors if the appropriate correction data is given?
No. All resistors are placed in an oil bath, which is adjusted to the temperature reported by NIST for our Thomas One Ohm, (Typically 25 degrees C.)
8. Is your organization willing/able to pay for the shipment of the artifact back to Fort Wayne Indiana after the measurement process is complete? Yes.
9. Other comments?
2000 NCSL Workshop & Symposium
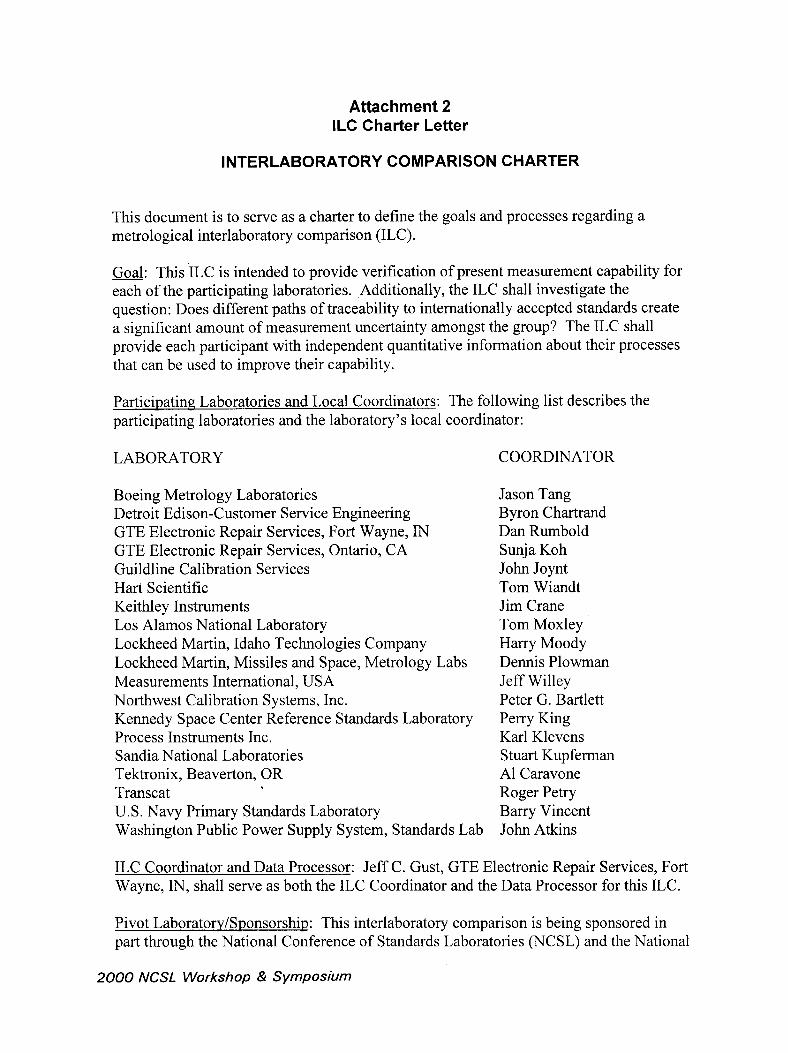
Attachment 2 ILC Charter Letter
INTERLABORATORY COMPARISON CHARTER
This document is to serve as a charter to define the goals and processes regarding a metrological interlaboratory comparison (ILC).
Goal: This ILC is intended to provide verification of present measurement capability for each of the participating laboratories. Additionally, the ILC shall investigate the question: Does different paths of traceability to internationally accepted standards create a significant amount of measurement uncertainty amongst the group? The ILC shall provide each participant with independent quantitative information about their processes that can be used to improve their capability.
Participating Laboratories and Local Coordinators: The following list describes the participating laboratories and the laboratory’s local coordinator:
LABORATORY
Boeing Metrology Laboratories Detroit Edison-Customer Service Engineering GTE Electronic Repair Services, Fort Wayne, IN GTE Electronic Repair Services, Ontario, CA Guildline Calibration Services Hart Scientific Keithley Instruments Los Alamos National Laboratory Lockheed Martin, Idaho Technologies Company Lockheed Martin, Missiles and Space, Metrology Labs Measurements International, USA Northwest Calibration Systems, Inc. Kennedy Space Center Reference Standards Laboratory Process Instruments Inc. Sandia National Laboratories Tektronix, Beaver-ton, OR Transcat
.
U.S. Navy Primary Standards Laboratory Washington Public Power Supply System, Standards Lab
COORDINATOR
Jason Tang Byron Chartrand Dan Rumbold Sunja Koh John Joynt Tom Wiandt Jim Crane Tom Moxley Harry Moody Dennis Plowman Jeff Willey Peter G. Bartlett Perry King Karl Klevens Stuart Kupferman Al Caravone Roger Petry Barry Vincent John Atkins
ILC Coordinator and Data Processor: Jeff C. Gust, GTE Electronic Repair Services, Fort Wayne, IN, shall serve as both the ILC Coordinator and the Data Processor for this ILC.
Pivot LaboratorvSponsorship: This interlaboratory comparison is being sponsored in part through the National Conference of Standards Laboratories (NCSL) and the National
2000 NCSL Workshop & Symposium
Institute of Standards and Technology (NIST). The NCSL was petitioned to apply for funding from NIST measurement services involved in this ILC. The funding was approved. NIST shall provide the beginning and ending measurement for the interlaboratory comparison. In addition, NIST shall measure the pressure coefficient for the artifact during the beginning measurement. GTE Electronic Repair Services, Fort Wayne, IN, shall assume all other pivot laboratory responsibilities.
Parameter, Range, and Target Uncertainty: The parameter for this ILC is DC Resistance, the range shall be one ohm, and the target uncertainty is two ppm or lower for measurement uncertainty. The ILC shall consist of a single artifact Thomas type one ohm resistor.
Time Frame: The artifact shall be sent to NIST in August 1998. The estimated completion is December 1999. Schedule details for individual laboratories shall be provided at a later date.
Financial Considerations: Due to the sponsorship of NIST, the only direct costs to each laboratory shall be shipping the artifact from their laboratory to GTE Electronic Repair Services, Fort Wayne, IN. Each laboratory shall assume all indirect costs involved with providing measurement and data for the ILC.
Confidentiality: The participants of this ILC shall be publicly identified, but their data and associated results are to remain confidential. Any published data will be coded so only the laboratory associated with the code shall know who they are.
All data gathered in this ILC shall be treated as confidential. There will be no disclosure or discussion regarding data gathered in this ILC with anyone except for the organization in which the data originated. Every effort shall be made to protect the confidentiality of each participating laboratory during this ILC.
Publication of Results: A formal report of the ILC shall be published and presented to the NCSL Measurement Comparison Program Committee. This report shall identify the participating laboratories, but all data will be coded. A summary of this report will be presented at either the NCSL annual conference or the Measurement Science Conference.
Each participating laboratory shall receive the formal report, and a customized report to present findings that are specific to the participating laboratory.
I HEREBY AGREE TO THE CONDITIONS OF THIS CHARTER
Jeff C. Gust, ILC Coordinator Participating Laboratory Coordinator
2000 NCSL Workshop & Symposium
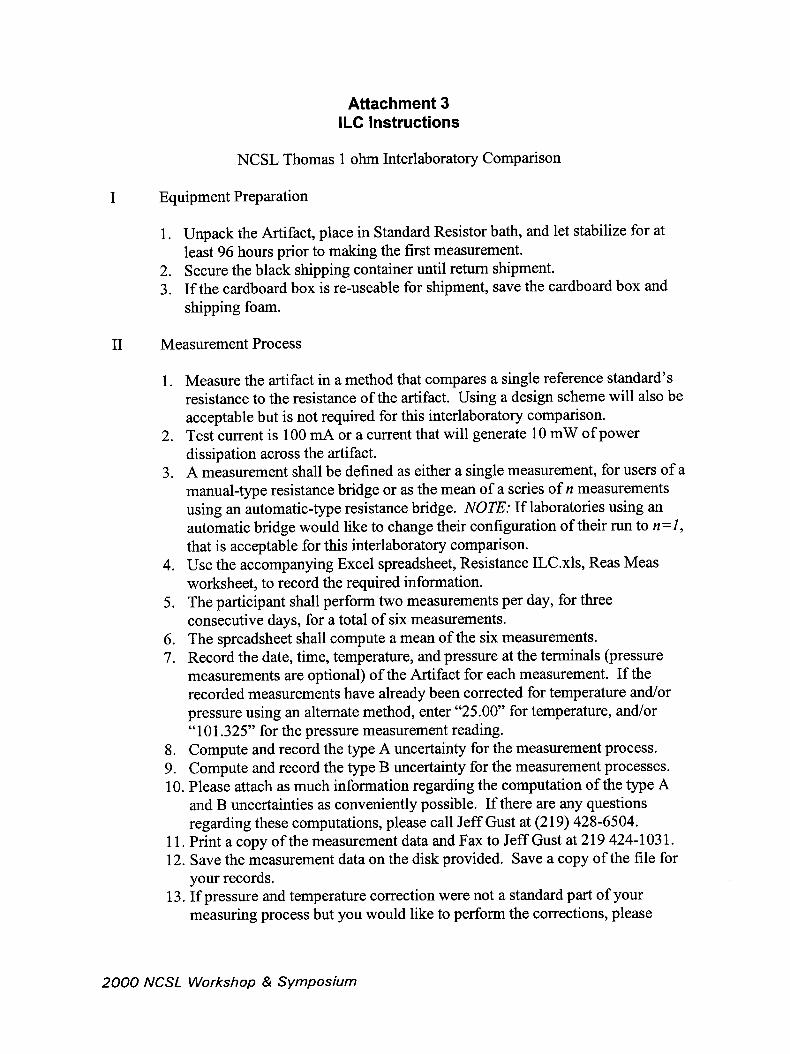
Attachment 3 ILC Instructions
NCSL Thomas 1 ohm Interlaboratory Comparison
I Equipment Preparation
1. Unpack the Artifact, place in Standard Resistor bath, and let stabilize for at least 96 hours prior to making the first measurement.
2. Secure the black shipping container until return shipment. 3. If the cardboard box is re-useable for shipment, save the cardboard box and
shipping foam.
II Measurement Process
1. Measure the artifact in a method that compares a single reference standard’s resistance to the resistance of the artifact. Using a design scheme will also be acceptable but is not required for this interlaboratory comparison.
2. Test current is 100 mA or a current that will generate 10 mW of power dissipation across the artifact.
3. A measurement shall be defined as either a single measurement, for users of a manual-type resistance bridge or as the mean of a series of n measurements using an automatic-type resistance bridge. NOTE: If laboratories using an automatic bridge would like to change their configuration of their run to n=l, that is acceptable for this interlaboratory comparison.
4. Use the accompanying Excel spreadsheet, Resistance ILC.xls, Reas Meas worksheet, to record the required information.
5. The participant shall perform two measurements per day, for three consecutive days, for a total of six measurements.
6. The spreadsheet shall compute a mean of the six measurements. 7. Record the date, time, temperature, and pressure at the terminals (pressure
measurements are optional) of the Artifact for each measurement. If the recorded measurements have already been corrected for temperature and/or pressure using an alternate method, enter “25.00” for temperature, and/or “101.325” for the pressure measurement reading.
8. Compute and record the type A uncertainty for the measurement process. 9. Compute and record the type B uncertainty for the measurement processes. 10. Please attach as much information regarding the computation of the type A
and B uncertainties as conveniently possible. If there are any questions regarding these computations, please call Jeff Gust at (219) 428-6504.
11. Print a copy of the measurement data and Fax to Jeff Gust at 219 424-l 03 1. 12. Save the measurement data on the disk provided. Save a copy of the file for
your records. 13. If pressure and temperature correction were not a standard part of your
measuring process but you would like to perform the corrections, please
2000 NCSL Workshop & Symposium
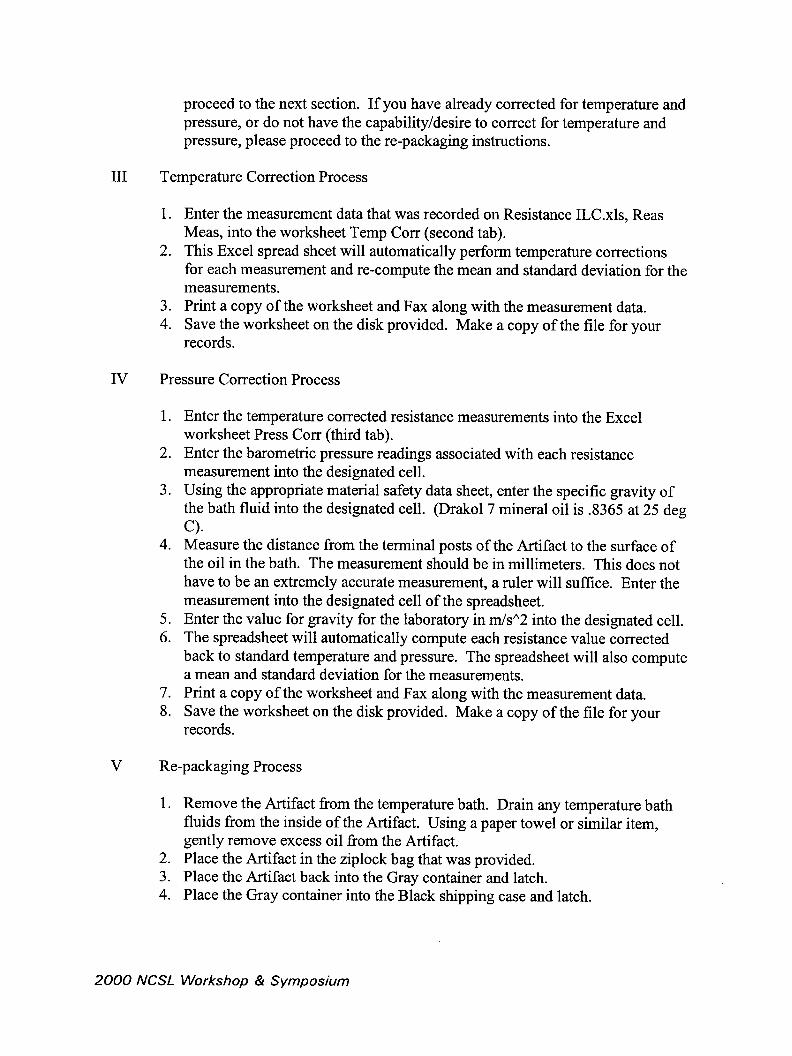
proceed to the next section. If you have already corrected for temperature and pressure, or do not have the capability/desire to correct for temperature and pressure, please proceed to the re-packaging instructions.
III Temperature Correction Process
1. Enter the measurement data that was recorded on Resistance ILC.xls, Reas Meas, into the worksheet Temp Con: (second tab).
2. This Excel spread sheet will automatically perform temperature corrections for each measurement and re-compute the mean and standard deviation for the measurements.
3. Print a copy of the worksheet and Fax along with the measurement data. 4. Save the worksheet on the disk provided. Make a copy of the file for your
records.
IV Pressure Correction Process
1.
2.
3.
4.
5. 6.
7. 8.
Enter the temperature corrected resistance measurements into the Excel worksheet Press Con- (third tab). Enter the barometric pressure readings associated with each resistance measurement into the designated cell. Using the appropriate material safety data sheet, enter the specific gravity of the bath fluid into the designated cell. (Drako17 mineral oil is .8365 at 25 deg
0 Measure the distance from the terminal posts of the Artifact to the surface of the oil in the bath. The measurement should be in millimeters. This does not have to be an extremely accurate measurement, a ruler will suffice. Enter the measurement into the designated cell of the spreadsheet. Enter the value for gravity for the laboratory in m/s”2 into the designated cell. The spreadsheet will automatically compute each resistance value corrected back to standard temperature and pressure. The spreadsheet will also compute a mean and standard deviation for the measurements. Print a copy of the worksheet and Fax along with the measurement data. Save the worksheet on the disk provided. Make a copy of the file for your records.
V Re-packaging Process
1. Remove the Artifact from the temperature bath. Drain any temperature bath fluids from the inside of the Artifact. Using a paper towel or similar item, gently remove excess oil from the Artifact.
2. Place the Artifact in the ziplock bag that was provided. 3. Place the Artifact back into the Gray container and latch. 4. Place the Gray container into the Black shipping case and latch.
2000 NCSL Workshop & Symposium
5. If the cardboard box is still useable, pack the Black shipping case back into the cardboard box, place in the box in the same manner as it was received, and seal securely.
6. If the cardboard box is no longer serviceable and your facility has the capability, pack the Black shipping case into a cardboard box with foam-in- place packing.
VI Shipping the Artifact
1. Contact Jeff Gust at (219) 428-6504 to coordinate the return shipping of the Artifact.
2. Work with your shipping department, and utilizing the shipping label attached to the instructions, ship the Artifact.
2000 NCSL Workshop & Symposium
Attachment 4 ILC Excel Datasheets
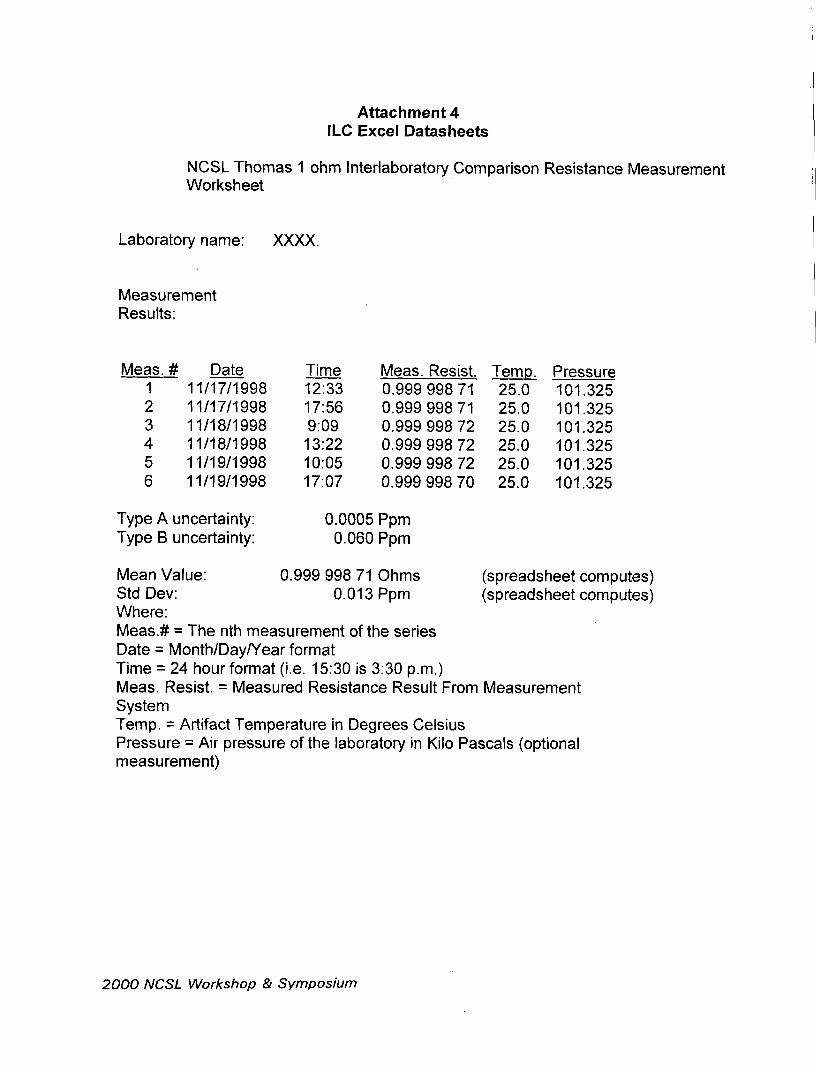
NCSL Thomas 1 ohm Interlaboratory Comparison Resistance Measurement Worksheet
Laboratory name: xxxx. II
Measurement Results:
Meas. # Date Time Meas. Resist. Temp. Pressure
1 11 /I 7/l 998 12:33 0.999 998 71 25.0 101.325
2 1 l/17/1998 17:56 0.999 998 71 25.0 101.325 3 11 /I 8/l 998 9:09 0.999 998 72 25.0 101.325
4 1 l/18/1998 13:22 0.999 998 72 25.0 101.325
5 11 /I 9/l 998 IO:05 0.999 998 72 25.0 101.325
6 1 l/19/1998 17:07 0.999 998 70 25.0 101.325
Type A uncertainty: Type B uncertainty:
0.0005 Ppm 0.060 Ppm
Mean Value: Std Dev: Where:
0.999 998 71 Ohms (spreadsheet computes) 0.013 Ppm (spreadsheet computes)
Meas.# = The nth measurement of the series Date = Month/Day/Year format Time = 24 hour format (i.e. 15:30 is 3:30 p.m.) Meas. Resist. = Measured Resistance Result From Measurement System Temp. = Artifact Temperature in Degrees Celsius Pressure = Air pressure of the laboratory in Kilo Pascals (optional measurement)
2000 NCSL Workshop & Symposium
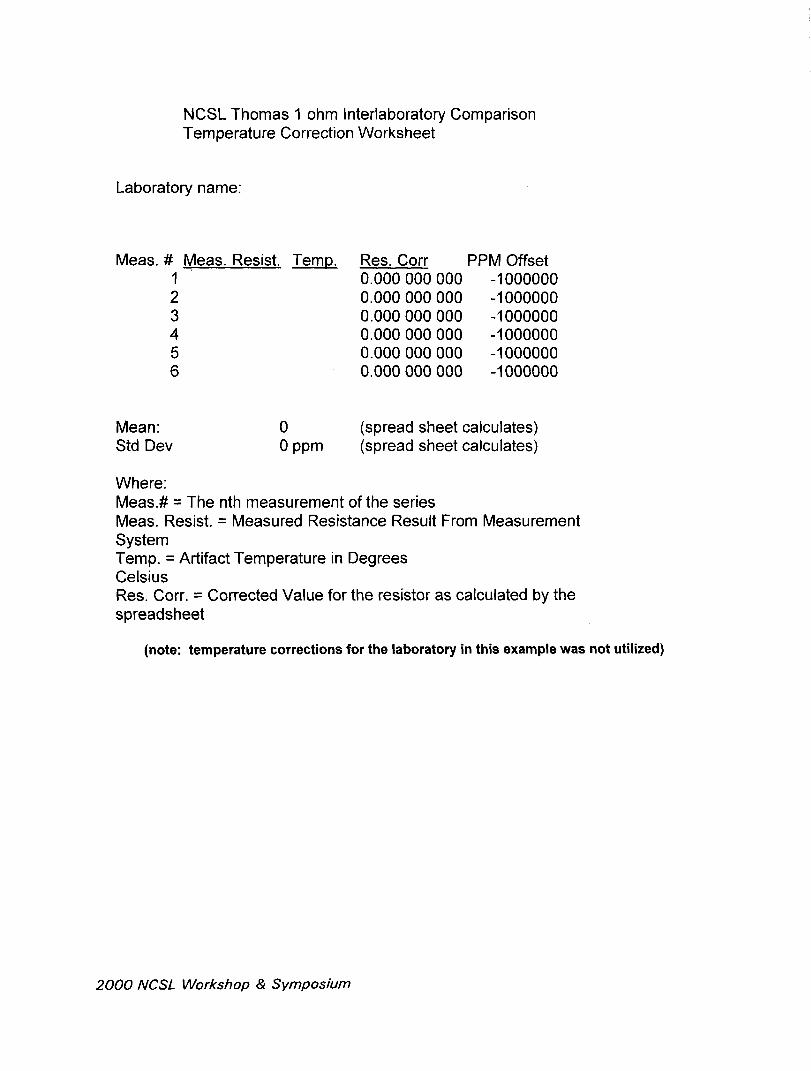
NCSL Thomas 1 ohm Interlaboratory Comparison Temperature Correction Worksheet
Laboratory name:
Meas. # Meas. Resist. Temp. Res. Corr PPM Offset 1 0.000 000 000 -1000000 2 0.000 000 000 -1000000 3 0.000 000 000 -1000000 4 0.000 000 000 -1000000 5 0.000 000 000 -1000000 6 0.000 000 000 -1000000
Mean: 0 (spread sheet calculates) Std Dev 0 PPm (spread sheet calculates)
Where: Meas.# = The nth measurement of the series Meas. Resist. = Measured Resistance Result From Measurement System Temp. = Artifact Temperature in Degrees Celsius Res. Corr. = Corrected Value for the resistor as calculated by the spreadsheet
(note: temperature corrections for the laboratory in this example was not utilized)
2000 NCSL Workshop & Symposium
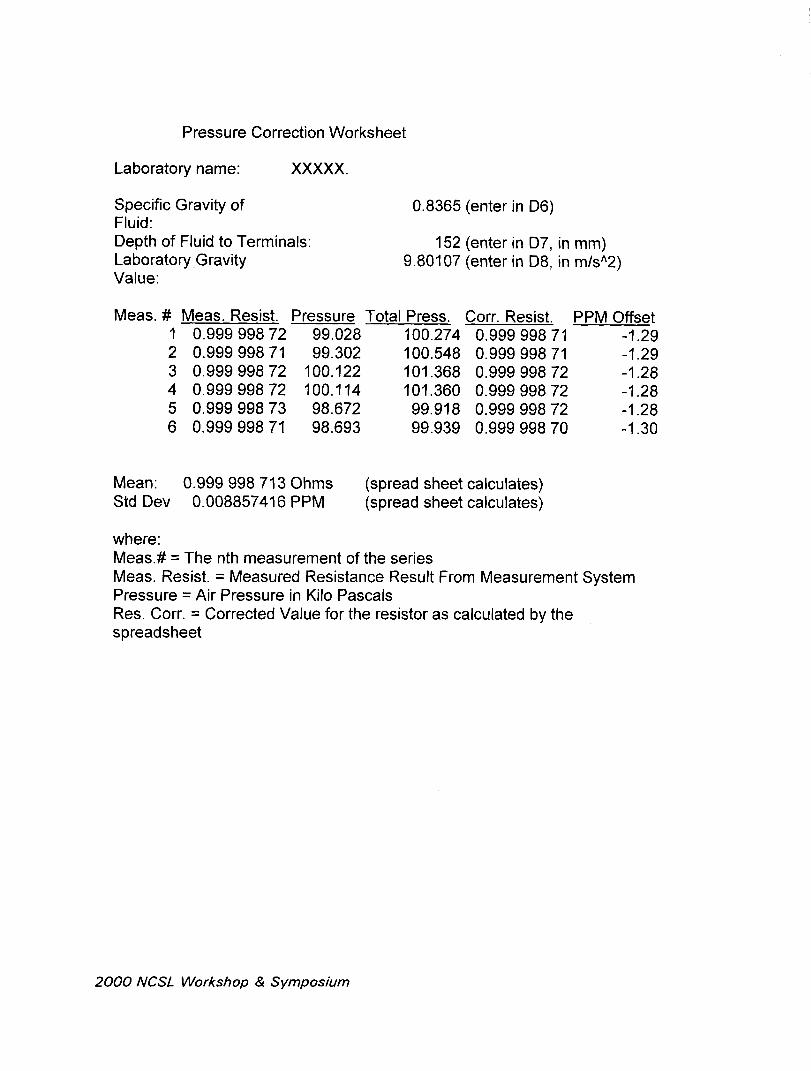
Pressure Correction Worksheet
Laboratory name: xxxxx.
Specific Gravity of Fluid:
0.8365 (enter in D6)
Depth of Fluid to Terminals: Laboratory ,Gravity Value:
152 (enter in D7, in mm) 9.80107 (enter in D8, in m/$2)
Meas. # Meas. Resist. Pressure Total Press. Corr. Resist. PPM Offset 1 0.999 998 72 99.028 100.274 0.999 998 71 -1.29 2 0.999 998 71 99.302 100.548 0.999 998 71 -1.29 3 0.999 998 72 100.122 101.368 0.999 998 72 -1.28 4 0.999 998 72 100.114 101.360 0.999 998 72 -1.28 5 0.999 998 73 98.672 99.918 0.999 998 72 -1.28 6 0.999 998 71 98.693 99.939 0.999 998 70 -1.30
Mean: 0.999 998 713 Ohms Std Dev 0.008857416 PPM
(spread sheet calculates) (spread sheet calculates)
where: Meas.# = The nth measurement of the series Meas. Resist. = Measured Resistance Result From Measurement System Pressure = Air Pressure in Kilo Pascals Res. Corr. = Corrected Value for the resistor as calculated by the spreadsheet
2000 NCSL Workshop & Symposium


![Solid State Lighting Annex: Interlaboratory Comparison ... · Solid State Lighting Annex: Interlaboratory Comparison Test Method . ... 100 Bureau Drive, MS 8442 ... , IEC 62504 [8],](https://img.pdfslide.net/doc/110x75/5b48bcf97f8b9a5e5f8cfc75/solid-state-lighting-annex-interlaboratory-comparison-solid-state-lighting.jpg)