Embed Size (px)
Citation preview

NASA / CR-1998-206933
An Investigation of Candidate Sensor-
Observable Wake Vortex StrengthParameters for the NASA Aircraft Vortex
Spacing System (AVOSS)
Christopher Rhoads Tatnall
The George Washington University,
Joint Institute for Advancement of Flight Sciences,
Langley Research Center, Hampton, Virginia
National Aeronautics and
Space Administration
Langley Research CenterHampton, Virginia 23681-2199
Prepared for Langley Research Centerunder Cooperative Agreement NCC1-24
March 1998
https://ntrs.nasa.gov/search.jsp?R=19980163014 2018-05-17T10:14:26+00:00Z

Available from the following:
NASA Center for AeroSpace Information (CASI)
800 Elkridge Landing Road
Linthicum Heights, MD 21090-2934
(301) 621-0390
National Technical Information Service (NTIS)
5285 Port Royal Road
Springfield, VA 22161-2171
(703) 487-4650

ABSTRACT
The Aircraft Vortex Spacing System (AVOSS) under development at NASA is designed to prescribe safe
and accurate aircraft landing approach separation distances. A key component of the AVOSS is a stationaryground sensor, making wake observations to verify predicted behavior. These readings would ensure safety
by giving advanced warning of unexpectedly hazardous conditions. This task requires knowledge of a
flowfield strength metric which gauges the severity of disturbance an encountering aircraft could potentiallyexperience.
Several proposed strength metric concepts are defined and evaluated for various combinations of metric
parameters and sensor line-of-sight elevation angles. Representative populations of generating and
following aircraft types are selected, and their associated wake flowfields are modeled using various wake
geometry definitions. All aircraft disturbance and metric calculations are performed applying two differentmethodologies in order to include results for all ranges of vortex intensity. Metric candidates are then rated
and compared based on the correspondence of their computed values to associated aircraft response values,using basic statistical analyses.
ACKNOWLEDGMENTS
Some of the original concepts and information used in this study can be attributed to other individuals.Both the use of a dual-vortex flowfield for computations and the fiat-plate roll moment metric were
originally proposed by Dr. Roland Bowles, a consultant and retired NASA engineer. The velocity gradient
metric concept was informally suggested by Eric Stewart, an engineer at NASA Langley. Therepresentative following and generating aircraft with accompanying data were selected from a fairly
comprehensive list of aircraft typically operating at US airports, compiled June 1995 by Robert Stuever,also an engineer at NASA Langley.
TABLE OF CONTENTS
ABSTRACT ..................................................................................................................................................... i
ACKNOWLEDGMENTS ................................................................................................................................ i
TABLE OF CONTENTS ................................................................................................................................ ii
LIST OF SYMBOLS ...................................................................................................................................... iii
LIST OF FIGURES ........................................................................................................................................ vi
1. INTRODUCTION ...................................................................................................................................... 1
2. DESCRIPTION OF MODELS ................................................................................................................... 2
Wake Vortex Flowfield .............................................................................................................................. 2
Aircraft Roll Response ............................................................................................................................... 3
Vortex Induced Aircraft Loads .............................................................................................................. 3Dynamic Model ..................................................................................................................................... 5
Candidate Flowfield Strength Metrics ........................................................................................................ 5Velocity Gradient ................................................................................................................................... 6
"Flat-Plate" Average Circulation ........................................................................................................... 6"Fiat-Plate" Roll Moment ...................................................................................................................... 7
3. ANALYSIS ................................................................................................................................................ 9
Aircraft Response Calculations .................................................................................................................. 9
Strength Metric Calculations .................................................................................................................... 10
Metric Quality Evaluation ........................................................................................................................ 11
4, RESULTS AND DISCUSSION ............................................................................................................... 13
Statistical Comparisons ............................................................................................................................ 13
Dependence on Aircraft Wing Span ......................................................................................................... 14
5. CONCLUSIONS ...................................................................................................................................... 15
REFERENCES .............................................................................................................................................. 29
ii
LIST OF SYMBOLS
b
B
C,Cr
C
Ci a , CLc_
C_nd ' CLind
C/. v , CL v
( C_v )MAX
Hs
Ixx
k
K
L
m
N
0
Pi
q
r
ra,rb
rc
rj
roc , roPi
s
Aircraft Wing Span
Vortex Pair Separation Distance
Plate Span
Aircraft Local, Root (Mid-Span) Wing Chord
Point About Which All Velocity Measurements Are Centered For a Given Metric
Aircraft Two-Dimensional, Three-Dimensional Wing Lift Curve Slopes
Total Vortex-Induced Roll Moment, Lift Coefficients for Entire Flowfield
Aircraft Roll Control Input Coefficient, Assuming Maximum Control Input
Aircraft Roll Damping Coefficient, Where Derivative is Taken With Respect to Non-
Dimensional Roll Rate-_=(_b)/(2V)
Vortex Induced Roll Moment, Lift Coefficients for Single Vortex
Maximum Possible Roll Moment Coefficient Induced on an Aircraft As It
Encounters a Given Flowfield at the "Worst-Case" Position and Bank Angle
Flat-Plate Roll Moment
Aircraft Mass-Moment-of-Inertia About the Roll Axis
Index Denoting a Metric's Order of Preference Relative to All Candidates
Total Number of Candidate Strength Metrics
Aircraft Lift
Aircraft Mass
Total Number of Pairs of Velocity Observations Used to Approximate Either Flat-
Plate Average Circulation or Roll Moment
Point Indicating the Location of the Ground Sensor
Point At Which Velocity VLOSi is Observed
Freestream Dynamic Pressure, 1 p2
V
Radial Coordinate From Point About Which Local/Average Circulation is
Inner.Outer Radial Limits Between Which Average Circulation is Determined
Vortex Core Radius
Radial Distance From Center Point C to fh Pair of Velocity Observation Points
(P/) j For Approximation of Flat-Plate Average Circulation
Distances Between Points O and C, Points O and P_
Plate-Spanwise Coordinate Used in Computing Flat-Plate Roll Moment
iii

sj
S
Sk
t
Tp
V
VLOS
WNp
WT
Wy, WZ, W_
W
(Y, Z)
oq
8r, 8s
AVLos
O
¢I)MAX
F (r)
F_
Fan (r), FL (r)
Fv (r)
_., _.v
0
P
%
(n,_)
F
G
i
J
LV, RV
Plate-Spanwise Distance From Center Point C to fh Pair of Velocity Observation
Points (e/) j For Approximation of Flat-Plate Roll Moment
Aircraft Wing Area
Score Value Assigned to k 'h Metric Based on Relative Performance
Time
Pilot Response Delay Time
Aircraft Velocity
Observed Line-of-Sight Velocity
Induced Velocity Component Normal to Plate
Induced Tangential Velocity With Respect to Vortex Center
Induced Velocity Components in the Y-, Z- and (-Directions
Aircraft Weight
Inertial Coordinates
Vortex Induced Angle of Attack
Incremental Distance Between Velocity Observation Points (P/) j With Flat-Plate
Average Circulation, Roll Moment Metrics
Distance Separating Velocity Observation Points P_ Used to Approximate Velocity
Gradient
Difference in Observed Velocities VLOS_ Used to Approximate Velocity Gradient
Aircraft Roll Angle
Maximum Aircraft Roll Disturbance Angle Experienced During a Wake VortexEncounter
Local Circulation at a Given Radius r
Total Vortex Circulation ( F (r), r ---) _o )
Local Vortex Circulation Based on Burnham-Hallock, Lamb Vortex Models
Local Circulation of a Single Vortex at a Given Radius r From Its Center
True, Observed ("Flat-Plate") Average Circulations
Taper Ratios of Flat Plate, Following Aircraft's Wing
Sensor Center Line-of-Sight Elevation Angle, Measured From Ground Level
Ambient Air Density
Sweep Angle of Sensor Line-of-Sight Associated With fh Pair of Velocity
Observation Points (Pi) j, Measured From Center Line-of- Sight roc
Aircraft Body-Fixed Coordinates
Subscripts
Refers to Wake-Encountering (Following) Aircraft
Refers to Wake-Generating (Leading) Aircraft
Index Specifying Individual Velocity Observation in a Given Pair ( i = 1,2 )
Index Specifying Pair of Velocity Observations in Total Number of Pairs Used to
Approximate Flat-Plate Average Circulation or Roll Moment (j = 1,2,3
.... N)
Denotes Positions of Left, Right Vortices in a Pair
iv

rel
V
2-D
ATC
AVOSS
IFR
NASA
TAP
UK
US
Denotes Position/Distance Specified Relative to the Vortex Center
Refers to a Single Vortex
Abbreviations
Two-Dimensional
Air Traffic Control
Aircraft Vortex Spacing System
Instrument Flight Rules
National Aeronautics & Space Administration
Terminal Area Productivity
United Kingdom
United States
LIST OF FIGURES
Figure
1.
2.
o
4.
5.
6.
7.
8.
9°
10.
11.
12.
13.
14.
15.
Illustration of method and assumptions used in computing vortex-induced aircraft response ....
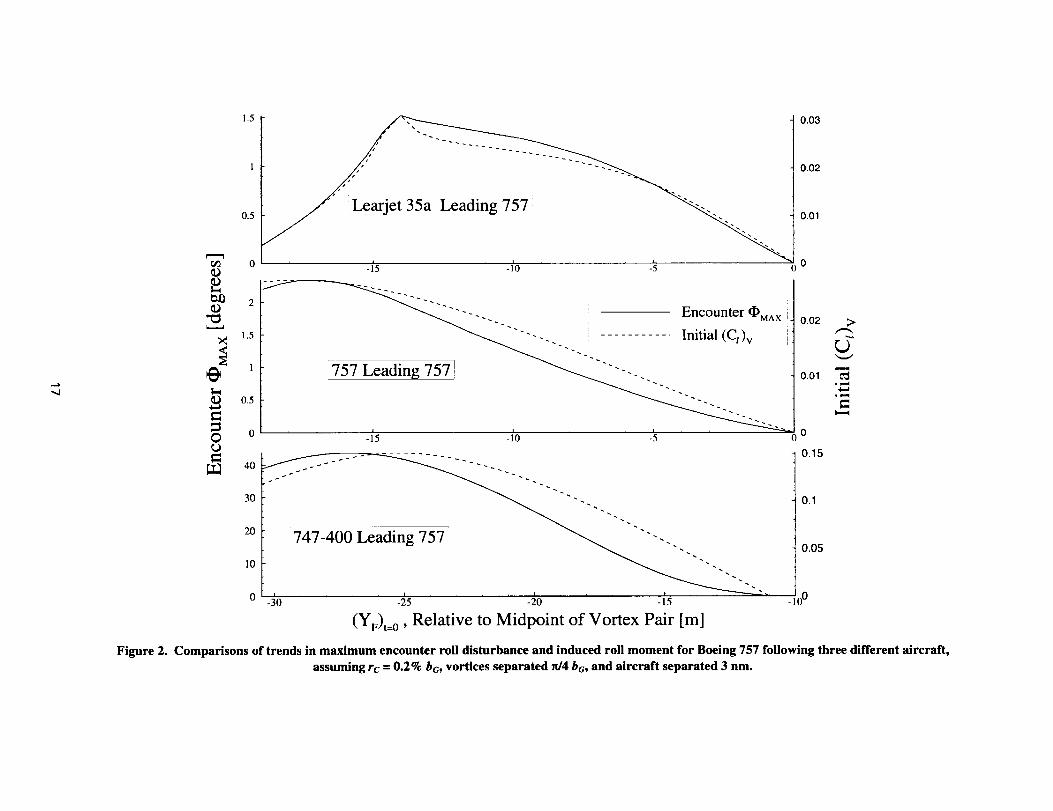
Comparisons of trends in maximum encounter roll disturbance and induced roll moment forBoeing 757 following three different aircraft, assuming rC = 0.2% bG, vortices separated
_/4 bG, and aircraft separated 3 nm ......................................................................................
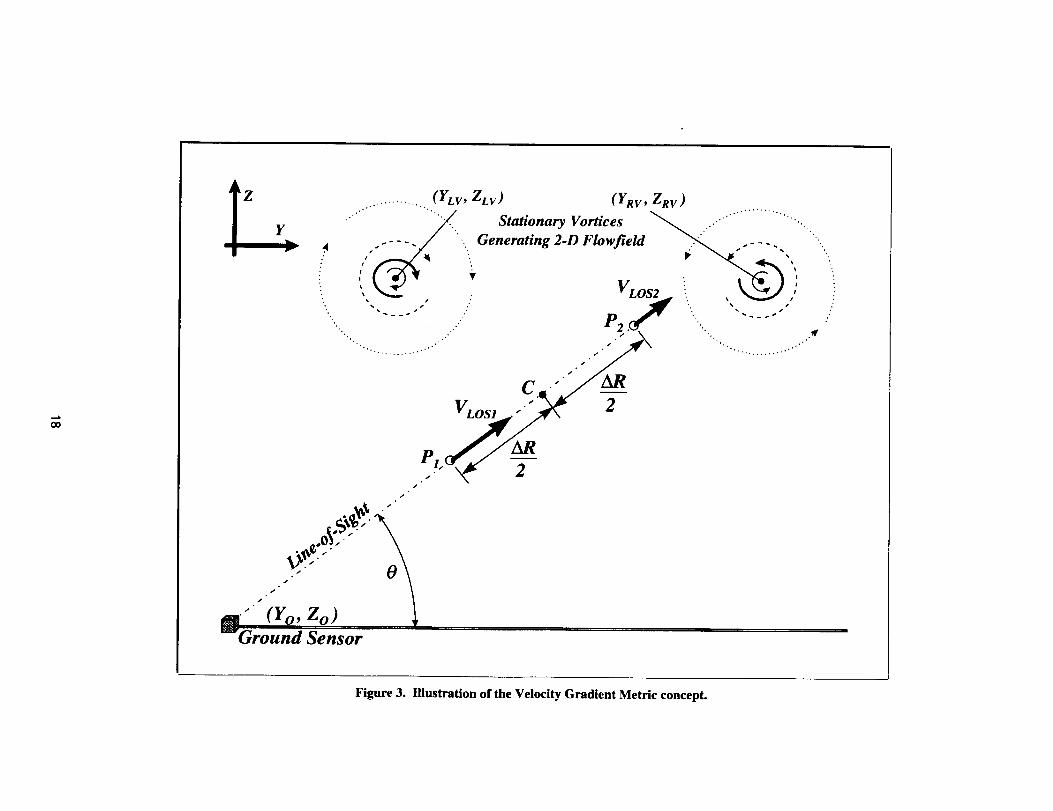
Illustration of the Velocity Gradient Metric concept ..................................................................
Illustration of the Flat-Plate Average Circulation Metric concept ..............................................
Illustration of the Flat-Plate Roll Moment Metric concept .........................................................
Representation of different approaches taken to evaluate and compare candidate metrics. In
this example, the metric corresponding to the triangle symbols is superior in predicting
only larger disturbance values ...............................................................................................
Metrics sorted in order of preference, using the constant-spacing methodology and performing
regression with all data for each metric .................................................................................
Metrics sorted in order of preference, using the fixed-disturbance methodology and computingmean and standard deviation of all data for each metric .......................................................
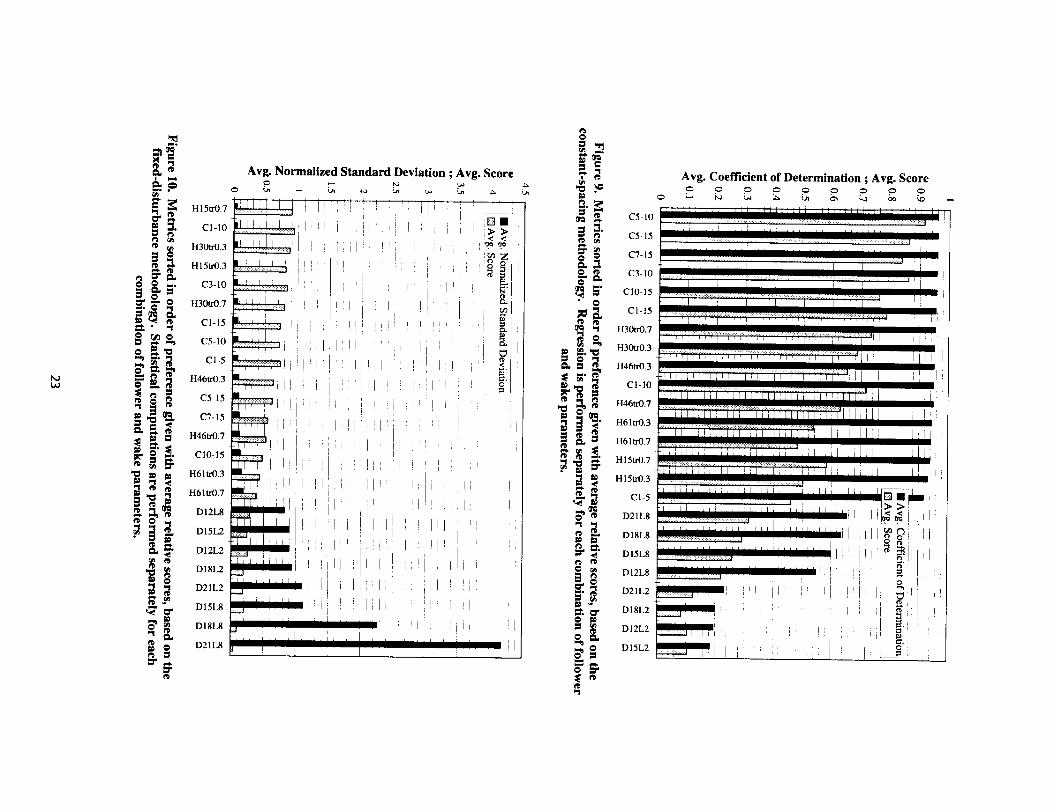
Metrics sorted in order of preference given with average relative scores, based on theconstant-spacing methodology. Regression is performed separately for each combination
of follower and wake parameters ...........................................................................................
Metrics sorted in order of preference given with average relative scores, based on the fixed-
disturbance methodology. Statistical computations are performed separately for each
combination of follower and wake parameters ......................................................................
Metrics sorted in order of preference along with average relative scores, based on the
constant-spacing methodology. Regression is performed using all combinations of wake
parameters for each individual follower ................................................................................
Metrics sorted in order of preference given with average relative scores, based on the fixed-
disturbance methodology. Statistical computations are performed using all combinations
of wake parameters for each individual follower ..................................................................
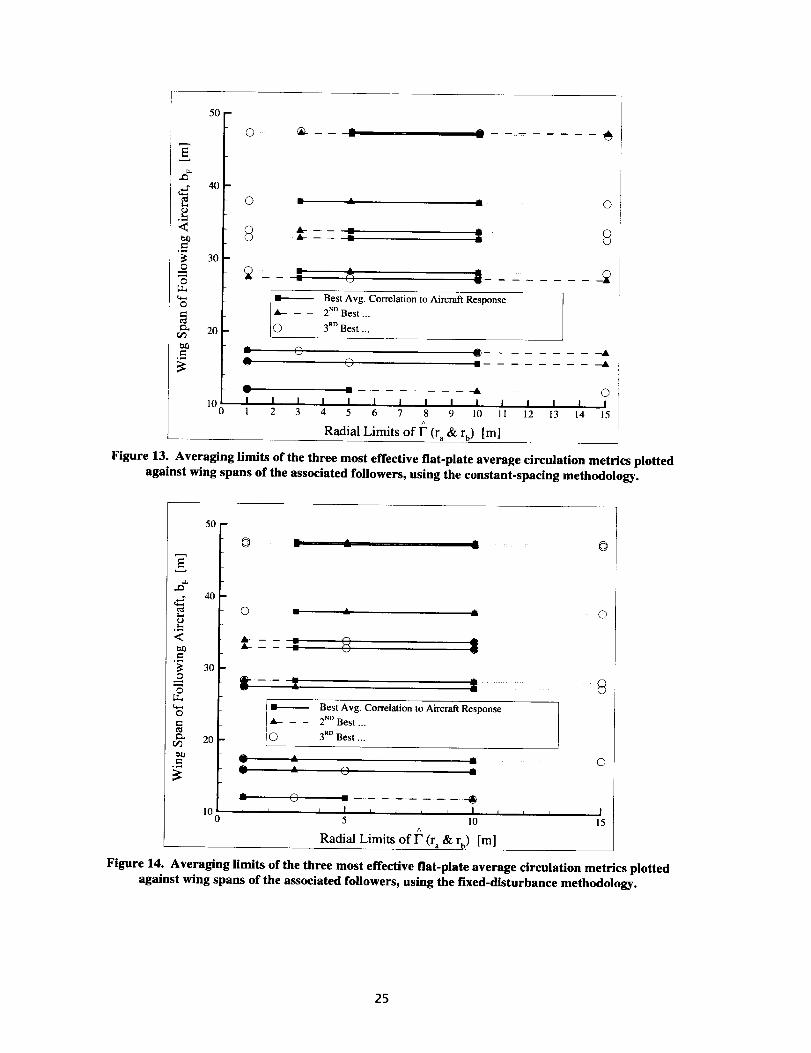
Averaging limits of the three most effective tim-plate average circulation metrics plotted
against wing spans of the associated followers, using the constant-spacing methodology ....
Averaging limits of the three most effective tim-plate average circulation metrics plottedagainst wing spans of the associated followers, using the fixed-disturbance methodology...
Plate span lengths of the three most effective fiat-plate roll moment metrics plotted against
wing spans of the associated followers, using the constant-spacing methodology ................
Page
16
17
18
19
20
21
22
22
23
23
24
24
25
25
26
vi

16.
17.
18.
19.
20.
Platespanlengthsofthethreemosteffectiveflat-platerollmomentmetricsplottedagainstwingspansoftheassociatedfollowers,usingthefixed-disturbancemethodology...............
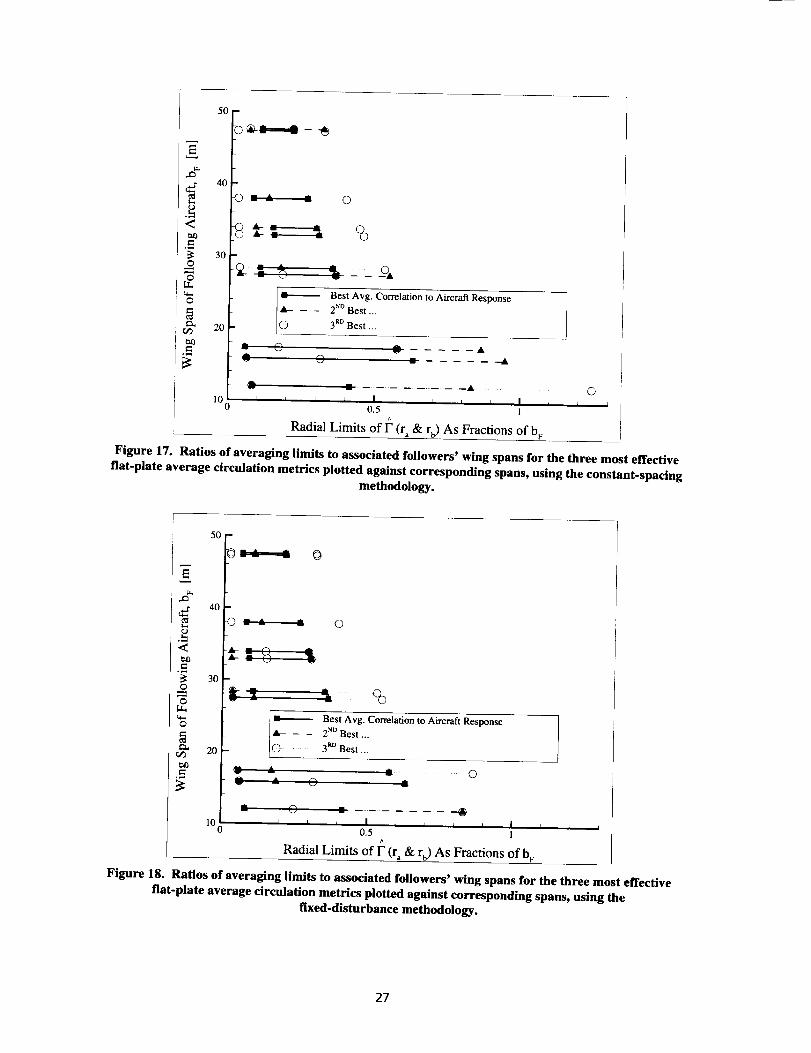
Ratiosofaveraginglimitstoassociatedfollowers'wingspansforthethreemosteffectivefiat-plateaveragecirculationmetricsplottedagainstcorrespondingspans,usingtheconstant-spacingmethodology..............................................................................................
Ratiosofaveraginglimitstoassociatedfollowers'wingspansforthethreemosteffectivefiat-plateaveragecirculationmetricsplottedagainstcorrespondingspans,usingthefixed-disturbancemethodology.............................................................................................
Ratiosofplatespanlengthstoassociatedfollowers'wingspansforthethreemosteffectivefiat-platerollmomentmetricsplottedagainstcorrespondingspans,usingtheconstant-spacingmethodology.............................................................................................................
Ratiosofplatespanlengthstoassociatedfollowers'wingspansforthethreemosteffectivefiat-platerollmomentmetricsplottedagainstcorrespondingspans,usingthefixed-disturbancemethodology.............................................................................................
26
27
27
28
28
vii

1. INTRODUCTION
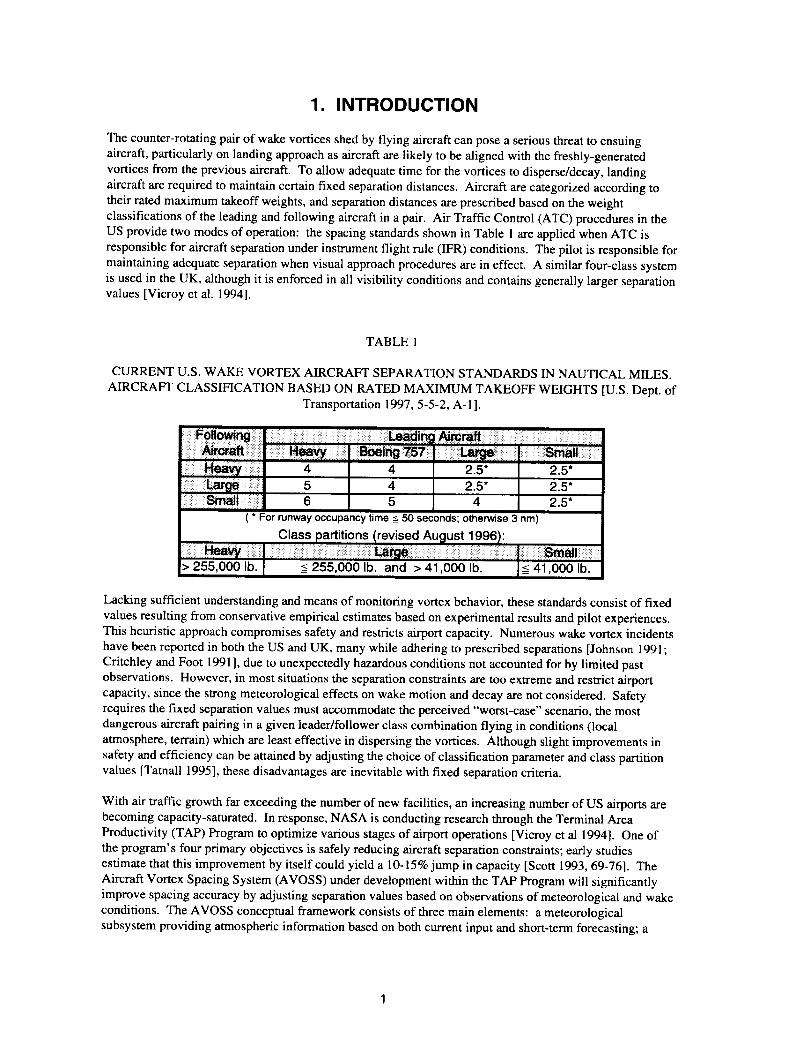
The counter-rotating pair of wake vortices shed by flying aircraft can pose a serious threat to ensuing
aircraft, particularly on landing approach as aircraft are likely to be aligned with the freshly-generated
vortices from the previous aircraft. To allow adequate time for the vortices to disperse/decay, landingaircraft are required to maintain certain fixed separation distances. Aircraft are categorized according to
their rated maximum takeoff weights, and separation distances are prescribed based on the weight
classifications of the leading and following aircraft in a pair. Air Traffic Control (ATC) procedures in theUS provide two modes of operation: the spacing standards shown in Table 1 are applied when ATC is
responsible for aircraft separation under instrument flight rule (IFR) conditions. The pilot is responsible for
maintaining adequate separation when visual approach procedures are in effect. A similar four-class system
is used in the UK, although it is enforced in all visibility conditions and contains generally larger separationvalues [Vicroy et al. 1994].
TABLE l
CURRENT U.S. WAKE VORTEX AIRCRAFT SEPARATION STANDARDS IN NAUTICAL MILES.
AIRCRAFT CLASSIFICATION BASED ON RATED MAXIMUM TAKEOFF WEIGHTS [U.S. Dept. ofTransportation 1997, 5-5-2, A-1 ].
ii!!iii:iii!i!i!iiiHeavyiiiii!ii!iiiiiii!i4 4 2.5* 2.5*
ili!iiiiii!iii!i_iii!:ii_r_iiii!_ii!_iiiiiiiiii5 4 2.5* 2.5*
!iiiiii!!iii!!iliSmalliiii_iiiiii!!iiiili!iiii6 5 4 2.5*
( * For runwayoccupancytime __<50 seconds;otherwise3 nm)
> 255,000 lb. _-<255,000 lb. and > 41,000 lb.
Lacking sufficient understanding and means of monitoring vortex behavior, these standards consist of fixed
values resulting from conservative empirical estimates based on experimental results and pilot experiences.This heuristic approach compromises safety and restricts airport capacity. Numerous wake vortex incidents
have been reported in both the US and UK, many while adhering to prescribed separations [Johnson 1991;
Critchley and Foot 1991 ], due to unexpectedly hazardous conditions not accounted for by limited past
observations. However, in most situations the separation constraints are too extreme and restrict airport
capacity, since the strong meteorological effects on wake motion and decay are not considered. Safetyrequires the fixed separation values must accommodate the perceived "worst-case" scenario, the most
dangerous aircraft pairing in a given leader/follower class combination flying in conditions (local
atmosphere, terrain) which are least effective in dispersing the vortices. Although slight improvements in
safety and efficiency can be attained by adjusting the choice of classification parameter and class partitionvalues [Tatnall 1995], these disadvantages are inevitable with fixed separation criteria.
With air traffic growth far exceeding the number of new facilities, an increasing number of US airports arebecoming capacity-saturated. In response, NASA is conducting research through the Terminal Area
Productivity (TAP) Program to optimize various stages of airport operations [Vicroy et al 1994]. One of
the program's four primary objectives is safely reducing aircraft separation constraints; early studiesestimate that this improvement by itself could yield a 10-15% jump in capacity [Scott 1993, 69-76]. The
Aircraft Vortex Spacing System (AVOSS) under development within the TAP Program will significantly
improve spacing accuracy by adjusting separation values based on observations of meteorological and wake
conditions. The AVOSS conceptual framework consists of three main elements: a meteorologicalsubsystem providing atmospheric information based on both current input and short-term forecasting; a
predictorsubsystemwhichdecidestheappropriatespacingbasedon weather, airport, and aircraft-specificfactors; a sensor subsystem to monitor the actual vortices' strength and position, providing feedback to the
predictor [Hinton 1995, 4]. Sensor readings would also ensure safety by allowing adequate notice to abort a
landing in case of unexpectedly strong wakes. This capability depends on knowledge of some wake-
flowfield parameter, a "strength metric", which quantifies the threat posed to an approaching aircraft.
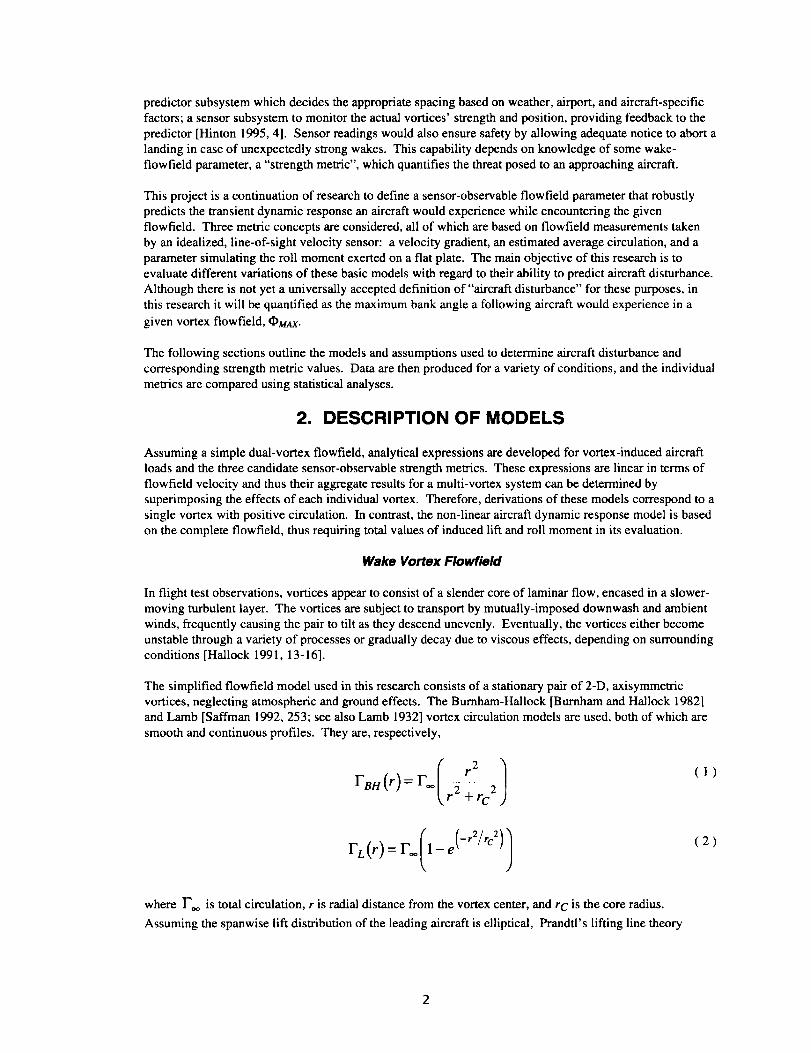
This project is a continuation of research to define a sensor-observable flowfield parameter that robustly
predicts the transient dynamic response an aircraft would experience while encountering the givenflowfield. Three metric concepts are considered, all of which are based on flowfield measurements taken
by an idealized, line-of-sight velocity sensor: a velocity gradient, an estimated average circulation, and a
parameter simulating the roll moment exerted on a flat plate. The main objective of this research is toevaluate different variations of these basic models with regard to their ability to predict aircraft disturbance.
Although there is not yet a universally accepted definition of "aircraft disturbance" for these purposes, in
this research it will be quantified as the maximum bank angle a following aircraft would experience in a
given vortex flowfield, OMAX.
The following sections outline the models and assumptions used to determine aircraft disturbance and
corresponding strength metric values. Data are then produced for a variety of conditions, and the individual
metrics are compared using statistical analyses.
2. DESCRIPTION OF MODELS
Assuming a simple dual-vortex flowfield, analytical expressions are developed for vortex-induced aircraft
loads and the three candidate sensor-observable strength metrics. These expressions are linear in terms offlowfield velocity and thus their aggregate results for a multi-vortex system can be determined by
superimposing the effects of each individual vortex. Therefore, derivations of these models correspond to a
single vortex with positive circulation. In contrast, the non-linear aircraft dynamic response model is basedon the complete flowfield, thus requiring total values of induced lift and roll moment in its evaluation.
Wake Vortex Flowfield
In flight test observations, vortices appear to consist of a slender core of laminar flow, encased in a slower-moving turbulent layer. The vortices are subject to transport by mutually-imposed downwash and ambient
winds, frequently causing the pair to tilt as they descend unevenly. Eventually, the vortices either become
unstable through a variety of processes or gradually decay due to viscous effects, depending on surroundingconditions [Hallock 1991, 13-16].
The simplified flowfield model used in this research consists of a stationary pair of 2-D, axisymmetricvortices, neglecting atmospheric and ground effects. The Burnham-Hallock [Burnham and Hallock 1982]and Lamb [Saffman 1992, 253; see also Lamb 1932] vortex circulation models are used, both of which are
smooth and continuous profiles. They are, respectively,
I2/r
FBH(r)= F_ r 2 + rc 2
(1)
l (-r2/rc2/)FL(r) = F-_l-e '_
(2)
where I-',_ is total circulation, r is radial distance from the vortex center, and rC is the core radius.
Assuming the spanwise lift distribution of the leading aircraft is elliptical, Prandtl's lifting line theory
2

estimatesthattheturbulentwakeshedfromthewingwilleventuallyrollupintotwoparallelcounter-rotatingvorticesseparatedbendistanceb- = (l_/4)b G ,each having total circulation
L G
[Karamcheti 1980, 550] where L G ,V G and b G are the lift, velocity and wing span of the generating
aircraft, respectively, and p is ambient air density. Because the generating aircraft is assumed to be in
steady-level flight, its weight WG is substituted for lift.
Here, vortex decay is represented by a uniform decrease in the total circulation, with no change in vortex
position or circulation profile. In previous work using similar models and assumptions, decreasingcirculation strength was obtained using a conservative linear decay law, which in its simplest form isexpressed
F_(t) 4W G-1- t
Foo (0) _4 pV G bG 3
[Tatnall 1995, 29-32].
(3)
(4)
Aircraft Roll Response
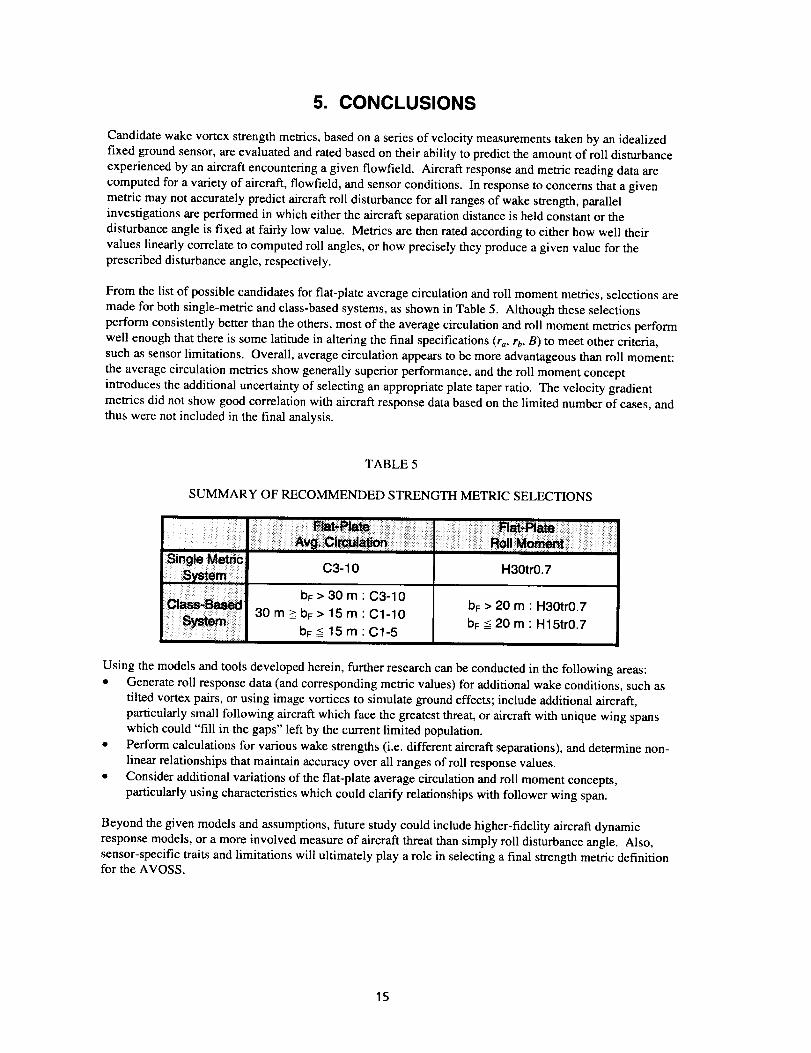
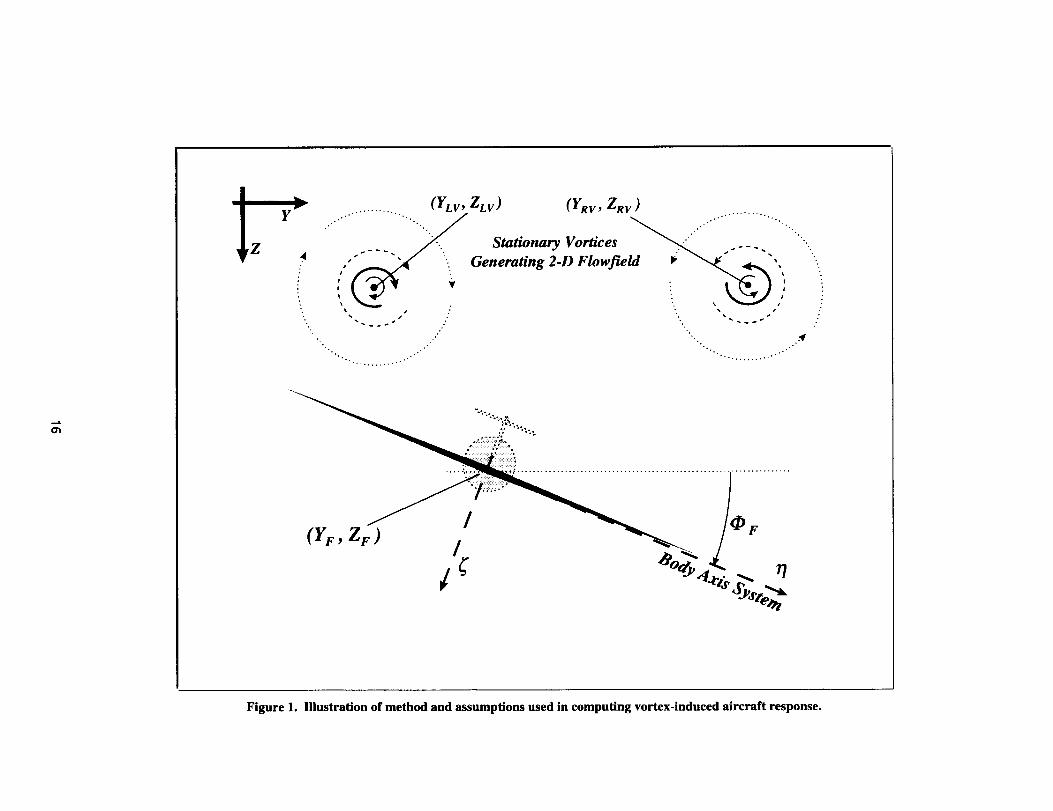
In computing the vortex induced loads during an encounter, the following aircraft is modeled as a fiat (i.e.
without dihedral or twist), linearly-tapered wing which extends to the aircraft centerline; fuselage, nacellesand tail surfaces are excluded (see Figure 1). The dynamic model allows the aircraft to roll and translate
vertically and laterally, in response to the vortex induced lift and roll moment, roll damping and pilot input.For purposes of response calculations, the inertial coordinate system is assumed to have a downward-
pointed Z-axis in keeping with aircraft stability and control conventions. As will be later noted, this isreversed for all metric calculations in keeping with metric and sensor conventions.
Vortex Induced Aircraft Loads
By definition of circulation for an axisymmetric vortex, Fv(r), the tangential velocity at some distance rfrom the center is
WTv (r)= (5)
The flowfield velocity components at a fixed location (Y,Z) induced by a vortex centered at (Yv ,Zv )
can be expressed in terms of relative coordinates (Yrel ,Zrel )= (Y- YV ,Z - Z V ):
WYv(Yrel'Zre') l I-Zrel/rre,= w, v (rre l ). f ( 6 )(Y,.W Zv • iZre I )J t rrel/rrel J
where FreI = 3f Yrel 2 -F Zrel 2 .
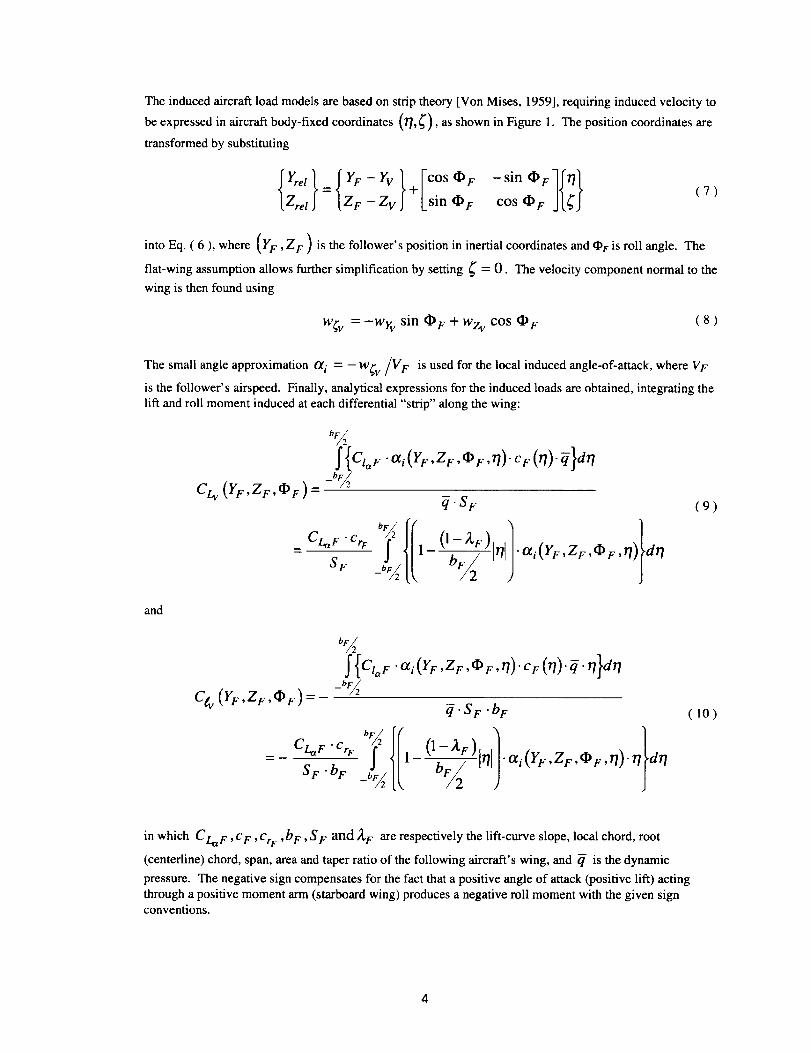
Theinducedaircraftloadmodelsarebasedonstriptheory[VonMises,1959],requiringinducedvelocitytobeexpressedinaircraftbody-fixedcoordinates(r/,(), asshowninFigure1.Thepositioncoordinatesare
transformed by substituting
Y_et}={YF--YvI+[COS_F - sin OFI_r/_Zre t ZF - Zv J Lsin • F cos • F IL(J
(7)
into Eq. ( 6 ), where (YF ,ZF ) is the follower's position in inertial coordinates and Or is roll angle. The
fiat-wing assumption allows further simplification by setting _" = 0. The velocity component normal to the
wing is then found using
w(v =-Wrv sin • F + Wzv cos • F (8)
The small angle approximation a i = - W(v/V F is used for the local induced angle-of-attack, where VF
is the follower's airspeed. Finally, analytical expressions for the induced loads are obtained, integrating thelift and roll moment induced at each differential "strip" along the wing:
_ CL_ F • CrF
SF
q" S F
(1--ZF) ].O_i(YF,ZF,OF,_)}b-_22 It/1 dr/
(9)
and
f{c,o c¢
CL_ F • CrF
S F • b F
(10)
in which fLu F ,c F ,CrF ,b F ,S F and Z F are respectively the lift-curve slope, local chord, root
(centerline) chord, span, area and taper ratio of the following aircraft's wing, and _- is the dynamic
pressure. The negative sign compensates for the fact that a positive angle of attack (positive lift) actingthrough a positive moment arm (starboard wing) produces a negative roll moment with the given signconventions.

Dynamic Model
The aircraft can roll and translate laterally and vertically in response to the induced lift and roll moment.The equations of motion are
mrYF=(WF +qSpCt.,,d)sinOe
mFZF=WF--(WF +qSFCLi,_)COS¢ F
'XX rF= S, bF[CbL+ 1L(. 2VF Cg, r + C/,.,. -Y-[(t-Tp)--_CIcF F
(11)
where m F ,WF , I XX F , CleF and C lc F are respectively the mass, weight, rolling axis mass-moment-of-
inertia, roll damping coefficient and full-input roll control coefficient of the following aircraft. The non-
linear dynamic system must be solved numerically, at each step using the complete-flowfield values for
vortex induced lift and roll moment coefficient, CLi_a and Cgi.a . These terms are simply the sums of the
respective induced lift and roll moment coefficients for individual vortices (Eqs. ( 9 ) and ( 10 )), and
therefore must be re-computed at each integration step since they are dependent on YF, Zr and OF. The
step-function used in the control input term, .q{(t - Tp), accounts for the pilot reaction time, after which
full roll-control authority is applied to level the wing. In all cases, the suggested delay of Te = 0.6 secondsis used [Tinling 1977, 11-22].
The following aircraft is assumed to encounter the wake in wings-level flight on a standard glideslope of 3degrees. The position at which the aircraft initially penetrates the wake is determined such that the greatest
encounter roll perturbation is experienced in the given flowfield conditions. Due to the non-linearity of thedynamic model, these coordinates cannot be analytically determined, and the computational cost of the
required numerical integration makes a Monte-Carlo approach impractical. An acceptable alternative usedin previous research is to insert the aircraft at the location of greatest induced roll moment [Tatnall 1995].
For limited validation of this assumption, values of induced roll moment and maximum bank angledeviations are computed for three different aircraft pairs as the follower's initial position is varied laterallywith respect to the midpoint of the vortex pair. As shown in Figure 2, the initial follower locations
corresponding to the greatest values of aircraft disturbance and highest initial roll moment show excellent
agreement for all three aircraft pairs. Thus, the initial values for Eqs. ( 11 ) used in all cases are
--• F =0
}:'e = 0
2 F =- g F tan 3°
_F =0
(12)
t=0
Candidate Flowfield Strength Metrics
The three types of parameters for assessing potential aircraft disturbance in a given flowfield are all based
on a series of discrete line-of-sight velocity measurements taken by a stationary ground sensor. Velocities
oriented away from the sensor are considered positive, and sensor-specific limitations are neglected. Also,the inertial coordinate system used for all metric calculations is oriented such that the Z-axis is directed
upward. This discrepancy in the coordinate systems used for aircraft response and metric values is

insignificantsincetheintentis torelatethemagnitudes of each. With this axis system, positive circulationis counter-clockwise.
Velocity Gradient
This metric model is based on the line-of-sight velocity gradient at a point C, approximated over the length
dR, as shown in Figure 3. In order to locate the observation points, their polar coordinates relative to the
ground sensor are first determined:
roc=_(Yc-Yo) 2 +(ZC-ZO) 2 ;O=tan-'(Zc-Z° I rcro(13)
so the distances from the ground sensor to the measurement points are rop _ = roc - ARA and
rop 2 = roc + ARA . Transforming back to Cartesian coordinates, the observation points are located at
(YPi 'Zei ): (YO + roe i c°sO,Zo + roei sinO) i: 1,2.
The velocity components at each point, (WYvi ,WZv i )i = 1,2, induced by a vortex at (Yv ,Zv) such
that (greli,Zreli)=(Ypi - gv,ZPi -Zv) and rreli : _/greli 2 -t- Zreli2 i = 1,2,can be computed
using Eqs. ( 5 ) and ( 6 ). Finally, the observed line-of-sight velocities
VLosi = wry i cos0+ Wzv i sin0 i = 1,2, are used to calculate the gradient metric:
AV_.os VLOS2 -- VLOS_ (1,*)
AR AR
"Flat-Plate" Average Circulation
The principle of this metric is to estimate the average of the velocity circulation values around a given
center point C between the radial limits ra and rb , based on a series of pairs of discrete tangential velocity
observations. The definition of average circulation is given as:
IF(r)dr
Fra,r b -- rarb -- ra
(15)
where l"(r) is the local circulation at radius r. However, actual circulation can only be determined with
complete knowledge of the 2-D velocity flowfield in the given region, which is impossible to obtain with a
stationary line-of-sight sensor. Therefore, an alternative method is used wherein the circulation at a givenradius is approximated as the mean of the observed tangential velocities. In this manner, the integral in Eq.
( 15 ) can be solved numerically using the discrete pairs of velocity observations to estimate the localcirculations at each of N discrete radii. This flow field parameter is distinguished as "fiat-plate" average
circulation because it resembles the effect of measuring the velocities traversing an imaginary plate. As
shown in Figure 4, a fixed sensor cannot actually measure tangential velocities crossing a fiat plate located
some finite distance away. As the sensor's sweep angle _ increases for each tangential velocitymeasurement, the observation points diverge from the flat plate, forming an elliptical arc instead.
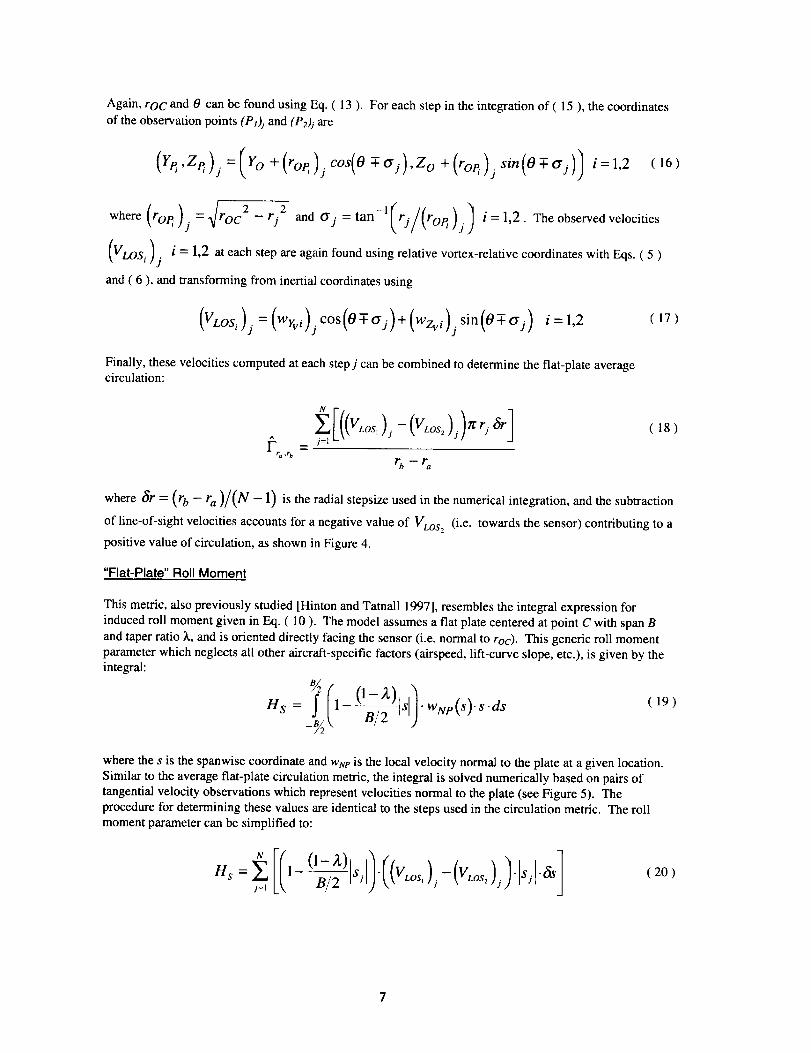
Again,roc and 0 can be found using Eq. ( 13 ). For each step in the integration of ( 15 ), the coordinates
of the observation points (P.'b and (P2b are
+(ro )jcos(O 1/1: (16)
where(ro ),/ro: an, O,=tan'(rj/(ro )jl eo se e w,ocitie VLo ) at each step are again found using relative vortex-relative coordinates with Eqs. ( 5 )i 1,2
si j
and ( 6 ), and transforming from inertial coordinates using
(',:.o_i)--(w.,.)cos(O_o,)+(w_,.)sin(O_,_,)i--,.2 (17)
Finally, these velocities computed at each stepj can be combined to determine the flat-plate averagecirculation:
r_,_
N
rb-r a
(18)
where _r = (r b - ra )/(N - 1) is the radial stepsize used in the numerical integration, and the subtraction
of line-of-sight velocities accounts for a negative value of Vt.os 2 (i.e. towards the sensor) contributing to a
positive value of circulation, as shown in Figure 4.
"Flat-Plate" Roll Moment
This metric, also previously studied [Hinton and Tatnall 1997], resembles the integral expression for
induced roll moment given in Eq. ( 10 ). The model assumes a fiat plate centered at point C with span B
and taper ratio k, and is oriented directly facing the sensor (i.e. normal to roc). This generic roll momentparameter which neglects all other aircraft-specific factors (airspeed, lift-curve slope, etc.), is given by theintegral:
HS=_( 1 (l_/_2)[s[I.wNp(s).s.ds (19)__,,,
where the s is the spanwise coordinate and woe is the local velocity normal to the plate at a given location.Similar to the average fiat-plate circulation metric, the integral is solved numerically based on pairs of
tangential velocity observations which represent velocities normal to the plate (see Figure 5). The
procedure for determining these values are identical to the steps used in the circulation metric. The rollmoment parameter can be simplified to:
(20)
7
where sj is the spanwise distance from C in either direction for the fh step, _ = (B/2)/(N - 1) is the
stepsize, and the subtraction accounts for negative values of VLos2 (i.e. towards sensor) contributing to
positive values for roll moment (see Figure 5).
8

3. ANALYSIS
Using a representative aircraft population, induced bank angle data are generated for numerous flowfield
conditions based on the assumptions and methods previously outlined. Strength metric data are also
computed for each of the corresponding wakes, using variations of the three basic metric models. Simplestatistical techniques are then applied to determine correlation between aircraft roll disturbance and metric
data, allowing the candidate metrics to be quantitatively rated and compared.
Aircraft Response Calculations
To account for unpredictable or variable wake characteristics, all aircraft response and metric calculations
are repeated for a variety of conditions. To keep the amount of data manageable, the representative lists of
leading and following aircraft were each narrowed to 10, as given in Tables 2 and 3, respectively. Theselection criteria were:
• Generally uniform coverage of the weight categories, with the leading aircraft list biased towards theheavier models and follower list biased towards the smaller ones, excluding general aviation aircraft
• Fair representation of the different aircraft manufacturers
• Inclusion of aircraft of particular interest, such as the Boeing 747-400 which is presently the heaviest in
the US commercial fleet, and the Boeing 757-200 which has been the subject of past controversy due toits "high-lift" landing capabilities supposedly generating unusually hazardous wakes.
In all cases, the basic flow field structure is a symmetrical pair of vortices located on either side of the origin
((Yv,Zv)=(+b/2, 0)). Aircraft response calculations for all leader/follower pairs from the lists are
repeated for 12 combinations of flowfield parameters: both the Lamb and Burnham-Hallock profiles are
used with 3 different core-radii (rc = 2%, 4% and 6% of bG) and 2 vortex separation distances ( b = (rd4)bc
and (3rt/8)ba). Total circulation is determined using Eqs. ( 3 ) and ( 4 ), where vortex decay time is found
by assuming a constant aircraft separation distance of 3 nm and converting to time using the generator' s
velocity only, Vc. In some operational scenarios, the actual distance-to-time conversion may also dependon the follower's velocity, Ve [Tatnall 1995, 44]. However, modeling the flowfield exclusively based on
the characteristics of the generating aircraft yields acceptable results, and greatly reduces the amount of
metric data since there are only 10 unique strengths (Foo) for each of the 12 cases previously mentioned.
In previous research, a linear relationship between strength metric and aircraft roll-disturbance values,computed based on a flowfields of fixed strengths, did not show good correlation with wakes that were half
as strong [Hinton and Tatnall 1997, 15]. Although this inconsistency can be attributed to non-linearity in
the aircraft response model, it also raises the issue that a given strength memc may only correlate well toaircraft response in a certain range of flowfield strength. Therefore, additional calculations are made in
which wake strength is based on a constant follower roll response of 10 degrees for all aircraft pairs, ratherthan a fixed separation distance. With no analytical solution for the maximum encounter roll disturbance,the vortex strength required for each aircraft pair must be found numerically. Also, now that the flowfield is
a result of both generator and follower, metric values will have to be computed for all aircraft paircombinations.

TABLE 2
LIST OF LEADING (WAKE-GENERATING) AIRCRAFT STUDIED, WITH PERTINENT DATA.
64.3
60.9,
47.3,
59.51
47.3
47.5;
37.9
32.9:
28.4
23.4
TABLE 3
LIST OF FOLLOWING (WAKE-ENCOUNTERING) AIRCRAFT STUDIED, WITH PERTINENTDATA.
164,881 10,646,544 47.34 358.7 0.30 4.70 _ I -0.407 0.062
129,274 6,394,037 47.58 1283.4 0.27 4.98 ' -0.447 0.051
95,254 4,314,213 37.95 181.3 0.23 4.97 -0.462 0.060
64,501 1,491,400 33.921 122.4 0.25 5.14 h, I -0.512 0.640
62,369 1,038,557 32.92! 1579 0.30 4.81 _ I -0.451 0.029
46,720 585,713 28.351 102.0 0.34 4.95 _ I -0.498 0.030
18,144 203,373 27.43! 56.2 0.48 5.43 ' -0.650 0.0686,940 22,642 12.04! 23.5 0.56 4.69 ___ I -0.440 0.020
6,577 42,030 15.85 I 25.2 0.38 5.19 ' -0.560 0.034I
Fairchild SA-?.2.7 Metro 6,577 6,350 39,319 17.37 i 28.7 0.33 5.24 , -0.554 0.032
Strength Metric Calculations
The complete list of 24 candidate metrics, shown in Table 4, is comprised of variations on the 3 basic
metric models outlined in the previous section. The metric names are assigned such that gradient,circulation, and roll moment metrics begin with the letters "D", "C", and "H" respectively, and denote the
key properties of each specific metric (see Table 4). The values used for dR and B appear haphazard
because the original computations were performed in British units, in which these lengths were chosen asuniform multiples of feet.
10
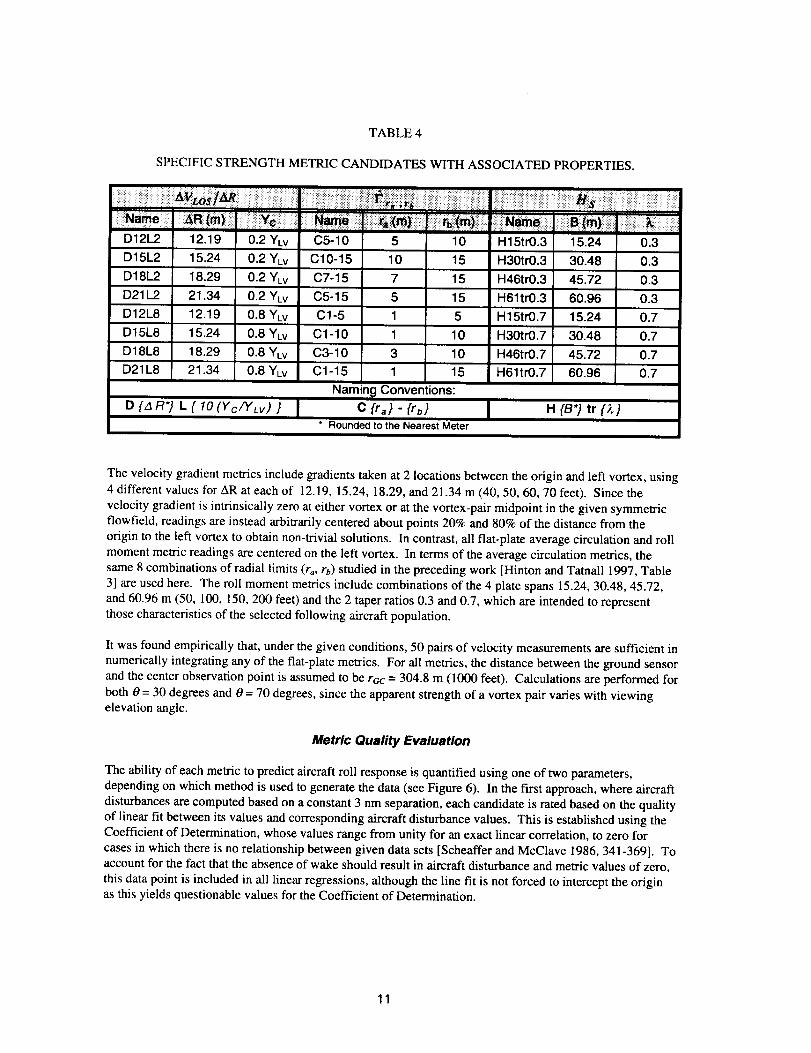
TABLE 4
SPECIFIC STRENGTH METRIC CANDIDATES WITH ASSOCIATED PROPERTIES.
D12L2 12.19 0.2 YLV C5-10 5 10 H15tr0.3 15.24 0.3
D15L2 15.24 0.2 YLV C 10-15 10 15 H30tr0.3 30.48 0.3
D18L2 18.29 0.2 YLV C7-15 7 15 H46tr0.3 45.72 0.3
D21L2 21.34 0.2 YLV C5-15 5 15 H61tr0.3 60.96 0.3
D12L8 12.19 0.8 YLV C1-5 1 5 H15tr0.7 15.24 0.7
D 15L8 15.24 0.8 YLv
D18L8 18.29 0.8 YLV
D21 L8 21.34 0.8 YLV
D {A R*} L { 10 (Yc/YLv) }
C1-10 1 10 H30tr0.7 30.48 0.7
C3-10 3 10 H46tr0.7 45.72 0.7
C1-15 1 15 H61tr0.7 60.96 I 0.7Naming Conventions:
C {ra} - {re} H {B*} tr {X}* Roundedtothe NearestMeter
The velocity gradient metrics include gradients taken at 2 locations between the origin and left vortex, using4 different values for AR at each of 12.19, 15.24, 18.29, and 21.34 m (40, 50, 60, 70 feet). Since the
velocity gradient is intrinsically zero at either vortex or at the vortex-pair midpoint in the given symmetricflowfield, readings are instead arbitrarily centered about points 20% and 80% of the distance from the
origin to the left vortex to obtain non-trivial solutions. In contrast, all flat-plate average circulation and roll
moment metric readings are centered on the left vortex. In terms of the average circulation metrics, the
same 8 combinations of radial limits (ra, rb) studied in the preceding work [Hinton and Tatnall 1997, Table
3] are used here. The roll moment metrics include combinations of the 4 plate spans 15.24, 30.48, 45.72,
and 60.96 m (50, 100, 150, 200 feet) and the 2 taper ratios 0.3 and 0.7, which are intended to representthose characteristics of the selected following aircraft population.
It was found empirically that, under the given conditions, 50 pairs of velocity measurements are sufficient in
numerically integrating any of the fiat-plate metrics. For all metrics, the distance between the ground sensor
and the center observation point is assumed to be rc,c = 304.8 m (1000 feet). Calculations are performed for
both 0 = 30 degrees and 0 = 70 degrees, since the apparent strength of a vortex pair varies with viewingelevation angle.
Metric Quality Evaluation
The ability of each metric to predict aircraft roll response is quantified using one of two parameters,depending on which method is used to generate the data (see Figure 6). In the first approach, where aircraft
disturbances are computed based on a constant 3 nm separation, each candidate is rated based on the quality
of linear fit between its values and corresponding aircraft disturbance values. This is established using theCoefficient of Determination, whose values range from unity for an exact linear correlation, to zero for
cases in which there is no relationship between given data sets [Scheaffer and McClave 1986, 341-369]. Toaccount for the fact that the absence of wake should result in aircraft disturbance and metric values of zero,
this data point is included in all linear regressions, although the line fit is not forced to intercept the originas this yields questionable values for the Coefficient of Determination.
11

However,thismethodologyisnotapplicablewiththesecondmethodwhichisbasedon fixed aircraft roll
response values of 10 degrees for all cases. Instead, metric quality is assessed by the amount of scatter in agiven set of metric values, based on the principle that a good metric should give consistent readings for the
same value of aircraft bank angle. This is determined using standard deviation, normalized by the absolutevalue of the mean to facilitate comparison of different metric types.
Statistical analyses are repeated for 3 different "cuts" of the data: analyses are performed on all data foreach of the two methodologies, so that there are a total of 2400 data points in each set; separate analyses are
performed for each combination of the 10 following aircraft and the 12 wake geometry descriptions, so that
there are 120 individual subsets each containing 20 data points; analyses are performed for each followingaircraft in all wake conditions, so that there are 10 subsets each with 240 data points.
Because the ultimate objective is to rate the relative worth of the various strength metrics, each metric is
assigned a "score" based on its position in a list of metrics sorted in order of preference (either descendingorder of Coefficient of Determination, or ascending order of Normalized Standard Deviation). A simple
method for scoring the candidates is to assign values between unity and zero which linearly decrease in
magnitude with decreasing order of preference. This metric score parameter is:
S k =1(k - 1) ( 21 )
K
in which K is the total number under consideration and k is the sorted order of each individual. This
parameter is useful where separate analyses are performed on individual subsets of data and the resultsaveraged. Averaging the scores from each analysis gives insight on how consistently a given metric
performed, rather than drawing conclusions simply based on the final mean values for each metric.
12

4. RESULTS AND DISCUSSION
With raw aircraft response and metric data produced using the models and constraints previously described,
statistical analyses are applied to different groupings based on combinations of following aircraft andflowfield geometry conditions. Also, trends are studied between geometric properties of the mostsuccessful metrics and associated followers' wing spans.
Statistical Comparisons
As an initial cut, data for all aircraft, flowfield conditions and sensor elevation angles (2400 data points) are
grouped together for each metric, with the statistical results for each of the 2 analytical procedures shown in
Figure 7 and Figure 8. Generally, the results indicate weak relationships between aircraft response andmetric values. Coefficient of Determination values are less than half of that indicating a good fit, and
although Normalized Standard Deviation does not have a specific ideal value, most of the values are nearlyan order of magnitude greater that those found in subsequent data reduction. Neither of the statistical
indicators is explicitly tied to the size of the data set; rather, the poor results indicate that no single strengthmetric relationship can be reasonably used for all following aircraft and flowfield conditions. However,
several trends in relative metric quality are evident, the most apparent being that the various flat-plate
average circulation and roll moment selections perform similarly, while all of the gradient metrics showsignificantly weaker correlation. More specifically, trends indicate that gradient metric performance
increases as observations are made closer to a given vortex. Also, it appears that smaller values of zlR are
preferable for near-vortex measurements, whereas larger zlR values are favored when observations are made
closer to the midpoint of the vortex pair. However, further analysis is required for an acceptable strengthmetric choice to emerge.
Another perspective is gained by subdividing the data into groups corresponding to each of the 10 followingaircraft and 12 combinations of wake geometry parameters (i.e. 120 subsets of 20 values each). For each
subset, comprised of data corresponding to the 10 leading aircraft and 2 different sensor elevation angles,
quality (Coefficient of Determination, Normalized Standard Deviation) is computed for all metrics; they arethen assigned a score using Eq. ( 21 ) based on their relative performance. The average results of these
individual sub-analyses are given in Figure 9 and Figure 10, applying the constant-spacing and fixed-
disturbance techniques respectively. The general quality of fit shows significant improvement becausestatistical relationships are determined for individual data subsets rather than processing all data
concurrently. As shown in the figures, the average scores do not decrease monotonically with descending
order of preference. This is because a candidate could rank above (or below) another in only a fewindividual cases, but by sufficient margins to achieve a greater (or lower) average quality rating. Still, the
prevailing trend in average scores is mostly consistent with overall metric quality, indicating that metric
performance is fairly robust with respect to variation in the wake characteristics and the encountering
aircraft. Despite its statistical advantages, however, this data reduction technique does not offer a practicalsolution. There is almost complete disagreement between the constant-spacing and fixed-disturbance
investigations in terms of metric preference. Furthermore, a consistently good quality of fit does not ensurethat a metric would use the same relationship to predict values for all combinations of wake parameters and
following aircraft; a set of strength metric functions covering all possible conditions would be excessive.
As a compromise between the first two cuts, data is partitioned such that analyses are performed for each
individual following aircraft in all combinations of flowfield settings (i.e. 10 subsets of 240 values each).
The average quality ratings and scores for these 10 cases are shown in Figure 11 and Figure 12. Overall,metric quality remains high; most of the Coefficients of Determination remain above 0.9, and the
Normalized Standard Deviation values are less than double the previous values. Also, there is much greatercorrespondence between metric rankings obtained under constant-spacing and fixed disturbance
assumptions. In previous research, when only considering relatively large following aircraft and strong
wakes it was determined that the "C5-10" metric was the best choice for predicting aircraft response[Hinton and Tatnall 1997, 17]. However, the results here indicate that "C3-10" is the best overall choice
for the full range of aircraft sizes and wake strengths, considering both average quality and average score
13
values. Of the roll moment metrics, the best overall choice is "H30trO.7", although the average circulation
metrics appear to offer generally better performance.
It can also be observed that the trend in average score is fairly sporadic for both methodologies, showing asignificant variation in relative metric performance with type of following aircraft. This suggests the
possibility of improved prediction capability with a class-based system of metrics determined by some
property of the following aircraft. Also, further efforts to refine these metrics could benefit from knowledgeof direct relationships between characteristics of the metrics and encountering aircraft.
Dependence on Aircraft Wing Span
Wing span is selected as the aircraft property for comparison purposes mainly because of its strongrelationship to the induced loads which cause the aircraft disturbance. Additionally, span has the advantage
of being a fixed value for each aircraft type, whereas mass-based quantities (i.e. weight and mass moment-
of-inertia) are unpredictable due to varying amounts of fuel, cargo and/or passengers. Because the averagequality values of the most preferable circulation and roll moment metrics are nearly identical, the top 3
metrics of each type in each of the two methodologies are selected for study in order to more completely
represent trends. Due to consistently poor performance, the velocity gradient metrics are excluded from
further study.
The first comparisons are made between wing span values and the averaging limits (ra, rb) of the three best
flat-plate average circulation metrics for each individual analysis, as shown in Figure 13 and Figure 14. Itappears that both inner and outer limits decrease with shorter follower wing span, particularly for values of
be < 30 m. Also, there is a general decrease in the averaging limits for the fixed-disturbance cases. The
plots confirm that "C3-10" would be the optimal choice for a single metric system. However, trendsindicate that assigning different metrics to given ranges of following aircraft could improve results. Based
on the limited pool of aircraft and averaging radius combinations, a 3-class system emerges wherein"C3-10" is used when by > 30 m, "CI-10" when 15 m < be < 30 m, and "C1-5" when br -_<15 m. It should
also be observed that the averaging limits also decrease with wake strength, suggesting that the "C5-10"
metric would not necessarily be the optimum choice even if smaller aircraft are ignored.
Similar comparisons are made between follower span and plate span used in the flat-plate roll moment
metrics, as presented in Figure 15 and Figure 16. The values of optimal plate span generally decrease withfollower wing span, which is expected since this basic metric model is designed to represent the roll
moment induced on a follower's wing. In the same respect, however, it is surprising that almost all of the
top-ranking roll moment metrics use a taper ratio of 0.7 despite the fact the most of the following aircraft
have taper ratios around 0.3 and the highest values are around 0.5. While it would be reasonable to select"H30tr0.7" for use in a single metric system, patterns indicate that 2-class system, in which "H30tr0.7" is
used for be > 20 m and "HI 5tr0.7" for be <- 20 m, could offer better results.
To further investigate relationships between wing span and the optimal radial averaging limits used in the
fiat-plate average circulation metric (ra, rb), these values are plotted are plotted as fractions of follower wing
span in Figure 17 and Figure 18. The inner radius values appear to fluctuate around roughly 10% of thefollower's wing span; although harder to distinguish due to the limited number of possible choices, the outer
radius values range from around 20-60%, but seem to center on 30-40% of the follower's span. Similarly,
the ratios of plate spans (B) to follower wing span are plotted in Figure 19 and Figure 20. Both figuresindicate a direct correspondence between follower wing span and plate span.
14
5. CONCLUSIONS
Candidate wake vortex strength metrics, based on a series of velocity measurements taken by an idealizedfixed ground sensor, are evaluated and rated based on their ability to predict the amount of roll disturbance
experienced by an aircraft encountering a given flowfield. Aircraft response and metric reading data are
computed for a variety of aircraft, flowfield, and sensor conditions. In response to concerns that a givenmetric may not accurately predict aircraft roll disturbance for all ranges of wake strength, parallelinvestigations are performed in which either the aircraft separation distance is held constant or the
disturbance angle is fixed at fairy low value. Metrics are then rated according to either how well their
values linearly correlate to computed roll angles, or how precisely they produce a given value for theprescribed disturbance angle, respectively.
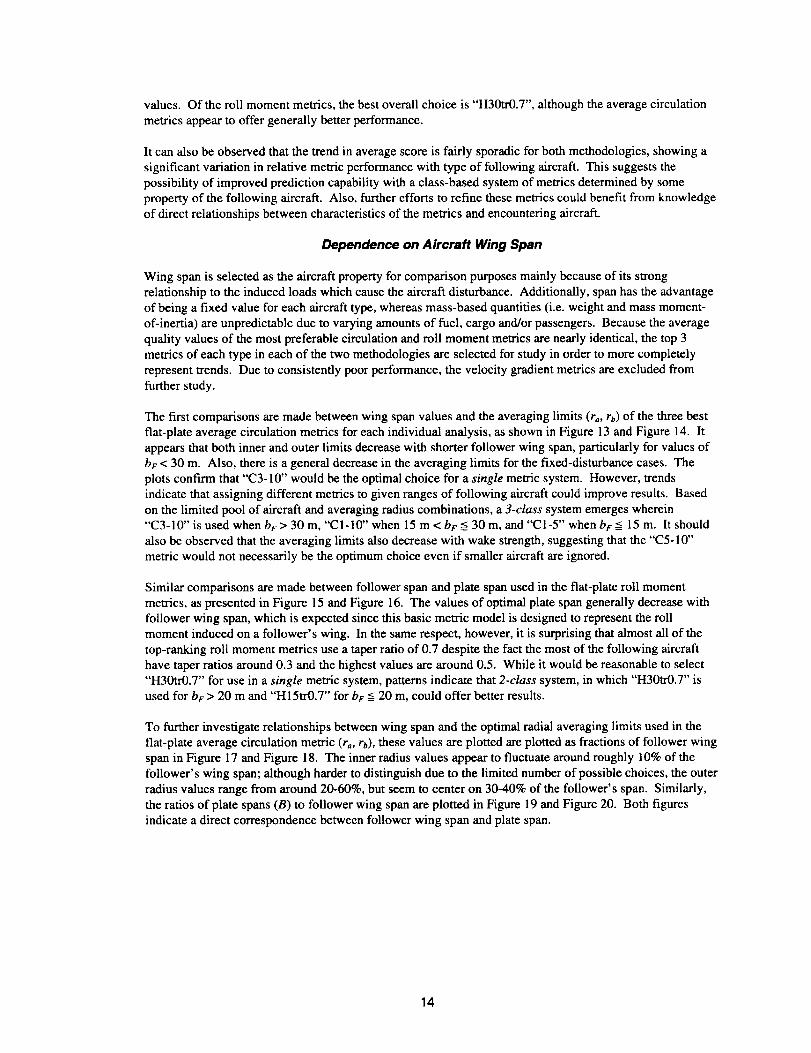
From the list of possible candidates for flat-plate average circulation and roll moment metrics, selections are
made for both single-metric and class-based systems, as shown in Table 5. Although these selections
perform consistently better than the others, most of the average circulation and roll moment metrics performwell enough that there is some latitude in altering the final specifications (ra, rb, B) to meet other criteria,
such as sensor limitations. Overall, average circulation appears to be more advantageous than roll moment:
the average circulation metrics show generally superior performance, and the roll moment concept
introduces the additional uncertainty of selecting an appropriate plate taper ratio. The velocity gradientmetrics did not show good correlation with aircraft response data based on the limited number of cases, andthus were not included in the final analysis.
TABLE 5
SUMMARY OF RECOMMENDED STRENGTH METRIC SELECTIONS
C3-10 H30tr0.7
bE > 30 rn : C3-10
30 m __>bE > 15 rn : C1-10
bF =<15 rn : C1-5
bF > 20 rn : H30trO.7
bF _-<20 m : H15tr0.7
Using the models and tools developed herein, further research can be conducted in the following areas:
• Generate roll response data (and corresponding metric values) for additional wake conditions, such as
tilted vortex pairs, or using image vortices to simulate ground effects; include additional aircraft,
particularly small following aircraft which face the greatest threat, or aircraft with unique wing spanswhich could "fill in the gaps" left by the current limited population.
• Perform calculations for various wake strengths (i.e. different aircraft separations), and determine non-
linear relationships that maintain accuracy over all ranges of roll response values.
• Consider additional variations of the fiat-plate average circulation and roll moment concepts,
particularly using characteristics which could clarify relationships with follower wing span.
Beyond the gwen models and assumptions, future study could include higher-fidelity aircraft dynamic
response models, or a more involved measure of aircraft threat than simply roll disturbance angle. Also,
sensor-specific traits and limitations will ultimately play a role in selecting a final strength metric definitionfor the AVOSS.
15
.=_
O_
I(YLv, Z,v) (FRy, ZRv)
., ...' ......... ".,...%. _. "''* ..... .....'" ',...%
Stationary Vortices '.
wfield _ _ "-- "" "s • .
• " " " Generating 2-D Flo " " 'I " t I "*
'. • • "
x, , _s S ." ', _-._ ."
.* ".o. ..
"'... . .. "'.. ........ ..."• ... ....... .
Figure 1. Illustration of method and assumptions used in computing vortex-induced aircraft response.
1.5 0.03
1 "" - ........ 0.02
0.5 0.01
o , i -"5, i i -"o, .... -5 i i o o
2,._ -... Encounter OMA X 0.02 >
""_ 1.5 ---- -. --i _" "'" _ "'---- - _- - ..... Initial (C l )v _'_'_
e 1 757 Leading 7571 0.01 •,,,-_:S
• ,s-,,I
0.5
o ' ' -_5 -lo -5 o o
10
0 -30 -25 -20 -15 "' -100
(YF)t---o, Relative to Midpoint of Vortex Pair [m]
Figure 2. Comparisons of trends in maximum encounter roll disturbance and induced roll moment for Boeing 757 following three different aircraft,
assuming rc = 0.2% be, vortices separated rd4 be, and aircraft separated 3 nm.
O0
_Y 4
(YLv, ZLv) (YRv, ZRv )..... ........ ... . . . ...
Generating 2-D Flowfield
: ( ".O• * V, os2 _ k ".'_.Z. . _
% ,'" l'J2 o_ ".
• .. '*..... ... ""
°
•p,._.s,.. _"" _ 2
Ground Sensor
Figure 3. Illustration of the Velocity Gradient Metric concept.

L Stationary Vortices
Generating 2-D Flowfield
Reference"Flat Plate"
+ (VLos1) j
Figure 4. Illustration of the Flat-Plate Average Circulation Metric concept.

0
Stationary Vortices
Generating 2-D Flowfield
-'Ground Sensor
Figure 5. Illustration of the Fiat-Plate Roll Moment Metric concept.

...t
10 °,
O _ i A
o _ O_ A .
/ °y
/
s Unknown non-linear relationship
• between roll disturbance and metric
t values for entire range of wake strengths!
Fixed-Disturbance Technique 1
• -AO 0 - -G -A- -0 _ O0 .......... A&- .... -& - --
I
Metric Value
Figure 6. Representation of different approaches taken to evaluate and compare candidate metrics. In this example, the metric corresponding to thetriangle symbols is superior in predicting only larger disturbance values.

"O r_
O
O
C3-10
C5-10
C1-15
H30trO.7
CI-10
H3Otr0.3
C5-15
H46trO.3
C7-15
H46tr0.7
C10-15
Hl5tr0.7
H611_'0.3
H15tr0.3
H61tr0.7
C1-5
DI2L8
DISL2
DI8L2
DI2L2
D21L2
DI5L8
D18L8
D21L8
Normalized Standard Deviationto
0
_°
• 0
• m°
0
Cb
Coefficient of Determination
• _ _,_
C3-10
H46tr0.3
H15tr0.3
C5-10
H46tr0.7
H61tr0.3
C5-15
C1-5
C7-15
H61tr0.7
C10-15
D 12L8
D15L8
DI8L8
D21L8
D21L2
i ID18L2
:I
b,,,I1,o
Avg. Normalized Standard Deviation ; Avg. Score
0
&
0
0
0 "I
0
0 gl,
C5 I0
,n.C5-15
C7-15
C3-10
C10-15
C1-15
H30tr0.7
H30trO.3
H46tr0.3
CI-10
H46tr0.7
H61tr0.3
H61tr0.7
H15trO.7
Hl5tr0.3
C15
D21L8
D18L8
DI5L8
DI2L8
D21L2
DISL2
D12L2
D15L2
Avg. Coefficient of Determination ; Avg. Score

l',,J
CI-IO
H3OtrO.3
C3-10
H3Otr0.7
C1-15
C5-10
Avg. Normalized Standard Deviation ; Avg. Score
I
i
i i
I
IilJ
D12L2
D21L2
D15L8
D18L8
D21L8
Avg. Coefficient of Determination ; Avg. Score
E
u.
$.w
<
c-
o
o
O
_L
..=
5O
4O
o
830
_-__
20
I10; 1
0 _--- = ----
= A .L
--- Best Avg. Correlation to Aircraft Response
2 NDBest ...RD
3 Best ...
O
8
O _ --_O _ --_
; --A OI I I I I I I I I I I I I i2 3 4 5 6 7 8 9 10 11 12 13 14 15
A
Radial Limits of l" (ra & rb) [m]
Figure 13. Averaging limits of the three most effective flat-plate average circulation metrics plottedagainst wing spans of the associated followers, using the constant-spacing methodology.
a,
(.)
<
..=
_o
0
r_
50-
40
3o
2o
O : l L ..... ©
O - A .L O
- - = 811w
Best Avg. Correlation to Aircraft ResponseND
2 Best ...RD3 Best ...
.I. 4. 0_ 0 .L
oI- " O : .................... -_lO i i i i I i i i i I i L i i I5 10 15
A
Radial Limits of F (r & rb) [m]
Figure 14. Averaging limits of the three most effective flat-plate average circulation metrics plottedagainst wing spans of the associated followers, using the fixed-disturbance methodology.
25

50-
Z
40_-c_t-,O
<ca_
..30
0L_
0e..
_ 20
10
; 6
_- ©
_,_ Best Avg. Correlation to Aircraft Response-- - 2 NDBest...
iO 3 RDBest ...
"-- ............. O
" ©
I I I I I I I J I I I h h h I L L i _ I d J J , il 0 20 30 40 50
Plate Span Used in H s (B) [m]
Figure 15. Plate span lengths of the three most effective flat-plate roll moment metrics plotted
against wing spans of the associated followers, using the constant-spacing methodology.
50-
e_40
c_t.,C_
<
.=__: 30
o
0
_ 20
_o
10'0
_" ©
l:_ Best Avg. Correlation to Aircraft Response-- - 2 ND Best ...
IO 3 aD Best
I h k I I I h I I I I I t I I I I t I I I I I I I10 20 30 40 50
Plate Span Used in H s (B) [m]
Figure 16. Plate span lengths of the three most effective fiat-plate roll moment metrics plotted
against wing spans of the associated followers, using the fixed-disturbance methodology.
26
5O
40
E
© .--.,h,--.-a o
< _- _ oo
_._ [_ ] I---I- Best Avg. Correlation to Aircraft Response
_- tA-- - - 2'_° Best ...
_= 20_- /o _ 3 _Best .._--__
=_ [-2 o _. ...... ,,t'" o = ......
o_ _ = ................. • .......I0 I I I I I I I I I I ,0.5 1
A
Radial Limits of F (ra& rb) As Fractions of bF
OI
Figure 17. Ratios of averaging limits to associated followers' wing spans for the three most effective
flat-plate average circulation metrics plotted against corresponding spans, using the constant-spacingmethodology.
E
¢J
<_o
..=
"5iL,
=
50-
401-
-7.i _.j w
30 I-
r;-
20
10 n k I0
O
o
Best Avg. Correlation to Aircraft Response
2_D Best ...
3 a° Best ...
r_v .k
0 = .............. --_
I I I r I _ I I0.5 1
A
RadialLimitsofF (r& rb)As FractionsofbF
I I I
Figure 18. Ratios of averaging limits to associated followers' wing spans for the three most effective
flat-plate average circulation metrics plotted against corresponding spans, using thefixed-disturbance methodology.
27

50 -
Z L
40
c.)
<
3O
20
" O
m -- -- %
O
Best Avg. Correlation to Aircraft Response
_-- -- - 2 red Best...
O 3 R° Best ...
= ....... .-_
" O
I,,,,' .... I .... i .... I .... I .... I .... I .... I .... '''"-.L5_27100.25 0.5 0.75 1 1.25 1.5 1.75 2 2.25 2.5
Plate Span Used in H s (B) As Fraction of b F
Figure 19. Ratios of plate span lengths to associated followers' wing spans for the three most
effective fiat-plate roll moment metrics plotted against corresponding spans, using the constant-
spacing methodology.
E
<
.=.
_o-6
@
e_o.=.
5O
40!
3O
2O
10 o
0
--. %
------- Best Avg. Correlation to Aircraft Response2 NDBest ...
lO .... 3 RDBest ,..
A •
d. ................... O
_IiLLIILIJ JI_JJlLii¢I'_''IiLn'ILL''ILI'¢Iit JLI_'J_I
0.25 0.5 0.75 1 1.25 1.5 1.75 2 2.25 2.5 2.75
Plate Span Used in H s (B) As Fraction of b F
Figure 20. Ratios of plate span lengths to associated followers' wing spans for the three most
effective flat-plate roll moment metrics plotted against corresponding spans, using the
fixed-disturbance methodology.
28
REFERENCES
Burnham, D. C., and Hallock, J. N. 1982. Chicago Monostatic Acoustic Vortex Sensing System. Vol. 4,Wake Vortex Decay. Springfield, VA: National Technical Information Service.
Critchley, J. B., and Foot, P. B. 1991. United Kingdom Civil Aviation Authority Database: Analysis ofIncidents Reported Between 1972 and 1990" In Proceedings of the Aircraft Wake Vortice,_
Conference, Washington, DC, October 29-31, 1991, Vol. 1, by the National Technical InformationService. Springfield, VA: National Technical Information Service.
Hallock, J.N. 1991. Aircraft Wake Vortices: An Assessment of the Current Situatio,. Cambridge, MA:U.S. Department of Transportation, Research and Special Programs Administration. DOT-FAA-RD-90-29.
Hinton, David A. 1995. Aircraft Vortex Spacing System (AVOSS) Conceptual Design. NASA TechnicalMemorandum 110184.
Hinton, David A., and Tatnall, Christopher R. 1997. A Candidate Wake Vortex Strength Definition forApplication to the NASA Aircraft Vortex Spacing System (AVOSS). NASA TechnicalMemorandum 110343.
Johnson, Amanda. 1991. Trends in wake vortex incidents. In Proceedings of the Aircraft Wake Vortices
Conference, Washington, DC, October 29-31, 1991, Vol. I, by the National Technical InformationService. Springfield, VA: National Technical Information Service.
Karamcheti, Krishnamurty. 1980. Principles of Ideal-Fluid Aerodynamics. New York: Wiley, 1966;reprint, Malabar, FL: Krieger Publishing Co. (page references are to reprint edition).
Lamb, H. 1932. Hydrodynamics, 6th Ed. Cambridge University Press.
Saffman, P.G. 1992. Vortex Dynamics. Cambridge University Press.
Scheaffer, Richard L., and McClave, James T. 1986. Probability and Statistics for Engineers, 2nd Ed.Boston: Duxbury Press.
Scott, William B. Technology, Economics, Fuel, Public-Private Cooperation. Aviation Week & SpaceTechnology, June 7, 1993.
Tatnall, Christopher R. 1995. A Proposed Methodology for Determining Wake-Vortex Imposed AircraftSeparation Constraints M.S. thesis, George Washington University.
Tinling, Bruce E. 1977. Estimation of Vortex-Induced Roll Excursions Based on Flight and Simulation
Results. In Proceedings of the aircraft wake-vortices conference held at Kendall Square,Cambridge, MA, March 15-17, 1977, edited by J. N. Hailock.
29

U.S.Departmentof Transportation. Federal Aviation Administration. 1997. Air Traffic Control7110.65K. [Washington, D.C.]: U. S. Department of Transportation, Federal Aviation
Administration.
Vicroy, Dan; Bowles, Roland; Brandon, Jay; Greene, George; Jordan, Frank, Jr.; Rivers, Robert; Stewart,Eric; Stough, H. Paul, III and Stuever, Robert. 1994. NASA Wake Vortex Research. ICAS-94-
6.2.2, 19th Congress of the International Council of the Aeronautical Sciences, Anaheim, CA, 19-
23 September 1994.
Von Mises, R. 1959. Theory of Flight. New York: Dover Publications.
30

31

REPORT DOCUMENTATION PAGE FormApp,o,,_OMB No. 0704-0188
Public reporting burden for this collection of informa_on is estimated to average 1 hour per response, including the time for reviewing instructions, searching exis1_ngdatasources, gathering and maintaining the data needed, and completing and raviev_ng the collection of information. Send comments regarding this burden estimate or any otheraspect of this collection of information, ir,cluding suggestions for reducing this burden, to Washington Hea(:k:luarters Services, Directorate for Information Operations endReports, 1215 Jefferson Davis Highway, Suite 1204, Arlington, VA 22202-4302, and to the Office of Management and Budget, Paperwork Reduc_on Proiest (0704-0188),
Washington, DC 20503.
1. AGENCY USE ONLY (Leave blank) 2. REPORT DATE 3. REPORT TYPE AND DATES COVERED
March 1998 Contractor Report
4. TITLE AND SUBTITLE 5. FUNDING NUMBERS
An Investigation of Candidate Sensor-Observable Wake Vortex StrengthParameters for the NASA Aircraft Vortex Spacing System (AVOSS)
6. AUTHOR(S)
Christopher R. Tatnall
7. PERFORMING ORGANIZATION NAME(S) AND ADDRESS(ES)
George Washington UniversityJoint Institute for Advancement of Flight SciencesLangley Research CenterHampton, VA 23681-2199
9. SPONSORING/MONITORING AGENCY NAME(S) AND ADDRESS(ES)
National Aeronautics and Space AdministrationLangley Research Center
Hampton, VA 23681-2199
NCC 1-24538-04-11-11
8. PERFORMING ORGANIZATION
REPORT NUMBER
10. SPONSORING/MONITORING
AGENCY REPORT NUMBER
NASA/CR- 1998-206933
11.SUPPLEMENTARYNOTESA Professional Degree Project submitted to the faculty of The School of Engineering and Applied Science ofThe George Washington University in partial satisfaction of the requirements for the degree of Professional
Engineer. Langley Technical Monitor: David Hinton.1211. DISTRIBUTION/AVAILABILITY STATEMENT
Unclassified-Unlimited
Subject Category 03 Distribution: StandardAvailability: NASA CASI (301) 621-0390
12b. DISTRIBUTION CODE
13. ABSTRACT (Maximum 200 words)
The counter-rotating pair of wake vortices shed by flying aircraft can pose a threat to ensuing aircraft,particularly on landing approach. To allow adequate time for the vortices to disperse/decay, landing aircraft arerequired to maintain certain fixed separation distances. The Aircraft Vortex Spacing System (AVOSS), underdevelopment at NASA, is designed to prescribe safe aircraft landing approach separation distances appropriateto the ambient weather conditions. A key component of the AVOSS is a ground sensor, to ensure safety bymaking wake observations to verify predicted behavior. This task requires knowledge of a flowfield strengthmetric which gauges the severity of disturbance an encountering aircraft could potentially experience. Severalproposed strength metric concepts are defined and evaluated for various combinations of metric parameters andsensor line-of-sight elevation angles. Representative populations of generating and following aircraft types areselected, and their associated wake flowfields are modeled using various wake geometry definitions. Strengthmetric candidates are then rated and compared based on the correspondence of their computed values to
associated aircraft response values, using basic statistical analyses.
14.SUBJECTTERMS
wake vortex; aviation safety; airport operations;
aircraft stability and control; wake vortex sensing
17. SECURITY CLASSIFICATION
OF REPORT
Unclassified
18. SECURITY CLASSIFICATION
OF THIS PAGE
Unclassified
NSN 7540-01-280-5500
19. SECURITY CLASSIFICATION
OF ABSTRACT
Unclassified
15. NUMBER OF PAGES
42
16. PRICE CODE
A0320. LIMITATION
OF ABSTRACT
32
Standard Form 298 (Rev. 2-89)
Prescribed by ANSI Std. Z-39-18298-102