Embed Size (px)
Citation preview
The Pennsylvania State University
The Graduate School
College of Education
AN INVESTIGATION OF ENGINEERING STUDENTS’ POST-GRADUATION PLANS
INSIDE OR OUTSIDE OF ENGINEERING
A Dissertation in
Higher Education
by
Hyun Kyoung Ro
© 2011 Hyun Kyoung Ro
Submitted in Partial Fulfillment
of the Requirements
for the Degree of
Doctor of Philosophy
August 2011
ii
The dissertation of Hyun Kyoung Ro was reviewed and approved* by the following:
Lisa R. Lattuca
Professor of Higher Education
Dissertation Advisor
Chair of Committee
John Cheslock
Associate Professor of Higher Education
Leticia Oseguera
Assistant Professor of Higher Education
Hoi K. Suen
Distinguished Professor of Educational Psychology
Dorothy H. Evensen
Professor of Higher Education
Professor-in-Charge of the Higher Education Program
*Signatures are on file in the Graduate School
iii
ABSTRACT
The question of students‘ post-graduation plans is a critical one for the field of
engineering as both industry and higher education institutions seek to understand how to increase
the production of highly-skilled individuals for the STEM workforce. Despite the concern, there
are but a few empirical studies that examine how students‘ academic majors, their educational
experiences inside and outside the classrooms, and their perceptions of their knowledge and
abilities influence their career and graduate education plans. This study utilized a nationally
representative dataset collected for the Prototype to Production: Processes and Conditions for
Preparing the Engineer of 2020 (P2P) study (NSF-EEC Award No. 0550608). This study used
survey responses from 5,239 engineering students in 212 engineering programs from 31 four-
year engineering schools to explore the post-graduation plans of the U.S. engineering students,
specifically addressing the research question: do individual students‘ pre-college characteristics,
academic program experiences, and self-assessments of their engineering abilities influence their
post-graduation plans? Six potential responses regarding students‘ post-graduation plans from
the P2P student survey were explored in this study: 1) Be self-employed in engineering; 2) Be a
practicing engineer; 3) Work in engineering management or sales; 4) Work outside engineering;
5) Be in engineering graduate school for academic career; and 6) Be in engineering graduate
school for professional career. Because these outcome measures use an ordered scale (from
definitely won’t to definitely will), the analysis used a multinomial logistic regression model.
Based on the conceptual framework adapted from Terenzini and Reason (2005), the
analyses examined students‘ post-graduation plans as a function of students‘ academic program
experiences after controlling for pre-college characteristics that research has shown influence the
odds of having the outcomes and experiences to begin with (gender, race/ethnicity, and academic
preparedness). The study also explored how students‘ self-assessments of their engineering
domain knowledge and skills influenced their post-graduation plans after controlling for student
pre-college characteristics and academic program experiences.
A key finding of the study is that engineering students‘ post-graduation plans appear to
be complex and tentative decisions. Seniors consider multiple career options, which are not
limited to work or study in the field of engineering, as they near graduation. This study also
found that there are multiple factors that seem to influence engineering students‘ post-graduation
plans to stay in the field of engineering. Students‘ engineering career and graduate school plans
were positively influenced by: gender (with men‘s odds higher than women‘s); greater curricular
emphases on core engineering thinking and professional skills in engineering programs; more
active and collaborative learning experiences in the classroom; more active engagement in
student organizations for women and underrepresented minority students; and higher self-
assessments of fundamental and design skills. On the other hand, students‘ plans for graduate
study or work outside engineering were positively influenced by: class year standing (with
seniors‘ odds higher than sophomores‘); majoring in General Engineering (compared to the
reference group of Mechanical Engineering); greater curricular emphasis on professional values
in engineering programs; more active engagement in student organizations for women and
URMs; and higher self-assessment of contextual competence. Being active in engineering clubs
for women and URMs, appears to influence both engineering and non-engineering career options.
iv
Thus, simply offering co-curricular opportunities may not be enough to promote persistence in
engineering fields.
These findings have a number of implications for practice, policy, theory-building, and
future research. Most policies focused on enlarging the engineering pipeline are motivated by a
desire to increase the quality and diversity of the engineering workforce, but there has been little
empirical study of the section of the pipeline between undergraduate education and the
engineering workforce. Advocates of diversifying the workforce will be concerned with the
finding that women students are two times less likely than men to plan to enter engineering
career and graduate school path. Although most previous research focuses on why women
students do not persist or graduate in engineering programs, more research is needed to
understand why women who plan to complete an engineering degree then choose a career
outside of their field. This study found there was little difference between underrepresented
minority and White students in terms of their post-graduation plans, which might be because this
study could not examine the race/ethnicity groups separately due to insufficient sample sizes.
Agencies such as the National Science Foundation might respond by funding research to develop
and analyze large-scale and nationally representative data sets on engineering graduates that
would permit researchers to examine post-graduation plans and outcomes for specific
racial/ethnic groups.
In terms of implications for practice, this study suggests that the engineering programs
should provide diverse curricula, instructional, and co-curricular experiences that contribute to
students‘ learning and satisfaction, and thus encourage them to remain on the engineering
workforce pathway. Engineering curricula should integrate technical and contextual issues by
stressing problem-solving in real-world contexts to attract engineering students, especially
women. Engineering programs also should link curricular and co-curricular opportunities that
stress the connections between design, innovation, creativity, interdisciplinary, and professional
skills since this content is associated with plans to stay in the engineering workforce or attend an
engineering graduate program.
Engineering programs or institutions should also encourage and assist engineering faculty
members to learn new instructional methods. Opportunities and incentives for professional
development activities may promote greater use of instructional practices that actively engage
students in their learning. The findings from this study suggest that engineering programs should
encourage students to participate in diverse co-curricular programs. Engineering industries
should recognize the value of students‘ co-curricular experiences in cultivating students‘
profession skills and building students‘ understanding of the social and global contexts and
issues that are part of the work of today‘s engineer.
In addition to the policy and practical implications, this study suggests future research
areas. Terenzini and Reason‘s conceptual model, which was modified for this study, should
include the disciplinary environment within the organizational context. Student outcomes,
however, are situated not only in the context of academic programs and institutions, but also in
socio-historical context. Students‘ career plans are thus influenced by economic and other
prevalent social and cultural conditions. As this study shows seniors consider a broader array of
career options than sophomores, possibly because they recognize job market conditions, which
v
will shape their career pathways. Terenzini and Reason‘s model should be modified to include
this broader socio-historical context.
Research on pathways from higher education to the engineering workforce is relatively
new. Although students‘ reports of their work and graduate study plans are the best predictors
of these decisions, future studies should explore the correlation between engineering students‘
post-graduation plans in or outside of engineering and actual career and graduate school
decisions. Longitudinal data should be collected for this purpose and the long trajectory of
engineering graduates‘ career pathways should be examined.
vi
TABLE OF CONTENTS
LIST OF TABLES ....................................................................................................................... viii
LIST OF FIGURES ....................................................................................................................... ix
Chapter 1 INTRODUCTION ........................................................................................................ 1
Engineering Workforce and Graduate Schools ........................................................................... 1
Engineering Workforce and Graduate School Plans ................................................................... 3
Purpose of the Study ................................................................................................................... 5
Justification for the Study ........................................................................................................... 7
Implications for Policy ............................................................................................................ 7
Implications for Practice .......................................................................................................... 9
Contribution to Future Research and Theory Building ......................................................... 10
Chapter 2 LITERATURE REVIEW ........................................................................................... 13
Students Pre-College Characteristics and Experiences ............................................................. 16
Organizational Context ............................................................................................................. 20
Individual Students‘ College Experiences ................................................................................ 24
Curricular Experiences .......................................................................................................... 24
Classroom Experiences .......................................................................................................... 27
Out-of-class Experiences ....................................................................................................... 30
Outcomes ................................................................................................................................... 34
The Effect of Student Abilities on Post-graduation Plans ..................................................... 35
Conceptual and Methodological Issues of Self-ratings ......................................................... 37
Mediating Effect of Students‘ Abilities ................................................................................. 39
Post-graduation Plans: Engineering Career and Educational Plans. ..................................... 40
Conceptual and Methodological Issues of Post-graduation Plans ......................................... 43
Conceptual Framework ............................................................................................................. 44
Contributions ......................................................................................................................... 46
Chapter 3 METHODS................................................................................................................. 48
Operationalizing the Conceptual Framework ........................................................................... 48
Design, Population, and Sample ............................................................................................... 49
Data Collection Procedures and Response Rates ...................................................................... 53
Scale Development and Variables Used ................................................................................... 54
Control Variables ................................................................................................................... 55
Students‘ Pre-college Characteristics Variables .................................................................... 56
Academic Program Experience Variables ............................................................................. 57
vii
Students‘ Engineering Knowledge and Skills Variables ....................................................... 59
Post-graduation Plans Variables ............................................................................................ 59
Analytical Methods ................................................................................................................... 60
Parallel Regressions Assumption .......................................................................................... 61
Independence of Irrelevant Alternatives ................................................................................ 63
Combining Outcome Categories ........................................................................................... 64
Measures of Model Fit ........................................................................................................... 65
Odds Ratios and Robust Standard Errors .............................................................................. 67
Limitations ................................................................................................................................ 68
Limitations of the Dataset...................................................................................................... 68
Limitations of Single-Level Analysis .................................................................................... 70
Limitations of the Conceptual Framework ............................................................................ 71
Chapter 4 FINDINGS ................................................................................................................. 72
Explained Variances in Post-graduation Plans.......................................................................... 73
The Effect of Student Variables on Post-Graduation Plans ...................................................... 75
The Influences of Pre-college Characteristics ....................................................................... 76
The Influences of Academic Program Experiences .............................................................. 78
The Influences of Self-assessment of Engineering Knowledge and Skills ........................... 82
Summary ................................................................................................................................ 84
Chapter 5 DISCUSSION, CONCLUSIONS, and IMPLICATIONS ......................................... 92
Restatement of the Problem ...................................................................................................... 92
Discussion and Conclusions ...................................................................................................... 93
Students‘ Pre-college Characteristics .................................................................................... 93
Academic Program Experiences ............................................................................................ 96
Students‘ Self-assessments of Engineering Knowledge and Skills ..................................... 109
Implications ............................................................................................................................. 113
Implications for Policy ........................................................................................................ 115
Implications for Practice ...................................................................................................... 117
Implications for Future Research and Theory Building ...................................................... 122
References ................................................................................................................................... 125
Appendix A SURVEY .............................................................................................................. 136
Appendix B VARIABLES ........................................................................................................ 152
Appendix C OBSERVED AND PREDICTED OUTCOMES FOR THE MULTINOMIAL
LOGISTIC MODEL OF POST-GRADUATION PLANS ........................................................ 162
Appendix D MULTINOMIAL LOGISTIC REGRESSION ANALYSES .............................. 165
viii
LIST OF TABLES
Table 3. 1: Characteristics of the population of 2008 engineering students, survey respondents,
and their institutions ...................................................................................................................... 52 Table 3. 2: Likelihood-ratio test of the Parallel Regressions Assumption ................................... 62
Table 3. 3: Brant‘s test of the Parallel Regressions Assumption .................................................. 62 Table 3. 4: Hausman-McFadden test of Independence of Irrelevant Alternatives ....................... 64 Table 3. 5: LR test for Combining Outcome Categories (df=32) ................................................. 65 Table 4. 1: Blocked Multinomial Logistic Regression Model Fit Comparison (n=5,239) ........... 74 Table 4. 2: The Likelihood of Working as Self-employment in Engineering .............................. 86
Table 4. 3: The Likelihood of Working as a Practicing Engineer ................................................ 87
Table 4. 4: The Likelihood of Working in Engineering Management or Sales ............................ 88 Table 4. 5: The Likelihood of Working outside of Engineering................................................... 89
Table 4. 6: The Likelihood of Graduate School Plans for Engineering Faculty Jobs .................. 90
Table 4. 7: The Likelihood of Graduate School Plans for Engineering Professions .................... 91 Table 5. 1: Relationship between Disciplines and Post-graduation Plans .................................... 97 Table 5. 2: Relationship between Curricular Experiences and Post-graduation Plans ............... 102
Table 5. 3: Relationship between Classroom Instructional /Co-curricular Experiences and Post-
graduation Plans .......................................................................................................................... 106
Table 5. 4: Relationship between Engineering Knowledge and Skills and Post-graduation Plans
..................................................................................................................................................... 110 Table B. 1: Study Variables ........................................................................................................ 153
Table B. 2: Descriptive Statistics of Study Variables ................................................................. 157
Table C. 1: Classification Table for Self-employment in Engineering..….................................163
Table C. 2: Classification Table for Working as a Practicing Engineer ..................................... 163 Table C. 3: Classification Table for Working in Engineering Management or Sales ................ 163
Table C. 4: Classification for Working Outside of Engineering ................................................ 164 Table C. 5: Classification for Graduate School Plans for Engineering Faculty Jobs ................. 164
Table C. 6: Classification for Graduate School Plans for Engineering Professions ................... 164 Table D. 1: Parameter Estimates for Self-employment in Engineering...……………….……...166
Table D. 2: Parameter Estimates for Working as a Practicing Engineer .................................... 168
Table D. 3: Parameter Estimates for Working in Engineering Management or Sales ............... 170 Table D. 4: Parameter Estimates for Working Outside of Engineering ..................................... 172 Table D. 5: Parameter Estimates for Graduate School Plans for Engineering Faculty Jobs ...... 174
Table D. 6: Parameter Estimates for Graduate School Plans for Engineering Professions ........ 176

ix
LIST OF FIGURES
Figure 2. 1: A comprehensive model of influences on student learning and persistence ............. 13 Figure 2. 2: Conceptual Framework for Engineering Students‘ Post-graduation Plans ............... 46 Figure 3. 1: Engineering Students‘ Post-graduation Plans Analytical Model .............................. 49
1
Chapter 1
INTRODUCTION
Engineering Workforce and Graduate Schools
Maintaining a competitive lead in science, technology, engineering, and mathematics
(STEM) education has proven to be a challenge for the United States despite significant efforts
to improve the recruitment and retention of STEM students. Fears of increasing global
competition compound the perception that there has been a large decline in the supply of human
resources in the STEM fields. While many other countries are increasing the number of STEM
graduates who receive bachelor‘s degrees, U.S. production has remained mostly constant over
the last 50 years (National Science Board, 2010). For example, in the United States, about 5% of
all bachelor‘s degrees are in engineering, while in Asia about 20% of the degrees awarded are in
engineering fields. In China in 2006, about one-third of university degrees were engineering
degrees (National Science Board, 2010).
Gender disparity in engineering undergraduate programs is one factor contributing to the
gender gap in the U.S. engineering workforce. The National Science Board (2010) reported
women have accounted for 58% of all bachelor‘s degrees awarded in the U.S. since 2000.
Engineering, however, has a severe gender gap at the baccalaureate level. Less than 20% of
undergraduate engineering degrees in 2006 were awarded to women, and the proportion of
engineering degrees awarded to women U.S. citizens has increased less than 2% from 1996
(17.9%) to 2006 (19.5%). Similar gender disparities are evident in graduate degrees. Women
earned 20% of engineering doctorates in 2006, up from 12% in 1997 (National Science Board,
2010). To meet future workforce needs in engineering, many science and engineering colleges
have made great efforts to recruit and retain women students and thereby increase the number of
2
graduates entering the workforce. Yet, women remain underrepresented in most engineering
disciplines.
Recently, attention has turned to underrepresented minority (Masters, Schuurman,
Okudan, & Hunter) students – African Americans, Latino/as and Native Americans particularly –
as critical to the health of the STEM workforce in the U.S. Although the number of URM
students in higher education has steadily increased over the past few decades, the proportion of
engineering degrees awarded to URM students in engineering has stalled. The racial gap in the
engineering workforce and in graduate programs reflects the racial differences in STEM degree
attainment. URM student groups share only 17% of science and engineering bachelor‘s degrees
(Black students – 8%; Hispanic students – 8%; and American Indian/Alaska Native students –
0.7%) in 2007 (National Science Board, 2010). The proportion of engineering doctorate degrees
awarded to URM students is more daunting. Hispanic U.S. citizen doctorate recipients averaged
5% from 1997 to 2006, with Black U.S. citizen and American Indian/Alaska Native doctorate
recipients almost nonexistent during that period (National Science Board, 2010). Despite the
overall increase of URM students in higher education, the numbers lag far behind White and
Asian student groups in engineering programs and the workforce.
In addition to gender and racial disparity, student attrition in STEM fields is a constant
concern. According to a recent report from the National Center for Education Statistics (Chen &
Weko, 2009), 36% of students who first enrolled in STEM fields in 1995-96 were no longer in
STEM majors in 2001. On the other hand, about 7% of students who began in a non-STEM
major switched to a STEM field. In engineering, the low in-migration into undergraduate
programs is more severe. Few students migrate into engineering majors after starting college,
resulting in a net loss of students of more than 15%, which is greater than the loss in most other
3
majors (Ohland et al., 2008). This study suggests, however, that persistence in engineering
majors is comparable to that in other majors.
A lack of highly qualified and well-trained college graduates with engineering bachelor‘s
degrees is regarded an indicator of a loss of future human resources in STEM industries. The
situation may be worse than it appears, however, because graduates with engineering bachelor‘s
degrees do not necessarily choose a career in the engineering workforce; as one researcher put it,
an engineering major is not necessarily equal to an engineer (Lichtenstein et al., 2009). Attrition
of STEM-trained individuals leaving the STEM workforce is especially concerning because it
represents a loss of talent cultivated throughout the STEM education pipeline. The National
Science Board (2010) indicated that only about 39% of college graduates whose highest degree
is in a science and engineering (S&E) field work in S&E applications. An additional 25% were
working in fields related to engineering, computer science, or the physical, chemical, and life
sciences. This means that 36% of those highly trained in the STEM disciplines—over five
million potential S&E workers—were employed in unrelated fields. These STEM trained
individuals engaged in the workforce outside of S&E are, from at least the STEM employer
perspective, a lost resource.
Engineering Workforce and Graduate School Plans
Researchers have recently focused on the pathways between postsecondary education and
the engineering workforce, raising the question of whether U.S. higher education produces
enough and highly qualified engineers (See, Lowell & Salzman, 2007; Lowell, Salzman,
Bernstein, & Henderson, 2009). To answer the question, researchers have studied the actual
career choices of engineering graduates in and outside of the science and engineering workforce
(Fox & Stephen, 2001; Hill, Corbett, & Rose, 2010).
4
Recent research has also examined why engineering students might plan for careers in –
or outside – of engineering. Understanding the factors that influence college students‘ career and
graduate school plans upon graduation is an important focus for research because such plans are
typically among the best predictors of actual choice of professions or graduate school enrollment
(A. W. Astin, 1977; Pascarella & Terenzini, 2005; Tinto, 1993; Whitaker & Pascarella, 1994).
Further, recent research suggest that engineering programs might need to implement early
interventions for students who might already be deciding early in their college experience that
engineering is not the field in which they want to persist (Ro et al., 2011, June).
The Academic Pathways of People Learning Engineering Survey (APPLES) used data
from 4,266 students on 21 campuses to examine to examine the impacts of motivation, college
experiences, and demographics on students‘ plans upon graduation (e.g., engineering and non-
engineering work and graduate school plans). Atman et al.(2010) found about 30% of the senior
engineering students in this cross-sectional study focused their post-graduation plans exclusively
on engineering (i.e., work and/or graduate school in engineering). Students in this group were
strongly motivated to study engineering (e.g., reporting that ―engineering is fun‖), and were
likely to have engineering-related work experiences through cooperative education and/or
internship programs, but were less confident in their professional and interpersonal skills (e.g.,
skills in written oral communications, teamwork, and leadership) than students who were open to
non-engineering options. More than 60% of senior engineering majors reported that they
considered career options that would combine engineering and non-engineering components.
The researchers concluded that undergraduates in their senior year, relative to first year students,
had broadened their career interests.
5
Engineering students seem to consider many career and graduate education options
within and outside of engineering. Engineering graduates can choose a career or graduate degree
in a field other than engineering, based on their interests and future goals, which is certainly not
a failure for the individual. Given that the United States has invested in increasing the number of
engineering graduates, however, the loss of engineering graduates from STEM careers and
graduate education may be considered an indication of the nation‘s failure to increase human
capital in STEM fields (Lowell, et al., 2009). Further research is needed to identify how
engineering students develop their career and graduate education plans during their
undergraduate years, which will allow for early interventions designed to encourage engineering
students to stay in engineering jobs and graduate education.
Purpose of the Study
Engineering students‘ post-graduation plans seem to be tentative and influenced by a mix
of factors: institutional, programmatic, and individual characteristics. Previous research,
however, is limited because it has not 1) examined the potential impact of a broad array of
engineering students‘ experiences and abilities on their post-graduation plans; 2) explored
potential differences in the plans of engineering students in different subdisciplines; and 3) been
grounded in a comprehensive and theoretical foundation.
College students‘ learning and performance are the result of a broad spectrum of college
experiences. Drawing on an extensive literature base, Pascarella & Terenzini (2005) content that
college students participate in a variety of curricular and co-curricular activities that shape their
major choices, persistence, graduation, and post-graduation outcomes. Presumably, engineering
students‘ post-graduation plans are similarly influenced by diverse engineering and non-
engineering related experiences. Most previous studies, however, focus on engineering-specific
6
activities such as internships or cooperative education experiences (e.g., Sheppard et al., 2010),
and few have examined the potential impacts of the panoply of students‘ curricular and co-
curricular experiences. In addition, previous studies tend to examine the impacts of students‘
confidence level in their math and science skills on their post-graduation plans and outcomes (A.
W. Astin & Astin, 1992; Correll, 2004; Eris et al., 2007), but have not explored other domain
knowledge and skill sets (for example, design skills, contextual competence, and different types
of professional skills) that may contribute to an engineer‘s success in the profession.
Although institutional characteristics appear to influence students‘ career planning
(Lichtenstein, et al., 2009), researchers have not considered whether differences in career plans
may be affected by variations in students‘ experiences in different engineering programs. Recent
research suggests that internal policies and practices and faculty members‘ engagement in
teaching – which influence students‘ experiences and learning (Pascarella & Terenzini, 2005) –
vary across engineering disciplines. Specifically, Lattuca, Terenzini & Volkwein (2006)
provided evidence that faculty engagement in learning-centered practices, such as continuous
improvement, assessment, and professional development activities, differed across engineering
disciplines. Lattuca, Terenzini, Harper, & Yin (2010) found that engineering faculty members‘
values, customs, dispositions on curricular and pedagogical change varied by subdiscipline.
Such variations in faculty practices and attitudes may result in variations in students‘ learning
experiences—which may in turn influence their learning and post-graduation plans in their
engineering disciplines.
Furthermore, researchers studying students‘ post-graduation plans tend to simply respond
to current industrial needs and focus on a fraction of the phenomenon rather than designing their
studies using comprehensive theoretical or conceptual frameworks. In the higher education
7
literature, frameworks and models incorporating various sets of variables presumed to affect
student outcomes are often used to explore salient influences on student learning, development,
and behavior (Pascarella & Terenzini, 2005). Among these frameworks, the college impact
models developed by Astin (1985, 1993), Tinto (1993), Pascarella (1985), and Terenzini and
Reason (2005) represent comprehensive approaches to the study of student outcomes; these
models include demographic and other student characteristics, institutional traits and
organizational internal structures (in the case of Berger & Milem, 2000; Terenzini & Reason,
2005), and student experiences, which are assumed to affect students‘ outcomes such as
persistence to graduation or post-graduation plans.
The purpose of this study was to identify the array of factors shaping engineering
students‘ post-graduation plans. Using a nationally-representative data set of engineering
students from 121 academic programs in 31 U.S. colleges and universities, this study tested the
extent to which students‘ pre-college characteristics, experiences in their academic programs,
and self-assessment of their engineering abilities influenced their plans to pursue an engineering
profession or engineering graduate degree. In identifying these factors and exploring their
relationships on post-graduation plans, this study addressed the following research question:
Do individual students‘ pre-college characteristics, academic program experiences, and
self-assessments of their engineering abilities influence their post-graduation plans?
Justification for the Study
Implications for Policy
This study will results in a comprehensive college impact model of engineering students‘
career and graduate school plans and may also inform public policy discussions about cultivating
8
a well-trained STEM workforce in the United States. Many legislative actions, such as the
American Competiveness Initiative and Higher Education Reauthorization Act of 2005, have
worked to change the stagnancy in STEM education (House Resolution 1709, 2009). The
Obama administration followed a long tradition of involvement in STEM education focusing on
initiatives to improve science education, the STEM pipeline, and innovation. For example, in
2010, President Obama announced several new and innovative partnerships involving major
companies, universities, foundations, non-profit organizations, and government agencies
designed to attract, develop, reward and retain outstanding educators in STEM. These
partnerships built upon previous initiatives that the President announced at the launch of the
―Educate to Innovate‖ campaign to motivate and inspire students to excel in STEM subjects
(White House, 2010). The ―Educate to Innovate‖ campaign aimed at (House Resolution 1709)
increasing STEM literacy so that all students can master challenging content and think critically
in STEM fields; (2) moving American students from the middle of the pack to the top of the
world in STEM achievement over the next decade and preparing the next generation of
American scientists; and (3) expanding STEM education and career opportunities for
underrepresented groups, including women. This campaign encompassed a goal of increasing
critical thinking in STEM contents, global competitiveness, and underrepresented student groups
in STEM education and workforce.
The findings of study could also be used to support the development of more intervention
programs supporting initiatives such as the ―Educate to Innovate‖ campaign which focuses on
STEM pathways from postsecondary education to the workforce. This study will suggest
effective curricular emphases, co-curricular activities, and instructional practices that encourage
women and minority students to pursue in STEM careers and graduate study. The federal
9
government and other funding agencies may wish to focus attention on these successful
strategies for broadening engineering pathways or encourage further studies that will identify in
greater detail how and why particular educational activities promote the movement from
engineering programs to the engineering workforce or why they are particularly effective for
underserved groups of students.
Implications for Practice
Ensuring the persistence of students from STEM programs to the STEM workforce and
further education is of interest to STEM educators and practitioners nationwide. In addition to
the implications for public policy discussions, the results of this study may inform the decision-
making of engineering programs and faculty members that seek to promote students‘ interests in
pursuing careers in the engineering professions and graduate programs in engineering. Since this
study explores the impact of students‘ academic program experiences on their post-graduation
plans, it will likely have broad implications to engineering programs and faculty members.
Further, this study will determine if there is variation in post-graduation plans by gender and
race/ethnicity. The findings will suggest how academic programs might encourage women and
underrepresented minority students to stay in engineering pathways.
The influences on engineering students‘ career and graduate school plans may not differ
substantially from that of undergraduates in other STEM disciplines. The conceptual model
developed here may be particularly useful to researchers who seek to design comprehensive
studies of STEM students‘ undergraduate experiences and their influence on their post-
graduation plans in or outside of STEM fields.
10
Contribution to Future Research and Theory Building
A large body of literature suggests three different perspectives to explain why
engineering students enroll, persist, and complete engineering bachelor‘s degrees, and ultimately
choose and persist in the engineering workforce and graduate study: 1) supply attributes; 2)
demand factors; and 3) matches between qualification and interests (Lowell, et al., 2009). These
three approaches, however, rarely address the role of academic programs that engineering
students attend, and their influence on engineering students‘ post-graduation plans.
The first perspective suggests if students are proficient in mathematics and science at an
early age, this proficiency encourages them to choose and persist engineering programs. Most
research identifies academic preparedness in secondary school, specifically, in mathematics, as
one of the most salient factors influencing students‘ intention to pursue, persist, and complete
engineering programs (Pascarella & Terenzini, 2005). Adelman (1998), however, argues that
high-achieving women engineering students are especially likely to switch fields, which might
decrease the number of women in engineering workforce and graduate programs. The supply
attributes approach does not take into account the impacts of students‘ educational experiences in
their academic programs (majors) on their decision to leave or stay in engineering. This study
will help explain how students‘ academic program experiences influence engineering students‘
career and graduate education plans even after controlling for the impacts of students‘ academic
preparedness in secondary school.
The second perspective on persistence and achievement is based on demand or market
forces. In the economics literature, researchers have emphasized the availability of STEM-
related jobs. The National Science Board (2010) reports that more than 30% of engineering and
science graduates have jobs that are not related to their degrees because jobs in their highest
11
degree field are not available. Further, engineering graduates, especially highly qualified ones,
can choose any career path that will best compensate them for their abilities. Thus, both
engineering industries and other professional fields (e.g., finance, law, or medicine) have tried to
attract more highly qualified engineering graduates via higher compensation (Lowell & Salzman,
2007; Lowell, et al., 2009). While studies examining these labor market actions have provided
valuable clues for educators, their utility is limited because educators cannot control the labor
markets that compete for and recruit the highly qualified engineering workforce.
Still, the findings of the demand factor approach will contribute information on how
higher education institutions play a role in maintaining the ability of the United States to
compete other countries in STEM fields by identifying how engineering students make plans
related to the engineering workforce. Higher education institutions and engineering programs
must not only provide a large enough STEM-talent pool in the nation, but they must also
encourage students to pursue engineering work and graduate education.
The last perspective suggests that students choose their careers and graduate education
based on not only their qualifications but also their interests in specific disciplines. Career and
educational aspirations and interest in engineering during college seems to have an impact on
students‘ choices to enter the engineering workforce and engineering graduate school (Wang &
Staver, 2001; Wei-Cheng, 2003). In the career development and assessment literature focusing
on college students, however, only a few studies consider how college environments or students‘
college experiences influence career aspiration and interest, and then actual career choice. The
findings of this study will contribute to our understanding of how college environments and
experiences influence undergraduates‘ career plans.
12
This study will also contribute to the further development of the conceptual model of
college impact proposed by Terenzini and Reason (2005) to provide a more complete picture of
how college affects student learning. This study will build an empirically based model of the
effects of college environment and experiences on students‘ future plans and provide a strong
foundation for further testing of comprehensive college impact model on student outcomes.
13
Chapter 2
LITERATURE REVIEW
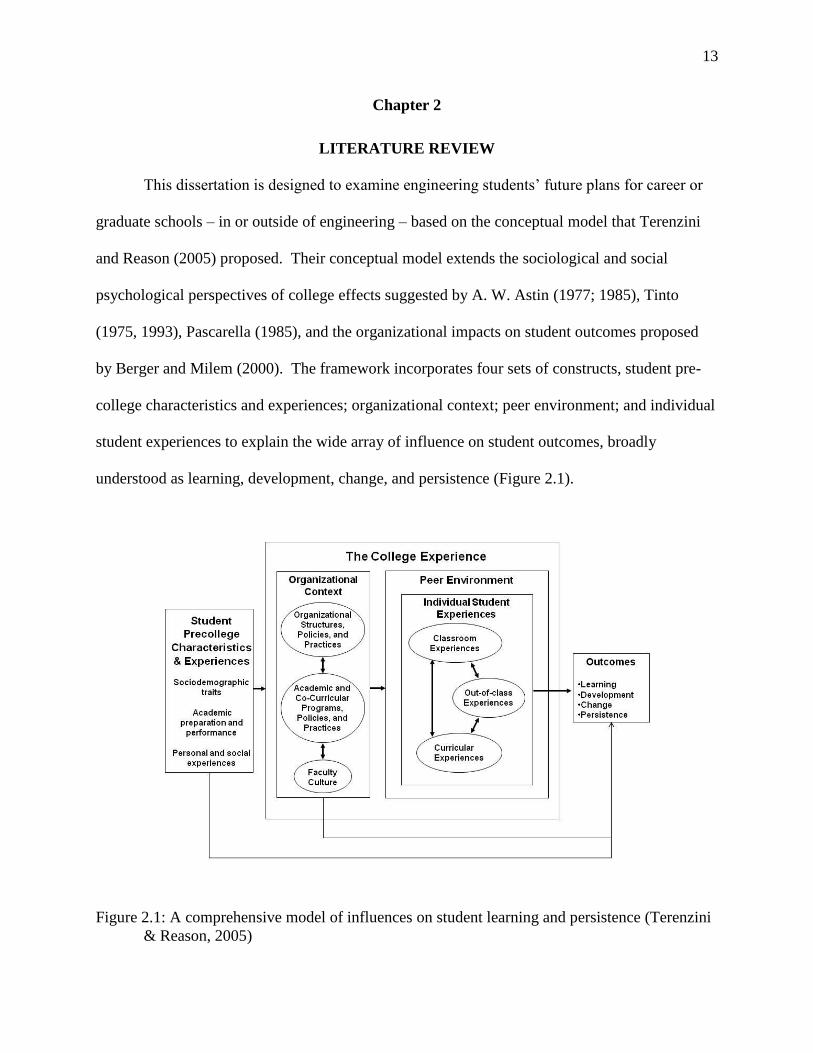
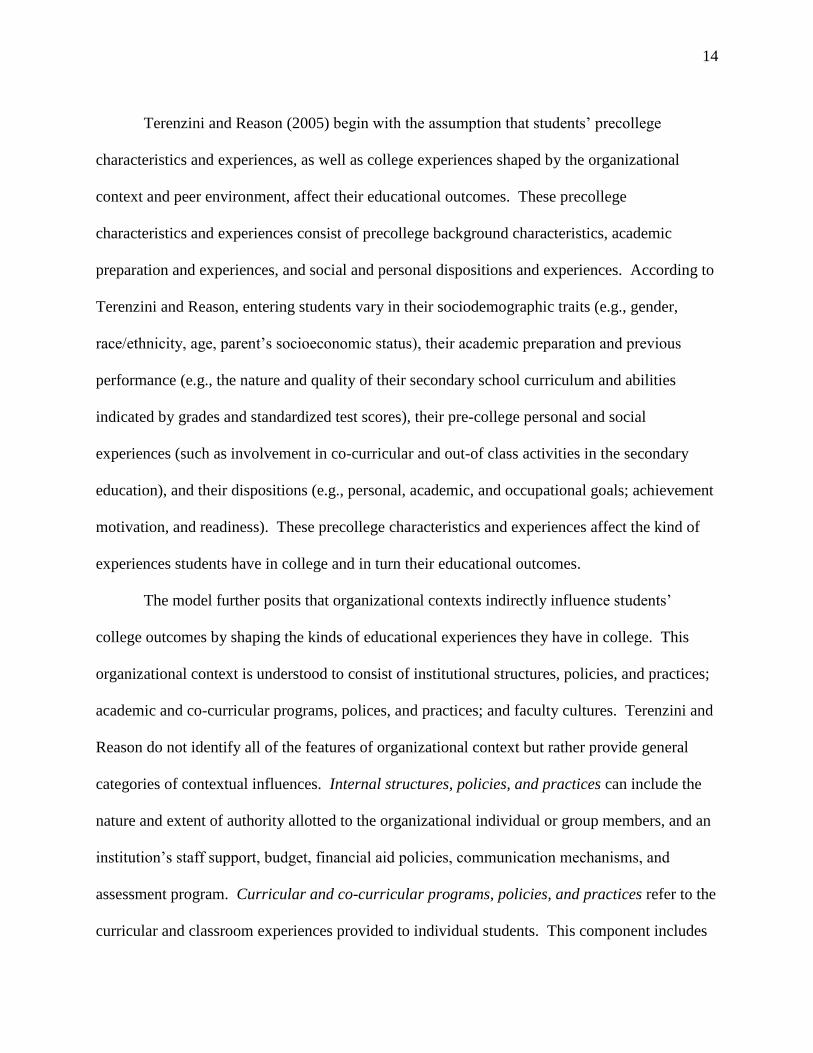
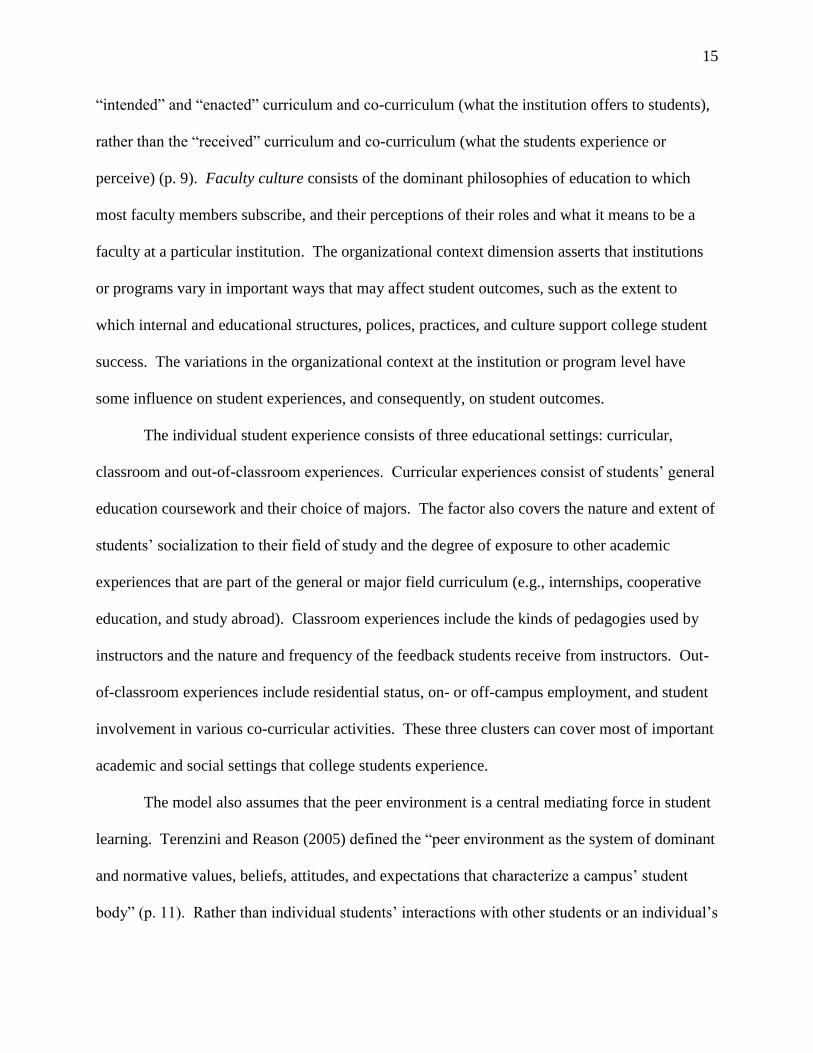
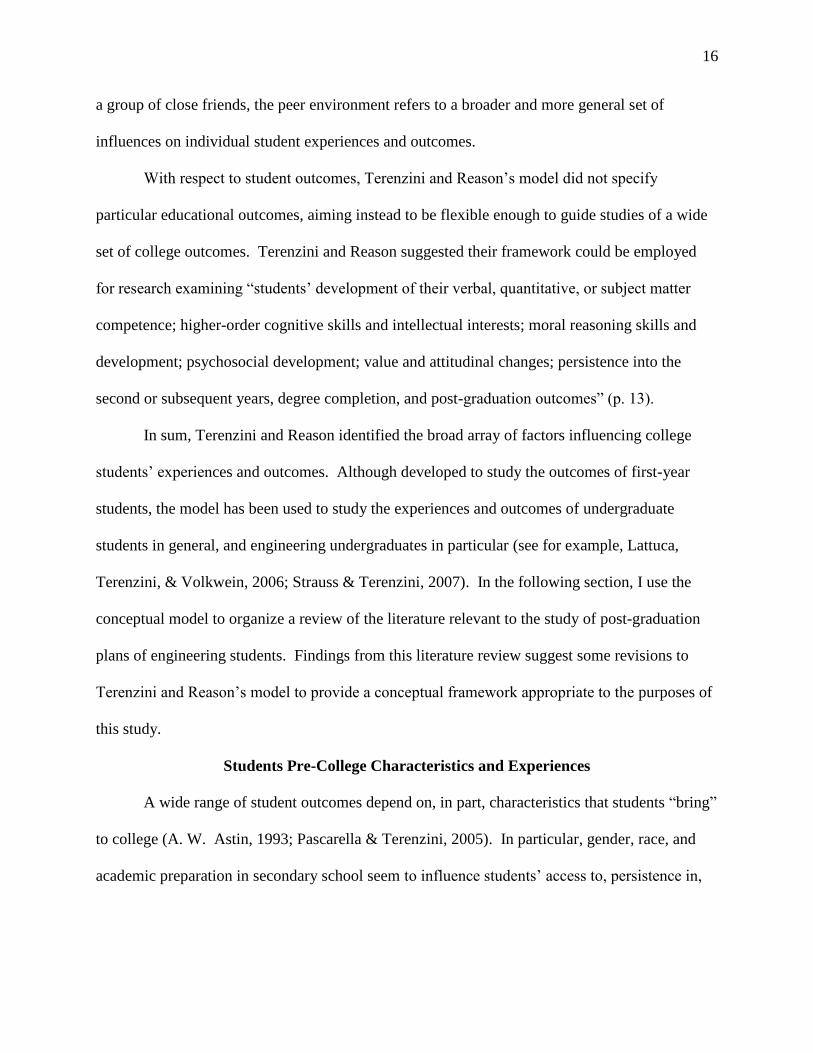
This dissertation is designed to examine engineering students‘ future plans for career or
graduate schools – in or outside of engineering – based on the conceptual model that Terenzini
and Reason (2005) proposed. Their conceptual model extends the sociological and social
psychological perspectives of college effects suggested by A. W. Astin (1977; 1985), Tinto
(1975, 1993), Pascarella (1985), and the organizational impacts on student outcomes proposed
by Berger and Milem (2000). The framework incorporates four sets of constructs, student pre-
college characteristics and experiences; organizational context; peer environment; and individual
student experiences to explain the wide array of influence on student outcomes, broadly
understood as learning, development, change, and persistence (Figure 2.1).
Figure 2.1: A comprehensive model of influences on student learning and persistence (Terenzini
& Reason, 2005)
14
Terenzini and Reason (2005) begin with the assumption that students‘ precollege
characteristics and experiences, as well as college experiences shaped by the organizational
context and peer environment, affect their educational outcomes. These precollege
characteristics and experiences consist of precollege background characteristics, academic
preparation and experiences, and social and personal dispositions and experiences. According to
Terenzini and Reason, entering students vary in their sociodemographic traits (e.g., gender,
race/ethnicity, age, parent‘s socioeconomic status), their academic preparation and previous
performance (e.g., the nature and quality of their secondary school curriculum and abilities
indicated by grades and standardized test scores), their pre-college personal and social
experiences (such as involvement in co-curricular and out-of class activities in the secondary
education), and their dispositions (e.g., personal, academic, and occupational goals; achievement
motivation, and readiness). These precollege characteristics and experiences affect the kind of
experiences students have in college and in turn their educational outcomes.
The model further posits that organizational contexts indirectly influence students‘
college outcomes by shaping the kinds of educational experiences they have in college. This
organizational context is understood to consist of institutional structures, policies, and practices;
academic and co-curricular programs, polices, and practices; and faculty cultures. Terenzini and
Reason do not identify all of the features of organizational context but rather provide general
categories of contextual influences. Internal structures, policies, and practices can include the
nature and extent of authority allotted to the organizational individual or group members, and an
institution‘s staff support, budget, financial aid policies, communication mechanisms, and
assessment program. Curricular and co-curricular programs, policies, and practices refer to the
curricular and classroom experiences provided to individual students. This component includes
15
―intended‖ and ―enacted‖ curriculum and co-curriculum (what the institution offers to students),
rather than the ―received‖ curriculum and co-curriculum (what the students experience or
perceive) (p. 9). Faculty culture consists of the dominant philosophies of education to which
most faculty members subscribe, and their perceptions of their roles and what it means to be a
faculty at a particular institution. The organizational context dimension asserts that institutions
or programs vary in important ways that may affect student outcomes, such as the extent to
which internal and educational structures, polices, practices, and culture support college student
success. The variations in the organizational context at the institution or program level have
some influence on student experiences, and consequently, on student outcomes.
The individual student experience consists of three educational settings: curricular,
classroom and out-of-classroom experiences. Curricular experiences consist of students‘ general
education coursework and their choice of majors. The factor also covers the nature and extent of
students‘ socialization to their field of study and the degree of exposure to other academic
experiences that are part of the general or major field curriculum (e.g., internships, cooperative
education, and study abroad). Classroom experiences include the kinds of pedagogies used by
instructors and the nature and frequency of the feedback students receive from instructors. Out-
of-classroom experiences include residential status, on- or off-campus employment, and student
involvement in various co-curricular activities. These three clusters can cover most of important
academic and social settings that college students experience.
The model also assumes that the peer environment is a central mediating force in student
learning. Terenzini and Reason (2005) defined the ―peer environment as the system of dominant
and normative values, beliefs, attitudes, and expectations that characterize a campus‘ student
body‖ (p. 11). Rather than individual students‘ interactions with other students or an individual‘s
16
a group of close friends, the peer environment refers to a broader and more general set of
influences on individual student experiences and outcomes.
With respect to student outcomes, Terenzini and Reason‘s model did not specify
particular educational outcomes, aiming instead to be flexible enough to guide studies of a wide
set of college outcomes. Terenzini and Reason suggested their framework could be employed
for research examining ―students‘ development of their verbal, quantitative, or subject matter
competence; higher-order cognitive skills and intellectual interests; moral reasoning skills and
development; psychosocial development; value and attitudinal changes; persistence into the
second or subsequent years, degree completion, and post-graduation outcomes‖ (p. 13).
In sum, Terenzini and Reason identified the broad array of factors influencing college
students‘ experiences and outcomes. Although developed to study the outcomes of first-year
students, the model has been used to study the experiences and outcomes of undergraduate
students in general, and engineering undergraduates in particular (see for example, Lattuca,
Terenzini, & Volkwein, 2006; Strauss & Terenzini, 2007). In the following section, I use the
conceptual model to organize a review of the literature relevant to the study of post-graduation
plans of engineering students. Findings from this literature review suggest some revisions to
Terenzini and Reason‘s model to provide a conceptual framework appropriate to the purposes of
this study.
Students Pre-College Characteristics and Experiences
A wide range of student outcomes depend on, in part, characteristics that students ―bring‖
to college (A. W. Astin, 1993; Pascarella & Terenzini, 2005). In particular, gender, race, and
academic preparation in secondary school seem to influence students‘ access to, persistence in,
17
and completion of engineering programs, which might, in turn, influence their pursuit of
engineering careers and graduate study.
Compared to men students, women students tend to have lower confidence in
mathematics; less interest in quantitative subjects (e.g., mathematics); and more negative
perceptions of STEM majors and professions (Brickhouse, 2001; Campbell, Jolly, Hoey, &
Perlman, 2002; Fadigan & Hammrich, 2004; Gilbert & Calvert, 2003). These gender differences
may contribute to the underrepresentation of women in STEM programs and the STEM
workforce. In a study comparing gender differences in both the science achievements and
attitudes of 19,000 eighth grade students who participated in the National Educational
Longitudinal Study, Catsambis (1995) found that women performed just as well as men, and
some showed a greater likelihood of enrolling in higher level science classes than their men
counterparts. Yet, women had less positive attitudes about science and engineering and less
frequently aspired to science and engineering careers. Similarly, Campbell et al. (2002) found
that male and female elementary school students scored similarly on tests in the fourth grade, but
that men tended to develop physical science and technology-related interests, whereas women
tended to track toward life sciences. High school seniors also showed no differences across
gender in achievement, as both men and women were as likely to take advanced coursework.
Women students, however, were less likely to major in computer/information science, science,
engineering, or math than their men counterparts (Campbell, et al., 2002). Despite entering
college with achievement and confidence levels similar to men, women in STEM fields tend to
lose that confidence upon matriculation, potentially because of feelings of isolation resulting
from their underrepresentation in the STEM disciplines (Seymour, 1995; Whitt, Pascarella,
Elkins Neisheim, & Martin, 2003).
18
In addition to gender, race/ethnicity is another sociodemographic characteristic that
influences patterns of plans or aspiration in engineering. Fewer underrepresented minority
students than White students choose a major or career in engineering, even though URM
students are interested in pursuing scientific and engineering careers during their early ages
(Hurtado et al., 2006; The College Board, 2005). The same percentage of African American and
White (44%) college-bound high school students indicated their intent to majors and careers in
science and engineering fields (The College Board, 2005). Campbell et al. (2002) also found
that interest in science and math subjects did not vary between White and minority student
groups throughout secondary education and while in college. However, only 27% of the
minority students who intended to major in a science or engineering fields obtained scientific or
technical degrees, whereas 46% of their majority counterparts received scientific and technical
degrees (Huang, Taddese, & Walter, 2000; Hurtado, et al., 2006). Given that not all engineering
undergraduates choose an engineering career or go on to engineering graduate school after
graduation, the numbers of underrepresented individuals in the workforce and in Ph.D. programs
is even less.
In the United States, being a racial/ethnic minority tends to be correlated with being less
academically prepared and having less economic, cultural, and social capital than white students
(Pascarella & Terenzini, 2005). To URM students, high school academic achievement may not
matter in choosing engineering majors; even minority students with high composite scores in
SAT or ACT tend to choose non-STEM fields, because URM student groups are less likely to
have access to higher levels of math in secondary education (Riegle-Crumb, 2005). Campbell et
al. (2002) also found that minority students are more likely to transfer out of STEM majors prior
to degree attainment because, on average, they exit high school without the academic
19
background preparation required of for study in these disciplines. Other researchers suggest that
racial minorities whose parents come from low socioeconomic status (SES) groups are often
disadvantaged compared to white students with regard to access, persistence, and completion of
postsecondary education (Brantlinger, 2003; Lareau, 2002). Using nationally representative data,
Donaldson, Lichtenstein, and Sheppard (2008) found a high number of significant differences in
engineering students‘ educational experiences and decisions for future plans between high and
low socio-economic status (SES) groups. The researchers suggest that research on different
student groups, particularly research that examines traditionally underrepresented populations in
engineering, should consider controlling for SES.
Indicators measuring academic preparedness in secondary school (e.g., high school GPA,
ACT, and SAT) are a critical factor in predicting access to, persistence in, and completion of
post-graduation education. It is not clear, however, whether high-achieving students are more
likely to complete engineering degrees and pursue engineering careers. Based on a three-year
study of 460 science, mathematics, and engineering students at seven institutions, Seymour and
Hewitt (1997) warned that most highly qualified college entrants leave their engineering
programs despite a serious national effort to improve recruitment and retention. Adelman (1998)
also found that high achieving women students tend to leave engineering programs or switch
majors into science-related or other programs. Also, Lowell, Salzman, Bernstein, and Henderson
(2009) demonstrated that highly qualified students (top quintile SAT/ACT and GPA) choose
non-STEM jobs because of a lack of social and economic incentives encouraging them to pursue
science and engineering careers. These studies suggest that students are not leaving engineering
pathways because of a lack of preparation or ability.
20
In addition to high school GPA or standardized test scores, students who enter college
with more science and mathematics courses are more likely than others to pursue engineering
careers. High school students who only take lower levels of math or science, on the other hand,
may not be able to choose a major in engineering and a plan for engineering careers. Students
who take trigonometry, pre-calculus, or calculus in high school are more likely to attain STEM
degrees than their peers (Chen & Weko, 2009). However, looking at medical career aspirations,
Antony (1998) argued that there is a possibility that many students may actually decide to pursue
their career in high school, and thus elect to take math and science courses in preparation for
such a career. Because of the ambiguity in directionality, Antony suggests that more evidence is
needed to determine if students taking more or higher levels of mathematics and science courses
are more likely to aspire to challenging careers like engineering.
Organizational Context
Most of the literature examining students‘ plans in engineering has focused on the impact
of individual students‘ pre-college characteristics and their college experiences. For example,
using data from 4,266 students on 21 campuses in a cross-sectional survey, the Academic
Pathways of People Learning Engineering Survey (APPLES) study, one part of the Academic
Pathways Study (APS), explores the effects of individual students‘ motivation, experiences, and
confidence on their post-graduation plans in and outside of engineering. In the APPLES study,
Sheppard at el. (2010) specifically explores how students‘ experiences in internships and
cooperative education and their confidence levels in their professional and interpersonal skills
influence their plans upon graduation, as well as how these vary by gender and underrepresented
racial/ethnic minority status. The study, however, does not take into account how these
experiences and confidence levels are shaped by institutions and engineering programs that
21
student attend and how these might then influence students‘ post-graduation plans. Although the
impact of the educational features of engineering programs on student outcomes are less
influential than students‘ actual educational experiences (Lattuca, et al., 2006), engineering
programs (a dimension of the organizational context) are presumed to indirectly influence
students‘ outcomes through the student experience (Terenzini & Reason, 2005).
Several researchers have addressed the influence of institutional characteristics on
students‘ post-graduation plans, but could not rule out the influence of students‘ precollege
characteristics on differences found in students‘ career plans. For example, analyzing the
Persistence in Engineering (PIE) Survey and semi-structured interview data from 74 students on
the two campuses, Lichtenstein et al. (2009) found that students‘ intentions to pursue an
engineering career after graduation varied based on a function of programmatic differences at the
two campuses. Fourteen percent of engineering seniors at the campus, which focused primarily
on the education of engineering, science, and technology majors, reported that they were unlikely
to pursue an engineering career or graduate education in the field after graduation. On the other
hand, 36% of engineering seniors at the campus offering a broader range of majors, including the
humanities and social sciences, indicated that they were unlikely to pursue an engineering career.
One of the study‘s limitations is that only compared two institutions, which makes it hard to
generalize the findings. A more critical concern, however, is students‘ self-selection since
students who were already interested in an engineering career might choose the more technically
focused institution. In other words, the different response patterns by students at the two
campuses might stem not only from institutional characteristics but also from students‘
predisposition toward engineering or technology.
22
Similarly, most of the research exploring the impact of institutional characteristics (e.g.,
institutional types) on students‘ educational aspiration is likely to be influenced by self-selection.
For example, using longitudinal data from 2,212 students from 18 four-year colleges and 262
students from five community colleges collected as part of the National Study of Student
Learning (NSSL), Cruce, Wolniak, Seifert, and Pascarella (2006) found that students‘
attendance at a research university was the only significant and positive influence on their plans
for a graduate degrees. Institutional environments more focused on research might encourage
students to be interested in graduate school, but students who choose a research university may
already be interested in pursuing graduate school. Using the three nationally representative
datasets (the National Secondary Student Assistance Study, Beginning Post-secondary Study,
and Integrated Postsecondary Educational Data System), Carter (1999) compared African-
American and White students‘ highest level of educational expectations by institutional
characteristics (e.g., institutional size, four-year vs. two-year institutions, and selectivity) as well
as individual characteristics. In this study, institutional size or selectivity seemed to be
influential in the students‘ educational aspirations; however this finding is also likely to be
affected by student‘s self-selection. Although these studies attempt to examine the impact of
institutional characteristics on students‘ career or educational plans and aspirations, their findings
cannot support the causal relationships.
In contrast to institutional characteristics, academic program or disciplinary
characteristics, such as curricular emphasis in engineering programs, might be less likely to be
confounded with student‘s self-selection. It is not difficult for high school students and their
parents to recognize institutional characteristics, (e.g., technology-focused institutions, research
institutions, or highly selective institutions), which might influence their college-choice
23
processes (Cabrera & La Nasa, 2000). Cabrera and La Nasa (2000) demonstrated that 11th
to
12th
grade students develop and evaluate the quality of the institution, campus life, availability of
majors, and financial abilities when targeting specific institutions. Students consider availability
of majors in general; however, it might be more difficult for them to choose their institutions
based on the curricular emphasis of individual academic programs, such as the engineering
program‘s focus on professional skills, diversity, the influence of social contexts in engineering,
or design skills. Thus, the impact of engineering programs‘ curricular emphasis on student‘s
future plans in engineering might be less influenced by self-selection than institutional
characteristics.
Beyond the concern for self-selection, the literature suggests that academic programs‘
curricular emphases and faculty members‘ engagement in teaching -- which influence students‘
experiences and learning (Pascarella & Terenzini, 2005) -- vary across engineering disciplines.
Lattuca et al. (2006) found that faculty engagement in learning-centered practices differed
among engineering disciplines. For example, some faculty and some programs were deeply
engaged in continuous improvement, assessment, and professional development activities in
support of their program‘s educational efforts while others were not. Lattuca, Terenzini, Harper,
and Yin (2010) also found that engineering faculty members varied in their perceptions of
changing curricular and pedagogical requirements, and these differences were consistent with the
patterns suggest by Holland‘s typology-based disciplinary environments. The authors suggested
that disciplinary variations in programs‘ and faculty members‘ values, customs, perceptions, and
dispositions related to curricular and pedagogical practices need to be considered because the
differences in programs or disciplines might influence variations in student learning and
experiences across disciplines.
24
Individual Students’ College Experiences
While student outcomes may be directly influenced by their academic programs, previous
investigations of student outcomes indicate that student experiences have the strongest and most
significant effects (Lattuca, et al., 2006; Pascarella & Terenzini, 2005). In the following section,
I discuss literature on engineering students‘ curricular, classroom, and co-curricular experiences
that might influence their post-graduation plans.
Curricular Experiences
Researchers have demonstrated the important influence of curricular factors on how
students explore and choose engineering as their majors, persist in engineering programs and
complete engineering degrees, and pursue engineering careers. Drawing evidence from the 11-
year college transcript history of the High Schools & Beyond/Sophomore Cohort Longitudinal
Study, Adelman (1998) introduced the concept of curricular momentum, which can reinforce
student trajectories within engineering or discourage student to leave engineering. Curricular
momentum begins in secondary school (e.g., mathematics); some high school students who are
not good at mathematics or not exposed to higher level of mathematics courses, cannot enter in
engineering programs. Grose (2008) also demonstrated that engineering students struggle to
understand course content and compete with other peers during the first two years, when they
typically take ‗gatekeeper‘ courses in math, physics, and chemistry. Academic difficulties and
competition may compel some students to leave in engineering. Adelman (1998) found, on the
other hand, some engineering students who had less difficulty in taking more quantitative
courses in colleges appear to switch their majors in physics and computer science. The studies
identified specific courses that challenged engineering students who wanted to enter engineering
pathways or allowed them to immigrate into other fields; however, the study did not suggest how
25
course content might be enablers or barriers for some students to persist in their interests in
engineering.
Beyond course-taking per se, some researchers have studied how course content (e.g.,
design and problem solving-based content) affects engineering students‘ decisions to remain in
engineering programs and ultimately pursue engineering careers. Rowan University, for
example, offers Engineering Clinics which infuse design into the curriculum through an eight-
semester course sequence in which students learn design in a multidisciplinary team environment
and increase design skills throughout their 4-year career (Kadlowec et al., 2007). In addition to
improving students‘ design skills, the Clinics reportedly enhanced students‘ communication
skills, contextual competence, ethics, and entrepreneurship. The University of Arizona similarly
found that project-based first-year engineering courses increased students‘ engineering design
knowledge (Bailey & Szabo, 2007). Researchers also suggested that freshmen engineering or
design experiences increase interest in the field of engineering (Sathianathan et al., 1998) and
improve retention and graduation rates (Bullen & Knight, 2006). Studies of problem-based
curricula have found increased student interest and higher grade point averages (Macias-Guarasa,
Montero, San-Segundo, Araujo, & Nieto-Taladriz, 2006) and increased critical problem solving
skills (Barroso & Morgan, 2009). All of these may influence engineering students‘ plans to
pursue engineering as a career and further education.
In addition to design and problem solving skills, engineering undergraduate programs
must include attention to the social contexts of engineering problems in their curricula to meet
ABET accreditation requirements. As engineers have been requested to communicate and work
with people of diverse and global backgrounds (Sheppard, Macatangay, Colby, & Sullivan,
2008), contextual competence has been emphasized in engineering programs. Stark & Lowther
26
(1988) defined contextual competence as ―the capability to adopt multiple perspectives which
allows the graduate to comprehend the complex interdependence between the profession and
society‖ (p.23). Stark & Lowther (1988) emphasize the importance of students‘ abilities to
make judgments in light of historical, social, economic, scientific, and political realities both as
experts in their professions and as citizens. Engineering programs and faculty members have
emphasized the importance of contextual competence because practicing engineers must
consider whether particular engineering solutions are feasible and desirable given historical,
social, economic, environmental, and political realities. Contextual competence in engineering
may also include the ability to work with clients and customers who have different cultural
backgrounds and perspectives.
To increase engineering students‘ contextual competence, U.S. engineering programs
have integrated societal, global, and current issues into their curriculum. Lattuca et al. (2006),
however, found that engineering students were least confident about their ability to understand
broader social contexts, when asked to rate their abilities in nine areas. In the APPLES study,
Sheppard et al. (2010) found that junior and senior students did not consider broad context more
than first-year students. One reason for this result may be that undergraduate engineering
curricula are heavily loaded with technical content courses rather than contextual content, despite
of the importance of contextual understanding.
Although engineering students seem to struggle to gain contextual competence, women
students consider broader contexts more so than men in engineering design problems (Sheppard,
et al., 2010). Stressing the social relevance of science and engineering is a strategy that has
proven successful in the recruitment and retention of women, which may, in turn, influence
women students‘ post-graduation plans. Women and underrepresented minority high school
27
students are also attracted to curricular content founded on ethics and global awareness
(Christensen et al., 2008). Contextualizing math and science skills using practical problems
effectively sparks and sustains women students‘ interest in STEM subjects (Halpern et al., 2007).
Classroom Experiences
Not surprisingly, students‘ academic content learning and cognitive skill development,
which might influence an engineering student‘s future plans in engineering, are greatest in areas
where they take the most courses (Pascarella & Terenzini, 2005). Curricular content alone,
however, may not produce as much learning as expected. For example, Trowbridge and
McDermott (1981) found that even after instruction, many of the 200 students in their study still
confused basic concepts in velocity and acceleration. To understand fully why curricula are
successful or not, researchers must look pedagogies and instructional practices beyond curricular
coverage.
In the higher education literature, researchers have examined the impact of a variety of
learning and teaching methods on a wide set of learning outcomes. Drawing on an extensive
literature, Pascarella & Terenzini (2005) noted that ―innovative, active, collaborative,
cooperative, and constructivist instructional approaches shape learning more powerfully… than
do conventional lecture-discussion and text based approaches‖ (p. 646). Because these learning
and teaching approaches have commonalities, researchers tend to use the terms interchangeably.
Prince (2006) as well as others (Millis & Cottell, 1998), however, distinguished among these
terminologies. Collaborative learning is a broader concept than cooperative learning in that
collaborative learning includes all student group works pursing a common goal (Smith &
MacGregor, 1992). Cooperative learning is a more structured form of group work where
students are assessed individually while they pursue common goals (D. Johnson, R., Johnson, &
28
Smith, 1998). These learning methods are regarded as positive factors influencing engineering
students‘ performance and career plans because the students collaborate to fill each other‘s
weakness in knowledge and skills with these learning methods (Marra & Bogue, 2003).
Engineering students‘ classroom experiences are strongly related to their attitudes toward
engineering and their confidence levels in engineering knowledge and skills. Compared to
majors in other fields, engineering majors are much more reliant on lecturing and individual
work, and norm-referenced grading (A. W. Astin, 1993), which appear to influence engineering
students‘ dissatisfaction levels and therefore student attrition from engineering programs and the
engineering workforce. Thus, researchers have suggested that cooperative and collaborative
learning and teaching methods to enhance engineering student‘s learning and development. For
example, conducting a longitudinal study at North Carolina State University, Felder, Felder, and
Dietz (1998) found differences in learning outcomes between students taught using cooperative
learning versus traditional methods. In a post-graduation survey, the students who experienced
active and cooperative learning reported group work as the most valuable feature of their
undergraduate education because they had to face the similar interpersonal problems on their job
that they had confronted in the their classes. Unlike their counterparts from other institutions,
the students learned strategies for how to work and communicate with team members from the
cooperative learning instructions. Strauss and Terenzini (2007) compared engineering students‘
learning outcomes for groups that reported different levels of active and traditional learning
techniques. They found that students in active learning settings had statistically significant
advantages in learning outcomes, specifically in design skills, communication skills, and group
skills. Lattuca et al. (2006) also found that classroom experiences were the most powerful
29
predictor on engineering student‘s learning outcomes, although a variety of out-of-classroom
experiences also positively influenced learning outcomes.
In addition, active and collaborative learning approaches increase student persistence in
engineering, which, in turn, might influence student career and graduate education plans. In a
meta-analysis of 37 studies of small group learning in college-level science, math, engineering
and technology courses, students working collaboratively or cooperatively persisted in STEM
courses or programs at a higher rate than students who did not (Springer, Stanne, & Donovan,
1997). Suresh (2006) also suggested that students‘ perceptions about faculty teaching methods
influenced student persistence in engineering majors. Traditional teaching styles, such as
lectures, and the ―weed-out culture‖ discouraged students from persisting in engineering majors,
which would also impact post-graduation plans in engineering. Felder, Felder, and Dietz (1998)
also found that students experienced with cooperative learning were more likely to pursue
advanced study in engineering fields.
Active learning approaches may also have a positive impact on women and minority
students‘ learning and plans. For example, feminist pedagogies in engineering courses are said
to invigorate engineering curricula with inclusive learning pedagogies and improve classroom
climates for women and other underrepresented students. Pawley (2004) found that different
classroom techniques, such as group work, were more beneficial to women and minority students
than were traditional methods. Teamwork pedagogies and feminist pedagogies also influenced
students‘ affective responses to teamwork and women students‘ intentions to persist in
engineering in the future (Hartman & Hartman, 2006). Although these studies each examined a
single institution, together they suggest that if the engineering students had effective teamwork

30
experiences and positive attitudes toward team members, they were encouraged to persist in their
engineering career plans.
Out-of-class Experiences
Engineering students‘ learning and development are shaped not only by what happens in
classroom, but by experiences outside classroom as well. In a study of learning in a nationally
representative sample of engineering seniors, out-of-class experiences made statistically
significant and independent contributions on learning, although curricular and classroom
experiences are the most powerful effects on learning (Lattuca, et al., 2006). Strauss and
Terenzini (2007) found that, in addition to their in-classroom experiences, engineering students‘
out-of-class experiences (e.g., participating in an engineering, design competition, employment
status, having an internship/cooperative, education experiences, and being involved in a student
chapter of a professional society or association) made significant and unique contributions to
students‘ analytical and group skills. These findings support the proposition that students
develop academic knowledge and skills through formal or informal activities related curricula
outside the classroom as well as in it.
Among a broad set of co-curricular activities, study abroad programs contribute to
students‘ confidence in their ability to appreciate foreign culture and intercultural relationships
(Bettez, 2004) and communicate with multicultural people (A. W. Astin, 1993; Esparragoza,
Friess, & Larrondo, 2008), as well as their knowledge of other countries and market places and
sensitivity to the perspectives of others (Alexander, Besterfield-Sacre, Matherly, & Shuman,
2008; Evans & McGinnis, 2006). The confidence in many of the professional and global skills
increasingly called for in engineering practice may encourage engineering students to choose and
succeed in engineering. However, engineering students might not be able to take advantage of
31
co-curricular activities that institutions provide because of a sense of curricular overload (Atman,
et al., 2010). In the APS studies, researchers found that engineering students report lower gains
in personal growth and fewer opportunities to study abroad than students in other majors. A lack
of opportunities to integrate the knowledge they are gaining about engineering from engineering
courses into real- and global- world problems and settings might make students hesitant about
engineering work or graduate school (Jocuns, Stevens, Garrison, & Amos, 2008).
Participation in undergraduate research programs has also been shown to positively
influence student success in engineering programs. Since undergraduate research programs are
aimed at providing students more research experiences and encouraging students to continue
their graduate education in engineering, researchers have focused on the impact of undergraduate
research experiences on enrollment in graduate education. A considerable amount of research
has found that undergraduate research experiences encourage students to continue graduate
education in engineering or STEM-related fields (Lopatto, 2004, 2007; Seymour, Hunter,
Laursen, & DeAntoni, 2004). Because they learned a variety of research skills that engineering
graduate schools require, engineering undergraduate students perceived that their undergraduate
research experiences helped them to understand the atmosphere and research environment that
exists in engineering graduate schools (A. W. Astin, 1993). Through undergraduate research
experiences, students can also develop networks and interact with faculty members and graduate
students in undergraduate research programs. The formal and informal interactions with faculty
members though undergraduate research programs had a positive impact on the graduate
education choices of engineering students (A. W. Astin & Astin, 1992; C. M. Kardash, 2000).
The positive impact of co-curricular experiences applies to women and underrepresented
minority engineering students as well. Robinson and Reilly (1993) found that women alumnae
32
of engineering programs liked opportunities to apply their technical knowledge, but did not
believe there were enough co-curricular opportunities for such application. The women
engineering graduates reported that the importance of involvement in student organizations,
which assisted them in improving their personal and communication skills – which are required
for professional success and advancement. Research also indicates that women and minority
students who participated in undergraduate research programs were more likely to stay in
engineering fields and pursue an engineering graduate degree (Ogunfunmi, 2008). Oseguera,
Hurtado, Denson, Cerna, and Saenz (2006) also found that involvement in research-oriented
programs prior to college years substantially increased minority students entering freshmen‘s
interests in pursuing a science research career. Other research, however, indicates that the
impact of undergraduate research experiences was significant only when faculty members have
enough interaction with students or played a vital role in being a role-model to them (A. W.
Astin & Astin, 1992; Guterman, 2007). Similar to the findings of Oseguera et al. (2006),
Christie (2008) found that a seven-year community outreach program at a community college
improved the pipeline of underrepresented minorities studying science, engineering or
mathematics at college level. In this outreach program, the role of faculty members was one of
the important factors for minority student success in engineering pipeline.
There is no debate among the engineering profession and academia of the benefit derived
by students from participation in co-curricular programs. However, most of the research has a
critical limitation in that it is almost impossible to develop an experimental design and control
for other unexplained variables to evaluate co-curricular programs (Ehrenberg, Kuh, & Cornell
Higher Education Research Institute, 2009). For example, it is possible that students choose
study abroad programs, undergraduate research programs, or internship, because they are already
33
interested in an engineering career or graduate education. Other students who are disciplined
towards engineering employment, on the other hand, may avoid exposure to co-op and internship
experiences. Thus, using a pre-post research design, some researchers argued that the impact of
co-curricular programs is not substantial, because the students in the experiment are already
highly interested in engineering disciplines (Lemke, 2009). The selection bias suggests that
there is a need of more rigorous empirical evidence that supporting the positive impacts of co-
curricular experiences on post-graduation plans.
Furthermore, the effects of participation in co-curricular activities on post-graduation
plans seem to be complicated. Research suggests the top predictor of engineering job plans is
exposure to engineering experiences such as cooperative education and internships; however,
this same variable also appears to be a negative predictor for plans for non-engineering
employment. In the APPLES survey, Sheppard et al. (2010) found that students participating in
internship and cooperative education were more likely to pursue engineering careers and
graduate school. Using a qualitative research design, Seymour and Hewitt (1997) concluded that
co-curricular experiences encouraged engineering students to pursue an engineering career and
keep on track because the activities allowed students who had little idea of what engineers
actually do to experience engineering profession. In contrast, Lichtenstein et al.(2009) cited a
student who had internship which experiences taught her the real engineering profession was not
interesting to her. Throughout the experiences, she was disinclined towards engineering as a
career, but she recognized the power of the engineering degree for getting a high-paying job. It
is unwise to generalize from the interviews cited by Seymour and Hewitt (1997) and Lichtenstein
et al.(2009); however, it is clear that the impacts of co-curricular activities on persistence in
programs or plans to stay in engineering professions or graduate school depend on satisfaction
34
from the experiences or a sense of fit into engineering disciplines and workforce rather than
merely participation in co-curricular programs.
Outcomes
In 1996, the ABET Board of Directors adopted a new set of accreditation standards,
called Engineering Criteria 2000: Criteria for Accrediting Programs in Engineering in the
United States (EC2000) (ABET, 1997). The accreditation criteria stress not only the
development of students‘ mathematical, scientific, and technical knowledge but also other
professional skills, such as solving unstructured problems, communicating effectively, and
working in teams, as well as awareness of ethical and contextual considerations in engineering
(ABET Engineering Accreditation Commission, 2008). Educating the Engineer of 2020 (E2020)
(National Academy of Engineering, 2005) also provides identifies the attributes and skills in
order to maintain America's technological and economic competitiveness. Concurrently,
engineering instructors and faculty members are also redesigning engineering education
emphasizing these engineering skills to students, because these attributes and skills are congruent
with current trends found in industry (Sheppard, et al., 2008). Students‘ perceptions of their
levels of knowledge and skill in these areas may influence their decisions to pursue an
engineering career. Higher levels of confidence may result in a greater likelihood to choose an
engineering career or graduate program that will lead to an engineering career. Few researchers,
however, have explored whether students‘ perceptions of their engineering skills contribute
positively or negatively to their choice of a career in engineering. Theory and recent research,
however, support this hypothesis.
Holland (1997) theorized that individuals choose occupations that are consistent with
their vocational aspirations, interests, competencies, and self-rated abilities. Exploring the
35
relationships among interests, competencies, and self-rated abilities, Holland (1997) found there
are positive correlations between students‘ interests in scientific occupations and scientific
competencies. However, there is some ambiguity whether students‘ competencies affect their
interests in certain occupations. Some studies have demonstrated a high level of correspondence
between self-efficacy and interests in determining career choice (Tracey & Hopkins, 2001).
Using data from senior high school students from a nationally representative study, however,
Tracey and Hopkins (2001) concluded that self-efficacy or abilities1 and interests each make
unique contributes to occupational choice. Lent, Brown, Hackett (1994) suggested the mediating
role of interest between self-efficacy and career choice, the Tracey and Hopkins (2001) study,
supported the presence of this independent contribution of abilities to career choice. In the
following section, I review and discuss the literature on the effect of students‘ engineering
knowledge and skills on their post-graduation plans.
The Effect of Student Abilities on Post-graduation Plans
In the engineering education literature, research has focused on specific engineering skills
and their relationship to engineering students‘ career plans. Fundamental skills, including basic
mathematics and science competency, have historically been emphasized in undergraduate
engineering programs. In the Persistence in Engineering (PIE) survey, a preliminarily
explanatory research to develop the APPLES survey, Eris et al. (2007) found that students who
leave engineering in their early years have lower levels of confidence in their math and science
skills than students who persist. Self or other assessments of fundamental skills are likely to be
important to students as they decide to leave or persist in engineering career or graduate
education after college graduation.
1 Tracey & Hopkins (2001) used the term, self-efficacy and abilities interchangeably.
36
A. W. Astin and Astin (1992)examined factors that influenced first-year college students‘
interests in studying science and in pursuing science-related careers. The most powerful
predictor of changes in students‘ interest in science majors and careers was their entering level of
mathematical or academic competency. Similarly, Sax (1994) found that self-ratings of math
ability were a significant predictor of retention, which is presumed to influence persistence on
paths to careers in engineering. In an experiment with undergraduate students, Correll (2004)
found that students who reported higher assessments of their own mathematical ability were
more likely to pursue engineering and science careers than other counterparts. Further Correll
(2004) showed self-ratings of math abilities significantly differed for men and women. This
gender disparity in self-ratings of abilities might contribute to women students‘ persistence on
paths to careers in engineering.
Self-ratings of spatial skills have also been examined as a predictor of engineering
performance, a potential influence on engineering career plans. Malicky (2003) found that
spatial skills were one of the engineering skills that predict engineering performance. As with
fundamental engineering skills, however, there is a gender difference in self-ratings of spatial
skills. Sorby, Leopold, and Gorska (1999) found that men students rated their spatial abilities
significantly higher than women students. Devon, Engel, and Turner (1998) found, however,
that these gender differences were substantially decreased by additional training (i.e., practicing
to increase spatial skills) offered to both the women and men participants. Spatial skills might be
related to design or problem-solving skills, and thus students who are confident of their spatial
skills maybe encouraged to pursue engineering careers and graduate school. Lichtenstein et al.
(2009) suggested, however, that the problem-solving skills engineering students develop as a
37
result of their undergraduate programs would provide a good basis for exploring a various range
of options after graduation.
Engineering programs have emphasized attributes such as contextual competence
because engineering graduates are working in a world that is more complex technologically,
culturally, and globally (National Academy of Engineering, 2004, 2005). As noted earlier,
however, Lattuca et al. (2006) found that when asked about ABET-related learning outcomes,
engineering students were least confident about their ability to understand broader social
contexts. Sheppard et al. (2010) also found that senior students did not indicate greater
attentiveness to the broad context of engineering design problems. Research has explored which
factors influence engineering students‘ contextual competence (see Lattuca, et al., 2006);
however, no study has investigated the effects of engineering students‘ confidence in contextual
and broad perspective on their post-graduation plans.
Conceptual and Methodological Issues of Self-ratings
Self-ratings of abilities have been examined as either explanatory factors or predicted
values in studies of student outcomes. Terenzini and Reason (2005) considered self-ratings of
college student abilities, which they called learning outcomes, as a criterion measure that is
influenced by student experiences. However, college students‘ abilities (or outcomes) have also
been analyzed as explanatory factors influencing outcomes such as persistence and post-
graduation plans. Self-rated or self-assessed student abilities are a psychological construct that
can be influenced by educational experiences and predict student performance, such as post-
graduation plans. Researchers use different terms to describe student perception of their abilities,
including self-efficacy, self-rated abilities, and achievement. These three attributes are likely to
be correlated.
38
Some researchers treat reports of self-efficacy as equivalent to self-estimated or -rated
abilities. There are some similarities between these two constructs; both involve people‘s beliefs
about their personal capabilities. Based on Social Learning Theory (1977, 1986), Bandura (1997)
proposed the concept of self-efficacy, which is defined as an individual‘s own perception of his
or her ability to carry out the necessary actions to achieve a certain outcome. Self-efficacy is
conceptualized as the assessment of one's self-perceived ability to do certain tasks. Tracey &
Hopkins (2001) also explained self-efficacy as ―self-estimates of ability to successfully engage in
a behavior‖ (p. 178) and assumed the self-efficacy and self-rated abilities as an interchangeable
concept. Concannon (2009) defined engineering self-efficacy as an individual‘s belief in his or
her ability to successfully negotiate the academic hurdles of the engineering programs.
In contrast, other researchers distinguish self-rated abilities from self-efficacy. Brown,
Lent, and Gore (2000) proposed that self-efficacy and self-rated abilities represent empirically
related but distinct constructors. In the development of vocational interests and choices, self-
rated abilities were defined as normative judgments about one‘s current work-related abilities
(Swanson, 1993). For example, some researchers measured self-rated abilities by asking
respondents to compare themselves to others of their own age on artistic ability, scientific ability,
and so forth, using a scale from ―low ability‖ to ―high ability‖ (Brown, et al., 2000; Swanson,
1993). On the other hand, self-efficacy was defined as reflect an individual‘s expectations about
future performance in specific tasks and environments that are based on judgments of
capabilities (Lent & Brown, 2006; Lent, et al., 1994). Brown et al. (2000) summarized this
distinction, explaining that self-efficacy was assumed as prospective or future-oriented
performance capabilities, whereas self-rated ability was focused on judgments about current
abilities.
39
Furthermore, self-reported abilities have been distinguishable from student-reports of
their academic achievement. In the higher education literature, standardized tests (e.g., SAT and
ACT) or high school and college GPA are often employed as measures of students‘ academic
achievement. Researchers tend to treat these grades and scores as actual ability, distinguished
from self-assessments of competence in certain task (Correll, 2004) or domain. A few studies
distinguished the effects of actual abilities and self-ratings of abilities on career decisions and
controlled for the effects of actual abilities (i.e., previous academic achievement) on their career
plans (Correll, 2004; Nauta, 1998).
Mediating Effect of Students’ Abilities
The hypothesis of the mediating effect of students‘ psychosocial characteristics on career
aspiration and plans has been explained by researchers in the career development field. The
assumption is that if engineering students have beneficial (or detrimental) experiences during
their undergraduate years, this increases (or decreases) their self-confidence related to
engineering tasks. This self-assessed competence in turn influences aspirations and intentions to
persist in engineering careers and graduate education.
Many of these studies employed Bandura‘s Social Cognitive Theory (1977, 2001) as a
conceptual framework, which suggests the mediating role of self-efficacy in predicting student‘s
performance. With respect to career plans and aspirations, researchers have examined if self-
efficacy mediates between actual ability and academic performance (Nauta, 1998) and between
student experiences and outcomes such as career aspirations (Bandura, 2001). For example, a
student may have high ACT/SAT scores or a high college GPA, but without self-efficacy her
performance suffers. The assumption is that a variety of college experiences influence students‘
self-efficacy (Malicky, 2003), which then predicts higher level career aspirations. Higher self-
40
efficacy caused by beneficial experiences positively influence students‘ persistence on paths to
engineering careers. Conversely, lower self-efficacy due to negative experiences, such as
gender-based discrimination, differentially influences women students to not persist. Malicky
(2003) concluded that self-efficacy might be a mediator between sexual discrimination and
persistence for women engineering students. Just like self-efficacy, student motivation has a
mediating effect on student performance. Some students with high level of motivation to
succeed in the field persist in engineering majors although they struggle with challenging courses,
such as calculus, physics, and statics (which typically have the highest rate of failures and/or
withdrawals) (Suresh, 2006).
In the higher education and engineering education literatures, self-efficacy has been most
often studied as a psychological trait of college students that influences post-graduation plans.
Many studies have employed Bandura‘s theory and examined the effects of self-efficacy on
career plans or aspirations (see Hackett, 1997). In contrast, there is a lack of literature on the
influence of self-rated abilities on post-graduation plans. Few studies use students‘ perception of
their abilities as a trait that mediates the relationships between student experiences and their
plans. Given that both self-efficacy and self-rating of student abilities are psychological traits,
empirical evidence is needed to determine if self-ratings of abilities also mediate the relationship
between students‘ experiences and their plans, as in the case of self-efficacy.
Post-graduation Plans: Engineering Career and Educational Plans.
Recently, several studies demonstrated that majoring in engineering does not necessarily
result in an engineering career choice. Ngambeki, Dalrymple, and Evangelou (2008) found that
students who completed a major in engineering were not necessarily committed to engineering or
even STEM careers. Many of the highest-achieving students chose careers and graduate schools
41
in other fields (Lowell, et al., 2009). Lowell and Salzman (2007) found that two years after
graduation from science and engineering programs, 20% of the graduates with bachelor's degrees
were in non-science and engineering graduate programs and 45% were in the workforce but not
in science or engineering jobs. To identify which factors influence engineering graduates choice
of careers and graduate school, the APPLES study and the Longitudinal Cohort study have
examined how engineering students develop their career and graduate education plans inside or
outside of engineering (Atman, et al., 2010).
Both studies reflected uncertainty in seniors about their post-graduation engineering plans.
In the Longitudinal Cohort analyses, of 28 Longitudinal Cohort seniors at two of the four study
schools, 15 fell into the unsure category. These ―unsure‖ students seemed to be willing to
explore different job options; however, they tended to struggle with the large number of options
both within and outside of the engineering profession. The students felt that their engineering
education and problem-solving skills would provide a good basis for exploring different options
after graduation (Lichtenstein, et al.). Using nationally representative data, Sheppard et al. (2010)
found similar patterns in engineering students‘ post-graduation plans.
In the APPLES survey, Sheppard et al. (2010) asked engineering students to report their
plans in late winter through early spring of their senior year. They found that about 30% of the
engineering seniors had post-graduation plans focused exclusively on engineering (work and/or
graduate school), while only 8% were uncertain about their plans to enter into engineering work.
Twenty-five percent of the seniors considered both in and outside of engineering for their future
careers and graduate school, which indicates that one in four seniors were unsure whether an
engineering or non-engineering path would be the best fit for them. Although the effects of
program or institutional characteristics on engineering students‘ post-graduation plans were not
42
specifically a part of their study, Sheppard et al. (2010) proposed that engineering senior‘s post-
graduation plans might be influenced by mentorship and advising from engineering faculty and
staff members.
Sheppard et al. (2010) also found racial differences in engineering students‘ post-
graduation plans. URM students (Black, Hispanic, and Native American) were initially more
interested in engineering graduate schools. Particularly in the first year, URM students
expressed significantly more interest in enrolling in engineering graduate school than did non-
URM students (65% vs. 38%). Even in the senior year, one-and-a-half as many URM seniors
than non-URM seniors still expressed plans to attend engineering graduate school (57% vs.
40%).2 Although a racial gap remains in engineering graduate school enrollment, this study
shows that URM students have strong interests in engineering graduate school which might
translate into actual graduate school enrollment. More senior URM students also considered
multiple options that span engineering and non-engineering careers and graduate school than did
non-URM students (67% vs. 56%). Sheppard et al. (2010) suggested that URM students might
have broader interests in job options and that engineering as a profession should put more efforts
to retain these students.
To ensure a supply of enough and high qualified engineers, engineering programs have
encouraged engineering students‘ interest in engineering careers and graduate education. In fact,
because career aspirations or plans might be different from actual post-graduation outcomes,
actual engineering career employment or graduate school enrollment are the most valid measures.
Still, understanding the factors that influence college students‘ career or graduate school plans or
aspirations upon graduation is an important focus for research because such plans are typically
2 By the senior year, URM status was no longer a predictor, when controlling for other factors. However, the actual
percentages still indicate that more URM students are more interested in attending engineering graduate school than
non-URM students.
43
among the best predictors of actual choice of professions or graduate school enrollment (A. W.
Astin, 1977; Pascarella & Terenzini, 2005; Tinto, 1993; Whitaker & Pascarella, 1994). Further,
given that engineering students may make plans to leave engineering after earning an
undergraduate degree (Eris, et al., 2007; Lichtenstein, et al., 2009), researchers also need to
understand which factors influence engineering students‘ post-graduation plans. Only then can
undergraduate engineering programs design interventions to keep engineering students in the
engineering profession and engineering graduate programs.
Conceptual and Methodological Issues of Post-graduation Plans
The research literature on college students‘ career choice (including graduate education)
employs a variety of terms, including career aspirations, career plans, educational aspirations, or
educational plans. Because researchers defined these terms differently, this section examines
generally accepted definitions and highlights distinctions among them.
Researchers employ career aspirations as a psychological outcome influenced by social
and educational experiences (Bandura, 1997). As a psychological construct, students‘ career
aspirations can be specified by two components: ambition and inspiration (Plucker, 1998;
Quaglia & Perry, 1995). Ambition refers to a student's sense of educational and vocational goals
for the future. Inspiration refers to students' involvement in an activity for its intrinsic value and
enjoyment (Plucker, 1998). Career aspiration is also conceptualized differently depending on
research targets. In studies of children, career aspiration is conceptualized as the extent to which
children perceive the real profession or the social value of an occupation. These studies aim to
investigate how children abandon fantasy occupational aspirations (Helwig, 2001); and how they
conceptualize and assess realistic vocational aspirations based on their perceptions of
occupational gender roles (Gottfredson & Lapan, 1997). In research on employees, career
44
aspirations have been conceptualized as the extent to which people aspire to leadership or
advanced positions within their chosen occupation (Dukstein & O'Brien, 1995, August; O'Brien
& Fassinger, 1993). These are called as higher-level career aspirations (Nauta, 1998).
The proposed study assumes that the concepts of career aspiration and plans are
distinguishable. Although career aspirations and plans seem to be used interchangeably, career
plans suggest more immediate and realistic intentions than aspirations or ambitions. For
example, college students, especially seniors, should have more specific future career plans than
young children. Thus, post-graduation plans might be a more valid measure of actual future
career choices than career aspiration or ambition. Post-graduation plans for this study are
defined as engineering students‘ plans for a career or graduate education after completion of the
baccalaureate degrees either in engineering or outside engineering.
Conceptual Framework
The conceptual framework of this dissertation adapts Terenzini and Reason‘s (2005)
model to examine engineering students‘ post-graduation plans. Pre-college characteristics
consist of gender, race, and academic achievement (high school GPA, and SAT math scores).
This study combines the organizational context and individual student experiences from
Terenzini and Reason‘s (2005) model into ―academic program experiences‖ because students‘
college experiences are shaped by their majors and also vary by class standing (or year in
college). Research suggests the curriculum and instructional practices, faculty attitudes and
behaviors, and program culture and norms of engineering programs vary by engineering
disciplines (Lattuca, et al., 2010; Lattuca, et al., 2006); academic programs (i.e., engineering
disciplines) are likely to differently influence students‘ educational experiences. Students‘
45
disciplinary experiences also can vary by class standing (i.e., year in college). For this reason,
discipline and class standing are considered features of the academic program experience.
With regard to the individual student experience, the study adopts the curricular and
classroom experience components that Terenzini and Reason (2005) proposed with the exception
of out-of-classroom experiences. Terenzini and Reason (2005) listed internships, cooperative
education, and study abroad as examples of the curricular experiences because they assumed that
these activities are part of the general or major field curriculum. In contrast, this study considers
these activities to be co-curricular experiences because it is sometimes unclear in the dataset
whether these activities are awarded academic credit (and are thus a part of a students‘
curriculum) or if they are out-of-class activities as Terenzini and Reason defined them. For this
study, co-curricular experiences are defined as student activities that are intentionally designed
with learning as a goal and that are related to the content of the engineering program although
not necessarily in a formal way; for example, as credit-bearing activities or requirements. The
co-curriculum, then, is defined as activities specifically related to engineering, such as,
internships and engineering clubs.
The proposed conceptual model for this study extends Terenzini and Reason‘s model by
including a factor presumed to mediate student experiences and post-graduation plans: domain
knowledge and skills. ―Domain knowledge and skills‖ is operationalized as a self-assessment of
specific abilities in following areas: fundamental skills, design skills, and contextual awareness.
Thus, the conceptual model that I propose considers not only the effects of college and program
experiences on students‘ post-graduation plans but also those of the domain knowledge and skills
that students have gained throughout their undergraduate engineering education (Figure 2.2).
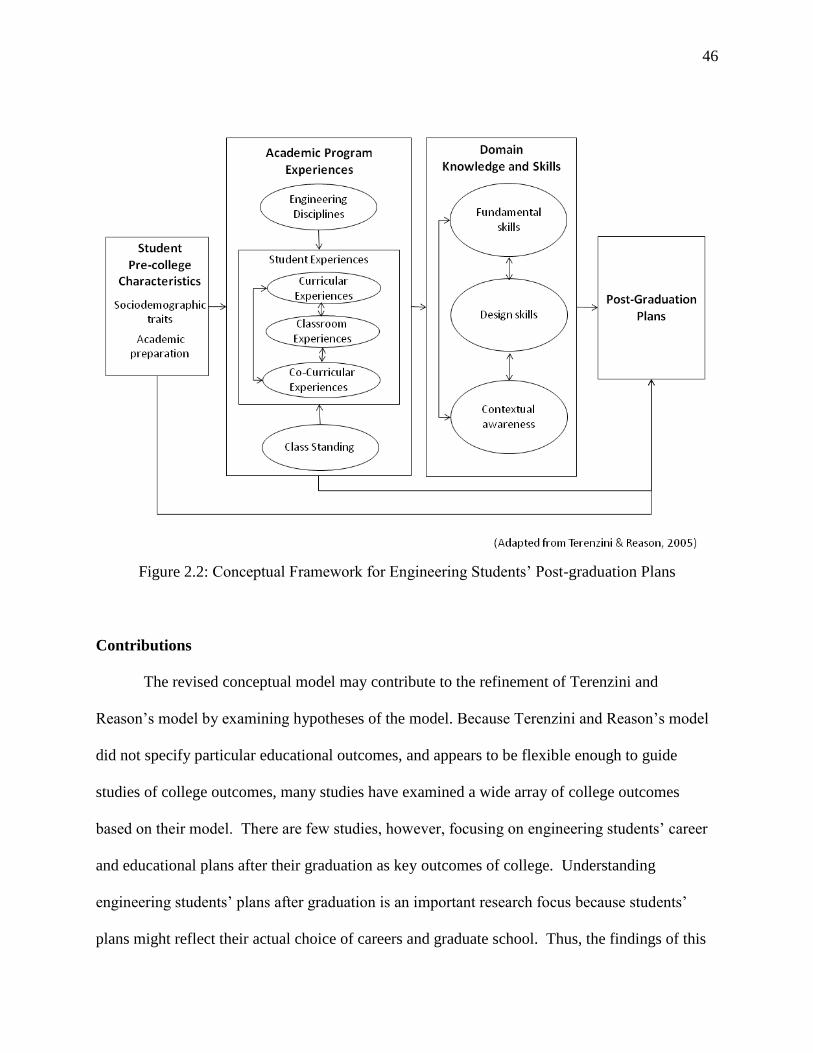
46
Figure 2.2: Conceptual Framework for Engineering Students‘ Post-graduation Plans
Contributions
The revised conceptual model may contribute to the refinement of Terenzini and
Reason‘s model by examining hypotheses of the model. Because Terenzini and Reason‘s model
did not specify particular educational outcomes, and appears to be flexible enough to guide
studies of college outcomes, many studies have examined a wide array of college outcomes
based on their model. There are few studies, however, focusing on engineering students‘ career
and educational plans after their graduation as key outcomes of college. Understanding
engineering students‘ plans after graduation is an important research focus because students‘
plans might reflect their actual choice of careers and graduate school. Thus, the findings of this

47
study may have implications for increasing the number of students who pursue to enter the
engineering workforce and graduate school.
48
Chapter 3
METHODS
Operationalizing the Conceptual Framework
This dissertation examines the factors that influence engineering students‘ post-
graduation plans both in and outside the engineering field. Three hypotheses are explored: 1)
Engineering student‘s post-graduation plans vary based on pre-college characteristics, such as
gender, race, and academic preparedness. 2) Students‘ graduation plans are influenced by their
academic program experiences and self-ratings of their engineering knowledge and skills after
taking into account certain student- and institutional characteristics. 3) Students‘ pre-college
characteristics and academic program experiences (including students‘ curricular, instructional,
and co-curricular experiences, which are shaped by the major field and class standing) influence
their post-graduation plans through their self-ratings of their engineering knowledge and skills,
(after controlling for student and institutional characteristics). Using multinomial logistic
regression, this investigation tests these hypothesized linkages.
Following the conceptual framework based on Terenzini and Reason‘s model of college
impact and grounded in the higher education literature, I developed an analytical model to
examine the linkages between student per-college characteristics, academic program experiences,
abilities in engineering knowledge and skills, and post-graduation plans (Figure 3.1).
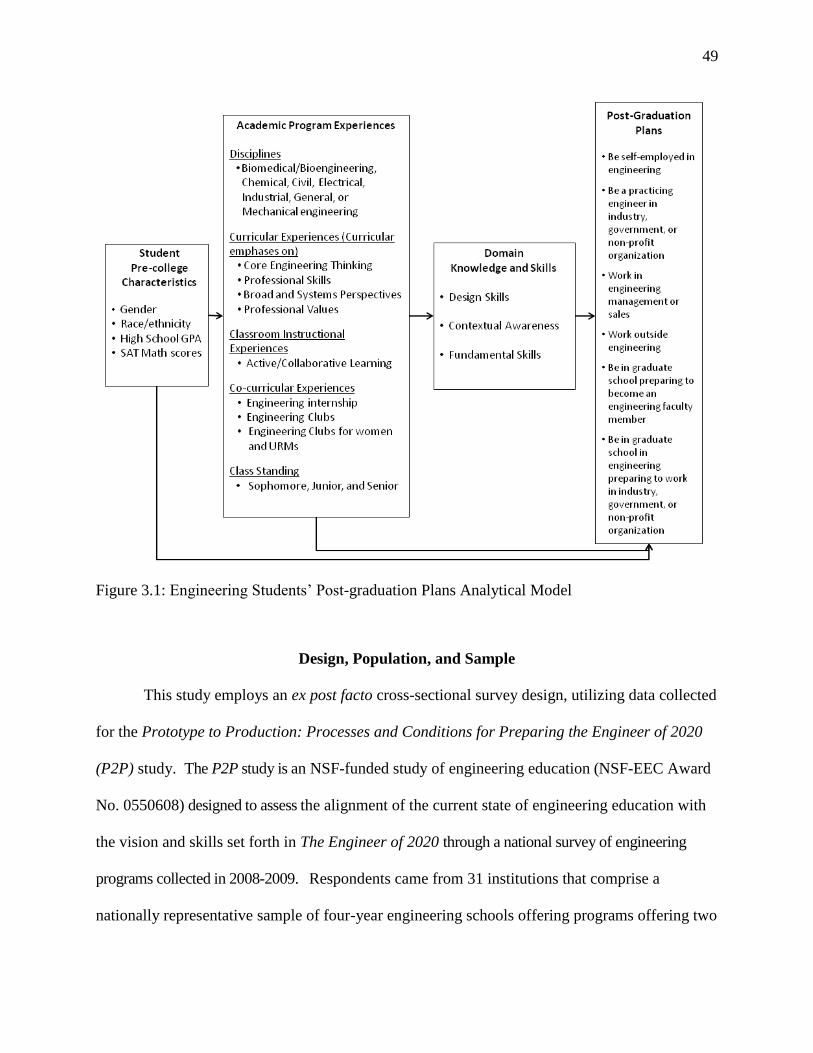
49
Figure 3.1: Engineering Students‘ Post-graduation Plans Analytical Model
Design, Population, and Sample
This study employs an ex post facto cross-sectional survey design, utilizing data collected
for the Prototype to Production: Processes and Conditions for Preparing the Engineer of 2020
(P2P) study. The P2P study is an NSF-funded study of engineering education (NSF-EEC Award
No. 0550608) designed to assess the alignment of the current state of engineering education with
the vision and skills set forth in The Engineer of 2020 through a national survey of engineering
programs collected in 2008-2009. Respondents came from 31 institutions that comprise a
nationally representative sample of four-year engineering schools offering programs offering two
50
or more ABET-accredited programs in the six engineering disciplines:
biomedical/bioengineering3, chemical, civil, electrical, industrial, or mechanical engineering. In
the aggregate, these six disciplines accounted for 67 percent of all baccalaureate engineering
degrees awarded in the U.S. in 2007.
The research team used a 6 x 3 x 2 disproportionate stratified random sampling to select a
nationally representative sample population of engineering programs using three strata:
Six discipline levels,
Three levels of highest degree offered (bachelor's, master's, or doctorate), and
Two levels of "type of control" (public or private).
The total sample of 32 four-year colleges and universities was ―pre-seeded‖ with nine
pre-selected institutions. These included the six case study institutions participating in a
companion project (Prototyping the Engineer of 2020: A 360-degree Study of Effective
Engineering Education) and three institutions with general engineering programs. Penn State‘s
Survey Research Center selected 23 additional institutions at random from the population within
the 6x3x2 framework above. The final sample also included three Historically Black Colleges
and Universities (HBCUs) and three Hispanic-serving Institutions (HSIs). The sampling design
ensured that the sample institutions are representative of the population with respect to type,
mission, and highest degree offered and student populations with respect to discipline,
race/ethnicity, gender, class status, and full-/part-time status distributions (Table 3.1).
Population data was drawn from the American Society for Engineering Education (ASEE)
database using 2008 numbers for current students.
3 Despite its relatively small size, biomedical/ bioengineering was included as one of the focal disciplines, because
of its prominence in Educating the Engineer of 2020 and its position as a rapidly growing discipline, which was
recommended by the project‘s National Advisory Board.
51
The four-year student population was defined as all sophomore, junior, and senior
students in one of the focal engineering disciplines. Since some engineering programs do not
allow students to declare a major until their sophomore year, the study‘s sample does not include
first-year students. All students on each campus meeting the study‘s population specifications
were invited to participate. Chi-square Goodness-of-Fit tests indicated that on some precollege
student characteristics, respondents were marginally unrepresentative of the overall campus
population of engineering students with respect to one or more of the following characteristics:
discipline, race/ethnicity, gender, or class level. The Chi-square test, however, is sensitive to
large numbers. When comparing the population and sample distributions on these student
characteristics, the proportions were relatively similar; differences between population and
sample proportions ranged from 1% to 11%. Nonetheless, weights were developed to adjust for
response bias (at the campus level) and for differences in institutional response rates. Weighting
adjustments corrected for minor response biases, producing nationally representative samples for
students with respect to sex, race/ethnicity, class, and engineering discipline. Consequently, the
adjusted sample can be considered representative of the population of engineering students (as
specified) both on each campus and nationally.
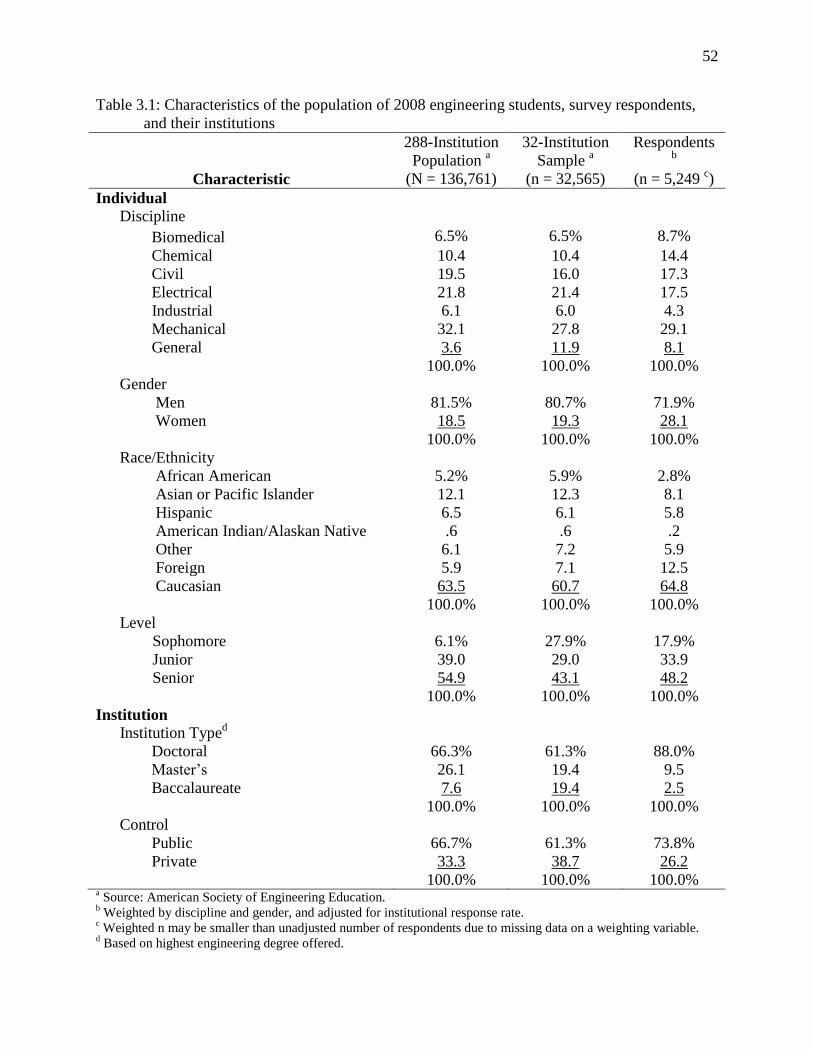
52
Table 3.1: Characteristics of the population of 2008 engineering students, survey respondents,
and their institutions
288-Institution
Population a
32-Institution
Sample a
Respondents
b
Characteristic (N = 136,761) (n = 32,565) (n = 5,249 c)
Individual
Discipline
Biomedical 6.5% 6.5% 8.7%
Chemical 10.4 10.4 14.4
Civil 19.5 16.0 17.3
Electrical 21.8 21.4 17.5
Industrial 6.1 6.0 4.3
Mechanical 32.1 27.8 29.1
General 3.6 11.9 8.1
100.0% 100.0% 100.0%
Gender
Men 81.5% 80.7% 71.9%
Women 18.5 19.3 28.1
100.0% 100.0% 100.0%
Race/Ethnicity
African American 5.2% 5.9% 2.8%
Asian or Pacific Islander 12.1 12.3 8.1
Hispanic 6.5 6.1 5.8
American Indian/Alaskan Native .6 .6 .2
Other 6.1 7.2 5.9
Foreign 5.9 7.1 12.5
Caucasian 63.5 60.7 64.8
100.0% 100.0% 100.0%
Level
Sophomore 6.1% 27.9% 17.9%
Junior 39.0 29.0 33.9
Senior 54.9 43.1 48.2
100.0% 100.0% 100.0%
Institution
Institution Typed
Doctoral 66.3% 61.3% 88.0%
Master‘s 26.1 19.4 9.5
Baccalaureate 7.6 19.4 2.5
100.0% 100.0% 100.0%
Control
Public 66.7% 61.3% 73.8%
Private 33.3 38.7 26.2
100.0% 100.0% 100.0% a Source: American Society of Engineering Education.
b Weighted by discipline and gender, and adjusted for institutional response rate.
c Weighted n may be smaller than unadjusted number of respondents due to missing data on a weighting variable.
d Based on highest engineering degree offered.
53
Data Collection Procedures and Response Rates
Participating institutions provided the research team with electronic files containing
contact information and students' gender, race/ethnicity, class level, and engineering field. In
April 2009 and in advance of the first mailing, the dean of engineering on each campus e-mailed
students to advise them of the institution's participation in the study, alerting them that they
would soon hear from the research group, summarizing the potential benefits to the campus, and
encouraging them to participate in the study. The Penn State Survey Research Center (SRC)
conducted all data collection for the student survey. SRC e-mailed a web-based invitation to
complete the web-based survey. Two weeks after the initial contact, non-respondents received
an e-mail reminder. After an additional two weeks, non-respondents received a final e-mail
request to complete the survey. SRC removed all personally identifying information from the
dataset before releasing it to the research team.
The resulting sample included survey responses from 5,249 students (a 16% response rate)
in 31 colleges of engineering during the 2009 spring and summer terms (one of the institutions
sampled was unable to provide the necessary student contact information in a timely fashion). In
this study 5,239 student data were used because 10 students identified their major as undeclared,
so the cases were not included in the analysis. Missing data were imputed using procedures
recommended by Dempster, Laird, and Rubin (1977) and by Graham (2009). The research team
subsequently imputed all missing data using the Expectation-Maximization (EM) algorithm of
the Statistical Package for the Social Sciences (SPSS) software (v.18). Weights were developed
before missing data were imputed.
54
Scale Development and Variables Used
The P2P research team completed a series of factor analyses to provide a more compact,
aggregated summary of the individual-item data. These widely used "data-reduction" procedures
identify individual survey items that correlate highly with one another, indicating they may be
measuring the same (or a similar) construct. This section contains information on the contents
and characteristics of the scales and other variables used in this study.
Although a variety of factor analytic procedures are available, the research group chose to
use principal axis analysis. Only items with rotated factor loadings greater than .40 were
considered in forming a scale. Because the procedures adopted an Oblimin criterion with Kaiser
Normalization rotation, factors may be correlated, and some items may load above .40 on
multiple factors. In those instances, items were assigned to a factor based on the magnitude of
the loading, the effect of keeping/discarding the item on the scale‘s internal consistency (alpha)
reliability (see below), and on professional judgment. In some instances, items loading above .40
on more than one factor were discarded. Factor scale scores were formed by summing
individuals‘ responses on the component items of a scale and then dividing by the number of
items in the scale (Armor, 1974).
Once scales were initially developed, Cronbach's alpha was used to evaluate their
internal consistency reliability. Alpha reflects the extent to which a scale's items are correlated
and, consequently, whether the scale is internally consistent, indicating that respondents who
answer one item higher or lower tend to answer other items in the scale higher or lower in a
consistent fashion. Alpha can range from .00 to 1.00. Psychometricians consider any scale with
an alpha of .70 or higher to be acceptable, although scales with alphas in the .5 or .6 ranges are
occasionally used.
55
The data used for this study come primarily from the survey for 4-year college students.
The student survey includes information on students‘ demographic characteristics and
background, self-assessment on selected learning outcomes, and curricular/co-curricular
experiences at the institution. It also included questions concerning classroom instructional
practices, out-of-class interactions with faculty, and future career plans (Appendix A). The P2P
student data contains a number of variables relevant to this study, such as student educational
experiences, self-assessment of ability in engineering knowledge and skills, and post-graduation
plans. In addition, several control variables are used in the analysis in order to eliminate possible
alternate hypotheses.
Control Variables
Based on the literature review, several institutional and individual control variables are
used. The institutional control variables are institutional type, size, and highest degree offered.
These institutional characteristics influence institutional culture and resources, thereby
potentially influencing students‘ post-graduation plans (See Lichtenstein, et al., 2009).
Institutional type includes two categories: public and private (reference group). Institutional size
is operationalized as total student enrollment in an institution, which contains three categories:
small, medium, and large (reference group). Highest degree offered include three categories:
Master‘s, Bachelor‘s, and Doctoral (reference group). These values were drawn from the
Integrated Postsecondary Data System (National Center for Educational Statistics, n.d.). The
student control variables are transfer status (whether students transferred from 2-year and/or 4-
year institutions), and parents‘ educational level. Although they attend the same institution,
transfer students might perceive their curricular and classroom experiences differently from non-
transfer students. Students‘ parental education level is related to their race, social/cultural capital,
56
and academic preparedness (Pascarella & Terenzini, 2005). Each of these variables represents
potential influences on student‘s post-graduation plans that are not attributable to the influence of
student experiences and abilities. Including these variables as controls in the analyses will rule
out the possibility that findings can be attributed to these factors rather than to the variables of
interest.
Students’ Pre-college Characteristics Variables
Findings cited in the literature review for this study suggest that students‘ post-graduation
plans and pathways vary by their gender, race, and mathematics proficiency prior to college (e.g.,
Sheppard, et al., 2010). The student pre-college characteristics variables are sociodemographic
information (gender and underrepresented minority status) and academic preparedness in high
school. Women are the reference group for the gender variable. Although more detailed student
race/ethnicity categories were available4, the small numbers of student respondents in some
categories, combined with the lack of statistical significance of these variables in preliminary
regression analyses, led the research team to collapse these categories into a dichotomous
variable called Underrepresented Minority (URMs). The URM student group, which consists of
African American, Hispanic/Latino/a American, Native American, Foreign National (i.e., citizen
of another country and Naturalized U.S. citizen) and Other, was compared to the reference group
of Caucasian/Whites. It is possible that Foreign Nationals, depending on their country of origin
and socioeconomic status, have different goals and experiences than U.S. born minority students.
However, the percentage of Foreign National students in the data set is very small (citizen of
other countries: 7.2%, naturalized U.S. citizen: 6.8%) and thus unlikely to influence the findings
of the study. Asian American students are not categorized as the URM group because Asian
4 African American, Caucasian/White, Asian American, Hispnic/Latino/a American, Native American Foreign
National (i.e., citizen of another country), Naturalized U.S. citizen, and other.
57
American students are not historically underrepresented in engineering and science.5 In the
analysis, Asian Americans were compared to Caucasian/Whites and URM students. Academic
preparedness in high school is operationalized using two measures, high school grade point
average and SAT mathematics scores.
Academic Program Experience Variables
Students‘ major area of study (i.e., their discipline) is a strong influence on their
educational experiences. Six disciplines (Bio, Chemical, Civil, Electrical, Industrial, and General
Engineering), as well as a category representing ―other‖ engineering disciplines, are compared to
Mechanical Engineering (as the reference group). Research suggests that the curriculum and
instructional practices of engineering programs vary by engineering discipline (e.g., chemical,
bioengineering) (Lattuca, et al., 2010; Lattuca, et al., 2006). Each discipline has its own culture
and norms, which influence faculty members‘ attitudes and behaviors and thus may differently,
influence students‘ experiences and learning outcomes (Lattuca & Stark, 2009; Smart, Feldman,
& Ethington, 2000). For this reason, the seven discipline variables (including ―other‖
engineering) are considered features of the academic program experience.
Students‘ disciplinary experiences also can vary by class standing (or year in college).
While sophomore engineering students are more likely to take engineering pre-required math and
science courses, juniors and seniors tend to take major-specific courses in their own disciplines.
The post-graduation plans of juniors and seniors (defined as fourth-year student or higher) were
compared to sophomore students as a reference group.
5 Asians and Asian Americans are not an underrepresented minority group in STEM fields. Using the 1996/01
Beginning Postsecondary Students Longitudinal Study (BPS:96/01), Chen and Weko (2009) found that nearly half
of the Asian/Pacific Islander students (47%) who entered postsecondary education enrolled in STEM majors in
1995-96, compared to 19%–23% of students in each of the other racial/ethnic groups. Also, after five years, 29.5%
of the White students and 31.2% of the Asian/Pacific Islanders attained a bachelor‘s degree in a STEM Field,
compared to Black (15.5%) and Hispanic (16.3%) students. Thus, Asian American students are included in the non-
URM group for this study.
58
While organizational contexts indirectly influence student outcomes, student experiences
have the strongest and most significant effects on student outcomes (Lattuca, et al., 2006;
Pascarella & Terenzini, 2005). Student experiences constructs consist of 1) curricular
experiences, 2) classroom instructional experiences; and 3) co-curricular experiences.
Explanatory factor analysis of the student data yielded four scales of interest in curricular
experiences: Core Engineering Thinking (scale alpha =.85), Professional Skills (.88), Broad and
Systems Perspectives (.84), and Professional Values (.82). Each of these scales represents
students‘ assessments of the level of emphasis placed on these topics in their engineering
program. The Active/Collaborative Learning (.77) scale was employed as a classroom
instructional experience predictor.
With respect to co-curricular experiences, this study examines the effect of students‘
participation in an engineering-specific co-curriculum on their post-graduation plans. The P2P
survey explores ten individual items that measure students‘ engagement in engineering-related or
general co-curricular activities6. Although research suggests that undergraduate research
experiences or study abroad influence students‘ post-graduation plans, I did not include these
variables because the P2P survey did not clearly ask about these activities in relation to
engineering. In this study, the items include student participation in internships, in clubs (an
engineering club or student chapter of a professional society), and in engineering-related clubs
or programs for women and/or minority students.
6 In the P2P survey, co-curricular experiences consist of six single-item measures of the number of months students
reported spending in undergraduate research activities; engineering internships; engineering cooperative education
experiences; study abroad or an international school-related tours; working on humanitarian engineering projects;
and student design projects/competitions beyond class requirements. In addition, co-curricular experiences
included five single-items measuring the extent of graduates‘ involvement in an engineering club or student
chapter of a professional society (IEEE, ASME, ASCE, etc.); other clubs or activities (hobbies, civic or church
organizations, campus publications, student government, Greek life, sports, etc.); and other clubs or activities
(hobbies, civic or church organizations, campus publications, student government, Greek life, sports, etc.).
59
Students’ Engineering Knowledge and Skills Variables
The proposed study hypothesizes that students‘ reports of their engineering knowledge
and abilities will influence their post-graduation plans. The P2P student survey included 49
questions for which students reported on their abilities. Factor analysis yielded nine scales7 and
three scales of interests are included in this study as outcomes variables.
The first ability of interest, fundamental skills (3 item scale, alpha=.71), was chosen
because it is the keystone of an engineering program. Without these foundational abilities in
mathematics, science and engineering sciences, engineering graduates could hardly be called
engineers. The second scale of interest assesses students‘ design skills (12 item scale, alpha
=.92). Design and problem solving skills are also critical engineering skills identified in the
EC2000 engineering accreditation criteria (ABET Engineering Accreditation Commission, 2008).
The third ability of interest is contextual awareness (4 item scale, alpha=.91). The EC2000
accreditation standards further specify that all engineering undergraduates must be prepared to
solve engineering problems in real-world contexts (ABET Engineering Accreditation
Commission, 2008). Members of the engineering faculty and employment sector are also
interested in this outcome because the engineering workforce has become increasingly
globalized (National Academy of Engineering, 2005).
Post-graduation Plans Variables
Variables representing engineering students‘ post-graduation plans are the criterion
measures in this study. The P2P study included seven questions related to this construct.
Students were asked about the likelihood that, three years after graduation, they would be: 1) Be
self-employed in engineering; 2) Be a practicing engineer in industry, government, or non-profit
7 Design skills, Interdisciplinary skills, Teamwork skills, Contextual awareness, Communication skills, Reflective
behaviors (or practice), Fundamental skills, Leadership skills, Recognizing disciplinary perspectives
60
organization; 3) Work in engineering management or sales; 4) Work outside engineering; 5) Be
in graduate school preparing to become an engineering faculty member; 6) Be in graduate school
in engineering preparing to work in industry, government, or non-profit organization; and 7) Be
in graduate school in a field other than engineering (business, medicine, law, etc.). These
outcome variables are measured using an ordered scale (from low to high; 1=definitely won‘t;
2=probably won‘t; 3=not sure; 4=probably will; and 5=definitely will).
This study uses the first six of these seven questions. The first three questions are related
to engineering students‘ plans to work in engineering after graduation, while the fourth asks
about their plans to work outside of engineering. The fifth and sixth questions are related to
engineering students‘ plans to pursue engineering graduate school, which can be interpreted as
an indication that students intend to stay in the engineering workforce (either in academia or
industry). This study does not examine the last question (students‘ plans to attend graduate
school in a field other than engineering) due to the ambiguity of interpretation. Earning a degree
in a field outside engineering may mean that a student plans to leave the field of engineering –
but it does not necessarily mean this. Engineering students often pursue master‘s degrees in
business to complement their engineering expertise. Similarly, students may pursue graduate
work in law or medicine and still maintain an engineering career. See Appendix B for detailed
information on each variable used in this study (Table B.1) and their descriptive statistics (Table
B.2).
Analytical Methods
Since the outcome variables are measured on an ordered scale instead continuous or
linear one, the use of Ordinary Least Squares (OLS) linear regression models is not appropriate. I
examined two tests to choose the appropriate regression method for the analysis. To determine
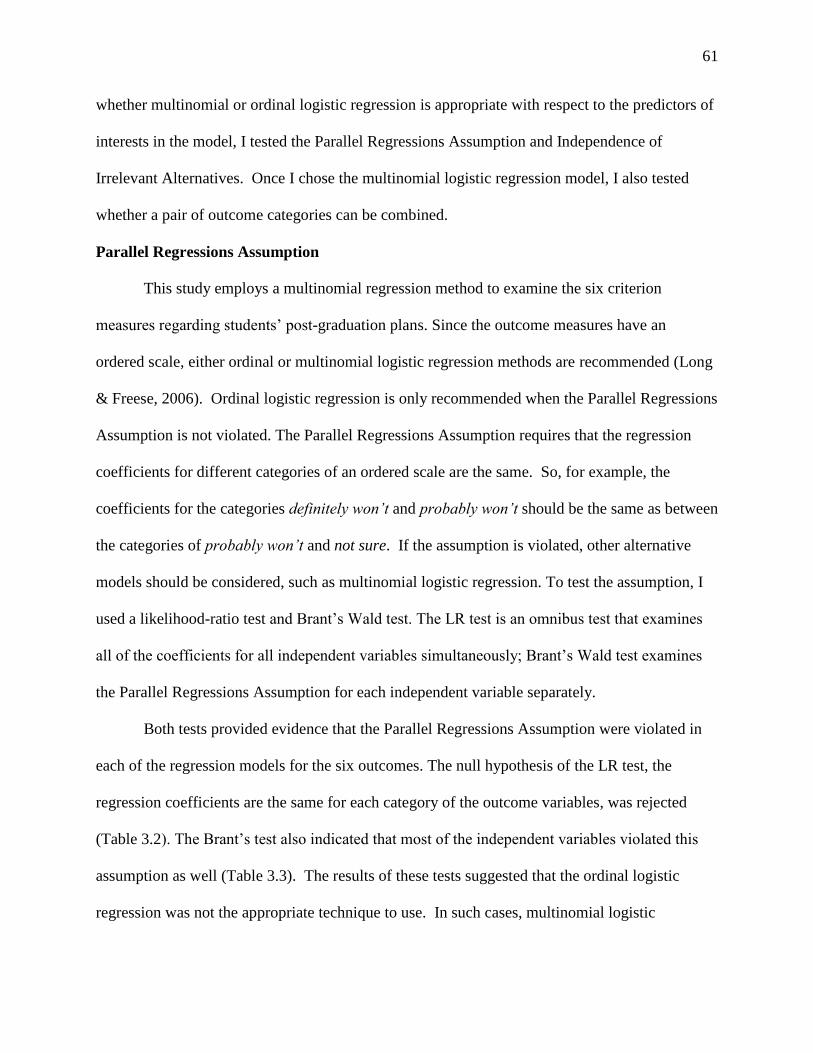
61
whether multinomial or ordinal logistic regression is appropriate with respect to the predictors of
interests in the model, I tested the Parallel Regressions Assumption and Independence of
Irrelevant Alternatives. Once I chose the multinomial logistic regression model, I also tested
whether a pair of outcome categories can be combined.
Parallel Regressions Assumption
This study employs a multinomial regression method to examine the six criterion
measures regarding students‘ post-graduation plans. Since the outcome measures have an
ordered scale, either ordinal or multinomial logistic regression methods are recommended (Long
& Freese, 2006). Ordinal logistic regression is only recommended when the Parallel Regressions
Assumption is not violated. The Parallel Regressions Assumption requires that the regression
coefficients for different categories of an ordered scale are the same. So, for example, the
coefficients for the categories definitely won’t and probably won’t should be the same as between
the categories of probably won’t and not sure. If the assumption is violated, other alternative
models should be considered, such as multinomial logistic regression. To test the assumption, I
used a likelihood-ratio test and Brant‘s Wald test. The LR test is an omnibus test that examines
all of the coefficients for all independent variables simultaneously; Brant‘s Wald test examines
the Parallel Regressions Assumption for each independent variable separately.
Both tests provided evidence that the Parallel Regressions Assumption were violated in
each of the regression models for the six outcomes. The null hypothesis of the LR test, the
regression coefficients are the same for each category of the outcome variables, was rejected
(Table 3.2). The Brant‘s test also indicated that most of the independent variables violated this
assumption as well (Table 3.3). The results of these tests suggested that the ordinal logistic
regression was not the appropriate technique to use. In such cases, multinomial logistic
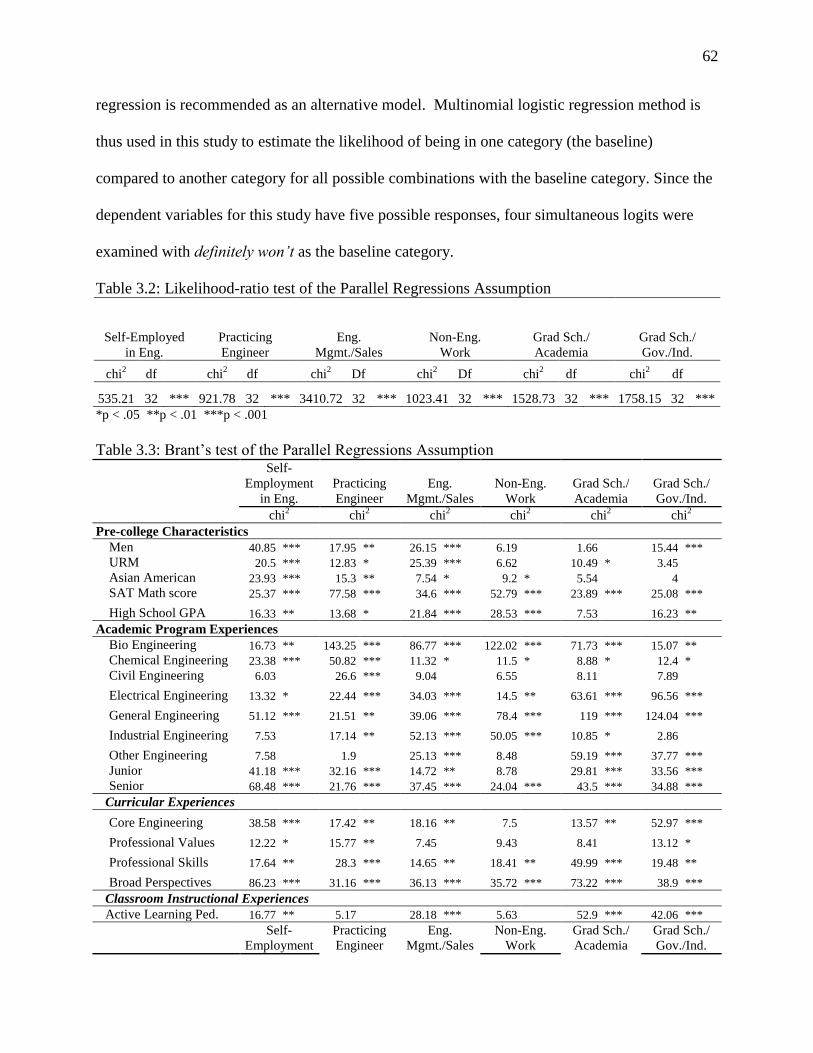
62
regression is recommended as an alternative model. Multinomial logistic regression method is
thus used in this study to estimate the likelihood of being in one category (the baseline)
compared to another category for all possible combinations with the baseline category. Since the
dependent variables for this study have five possible responses, four simultaneous logits were
examined with definitely won’t as the baseline category.
Table 3.2: Likelihood-ratio test of the Parallel Regressions Assumption
Self-Employed
in Eng.
Practicing
Engineer
Eng.
Mgmt./Sales
Non-Eng.
Work
Grad Sch./
Academia
Grad Sch./
Gov./Ind.
chi2 df chi
2 df chi
2 Df chi
2 Df chi
2 df chi
2 df
535.21 32 *** 921.78 32 *** 3410.72 32 *** 1023.41 32 *** 1528.73 32 *** 1758.15 32 ***
*p < .05 **p < .01 ***p < .001
Table 3.3: Brant‘s test of the Parallel Regressions Assumption
Self-
Employment
in Eng.
Practicing
Engineer
Eng.
Mgmt./Sales
Non-Eng.
Work
Grad Sch./
Academia
Grad Sch./
Gov./Ind.
chi2 chi
2 chi
2 chi
2 chi
2 chi
2
Pre-college Characteristics
Men 40.85 *** 17.95 ** 26.15 *** 6.19
1.66
15.44 ***
URM 20.5 *** 12.83 * 25.39 *** 6.62
10.49 * 3.45
Asian American 23.93 *** 15.3 ** 7.54 * 9.2 * 5.54
4
SAT Math score 25.37 *** 77.58 *** 34.6 *** 52.79 *** 23.89 *** 25.08 ***
High School GPA 16.33 ** 13.68 * 21.84 *** 28.53 *** 7.53
16.23 **
Academic Program Experiences
Bio Engineering 16.73 ** 143.25 *** 86.77 *** 122.02 *** 71.73 *** 15.07 **
Chemical Engineering 23.38 *** 50.82 *** 11.32 * 11.5 * 8.88 * 12.4 *
Civil Engineering 6.03
26.6 *** 9.04
6.55
8.11
7.89
Electrical Engineering 13.32 * 22.44 *** 34.03 *** 14.5 ** 63.61 *** 96.56 ***
General Engineering 51.12 *** 21.51 ** 39.06 *** 78.4 *** 119 *** 124.04 ***
Industrial Engineering 7.53
17.14 ** 52.13 *** 50.05 *** 10.85 * 2.86
Other Engineering 7.58
1.9
25.13 *** 8.48
59.19 *** 37.77 ***
Junior 41.18 *** 32.16 *** 14.72 ** 8.78
29.81 *** 33.56 ***
Senior 68.48 *** 21.76 *** 37.45 *** 24.04 *** 43.5 *** 34.88 ***
Curricular Experiences
Core Engineering 38.58 *** 17.42 ** 18.16 ** 7.5
13.57 ** 52.97 ***
Professional Values 12.22 * 15.77 ** 7.45
9.43
8.41
13.12 *
Professional Skills 17.64 ** 28.3 *** 14.65 ** 18.41 ** 49.99 *** 19.48 **
Broad Perspectives 86.23 *** 31.16 *** 36.13 *** 35.72 *** 73.22 *** 38.9 ***
Classroom Instructional Experiences
Active Learning Ped. 16.77 ** 5.17
28.18 *** 5.63
52.9 *** 42.06 ***
Self-
Employment
Practicing
Engineer
Eng.
Mgmt./Sales
Non-Eng.
Work
Grad Sch./
Academia
Grad Sch./
Gov./Ind.
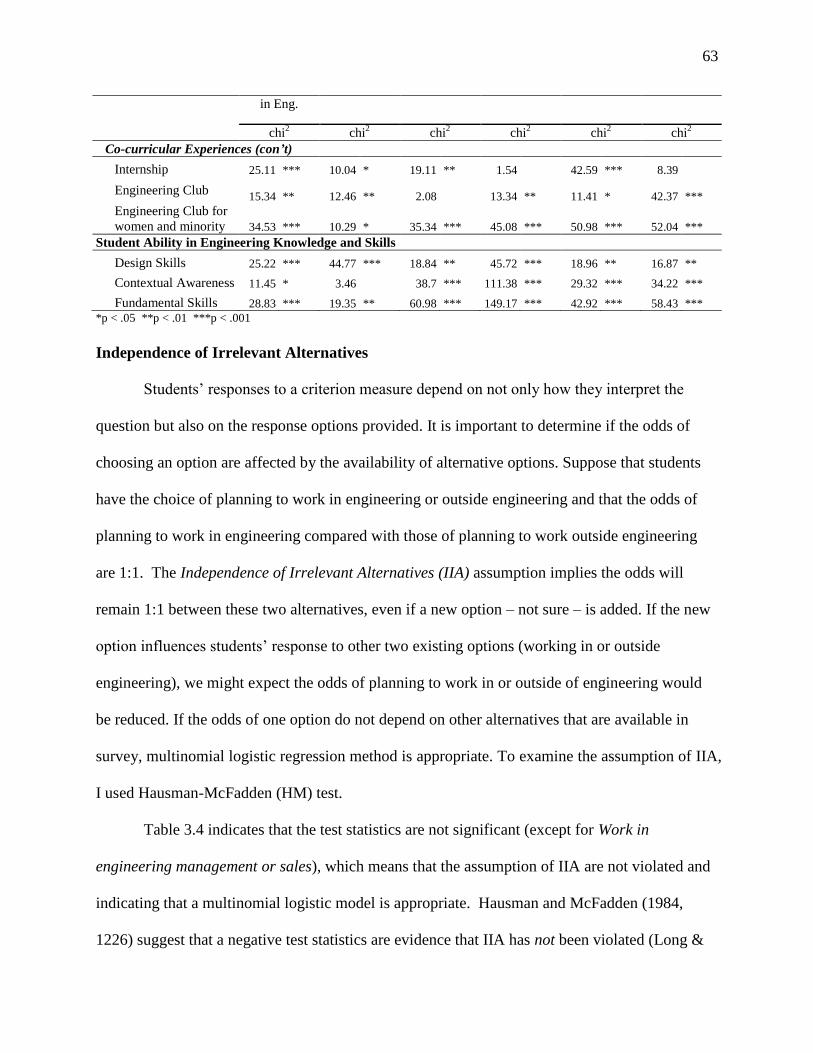
63
in Eng.
chi2 chi
2 chi
2 chi
2 chi
2 chi
2
Co-curricular Experiences (con’t)
Internship 25.11 *** 10.04 * 19.11 ** 1.54
42.59 *** 8.39
Engineering Club 15.34 ** 12.46 ** 2.08
13.34 ** 11.41 * 42.37 ***
Engineering Club for
women and minority 34.53 *** 10.29 * 35.34 *** 45.08 *** 50.98 *** 52.04 ***
Student Ability in Engineering Knowledge and Skills
Design Skills 25.22 *** 44.77 *** 18.84 ** 45.72 *** 18.96 ** 16.87 **
Contextual Awareness 11.45 * 3.46
38.7 *** 111.38 *** 29.32 *** 34.22 ***
Fundamental Skills 28.83 *** 19.35 ** 60.98 *** 149.17 *** 42.92 *** 58.43 ***
*p < .05 **p < .01 ***p < .001
Independence of Irrelevant Alternatives
Students‘ responses to a criterion measure depend on not only how they interpret the
question but also on the response options provided. It is important to determine if the odds of
choosing an option are affected by the availability of alternative options. Suppose that students
have the choice of planning to work in engineering or outside engineering and that the odds of
planning to work in engineering compared with those of planning to work outside engineering
are 1:1. The Independence of Irrelevant Alternatives (IIA) assumption implies the odds will
remain 1:1 between these two alternatives, even if a new option – not sure – is added. If the new
option influences students‘ response to other two existing options (working in or outside
engineering), we might expect the odds of planning to work in or outside of engineering would
be reduced. If the odds of one option do not depend on other alternatives that are available in
survey, multinomial logistic regression method is appropriate. To examine the assumption of IIA,
I used Hausman-McFadden (HM) test.
Table 3.4 indicates that the test statistics are not significant (except for Work in
engineering management or sales), which means that the assumption of IIA are not violated and
indicating that a multinomial logistic model is appropriate. Hausman and McFadden (1984,
1226) suggest that a negative test statistics are evidence that IIA has not been violated (Long &
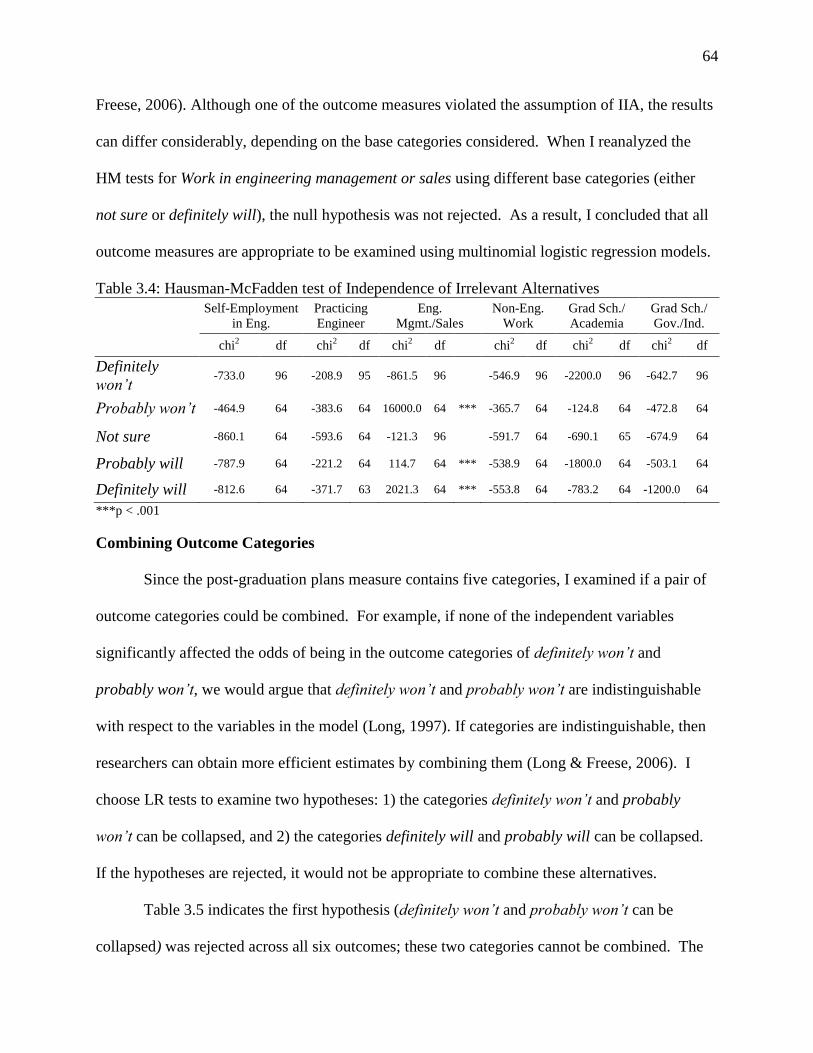
64
Freese, 2006). Although one of the outcome measures violated the assumption of IIA, the results
can differ considerably, depending on the base categories considered. When I reanalyzed the
HM tests for Work in engineering management or sales using different base categories (either
not sure or definitely will), the null hypothesis was not rejected. As a result, I concluded that all
outcome measures are appropriate to be examined using multinomial logistic regression models.
Table 3.4: Hausman-McFadden test of Independence of Irrelevant Alternatives
Self-Employment
in Eng.
Practicing
Engineer
Eng.
Mgmt./Sales
Non-Eng.
Work
Grad Sch./
Academia
Grad Sch./
Gov./Ind.
chi2 df chi
2 df chi
2 df
chi
2 df chi
2 df chi
2 df
Definitely
won’t -733.0 96 -208.9 95 -861.5 96
-546.9 96 -2200.0 96 -642.7 96
Probably won’t -464.9 64 -383.6 64 16000.0 64 *** -365.7 64 -124.8 64 -472.8 64
Not sure -860.1 64 -593.6 64 -121.3 96
-591.7 64 -690.1 65 -674.9 64
Probably will -787.9 64 -221.2 64 114.7 64 *** -538.9 64 -1800.0 64 -503.1 64
Definitely will -812.6 64 -371.7 63 2021.3 64 *** -553.8 64 -783.2 64 -1200.0 64
***p < .001
Combining Outcome Categories
Since the post-graduation plans measure contains five categories, I examined if a pair of
outcome categories could be combined. For example, if none of the independent variables
significantly affected the odds of being in the outcome categories of definitely won’t and
probably won’t, we would argue that definitely won’t and probably won’t are indistinguishable
with respect to the variables in the model (Long, 1997). If categories are indistinguishable, then
researchers can obtain more efficient estimates by combining them (Long & Freese, 2006). I
choose LR tests to examine two hypotheses: 1) the categories definitely won’t and probably
won’t can be collapsed, and 2) the categories definitely will and probably will can be collapsed.
If the hypotheses are rejected, it would not be appropriate to combine these alternatives.
Table 3.5 indicates the first hypothesis (definitely won’t and probably won’t can be
collapsed) was rejected across all six outcomes; these two categories cannot be combined. The
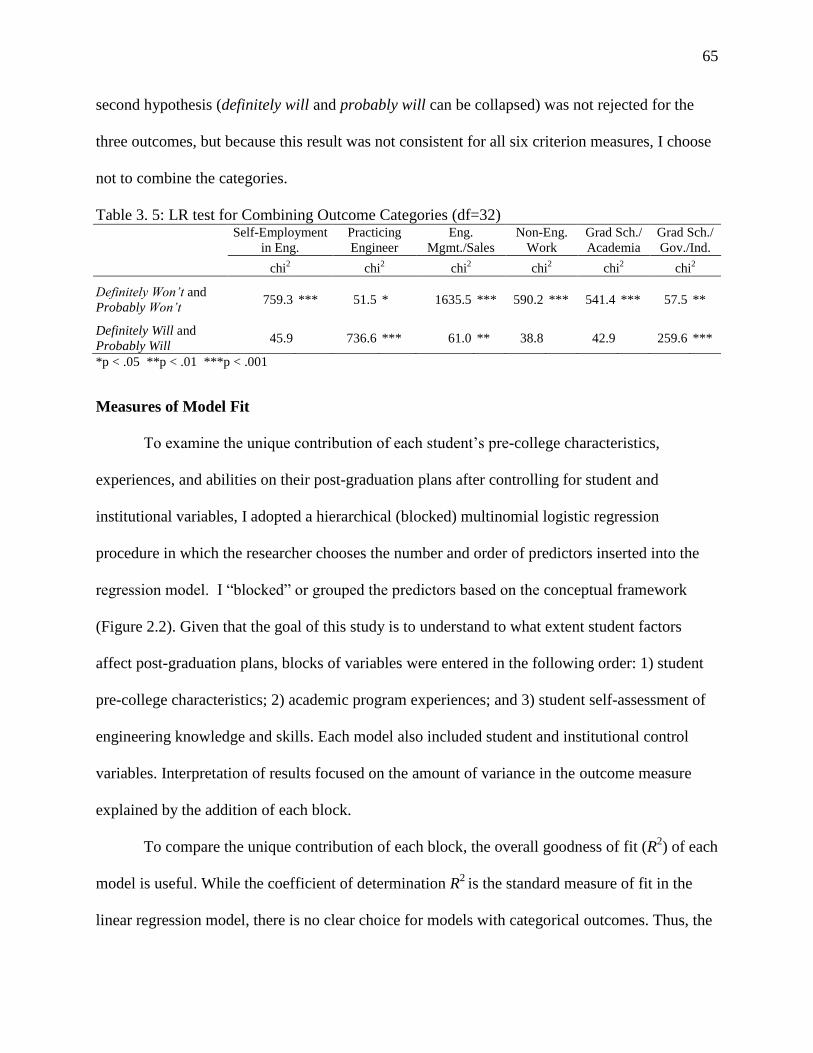
65
second hypothesis (definitely will and probably will can be collapsed) was not rejected for the
three outcomes, but because this result was not consistent for all six criterion measures, I choose
not to combine the categories.
Table 3. 5: LR test for Combining Outcome Categories (df=32)
Self-Employment
in Eng.
Practicing
Engineer
Eng.
Mgmt./Sales
Non-Eng.
Work
Grad Sch./
Academia
Grad Sch./
Gov./Ind.
chi2 chi
2 chi
2 chi
2 chi
2 chi
2
Definitely Won’t and
Probably Won’t 759.3 *** 51.5 * 1635.5 *** 590.2 *** 541.4 *** 57.5 **
Definitely Will and
Probably Will 45.9 736.6 *** 61.0 ** 38.8 42.9 259.6 ***
*p < .05 **p < .01 ***p < .001
Measures of Model Fit
To examine the unique contribution of each student‘s pre-college characteristics,
experiences, and abilities on their post-graduation plans after controlling for student and
institutional variables, I adopted a hierarchical (blocked) multinomial logistic regression
procedure in which the researcher chooses the number and order of predictors inserted into the
regression model. I ―blocked‖ or grouped the predictors based on the conceptual framework
(Figure 2.2). Given that the goal of this study is to understand to what extent student factors
affect post-graduation plans, blocks of variables were entered in the following order: 1) student
pre-college characteristics; 2) academic program experiences; and 3) student self-assessment of
engineering knowledge and skills. Each model also included student and institutional control
variables. Interpretation of results focused on the amount of variance in the outcome measure
explained by the addition of each block.
To compare the unique contribution of each block, the overall goodness of fit (R2) of each
model is useful. While the coefficient of determination R2
is the standard measure of fit in the
linear regression model, there is no clear choice for models with categorical outcomes. Thus, the
66
STATA statistical software package provides several indices.8 I choose to report the Adjusted
Count R2 rather than the Count R
2. The Adjusted Count R
2 is based on the difference between
the observed and predicted values of categorical outcomes (based on the classification table in
the Appendix C). The Count R2 is the proportion of correct predictions, which sometimes can
give the faulty impression that the model is predicting very well, when, in fact, it is not. Thus
the Adjusted Count R2 is more appropriate, indicating how much error is reduced in the
regression model prediction. I also choose to present McFadden‘s adjusted R2
( 2Mcf), which
compares a model with just the intercept to a model with all parameters, because it‘s the
commonly accepted logistic regression counterpart to adjusted R2
in OLS regression.
Unfortunately, there is no significance test for the difference in 2Mcf between models.
Therefore, I used the Bayesian Information Criterion (BIC) to compare each model. Long (1997)
suggested there are at least three ways in which the BIC statistic is defined and calculated,
however, the differences are not important. Since the STATA program tests if the final model is
supported based on BIC', I choose to present the BIC' statistic. The more negative the value of
the BIC' statistic, the better the model fit.
Although measures of fit provide some information to researchers, Long (1997) suggests
they offer only partial information; the final model should be based on the theory motivating the
analysis along with the estimated parameters of the model. Thus, I will present the parameters of
each predictor in terms of odds ratios.
8 McFadden‘s R
2, McFadden‘s adjusted R
2, Maximum Likelihood R
2, Cragg & Uhler‘s R
2, Count and
adjusted count R2, and information measure (AIC, and BIC and BIC'). There are more details in Long &
Freese (2006, p. 104-113).
67
Odds Ratios and Robust Standard Errors
This study uses odds ratios (OR) to facilitate the interpretation of results in a way similar
to how one interprets coefficients in OLS linear regression. The odds ratio represents the change
in the odds of each category of post-graduation plans (definitely will, probably will, not sure, or
probably won’t) relative to the base category (definitely won’t) that is associated with a one-unit
change in a specific independent variable, while holding all other variables constant. For
example, the analysis will provide information on whether women students were less likely than
men to respond that they probably will be in engineering career, compared to the reference
category of definitely won’t. Further, the analysis will show whether the predictors are
significant across all categories or only a few.
Essentially, odds ratios are the comparison of the probability of one event occurring
versus another. An odds ratio greater than one represents an increase in the likelihood of an
outcome relative to the reference category, while an odds ratio of less than one represents a
decrease in the likelihood (Peng, 2002). Odds ratios are not linearly additive , so in order to
compare the relative effect of odds ratios greater than one to those less than one, we have to take
the inverse of the latter (DesJardins, 2001). Thus, this study provides odds ratios and inverse
odds ratios in cases where the coefficients of independent variables are negative.
Since the P2P data were collected from students clustered within institutions, I used
robust standard errors with clusters to adjust for potential biases due to this clustering. OLS
regression and multinomial logistic regression both underestimate standard errors when complete
independence of observations is violated. Robust standard errors account for clustering at the
institution level (Cheslock & Rios-Aguilar, 2011). The large set of variables in the analysis also
precluded the use of an HLM model. Hence, I used robust standard errors with clustering which
68
has one of the benefits associated with HLM use: the correction of standard errors for clustering
at the group level (Cheslock & Rios-Aguilar, 2011).
Limitations
Limitations of the Dataset
This study takes advantage of a nation-wide, large-scale study (the P2P study) that
examined the curricula, instructional practices, and co-curricular activities of undergraduate
engineering programs and their influence on student outcomes. Despite the extensive P2P
dataset, there are threats to internal validity in this study. In order to demonstrate causality, an
alternative method such as experimental design is needed (Krathwohl, 2004). This alternative
approach, however, was not possible for the study because of the inability to manipulate the level
of program curricular emphases and randomly assign students to programs. In addition, even
when they are available, experimental designs can seriously compromise external validity in
pursuit of internal validity (Cheslock & Rios-Aguilar, 2011).9 Thus this study used control
variables to help account for omitted variables that could bias the results.
Because the P2P survey data are cross-sectional, this study is not able to measure
engineering students‘ actual career choice and enrollment in their post-graduation plans. Some
studies indicate that college students‘ career and graduate school plans upon their graduation are
typically among the best predictors of actual choice of profession or graduate school enrollment
(A. W. Astin, 1977; Pascarella & Terenzini, 2005; Tinto, 1993; Whitaker & Pascarella, 1994).
This study assumes that the students‘ post-graduation plans are proxy measures that predict
actual choice of profession or graduate school enrollment; however, students‘ plans and actual
9 While external validity refers to whether the cause-effect relationship holds over different persons, settings,
treatment variables, and measurement variables, internal validity refers to whether the co-variation reflects a causal
relationship (Cheslock & Rios-Aguilar, 2011; Shadish, Cook, & Campbell, 2002)
69
choice may be different. Also, the P2P survey asks engineering students what they plan to be
doing three years after graduation; engineering graduates, of course, may decide to switch their
career or enroll in graduate study after a period of employment in the field.
An additional limitation is the use of self-reported data on students‘ abilities in
engineering knowledge and skills. Higher education researchers and administrators have
frequently used self-reported gains as indicators of student learning or ability. The literature in
this area is admittedly mixed. Bowman (2010) reports that some researchers found strong
correlations between subjective and objective assessments (Berdie, 1971; Pike, 1995, 1996;
Pohlmann & Beggs, 1974, as cited in Bowman, 2010), while others reported strong divergence
between subjective and objective assessments (Bowman & Seifert, 2009; Dumont &
Troelstrup,1980, as cited in Bowman, 2010). Although direct measures of learning, such as a
standardized, objective test, would be preferable to self-reported abilities, such assessments are
time-consuming and costly to collect. Moreover, there is no widely used standardized test of the
engineering learning for key learning outcomes such as design skills, problem-solving skills, and
contextual competence (Lattuca, et al., 2006).
Prior research indicates that self-reports of learning can provide a reasonable estimation
of actual learning, especially when measuring the differences among groups rather than
individuals (Anaya, 1999; Kuh, Kinzie, Schuh, Whitt, & Associates, 2005; Laing, Swayer, &
Noble, 1989; Pace, 1985; Pike, 1995). The reliability of the data used in this study is further
supported because it meets the criteria outlined by Kuh et al.(2005) and Pike (1995) for the use
of self-reports: the information is known to the respondents, the questions are unambiguous and
refer to recent activities, the respondents take the questions seriously, and responding has no
adverse consequences nor does it encourage socially desirable, rather than truthful, answers. As
70
a result, one can conclude that the self-assessment of student ability in engineering knowledge
and skills revealed in the data are reasonable proxies for more objective measures of ability.
Students‘ college experiences and outcomes appear to differ by race/ethnicity. However,
this study could not analyze the differences of engineering students‘ post-graduation plans in
racial/ethnic groups due to the small number of students in each group (as is the case for most
engineering datasets). In the dataset used in this study, the numbers and percentages of the URM
sub-groups are: African-American (n=232, 4.3%); Hispanic/Latino (n=598, 11.1%); Native
American (n=16, 0.3%); Middle Eastern (n=16, 0.3%); multi-race (n=156, 2.9%); and other
(n=156, 2.9%). Since this study combined all Underrepresented Minority students into a single
URM variable, caution should be used in interpreting the results because result for individual
sub-racial/ethnic groups maybe different.
Limitations of Single-Level Analysis
Although the focus of this study was on an individual student-level influence on post-
graduation plans, this study did not address how the students‘ experiences and abilities are
influenced by their programs or institutions. The organizational context, such as faculty cultures,
and internal structural, programmatic, and policy considerations in academic programs need to
be estimated in multi-level approaches. For example, this study hypothesized that students being
actively engaged in engineering related co-curricular activities has a positive impact on their
post-graduation plans in engineering. The engagement might vary not only between individual
students within academic programs, but also between academic programs. While some students
can participate in certain co-curricular programs their college provides, others cannot because
their college does not offer them. This study does not account for variations between programs.
71
A multi-level analysis using the faculty or program chair data might provide more precise
parameters of program-level variables. This study used student data to measure their curricular
experiences and classroom instructional experiences in their engineering programs. The
curricular emphases and instructional practices identified by students may not be consistent with
the responses from faculty and administrators because students might not recognize the
overarching rational for certain pieces of the curriculum. However, preliminary investigations
revealed that engineering seniors and program chairs had similar perceptions of the overall
emphases of their program‘s curriculum (Lattuca, May 11, 2010). To examine curricular
emphases and instruction practices more exactly, the survey items reported by the program chairs
or faculty members should be employed in future research.
Limitations of the Conceptual Framework
Finally, the conceptual framework itself suffers some limitations. One immediate cause
for concern is the failure to account for outside influences such as the effects of the engineering
industry or the condition of economic downturn on engineering students‘ career plans. As a
conceptual framework it is necessarily a simplification of reality, and this study will explore its
appropriateness for examining the impact of colleges on students‘ post-graduation plans.
72
Chapter 4
FINDINGS
This study explored the influence of engineering undergraduate students‘ pre-college
characteristics, academic program experiences, and self-assessment of engineering knowledge
and skills on their post-graduation plans. Given that the purpose of this study is to examine to
what extent student factors affect post-graduation plans, blocked multinomial logistic regression
was employed. The blocks of variables were entered in the following order: 1) student pre-
college characteristics; 2) academic program experiences; and 3) student self-assessment of
engineering knowledge and skills. Each model also included student and institutional control
variables.
In the first section of this chapter, I present measures of fit to explain how much variation
in the dependent measure is attributed to each block. Interpretation of these results focus on the
amount of variance in the outcome measure explained by the addition of each block. Because
measures of fit provide only partial information (Long & Freese, 2006), however, the size of the
parameters are also explained. I therefore present the parameters of each predictor in terms of
odds ratios in the second section of this chapter. In this chapter, I report only the significant
results in each block in which variables were entered in the following order: 1) student pre-
college characteristics; 2) academic program experiences; and 3) self-assessment of engineering
knowledge and skills. All finings including control variables are reported in Appendix D. In the
third section, I summarize the statistically significant findings from the full model (including
students‘ pre-college characteristics, academic program experiences, and self-assessment of
knowledge and skills) across all outcome measures.
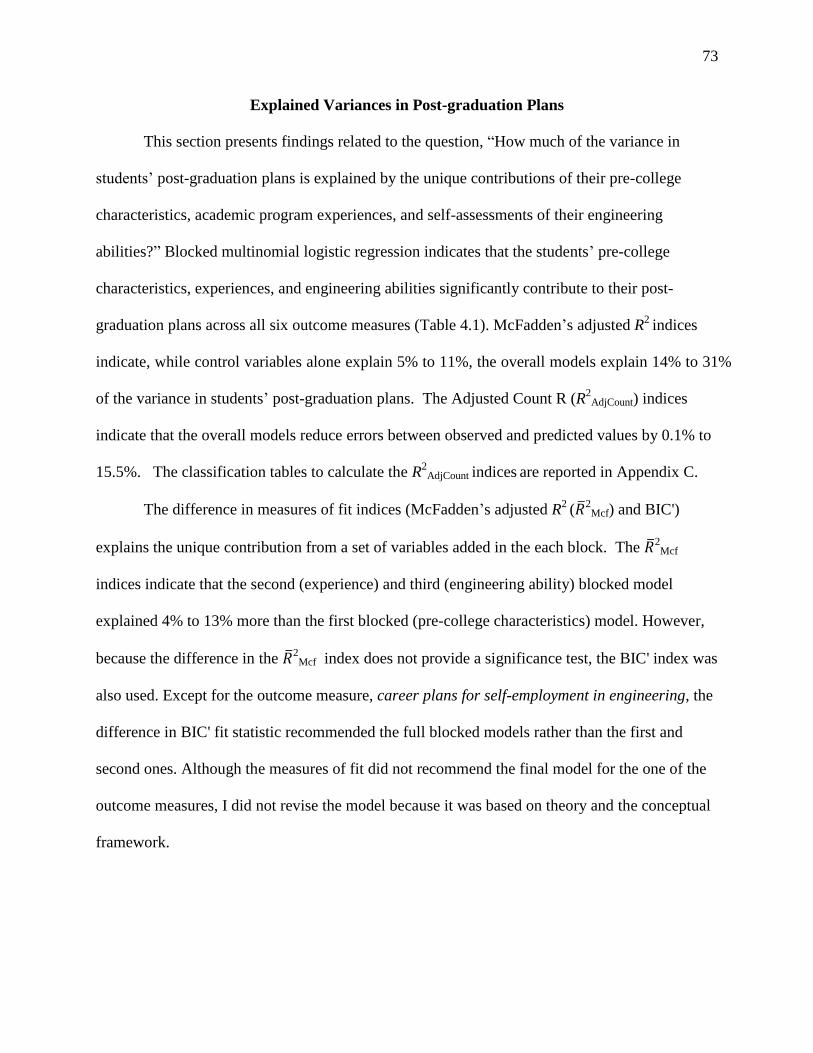
73
Explained Variances in Post-graduation Plans
This section presents findings related to the question, ―How much of the variance in
students‘ post-graduation plans is explained by the unique contributions of their pre-college
characteristics, academic program experiences, and self-assessments of their engineering
abilities?‖ Blocked multinomial logistic regression indicates that the students‘ pre-college
characteristics, experiences, and engineering abilities significantly contribute to their post-
graduation plans across all six outcome measures (Table 4.1). McFadden‘s adjusted R2
indices
indicate, while control variables alone explain 5% to 11%, the overall models explain 14% to 31%
of the variance in students‘ post-graduation plans. The Adjusted Count R (R2
AdjCount) indices
indicate that the overall models reduce errors between observed and predicted values by 0.1% to
15.5%. The classification tables to calculate the R2
AdjCount indices are reported in Appendix C.
The difference in measures of fit indices (McFadden‘s adjusted R2
( 2Mcf) and BIC')
explains the unique contribution from a set of variables added in the each block. The 2Mcf
indices indicate that the second (experience) and third (engineering ability) blocked model
explained 4% to 13% more than the first blocked (pre-college characteristics) model. However,
because the difference in the 2Mcf
index does not provide a significance test, the BIC' index was
also used. Except for the outcome measure, career plans for self-employment in engineering, the
difference in BIC' fit statistic recommended the full blocked models rather than the first and
second ones. Although the measures of fit did not recommend the final model for the one of the
outcome measures, I did not revise the model because it was based on theory and the conceptual
framework.
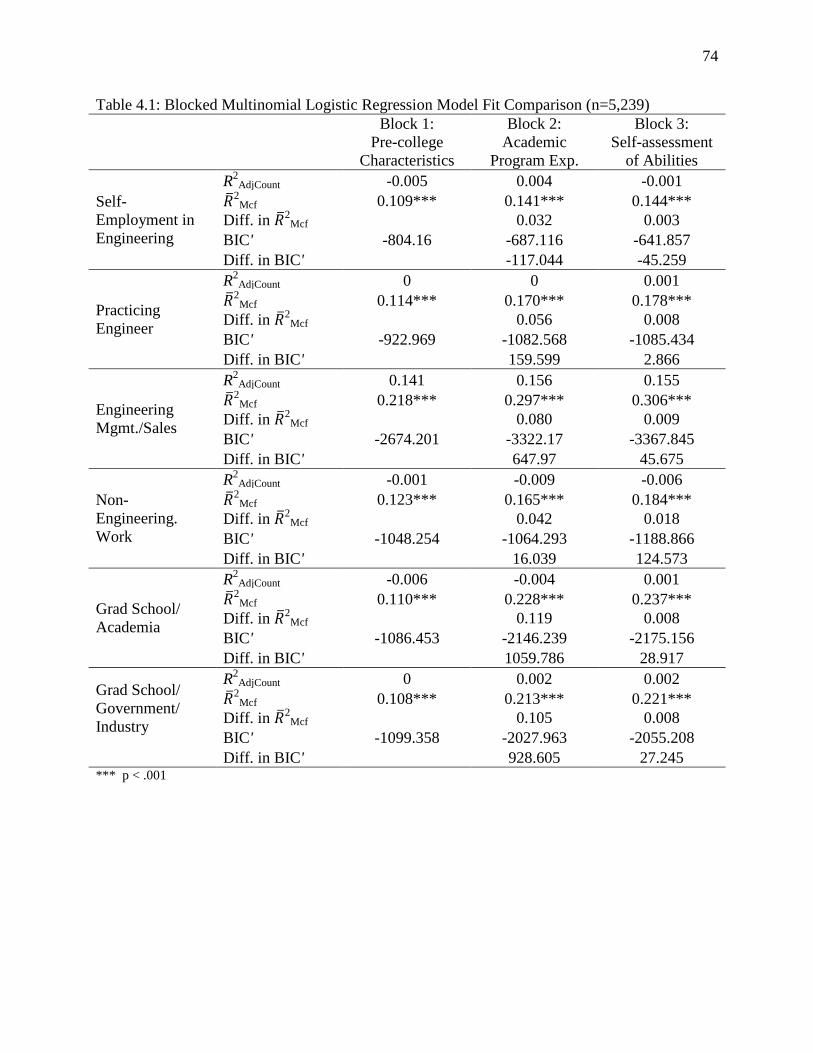
74
Table 4.1: Blocked Multinomial Logistic Regression Model Fit Comparison (n=5,239)
Block 1:
Pre-college
Characteristics
Block 2:
Academic
Program Exp.
Block 3:
Self-assessment
of Abilities
Self-
Employment in
Engineering
R2
AdjCount -0.005 0.004 -0.001
2Mcf 0.109*** 0.141*** 0.144***
Diff. in 2Mcf
0.032 0.003
BIC' -804.16 -687.116 -641.857
Diff. in BIC'
-117.044 -45.259
Practicing
Engineer
R2
AdjCount 0 0 0.001
2Mcf 0.114*** 0.170*** 0.178***
Diff. in 2Mcf
0.056 0.008
BIC' -922.969 -1082.568 -1085.434
Diff. in BIC'
159.599 2.866
Engineering
Mgmt./Sales
R2
AdjCount 0.141 0.156 0.155
2Mcf 0.218*** 0.297*** 0.306***
Diff. in 2Mcf
0.080 0.009
BIC' -2674.201 -3322.17 -3367.845
Diff. in BIC'
647.97 45.675
Non-
Engineering.
Work
R2
AdjCount -0.001 -0.009 -0.006
2Mcf 0.123*** 0.165*** 0.184***
Diff. in 2Mcf
0.042 0.018
BIC' -1048.254 -1064.293 -1188.866
Diff. in BIC'
16.039 124.573
Grad School/
Academia
R2
AdjCount -0.006 -0.004 0.001
2Mcf 0.110*** 0.228*** 0.237***
Diff. in 2Mcf
0.119 0.008
BIC' -1086.453 -2146.239 -2175.156
Diff. in BIC'
1059.786 28.917
Grad School/
Government/
Industry
R2
AdjCount 0 0.002 0.002
2Mcf 0.108*** 0.213*** 0.221***
Diff. in 2Mcf
0.105 0.008
BIC' -1099.358 -2027.963 -2055.208
Diff. in BIC'
928.605 27.245 *** p < .001

75
The Effect of Student Variables on Post-Graduation Plans
This section reports findings regarding the three sub-research questions: 1) to what extent
students‘ pre-college characteristics influence their post-graduation plans after controlling for
institutional characteristics; 2) to what extent do students‘ academic program experiences
influence their post-graduation plans after controlling students‘ pre-college characteristics and
institutional characteristics; and 3) to what extent do students‘ self-assessments of their
engineering knowledge and skills influence their post-graduation plans after controlling for
students‘ pre-college characteristics, experiences, and institutional characteristics?
Students‘ pre-college characteristics include students‘ gender, race/ethnicity, SAT math
score, and high school GPA. Academic program experiences include students‘ reports of the
emphasis on particular engineering topics in their programs (i.e., core-engineering thinking,
professional skills, professional values, and broad and systems perspectives); the extent to which
they experienced particular teaching approaches (active and collative learning); and their
engagement in a variety of co-curricular opportunities (internship, clubs, and clubs for women
and URM students); their disciplines (majors); and their class standing in college. The self-
assessment of engineering abilities comprises students‘ report of their design skills, contextual
competence, and fundamental skills.
I report here student variables which significantly influenced engineering students‘ post-
graduation plans organized according to the three categories which of greatest interest in this
study: 1) engineering career plans; 2) non-engineering career plans; and 3) engineering graduate
school plans. Instead of reporting coefficients, I report odds ratios because odds ratios indicate
the comparative effect size among independent variables. Although some findings are
statistically significant, a small effect size may render them practically meaningless. In the last
76
section of this chapter, I also summarize which independent variables positively influenced
engineering students‘ post-graduation plans in or outside of engineering. Both significant and
non-significant results of all variables in the full model are reported in Appendix D.
The Influences of Pre-college Characteristics
Students‘ pre-college characteristics appear to be less likely to increase or decrease the
odds of their plans upon graduation than students‘ academic program experiences and
engineering abilities (Table 4.1). In this section, I focus mainly on the results of Model 1 in the
following tables (Table 4.2 to Table 4.7).
Engineering Career Plans: Self-employment, Engineering Practice, and Engineering
Management/sales
There was only a small difference between men and women students in engineering
career plans (odds ratios are approximately 1.5). For example, men students were more likely
than women to plan to be self-employed by 1.5 times. Women students were around 2 times
more likely than men to plan to work in engineering management or sales. However, after
controlling for students‘ academic program experiments and self-assessment of engineering
knowledge and skills the effect is no longer significant. Further, there was no gender gap in
students‘ plans to work as practicing engineers in industry, government, or non-profit
organizations.
There were no significant differences by race/ethnicity in students‘ plans to become self-
employed in engineering and to work in engineering management or sales. However, White
students were more likely than Asian American students to respond that they probably will (odds
ratio = 5.00) and definitely will (odds ratio =3.96) work as a practicing engineer (compared to
the reference category of definitely won’t).
77
Although students‘ high school GPA was negatively associated with the odds of self-
employment in engineering, the size of odds ratios (around 1) indicated that difference is trivial.
Students‘ SAT math proficiency also was negatively associated with their plans to work in
engineering management. It is worth noting that SAT math score was no longer significant when
students‘ academic program experiences and self-assessment of knowledge and skills were taken
into account.
Non-engineering Career Plans: Work outside of Engineering
Another of the outcomes variables in this study asked whether students were likely to
work outside of engineering three years after graduation (Table 4.5). Findings indicated no
differences by gender and race/ethnicity in students‘ non-engineering career plans. Students‘
SAT math scores were also non-significant influences on their non-engineering career plans.
After controlling for their SAT math scores, the higher a students‘ GPA, the more likely they
were to consider work outside engineering, although the effect size (odds ration) was relatively
small (around 1.5).
Engineering Graduate School Plans: Academia or Professional Development
The last two criterion measures asked if engineering students were likely to enter
graduate school in engineering for the purpose of pursuing a) an academic career (Table 4.6) and
b) a professional career (Table 4.7). Analyses revealed that men were almost 2 times more likely
than women to indicate an intention to attend engineering graduate school to prepare for
engineering work. Asian American students were 5 times more likely than White students to
report that they definitely will be graduate school for academic careers. Students‘ SAT math
score was negatively associated with the odds of planning to attend graduate school for further
engineering job preparation. Since a one point change in SAT math score is of little practical use,
78
I calculated the odds ratios for this variable based on a one standard deviation (81 point) change.
Overall, students with higher SAT scores were approximately 1.6 times more likely to say they
definitely would not attend graduate school to further their engineering careers than those with
average scores. Students‘ high school GPA, on the other hand, was positively related to students‘
graduate school plans for engineering professions, although the size of odds ratios was again
around 1.5.
The Influences of Academic Program Experiences
Engineering Career Plans: Self-employment, Engineering Practice, and Engineering
Management/sales
As would be expected, there were disciplinary differences in students‘ post-graduation
plans in engineering. Compared to Mechanical Engineering (ME) students, for example, Bio-
medical or Bio-engineering (BE) and Chemical Engineering (ChemE) students were almost two
times less likely to report that they planned to be self-employed in engineering. BE and ChemE
students were also less likely than to plan to work as practicing engineers. Compared to ME,
majoring in ChemE has an especially notable effect, decreasing these odds of planning to work
as a practicing engineer by almost 12 to 14 times. While students in General
Engineering/Engineering Science (GE) were 3 to 7 times more likely to plan to be self-employed
in engineering, they were 6 to 25 times less likely to plan to work in engineering management or
sales. In addition, compared to ME, students majoring in BE, ChemE, Civil Engineering (CE),
Electrical Engineering (EE), and ―other‖ majors had 2 to 3 times lower odds of planning to work
in engineering management or sales.
While there were no significant differences between juniors and sophomores in terms of
their career plans in engineering, senior students were more likely to indicate plans outside of
79
engineering. Relative to sophomores, seniors were more definite in their plans not to be self-
employed in engineering. Also, they were 3 to 5 times more likely than sophomore students to
report that they definitely would not be working as a practicing engineer or in engineering
management or sales.
Differences in curricular topics emphasized in engineering programs also resulted in
different kinds of influences on students‘ plan to work in engineering. Studying in programs that
placed more emphasis on professional values and broad and systems perspectives increased the
odds of plans for self-employment by almost 2.5 times. In contrast, studying in programs that
had higher perceived levels of emphasis on professional skills decreased the odds of planning
self-employment by five times. Students reporting greater attention to professional skills in their
program curricula were almost twice as likely to report plans to pursue working as a practicing
engineer (Table 4.3) or in engineering management (Table 4.4) than those whose curricula
focused less on professional skills. On the other hand, students reporting more exposure to core-
engineering skills in their program curricula were almost 4 times less likely to respond that they
will definitely pursue management or sales in engineering fields. The curricular emphasis on
core-engineering thinking in engineering courses was negatively associated with the odds of
engineering career plans for certain types of engineering professions (e.g., practicing engineer or
engineering management). However, students who reported more program emphases on core-
engineering thinking were almost half as likely to plan to work outside of engineering (Table
4.5).
Although the effects of a broad array of curriculum emphases were more influential than
classroom instructional experiences and co-curricular participation, instructional practices and
co-curricular programming have a positive influence on students‘ career plans in engineering.
80
Students‘ experiences with active/collaborative pedagogies increased the odds of planning a
career in management or sales by nearly one and half to three times. Students‘ participation in
engineering organizations for women (e.g., WISE, SWE) and for underrepresented minority
students (e.g. NSBE, SHPE) positively influenced the odds of engineering career plans (self-
employment and management in engineering) by 1.5 to 2 times.
Non-engineering Career Plans: Work outside of Engineering
Relative to sophomores, seniors were 2.7 times less likely to respond that they probably
will not work outside of engineering (reference category = definitely won’t). Although the
difference between the response categories, probably won’t and definitely won’t work outside of
engineering may be subtle, seniors nonetheless seem to consider non-engineering career plans
more than sophomores.
Students‘ curricular exposure to certain topics decreased the odds of planning a career
outside engineering. Students reporting greater emphasis on core-engineering topics in their
programs were one and half times less likely to report that they were not sure if they would work
outside of engineering (compared to the category of definitively won’t). Similarly, students with
more exposure to professional skills were 2.6 times more likely to report that they would
definitely not leave engineering after their graduation. The findings suggest that students who
receive more exposure to core-engineering thinking and professional skills in their courses --
both of which have been promoted by engineering professions -- are less likely to plan a non-
engineering career path. In contrast, students‘ reporting greater curricular attention to
professional values (which include topics such as ethics and diversity) and broad and systems
perspectives increased the odds of planning to enter non-engineering jobs by 1.5 to 2 times.
Similarly, compared to ME students, students in General Engineering (GE) programs were 3 to 7
81
times more likely to consider career plans outside of engineering; the multidisciplinary nature of
GE curriculum seems to be associated with the development of broader career plans. Students‘
participation in engineering clubs supporting women and URM students also appears to increase
the odds of planning non-engineering careers.
Engineering Graduate School Plans: Academia or Professional Development
The last two criterion measures asked students if they were likely to enter graduate school
in engineering for the purpose of pursuing an academic career (Table 4.6) or a professional
career (Table 4.7). Focusing on class standing, analyses indicated were no differences among
students who reported that they probably or definitely would be in graduate school three years
after graduation (compared to those definitely will not). Relative to sophomores, however,
juniors were more definite about their intentions to attend an engineering graduate program to
further their preparation for an engineering profession by almost three times. On the other hand,
seniors were less sure with their graduate school plans for academic job preparation.
The findings regarding engineering students‘ graduate school plans revealed some
disciplinary differences. Compared to ME students, being a CE, EE, or ―other‖ category of
engineering majors (e.g., computer engineering) increased the odds of graduate school plans for
both academic and professional job preparation by 3 to 8 times. While majoring in GE programs
decreased the odds of graduate school plans to prepare faculty jobs by 3 to 13 times, it increased
the odds of plans to attend graduate school to further one‘s engineering career by 5 to 7 times.
Overall, majoring in ―other‖ engineering programs increased the odds of graduate school plans
for academic and professional job preparation by 6 to 18 times.
Students‘ curricular, instructional, and co-curricular experiences decreased or increased
the odds of graduate school plans for faculty jobs and for engineering professions. Students
82
reporting more curricular emphasis on professional skills in their programs were about half as
likely to plan to attend graduate school in order to prepare for faculty careers and engineering
professions. On the other hand, greater curricular emphasis on broad and systems perspectives
increased the odds of planning graduate school and faculty careers plans and by around 2 times.
Further, studying in a program that placed greater curricular emphasis on core-engineering and
professional values increased the odds of considering graduate school for further engineering job
preparation by around two times.
Students‘ experiences with active learning pedagogy increased the odds of graduate
school plans to prepare to work in engineering by around two times. Engineering clubs, as well
as engineering clubs for women and URM students, were also positively related to the odds of
the graduate school plans for both academic and professional job preparation. Participation in
co-curricular activities increased the odds ratios of the graduate school plans around 1.5 times.,
but internship experiences were negatively related to the odds of the graduate school and faculty
work plans (although the effect size is diminutive).
The Influences of Self-assessment of Engineering Knowledge and Skills
Engineering Career Plans: Self-employment, Engineering Practice, and Engineering
Management/sales
In terms of students‘ self-assessment of engineering knowledge and skills, design skills
were significantly associated with the odds of post-graduation plans for self-employment in
engineering. Students with higher confidence in their design skills were four times more likely to
report that they definitely plan to be self-employed in engineering, compared to the reference
category of definitely won’t. While students‘ self-assessment of their fundamental skills (i.e.,
skills regarding applying math and science to engineering problems) was negatively associated
83
with the odds of their planning a career in management or sales, their confidence in their
contextual competence had the opposite effect. Specifically, looking across all categories,
students with higher confidence in their fundamental skills were 3 to 5 times more likely say they
definitely would not plan to enter engineering management or sales. Students perceiving higher
fundamental skills appeared to plan to enter engineering graduate schools (Table 4.6 and Table
4.7). In comparison, higher reported levels of contextual competence increased the odds of
planning a career in engineering management or sales by almost 2 times.
Non-engineering career plans: Work outside of Engineering
Students‘ engineering domain knowledge and skills differently influenced their post-
graduation plans to leave engineering fields. Students with higher confidence in their design
skills were 1.6 to 2.1 times less likely to report that they would work outside of engineering upon
their graduation. Students with a higher level of fundamental skills also were 2.0 to 2.6 times
less likely to report that they would leave the engineering career path. On the other hand, greater
contextual competence increased the odds that students would consider working outside of
engineering by 1.5 to 2.4 times.
Engineering Graduate School Plans: Academia or Professional Development
While students‘ fundamental skills were positively associated with their graduate school
plans to prepare for faculty jobs, students‘ contextual competence was negatively associated with
plans to prepare for faculty positions. Specifically, high fundamental skills increased the odds of
planning graduate school and faculty careers while higher levels of contextual competence
decreased such plans by 1.5 to 2.5 times. In terms of students‘ graduate school plans to further
engineering job preparation, higher confidence in fundamental skills increased the odds by
around 2.7 times. On the other hand, higher self-ratings of design skills and contextual
84
competence decreased the odds of these plans by almost 1.5 times. While students‘ contextual
competence was negatively related to graduate school plans regardless of whether students
planned to prepare for academic or professional positions, fundamental skills were positively
associated with each graduate school plan (Table 4.6 and Table 4.7).
Summary
Engineering students‘ post-graduation plans appear to be complex decisions. This study
suggests that students consider multiple options for their career goals, which are not limited to
engineering. This study also found that there are multiple factors decreasing or increasing
engineering students‘ post-graduation plans in engineering. Based on the conceptual framework
adapted from Terenzini and Reason (Terenzini & Reason, 2005), the analyses in this study
examined students‘ post-graduation plans as a function of students‘ academic program
experiences after controlling for pre-college characteristics that research has shown influence the
odds of having the outcomes and experiences to begin with (gender, race/ethnicity, and academic
preparedness). This study also explored how students‘ self-assessments of their engineering
domain knowledge and skills influenced their post-graduation plans after controlling for student
pre-college characteristics and academic program experiences. Although six outcome measures
were examined in the analyses, the findings were summarized into the following three sets of
engineering students‘ post-graduation plans:
Engineering career plans
Engineering graduate school plans
Non-engineering career plans
The first set, engineering career plans, contained three sub-measures based on different
types of engineering professions: self-employment in engineering, work as a practicing engineer,
85
and work in engineering management or sales. Engineering graduate school plans included two
sub-measures depending on the purposes of graduate school enrollment: to prepare for an
engineering faculty job or for other engineering professions. In this section, I summarize
significant predictors that consistently increase the odds of ―more definite‖ engineering post-
graduation plans. These findings will inform our understanding of which student variables
influence post-graduation plans in or outside of engineering. The first two sets of variables,
students‘ engineering career and graduate school plans, were positively influenced by:
Gender (with men‘s odds higher than women‘s);
Greater curricular emphases on core engineering thinking and professional skills in
engineering programs;
More active and collaborative learning experiences in the classroom;
More active engagement in student organizations for women and URMs; and
Higher self-assessments of fundamental and design skills
The third set, students‘ non-engineering career plans, was positively influenced by:
Class standing (with seniors‘ odds higher than sophomores‘);
Majoring in General Engineering (compared to Mechanical Engineering);
Greater curricular emphasis on professional values in engineering programs;
More active engagement in student organizations for women and URMs; and
Higher self-assessment of contextual competence.
In the next chapter I will discuss implications of these results for engineering education
policy and practice as well as suggest future research.
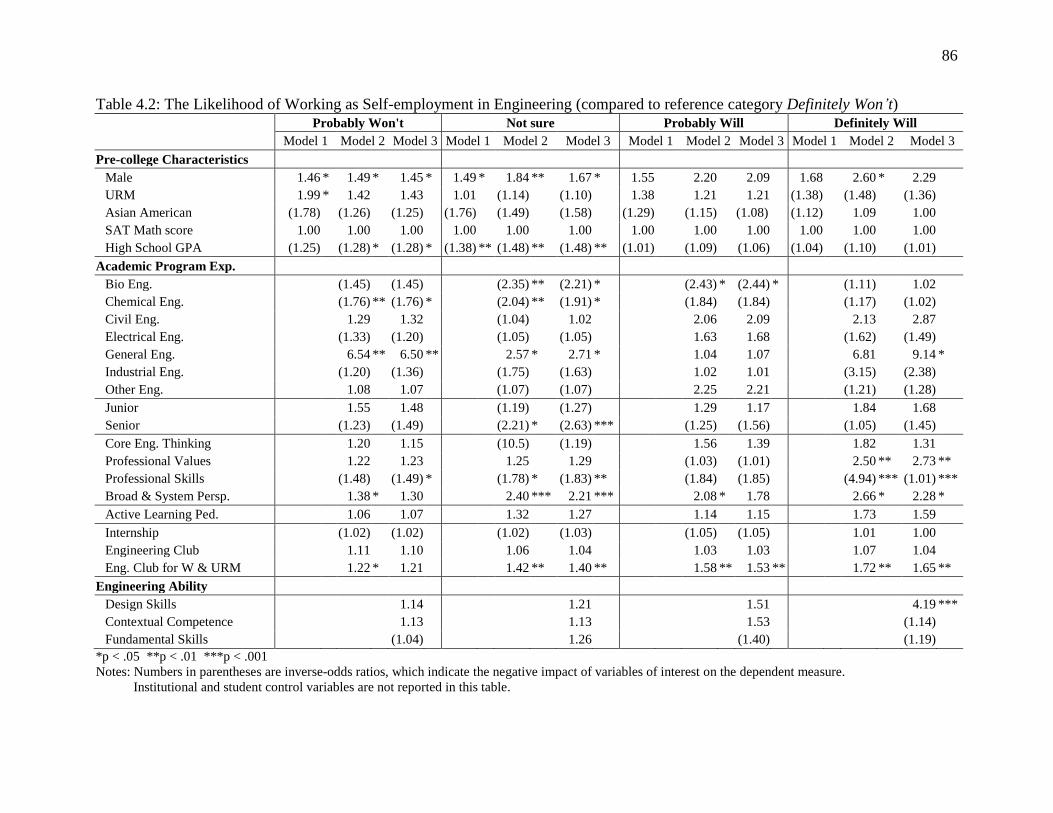
86
Table 4.2: The Likelihood of Working as Self-employment in Engineering (compared to reference category Definitely Won’t)
Probably Won't Not sure Probably Will Definitely Will
Model 1 Model 2 Model 3 Model 1 Model 2 Model 3 Model 1 Model 2 Model 3 Model 1 Model 2 Model 3
Pre-college Characteristics
Male 1.46 * 1.49 * 1.45 * 1.49 * 1.84 ** 1.67 * 1.55 2.20 2.09 1.68 2.60 * 2.29
URM 1.99 * 1.42 1.43 1.01 (1.14) (1.10) 1.38 1.21 1.21 (1.38) (1.48) (1.36)
Asian American (1.78) (1.26) (1.25) (1.76) (1.49) (1.58) (1.29) (1.15)
(1.08) (1.12) 1.09 1.00
SAT Math score 1.00 1.00 1.00 1.00 1.00 1.00 1.00 1.00 1.00 1.00 1.00 1.00
High School GPA (1.25) (1.28) * (1.28) * (1.38) ** (1.48) ** (1.48) ** (1.01) (1.09) (1.06) (1.04) (1.10) (1.01)
Academic Program Exp.
Bio Eng.
(1.45) (1.45) (2.35) ** (2.21) * (2.43) * (2.44) *
(1.11) 1.02
Chemical Eng.
(1.76) ** (1.76) * (2.04) ** (1.91) * (1.84) (1.84)
(1.17) (1.02)
Civil Eng.
1.29 1.32 (1.04) 1.02 2.06 2.09
2.13 2.87
Electrical Eng.
(1.33) (1.20) (1.05) (1.05) 1.63 1.68
(1.62) (1.49)
General Eng.
6.54 ** 6.50 ** 2.57 * 2.71 * 1.04 1.07
6.81 9.14 *
Industrial Eng.
(1.20) (1.36) (1.75) (1.63) 1.02 1.01
(3.15) (2.38)
Other Eng.
1.08 1.07 (1.07) (1.07) 2.25 2.21
(1.21) (1.28)
Junior
1.55 1.48 (1.19) (1.27) 1.29 1.17
1.84 1.68
Senior
(1.23) (1.49) (2.21) * (2.63) *** (1.25) (1.56)
(1.05) (1.45)
Core Eng. Thinking
1.20 1.15 (10.5) (1.19) 1.56 1.39
1.82 1.31
Professional Values
1.22 1.23 1.25 1.29 (1.03) (1.01)
2.50 ** 2.73 **
Professional Skills
(1.48) (1.49) * (1.78) * (1.83) ** (1.84) (1.85)
(4.94) *** (1.01) ***
Broad & System Persp.
1.38 * 1.30 2.40 *** 2.21 *** 2.08 * 1.78
2.66 * 2.28 *
Active Learning Ped.
1.06 1.07 1.32 1.27 1.14 1.15
1.73 1.59
Internship
(1.02) (1.02) (1.02) (1.03) (1.05) (1.05)
1.01 1.00
Engineering Club
1.11 1.10 1.06 1.04 1.03 1.03
1.07 1.04
Eng. Club for W & URM
1.22 * 1.21 1.42 ** 1.40 ** 1.58 ** 1.53 **
1.72 ** 1.65 **
Engineering Ability
Design Skills
1.14
1.21
1.51
4.19 ***
Contextual Competence
1.13
1.13
1.53
(1.14)
Fundamental Skills (1.04) 1.26 (1.40) (1.19)
*p < .05 **p < .01 ***p < .001
Notes: Numbers in parentheses are inverse-odds ratios, which indicate the negative impact of variables of interest on the dependent measure.
Institutional and student control variables are not reported in this table.
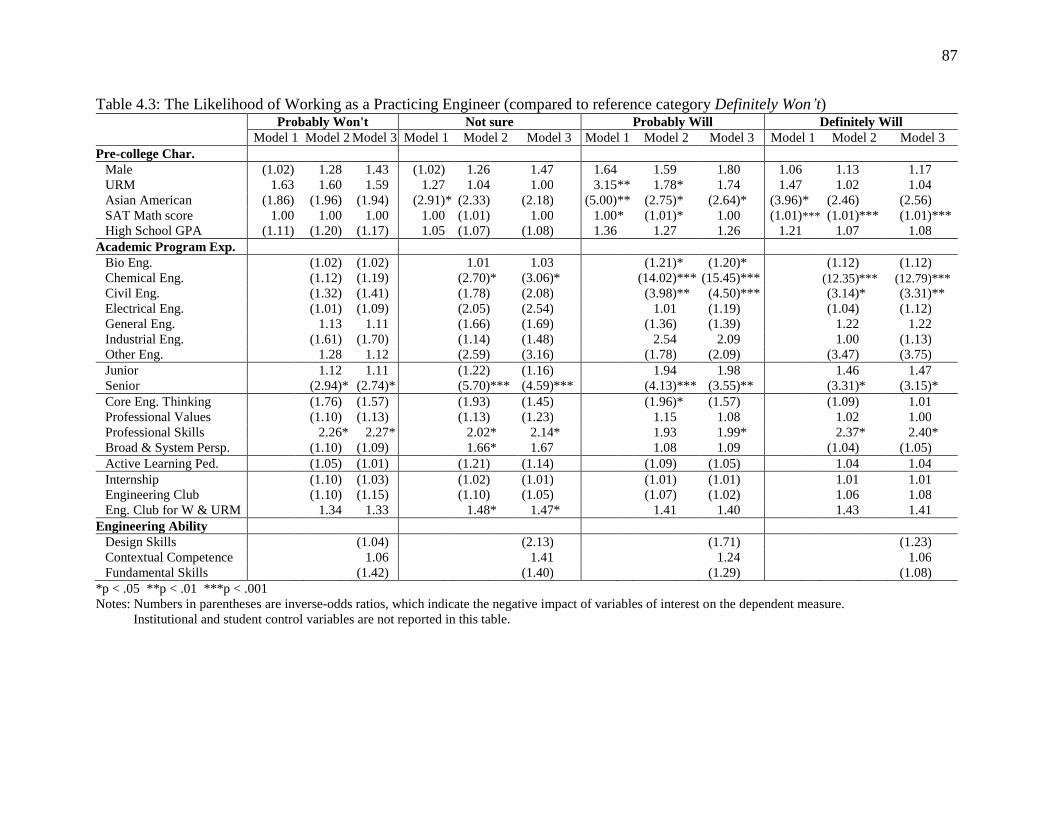
87
Table 4.3: The Likelihood of Working as a Practicing Engineer (compared to reference category Definitely Won’t)
Probably Won't Not sure Probably Will Definitely Will
Model 1 Model 2 Model 3 Model 1 Model 2 Model 3 Model 1 Model 2 Model 3 Model 1 Model 2 Model 3
Pre-college Char.
Male (1.02) 1.28 1.43 (1.02) 1.26 1.47 1.64 1.59 1.80 1.06 1.13 1.17
URM 1.63 1.60 1.59 1.27 1.04 1.00 3.15 ** 1.78 * 1.74 1.47 1.02 1.04
Asian American (1.86) (1.96) (1.94) (2.91) * (2.33) (2.18) (5.00) ** (2.75) * (2.64) * (3.96) * (2.46) (2.56)
SAT Math score 1.00 1.00 1.00 1.00 (1.01) 1.00 1.00 * (1.01) * 1.00 (1.01) *** (1.01) *** (1.01) ***
High School GPA (1.11) (1.20) (1.17) 1.05 (1.07) (1.08) 1.36 1.27 1.26 1.21 1.07 1.08
Academic Program Exp.
Bio Eng.
(1.02) (1.02)
1.01 1.03
(1.21) * (1.20) *
(1.12) (1.12)
Chemical Eng. (1.12) (1.19) (2.70) * (3.06) *
(14.02) *** (15.45) ***
(12.35) *** (12.79) ***
Civil Eng. (1.32) (1.41) (1.78) (2.08)
(3.98) ** (4.50) ***
(3.14) * (3.31) **
Electrical Eng. (1.01) (1.09) (2.05) (2.54)
1.01 (1.19)
(1.04) (1.12)
General Eng. 1.13 1.11 (1.66) (1.69)
(1.36) (1.39)
1.22 1.22
Industrial Eng. (1.61) (1.70) (1.14) (1.48)
2.54 2.09
1.00 (1.13)
Other Eng. 1.28 1.12 (2.59) (3.16)
(1.78) (2.09)
(3.47) (3.75)
Junior 1.12 1.11 (1.22) (1.16)
1.94 1.98
1.46 1.47
Senior (2.94) * (2.74) * (5.70) *** (4.59) ***
(4.13) *** (3.55) **
(3.31) * (3.15) *
Core Eng. Thinking (1.76) (1.57) (1.93) (1.45)
(1.96) * (1.57)
(1.09) 1.01
Professional Values (1.10) (1.13) (1.13) (1.23)
1.15 1.08
1.02 1.00
Professional Skills 2.26 * 2.27 * 2.02 * 2.14 *
1.93 1.99 *
2.37 * 2.40 *
Broad & System Persp. (1.10) (1.09) 1.66 * 1.67
1.08 1.09
(1.04) (1.05)
Active Learning Ped. (1.05) (1.01) (1.21) (1.14)
(1.09) (1.05)
1.04 1.04
Internship (1.10) (1.03) (1.02) (1.01)
(1.01) (1.01)
1.01 1.01
Engineering Club (1.10) (1.15) (1.10) (1.05)
(1.07) (1.02)
1.06 1.08
Eng. Club for W & URM 1.34 1.33 1.48 * 1.47 *
1.41 1.40
1.43 1.41
Engineering Ability
Design Skills
(1.04)
(2.13)
(1.71)
(1.23)
Contextual Competence
1.06
1.41
1.24
1.06
Fundamental Skills (1.42) (1.40) (1.29) (1.08)
*p < .05 **p < .01 ***p < .001
Notes: Numbers in parentheses are inverse-odds ratios, which indicate the negative impact of variables of interest on the dependent measure.
Institutional and student control variables are not reported in this table.
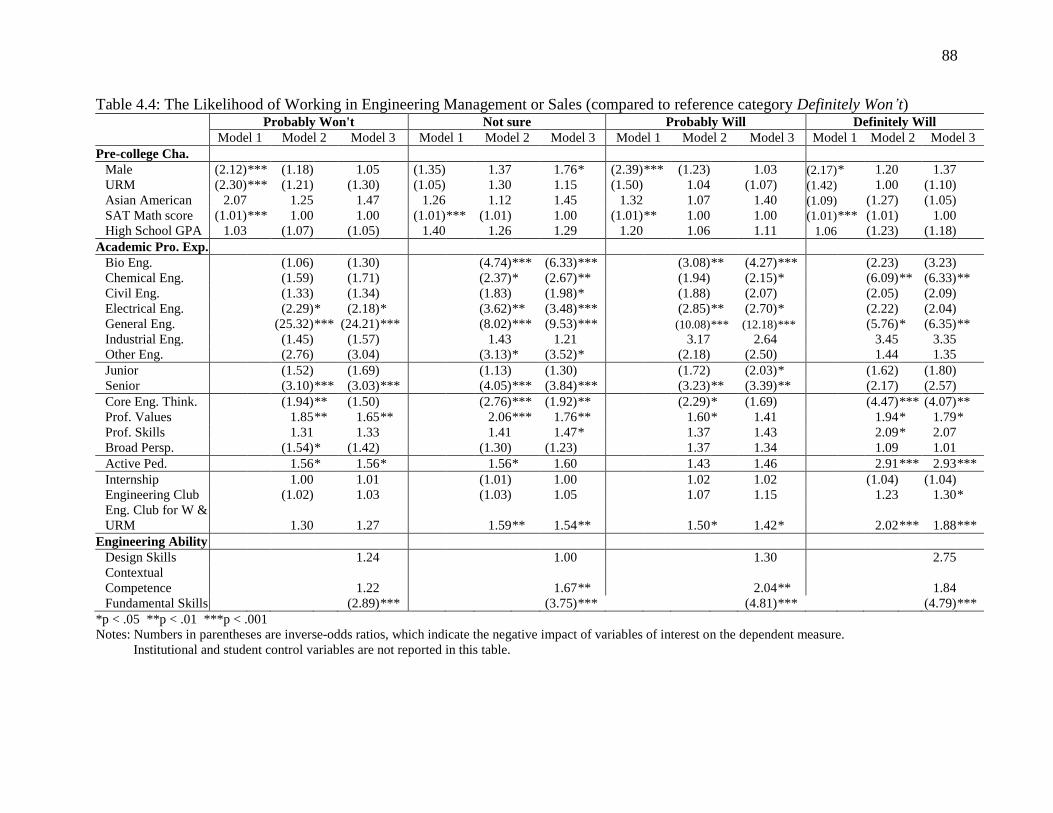
88
Table 4.4: The Likelihood of Working in Engineering Management or Sales (compared to reference category Definitely Won’t)
Probably Won't Not sure Probably Will Definitely Will
Model 1 Model 2 Model 3 Model 1 Model 2 Model 3 Model 1 Model 2 Model 3 Model 1 Model 2 Model 3
Pre-college Cha.
Male (2.12) *** (1.18) 1.05 (1.35) 1.37 1.76 * (2.39) *** (1.23) 1.03 (2.17) * 1.20 1.37
URM (2.30) *** (1.21) (1.30) (1.05) 1.30 1.15 (1.50) 1.04 (1.07) (1.42) 1.00 (1.10)
Asian American 2.07 1.25 1.47 1.26 1.12 1.45 1.32 1.07 1.40 (1.09) (1.27) (1.05)
SAT Math score (1.01) *** 1.00 1.00 (1.01) *** (1.01) 1.00 (1.01) ** 1.00 1.00 (1.01) *** (1.01) 1.00
High School GPA 1.03 (1.07) (1.05) 1.40 1.26 1.29 1.20 1.06 1.11 1.06 (1.23) (1.18)
Academic Pro. Exp.
Bio Eng.
(1.06) (1.30)
(4.74) *** (6.33) ***
(3.08) ** (4.27) ***
(2.23) (3.23)
Chemical Eng.
(1.59) (1.71)
(2.37) * (2.67) **
(1.94) (2.15) *
(6.09) ** (6.33) **
Civil Eng.
(1.33) (1.34)
(1.83) (1.98) *
(1.88) (2.07)
(2.05) (2.09)
Electrical Eng.
(2.29) * (2.18) *
(3.62) ** (3.48) ***
(2.85) ** (2.70) *
(2.22) (2.04)
General Eng.
(25.32) *** (24.21) ***
(8.02) *** (9.53) ***
(10.08) *** (12.18) ***
(5.76) * (6.35) **
Industrial Eng.
(1.45) (1.57)
1.43 1.21
3.17 2.64
3.45 3.35
Other Eng.
(2.76) (3.04)
(3.13) * (3.52) *
(2.18) (2.50)
1.44 1.35
Junior
(1.52) (1.69)
(1.13) (1.30)
(1.72) (2.03) *
(1.62) (1.80)
Senior
(3.10) *** (3.03) ***
(4.05) *** (3.84) ***
(3.23) ** (3.39) **
(2.17) (2.57)
Core Eng. Think.
(1.94) ** (1.50)
(2.76) *** (1.92) **
(2.29) * (1.69)
(4.47) *** (4.07) **
Prof. Values
1.85 ** 1.65 **
2.06 *** 1.76 **
1.60 * 1.41
1.94 * 1.79 *
Prof. Skills
1.31 1.33
1.41 1.47 *
1.37 1.43
2.09 * 2.07
Broad Persp.
(1.54) * (1.42)
(1.30) (1.23)
1.37 1.34
1.09 1.01
Active Ped.
1.56 * 1.56 *
1.56 * 1.60
1.43 1.46
2.91 *** 2.93 ***
Internship
1.00 1.01
(1.01) 1.00
1.02 1.02
(1.04) (1.04)
Engineering Club
(1.02) 1.03
(1.03) 1.05
1.07 1.15
1.23 1.30 *
Eng. Club for W &
URM 1.30 1.27
1.59 ** 1.54 **
1.50 * 1.42 *
2.02 *** 1.88 ***
Engineering Ability
Design Skills
1.24
1.00
1.30
2.75
Contextual
Competence
1.22
1.67 **
2.04 **
1.84
Fundamental Skills (2.89) *** (3.75) ***
(4.81) *** (4.79) ***
*p < .05 **p < .01 ***p < .001
Notes: Numbers in parentheses are inverse-odds ratios, which indicate the negative impact of variables of interest on the dependent measure.
Institutional and student control variables are not reported in this table.
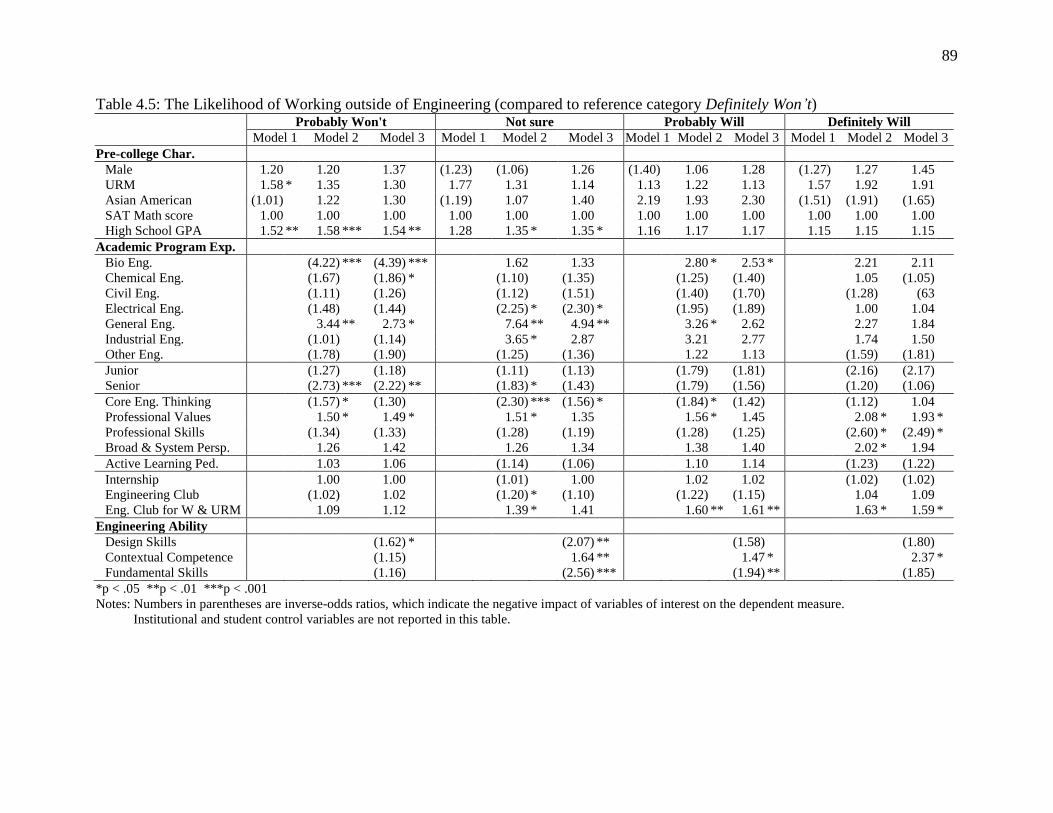
89
Table 4.5: The Likelihood of Working outside of Engineering (compared to reference category Definitely Won’t)
Probably Won't Not sure Probably Will Definitely Will
Model 1 Model 2 Model 3 Model 1 Model 2 Model 3 Model 1 Model 2 Model 3 Model 1 Model 2 Model 3
Pre-college Char.
Male 1.20 1.20 1.37 (1.23) (1.06) 1.26 (1.40) 1.06 1.28 (1.27) 1.27 1.45
URM 1.58 * 1.35 1.30 1.77 1.31 1.14 1.13 1.22 1.13 1.57 1.92 1.91
Asian American (1.01) 1.22 1.30 (1.19) 1.07 1.40 2.19 1.93 2.30 (1.51) (1.91) (1.65)
SAT Math score 1.00 1.00 1.00 1.00 1.00 1.00 1.00 1.00 1.00 1.00 1.00 1.00
High School GPA 1.52 ** 1.58 *** 1.54 ** 1.28 1.35 * 1.35 * 1.16 1.17 1.17 1.15 1.15 1.15
Academic Program Exp.
Bio Eng.
(4.22) *** (4.39) ***
1.62 1.33
2.80 * 2.53 *
2.21 2.11
Chemical Eng.
(1.67) (1.86) *
(1.10) (1.35)
(1.25) (1.40)
1.05 (1.05)
Civil Eng.
(1.11) (1.26)
(1.12) (1.51)
(1.40) (1.70)
(1.28) (63
Electrical Eng.
(1.48) (1.44)
(2.25) * (2.30) *
(1.95) (1.89)
1.00 1.04
General Eng.
3.44 ** 2.73 *
7.64 ** 4.94 **
3.26 * 2.62
2.27 1.84
Industrial Eng.
(1.01) (1.14)
3.65 * 2.87
3.21 2.77
1.74 1.50
Other Eng.
(1.78) (1.90)
(1.25) (1.36)
1.22 1.13
(1.59) (1.81)
Junior
(1.27) (1.18)
(1.11) (1.13)
(1.79) (1.81)
(2.16) (2.17)
Senior
(2.73) *** (2.22) **
(1.83) * (1.43)
(1.79) (1.56)
(1.20) (1.06)
Core Eng. Thinking
(1.57) * (1.30)
(2.30) *** (1.56) *
(1.84) * (1.42)
(1.12) 1.04
Professional Values
1.50 * 1.49 *
1.51 * 1.35
1.56 * 1.45
2.08 * 1.93 *
Professional Skills
(1.34) (1.33)
(1.28) (1.19)
(1.28) (1.25)
(2.60) * (2.49) *
Broad & System Persp.
1.26 1.42
1.26 1.34
1.38 1.40
2.02 * 1.94
Active Learning Ped.
1.03 1.06
(1.14) (1.06)
1.10 1.14
(1.23) (1.22)
Internship
1.00 1.00
(1.01) 1.00
1.02 1.02
(1.02) (1.02)
Engineering Club
(1.02) 1.02
(1.20) * (1.10)
(1.22) (1.15)
1.04 1.09
Eng. Club for W & URM
1.09 1.12
1.39 * 1.41
1.60 ** 1.61 **
1.63 * 1.59 *
Engineering Ability
Design Skills
(1.62) *
(2.07) **
(1.58)
(1.80)
Contextual Competence
(1.15)
1.64 **
1.47 *
2.37 *
Fundamental Skills (1.16) (2.56) *** (1.94) ** (1.85)
*p < .05 **p < .01 ***p < .001
Notes: Numbers in parentheses are inverse-odds ratios, which indicate the negative impact of variables of interest on the dependent measure.
Institutional and student control variables are not reported in this table.
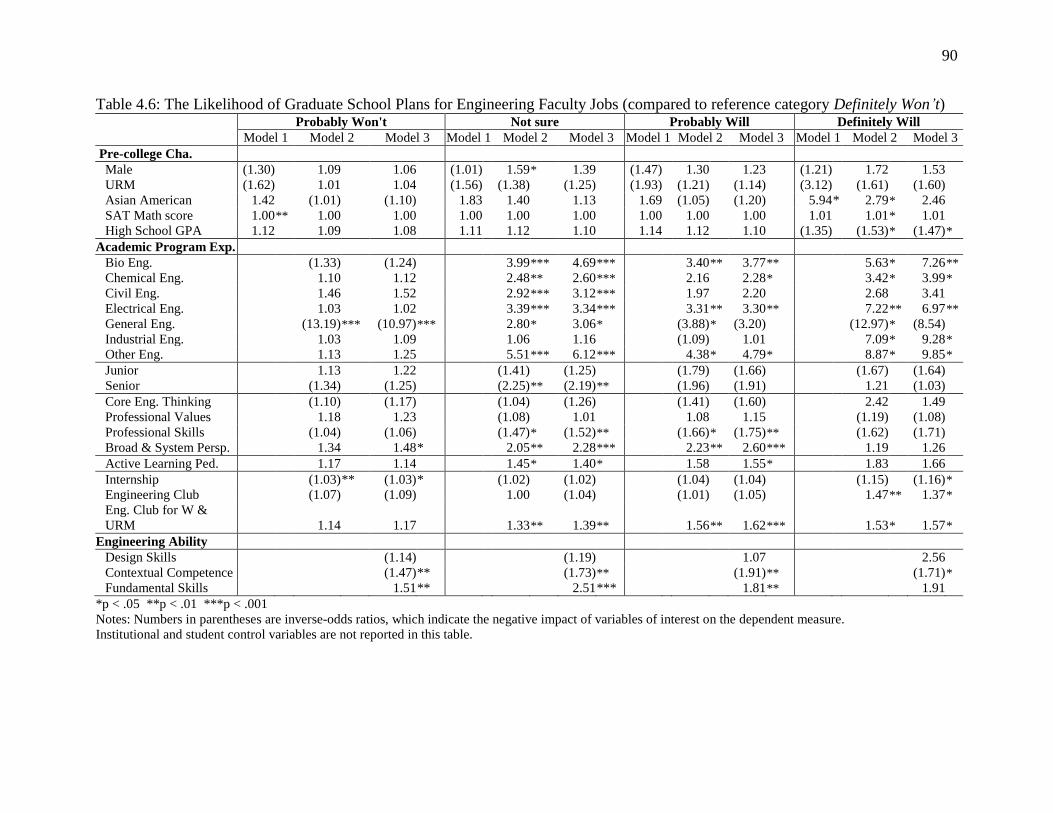
90
Table 4.6: The Likelihood of Graduate School Plans for Engineering Faculty Jobs (compared to reference category Definitely Won’t)
Probably Won't Not sure Probably Will Definitely Will
Model 1 Model 2 Model 3 Model 1 Model 2 Model 3 Model 1 Model 2 Model 3 Model 1 Model 2 Model 3
Pre-college Cha.
Male (1.30) 1.09 1.06 (1.01) 1.59 * 1.39 (1.47) 1.30 1.23 (1.21) 1.72 1.53 URM (1.62) 1.01 1.04 (1.56) (1.38) (1.25) (1.93) (1.21) (1.14) (3.12) (1.61) (1.60) Asian American 1.42 (1.01) (1.10) 1.83 1.40 1.13 1.69 (1.05) (1.20) 5.94 * 2.79 * 2.46 SAT Math score 1.00 ** 1.00 1.00 1.00 1.00 1.00 1.00 1.00 1.00 1.01 1.01 * 1.01 High School GPA 1.12 1.09 1.08 1.11 1.12 1.10 1.14 1.12 1.10 (1.35) (1.53) * (1.47) *
Academic Program Exp.
Bio Eng.
(1.33) (1.24)
3.99 *** 4.69 ***
3.40 ** 3.77 **
5.63 * 7.26 **
Chemical Eng.
1.10 1.12
2.48 ** 2.60 ***
2.16 2.28 *
3.42 * 3.99 *
Civil Eng.
1.46 1.52
2.92 *** 3.12 ***
1.97 2.20
2.68 3.41 Electrical Eng.
1.03 1.02
3.39 *** 3.34 ***
3.31 ** 3.30 **
7.22 ** 6.97 **
General Eng.
(13.19) *** (10.97) ***
2.80 * 3.06 *
(3.88) * (3.20)
(12.97) * (8.54) Industrial Eng.
1.03 1.09
1.06 1.16
(1.09) 1.01
7.09 * 9.28 *
Other Eng.
1.13 1.25
5.51 *** 6.12 ***
4.38 * 4.79 *
8.87 * 9.85 *
Junior
1.13 1.22
(1.41) (1.25)
(1.79) (1.66)
(1.67) (1.64) Senior
(1.34) (1.25)
(2.25) ** (2.19) **
(1.96) (1.91)
1.21 (1.03)
Core Eng. Thinking
(1.10) (1.17)
(1.04) (1.26)
(1.41) (1.60)
2.42 1.49 Professional Values
1.18 1.23
(1.08) 1.01
1.08 1.15
(1.19) (1.08) Professional Skills
(1.04) (1.06)
(1.47) * (1.52) **
(1.66) * (1.75) **
(1.62) (1.71) Broad & System Persp.
1.34 1.48 *
2.05 ** 2.28 ***
2.23 ** 2.60 ***
1.19 1.26
Active Learning Ped.
1.17 1.14
1.45 * 1.40 *
1.58 1.55 *
1.83 1.66
Internship
(1.03) ** (1.03) *
(1.02) (1.02)
(1.04) (1.04)
(1.15) (1.16) *
Engineering Club
(1.07) (1.09)
1.00 (1.04)
(1.01) (1.05)
1.47 ** 1.37 *
Eng. Club for W &
URM
1.14 1.17
1.33 ** 1.39 **
1.56 ** 1.62 ***
1.53 * 1.57 *
Engineering Ability
Design Skills
(1.14)
(1.19)
1.07
2.56
Contextual Competence
(1.47) **
(1.73) **
(1.91) **
(1.71) *
Fundamental Skills 1.51 ** 2.51 ***
1.81 ** 1.91
*p < .05 **p < .01 ***p < .001
Notes: Numbers in parentheses are inverse-odds ratios, which indicate the negative impact of variables of interest on the dependent measure.
Institutional and student control variables are not reported in this table.
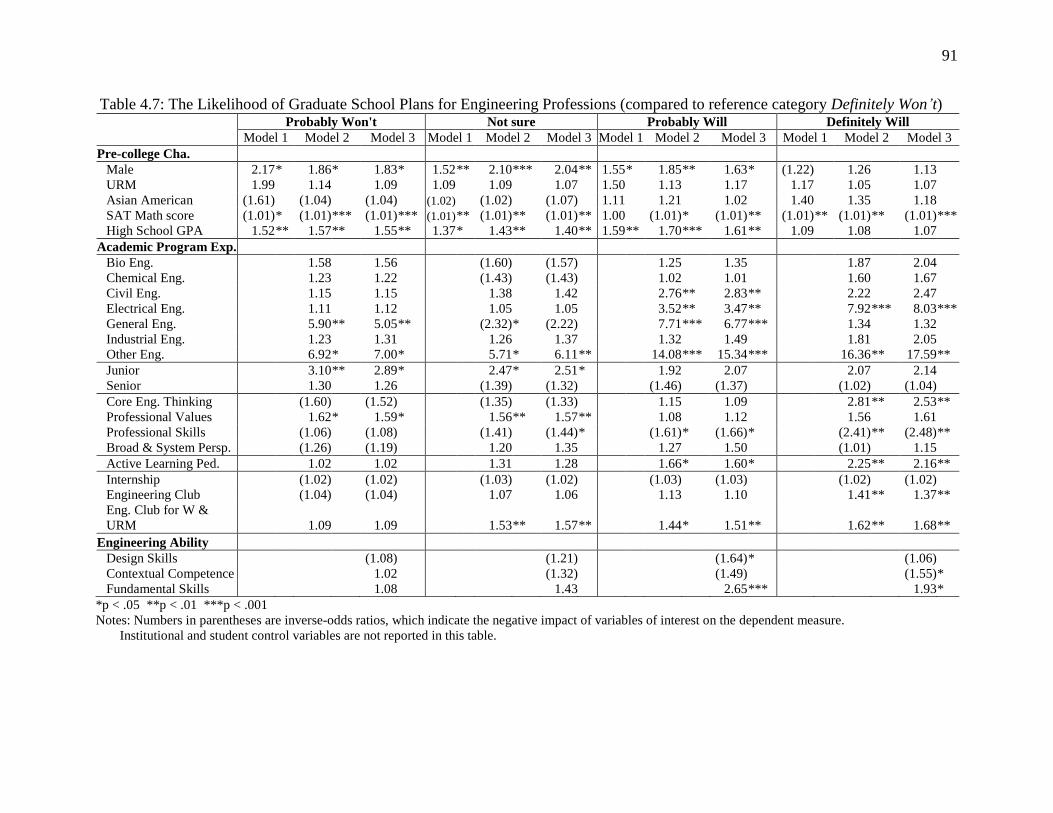
91
Table 4.7: The Likelihood of Graduate School Plans for Engineering Professions (compared to reference category Definitely Won’t)
Probably Won't Not sure Probably Will Definitely Will
Model 1 Model 2 Model 3 Model 1 Model 2 Model 3 Model 1 Model 2 Model 3 Model 1 Model 2 Model 3
Pre-college Cha.
Male 2.17 * 1.86 * 1.83 * 1.52 ** 2.10 *** 2.04 ** 1.55 * 1.85 ** 1.63 * (1.22) 1.26 1.13
URM 1.99 1.14 1.09 1.09 1.09 1.07 1.50 1.13 1.17 1.17 1.05 1.07
Asian American (1.61) (1.04) (1.04) (1.02) (1.02) (1.07) 1.11 1.21 1.02 1.40 1.35 1.18
SAT Math score (1.01) * (1.01) *** (1.01) *** (1.01) ** (1.01) ** (1.01) ** 1.00 (1.01) * (1.01) ** (1.01) ** (1.01) ** (1.01) ***
High School GPA 1.52 ** 1.57 ** 1.55 ** 1.37 * 1.43 ** 1.40 ** 1.59 ** 1.70 *** 1.61 ** 1.09 1.08 1.07
Academic Program Exp.
Bio Eng.
1.58 1.56
(1.60) (1.57)
1.25 1.35
1.87 2.04
Chemical Eng.
1.23 1.22
(1.43) (1.43)
1.02 1.01
1.60 1.67
Civil Eng.
1.15 1.15
1.38 1.42
2.76 ** 2.83 **
2.22 2.47
Electrical Eng.
1.11 1.12
1.05 1.05
3.52 ** 3.47 **
7.92 *** 8.03 ***
General Eng.
5.90 ** 5.05 **
(2.32) * (2.22)
7.71 *** 6.77 ***
1.34 1.32
Industrial Eng.
1.23 1.31
1.26 1.37
1.32 1.49
1.81 2.05
Other Eng.
6.92 * 7.00 *
5.71 * 6.11 **
14.08 *** 15.34 ***
16.36 ** 17.59 **
Junior
3.10 ** 2.89 *
2.47 * 2.51 *
1.92 2.07
2.07 2.14
Senior
1.30 1.26
(1.39) (1.32)
(1.46) (1.37)
(1.02) (1.04)
Core Eng. Thinking
(1.60) (1.52)
(1.35) (1.33)
1.15 1.09
2.81 ** 2.53 **
Professional Values
1.62 * 1.59 *
1.56 ** 1.57 **
1.08 1.12
1.56 1.61
Professional Skills
(1.06) (1.08)
(1.41) (1.44) *
(1.61) * (1.66) *
(2.41) ** (2.48) **
Broad & System Persp.
(1.26) (1.19)
1.20 1.35
1.27 1.50
(1.01) 1.15
Active Learning Ped.
1.02 1.02
1.31 1.28
1.66 * 1.60 *
2.25 ** 2.16 **
Internship
(1.02) (1.02)
(1.03) (1.02)
(1.03) (1.03)
(1.02) (1.02)
Engineering Club
(1.04) (1.04)
1.07 1.06
1.13 1.10
1.41 ** 1.37 **
Eng. Club for W &
URM 1.09 1.09
1.53 ** 1.57 **
1.44 * 1.51 **
1.62 ** 1.68 **
Engineering Ability
Design Skills
(1.08)
(1.21)
(1.64) *
(1.06)
Contextual Competence
1.02
(1.32)
(1.49)
(1.55) *
Fundamental Skills 1.08 1.43 2.65 *** 1.93 *
*p < .05 **p < .01 ***p < .001
Notes: Numbers in parentheses are inverse-odds ratios, which indicate the negative impact of variables of interest on the dependent measure.
Institutional and student control variables are not reported in this table.
92
Chapter 5
DISCUSSION, CONCLUSIONS, and IMPLICATIONS
Restatement of the Problem
Engineers and scientists help nations meet national workforce needs, maintained or
improve quality of life, and remain economically competitive in an increasingly global
workplace. To continue to meet the needs, engineering industry and undergraduate programs
have investigated ways to recruit and retain more diverse and highly-qualified students.
Recently, however, U.S. educators and policy makers have raised concerns about the tendency
for engineering and science graduates to choose careers outside the STEM fields in which they
were educated (Lowell, et al., 2009). Even before they leave engineering and science fields upon
their graduation, some engineering students plan to switch fields as they enter the job market
(Sheppard, et al., 2010). The question of students‘ post-graduation plan is thus a critical one for
the field of engineering as both industry and higher education institutions seek to understand how
to increase the production of highly-skilled individuals.
Despite the concern, there is a few empirical studies how students‘ academic program
and their experiences and abilities influence their career and graduate school plans. This study
employed the Prototype to Production: Processes and Conditions for Preparing the Engineer of 2020
(P2P) dataset, which contains survey responses from 5,239 engineering students in 212
engineering programs from 31 four-year engineering schools. Using this data, I was able to
explore the post-graduation plans of the U.S. engineering students by addressing the research
question: do individual students‘ pre-college characteristics, academic program experiences, and
self-assessments of their engineering abilities influence their post-graduation plans? Six
potential responses regarding students‘ post-graduation plans from the P2P student survey were
93
explored in this study: 1) Be self-employed in engineering; 2) Be a practicing engineer in
industry, government, or non-profit organization; 3) Work in engineering management or sales; 4)
Work outside engineering; 5) Be in graduate school preparing to become an engineering faculty
member; and 6) Be in graduate school in engineering preparing to work in industry, government,
or non-profit organization. Because these outcome measures use an ordered scale (from low to
high; 1=definitely won‘t; 2=probably won‘t; 3=not sure; 4=probably will; and 5=definitely will),
the analysis used a multinomial logistic regression model. These analyses contribute to our
understanding of engineering students‘ post-graduation plans in or outside of engineering. In this
chapter I discuss how students‘ post-graduation plans in engineering are positively or negatively
related to different aspects of their undergraduate experiences and their self-assessments of their
engineering knowledge and skills. These findings have a number of implications for practice,
policy, theory-building, and future research.
Discussion and Conclusions
Students’ Pre-college Characteristics
Women are underrepresented in engineering: males are nearly six times more than
females to major in engineering (Chen & Weko, 2009); women students are more likely to
switch their majors even after entering engineering programs (Seymour & Hewitt, 1997); women
are much less likely to receive a Ph.D. degree in engineering disciplines (National Science Board,
2010); and they tend to leave engineering fields even after spending several years developing
their careers (Fouad & Singh, 2011). This study documents an additional gender gap in students‘
post-graduation plans in or outside of engineering. Specifically, men were more likely than
women to plan to pursue self-employment in engineering and engineering graduate school to
further their engineering careers.
94
Although this study was not designed to explore why women students are less likely to
plan to pursue engineering career options, previous studies suggest that course content and
instructional practices may encourage women to choose engineering majors and stay in
engineering. Zafar (2009) reports that males are nearly twice as likely as females to major in
engineering, but about a quarter of the difference arises from differences in beliefs about
enjoyment of coursework rather than future earnings. Relative to men, research shows that
female tend to be more interested in broad concepts that have relevance on society or their own
lives (Brotman & Moore, 2008; Haüssler & Hoffmann, 2002; Sheppard, et al., 2010). Research
also indicates that using ―real life‖ situations in classes also is an effective instructional
technique (Clewell & Campbell, 2002) to entice women students in engineering programs
(Jessup, Sumner, & Barker, 2005). Future research should further examine how variations in
curricular emphases and instructional practices influence women students‘ post-graduation plans.
It might be argued that while omen students are less likely than male students to report
that they plan to enter engineering careers and/or engineering graduate school, these reported
plans might be different from their actual choices. However, a recent study found that 15 percent
(N=560) of participants who had earned a baccalaureate degree in engineering chose not to enter
the field of engineering. Instead, 4 out-of-5 worked in another area (such as information
technology), in education, or in government/non-profit agencies (Fouad & Singh, 2011). One of
the top five reasons those reporting for deciding not to pursue engineering careers was that they
had always planned to go into another field. Given the continuing gender gap, and the findings
of this study, engineering researchers and educators should examine how women engineering
students develop and, possibly, change their career and graduate school plans. If during their
engineering programs, women students decide not to pursue engineering careers because they are
95
dissatisfied with their engineering courses or the climate in their classrooms, engineering
programs should consider providing support systems to maintain women students‘ interests in
engineering careers as well as considering how changes in curriculum, instruction, and program
climates could enhance women‘s persistence to engineering careers.
Although historically underrepresented students continue to be vastly underrepresented
in engineering industry and graduate school (National Science Board, 2010), their post-
graduation plans regarding the pursuit of engineering careers, at least, do not appear to be
different than those of their White counterparts. This finding suggests a role for engineering
educators in encouraging URM students to follow up their plans to enter engineering professions
and enroll graduate school. This study, however, might not find differences between URMs and
White students, because specific race/ethnicity groups were not analyzed. Thus there is a need
for further research in these areas.
In addition to gender and race/ethnicity differences, this study explored whether level of
students‘ math proficiency prior to college influenced students‘ post-graduation plans. Math
proficiency is thought to be particularly important to success in engineering programs -- and
research indicates that this is truly the case for engineers (Adelman, 1998, 1999). While most
research emphasizes academic preparedness in mathematics as one of the most silent factors
influencing engineering students‘ choice to go to graduate school in engineering (Dix & National
Research Council, 1987), this study suggests that students with greater math proficiency are less
likely to plan to pursue an engineering career and advanced study in the field. Research by
Lowell, et al. (2009) indicated that high-performing students (defined as ranked in the top
quintile on the SAT/ACT tests and among high school GPA performers) were increasingly being
recruited into jobs that were not categorized as science and engineering. This points to a
96
limitation of the current study, which cannot account for external influences such as job market
trends, on engineering students‘ post-graduation plans.
Academic Program Experiences
A primary goal of this study was to understand the impact of engineering students‘
academic program experiences and class-standing on their post-graduation plans. To explore this,
the study investigated the role of disciplinary major, class standing, and three kinds of academic
program experiences (curricular emphases, co-curricular participation and engagement, and
instructional experiences). Examination of the factors that influenced students‘ post-graduation
plans provided insights into effective educational practices. The model including students‘
academic program experiences explained 14% to 30% of the variance in students‘ post-
graduation plans (across all six criterion measures), which is almost 90% to 98% of the variances
in the final model that included students‘ self-assessments of their engineering abilities. This
finding provides strong evidence that students‘ experiences in their academic programs shape
their post-graduation plans whether they stay in or leave engineering fields upon their graduation.
Disciplinary Differences
Researchers have examined whether students‘ career and graduate school plans vary by
type of institution (e.g., Cruce, et al., 2006), but they have not typically examined whether plans
vary by discipline. For example, Lichtenstein et al. (2009) found that students enrolling a
―specialized‖ institution offering only engineering, science, and technology majors were more
likely to pursue engineering careers and graduate school in engineering than students attending
an institution offering a broad range of majors. Sheppard et al. (2010) suggested that these
differences in post-graduation plans might be influenced by different curricular emphases offered
by the institutions. Previous studies, however, did not consider the effects of disciplinary majors
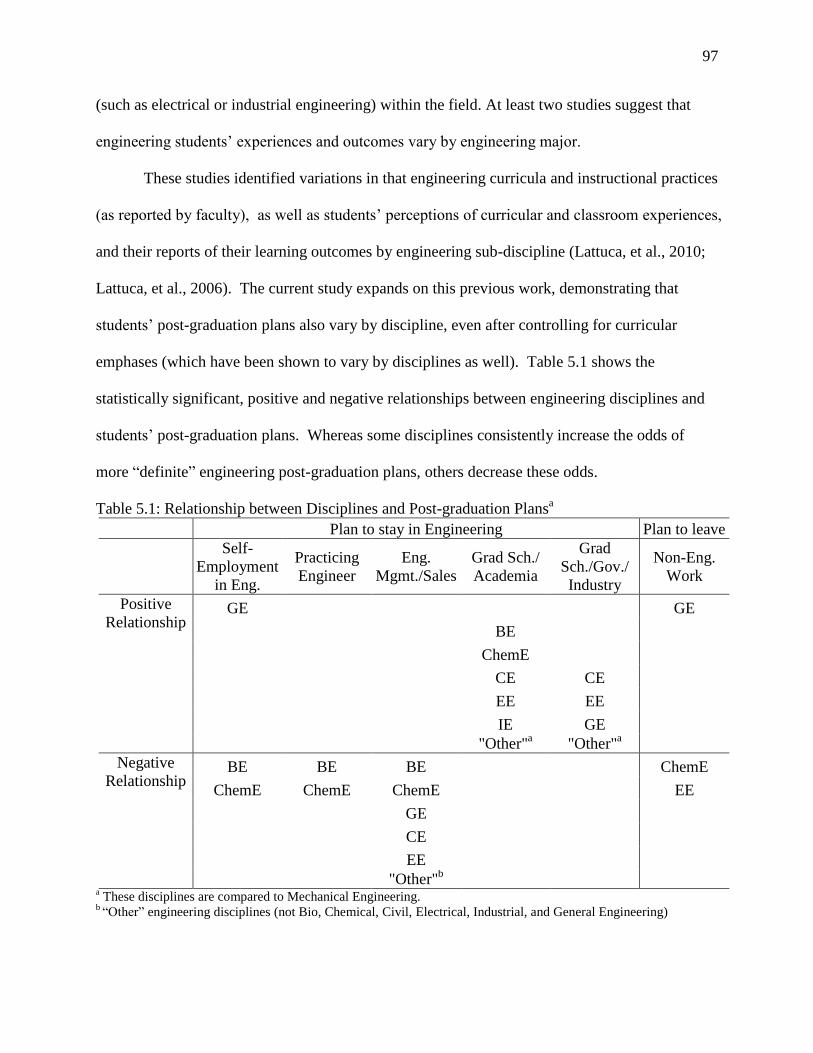
97
(such as electrical or industrial engineering) within the field. At least two studies suggest that
engineering students‘ experiences and outcomes vary by engineering major.
These studies identified variations in that engineering curricula and instructional practices
(as reported by faculty), as well as students‘ perceptions of curricular and classroom experiences,
and their reports of their learning outcomes by engineering sub-discipline (Lattuca, et al., 2010;
Lattuca, et al., 2006). The current study expands on this previous work, demonstrating that
students‘ post-graduation plans also vary by discipline, even after controlling for curricular
emphases (which have been shown to vary by disciplines as well). Table 5.1 shows the
statistically significant, positive and negative relationships between engineering disciplines and
students‘ post-graduation plans. Whereas some disciplines consistently increase the odds of
more ―definite‖ engineering post-graduation plans, others decrease these odds.
Table 5.1: Relationship between Disciplines and Post-graduation Plansa
Plan to stay in Engineering Plan to leave
Self-
Employment
in Eng.
Practicing
Engineer
Eng.
Mgmt./Sales
Grad Sch./
Academia
Grad
Sch./Gov./
Industry
Non-Eng.
Work
Positive
Relationship GE GE
BE
ChemE
CE CE
EE EE
IE GE
"Other"a "Other"
a
Negative
Relationship
BE BE BE
ChemE
ChemE ChemE ChemE
EE
GE
CE
EE
"Other"b
a These disciplines are compared to Mechanical Engineering.
b ―Other‖ engineering disciplines (not Bio, Chemical, Civil, Electrical, Industrial, and General Engineering)
98
Engineering students‘ post-graduation plans vary by engineering sub-disciplines,
however, depending on the purposes of graduate school attendance – either to prepare for
academic or professional positions. Compared to Mechanical Engineering (ME) students, for
example, students majoring in Bio-medical and Bio-engineering (BE) and Chemical Engineering
(ChemE) were less likely to plan to be a) self-employed in engineering, b) practicing engineers,
and c) working in management or sales in engineering three years after graduation. This finding
may not surprise engineers since bioengineering careers typically require advanced study in a
graduate field, but the from this study also indicated that BE and ChemE majors were more
likely to plan to enter engineering graduate school to prepare themselves for faculty positions.
In addition, this study found that, compared to ME students, students majoring in Civil
Engineering (CE) and Electronic Engineering (EE) were less likely to plan for careers as
managers or in sales in engineering industries. On the other hand, they were more likely to plan
to pursue graduate school to prepare for the engineering profession. In addition, students in
General Engineering, compared to ME, reported that they were more likely to leave engineering.
This finding may result from students‘ self-selection into general engineering programs. Some
of these programs (including some in this study sample) seek to provide students with a broad,
multidisciplinary engineering education. In these programs, curricula promote multidisciplinary
problem solving and the development of broad perspectives on engineering problems. This skill
may attract the attention of employers beyond engineering and encourage students to consider
alternative careers. Some general engineering programs are designed to accommodate students
who become unsure of their interests in engineering careers during their undergraduate programs
-- but who nonetheless wish to complete their undergraduate engineering degree. Engineering
programs and industry should recognize that they compete for engineering graduates with other
99
business sectors and ensure that students are provided with many opportunities to compare
employment options and to understand the benefits of an engineering career.
Sophomores vs. Seniors
This study found that engineering seniors were more likely to report that they plan not to
enter engineering careers than sophomores. The result is consistent to research by Sheppard et al.
(2010), which suggests that nearly two-thirds of seniors consider a combination of engineering
and non-engineering options after graduation. Lichtenstein, et al. (2009) suggested that
engineering students at the end of their senior year tend to be unsure whether an engineering or
non-engineering path is the best fit for them. The findings from this study also suggest that
seniors had broadened their career options and considered the available of job markets beyond
engineering.
Despite these consistent results, each study targets different student groups based on class
standing. Sheppard et al. (2010) compared senior and first-year engineering students separately,
while this study investigate seniors‘ post-graduation plans (including fifth or higher year students)
relative to sophomores. This study did not include first-year engineering students due to variation
in institutional polices regarding admission to the engineering major; some programs do not
admit first-year students to a major. Many engineering students take more than four years to
graduate due to the heavy technical course content and highly prescribed sequence of courses
required in engineering programs; others combine undergraduate study with internships and
other engineering-related experiences during college and thus take longer to graduate.
Recognizing these trends, this study included both seniors and 5th
or higher year students
(―super-seniors‖), and may consequently present a more reliable result since super-seniors may
100
have more seriously considered their career options than senior students who will not graduate
for another term or two.
What might explain the finding that seniors have less definite post-graduation plans than
sophomores? This question cannot be answered by this study, but several reasons might be
posited. Senior students might have a clearer sense of the current job market and incentives from
other business sectors. Economic conditions and a lack of job opportunities might persuade
seniors who might like to pursue in engineering career or graduate school to plan non-
engineering career options. Those having high math proficiency and problem-solving skills also
tend to be recruited by other business sectors (Lichtenstein, et al., 2009), which allows them to
consider broader options for their career and graduate school plans. Finally, seniors might
recognize that working in other business sectors with engineering degrees might offer more
incentives and compensations than working as engineers. If engineering graduates can apply
their engineering knowledge and skills in s variety of professions, this might not be a major
concern at a national level. However, if seniors plan not to work in engineering because of the
lack of engineering job opportunities or salary incentives, industry, and the nation, risk losing
qualified technical workers.
Although this study investigated students‘ post-graduate plans by class standing, it is not
a simple matter to interpret the differences in post-graduation plans of seniors and sophomores.
The results might be interpreted two different ways: 1) engineering students change their plans as
they progress in engineering programs or 2) the seniors we studied are simply different than the
sophomores we studied. Because the study used cross-sectional data, I cannot rule out the
possibility that the sophomore and senior students in the study differ in important ways. Despite
the attempt to identify the impact of variations in academic preparation and educational
101
experiences in college, there may be other differences between these student groups that were
not identified in the study; thus we must be careful when interpreting the results of different
trends of post-graduation plans by class standing.
Curricular Experiences
More definite plans to enter engineering career and graduate school were related to 1) a
broad set of curricular emphases, 2) being active in particular clubs and activities, and 3) active
and collaborative learning pedagogies. Of these positive factors, curricular emphases had the
largest influence. Curricular emphases on certain engineering topics and knowledge tend to have
a more powerful influence than classroom instructional practices and co-curricular programs on
engineering students‘ learning outcomes, such as interdisciplinary skills (Knight, 2011; Lattuca
& Knight, 2010), design skills (McKenna, Plumb, Kremer, Yin, & Ro, 2011), and contextual
competence (Palmer, Harper, Terenzini, McKenna, & Merson, 2011). The finding thus supports
the findings of previous studies that found curricular experiences to be the prominent factor in
influencing improved learning outcomes.
In this study, curricular experiences, defined as students‘ perceptions of the extent to
which certain engineering topics are emphasized in their programs curriculum, included four
scales: 1) core-engineering thinking, 2) professional skills, 3) professional values, and 4) broad
and systems perspectives. Table 5.2 summarizes the relationships among these curricular
emphases and students‘ post-graduation plans. The paragraphs that follow are organized by
curricular emphasis area.
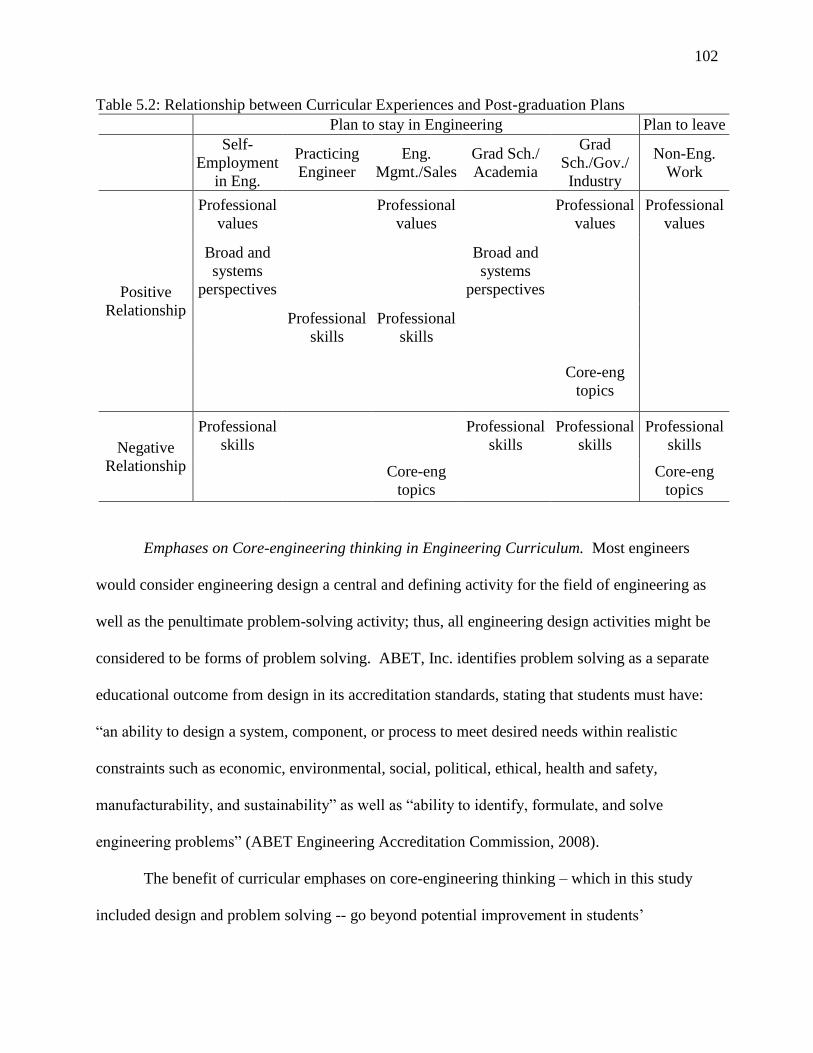
102
Table 5.2: Relationship between Curricular Experiences and Post-graduation Plans
Plan to stay in Engineering Plan to leave
Self-
Employment
in Eng.
Practicing
Engineer
Eng.
Mgmt./Sales
Grad Sch./
Academia
Grad
Sch./Gov./
Industry
Non-Eng.
Work
Positive
Relationship
Professional
values
Professional
values
Professional
values
Professional
values
Broad and
systems
perspectives
Broad and
systems
perspectives
Professional
skills
Professional
skills
Core-eng
topics
Negative
Relationship
Professional
skills
Professional
skills
Professional
skills
Professional
skills
Core-eng
topics
Core-eng
topics
Emphases on Core-engineering thinking in Engineering Curriculum. Most engineers
would consider engineering design a central and defining activity for the field of engineering as
well as the penultimate problem-solving activity; thus, all engineering design activities might be
considered to be forms of problem solving. ABET, Inc. identifies problem solving as a separate
educational outcome from design in its accreditation standards, stating that students must have:
―an ability to design a system, component, or process to meet desired needs within realistic
constraints such as economic, environmental, social, political, ethical, health and safety,
manufacturability, and sustainability‖ as well as ―ability to identify, formulate, and solve
engineering problems‖ (ABET Engineering Accreditation Commission, 2008).
The benefit of curricular emphases on core-engineering thinking – which in this study
included design and problem solving -- go beyond potential improvement in students‘
103
fundamental engineering knowledge and design skills. Using both qualitative and quantitative
methods, researchers found that the design course sequence provided opportunities for multi- or
interdisciplinary learning and collaboration (McKenna, et al., 2011). Since multi- and
interdisciplinary skills, communication, teamwork, and leadership are all considered aspects of
engineering design, design courses have been developed to explicitly embed these as central
activities. A strong curricular emphasis on design and problem-solving skills help engineering
students better understand the core attributes of engineering disciplines and fields (National
Academy of Engineering, 2005). The study suggested that the impacts of students‘ curricular
experiences on core-engineering thinking (i.e., design and problem solving skills, creativity and
innovation) advance their knowledge and skills (McKenna, et al., 2011), which, in turn, might
motivate them to stay in engineering fields.
Emphases on Professional Skills in Engineering Curriculum. Engineering program and
industry have emphasized professional skills as critical competencies of new engineers. For this
reason, the Engineering Change study asked faculty and program chairs to report on changes in
the curricular emphases on professional topics associated with the learning outcomes specified in
the EC2000 accreditation standards (Lattuca, et al., 2006). Program chairs and faculty reported
increases in all of the knowledge and skill topics central to EC2000, with the greatest increases
in emphasis on professional skills such as teamwork, communication, design and the use of
modern engineering tools. Specifically, program chairs reported the greatest changes in
emphasis in communication, teamwork, societal contexts, and ethics, with 75 to 90% of chairs
indicating some or significant increases in emphases on these topics. About 60% of chairs
reported some or a significant increase on contemporary issues. Faculty members, who reported
on a single course that they regularly teach, were most likely to report changes in their emphasis
104
on teamwork (52%), technical writing (39%) and verbal communication (34%). The
Engineering Change study found that changes in curricular emphases were related to changes in
students‘ learning outcomes, albeit indirectly and through their influence on students‘ classroom
experiences.
This study found that curricular emphases on professional skills are related to students‘
future plans to pursue engineering careers. While students who perceived more exposure to
professional skills in their curricula were less likely to plan to enter graduate school for
engineering professions or to pursue non-engineering career plans, but they were more likely to
plan to work as a practicing engineers or in engineering management or sales. Since this study
used a scale that included items such as leadership, teamwork, communication, and management
skills to measure curricular emphasis on professional skills, it is not clear which of these
professional skills have a more significant impact on engineering career plans. Future studies
should examine the impact of particular professional skills on post-graduation plans.
Emphases on Professional Values in Engineering Curriculum. The Engineering Change
study suggested that curricular emphases on professional values have been less successfully
integrated in the undergraduate curriculum than professional skills. Following the study, nearly
a third of the responding program chairs reported some or significant increases in their emphasis
on professional responsibility and ethics in their program curricula. Faculty also reported
moderate changes in their courses on attention to contemporary issues (43%), global and social
contexts in engineering (41%), professional responsibility (37%), and professional ethics (34%).
Compared to the larger increase in course emphases on professional skills, emphases on
professional values did not dramatically change when the new ABET accreditation were
implemented.
105
Attention to diversity and ethical issues in engineering courses might increase students‘
interdisciplinary skills and contextual competence (Knight, 2011; Lattuca & Knight, 2010),
which might subsequently encourage students to consider both engineering and non-engineering
career options. Students who reported more emphasis on professional values in their
engineering programs were more likely to plan be self-employed, to work in management or
sales, or to attend graduate school in engineering three years after graduation. However, these
students also reported that they were more likely to have non-engineering career plans. Thus
students who have more exposure to professional values in their curriculum might consider post-
graduation plans both inside and outside of engineering.
Emphases on Broad and Systems Perspectives in Engineering Curriculum. This study
found that students who took engineering courses emphasizing broad and systems perspectives
were more likely to plan to be self-employed in engineering and enter graduate school to become
a faculty member in engineering. An engineering curriculum designed to help students solve
engineering problems in social contexts increase students‘ interests in engineering disciplines
and promote retention in engineering fields (Atman et al., 2008; Atman, et al., 2010). A growing
body of research literature that explores students‘ contextual understanding and ways to
incorporate contextual competence into the engineering curriculum (e.g., Lattuca, et al., 2006).
Using qualitative and quantitative methods, researchers found that students‘ course experiences
integrating humanities and liberal education encouraged them to consider the contextual aspects
of engineering problems, directly influencing their engineering practice and perspectives
(Lattuca, Trautvetter, Marra, & Knight, 2011). Engineering courses emphasizing connections
among science, technology, and society are particularly useful in broadening students‘
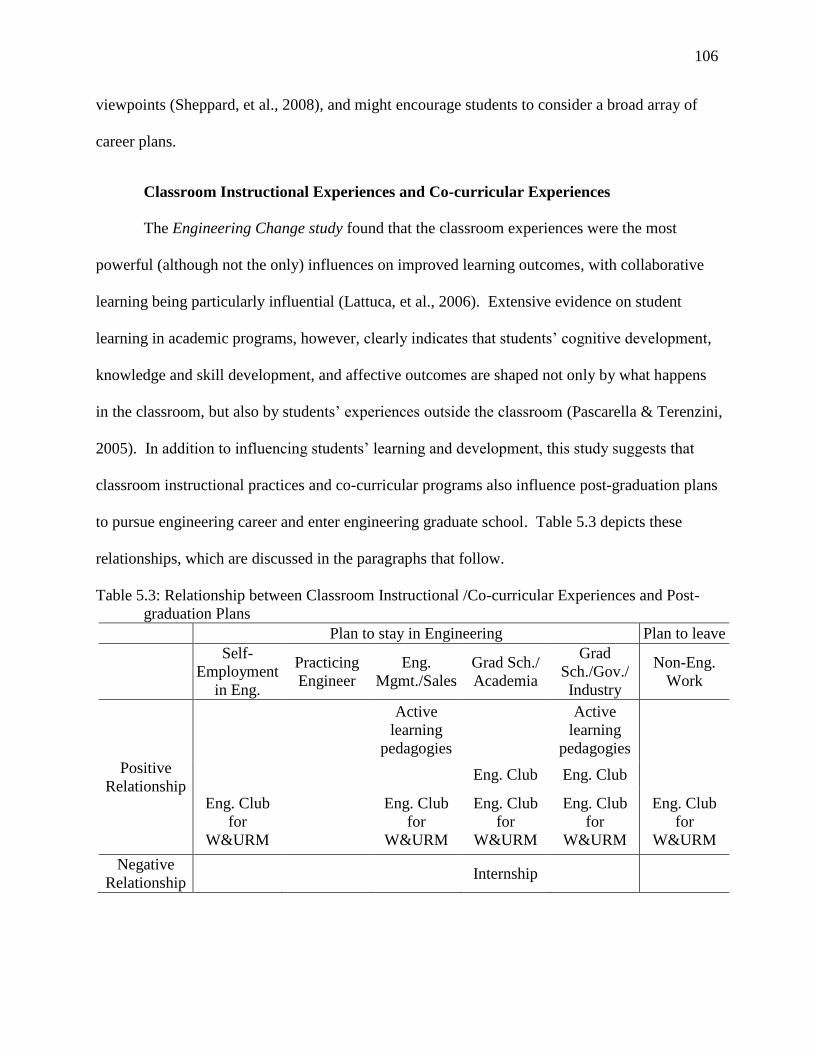
106
viewpoints (Sheppard, et al., 2008), and might encourage students to consider a broad array of
career plans.
Classroom Instructional Experiences and Co-curricular Experiences
The Engineering Change study found that the classroom experiences were the most
powerful (although not the only) influences on improved learning outcomes, with collaborative
learning being particularly influential (Lattuca, et al., 2006). Extensive evidence on student
learning in academic programs, however, clearly indicates that students‘ cognitive development,
knowledge and skill development, and affective outcomes are shaped not only by what happens
in the classroom, but also by students‘ experiences outside the classroom (Pascarella & Terenzini,
2005). In addition to influencing students‘ learning and development, this study suggests that
classroom instructional practices and co-curricular programs also influence post-graduation plans
to pursue engineering career and enter engineering graduate school. Table 5.3 depicts these
relationships, which are discussed in the paragraphs that follow.
Table 5.3: Relationship between Classroom Instructional /Co-curricular Experiences and Post-
graduation Plans
Plan to stay in Engineering Plan to leave
Self-
Employment
in Eng.
Practicing
Engineer
Eng.
Mgmt./Sales
Grad Sch./
Academia
Grad
Sch./Gov./
Industry
Non-Eng.
Work
Positive
Relationship
Active
learning
pedagogies
Active
learning
pedagogies
Eng. Club Eng. Club
Eng. Club
for
W&URM
Eng. Club
for
W&URM
Eng. Club
for
W&URM
Eng. Club
for
W&URM
Eng. Club
for
W&URM
Negative
Relationship Internship
107
Active and Collaborative Learning. This study found that active and collaborative
learning experiences were positively related to the odds of having plans to work in engineering
management or sales as well as graduate school plans to prepare for the engineering profession.
Engineering students might develop an identity as an engineer through collaborative learning
experiences in engineering which, in turn, generates interest in engineering careers and graduate
education. Research indicating that men and women differentially react to how course content is
packaged and presented (Baxter-Magolda, 1989; De Courten-Myers, 1999; Jacobs & Becker,
1997) may also provide insight into the impact of active and collaborative learning on students‘
post-graduation plans. For example, women students tend to prefer engaging classroom with
sufficient interaction and collaboration. On the other hand, male students appear to prefer more
lecture-oriented teaching style (C.M. Kardash & Wallace, 2001). It is worth noting that
engineering courses have historically been taught in this manner (Donald, 2002) and still largely
are arranged in this manner (Lattuca & Stark, 2009), which potentially explain why women
students‘ are less interested in engineering careers and graduate study in engineering. Future
research should explore if these instructional practices specifically influence women students‘
post-graduation plans.
Participation in Internships. Internships are off-campus work experiences that engage
students in solving authentic engineering problems. These real-work experiences (Smollins,
1999) are regarded as powerful influences on students‘ post-graduation plans. Sheppard et al.
(2010) found that students were more likely to plan to pursue engineering careers and graduate
school when they had more engineering-related work experiences through cooperative education
and/or internship programs. Based on their qualitative research, however, Lichtenstein et al.
(2009) argued that students who had unsatisfying internship experiences might extrapolate that
108
experience to all engineering work. If an internship experience fails to fulfill the goal of
providing students with industry experiences in which they apply engineering fundamentals
learned in the classroom into real-work situations (National Commission for Cooperative
Education, 2002), they may encourage students to plan for career outside the field of engineering.
Analysis of the date used in this study suggests that students‘ participation in engineering
internship has no significant impact on their engineering career plans. Internships, however,
decreased the likelihood of students‘ reports that in three years they would be preparing for
faculty positions in engineering by attending a graduate program in the field.
Being Active in Engineering Clubs. Being active in engineering clubs and professional
organizations for women (e.g., WISE, SWE) and for underrepresented minority students (e.g.
NSBE, SHPE) had a positive influence on students‘ engineering career plans. Active
participation in clubs increased the likelihood of all students reporting that they planned to attend
engineering graduate school for either academic or professional job preparation. Participation in
organizations specifically designed for women and URM students also positively influenced
students‘ plans to be self-employed in engineering, to work in engineering management or sales,
and graduate school plans as well. Being active in engineering clubs for women and URM,
however, appears to influence both engineering and non-engineering career options. The student
organizations or clubs for women and URM students provide a support network for those
students. Research suggests that such organizations have a positive influence on the retention of
women students – even those students who don‘t actively participate – in engineering and
science (Brainard & Carlin, 1997). Taking on leadership roles through organizations, such as the
National Society of Black Engineers and the Society of Hispanic Professional Engineers, might
create opportunities for students‘ personal growth and awareness of diversity issues. While peer
109
interaction and leadership roles appear to promote interest in engineering career interests among
women and underrepresented minority students, such organizations may also raise awareness of
diversity issues, which could discourage students who perceive that there is a chilly climate in
the field. Thus, simply offering co-curricular opportunities may not be enough to promote
persistence in engineering fields. Faculty members and staff should also interact with and
support these students through the co-curricular activities (Seymour & Hewitt, 1997).
In addition, it is important to note that students might be pressed to find time for such
activities because of heavy course loads and demanding coursework. Time constraints and other
obligations may prevent some engineering students from engaging in co-curricular activities
(Pascarella & Terenzini, 2005). Given the positive impact of participation in engineering clubs
for women and URM students, engineering departments might consider how to deliberately
structure co-curricular opportunities to meet the range of student needs and interests.
Students’ Self-assessments of Engineering Knowledge and Skills
Although most of variances in students‘ post-graduation plans were explained by the
student experience variables used in this study, students‘ self-assessment of their engineering
knowledge and skills also had a significant influence on students‘ plans inside or outside of
engineering. These findings are generally consistent with theories of vocational choice which
posit that individuals gravitate toward careers consistent with their vocational aspirations,
interests, competencies, and self-perceptions (Holland, 1997). For example, engineering
students who are most confident of their fundamental skills are more likely to pursue engineering
graduate school to prepare for either faculty jobs or industry. Such students may recognize that
these abilities will help succeed in graduate work. In addition to fundamental skills, design skills
and contextual competence also positively influenced students‘ post-graduation plans in
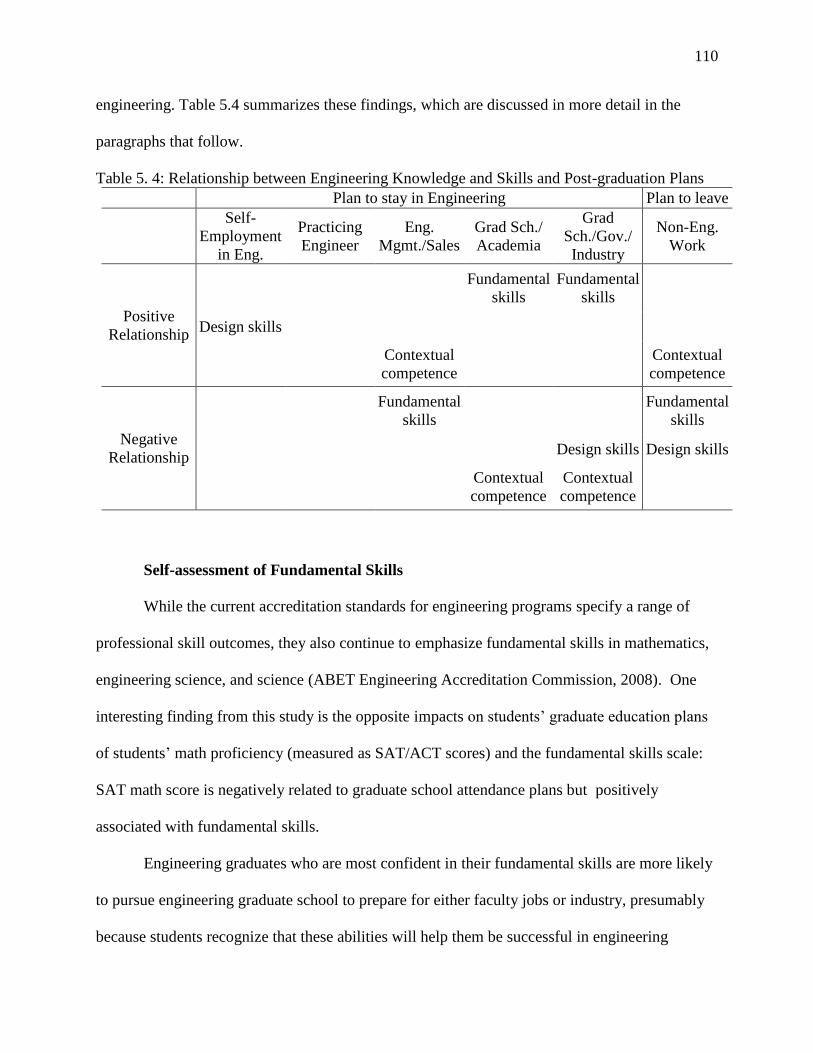
110
engineering. Table 5.4 summarizes these findings, which are discussed in more detail in the
paragraphs that follow.
Table 5. 4: Relationship between Engineering Knowledge and Skills and Post-graduation Plans
Plan to stay in Engineering Plan to leave
Self-
Employment
in Eng.
Practicing
Engineer
Eng.
Mgmt./Sales
Grad Sch./
Academia
Grad
Sch./Gov./
Industry
Non-Eng.
Work
Positive
Relationship
Fundamental
skills
Fundamental
skills
Design skills
Contextual
competence
Contextual
competence
Negative
Relationship
Fundamental
skills
Fundamental
skills
Design skills Design skills
Contextual
competence
Contextual
competence
Self-assessment of Fundamental Skills
While the current accreditation standards for engineering programs specify a range of
professional skill outcomes, they also continue to emphasize fundamental skills in mathematics,
engineering science, and science (ABET Engineering Accreditation Commission, 2008). One
interesting finding from this study is the opposite impacts on students‘ graduate education plans
of students‘ math proficiency (measured as SAT/ACT scores) and the fundamental skills scale:
SAT math score is negatively related to graduate school attendance plans but positively
associated with fundamental skills.
Engineering graduates who are most confident in their fundamental skills are more likely
to pursue engineering graduate school to prepare for either faculty jobs or industry, presumably
because students recognize that these abilities will help them be successful in engineering
111
graduate school. Students who rated themselves higher in terms of fundamental skills also
reported that they did not plan to work outside of engineering three years after graduation. This
interpretation is also supported by a previous finding that seniors‘ confidence levels in their
fundamental skills do not influence their plans to attend graduate school outside engineering (Ro,
2011). Fundamental skills appear to remain an important factor in retaining students in
engineering professions and graduate school.
Self-assessment of Design Skills
In addition to fundamental skills, design skills promote students‘ post-graduation plans in
engineering. Design and problem solving skills are critical to an engineer‘s training (Jonassen,
2007). The current accreditation criteria also include design and problem solving skills as
required learning outcomes. Since problem solving and design processes taught in engineering
programs often emphasize leadership, communication, and teamwork skills, as well as
interdisciplinary and contextual competence (McKenna, et al., 2011), industry and engineering
graduate programs should focus recruitment and retention efforts on engineering graduates who
are confident in their design and problem-solving skills.
Qualitative data from a study by Lichtenstein, et al. (2009) suggested that students who
believed they had superior problem-solving skills perceived they were more marketable, and thus
would have a broader array of career options after graduation. In contrast, this study suggests
that students who are most confident in their design skills are more likely to plan to work in
engineering. These students, however, reported that they were less likely plan to enter graduate
school to prepare for engineering professions. Of course, it is possible that students with high
confidence in their design skills might plan to pursue graduate school after spending some time
in the workforce.
112
Self-assessment of Contextual Competence
Engineering educators and practitioners have increasingly come to embrace the principle
that design engineering solutions should consider the contexts in which they are implemented.
This emphasis on the contextual dimension of engineering practice is evidenced in several of the
ABET accreditation Criterion 3 outcomes: (c) an ability to design a system, component, or
process to meet desired needs within realistic constraints such as economic, environmental,
social, political, ethical, health and safety, manufacturability, and sustainability; (f) an
understanding of professional and ethical responsibility; (h) the broad education necessary to
understand the impact of engineering solutions in a global, economic, environmental, and
societal context; and (j) a knowledge of contemporary issues (ABET Engineering Accreditation
Commission, 2008). Similarly, the National Academy of Engineering argues that the ―engineer
of 2020‖ must not only be technically capable, but also understand the contextual requirements
and social consequences of their work (National Academy of Engineering & National Research
Council, 2005).
Despite this increased national attention on contextual competence for engineers,
engineering students were generally lacking in key aspects of this skill. The Engineering
Change study found that the average engineering senior surveyed in 2004 reported that he or she
had ―more than adequate‖ communication and group skills (defined as interpersonal and
teamwork skills), but was less confident of his or her ability to understand societal and global
contexts. Three quarters of the 1,622 employers responding to the study surveys similarly
reported that new bachelors‘ degree hires were adequately to well-prepared in communication
and teamwork. Only half, however, said the same about new hires‘ understanding of the societal
contexts and constraints; almost 50% of employers considered new hires to be inadequately
113
prepared in this area (Lattuca, et al., 2006). Although the Engineering Change study found that a
lack of confidence in one‘s understanding the societal contexts among new engineering
graduates, few studies have explored the influence of students‘ perceived competence levels on
their post-graduation plans in or outside of engineering.
The current study found that students were more likely to stay in engineering fields
(pursuing management or sales in engineering) when they self-rated their contextual competence
as high. These students may enjoy interacting with others to determine client‘s needs and desires,
with the ability to understand contexts and societal consequences being critical to success in
these areas. Students reporting higher contextual competence were also more likely to work
outside of engineering, and this result is consistent to research on college seniors applying to
graduate school, which found that those planning to leave engineering and science were more
likely to value making a contribution to society than were the students planning to continue in
these fields (Grandy, 1992). Engineering educators should consider not only how to increase
engineering students‘ contextual competence but also how to encourage students with higher
levels of contextual competence to stay in the engineering upon graduation.
Based on the findings and discussion of this study, the next section includes implications
for federal-level polices, engineering undergraduate- and course-level practices, and theory
building through future research.
Implications
President Barack Obama‘s recent call to arms in his 2011 State of the Union Address
joins a series of policy documents demanding increased federal investment in science,
technology, engineering, and mathematics (STEM). To remain as a global leader, sustain
114
national security, and develop economic competitiveness, these reports emphasize producing
graduates who can enter the nation‘s STEM workforce (National Academies Committee on
Science Engineering and Public Policy, 2006; U.S. Department of Education, 2006; U.S.
Government Accountability Office, 2006). Government-led initiatives seek to ensure a high
quality STEM pipeline by fostering student interests in science and technology.
Recent research, however, indicates that it is not enough to simply encourage college
students to major in engineering; Lichtenstein et al. (2009) have shown that majoring in this field
does not necessarily lead to a career in engineering. Sheppard et al. (2010) suggest that students
may plan to major in the field while at the same time planning a non-engineering career path. Is
this a cause for concern? Perhaps not. Engineering degrees are increasingly regarded as a
flexible platform for a variety of careers, and a singular career trajectory may be less and less
uncommon, particularly for younger generations, given current professional and economic
realities (Sheppard, et al., 2010). While this flexibility may benefit individuals, it might however
be a matter of concern for engineering as a profession, for industries and employers who need
knowledgeable and skilled engineers, and ultimately to the United States, which relies on a
skilled workforce to maintain its economic competitiveness and quality of life.
The future prosperity of U.S. society in an accelerating global economy depends upon a
competitive, technically expert, college-educated workforce. Therefore, supporting an
educational system that produces a large number of highly qualified scientists and engineers is a
continuing national priority. The nation has increasingly and heavily relied on imports of well-
educated graduates from other countries to compensate for the loss of advanced degree-holders
to fill jobs in science and engineering. In addition, even students obtaining engineering
bachelor‘s degrees appear to consider post-graduation plans outside of engineering – which will
115
further diminish the numbers of highly-qualified domestic human resources in engineering fields.
Finally, the recruitment of women and underrepresented minorities into the field remains a
challenge. One potential bright note in this scenario: STEM-educated citizens, whether they
work in engineering or not, are likely to be better prepared to consider the kinds of issues
currently faced by governments and local communities worldwide: renewable energy sources
and sustainable water and food systems, eradicating disease and improving health, disposal of
hazardous wastes, and so on.
Implications for Policy
Most policies focused on the engineering pipeline are motivated by a desire to increase
the quality and diversity of the engineering workforce. They have responded to a pressing
concern over ―leaks‖ in the pipeline between K-12 and higher education, but have rarely
addressed pipeline between undergraduate education and workforce in engineering (Lowell, et
al., 2009). This study explored potential educational influences on engineering students‘ post-
graduation plans and examined how students‘ pre-college characteristics, academic program
experiences, self-assessment of knowledge domain knowledge and skills influenced their post-
graduation plans in or outside of engineering. The findings suggest implications for government
agencies, such as National Science Foundation (NSF) and the National Academy of Engineering
(NAE).
Both engineering graduate schools and industry have been requesting a diverse workforce
to meet the needs of a diverse population (Ehrenberg, et al., 2009). However, this study suggests
that women students are two times less likely than men to plan to enter engineering career and
graduate school path. Women students may decide to leave the field due to misconceptions
about engineering profession. For example, many students, especially women and minorities,
116
perceive engineering as a field that is more concerned with economic growth and national
defense, rather than with other matters that are important to communities, such as improving
health and environment, changing the quality of individual lives, and contributing to the
betterment of society (Atman, et al., 2010). Incorporating curricular and co-curricular
experiences that have global and social relevance into engineering projects and assignments may
attract and retain a more diverse student body and help all students develop a more accurate
perception on the range of engineering occupations and settings (Atman, et al., 2010). Thus, NSF
should consider granting programs to support the development of humanitarian engineering
programs and social entrepreneurship courses that make these kinds of engineering problems and
occupations visible to students. Such programs, by connecting students to problems they care
about and providing them with options to serve others, may encourage them to stay in
engineering fields.
NSF also needs to fund more research regarding on URM students‘ post-graduation plans
and outcomes. This study found there was little difference between URM and White students in
terms of their post-graduation plans. However, that might be because this study did not examine
the race/ethnicity groups separately. Lord et al. (2009) showed variations within ethnic groups
in persistence in engineering programs. Since the numbers of students in each minority
race/ethnicity group in our data set is small (as Lord et al. note is the case in most engineering
data sets), disaggregating underrepresented students was not possible. Thus, research to develop
and analyze large-scale and nationally representative data sets on engineering graduates should
be funded to be conducted to examine students‘ post-graduation plans and outcomes for specific
group comparison.
117
Although math proficiency is thought to be particularly important to success in
engineering programs, findings from this study show that students with greater math proficiency
are less likely to plan to pursue an engineering career and advanced study in the field. What
might explain this loss of highly-qualified (in terms of mathematics) students from the
engineering pipeline? This question cannot be answered by these data, but this analysis is
consistent with other studies indicated that many students who leave engineering (upon their
graduation) do not do so because of lack of academic preparation or success (Lowell, et al.,
2009). Funding of large-scale studies such as the ones suggested above could permit researchers
to examine this question.
The federal government should also examine whether targeting financial aid to students
who study in STEM majors contribute the economic development and human welfare in the
nation by increasing engineers and scientists. Scholarship programs like the federal SMART
Grant support (and invest in) STEM-major students during the latter years of their undergraduate
education (U.S. Department of Education Office of Postsecondary Education, 2010). These
types of programs contribute to efforts to increase the supply side of the STEM pipeline by
recruiting and retaining low-income, underrepresented minorities, and women students in higher
education system (Etzkowitz, Kemelgor, Neuschatz, & Uzzi, 1994). It is not clear, however, if
these programs actually increase the numbers of highly-qualified and diversified graduates in the
STEM workforce. Rigorous assessment of the outcomes of this grant program, including post-
graduation outcomes is needed.
Implications for Practice
Linking an array of academic program experiences to post-graduation plans, this study
has broad implications for institutions and engineering programs seeking to promote engineering
118
students‘ interests and intentions beyond graduation. This study found that seniors consider
broader career options including both engineering and non-engineering fields than sophomores.
Engineering program chairs should consider the following questions: Do engineering programs
produce students who regard engineering as just one option of their career paths; or do
engineering programs intend to produce well-prepared ―engineers‖? This study suggests that
the engineering programs should provide a diversity of curricula, classroom instructional, and
co-curricular experiences that contribute to students‘ learning and satisfaction, and thus
encourage them to remain in the engineering workforce pathway.
Findings from this study also demonstrate that students‘ experiences in programs that
emphasize on professional skills, core engineering thinking, and broad and systems perspectives
positively influence their plans for engineering careers and graduate school. The findings also
suggest that active and collaborative learning experiences, as well as participation in student
organization for women and URM students have a positive effect on students‘ post-graduation
plans in engineering. Engineering programs could capitalize on this connection by creating
linkages between the curriculum and the co-curriculum, to strengthen students‘ engineering
domain learning and to build a clearer understanding of engineering as a profession. In this
section, I suggest that both program-level implications for administrators and staff in engineering
programs and course-level implications to faculty members for their courses.
Developing and Teaching the Values of the Profession. This study found that students
with higher contextual competence and students in the program with greater emphases on
professional values (i.e., diversity and ethics) consider both engineering and non-engineering
professions. Those students might be able to apply their experiences or abilities in a broad array
of professions. As described earlier, this is not a problem for these individuals. However, it
119
comes to be a matter for the engineering community which might face a lack of engineers who
understand the social impact of their work and take ethical responsibility for their jobs.
Engineering programs and faculty members should therefore recognize the importance of
the code of ethics for professional engineers (Engineers‘ Council for Professional Development,
1978) and incorporate these into their curricula. Sheppard et al. (2008) argue that these codes
should include a set of central values: understanding the public purposes of engineering, its
contribution to human welfare, and its meaning in the context of contemporary society. These
values which are also aligned to The National Academy‘s The Engineer of 2020 (2004) and
Educating the Engineer of 2020 (2006). Although this study suggests that those curricular
emphases influence both engineering and non-engineering career plans, women and URM
students, who initially see engineering as a technical field, might learn that engineering
professions are innovative and require them to have more social responsibility, and then they
might be more interested in pursuing an engineering career path.
More Active and Collaborative Learning Pedagogy. The pedagogical methods – large
lecture courses, rigidly defined problem assignments, highly structured laboratory courses-- have
commonly used in engineering and science courses (Duderstadt, 2008). Courses that rely on
pedagogies such as lectures have been shown to suppress persistence of women in STEM
(Dickie, Dedic, Rosenfield, Rosenfield, & Simon, 2006). In contrast, a diversity of active
learning pedagogies in engineering programs encourages both women and men students to be
more engaged in engineering context and increase their learning outcomes (D. W. Johnson &
Johnson, 1983; Prince, 2004). This study also found that active learning pedagogies enhance not
only engineering students‘ learning and development, but also their post-graduation plans in
engineering. Faculty members should develop more active and collaborative learning methods
120
to promote student participation and engagement in the classroom, thus motivating students to
join the engineering community. Like many college and university faculty, engineering faculty
often use lectures easily because they did not have opportunities to learn alternative teaching
methods. Engineering programs or institutions should not only offer services to assist
engineering faculty members in learning new instructional methods, but provide incentives for
such professional development activities in order to encourage faculty to employ active
instructional practices.
Diversify Co-curricular Activity. This study found that engineering students who more
actively engaged in engineering organization for women and URM students were more likely to
plan to pursue careers in engineering. An unpublished analysis of the data from the P2P study
found that underrepresented minority students reported participating in community service at
significantly higher rates than did non-URMs, and URMs reported spending significantly more
time engaged in humanitarian engineering programs than did White students (Lattuca, et al.,
2006). These co-curricular activities can assist the underrepresented student groups to stay in the
engineering pipeline. Engineering students are often encouraged to pursue internships as a way
of learning about engineering careers and promoting interest in the field. The findings from this
study, however, suggest that engineering programs should encourage students to participate in
diverse co-curricular programs. Engineering industries also should recognize the value of
students‘ co-curricular experiences related not only profession skills but for building students‘
understanding of the social and global contexts and issues that are part of the work of today‘s
engineer.
Strengthen Students’ Confidence in Engineering Domain Knowledge. In addition to
students‘ academic program experiences, their self-confidence in their engineering knowledge
121
and skills influences their post-graduation plans. Students‘ abilities to apply to mathematics and
science in engineering problems (defined as fundamental skills in this study) have a positive
influence on their graduate school plans in engineering. This findings is consistent with that of
another study which found that students‘ graduate school plans in fields other than engineering is
negatively associated with their fundamental skills (Ro, 2011). It seems that these fundamental
skills play a critical role in keeping engineering students in engineering fields. Fundamental
knowledge and skills are often taught in lecture courses with high student enrollments and little
active learning. These conditions may depress students‘ interests in the field in engineering.
Employing more active and student-centered learning pedagogies in these courses may build
students‘ confidence in their knowledge and technical skills. Engineering curricula should also
integrate technical and contextual issues by stressing problem-solving in real-world contexts to
attract engineering students, especially women.
Students‘ fundamental skills, however, is not the only one, which encourage them to stay
in engineering fields. Students‘ design skills also positively influence their post-graduation plans
in engineering. Since design skills have been emphasized in engineering industry, students‘
design skills will allow engineering students to build identities as engineers. Engineering
programs should link curricular and co-curricular programs interconnecting innovation,
creativity, interdisciplinary, and professional skills with design. As suggested above, integrating
technical and professional content in engineering programs by requiring students to work on
multidisciplinary teams that solve real problems with societal consequences will serve all
engineering students, not simply women and underrepresented minorities, by providing a clearer
view of engineering practice.
122
Implications for Future Research and Theory Building
This study modified Terenzini and Reason‘s conceptual model (Terenzini & Reason,
2005) to explore students‘ post-graduation plans more precisely. Terenzini and Reason‘s model,
like other studies based on Astin‘s I-E-O model (1977; 1985), focuses researchers‘ attention on
undergraduate outcomes such as persistence, time to graduate, or learning outcomes. This study
found that students‘ college experiences and confidence developed through their college
experiences also shapes their learning and thus their thinking about their career choices.
Although this study did not explore engineering students‘ actual career pathways, the findings
suggest that students‘ college experiences and confidence in engineering knowledge and skills
affect their plans for both careers and graduate study. Terenzini and Reason‘s model therefore
appears be a good conceptual framework for studies that explore how college influences
student‘s post-graduation outcomes.
To examine engineering the trajectories of students‘ post-graduation plans, this study
proposed that Terenzini and Reason‘s model should contain components for academic discipline
environment and broad context beyond institutional setting. Students‘ educational experiences
and learning might, I suggested, be influenced by their academic disciplines in addition to their
institutional context. Even within a college of engineering, engineering programs have different
attributes associated with the characteristics of their disciplines. Engineering faculty members in
different engineering disciplines, for example, have different views about how to adjust
curricular and instructional strategies (Lattuca, et al., 2006). Terenzini and Reason‘s conceptual
model should therefore include the disciplinary environment within the organizational context.
Disciplinary variations in faculty values, customs, and dispositions toward engineering might
influence variation in students‘ post-graduation plans in engineering by disciplines.
123
Students‘ learning is situated in not only institutional context, but in socio-historical
context. Students‘ career plans are thus influenced by economic and other prevalent social and
cultural conditions. As this study suggests that seniors consider broader career options than
sophomores because they might be more recognizable to market situation, which must shape
their career pathways. Terenzini and Reason‘s model should be modified to include this broader
socio-historical context.
This study also suggests implications for future research in engineering education field.
Research on pathways from higher education to engineering workforce is relatively new in the
engineering education and research field. Further research should explore if engineering
students‘ post-graduation plans in or outside of engineering are correlated to their actual career
and graduate school choice. Longitudinal data should be collected for this purpose. Further,
engineering graduates‘ career pathways might not be completed within three years upon their
graduation in college. Graduates might choose to leave the fields after five or ten years;
although probably less likely due to the need to keep technically current, graduates may return to
engineering after a brief hiatus. Thus, the long trajectory of engineering graduates‘ career
pathways should be examined in the future.
The picture of students‘ post-graduation plans may be more detailed than was examined
by the P2P study. First, students‘ post-graduation plans are not independent: students appear to
consider career options as an engineer even as they remain open to non-engineering positions
and fields. Second, the dependent variables that measure graduate school plans in engineering
might not be an indicator of overall post-graduation plans in engineering. Some engineering
students might choose engineering graduate school and then move to non-engineering
professional sectors. Third, although this study employed three outcome variables that measure
124
engineering career plans (self-employment in engineering, work as a practicing engineer, and
work in engineering management or sales), there could exist more categories of engineering jobs
than just those. In other words, any simple survey measure might not reflect the complex pattern
of engineering students‘ post-graduation plans. When researchers develop survey questionnaires
to assess engineering students‘ career plans in or outside of engineering, they should recognize
that students do not consider a sole career option and should therefore find appropriate ways to
capture these trajectories.
Also needed is further study on the attributes of engineering sub-disciplines that
influence students‘ post-graduation plans. This study revealed disciplinary differences in
students‘ post-graduation plans, but could not explore why the differences were caused. For
example, findings suggest that students in general engineering programs are more likely to
consider non-engineering career options than those in mechanical engineering programs. In
terms of engineering career plans for self-employment, however, students in general engineering
program are more likely to pursue engineering career plans than those in mechanical engineering.
This study assumes that this result might be related to the interdisciplinary nature of general
engineering curriculum. But it is also possible that mechanical engineers are simply more
qualified to begin their own engineering firms. More research focused on influences on career
paths in engineering sub-disciplines is needed to understand disciplinary patterns and to make
comparisons among fields.
125
References
ABET. (1997). Engineering criteria 2000. Baltimore, MD: Author.
ABET Engineering Accreditation Commission. (2008). Criteria for Accrediting Engineering
Programs: Effective for Evaluations during the 2009-2010 Accreditation Cycle Retrieved
December 21, 2010, from http://www.abet.org/Linked%20Documents-
UPDATE/Criteria%20and%20PP/E001%2009-10%20EAC%20Criteria%2012-01-08.pdf
Adelman, C. (1998). Women and men of the engineering path: A model for analysis of
undergraduate careers. (PLLI-98-9055). Retrieved from www.erc-
assoc.org/nsf/engrg_paths.
Adelman, C. (1999). Answers in the Toolbox: Academic Intensity, Attendance Patterns and
Bachelor's Degree Attainment. U.S. Department of Education.
Alexander, L., Besterfield-Sacre, M., Matherly, C., & Shuman, L. J. (2008, June 22-25).
Internationalizing our engineers: Short-term experiential programs abroad for
engineering students. Paper presented at the 2008 American Society for Engineering
Education Annual Conference, Pittsburgh, PA.
Anaya, G. (1999). College impact on student learning: Comparing the use of self-reported gains,
standardized test scores, and college grades. Research in Higher Education, 40, 499-526.
Antony, J. S. (1998). Personality-career fit and freshman medical career aspirations: A test of
Holland's theory. Research in Higher Education, 39(6), 679.
Armor, D. J. (1974). Theta reliability and factor scaling. San Francisco: Jossey-Bass.
Astin, A. W. (1977). Four Critical Years. San Francisco: Jossey-Bass.
Astin, A. W. (1985). Achieving educational excellence: A critical assessment of priorities and
practices in higher education. San Francisco: Jossey-Bass.
Astin, A. W. (1993). What Matters in College? Four Critical Years Revisited. San Francisco, CA:
Jossey-Bass.
Astin, A. W., & Astin, H. S. (1992). Undergraduate science education: The impact of different
college environments on the educational pipeline in the sciences. Los Angeles: University
of California, Graduate School of Education, Higher Education Research Institution.
Atman, C. J., Sheppard, S., Fleming, L., Miller, R., Smith, K., Stevens, R. (2008, June 22-25).
Moving from pipeline thinking to understanding pathways: Finding from the academic
pathways study of engineering undergraduates. Paper presented at the 2008 American
Society for Engineering Education Annual Conference, Pittsburgh, PA.
Atman, C. J., Sheppard, S. D., Turns, J., Adams, R. S., Fleming, L. N., Stevens, R. (2010).
Enabling engineering student success: The final report for the Center for the
Advancement of Engineering Education. Center for the Advancement of Engineering
Education.
Bailey, R., & Szabo, Z. (2007). Assessing engineering design process knowledge. The
International journal of engineering education, 22(3), 508.
Bandura, A. (1977). Social learning theory. Englewood Cliffs, N.J.: Prentice Hall.
Bandura, A. (1986). Social foundations of thought and action: A social cognitive theory.
Prentice-Englewood Cliffs, NJ: Hall.
Bandura, A. (1997). Self-efficacy : the exercise of control. New York: W.H. Freeman.
Bandura, A. (2001). Self-efficacy beliefs as shapers of children's aspirations and career
trajectories. Child Development, 72(1), 187.
126
Barroso, L. R., & Morgan, J. R. (2009). Project Enhanced Learning: Addressing ABET
Outcomes and Linking the Curriculum. [Article]. Journal of Professional Issues in
Engineering Education and Practice, 135(1), 11-20. doi: 10.1061/(asce)1052-
3928(2009)135:1(11)
Baxter-Magolda, M. B. (1989). Gender differences in cognitive development: An analysis of
cognitive complexity and learning styles. Journal of College Student Development, 30(3),
213-220.
Berger, J., & Milem, J. (2000). Organizational behavior in higher education and student
outcomes. In J. C. Smart (Ed.), Higher Education: Handbook of Theory and Research (Vol. XV,
pp. 268-338). New York: Agathon.
Bettez, D. J. (2004). Assessing engineering students' study abroad experiences. Paper presented
at the American Society for Engineering Education Annual Conference & Exposition,
Salt Lake City, UT.
Bowman, N. A. (2010). Can 1st-Year college students accurately report their learning and
development? American Educational Research Journal, 47(2), 466-496. doi:
10.3102/0002831209353595
Brainard, S. G., & Carlin, L. (1997). A longitudinal study of undergraduate women in
engineering & science. Paper presented at the Frontiers in Education Conference,
Pittsburgh, PA.
Brantlinger, E. (2003). Dividing classes: How the middle class negotiates and rationalizes
school advantage. New York: Routledge Falmer.
Brickhouse, N. W. (2001). Embodying science: A feminist perspective on learning. Journal of
Research in Science Teaching, 38, 282-295.
Brotman, J. S., & Moore, F. M. (2008). Girls and science: a review of four themes in the science
education literature. Journal of Research in Science Teaching, 45(9), 971-1002.
Brown, S. D., Lent, R. W., & Gore, P. A., Jr. (2000). Self-Rated Abilities and Self-Efficacy
Beliefs: Are They Empirically Distinct? Journal of Career Assessment, 8(3), 223-235.
doi: 10.1177/106907270000800302
Bullen, F., & Knight, D. (2006). The broad and strategic value of the freshmen engineering
experience - FEE. [Article]. International Journal of Engineering Education, 22(6),
1241-1251.
Cabrera, A. F., & La Nasa, S. M. (2000). Understanding the College-Choice Process. New
Directions for Institutional Research, 2000(107), 5-22. doi: 10.1002/ir.10701
Campbell, P. B., Jolly, E., Hoey, L., & Perlman, L. K. (2002). Upping the numbers: Using
research based decision making to increase diversity in the quantitative disciplines. GE
Foundation Report.
Carter, D. F. (1999). The impact of institutional choice and environments on African-American
and White students' degree expectations. Research in Higher Education, 40(1), 17.
Catsambis, S. (1995). Gender, race, ethnicity, and science education in the middle grades.
Journal of Research in Science Teaching, 32, 243–257.
Chen, X., & Weko, T. (2009). Students Who Study Science, Technology, Engineering, and
Mathematics (STEM) in Postsecondary Education: U.S. Department of Education NCES
2009-161.
Cheslock, J. J., & Rios-Aguilar, C. (2011). Multilevel analysis in higher education research: A
multidisciplinary approach. In J. Smart (Ed.), Higher education: Handbook of theory and
research (Vol. 26, pp. 85-123). New York: Agathon Press.
127
Christensen, A., Nott, W., Edwards, D., Yoder, L., Ho, C., Flanagan, S. (2008, June 22-25).
Service learning oriented pre-engineering programs and their impact on non-traditional
engineering students. Paper presented at the 2008 American Society for Engineering
Education Annual Conference, Pittsburgh, PA.
Christie, B. (2008, June 22-25). Results of seven year community outreach program to improve
the pipeline of underrepresented minorities studying science, engineering or mathematics
at college level. Paper presented at the 2008 American Society for Engineering Education
Annual Conference, Pittsburgh, PA.
Clewell, B. C., & Campbell, P. B. (2002). Taking stock: where we‘ve been, where we are, where
we‘re going. Journal of Women and Minorities in Science and Engineering, 8, 255-284.
Concannon, J. P. (2009). A cross-sectional study of engineering students' self-efficacy by gender,
ethnicity, year, and transfer status. Journal of Science Education and Technology, 18(2),
163.
Correll, S. J. (2004). Constraints into preferences: Gender, status, and emerging career
aspirations. American Sociological Review, 69(1), 93.
Cruce, T. M., Wolniak, G. C., Seifert, T. A., & Pascarella, E. T. (2006). Impacts of good
practices on cognitive development, learning orientations, and graduate degree plans
during the first year of college. Journal of College Student Development, 47(4), 365-383.
De Courten-Myers, G. M. (1999). The human cerebral cortex: gender differences in structure and
function. Journal of Neuropathology and Experimental Neurology, 58(3), 217-226.
Dempster, A. P., Laird, N. M., & Rubin, D. B. (1977). Maximum likelihood from incomplete
data via the EM algorithm. Journal of the Royal Statistical Society. Series A. General,
39(1).
DesJardins, S. L. (2001). A comment on interpreting odds-ratios when logistic regression
coefficients are negative AIR Professional File: The Association for Institutional
Research.
Devon, R., Engel, R., & Turner, G. (1998). The effects of spatial visualization skill training on
gender and retention in engineering. Journal of Women and Minorities in Science and
Engineering, 4, 371-380.
Dickie, L. O., Dedic, H., Rosenfield, S., Rosenfield, E., & Simon, R. A. (2006). Success and
persistence in science: the influence of classroom climate. Arxiv preprint
physics/0610243.
Dix, L. S., & National Research Council. (1987). Minorities : their underrepresentation and
career differentials in science and engineering : proceedings of a workshop. Washington,
D.C.: National Academy Press.
Donald, J. G. (2002). Learning to think: Disciplinary perspectives: Jossey-Bass Inc Pub.
Donaldson, K., Lichtenstien, G., & Sheppard, S. (2008, June 22- 25). Socioeconomic status and
the undergraduate engineering experience: Preliminary findings from four American
universities. Paper presented at the 2008 American Society for Engineering Education
Annual Conference, Pittsburgh, PA.
Duderstadt, J. J. (2008). Engineering for a changing world: A roadmap to the future of
engineering practice, research, and education The Millennium Project. Ann Arbor, MI:
The University of Michigan.
Dukstein, R. D., & O'Brien, K. M. (1995, August). The contribution of multiple role self-efficacy
and gender role attitudes to women's career development. Paper presented at the the
103rd Annual Convention of the American Psychological Association, New York.
128
Ehrenberg, R. G., Kuh, C. V., & Cornell Higher Education Research Institute. (2009). Doctoral
education and the faculty of the future. Ithaca: Cornell University Press.
Eris, Ö ., Chachra, D., Chen, H., Rosca, C., Ludlow, L., Sheppard, S. (2007, June 24-27). A
preliminary analysis of correlates of engineering persistence: results from a longitudinal
study. Paper presented at the the American Society for Engineering Education Annual
Conference, Honolulu, Hawaii.
Esparragoza, I., Friess, A., & Larrondo, M. M. (2008, June 22-25). Developing assessment tools
for international experiences in engineering education. Paper presented at the 2008
American Society for Engineering Education Annual Conference, Pittsburgh, PA.
Etzkowitz, H., Kemelgor, C., Neuschatz, M., & Uzzi, B. (1994). Barriers to women in academic
science and engineering. In W. Pearson, Jr. & I. Fechter (Eds.), Who will do science?
Educating the next generation (pp. 43-67). Baltimore, MD: Johns Hopkins University
Press.
Evans, J., & McGinnis, R. (2006). Short-term study abroad: Engineering in a global and societal
context, Chicago, IL, United States.
Fadigan, K. A., & Hammrich, P. L. (2004). A longitudinal study of the educational and career
trajectories of female participants of an urban informal science education program.
Journal of Research in Science Teaching, 41, 835-860.
Felder, R. M., Felder, G. N., & Dietz, E. J. (1998). A longitudinal study of engineering student
performance and retention: V. Comparisons with traditionally-taught students. Journal of
Engineering Education, 87(4), 469-480.
Fouad, N. A., & Singh, R. (2011). Stemming the tide: Why women leave in engineering:
University of Wisconsin-Milwaukee.
Fox, F. M., & Stephen, P. E. (2001). Careers of young scientists: Preferences, prospects and
realities by gender and field. Social Studies of Science, 31(1), 109-122.
Gilbert, J., & Calvert, S. (2003). Challenging accepted wisdom: Looking at the gender and
science education question through a different lens. International Journal of Science
Education, 25 861-878.
Gottfredson, L. S., & Lapan, R. T. (1997). Assessing Gender-Based Circumscription of
Occupational Aspirations. Journal of Career Assessment, 5(4), 419-441. doi:
10.1177/106907279700500404
Graham, J. W. (2009). Missing data analysis: Making it work in the real world. Annual Review of
Psychology, 60(1), 549-576. doi: 10.1146/annurev.psych.58.110405.085530
Grandy, J. (1992). Graduate enrollment decisions of undergraduate science and engi- neering
majors: A survey of GRE test takers (GRE Board Professional Report No. 85-01).
Princeton, NJ: Educational Testing Service.
Grose, T. K. (2008, February 2008). Staying on track: Engineering schools used to shrug off high
attrition rates. Now they're working to help students achieve early - and enduring success.
ASEE PRISM, 17, 22-28.
Guterman, L. (2007, 8/17/2007). What good is undergraduate research, anyway? Many students
benefit, but studies show weaknesses in current practices, The Chronicle of Higher
Education, pp. A12-A16.
Haüssler, P., & Hoffmann, L. (2002). An intervention study to enhance girls' interest, self-
concept, and achievement in physics classes. Journal of Research in Science Teaching,
39(9), 870-888.
129
Hackett, G. (1997). Self-Efficacy in Career Choice and Development. In A. Bandura (Ed.), Self-
efficacy in Changing Societies (pp. 232-258). New York: Cambridge University Press.
Halpern, D. F., Aronson, J., Reimer, N., Simpkins, S., Star, J. R., & Wentzel, K. (2007).
Encouraging Girls in Math and Science. Institute of Education Sciences Practice Guide,
U.S. Department of Education.
Hartman, H., & Hartman, M. (2006). Leaving engineering: Lessons from Rowan University's
College of Engineering. Journal of Engineering Education, 95(1), 49-59.
Helwig, A. A. (2001). A Test of Gottfredson's Theory Using a Ten-Year Longitudinal Study.
Journal of Career Development, 28(2), 77.
Hill, C., Corbett, C., & Rose, A. S. (2010). Why So Few? Women in Science,Technology,
Engineering, and Mathematics. Washington, DC: American Association of University
Women (AAUW).
Holland, J. L. (1997). Making vocational choices : a theory of vocational personalities and work
environments (3rd ed.). Odessa, Fla.: Psychological Assessment Resources.
House Resolution 1709. (2009). STEM Education Coordination Act of 2009 Retrieved July 12,
2010, from http://science.house.gov/legislation/leg_highlights_detail.aspx?NewsID=2459
Huang, G., Taddese, N., & Walter, E. (2000). Entry and persistence of women and minorities in
college science and engineering education Retrieved July 30, 2010, from
http://nces.ed.gov/pubsearch/pubsinfo.asp?pubid=2000601
Hurtado, S., Cerna, O. S., Chang, J. C., Sa enz, V. B., Lopez, L. R., & Mosqueda, C. e. a. (2006).
Aspiring scientists: Characteristics of college freshmen interested in the biomedical and
behavioral sciences. Los Angeles, CA: Higher Education Research Institute, UCLA.
Jacobs, J. E., & Becker, J. R. (1997). Creating a gender-equitable multicultural classroom using
feminist pedagogy Yearbook (National Council of Teachers of Mathematics) (pp. 107-
114). Reston, VA: NCTM.
Jessup, E., T. , Sumner, & Barker, L. (2005). Report from the trenches: implementing curriculum
to promote the participation of women in computer science. Journal of Women and
Minorities in Science and Engineering, 11, 273–294.
Jocuns, A., Stevens, R., Garrison, L., & Amos, D. (2008, June 22-25). Students' changing images
of engineering and engineers. Paper presented at the 2008 American Society for
Engineering Education Annual Conference, Pittsburgh, PA.
Johnson, D., R., Johnson, & Smith, K. (1998). Active Learning: Cooperation in the College
Classroom (2nd ed.). Edina, MN: Interaction Book Co.
Johnson, D. W., & Johnson, R. T. (1983). The socialization and achievement crisis: Are
cooperative learning experiences the solution? Applied Social Psychology Annual, 4, 119-
164.
Jonassen, D. H. (2007). What makes scientific problems difficult? In D. H. Jonassen (Ed.),
Learning to solve complex scientific problems (pp. 3-23). New York: Lawrence Erlbaum.
Kadlowec, J., Bhatia, K., Chandrupatla, T. R., Chen, J. C., Constans, E., Hartman, H. (2007).
Design integrated in the mechanical engineering curriculum: Assessment of the
engineering clinics. [Article]. Journal of Mechanical Design, 129(7), 682-691. doi:
10.1115/1.2722788
Kardash, C. M. (2000). Evaluation of an undergraduate research experience: Perceptions of
undergraduate interns and their faculty mentors. journal of educational psychology, 92(1),
191-201.
130
Kardash, C. M., & Wallace, M. L. (2001). The perceptions of science classes survey: what
undergraduate science reform efforts really need to address. Journal of Educational
Psychology, 93(1), 199-210.
Knight, D. B. (2011). Engineering broad thinkers: The effects of curricular emphases and
instructional practices on undergraduate interdisciplinary skills. Paper presented at the
The American Educational Research Association, New Orleans, LA.
Krathwohl, D. R. (2004). Methods of educational and social science research (2nd ed.). Long
Grove, IL: Waveland Press, Inc.
Kuh, G. D., Kinzie, J., Schuh, J. H., Whitt, E. J., & Associates. (2005). Student success in college:
Creating conditions that matter. San Francisco: Jossey-Bass.
Laing, J., Swayer, R., & Noble, J. (1989). Accuracy of self-reported activities and
accomplishments of college-bound seniors. Journal of College Student Development,
29(4), 362-368.
Lareau, A. (2002). Iinvisible inequality: Ssocial class and childrearing in black families and
white families. American Sociological Review, 67(5), 747-776.
Lattuca, L. R. (May 11, 2010). Interdisciplinary competence: A learning goal for students and
faculty? Paper presented at the Keynote address at the 23rd Annual Teaching and
Learning Innovations Conference at University of Guelph, Guelph, Ontario, Canada.
Lattuca, L. R., & Knight, D. B. (2010). In the eye of the beholder: Defining and studying
interdisciplinarity in engineering education. Paper presented at the The American
Society for Engineering Education, Louisville, KY. .
Lattuca, L. R., & Stark, J. S. (2009). Shaping the college curriculum: Academic plans in context.
San Francisco: Jossey-Bass.
Lattuca, L. R., Terenzini, P., Harper, B., & Yin, A. (2010). Academic Environments in Detail:
Holland‘s Theory at the Subdiscipline Level. Research in Higher Education, 51(1), 21-39.
doi: 10.1007/s11162-009-9144-9
Lattuca, L. R., Terenzini, P. T., & Volkwein, J. F. (2006). Engineering change: A study of the
impact of EC2000. Baltimore: ABET.
Lattuca, L. R., Trautvetter, L. C., Marra, R. C., & Knight, D. B. (2011). Programs and practices
making a difference: A cross-case analysis identifying programs and factors that
influence recruitment and retention of women engineering students. Paper presented at
the the American Society for Engineering Education, Vancouver, Canada.
Lemke, R. J. (2009). Undergraduate STEM Research Experiences: Impact on Student Interest in
Doing Graduate Work in STEM Fields In R. G. Ehrenberg, C. V. Kuh & C. H. E. R.
Institute (Eds.), Doctoral education and the faculty of the future. Ithaca, NY: Cornell
University Press.
Lent, R. W., & Brown, S. D. (2006). On Conceptualizing and Assessing Social Cognitive
Constructs in Career Research: A Measurement Guide. Journal of Career Assessment,
14(1), 12-35. doi: 10.1177/1069072705281364
Lent, R. W., Brown, S. D., & Hackett, G. (1994). Social cognitive approach to career
development: An overview. Career Development Quarterly, 44.
Lichtenstein, G., Loshbaugh, H. G., Claar, B., Chen, H. L., Jackson, K., & Sheppard, S. D.
(2009). An Engineering Major Does Not (Necessarily) an Engineer Make: Career
Decision Making Among Undergraduate Engineering Majors. Journal of Engineering
Education, 98(3).
131
Long, J. S. (1997). Regression Models for Categorical and Limited Dependent Variables
(Advanced Quantitative Techniques in the Social Sciences). Thousand Oaks, California.
Long, J. S., & Freese, J. (2006). Regression Models for Categorical Dependent Variables Using
Stata (2nd ed.). College Station, TX: Stata Press.
Lopatto, D. (2004). Survey of Undergraduate Research Experiences (SURE): First Findings. Cell
Biol Educ, 3(4), 270-277. doi: 10.1187/cbe.04-07-0045
Lopatto, D. (2007). Undergraduate Research Experiences Support Science Career Decisions and
Active Learning. CBE Life Sci Educ, 6(4), 297-306. doi: 10.1187/cbe.07-06-0039
Lord, S. M., Brawner, D. E., Camacho, M. M., Layton, R. A., Ohland, M. W., & Wasburn, M. H.
(2009). Work in progress -- Engineering students' disciplinary choices: Do race and
gender matter? Paper presented at the the 39thASEE/IEEE Frontiers in Education
Conference, San Antonio, TX.
Lowell, B. L., & Salzman, H. (2007). Into the eye of the storm: Assessing the evidence on
science and engineering education, quality, and workforce demand. Washington, D.C.:
The Urban Institute.
Lowell, B. L., Salzman, H., Bernstein, H., & Henderson, E. (2009). Steady as she goes? Three
generations of students through the science and engineering pipeline.
Macias-Guarasa, J., Montero, J. M., San-Segundo, R., Araujo, A., & Nieto-Taladriz, O. (2006).
A project-based learning approach to design Electronic Systems Curricula. [Article]. Ieee
Transactions on Education, 49(3), 389-397. doi: 10.1109/te.2006.879784
Malicky, D. (2003). A Literature Re view on the Under-repr esentation of Women in
Undergraduate Engineering: Ability, Self-Eff icacy, and the "Chilly Climate". Paper
presented at the Proceedings of the 2003 American Society for Engineering Education
Annual Conference & Exposition.
Marra, R. M., & Bogue, B. (2003). A.W.E. (assessing women in engineering) – designing tools
for success using collaboration. Paper presented at the 33rd ASEE/IEEE Frontiers in
Education Conference, Boulder, CO.
Masters, C. B., Schuurman, M., Okudan, G., & Hunter, S. T. (2008, June 22-25). An
investigation of gaps in design process leanring: Is there a missing link between breadth
and depth? Paper presented at the 2008 American Society for Engineering Education
Annual Conference, Pittsburgh, PA.
McKenna, A., Plumb, C., Kremer, G. E., Yin, A. C., & Ro, H. K. (2011). Approaches to
engaging students in engineering design and problem solving. Paper presented at the the
American Society for Engineering Education, Vancouver, Canada.
Millis, B., & Cottell, P. (1998). Cooperative learning for higher education faculty: American
Council on Education, ORYX Press.
National Academies Committee on Science Engineering and Public Policy. (2006). Rising above
the gathering storm: Energizing and employing America for a brighter economic future. .
Washington, DC: National Academy of Sciences, National Academy of Engineering, and
Institute of Medicine.
National Academy of Engineering. (2004). The Engineer of 2020: Visions of Engineering in the
New Century. Washington, DC: National Academies Press.
National Academy of Engineering. (2005). Educating the engineer of 2020: Adapting
engineering education in the new century. Washington, DC: The National Academies
Press.
132
National Academy of Engineering. (2006). Educating the engineer of 2020: Adapting
engineering education in the new century. Washington, DC: The National Academies
Press.
National Academy of Engineering, & National Research Council. (2005). Enhancing the
community college pathway to engineering careers. Washington, DC: National Academy
of Sciences.
National Commission for Cooperative Education. (2002). The cooperative education model
Retrieved December 8, 2010, from http://www.co-op.edu/aboutcoop.htm.
National Science Board. (2010). Ch. 2: Higher Education in Science and Engineering Science
and Engineering Indicators: 2010: National Science Foundation, 2.1–2.48.
Nauta, M. M. (1998). A multiple-groups analysis of predictors of higher level career aspirations
among women in mathematics, science, and engineering majors. Journal of counseling
psychology, 45(4), 483.
Ngambeki, I., Dalrymple, O., & Evangelou, D. (2008, June 22-25). Decision-making in first-year
engineering: Exploring how students decide about futures studies and career pathways.
Paper presented at the 2008 American Society for Engineering Education Annual
Conference, Pittsburgh, PA.
O'Brien, K. M., & Fassinger, R. E. (1993). A causal model of the career orientation and choice of
adolescent women. Journal of Counseling Psychology, 40, 456-469.
Ogunfunmi, T. (2008, June 22-25). Impact and results of minority engineering student advising
and mentoring for career advancement. Paper presented at the 2008 American Society
for Engineering Education Annual Conference, Pittsburgh, PA.
Ohland, M. W., Sheppard, S. D., Lichtenstein, G., Eris, O., Chachra, D., & Layton, R. A. (2008).
Persistence, engagement, and migration in engineering programs. Journal of Engineering
Education, 97(3), 259-278.
Oseguera, L., Hurtado, S., Denson, N., Cerna, O., & Saenz, V. (2006). The characteristics and
experiences of minority freshmen committed to biomedical and behavioral science
research careers. Journal of Women and Minorities in Science and Engineering, 12(2-3),
155-177.
Pace, C. R. (1985). The credibility of student self-reports. Los Angeles: The Center for the Study
of Evaluation, Graduate School of Education, University of California at Los Angeles.
Palmer, E., Harper, B. J., Terenzini, P. T., McKenna, A., & Merson, D. S. (2011). Design in
context: Where do the engineers of 2020 learn this skill? Paper presented at the the
American Society for Engineering Education, Vancouver, Canada.
Pascarella, E. T. (1985). College environmental influences on learning and cognitive
development: A critical review and synthesis. In J. Smart (Ed.), Higher education:
Handbook of theory and research. New York: Agathon.
Pascarella, E. T., & Terenzini, P. T. (2005). How college effects students. A third decade of
research. San Francisco: Jossey-Bass.
Pawley, A. L. (2004, June). The feminist engineering classroom:A vision for future educational
innovations. Paper presented at the Proceedings of the 2004 American Society for
Engineering Education Annual Conference & Exposition, Salt Lake City, UT.
Peng, C. J., So, T.-S.H., Stage, F.K., & St. John, E. P. . (2002). The used and interpretation of
logistic regression in higher education journals. Research in Higher Education, 43(3),
259-294.
133
Pike, G. R. (1995). The relationship between self-reports of college experiences and achievement
test scores. Research in Higher Education, 36(1), 1-22.
Plucker, J. A. (1998). The relationship between school climate conditions and student aspirations.
The Journal of Educational Research, 91(4), 240.
Prince, M. (2004). Does active learning work? A review of the research. Journal of Engineering
Education, 93(3), 223-231.
Prince, M. (2006). Inductive teaching and learning methods: Definitions, comparisons, and
research bases. Journal of Engineering Education, 95(2), 123-138.
Quaglia, R. J., & Perry, C. M. (1995). Astudy of underlying variables affecting aspirations of
rural adolescents. Adolescence, 30.
Riegle-Crumb, C. (2005). The path through math: Course sequences and academic preformance
at the intersection of race/ethnicity and gender. Austin, TX: Population Research Center,
The University of Texas at Austin.
Ro, H. K. (2011). Predicting graduate school plans based on students' self-assessed engineering
knowledge and skills. Paper presented at the the American Society for Engineering
Education, Vancouver, Canada.
Ro, H. K., Marra, R. M., Terenzini, P. T., Trautvetter, L. C., Walser, A., D., , & Lord, M., S.
(2011, June). If you build it they will come (and stay): Recruiting and retaining women
and underrepresented minority students. Paper presented at the the meeting of the
American Society for Engineering Education, Vancouver, Canada.
Robinson, D., & Reilly, B. A. (1993). Women engineers: A study of educational preparation and
professional success. Journal of Engineering Education, 82(2), 79-82.
Sathianathan, D., Sheppard, S., Jenison, R., Bilgutay, N., Demel, J., Gavankar, P. (1998).
Freshman design projects: Lessons learned in engineering coalitions. Paper presented at
the Frontiers in Education Conference, Tempe, AZ.
Sax, L. J. (1994). Predicting gender and major-field differences in mathematical self-concept
during college. Journal of Women and Minorities in Science and Engineering, 1(4), 291-
307.
Seymour, E. (1995). The loss of women from science, mathematics, and engineering
undergraduate majors: An explanatory account. Science Education, 79, 437–473.
Seymour, E., & Hewitt, N. (1997). Talking about leaving: Why undergraduates leave the
sciences. Boulder, CO: Westview Press.
Seymour, E., Hunter, A.-B., Laursen, S., & DeAntoni, T. (2004). Establishing the benefits of
research experiences for undergraduates in the sciences: First findings from a three-year
study. Science Education, 88(4), 493-534.
Shadish, W., Cook, T., & Campbell, D. (2002). Experimental & quasi-experimental designs for
generalized causal inference. Boston: Houghton Mifflin.
Sheppard, S., Gilmartin, S., Chen, H. L., Donaldson, K., Lichtenstein, G., & Lande, M. (2010).
Exploring the engineering student experience: Findings from the Academic Pathways of
People Learning Engineering Survey (APPLES). Center for the Advancement of
Engineering Education. TR-10-01.
Sheppard, S., Macatangay, K., Colby, A., & Sullivan, W., M. (2008). Educating engineers:
Designing for the future of the field. San Francisco, CA: Jossey-Bass.
Smart, J. C., Feldman, K. A., & Ethington, C. A. (2000). Academic disciplines: Holland’s theory
and the study of college students and faculty. Nashville: Vanderbilt University Press.
134
Smith, B., & MacGregor, J. (1992). What is Collaborative Learning? In A. Goodsell, M. Mahler,
V. Tinto, B.L.Smith, and J. MacGreger (Ed.), Collaborative Learning: A Sourcebook for
Higher Education (pp. 9-22). University Park, PA: National Center on Postsecondary
Teaching, Learning and Assessment.
Smollins, J. (1999). The making of history: Ninety years of Northeaster co-op. Northeastern
University Magazine Online Retrieved December 23, 2010, from
http://www.northeastern.edu/magazine/9905/history.html.
Sorby, S. A., Leopold, C., & Gorska, R. (1999). Cross-cultural comparisons of gender
differences in the spatial
skills of engineering students. Journal of Women and Minorities in Science and Engineering, 5,
279-291.
Springer, L., Stanne, M. E., & Donovan, S. (1997). Effects of small-group learning on
undergraduates in science, mathematics, engineering, and technology: A meta-analysis.
Madison, WI: National Institute for Science Education.
Stark, J. S., & Lowther, M. A. (1988). Strengthening the Ties That Bind: Integrating
Undergraduate Liberal and Professional Study. Report of the Professional Preparation
Network: Professional Preparation Project, 2400 School of Education Building,
University of Michigan, Ann Arbor, MI 48109-1259 ($15.00).
Strauss, L. C., & Terenzini, P. T. (2007). The Effects of Students‘ In-and Out-of-Class
Experiences on their Analytical and Group Skills: A Study of Engineering Education.
Research in Higher Education, 48(8), 967.
Suresh, R. (2006). The relationship between barrier courses and persistence in engineering.
Journal of College Student Retention, 8(2), 215.
Swanson, J. L. (1993). Integrated assessment of vocational interests and self-rated abilities and
skills. Journal of Career Assessment, 1, 50-65.
Terenzini, P. T., & Reason, R. D. (2005, November 19). Parsing the first year of college:
Rethinking the effects of college on students. Paper presented at the 2005 Association for
the Study of Higher Education Conference, Philadelphia, PA.
The College Board. (2005). 2005 College-bound seniors: Total group profile report Retrieved
July 30, 2010, from
http://www.collegeboard.com/prod_downloads/about/news_info/cbsenior/yr2005/2005-
college-bound-seniors.pdf.
Tinto, V. (1975). Dropout from higher education: A theoretical synthesis of recent research.
Review of Educational Research, 45, 89-125.
Tinto, V. (1993). Leaving college : rethinking the causes and cures of student attrition (2nd ed.).
Chicago ; London: University of Chicago Press.
Tracey, T. J. G., & Hopkins, N. (2001). Correspondence of interests and abilities with
occupational choice. Journal of Counseling Psychology, 48(2), 178-189.
Trowbridge, D., & McDermott, L. C. (1981). Investigation of student understanding of the
concept of acceleration in one dimension. American Journal of Physics, 49(3), 242-252.
U.S. Department of Education. (2006). A test of leadership: Charting the future of U.S. higher
education: Report of the commission appointed by Secretary of Education Margaret
Spellings. Washington, DC: Education Publications Center.
U.S. Department of Education Office of Postsecondary Education. (2010). Academic
Competitiveness and National SMART Grants Retrieved July 12, 2010, from
http://www2.ed.gov/about/offices/list/ope/ac-smart.html
135
U.S. Government Accountability Office. (2006). Science, technology, engineering and
mathematics trends and the role of federal programs: Statement of Cornelia M. Ashby,
Director, Education, Workforce, and Income Security Issues (GAO-06-702T).
Washington, DC: Author.
Wang, J., & Staver, J. R. (2001). Examining Relationships between Factors of Science Education
and Student Career Aspiration. The Journal of Educational Research, 94(5), 312-319.
Wei-Cheng, M. (2003). Factors That Influence Persistence in Science and Engineering Career
Aspirations. Career Development Quarterly, 51(3), 234.
Whitaker, D. G., & Pascarella, E. T. (1994). Two-Year College Attendance and Socioeconomic
Attainment: Some Additional Evidence. The Journal of Higher Education, 65(2), 194-
210.
White House. (2010). Educate to Innovate Retrieved July 30, 2010, from
http://www.whitehouse.gov/issues/education/educate-innovate
Whitt, E. J., Pascarella, E. T., Elkins Neisheim, B. S., & Martin, B. P. (2003). Differences
between women and men in objectively measured outcomes, and the factors that
influence those outcomes, in the first three years of college. Journal of College Student
Development, 44(5), 587.
Zafar, B. (2009). College major choice and the gender gap. from Federal Reserve Bank of New
York Staff Reports http://www.newyorkfed.org/research/staff_reports/sr364.pdf

136
Appendix A
SURVEY
137
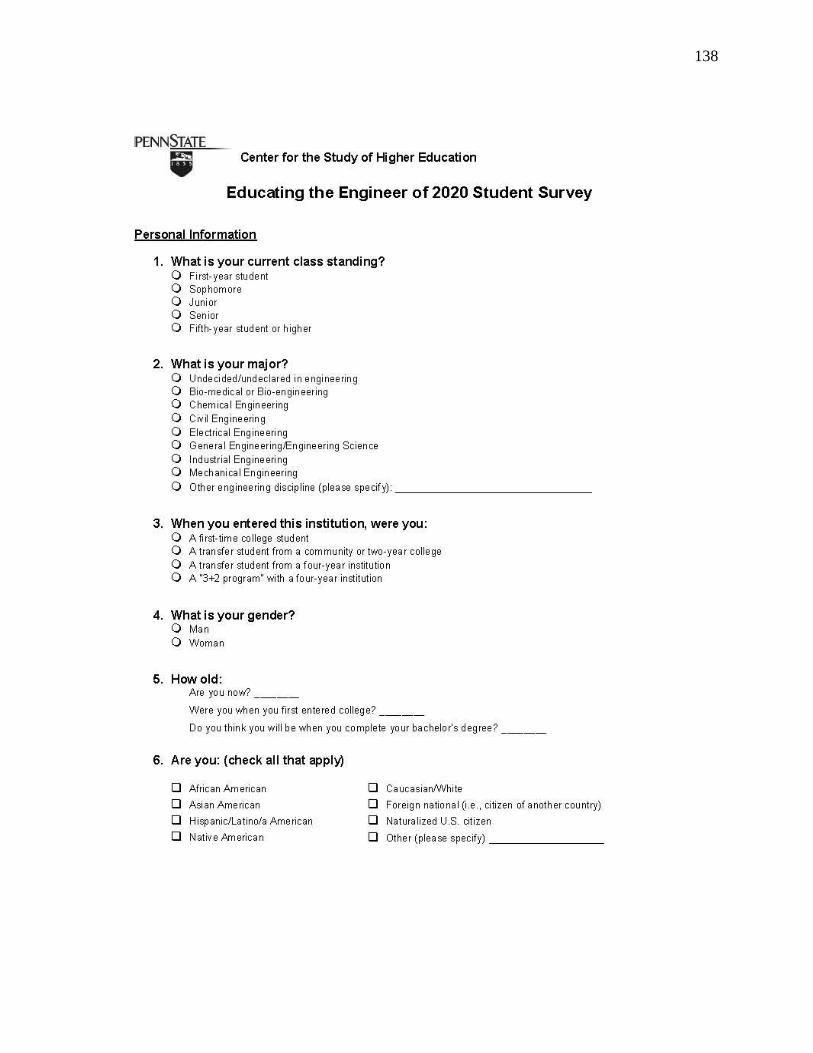
138
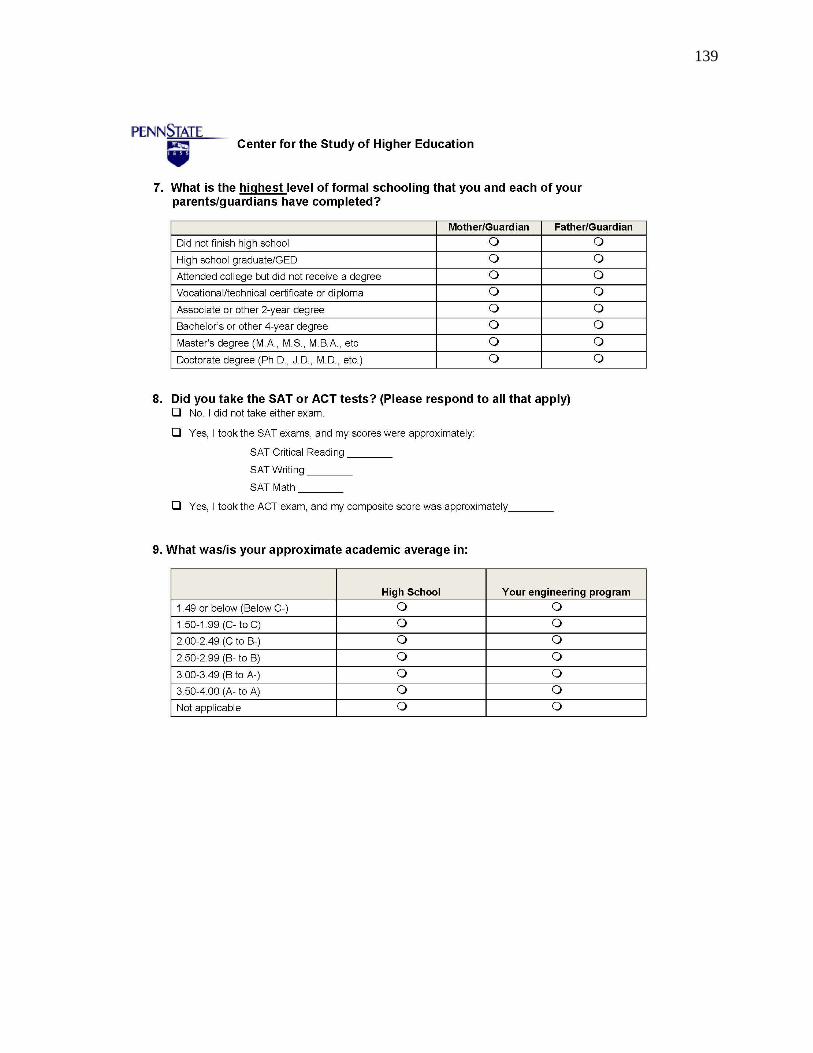
139
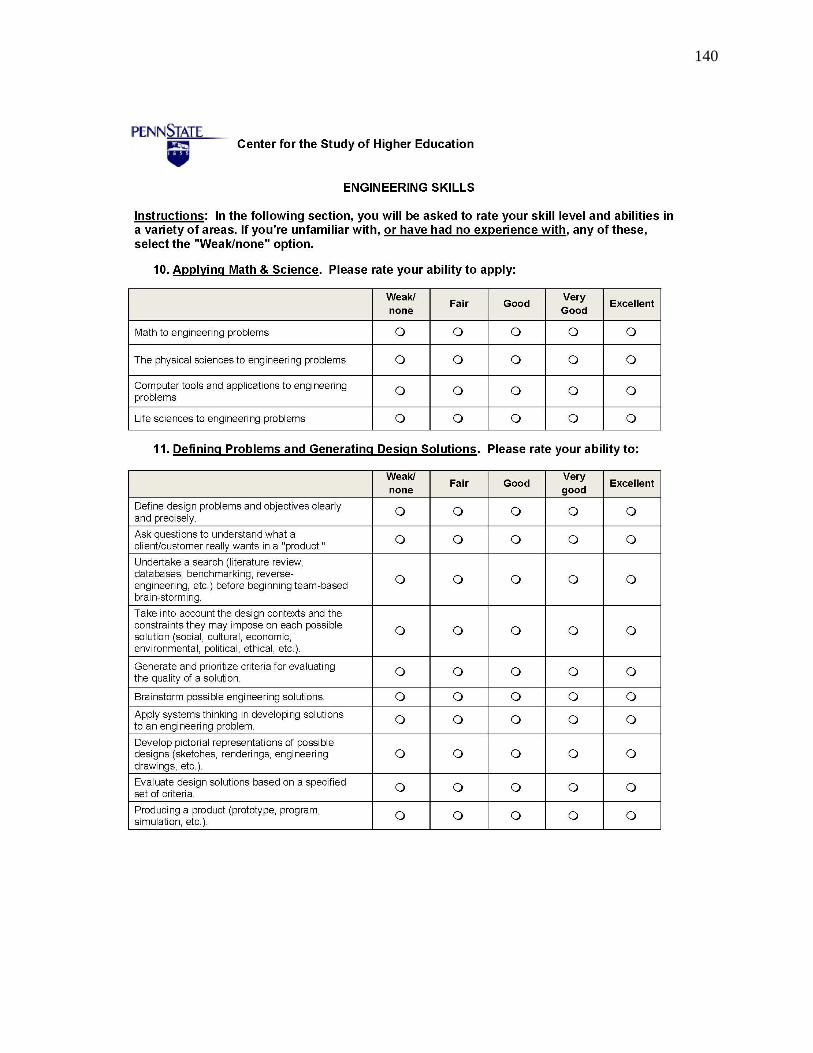
140
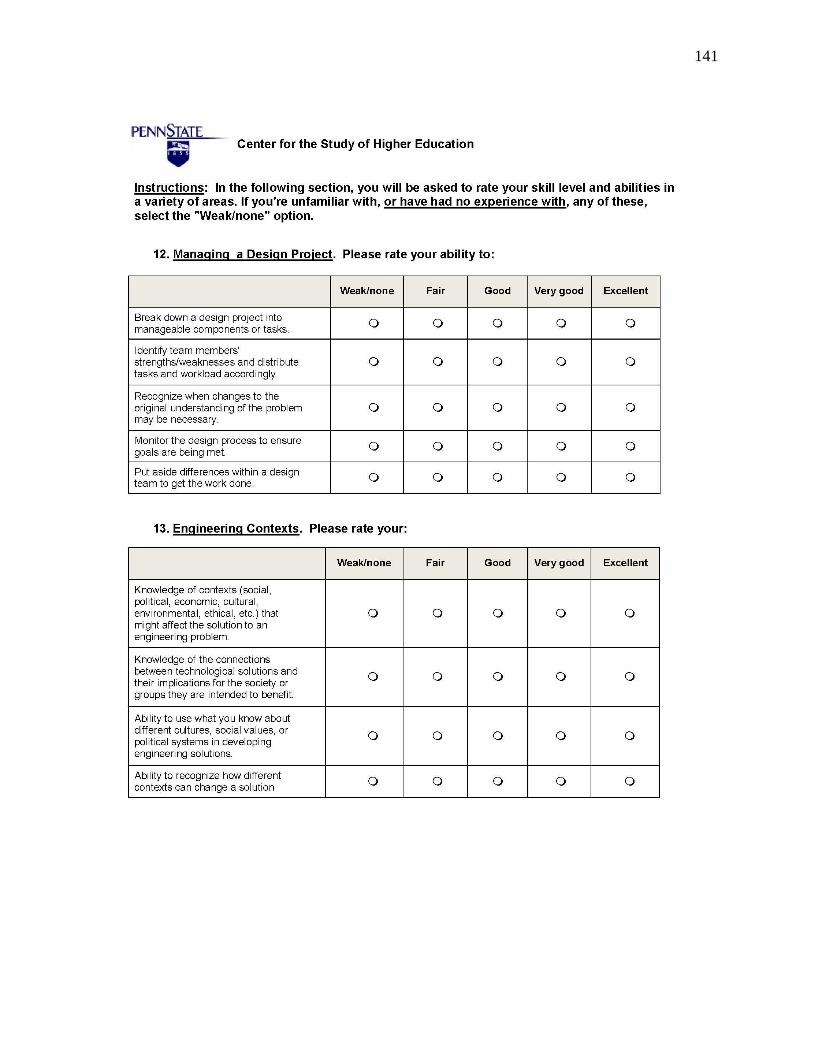
141
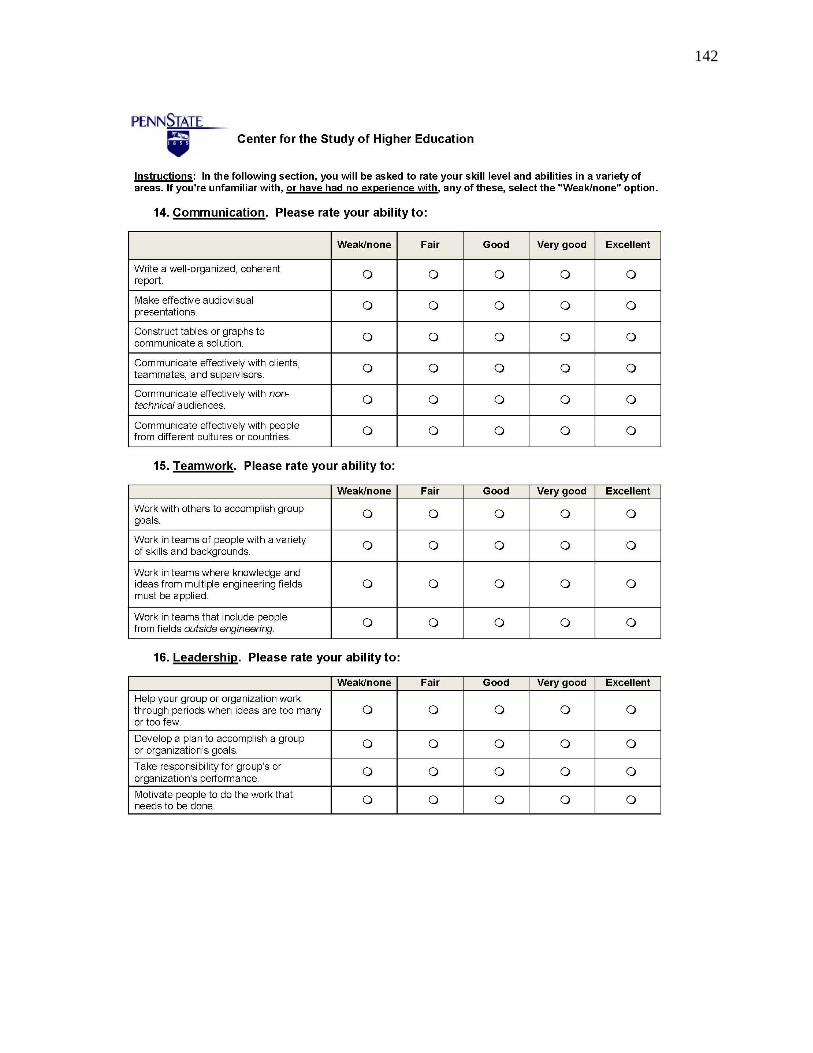
142
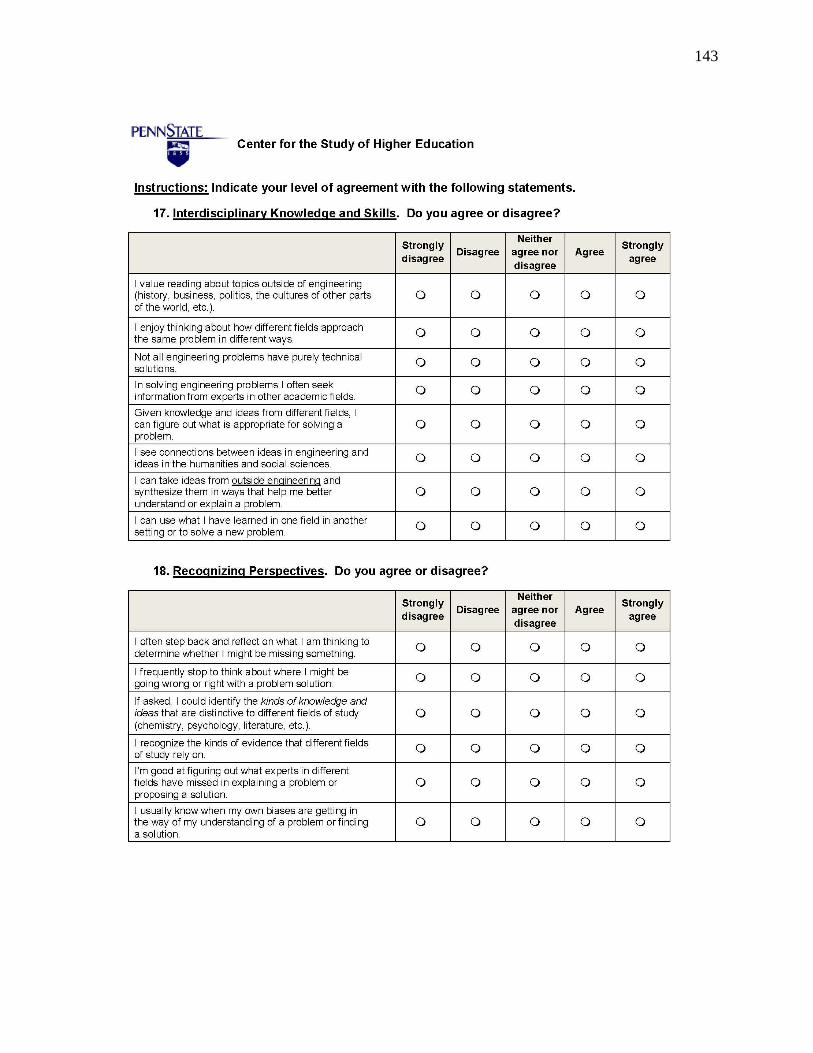
143
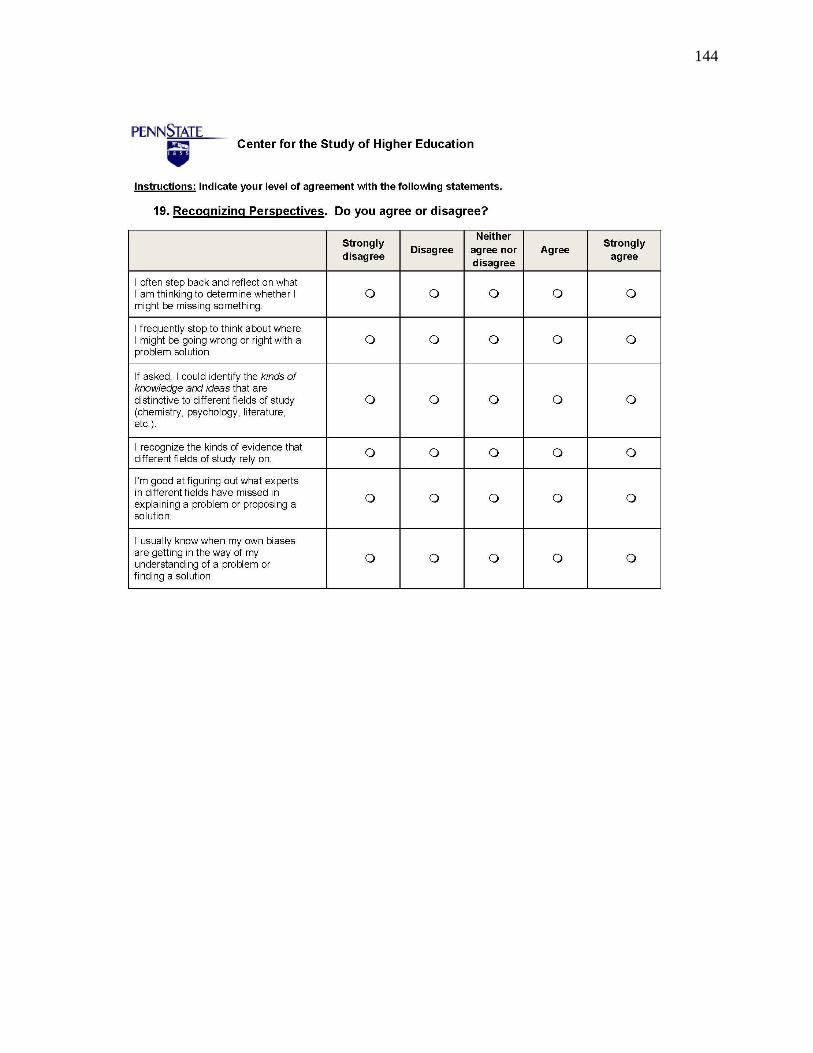
144

145
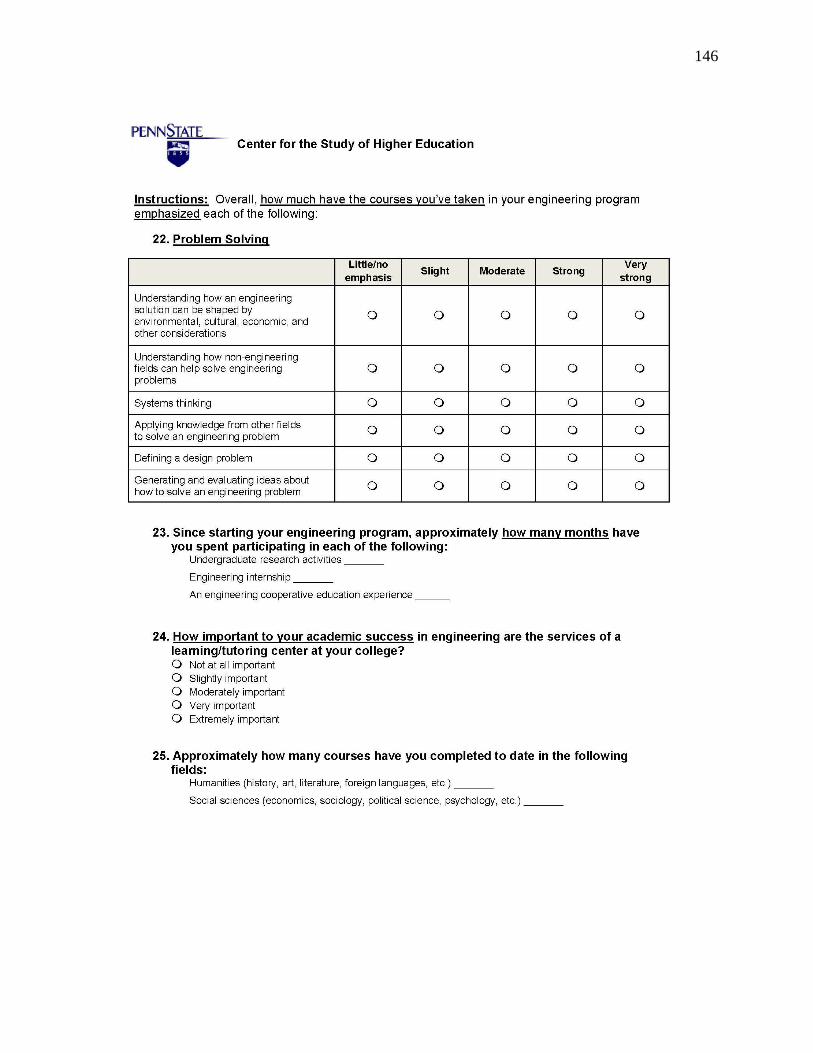
146
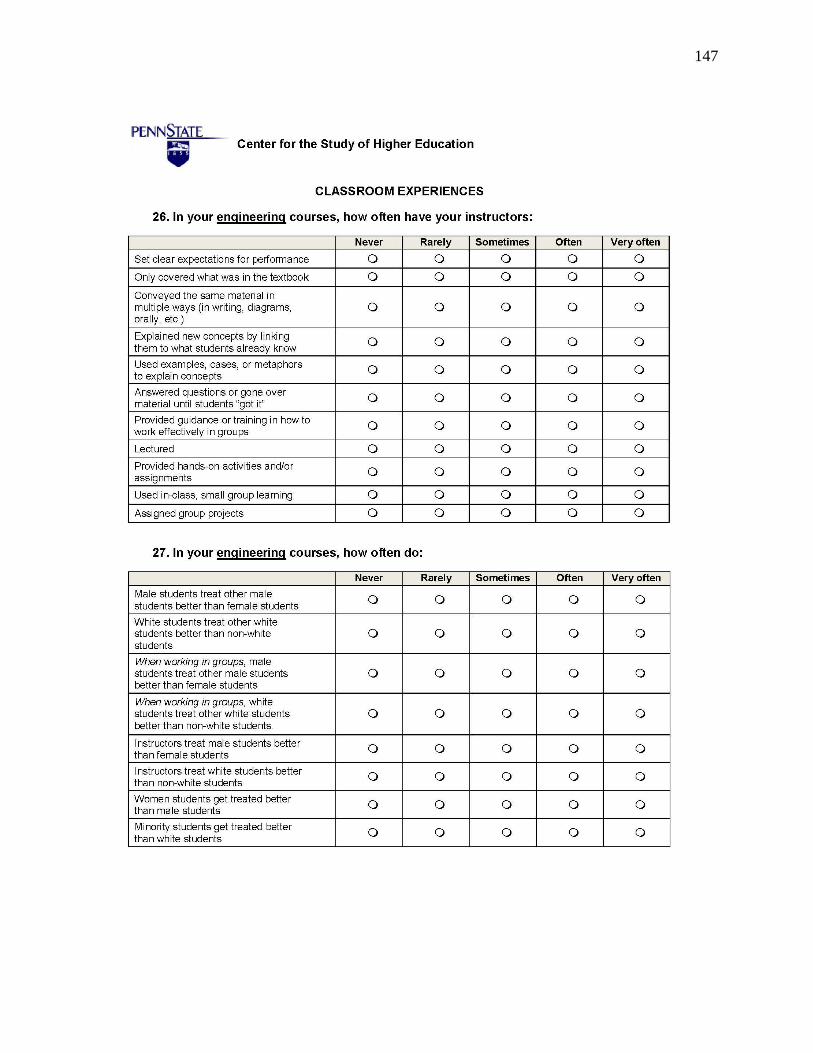
147
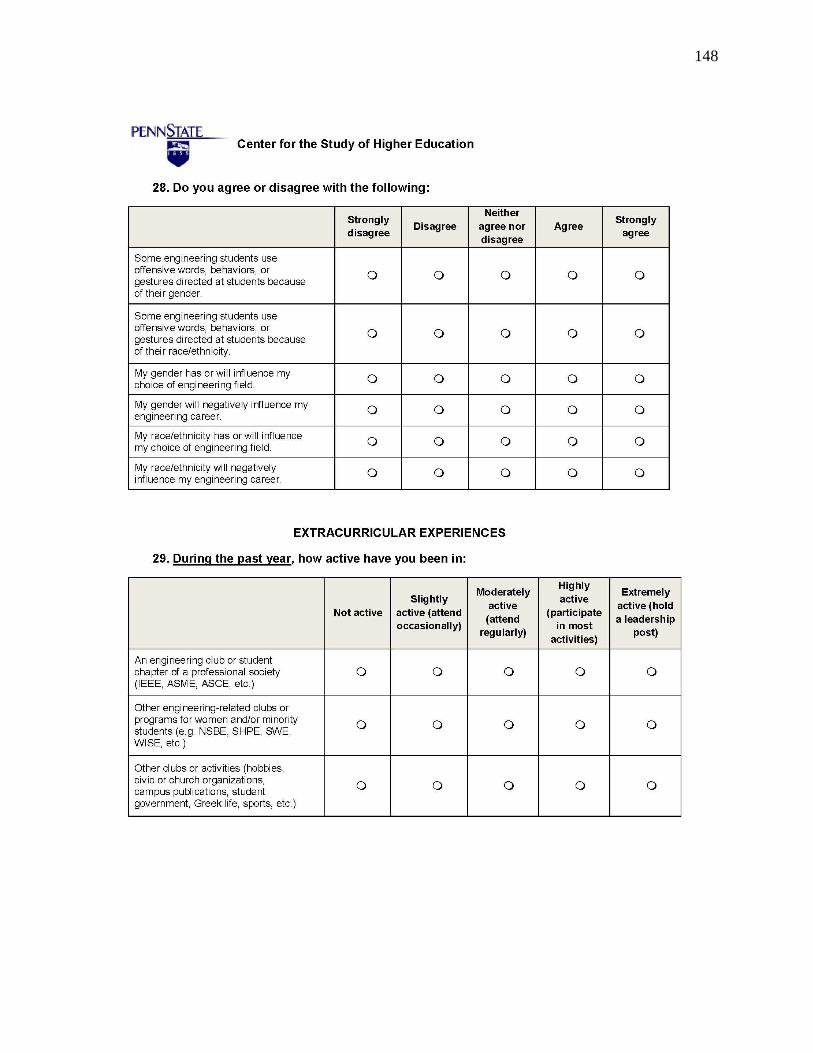
148
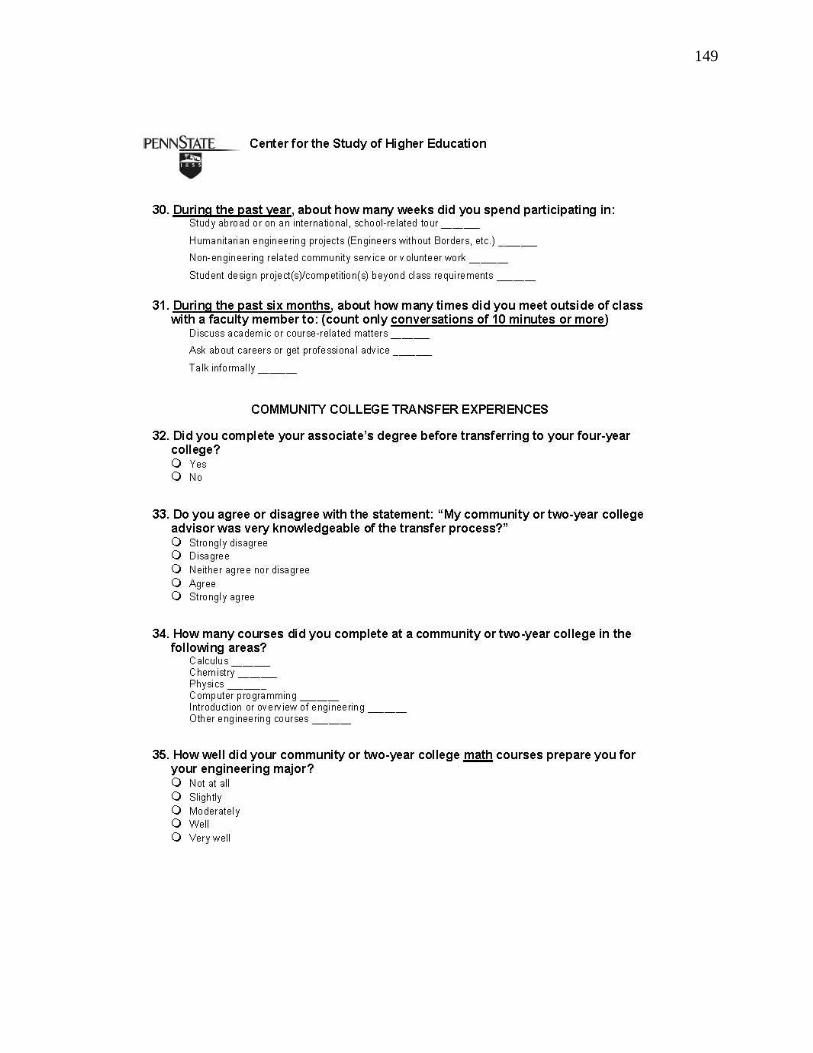
149
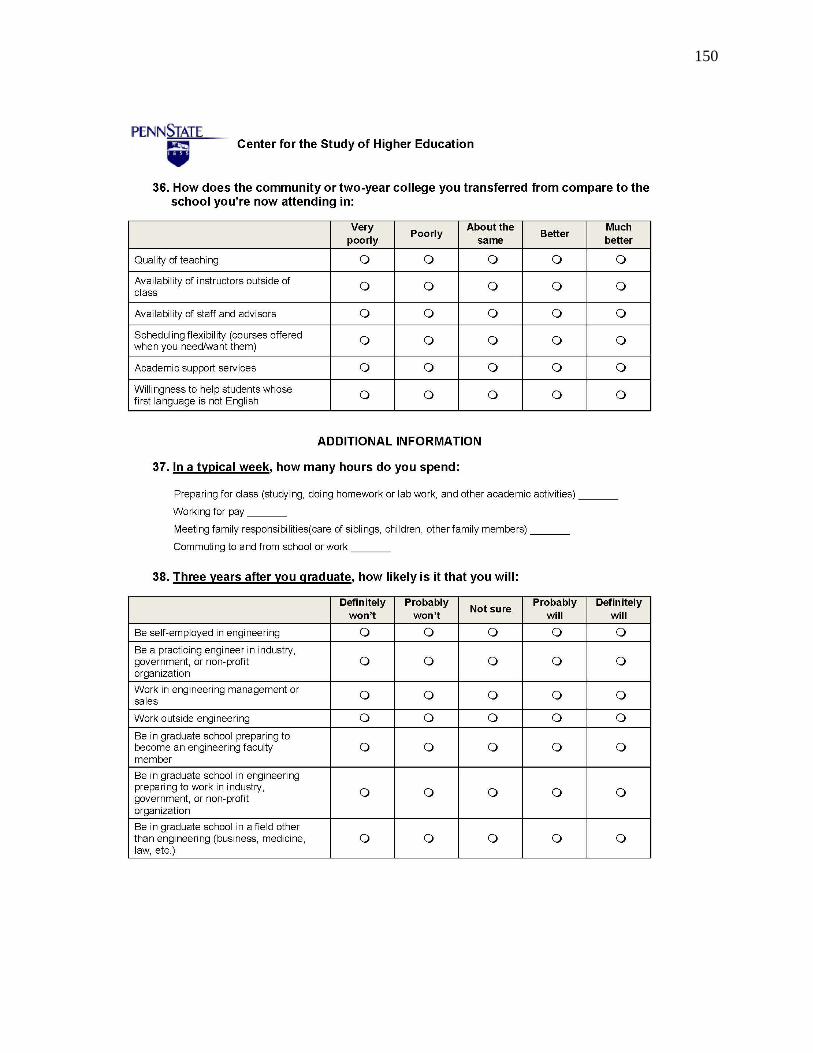
150
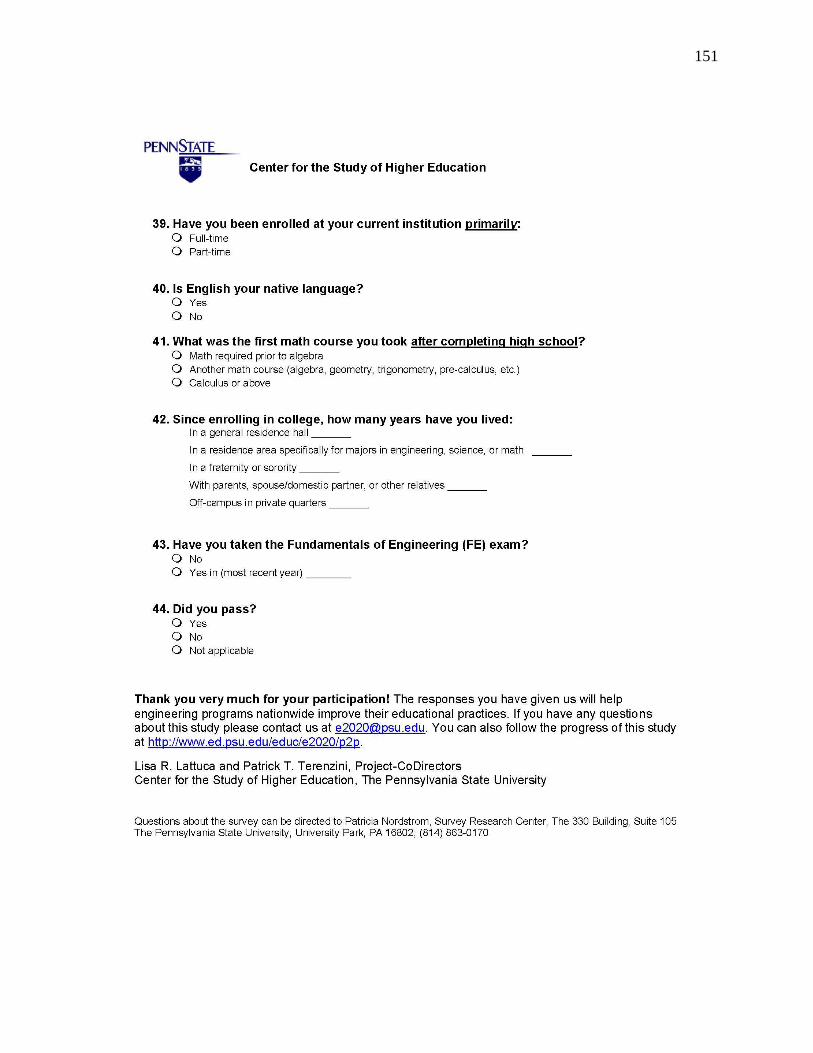
151

152
Appendix B
VARIABLES
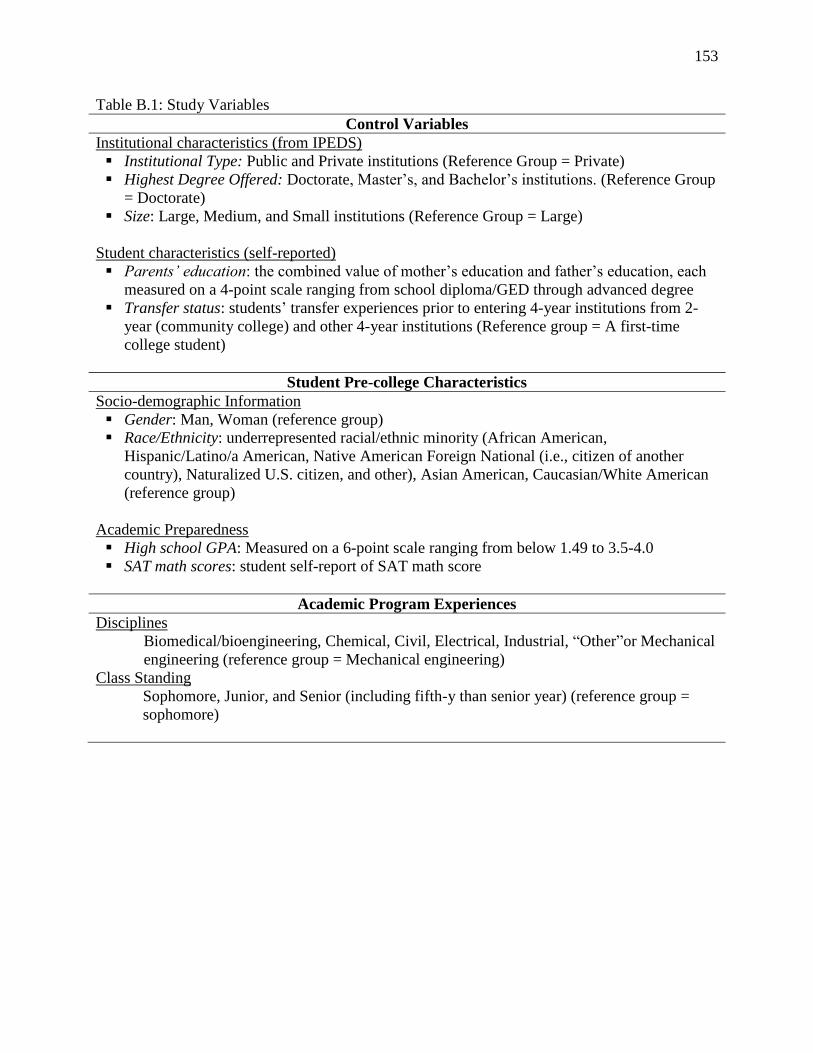
153
Table B.1: Study Variables
Control Variables
Institutional characteristics (from IPEDS)
Institutional Type: Public and Private institutions (Reference Group = Private)
Highest Degree Offered: Doctorate, Master‘s, and Bachelor‘s institutions. (Reference Group
= Doctorate)
Size: Large, Medium, and Small institutions (Reference Group = Large)
Student characteristics (self-reported)
Parents’ education: the combined value of mother‘s education and father‘s education, each
measured on a 4-point scale ranging from school diploma/GED through advanced degree
Transfer status: students‘ transfer experiences prior to entering 4-year institutions from 2-
year (community college) and other 4-year institutions (Reference group = A first-time
college student)
Student Pre-college Characteristics
Socio-demographic Information
Gender: Man, Woman (reference group)
Race/Ethnicity: underrepresented racial/ethnic minority (African American,
Hispanic/Latino/a American, Native American Foreign National (i.e., citizen of another
country), Naturalized U.S. citizen, and other), Asian American, Caucasian/White American
(reference group)
Academic Preparedness
High school GPA: Measured on a 6-point scale ranging from below 1.49 to 3.5-4.0
SAT math scores: student self-report of SAT math score
Academic Program Experiences
Disciplines
Biomedical/bioengineering, Chemical, Civil, Electrical, Industrial, ―Other‖or Mechanical
engineering (reference group = Mechanical engineering)
Class Standing
Sophomore, Junior, and Senior (including fifth-y than senior year) (reference group =
sophomore)
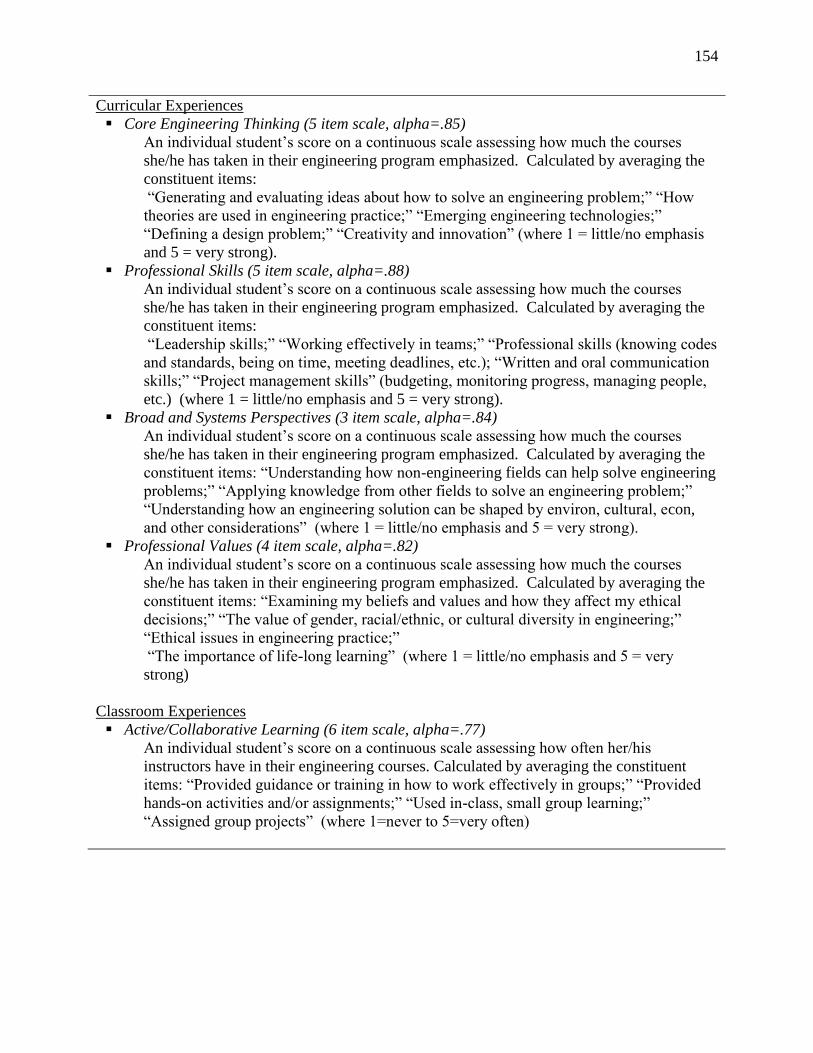
154
Curricular Experiences
Core Engineering Thinking (5 item scale, alpha=.85)
An individual student‘s score on a continuous scale assessing how much the courses
she/he has taken in their engineering program emphasized. Calculated by averaging the
constituent items:
―Generating and evaluating ideas about how to solve an engineering problem;‖ ―How
theories are used in engineering practice;‖ ―Emerging engineering technologies;‖
―Defining a design problem;‖ ―Creativity and innovation‖ (where 1 = little/no emphasis
and 5 = very strong).
Professional Skills (5 item scale, alpha=.88)
An individual student‘s score on a continuous scale assessing how much the courses
she/he has taken in their engineering program emphasized. Calculated by averaging the
constituent items:
―Leadership skills;‖ ―Working effectively in teams;‖ ―Professional skills (knowing codes
and standards, being on time, meeting deadlines, etc.); ―Written and oral communication
skills;‖ ―Project management skills‖ (budgeting, monitoring progress, managing people,
etc.) (where 1 = little/no emphasis and 5 = very strong).
Broad and Systems Perspectives (3 item scale, alpha=.84)
An individual student‘s score on a continuous scale assessing how much the courses
she/he has taken in their engineering program emphasized. Calculated by averaging the
constituent items: ―Understanding how non-engineering fields can help solve engineering
problems;‖ ―Applying knowledge from other fields to solve an engineering problem;‖
―Understanding how an engineering solution can be shaped by environ, cultural, econ,
and other considerations‖ (where 1 = little/no emphasis and 5 = very strong).
Professional Values (4 item scale, alpha=.82)
An individual student‘s score on a continuous scale assessing how much the courses
she/he has taken in their engineering program emphasized. Calculated by averaging the
constituent items: ―Examining my beliefs and values and how they affect my ethical
decisions;‖ ―The value of gender, racial/ethnic, or cultural diversity in engineering;‖
―Ethical issues in engineering practice;‖
―The importance of life-long learning‖ (where 1 = little/no emphasis and 5 = very
strong)
Classroom Experiences
Active/Collaborative Learning (6 item scale, alpha=.77)
An individual student‘s score on a continuous scale assessing how often her/his
instructors have in their engineering courses. Calculated by averaging the constituent
items: ―Provided guidance or training in how to work effectively in groups;‖ ―Provided
hands-on activities and/or assignments;‖ ―Used in-class, small group learning;‖
―Assigned group projects‖ (where 1=never to 5=very often)
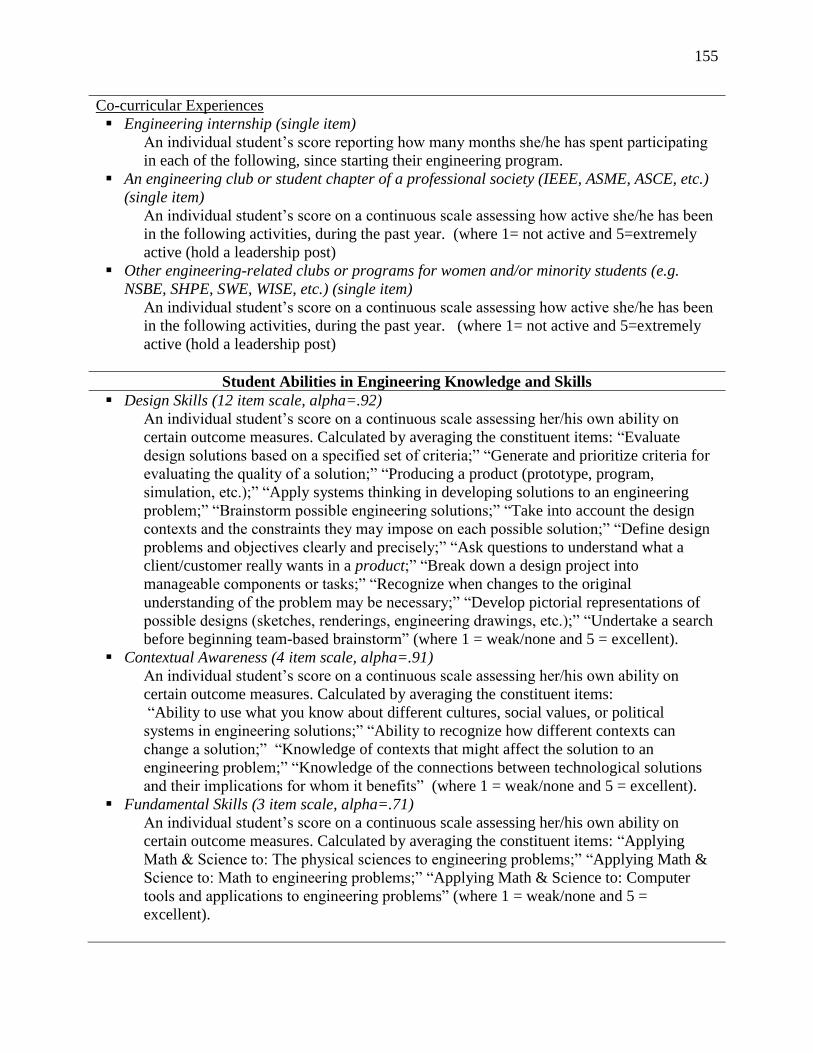
155
Co-curricular Experiences
Engineering internship (single item)
An individual student‘s score reporting how many months she/he has spent participating
in each of the following, since starting their engineering program.
An engineering club or student chapter of a professional society (IEEE, ASME, ASCE, etc.)
(single item)
An individual student‘s score on a continuous scale assessing how active she/he has been
in the following activities, during the past year. (where 1= not active and 5=extremely
active (hold a leadership post)
Other engineering-related clubs or programs for women and/or minority students (e.g.
NSBE, SHPE, SWE, WISE, etc.) (single item)
An individual student‘s score on a continuous scale assessing how active she/he has been
in the following activities, during the past year. (where 1= not active and 5=extremely
active (hold a leadership post)
Student Abilities in Engineering Knowledge and Skills
Design Skills (12 item scale, alpha=.92)
An individual student‘s score on a continuous scale assessing her/his own ability on
certain outcome measures. Calculated by averaging the constituent items: ―Evaluate
design solutions based on a specified set of criteria;‖ ―Generate and prioritize criteria for
evaluating the quality of a solution;‖ ―Producing a product (prototype, program,
simulation, etc.);‖ ―Apply systems thinking in developing solutions to an engineering
problem;‖ ―Brainstorm possible engineering solutions;‖ ―Take into account the design
contexts and the constraints they may impose on each possible solution;‖ ―Define design
problems and objectives clearly and precisely;‖ ―Ask questions to understand what a
client/customer really wants in a product;‖ ―Break down a design project into
manageable components or tasks;‖ ―Recognize when changes to the original
understanding of the problem may be necessary;‖ ―Develop pictorial representations of
possible designs (sketches, renderings, engineering drawings, etc.);‖ ―Undertake a search
before beginning team-based brainstorm‖ (where 1 = weak/none and 5 = excellent).
Contextual Awareness (4 item scale, alpha=.91)
An individual student‘s score on a continuous scale assessing her/his own ability on
certain outcome measures. Calculated by averaging the constituent items:
―Ability to use what you know about different cultures, social values, or political
systems in engineering solutions;‖ ―Ability to recognize how different contexts can
change a solution;‖ ―Knowledge of contexts that might affect the solution to an
engineering problem;‖ ―Knowledge of the connections between technological solutions
and their implications for whom it benefits‖ (where 1 = weak/none and 5 = excellent).
Fundamental Skills (3 item scale, alpha=.71)
An individual student‘s score on a continuous scale assessing her/his own ability on
certain outcome measures. Calculated by averaging the constituent items: ―Applying
Math & Science to: The physical sciences to engineering problems;‖ ―Applying Math &
Science to: Math to engineering problems;‖ ―Applying Math & Science to: Computer
tools and applications to engineering problems‖ (where 1 = weak/none and 5 =
excellent).

156
Student Post-graduation Plans
An individual student‘s score on a continuous scale assessing their plans in three year after
she/he graduates. (Where 1=definitely won‘t; 2=probably won‘t; 3=not sure; 4=probably will;
and 5=definitely will)
Be self-employed in engineering (single item)
Be a practicing engineer in industry, government, or non-profit organization (single item)
Work in engineering management or sales (single item)
Work outside engineering (single item)
Be in graduate school preparing to become an engineering faculty member (single item)
Be in graduate school in engineering preparing to work in industry, government, or non-
profit organization (single item)
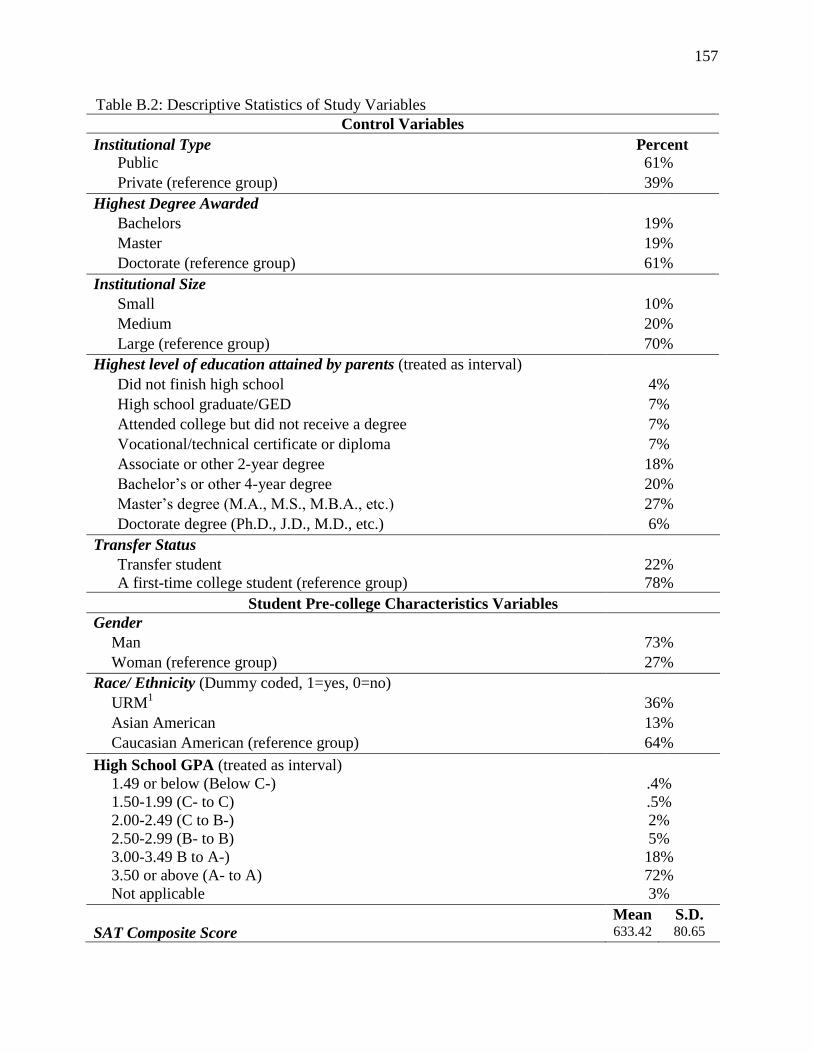
157
Table B.2: Descriptive Statistics of Study Variables
Control Variables
Institutional Type Percent Public 61%
Private (reference group) 39%
Highest Degree Awarded
Bachelors 19%
Master 19%
Doctorate (reference group) 61%
Institutional Size
Small 10%
Medium 20%
Large (reference group) 70%
Highest level of education attained by parents (treated as interval)
Did not finish high school 4%
High school graduate/GED 7%
Attended college but did not receive a degree 7%
Vocational/technical certificate or diploma 7%
Associate or other 2-year degree 18%
Bachelor‘s or other 4-year degree 20%
Master‘s degree (M.A., M.S., M.B.A., etc.) 27%
Doctorate degree (Ph.D., J.D., M.D., etc.) 6%
Transfer Status
Transfer student 22%
A first-time college student (reference group) 78%
Student Pre-college Characteristics Variables
Gender
Man 73%
Woman (reference group) 27%
Race/ Ethnicity (Dummy coded, 1=yes, 0=no)
URM1 36%
Asian American 13%
Caucasian American (reference group) 64%
High School GPA (treated as interval)
1.49 or below (Below C-) .4%
1.50-1.99 (C- to C) .5%
2.00-2.49 (C to B-) 2%
2.50-2.99 (B- to B) 5%
3.00-3.49 B to A-) 18%
3.50 or above (A- to A) 72%
Not applicable 3%
Mean S.D.
SAT Composite Score 633.42 80.65
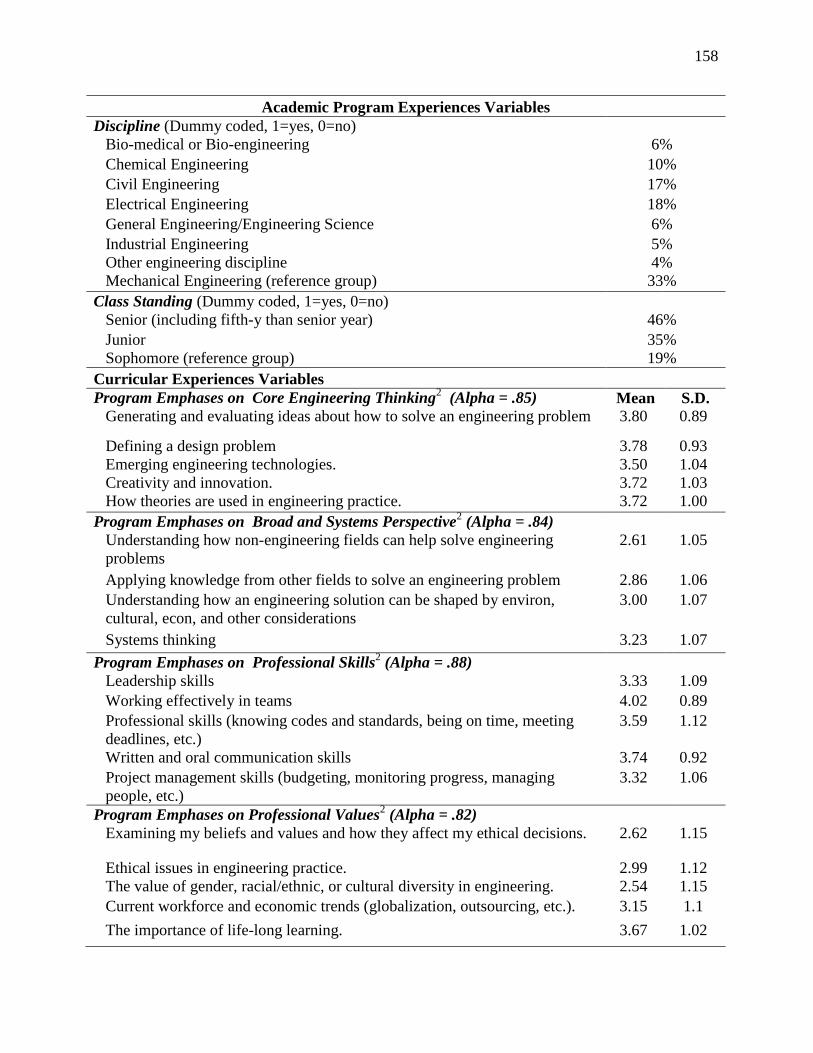
158
Academic Program Experiences Variables
Discipline (Dummy coded, 1=yes, 0=no)
Bio-medical or Bio-engineering 6%
Chemical Engineering 10%
Civil Engineering 17%
Electrical Engineering 18%
General Engineering/Engineering Science 6%
Industrial Engineering 5%
Other engineering discipline 4%
Mechanical Engineering (reference group) 33%
Class Standing (Dummy coded, 1=yes, 0=no)
Senior (including fifth-y than senior year) 46%
Junior 35%
Sophomore (reference group) 19%
Curricular Experiences Variables
Program Emphases on Core Engineering Thinking2 (Alpha = .85) Mean S.D.
Generating and evaluating ideas about how to solve an engineering problem 3.80 0.89
Defining a design problem 3.78 0.93
Emerging engineering technologies. 3.50 1.04
Creativity and innovation. 3.72 1.03
How theories are used in engineering practice. 3.72 1.00
Program Emphases on Broad and Systems Perspective2 (Alpha = .84)
Understanding how non-engineering fields can help solve engineering
problems
2.61 1.05
Applying knowledge from other fields to solve an engineering problem 2.86 1.06
Understanding how an engineering solution can be shaped by environ,
cultural, econ, and other considerations
3.00 1.07
Systems thinking 3.23 1.07
Program Emphases on Professional Skills2 (Alpha = .88)
Leadership skills 3.33 1.09
Working effectively in teams 4.02 0.89
Professional skills (knowing codes and standards, being on time, meeting
deadlines, etc.)
3.59 1.12
Written and oral communication skills 3.74 0.92
Project management skills (budgeting, monitoring progress, managing
people, etc.)
3.32 1.06
Program Emphases on Professional Values2 (Alpha = .82)
Examining my beliefs and values and how they affect my ethical decisions. 2.62 1.15
Ethical issues in engineering practice. 2.99 1.12
The value of gender, racial/ethnic, or cultural diversity in engineering. 2.54 1.15
Current workforce and economic trends (globalization, outsourcing, etc.). 3.15 1.1
The importance of life-long learning. 3.67 1.02
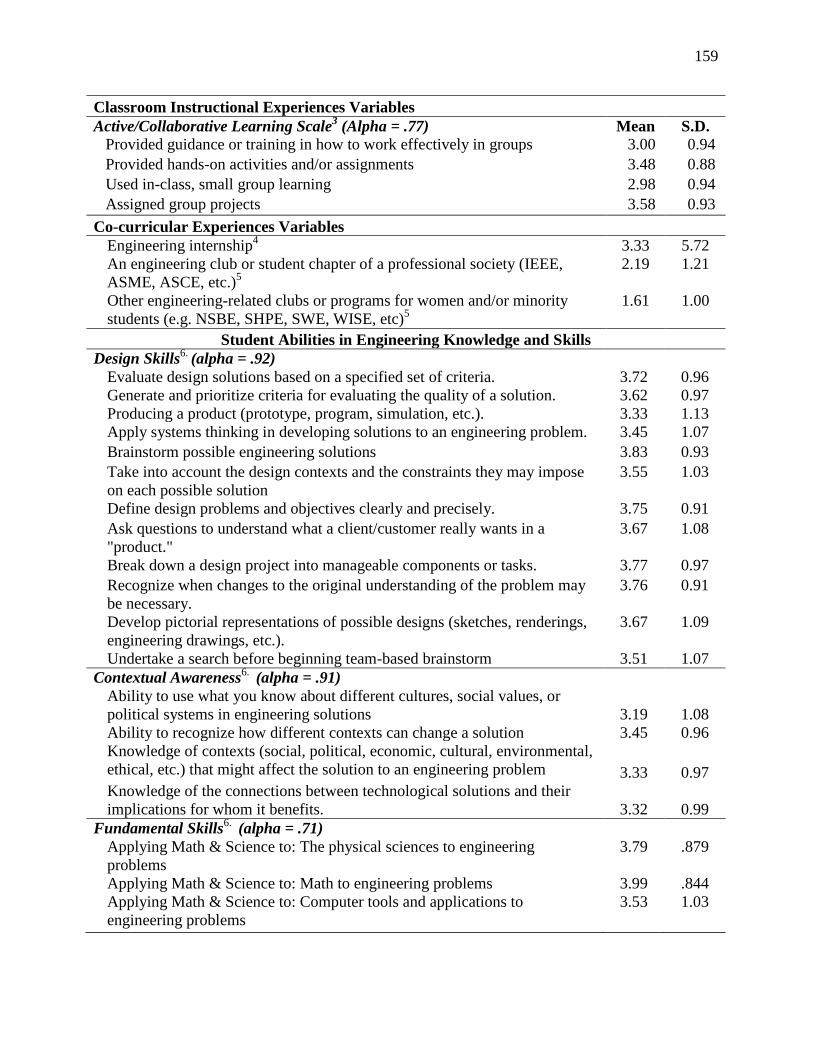
159
Classroom Instructional Experiences Variables
Active/Collaborative Learning Scale3 (Alpha = .77) Mean S.D.
Provided guidance or training in how to work effectively in groups 3.00 0.94
Provided hands-on activities and/or assignments 3.48 0.88
Used in-class, small group learning 2.98 0.94
Assigned group projects 3.58 0.93
Co-curricular Experiences Variables
Engineering internship4 3.33 5.72
An engineering club or student chapter of a professional society (IEEE,
ASME, ASCE, etc.)5
2.19 1.21
Other engineering-related clubs or programs for women and/or minority
students (e.g. NSBE, SHPE, SWE, WISE, etc)5
1.61 1.00
Student Abilities in Engineering Knowledge and Skills
Design Skills6.
(alpha = .92)
Evaluate design solutions based on a specified set of criteria. 3.72 0.96
Generate and prioritize criteria for evaluating the quality of a solution. 3.62 0.97
Producing a product (prototype, program, simulation, etc.). 3.33 1.13
Apply systems thinking in developing solutions to an engineering problem. 3.45 1.07
Brainstorm possible engineering solutions 3.83 0.93
Take into account the design contexts and the constraints they may impose
on each possible solution
3.55 1.03
Define design problems and objectives clearly and precisely. 3.75 0.91
Ask questions to understand what a client/customer really wants in a
"product."
3.67 1.08
Break down a design project into manageable components or tasks. 3.77 0.97
Recognize when changes to the original understanding of the problem may
be necessary.
3.76 0.91
Develop pictorial representations of possible designs (sketches, renderings,
engineering drawings, etc.).
3.67 1.09
Undertake a search before beginning team-based brainstorm 3.51 1.07
Contextual Awareness6.
(alpha = .91)
Ability to use what you know about different cultures, social values, or
political systems in engineering solutions 3.19 1.08
Ability to recognize how different contexts can change a solution 3.45 0.96
Knowledge of contexts (social, political, economic, cultural, environmental,
ethical, etc.) that might affect the solution to an engineering problem 3.33 0.97
Knowledge of the connections between technological solutions and their
implications for whom it benefits. 3.32 0.99
Fundamental Skills6.
(alpha = .71)
Applying Math & Science to: The physical sciences to engineering
problems
3.79 .879
Applying Math & Science to: Math to engineering problems 3.99 .844
Applying Math & Science to: Computer tools and applications to
engineering problems
3.53 1.03
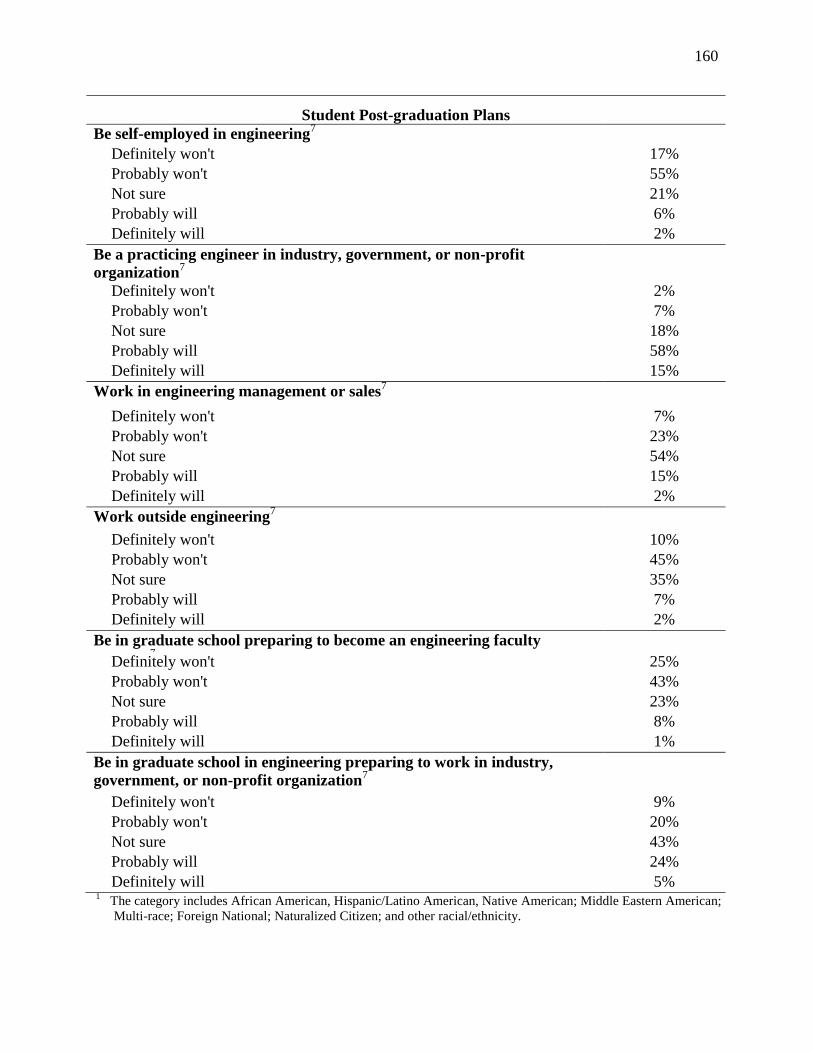
160
Student Post-graduation Plans
Be self-employed in engineering7
Definitely won't 17%
Probably won't 55%
Not sure 21%
Probably will 6%
Definitely will 2%
Be a practicing engineer in industry, government, or non-profit
organization7
Definitely won't 2%
Probably won't 7%
Not sure 18%
Probably will 58%
Definitely will 15%
Work in engineering management or sales7
Definitely won't 7%
Probably won't 23%
Not sure 54%
Probably will 15%
Definitely will 2%
Work outside engineering7
Definitely won't 10%
Probably won't 45%
Not sure 35%
Probably will 7%
Definitely will 2%
Be in graduate school preparing to become an engineering faculty
member7 Definitely won't 25%
Probably won't 43%
Not sure 23%
Probably will 8%
Definitely will 1%
Be in graduate school in engineering preparing to work in industry,
government, or non-profit organization7
Definitely won't 9%
Probably won't 20%
Not sure 43%
Probably will 24%
Definitely will 5% 1 The category includes African American, Hispanic/Latino American, Native American; Middle Eastern American;
Multi-race; Foreign National; Naturalized Citizen; and other racial/ethnicity.
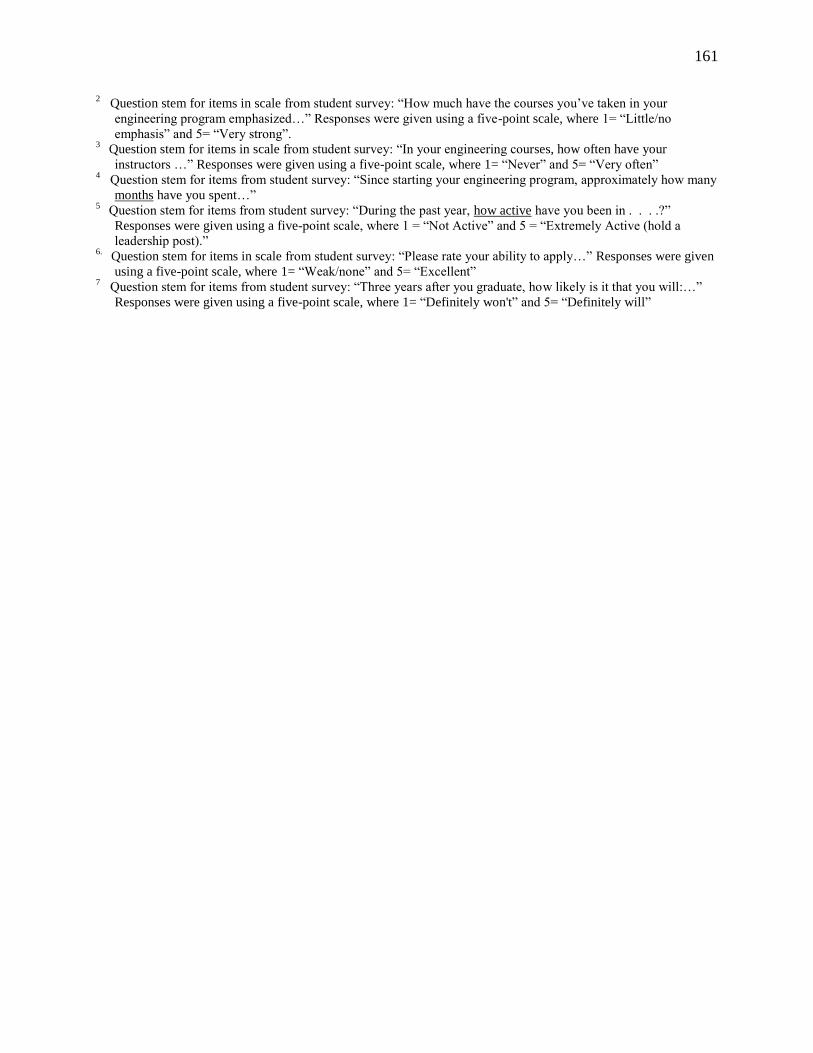
161
2 Question stem for items in scale from student survey: ―How much have the courses you‘ve taken in your
engineering program emphasized…‖ Responses were given using a five-point scale, where 1= ―Little/no
emphasis‖ and 5= ―Very strong‖. 3
Question stem for items in scale from student survey: ―In your engineering courses, how often have your
instructors …‖ Responses were given using a five-point scale, where 1= ―Never‖ and 5= ―Very often‖ 4
Question stem for items from student survey: ―Since starting your engineering program, approximately how many
months have you spent…‖
5 Question stem for items from student survey: ―During the past year, how active have you been in . . . .?‖
Responses were given using a five-point scale, where 1 = ―Not Active‖ and 5 = ―Extremely Active (hold a
leadership post).‖ 6.
Question stem for items in scale from student survey: ―Please rate your ability to apply…‖ Responses were given
using a five-point scale, where 1= ―Weak/none‖ and 5= ―Excellent‖
7 Question stem for items from student survey: ―Three years after you graduate, how likely is it that you will:…‖
Responses were given using a five-point scale, where 1= ―Definitely won't‖ and 5= ―Definitely will‖

162
Appendix C
OBSERVED AND PREDICTED OUTCOMES FOR THE MULTINOMIAL LOGISTIC
MODEL OF POST-GRADUATION PLANS
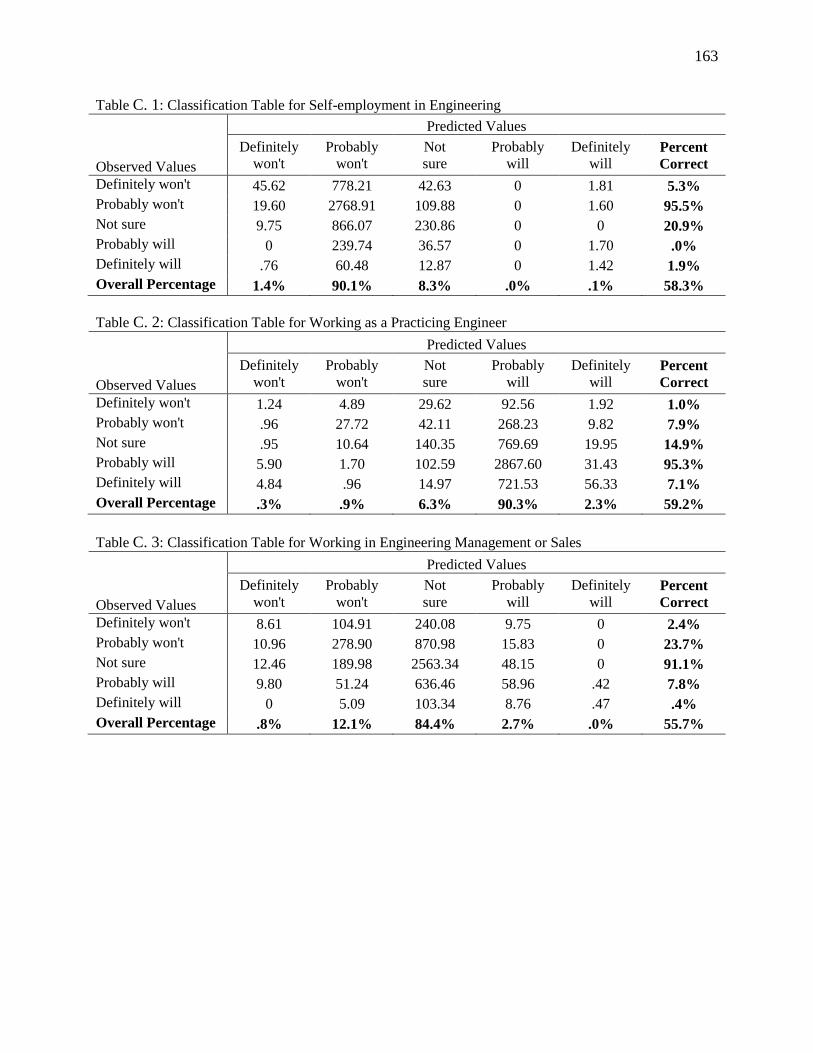
163
Table C. 1: Classification Table for Self-employment in Engineering
Observed Values
Predicted Values
Definitely
won't Probably
won't Not sure
Probably
will Definitely
will Percent
Correct
Definitely won't 45.62 778.21 42.63 0 1.81 5.3%
Probably won't 19.60 2768.91 109.88 0 1.60 95.5%
Not sure 9.75 866.07 230.86 0 0 20.9%
Probably will 0 239.74 36.57 0 1.70 .0%
Definitely will .76 60.48 12.87 0 1.42 1.9%
Overall Percentage 1.4% 90.1% 8.3% .0% .1% 58.3%
Table C. 2: Classification Table for Working as a Practicing Engineer
Observed Values
Predicted Values
Definitely
won't Probably
won't Not sure
Probably
will Definitely
will Percent
Correct
Definitely won't 1.24 4.89 29.62 92.56 1.92 1.0%
Probably won't .96 27.72 42.11 268.23 9.82 7.9%
Not sure .95 10.64 140.35 769.69 19.95 14.9%
Probably will 5.90 1.70 102.59 2867.60 31.43 95.3%
Definitely will 4.84 .96 14.97 721.53 56.33 7.1%
Overall Percentage .3% .9% 6.3% 90.3% 2.3% 59.2%
Table C. 3: Classification Table for Working in Engineering Management or Sales
Observed Values
Predicted Values
Definitely
won't Probably
won't Not sure
Probably
will Definitely
will Percent
Correct
Definitely won't 8.61 104.91 240.08 9.75 0 2.4%
Probably won't 10.96 278.90 870.98 15.83 0 23.7%
Not sure 12.46 189.98 2563.34 48.15 0 91.1%
Probably will 9.80 51.24 636.46 58.96 .42 7.8%
Definitely will 0 5.09 103.34 8.76 .47 .4%
Overall Percentage .8% 12.1% 84.4% 2.7% .0% 55.7%
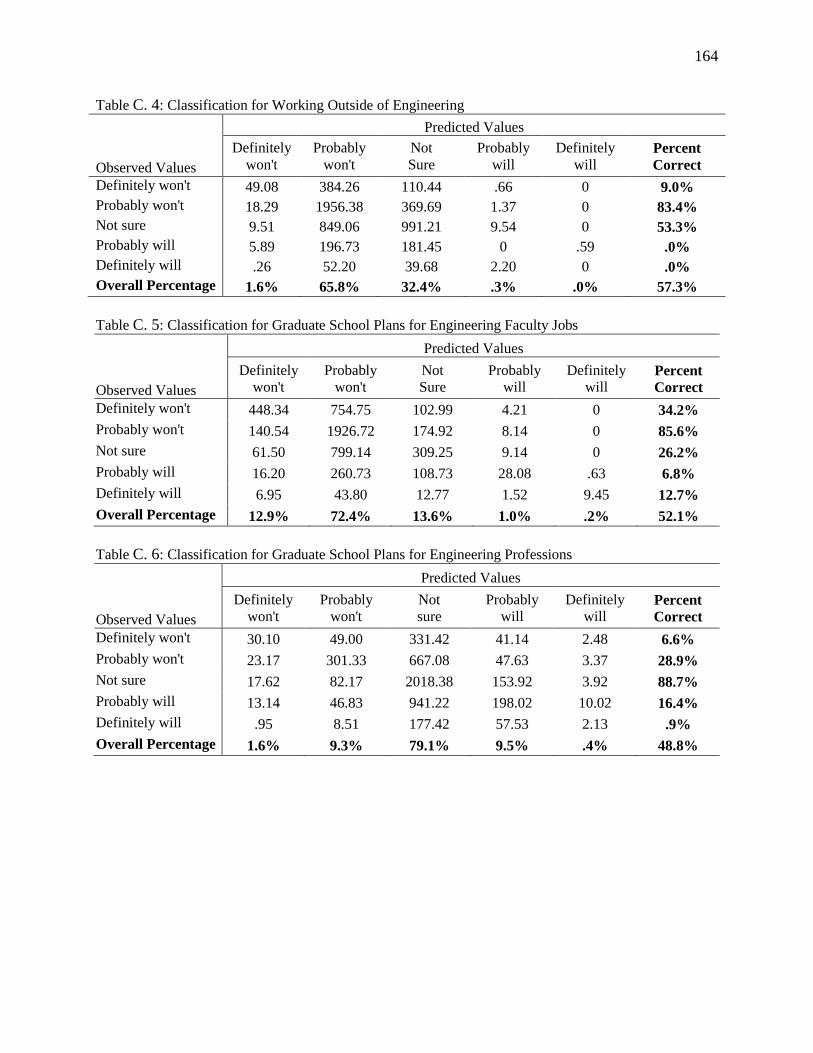
164
Table C. 4: Classification for Working Outside of Engineering
Observed Values
Predicted Values
Definitely
won't Probably
won't Not Sure
Probably
will Definitely
will Percent
Correct
Definitely won't 49.08 384.26 110.44 .66 0 9.0%
Probably won't 18.29 1956.38 369.69 1.37 0 83.4%
Not sure 9.51 849.06 991.21 9.54 0 53.3%
Probably will 5.89 196.73 181.45 0 .59 .0%
Definitely will .26 52.20 39.68 2.20 0 .0%
Overall Percentage 1.6% 65.8% 32.4% .3% .0% 57.3%
Table C. 5: Classification for Graduate School Plans for Engineering Faculty Jobs
Observed Values
Predicted Values
Definitely
won't Probably
won't Not Sure
Probably will
Definitely
will Percent
Correct
Definitely won't 448.34 754.75 102.99 4.21 0 34.2%
Probably won't 140.54 1926.72 174.92 8.14 0 85.6%
Not sure 61.50 799.14 309.25 9.14 0 26.2%
Probably will 16.20 260.73 108.73 28.08 .63 6.8%
Definitely will 6.95 43.80 12.77 1.52 9.45 12.7%
Overall Percentage 12.9% 72.4% 13.6% 1.0% .2% 52.1%
Table C. 6: Classification for Graduate School Plans for Engineering Professions
Observed Values
Predicted Values
Definitely
won't Probably
won't Not sure
Probably will
Definitely
will Percent
Correct
Definitely won't 30.10 49.00 331.42 41.14 2.48 6.6%
Probably won't 23.17 301.33 667.08 47.63 3.37 28.9%
Not sure 17.62 82.17 2018.38 153.92 3.92 88.7%
Probably will 13.14 46.83 941.22 198.02 10.02 16.4%
Definitely will .95 8.51 177.42 57.53 2.13 .9%
Overall Percentage 1.6% 9.3% 79.1% 9.5% .4% 48.8%
Appendix D
MULTINOMIAL LOGISTIC REGRESSION ANALYSES
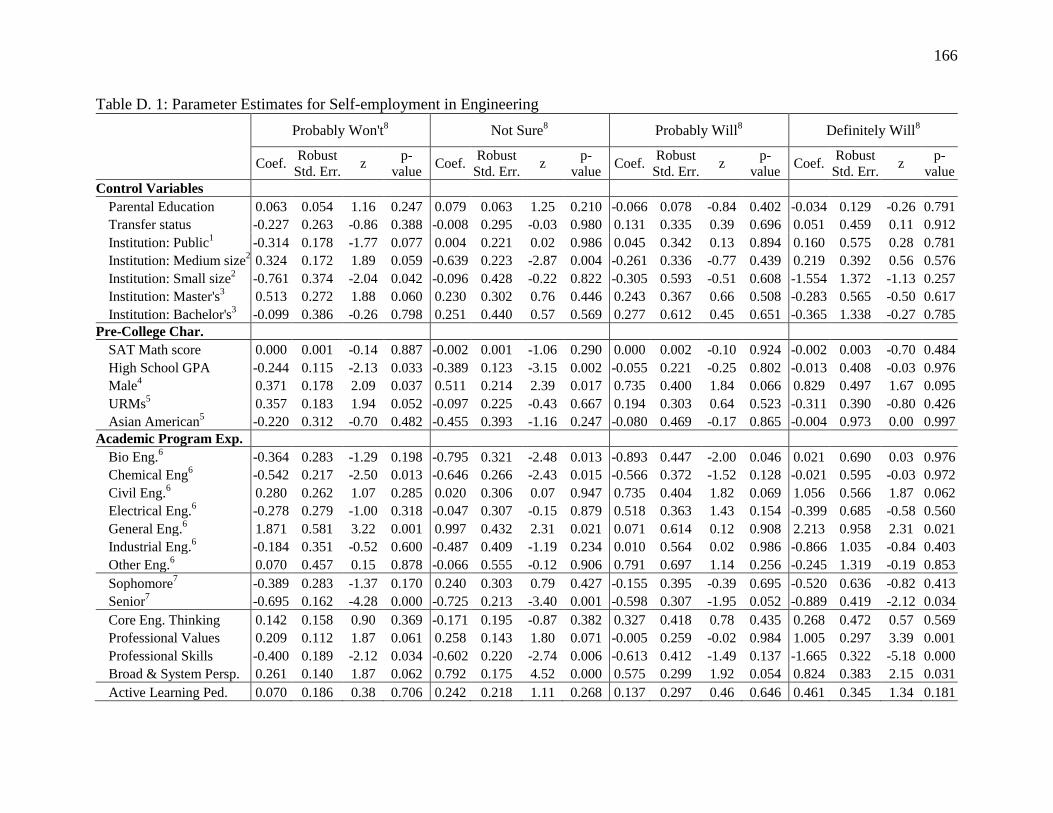
166
Table D. 1: Parameter Estimates for Self-employment in Engineering
Probably Won't8 Not Sure
8 Probably Will8 Definitely Will
8
Coef. Robust
Std. Err. z
p-
value Coef.
Robust
Std. Err. z
p-
value Coef.
Robust
Std. Err. z
p-
value Coef.
Robust
Std. Err. z
p-
value
Control Variables
Parental Education 0.063 0.054 1.16 0.247 0.079 0.063 1.25 0.210 -0.066 0.078 -0.84 0.402 -0.034 0.129 -0.26 0.791
Transfer status -0.227 0.263 -0.86 0.388 -0.008 0.295 -0.03 0.980 0.131 0.335 0.39 0.696 0.051 0.459 0.11 0.912
Institution: Public1 -0.314 0.178 -1.77 0.077 0.004 0.221 0.02 0.986 0.045 0.342 0.13 0.894 0.160 0.575 0.28 0.781
Institution: Medium size2 0.324 0.172 1.89 0.059 -0.639 0.223 -2.87 0.004 -0.261 0.336 -0.77 0.439 0.219 0.392 0.56 0.576
Institution: Small size2 -0.761 0.374 -2.04 0.042 -0.096 0.428 -0.22 0.822 -0.305 0.593 -0.51 0.608 -1.554 1.372 -1.13 0.257
Institution: Master's3 0.513 0.272 1.88 0.060 0.230 0.302 0.76 0.446 0.243 0.367 0.66 0.508 -0.283 0.565 -0.50 0.617
Institution: Bachelor's3 -0.099 0.386 -0.26 0.798 0.251 0.440 0.57 0.569 0.277 0.612 0.45 0.651 -0.365 1.338 -0.27 0.785
Pre-College Char. SAT Math score 0.000 0.001 -0.14 0.887 -0.002 0.001 -1.06 0.290 0.000 0.002 -0.10 0.924 -0.002 0.003 -0.70 0.484
High School GPA -0.244 0.115 -2.13 0.033 -0.389 0.123 -3.15 0.002 -0.055 0.221 -0.25 0.802 -0.013 0.408 -0.03 0.976
Male4 0.371 0.178 2.09 0.037 0.511 0.214 2.39 0.017 0.735 0.400 1.84 0.066 0.829 0.497 1.67 0.095
URMs5 0.357 0.183 1.94 0.052 -0.097 0.225 -0.43 0.667 0.194 0.303 0.64 0.523 -0.311 0.390 -0.80 0.426
Asian American5 -0.220 0.312 -0.70 0.482 -0.455 0.393 -1.16 0.247 -0.080 0.469 -0.17 0.865 -0.004 0.973 0.00 0.997
Academic Program Exp.
Bio Eng.6 -0.364 0.283 -1.29 0.198 -0.795 0.321 -2.48 0.013 -0.893 0.447 -2.00 0.046 0.021 0.690 0.03 0.976
Chemical Eng6 -0.542 0.217 -2.50 0.013 -0.646 0.266 -2.43 0.015 -0.566 0.372 -1.52 0.128 -0.021 0.595 -0.03 0.972
Civil Eng.6 0.280 0.262 1.07 0.285 0.020 0.306 0.07 0.947 0.735 0.404 1.82 0.069 1.056 0.566 1.87 0.062
Electrical Eng.6 -0.278 0.279 -1.00 0.318 -0.047 0.307 -0.15 0.879 0.518 0.363 1.43 0.154 -0.399 0.685 -0.58 0.560
General Eng.6 1.871 0.581 3.22 0.001 0.997 0.432 2.31 0.021 0.071 0.614 0.12 0.908 2.213 0.958 2.31 0.021
Industrial Eng.6 -0.184 0.351 -0.52 0.600 -0.487 0.409 -1.19 0.234 0.010 0.564 0.02 0.986 -0.866 1.035 -0.84 0.403
Other Eng.6 0.070 0.457 0.15 0.878 -0.066 0.555 -0.12 0.906 0.791 0.697 1.14 0.256 -0.245 1.319 -0.19 0.853
Sophomore7 -0.389 0.283 -1.37 0.170 0.240 0.303 0.79 0.427 -0.155 0.395 -0.39 0.695 -0.520 0.636 -0.82 0.413
Senior7 -0.695 0.162 -4.28 0.000 -0.725 0.213 -3.40 0.001 -0.598 0.307 -1.95 0.052 -0.889 0.419 -2.12 0.034
Core Eng. Thinking 0.142 0.158 0.90 0.369 -0.171 0.195 -0.87 0.382 0.327 0.418 0.78 0.435 0.268 0.472 0.57 0.569
Professional Values 0.209 0.112 1.87 0.061 0.258 0.143 1.80 0.071 -0.005 0.259 -0.02 0.984 1.005 0.297 3.39 0.001
Professional Skills -0.400 0.189 -2.12 0.034 -0.602 0.220 -2.74 0.006 -0.613 0.412 -1.49 0.137 -1.665 0.322 -5.18 0.000
Broad & System Persp. 0.261 0.140 1.87 0.062 0.792 0.175 4.52 0.000 0.575 0.299 1.92 0.054 0.824 0.383 2.15 0.031
Active Learning Ped. 0.070 0.186 0.38 0.706 0.242 0.218 1.11 0.268 0.137 0.297 0.46 0.646 0.461 0.345 1.34 0.181
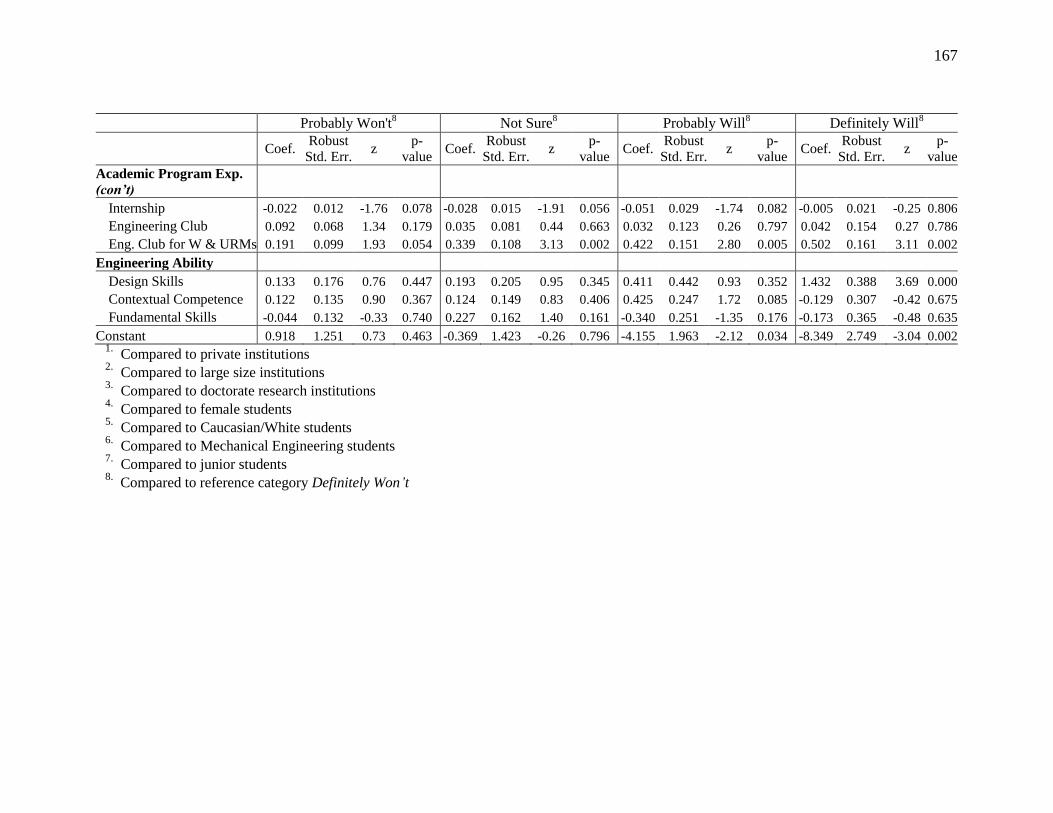
167
Probably Won't8 Not Sure
8 Probably Will8 Definitely Will
8
Coef. Robust
Std. Err. z
p-
value Coef.
Robust
Std. Err. z
p-
value Coef.
Robust
Std. Err. z
p-
value Coef.
Robust
Std. Err. z
p-
value
Academic Program Exp.
(con’t) Internship -0.022 0.012 -1.76 0.078 -0.028 0.015 -1.91 0.056 -0.051 0.029 -1.74 0.082 -0.005 0.021 -0.25 0.806
Engineering Club 0.092 0.068 1.34 0.179 0.035 0.081 0.44 0.663 0.032 0.123 0.26 0.797 0.042 0.154 0.27 0.786
Eng. Club for W & URMs 0.191 0.099 1.93 0.054 0.339 0.108 3.13 0.002 0.422 0.151 2.80 0.005 0.502 0.161 3.11 0.002
Engineering Ability Design Skills 0.133 0.176 0.76 0.447 0.193 0.205 0.95 0.345 0.411 0.442 0.93 0.352 1.432 0.388 3.69 0.000
Contextual Competence 0.122 0.135 0.90 0.367 0.124 0.149 0.83 0.406 0.425 0.247 1.72 0.085 -0.129 0.307 -0.42 0.675
Fundamental Skills -0.044 0.132 -0.33 0.740 0.227 0.162 1.40 0.161 -0.340 0.251 -1.35 0.176 -0.173 0.365 -0.48 0.635
Constant 0.918 1.251 0.73 0.463 -0.369 1.423 -0.26 0.796 -4.155 1.963 -2.12 0.034 -8.349 2.749 -3.04 0.002 1.
Compared to private institutions 2.
Compared to large size institutions 3.
Compared to doctorate research institutions 4.
Compared to female students 5.
Compared to Caucasian/White students 6.
Compared to Mechanical Engineering students 7.
Compared to junior students 8.
Compared to reference category Definitely Won’t
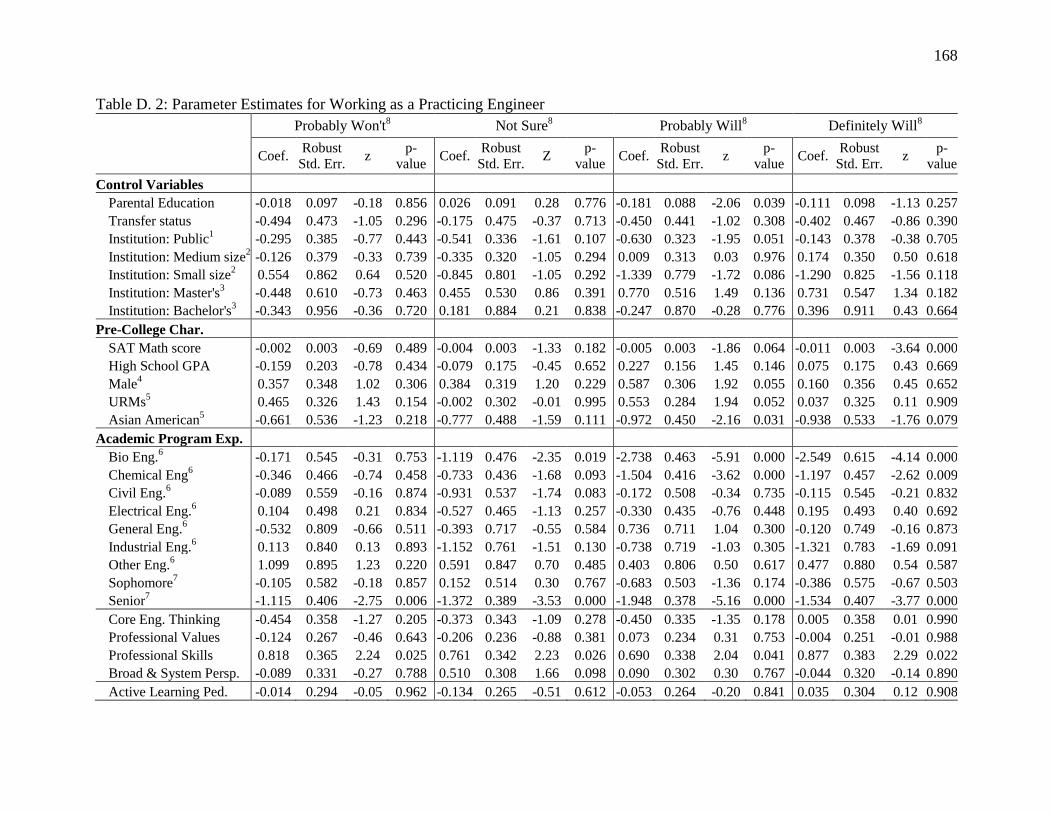
168
Table D. 2: Parameter Estimates for Working as a Practicing Engineer
Probably Won't8 Not Sure
8 Probably Will8 Definitely Will
8
Coef. Robust
Std. Err. z
p-
value Coef.
Robust
Std. Err. Z
p-
value Coef.
Robust
Std. Err. z
p-
value Coef.
Robust
Std. Err. z
p-
value
Control Variables Parental Education -0.018 0.097 -0.18 0.856 0.026 0.091 0.28 0.776 -0.181 0.088 -2.06 0.039 -0.111 0.098 -1.13 0.257
Transfer status -0.494 0.473 -1.05 0.296 -0.175 0.475 -0.37 0.713 -0.450 0.441 -1.02 0.308 -0.402 0.467 -0.86 0.390
Institution: Public1 -0.295 0.385 -0.77 0.443 -0.541 0.336 -1.61 0.107 -0.630 0.323 -1.95 0.051 -0.143 0.378 -0.38 0.705
Institution: Medium size2 -0.126 0.379 -0.33 0.739 -0.335 0.320 -1.05 0.294 0.009 0.313 0.03 0.976 0.174 0.350 0.50 0.618
Institution: Small size2 0.554 0.862 0.64 0.520 -0.845 0.801 -1.05 0.292 -1.339 0.779 -1.72 0.086 -1.290 0.825 -1.56 0.118
Institution: Master's3 -0.448 0.610 -0.73 0.463 0.455 0.530 0.86 0.391 0.770 0.516 1.49 0.136 0.731 0.547 1.34 0.182
Institution: Bachelor's3 -0.343 0.956 -0.36 0.720 0.181 0.884 0.21 0.838 -0.247 0.870 -0.28 0.776 0.396 0.911 0.43 0.664
Pre-College Char.
SAT Math score -0.002 0.003 -0.69 0.489 -0.004 0.003 -1.33 0.182 -0.005 0.003 -1.86 0.064 -0.011 0.003 -3.64 0.000
High School GPA -0.159 0.203 -0.78 0.434 -0.079 0.175 -0.45 0.652 0.227 0.156 1.45 0.146 0.075 0.175 0.43 0.669
Male4 0.357 0.348 1.02 0.306 0.384 0.319 1.20 0.229 0.587 0.306 1.92 0.055 0.160 0.356 0.45 0.652
URMs5 0.465 0.326 1.43 0.154 -0.002 0.302 -0.01 0.995 0.553 0.284 1.94 0.052 0.037 0.325 0.11 0.909
Asian American5 -0.661 0.536 -1.23 0.218 -0.777 0.488 -1.59 0.111 -0.972 0.450 -2.16 0.031 -0.938 0.533 -1.76 0.079
Academic Program Exp.
Bio Eng.6 -0.171 0.545 -0.31 0.753 -1.119 0.476 -2.35 0.019 -2.738 0.463 -5.91 0.000 -2.549 0.615 -4.14 0.000
Chemical Eng6 -0.346 0.466 -0.74 0.458 -0.733 0.436 -1.68 0.093 -1.504 0.416 -3.62 0.000 -1.197 0.457 -2.62 0.009
Civil Eng.6 -0.089 0.559 -0.16 0.874 -0.931 0.537 -1.74 0.083 -0.172 0.508 -0.34 0.735 -0.115 0.545 -0.21 0.832
Electrical Eng.6 0.104 0.498 0.21 0.834 -0.527 0.465 -1.13 0.257 -0.330 0.435 -0.76 0.448 0.195 0.493 0.40 0.692
General Eng.6 -0.532 0.809 -0.66 0.511 -0.393 0.717 -0.55 0.584 0.736 0.711 1.04 0.300 -0.120 0.749 -0.16 0.873
Industrial Eng.6 0.113 0.840 0.13 0.893 -1.152 0.761 -1.51 0.130 -0.738 0.719 -1.03 0.305 -1.321 0.783 -1.69 0.091
Other Eng.6 1.099 0.895 1.23 0.220 0.591 0.847 0.70 0.485 0.403 0.806 0.50 0.617 0.477 0.880 0.54 0.587
Sophomore7 -0.105 0.582 -0.18 0.857 0.152 0.514 0.30 0.767 -0.683 0.503 -1.36 0.174 -0.386 0.575 -0.67 0.503
Senior7 -1.115 0.406 -2.75 0.006 -1.372 0.389 -3.53 0.000 -1.948 0.378 -5.16 0.000 -1.534 0.407 -3.77 0.000
Core Eng. Thinking -0.454 0.358 -1.27 0.205 -0.373 0.343 -1.09 0.278 -0.450 0.335 -1.35 0.178 0.005 0.358 0.01 0.990
Professional Values -0.124 0.267 -0.46 0.643 -0.206 0.236 -0.88 0.381 0.073 0.234 0.31 0.753 -0.004 0.251 -0.01 0.988
Professional Skills 0.818 0.365 2.24 0.025 0.761 0.342 2.23 0.026 0.690 0.338 2.04 0.041 0.877 0.383 2.29 0.022
Broad & System Persp. -0.089 0.331 -0.27 0.788 0.510 0.308 1.66 0.098 0.090 0.302 0.30 0.767 -0.044 0.320 -0.14 0.890
Active Learning Ped. -0.014 0.294 -0.05 0.962 -0.134 0.265 -0.51 0.612 -0.053 0.264 -0.20 0.841 0.035 0.304 0.12 0.908
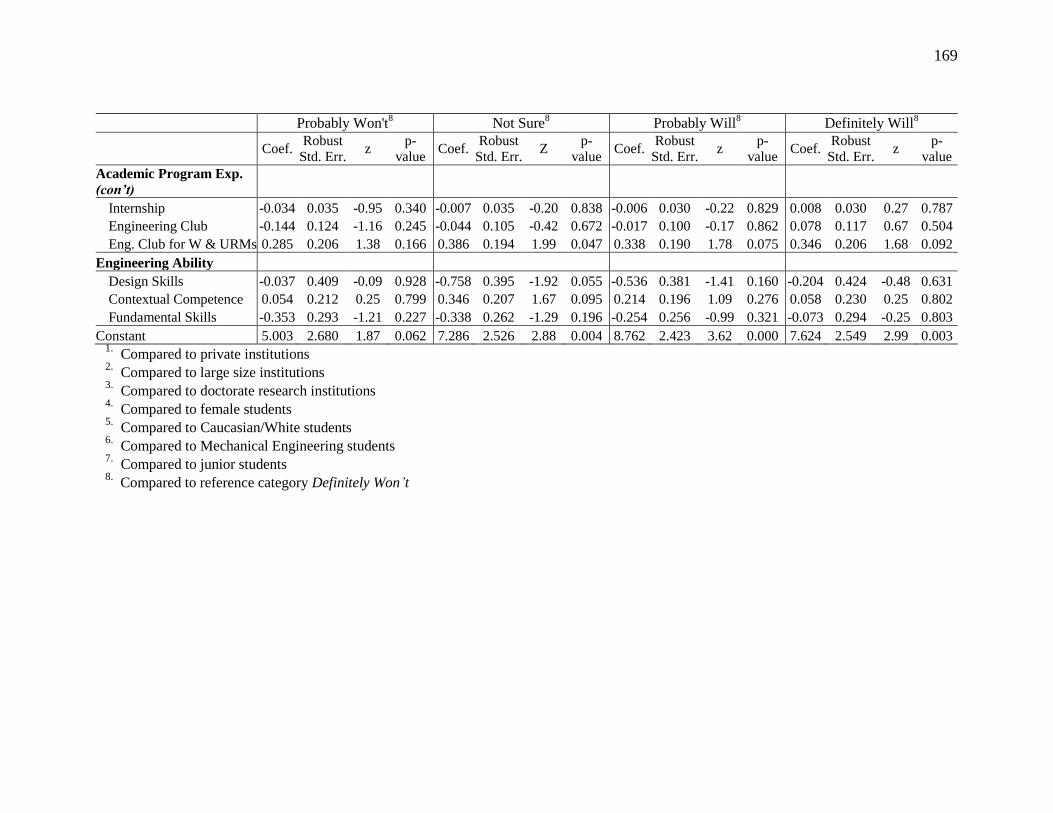
169
Probably Won't8 Not Sure
8 Probably Will8 Definitely Will
8
Coef. Robust
Std. Err. z
p-
value Coef.
Robust
Std. Err. Z
p-
value Coef.
Robust
Std. Err. z
p-
value Coef.
Robust
Std. Err. z
p-
value
Academic Program Exp.
(con’t) Internship -0.034 0.035 -0.95 0.340 -0.007 0.035 -0.20 0.838 -0.006 0.030 -0.22 0.829 0.008 0.030 0.27 0.787
Engineering Club -0.144 0.124 -1.16 0.245 -0.044 0.105 -0.42 0.672 -0.017 0.100 -0.17 0.862 0.078 0.117 0.67 0.504
Eng. Club for W & URMs 0.285 0.206 1.38 0.166 0.386 0.194 1.99 0.047 0.338 0.190 1.78 0.075 0.346 0.206 1.68 0.092
Engineering Ability
Design Skills -0.037 0.409 -0.09 0.928 -0.758 0.395 -1.92 0.055 -0.536 0.381 -1.41 0.160 -0.204 0.424 -0.48 0.631
Contextual Competence 0.054 0.212 0.25 0.799 0.346 0.207 1.67 0.095 0.214 0.196 1.09 0.276 0.058 0.230 0.25 0.802
Fundamental Skills -0.353 0.293 -1.21 0.227 -0.338 0.262 -1.29 0.196 -0.254 0.256 -0.99 0.321 -0.073 0.294 -0.25 0.803
Constant 5.003 2.680 1.87 0.062 7.286 2.526 2.88 0.004 8.762 2.423 3.62 0.000 7.624 2.549 2.99 0.003 1.
Compared to private institutions 2.
Compared to large size institutions 3.
Compared to doctorate research institutions 4.
Compared to female students 5.
Compared to Caucasian/White students 6.
Compared to Mechanical Engineering students 7.
Compared to junior students 8.
Compared to reference category Definitely Won’t
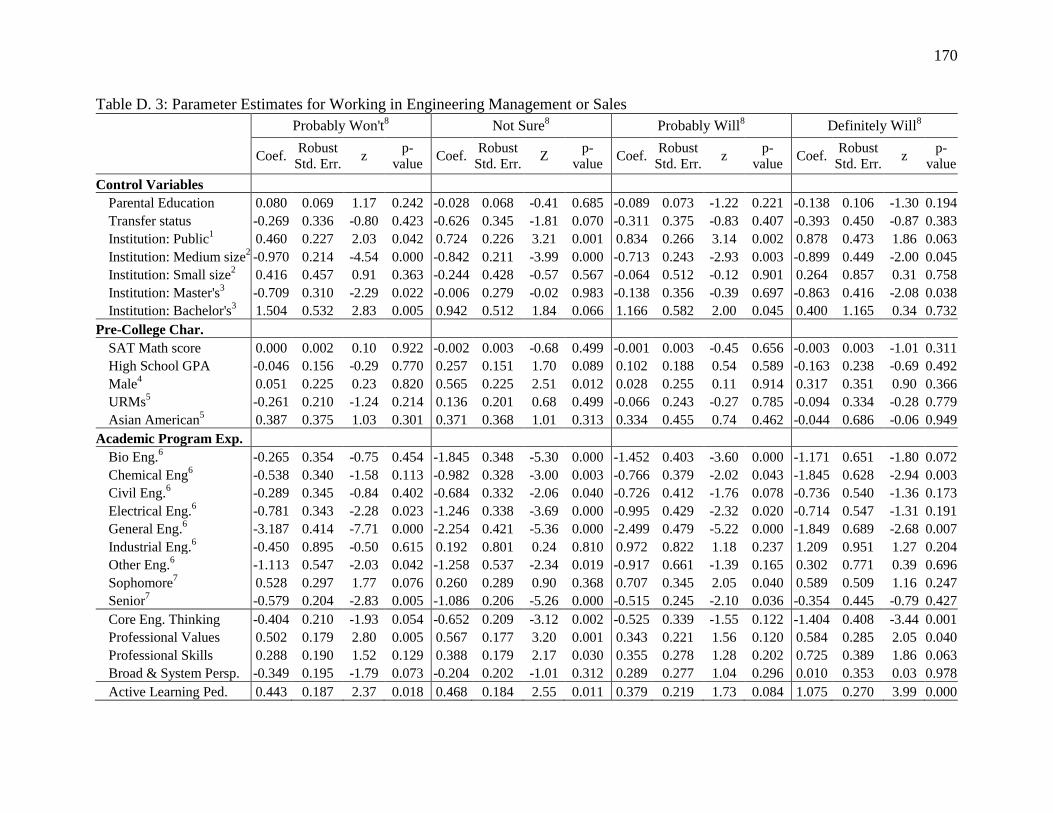
170
Table D. 3: Parameter Estimates for Working in Engineering Management or Sales
Probably Won't8 Not Sure
8 Probably Will8 Definitely Will
8
Coef. Robust
Std. Err. z
p-
value Coef.
Robust
Std. Err. Z
p-
value Coef.
Robust
Std. Err. z
p-
value Coef.
Robust
Std. Err. z
p-
value
Control Variables Parental Education 0.080 0.069 1.17 0.242 -0.028 0.068 -0.41 0.685 -0.089 0.073 -1.22 0.221 -0.138 0.106 -1.30 0.194
Transfer status -0.269 0.336 -0.80 0.423 -0.626 0.345 -1.81 0.070 -0.311 0.375 -0.83 0.407 -0.393 0.450 -0.87 0.383
Institution: Public1 0.460 0.227 2.03 0.042 0.724 0.226 3.21 0.001 0.834 0.266 3.14 0.002 0.878 0.473 1.86 0.063
Institution: Medium size2 -0.970 0.214 -4.54 0.000 -0.842 0.211 -3.99 0.000 -0.713 0.243 -2.93 0.003 -0.899 0.449 -2.00 0.045
Institution: Small size2 0.416 0.457 0.91 0.363 -0.244 0.428 -0.57 0.567 -0.064 0.512 -0.12 0.901 0.264 0.857 0.31 0.758
Institution: Master's3 -0.709 0.310 -2.29 0.022 -0.006 0.279 -0.02 0.983 -0.138 0.356 -0.39 0.697 -0.863 0.416 -2.08 0.038
Institution: Bachelor's3 1.504 0.532 2.83 0.005 0.942 0.512 1.84 0.066 1.166 0.582 2.00 0.045 0.400 1.165 0.34 0.732
Pre-College Char.
SAT Math score 0.000 0.002 0.10 0.922 -0.002 0.003 -0.68 0.499 -0.001 0.003 -0.45 0.656 -0.003 0.003 -1.01 0.311
High School GPA -0.046 0.156 -0.29 0.770 0.257 0.151 1.70 0.089 0.102 0.188 0.54 0.589 -0.163 0.238 -0.69 0.492
Male4 0.051 0.225 0.23 0.820 0.565 0.225 2.51 0.012 0.028 0.255 0.11 0.914 0.317 0.351 0.90 0.366
URMs5 -0.261 0.210 -1.24 0.214 0.136 0.201 0.68 0.499 -0.066 0.243 -0.27 0.785 -0.094 0.334 -0.28 0.779
Asian American5 0.387 0.375 1.03 0.301 0.371 0.368 1.01 0.313 0.334 0.455 0.74 0.462 -0.044 0.686 -0.06 0.949
Academic Program Exp.
Bio Eng.6 -0.265 0.354 -0.75 0.454 -1.845 0.348 -5.30 0.000 -1.452 0.403 -3.60 0.000 -1.171 0.651 -1.80 0.072
Chemical Eng6 -0.538 0.340 -1.58 0.113 -0.982 0.328 -3.00 0.003 -0.766 0.379 -2.02 0.043 -1.845 0.628 -2.94 0.003
Civil Eng.6 -0.289 0.345 -0.84 0.402 -0.684 0.332 -2.06 0.040 -0.726 0.412 -1.76 0.078 -0.736 0.540 -1.36 0.173
Electrical Eng.6 -0.781 0.343 -2.28 0.023 -1.246 0.338 -3.69 0.000 -0.995 0.429 -2.32 0.020 -0.714 0.547 -1.31 0.191
General Eng.6 -3.187 0.414 -7.71 0.000 -2.254 0.421 -5.36 0.000 -2.499 0.479 -5.22 0.000 -1.849 0.689 -2.68 0.007
Industrial Eng.6 -0.450 0.895 -0.50 0.615 0.192 0.801 0.24 0.810 0.972 0.822 1.18 0.237 1.209 0.951 1.27 0.204
Other Eng.6 -1.113 0.547 -2.03 0.042 -1.258 0.537 -2.34 0.019 -0.917 0.661 -1.39 0.165 0.302 0.771 0.39 0.696
Sophomore7 0.528 0.297 1.77 0.076 0.260 0.289 0.90 0.368 0.707 0.345 2.05 0.040 0.589 0.509 1.16 0.247
Senior7 -0.579 0.204 -2.83 0.005 -1.086 0.206 -5.26 0.000 -0.515 0.245 -2.10 0.036 -0.354 0.445 -0.79 0.427
Core Eng. Thinking -0.404 0.210 -1.93 0.054 -0.652 0.209 -3.12 0.002 -0.525 0.339 -1.55 0.122 -1.404 0.408 -3.44 0.001
Professional Values 0.502 0.179 2.80 0.005 0.567 0.177 3.20 0.001 0.343 0.221 1.56 0.120 0.584 0.285 2.05 0.040
Professional Skills 0.288 0.190 1.52 0.129 0.388 0.179 2.17 0.030 0.355 0.278 1.28 0.202 0.725 0.389 1.86 0.063
Broad & System Persp. -0.349 0.195 -1.79 0.073 -0.204 0.202 -1.01 0.312 0.289 0.277 1.04 0.296 0.010 0.353 0.03 0.978
Active Learning Ped. 0.443 0.187 2.37 0.018 0.468 0.184 2.55 0.011 0.379 0.219 1.73 0.084 1.075 0.270 3.99 0.000
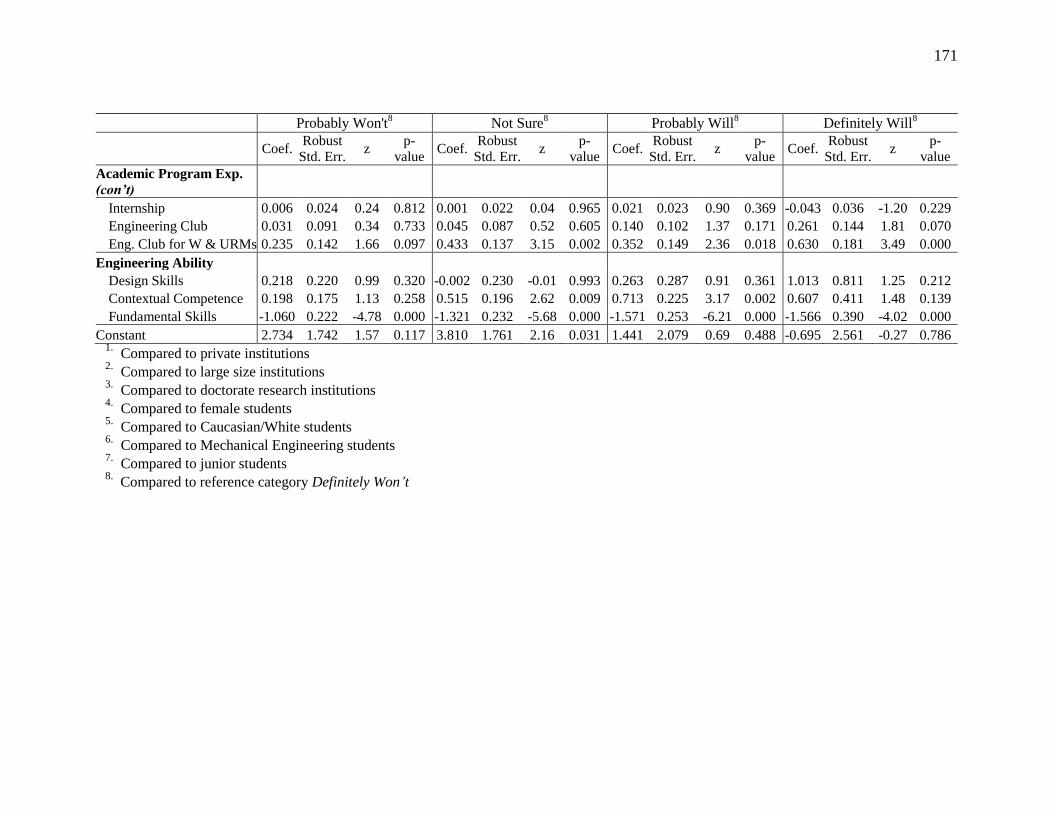
171
Probably Won't8 Not Sure
8 Probably Will8 Definitely Will
8
Coef. Robust
Std. Err. z
p-
value Coef.
Robust
Std. Err. z
p-
value Coef.
Robust
Std. Err. z
p-
value Coef.
Robust
Std. Err. z
p-
value
Academic Program Exp.
(con’t) Internship 0.006 0.024 0.24 0.812 0.001 0.022 0.04 0.965 0.021 0.023 0.90 0.369 -0.043 0.036 -1.20 0.229
Engineering Club 0.031 0.091 0.34 0.733 0.045 0.087 0.52 0.605 0.140 0.102 1.37 0.171 0.261 0.144 1.81 0.070
Eng. Club for W & URMs 0.235 0.142 1.66 0.097 0.433 0.137 3.15 0.002 0.352 0.149 2.36 0.018 0.630 0.181 3.49 0.000
Engineering Ability
Design Skills 0.218 0.220 0.99 0.320 -0.002 0.230 -0.01 0.993 0.263 0.287 0.91 0.361 1.013 0.811 1.25 0.212
Contextual Competence 0.198 0.175 1.13 0.258 0.515 0.196 2.62 0.009 0.713 0.225 3.17 0.002 0.607 0.411 1.48 0.139
Fundamental Skills -1.060 0.222 -4.78 0.000 -1.321 0.232 -5.68 0.000 -1.571 0.253 -6.21 0.000 -1.566 0.390 -4.02 0.000
Constant 2.734 1.742 1.57 0.117 3.810 1.761 2.16 0.031 1.441 2.079 0.69 0.488 -0.695 2.561 -0.27 0.786 1.
Compared to private institutions 2.
Compared to large size institutions 3.
Compared to doctorate research institutions 4.
Compared to female students 5.
Compared to Caucasian/White students 6.
Compared to Mechanical Engineering students 7.
Compared to junior students 8.
Compared to reference category Definitely Won’t
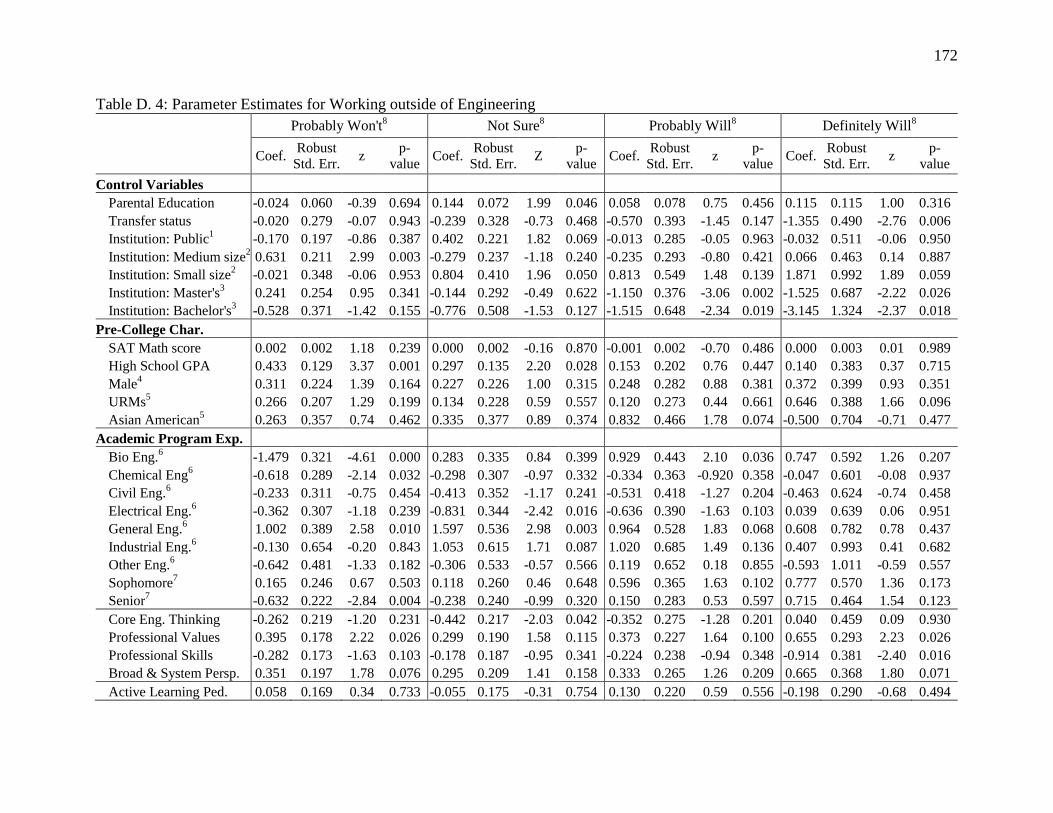
172
Table D. 4: Parameter Estimates for Working outside of Engineering
Probably Won't8 Not Sure
8 Probably Will8 Definitely Will
8
Coef. Robust
Std. Err. z
p-
value Coef.
Robust
Std. Err. Z
p-
value Coef.
Robust
Std. Err. z
p-
value Coef.
Robust
Std. Err. z
p-
value
Control Variables Parental Education -0.024 0.060 -0.39 0.694 0.144 0.072 1.99 0.046 0.058 0.078 0.75 0.456 0.115 0.115 1.00 0.316
Transfer status -0.020 0.279 -0.07 0.943 -0.239 0.328 -0.73 0.468 -0.570 0.393 -1.45 0.147 -1.355 0.490 -2.76 0.006
Institution: Public1 -0.170 0.197 -0.86 0.387 0.402 0.221 1.82 0.069 -0.013 0.285 -0.05 0.963 -0.032 0.511 -0.06 0.950
Institution: Medium size2 0.631 0.211 2.99 0.003 -0.279 0.237 -1.18 0.240 -0.235 0.293 -0.80 0.421 0.066 0.463 0.14 0.887
Institution: Small size2 -0.021 0.348 -0.06 0.953 0.804 0.410 1.96 0.050 0.813 0.549 1.48 0.139 1.871 0.992 1.89 0.059
Institution: Master's3 0.241 0.254 0.95 0.341 -0.144 0.292 -0.49 0.622 -1.150 0.376 -3.06 0.002 -1.525 0.687 -2.22 0.026
Institution: Bachelor's3 -0.528 0.371 -1.42 0.155 -0.776 0.508 -1.53 0.127 -1.515 0.648 -2.34 0.019 -3.145 1.324 -2.37 0.018
Pre-College Char.
SAT Math score 0.002 0.002 1.18 0.239 0.000 0.002 -0.16 0.870 -0.001 0.002 -0.70 0.486 0.000 0.003 0.01 0.989
High School GPA 0.433 0.129 3.37 0.001 0.297 0.135 2.20 0.028 0.153 0.202 0.76 0.447 0.140 0.383 0.37 0.715
Male4 0.311 0.224 1.39 0.164 0.227 0.226 1.00 0.315 0.248 0.282 0.88 0.381 0.372 0.399 0.93 0.351
URMs5 0.266 0.207 1.29 0.199 0.134 0.228 0.59 0.557 0.120 0.273 0.44 0.661 0.646 0.388 1.66 0.096
Asian American5 0.263 0.357 0.74 0.462 0.335 0.377 0.89 0.374 0.832 0.466 1.78 0.074 -0.500 0.704 -0.71 0.477
Academic Program Exp.
Bio Eng.6 -1.479 0.321 -4.61 0.000 0.283 0.335 0.84 0.399 0.929 0.443 2.10 0.036 0.747 0.592 1.26 0.207
Chemical Eng6 -0.618 0.289 -2.14 0.032 -0.298 0.307 -0.97 0.332 -0.334 0.363 -0.920 0.358 -0.047 0.601 -0.08 0.937
Civil Eng.6 -0.233 0.311 -0.75 0.454 -0.413 0.352 -1.17 0.241 -0.531 0.418 -1.27 0.204 -0.463 0.624 -0.74 0.458
Electrical Eng.6 -0.362 0.307 -1.18 0.239 -0.831 0.344 -2.42 0.016 -0.636 0.390 -1.63 0.103 0.039 0.639 0.06 0.951
General Eng.6 1.002 0.389 2.58 0.010 1.597 0.536 2.98 0.003 0.964 0.528 1.83 0.068 0.608 0.782 0.78 0.437
Industrial Eng.6 -0.130 0.654 -0.20 0.843 1.053 0.615 1.71 0.087 1.020 0.685 1.49 0.136 0.407 0.993 0.41 0.682
Other Eng.6 -0.642 0.481 -1.33 0.182 -0.306 0.533 -0.57 0.566 0.119 0.652 0.18 0.855 -0.593 1.011 -0.59 0.557
Sophomore7 0.165 0.246 0.67 0.503 0.118 0.260 0.46 0.648 0.596 0.365 1.63 0.102 0.777 0.570 1.36 0.173
Senior7 -0.632 0.222 -2.84 0.004 -0.238 0.240 -0.99 0.320 0.150 0.283 0.53 0.597 0.715 0.464 1.54 0.123
Core Eng. Thinking -0.262 0.219 -1.20 0.231 -0.442 0.217 -2.03 0.042 -0.352 0.275 -1.28 0.201 0.040 0.459 0.09 0.930
Professional Values 0.395 0.178 2.22 0.026 0.299 0.190 1.58 0.115 0.373 0.227 1.64 0.100 0.655 0.293 2.23 0.026
Professional Skills -0.282 0.173 -1.63 0.103 -0.178 0.187 -0.95 0.341 -0.224 0.238 -0.94 0.348 -0.914 0.381 -2.40 0.016
Broad & System Persp. 0.351 0.197 1.78 0.076 0.295 0.209 1.41 0.158 0.333 0.265 1.26 0.209 0.665 0.368 1.80 0.071
Active Learning Ped. 0.058 0.169 0.34 0.733 -0.055 0.175 -0.31 0.754 0.130 0.220 0.59 0.556 -0.198 0.290 -0.68 0.494
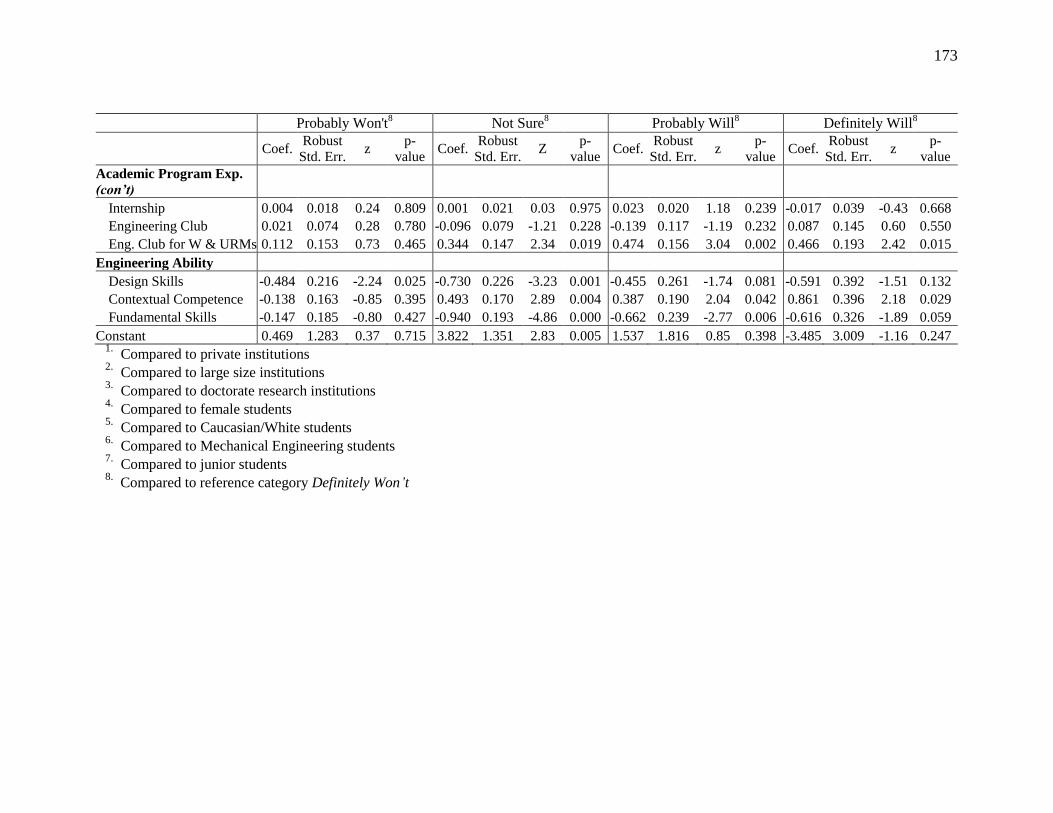
173
Probably Won't8 Not Sure
8 Probably Will8 Definitely Will
8
Coef. Robust
Std. Err. z
p-
value Coef.
Robust
Std. Err. Z
p-
value Coef.
Robust
Std. Err. z
p-
value Coef.
Robust
Std. Err. z
p-
value
Academic Program Exp.
(con’t) Internship 0.004 0.018 0.24 0.809 0.001 0.021 0.03 0.975 0.023 0.020 1.18 0.239 -0.017 0.039 -0.43 0.668
Engineering Club 0.021 0.074 0.28 0.780 -0.096 0.079 -1.21 0.228 -0.139 0.117 -1.19 0.232 0.087 0.145 0.60 0.550
Eng. Club for W & URMs 0.112 0.153 0.73 0.465 0.344 0.147 2.34 0.019 0.474 0.156 3.04 0.002 0.466 0.193 2.42 0.015
Engineering Ability
Design Skills -0.484 0.216 -2.24 0.025 -0.730 0.226 -3.23 0.001 -0.455 0.261 -1.74 0.081 -0.591 0.392 -1.51 0.132
Contextual Competence -0.138 0.163 -0.85 0.395 0.493 0.170 2.89 0.004 0.387 0.190 2.04 0.042 0.861 0.396 2.18 0.029
Fundamental Skills -0.147 0.185 -0.80 0.427 -0.940 0.193 -4.86 0.000 -0.662 0.239 -2.77 0.006 -0.616 0.326 -1.89 0.059
Constant 0.469 1.283 0.37 0.715 3.822 1.351 2.83 0.005 1.537 1.816 0.85 0.398 -3.485 3.009 -1.16 0.247 1.
Compared to private institutions 2.
Compared to large size institutions 3.
Compared to doctorate research institutions 4.
Compared to female students 5.
Compared to Caucasian/White students 6.
Compared to Mechanical Engineering students 7.
Compared to junior students 8.
Compared to reference category Definitely Won’t
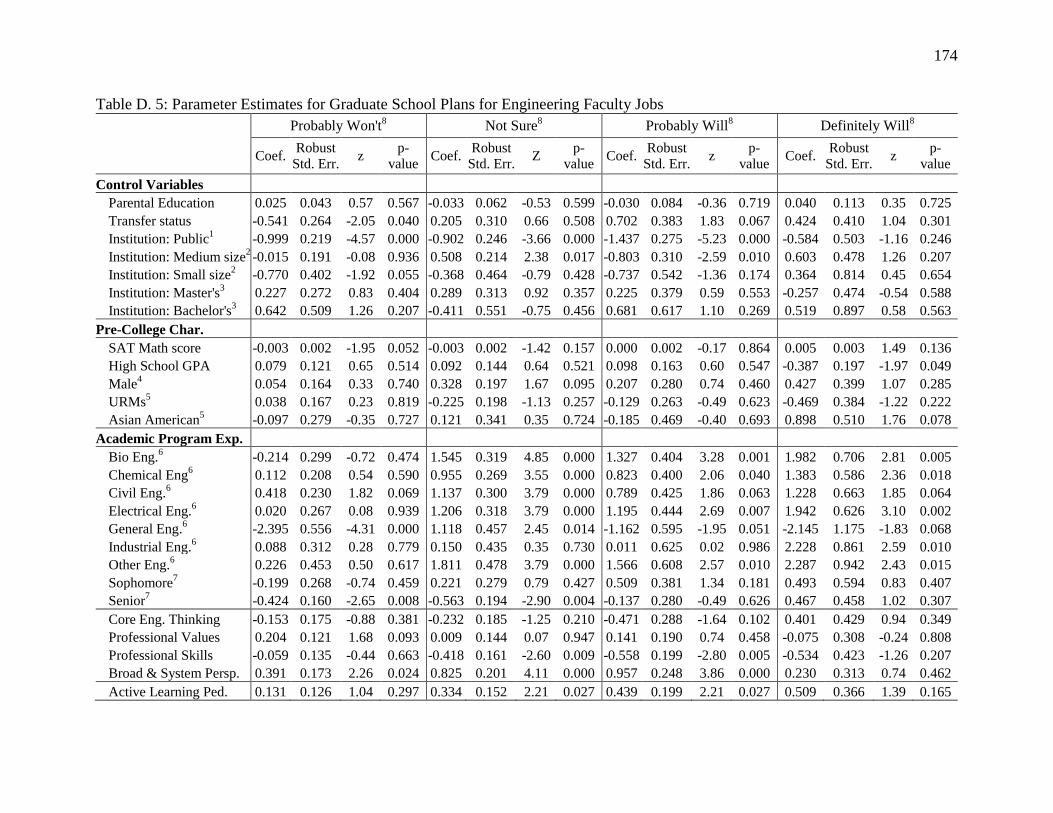
174
Table D. 5: Parameter Estimates for Graduate School Plans for Engineering Faculty Jobs
Probably Won't8 Not Sure
8 Probably Will8 Definitely Will
8
Coef. Robust
Std. Err. z
p-
value Coef.
Robust
Std. Err. Z
p-
value Coef.
Robust
Std. Err. z
p-
value Coef.
Robust
Std. Err. z
p-
value
Control Variables Parental Education 0.025 0.043 0.57 0.567 -0.033 0.062 -0.53 0.599 -0.030 0.084 -0.36 0.719 0.040 0.113 0.35 0.725
Transfer status -0.541 0.264 -2.05 0.040 0.205 0.310 0.66 0.508 0.702 0.383 1.83 0.067 0.424 0.410 1.04 0.301
Institution: Public1 -0.999 0.219 -4.57 0.000 -0.902 0.246 -3.66 0.000 -1.437 0.275 -5.23 0.000 -0.584 0.503 -1.16 0.246
Institution: Medium size2 -0.015 0.191 -0.08 0.936 0.508 0.214 2.38 0.017 -0.803 0.310 -2.59 0.010 0.603 0.478 1.26 0.207
Institution: Small size2 -0.770 0.402 -1.92 0.055 -0.368 0.464 -0.79 0.428 -0.737 0.542 -1.36 0.174 0.364 0.814 0.45 0.654
Institution: Master's3 0.227 0.272 0.83 0.404 0.289 0.313 0.92 0.357 0.225 0.379 0.59 0.553 -0.257 0.474 -0.54 0.588
Institution: Bachelor's3 0.642 0.509 1.26 0.207 -0.411 0.551 -0.75 0.456 0.681 0.617 1.10 0.269 0.519 0.897 0.58 0.563
Pre-College Char.
SAT Math score -0.003 0.002 -1.95 0.052 -0.003 0.002 -1.42 0.157 0.000 0.002 -0.17 0.864 0.005 0.003 1.49 0.136
High School GPA 0.079 0.121 0.65 0.514 0.092 0.144 0.64 0.521 0.098 0.163 0.60 0.547 -0.387 0.197 -1.97 0.049
Male4 0.054 0.164 0.33 0.740 0.328 0.197 1.67 0.095 0.207 0.280 0.74 0.460 0.427 0.399 1.07 0.285
URMs5 0.038 0.167 0.23 0.819 -0.225 0.198 -1.13 0.257 -0.129 0.263 -0.49 0.623 -0.469 0.384 -1.22 0.222
Asian American5 -0.097 0.279 -0.35 0.727 0.121 0.341 0.35 0.724 -0.185 0.469 -0.40 0.693 0.898 0.510 1.76 0.078
Academic Program Exp.
Bio Eng.6 -0.214 0.299 -0.72 0.474 1.545 0.319 4.85 0.000 1.327 0.404 3.28 0.001 1.982 0.706 2.81 0.005
Chemical Eng6 0.112 0.208 0.54 0.590 0.955 0.269 3.55 0.000 0.823 0.400 2.06 0.040 1.383 0.586 2.36 0.018
Civil Eng.6 0.418 0.230 1.82 0.069 1.137 0.300 3.79 0.000 0.789 0.425 1.86 0.063 1.228 0.663 1.85 0.064
Electrical Eng.6 0.020 0.267 0.08 0.939 1.206 0.318 3.79 0.000 1.195 0.444 2.69 0.007 1.942 0.626 3.10 0.002
General Eng.6 -2.395 0.556 -4.31 0.000 1.118 0.457 2.45 0.014 -1.162 0.595 -1.95 0.051 -2.145 1.175 -1.83 0.068
Industrial Eng.6 0.088 0.312 0.28 0.779 0.150 0.435 0.35 0.730 0.011 0.625 0.02 0.986 2.228 0.861 2.59 0.010
Other Eng.6 0.226 0.453 0.50 0.617 1.811 0.478 3.79 0.000 1.566 0.608 2.57 0.010 2.287 0.942 2.43 0.015
Sophomore7 -0.199 0.268 -0.74 0.459 0.221 0.279 0.79 0.427 0.509 0.381 1.34 0.181 0.493 0.594 0.83 0.407
Senior7 -0.424 0.160 -2.65 0.008 -0.563 0.194 -2.90 0.004 -0.137 0.280 -0.49 0.626 0.467 0.458 1.02 0.307
Core Eng. Thinking -0.153 0.175 -0.88 0.381 -0.232 0.185 -1.25 0.210 -0.471 0.288 -1.64 0.102 0.401 0.429 0.94 0.349
Professional Values 0.204 0.121 1.68 0.093 0.009 0.144 0.07 0.947 0.141 0.190 0.74 0.458 -0.075 0.308 -0.24 0.808
Professional Skills -0.059 0.135 -0.44 0.663 -0.418 0.161 -2.60 0.009 -0.558 0.199 -2.80 0.005 -0.534 0.423 -1.26 0.207
Broad & System Persp. 0.391 0.173 2.26 0.024 0.825 0.201 4.11 0.000 0.957 0.248 3.86 0.000 0.230 0.313 0.74 0.462
Active Learning Ped. 0.131 0.126 1.04 0.297 0.334 0.152 2.21 0.027 0.439 0.199 2.21 0.027 0.509 0.366 1.39 0.165
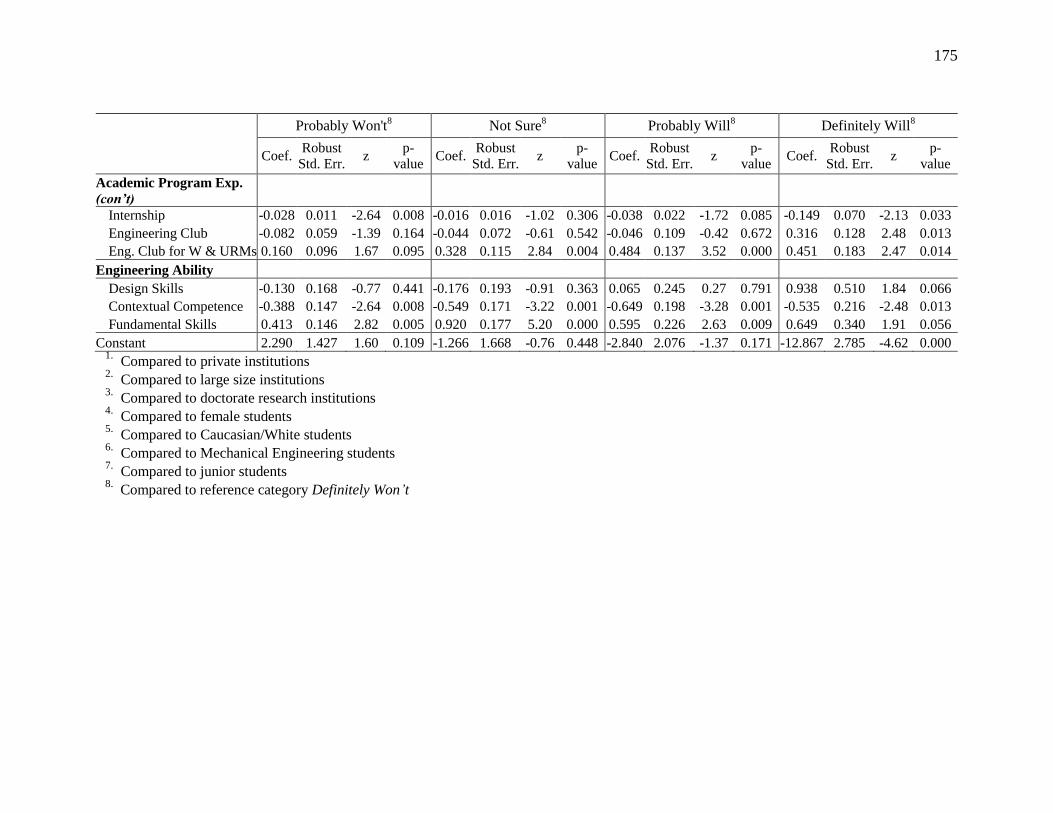
175
Probably Won't8 Not Sure
8 Probably Will8 Definitely Will
8
Coef. Robust
Std. Err. z
p-
value Coef.
Robust
Std. Err. z
p-
value Coef.
Robust
Std. Err. z
p-
value Coef.
Robust
Std. Err. z
p-
value
Academic Program Exp.
(con’t) Internship -0.028 0.011 -2.64 0.008 -0.016 0.016 -1.02 0.306 -0.038 0.022 -1.72 0.085 -0.149 0.070 -2.13 0.033
Engineering Club -0.082 0.059 -1.39 0.164 -0.044 0.072 -0.61 0.542 -0.046 0.109 -0.42 0.672 0.316 0.128 2.48 0.013
Eng. Club for W & URMs 0.160 0.096 1.67 0.095 0.328 0.115 2.84 0.004 0.484 0.137 3.52 0.000 0.451 0.183 2.47 0.014
Engineering Ability
Design Skills -0.130 0.168 -0.77 0.441 -0.176 0.193 -0.91 0.363 0.065 0.245 0.27 0.791 0.938 0.510 1.84 0.066
Contextual Competence -0.388 0.147 -2.64 0.008 -0.549 0.171 -3.22 0.001 -0.649 0.198 -3.28 0.001 -0.535 0.216 -2.48 0.013
Fundamental Skills 0.413 0.146 2.82 0.005 0.920 0.177 5.20 0.000 0.595 0.226 2.63 0.009 0.649 0.340 1.91 0.056
Constant 2.290 1.427 1.60 0.109 -1.266 1.668 -0.76 0.448 -2.840 2.076 -1.37 0.171 -12.867 2.785 -4.62 0.000 1.
Compared to private institutions 2.
Compared to large size institutions 3.
Compared to doctorate research institutions 4.
Compared to female students 5.
Compared to Caucasian/White students 6.
Compared to Mechanical Engineering students 7.
Compared to junior students 8.
Compared to reference category Definitely Won’t
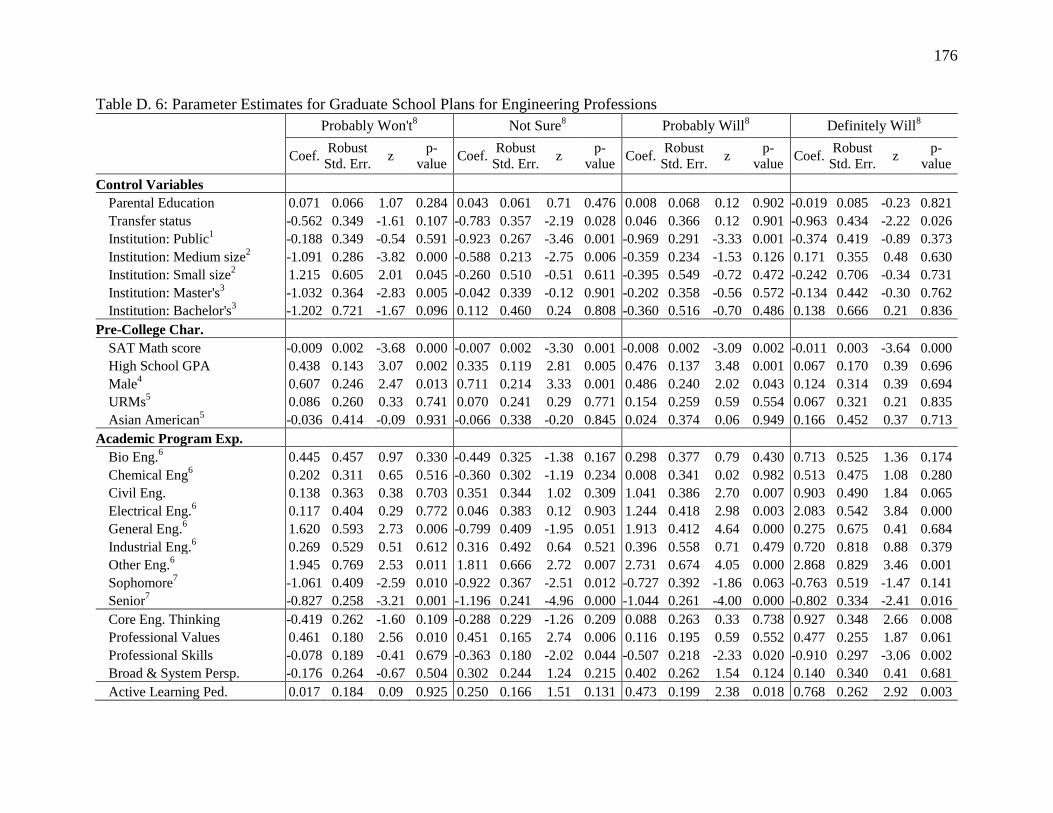
176
Table D. 6: Parameter Estimates for Graduate School Plans for Engineering Professions
Probably Won't8 Not Sure
8 Probably Will8 Definitely Will
8
Coef. Robust
Std. Err. z
p-
value Coef.
Robust
Std. Err. z
p-
value Coef.
Robust
Std. Err. z
p-
value Coef.
Robust
Std. Err. z
p-
value
Control Variables Parental Education 0.071 0.066 1.07 0.284 0.043 0.061 0.71 0.476 0.008 0.068 0.12 0.902 -0.019 0.085 -0.23 0.821
Transfer status -0.562 0.349 -1.61 0.107 -0.783 0.357 -2.19 0.028 0.046 0.366 0.12 0.901 -0.963 0.434 -2.22 0.026
Institution: Public1 -0.188 0.349 -0.54 0.591 -0.923 0.267 -3.46 0.001 -0.969 0.291 -3.33 0.001 -0.374 0.419 -0.89 0.373
Institution: Medium size2 -1.091 0.286 -3.82 0.000 -0.588 0.213 -2.75 0.006 -0.359 0.234 -1.53 0.126 0.171 0.355 0.48 0.630
Institution: Small size2 1.215 0.605 2.01 0.045 -0.260 0.510 -0.51 0.611 -0.395 0.549 -0.72 0.472 -0.242 0.706 -0.34 0.731
Institution: Master's3 -1.032 0.364 -2.83 0.005 -0.042 0.339 -0.12 0.901 -0.202 0.358 -0.56 0.572 -0.134 0.442 -0.30 0.762
Institution: Bachelor's3 -1.202 0.721 -1.67 0.096 0.112 0.460 0.24 0.808 -0.360 0.516 -0.70 0.486 0.138 0.666 0.21 0.836
Pre-College Char.
SAT Math score -0.009 0.002 -3.68 0.000 -0.007 0.002 -3.30 0.001 -0.008 0.002 -3.09 0.002 -0.011 0.003 -3.64 0.000
High School GPA 0.438 0.143 3.07 0.002 0.335 0.119 2.81 0.005 0.476 0.137 3.48 0.001 0.067 0.170 0.39 0.696
Male4 0.607 0.246 2.47 0.013 0.711 0.214 3.33 0.001 0.486 0.240 2.02 0.043 0.124 0.314 0.39 0.694
URMs5 0.086 0.260 0.33 0.741 0.070 0.241 0.29 0.771 0.154 0.259 0.59 0.554 0.067 0.321 0.21 0.835
Asian American5 -0.036 0.414 -0.09 0.931 -0.066 0.338 -0.20 0.845 0.024 0.374 0.06 0.949 0.166 0.452 0.37 0.713
Academic Program Exp.
Bio Eng.6 0.445 0.457 0.97 0.330 -0.449 0.325 -1.38 0.167 0.298 0.377 0.79 0.430 0.713 0.525 1.36 0.174
Chemical Eng6 0.202 0.311 0.65 0.516 -0.360 0.302 -1.19 0.234 0.008 0.341 0.02 0.982 0.513 0.475 1.08 0.280
Civil Eng. 0.138 0.363 0.38 0.703 0.351 0.344 1.02 0.309 1.041 0.386 2.70 0.007 0.903 0.490 1.84 0.065
Electrical Eng.6 0.117 0.404 0.29 0.772 0.046 0.383 0.12 0.903 1.244 0.418 2.98 0.003 2.083 0.542 3.84 0.000
General Eng.6 1.620 0.593 2.73 0.006 -0.799 0.409 -1.95 0.051 1.913 0.412 4.64 0.000 0.275 0.675 0.41 0.684
Industrial Eng.6 0.269 0.529 0.51 0.612 0.316 0.492 0.64 0.521 0.396 0.558 0.71 0.479 0.720 0.818 0.88 0.379
Other Eng.6 1.945 0.769 2.53 0.011 1.811 0.666 2.72 0.007 2.731 0.674 4.05 0.000 2.868 0.829 3.46 0.001
Sophomore7 -1.061 0.409 -2.59 0.010 -0.922 0.367 -2.51 0.012 -0.727 0.392 -1.86 0.063 -0.763 0.519 -1.47 0.141
Senior7 -0.827 0.258 -3.21 0.001 -1.196 0.241 -4.96 0.000 -1.044 0.261 -4.00 0.000 -0.802 0.334 -2.41 0.016
Core Eng. Thinking -0.419 0.262 -1.60 0.109 -0.288 0.229 -1.26 0.209 0.088 0.263 0.33 0.738 0.927 0.348 2.66 0.008
Professional Values 0.461 0.180 2.56 0.010 0.451 0.165 2.74 0.006 0.116 0.195 0.59 0.552 0.477 0.255 1.87 0.061
Professional Skills -0.078 0.189 -0.41 0.679 -0.363 0.180 -2.02 0.044 -0.507 0.218 -2.33 0.020 -0.910 0.297 -3.06 0.002
Broad & System Persp. -0.176 0.264 -0.67 0.504 0.302 0.244 1.24 0.215 0.402 0.262 1.54 0.124 0.140 0.340 0.41 0.681
Active Learning Ped. 0.017 0.184 0.09 0.925 0.250 0.166 1.51 0.131 0.473 0.199 2.38 0.018 0.768 0.262 2.92 0.003
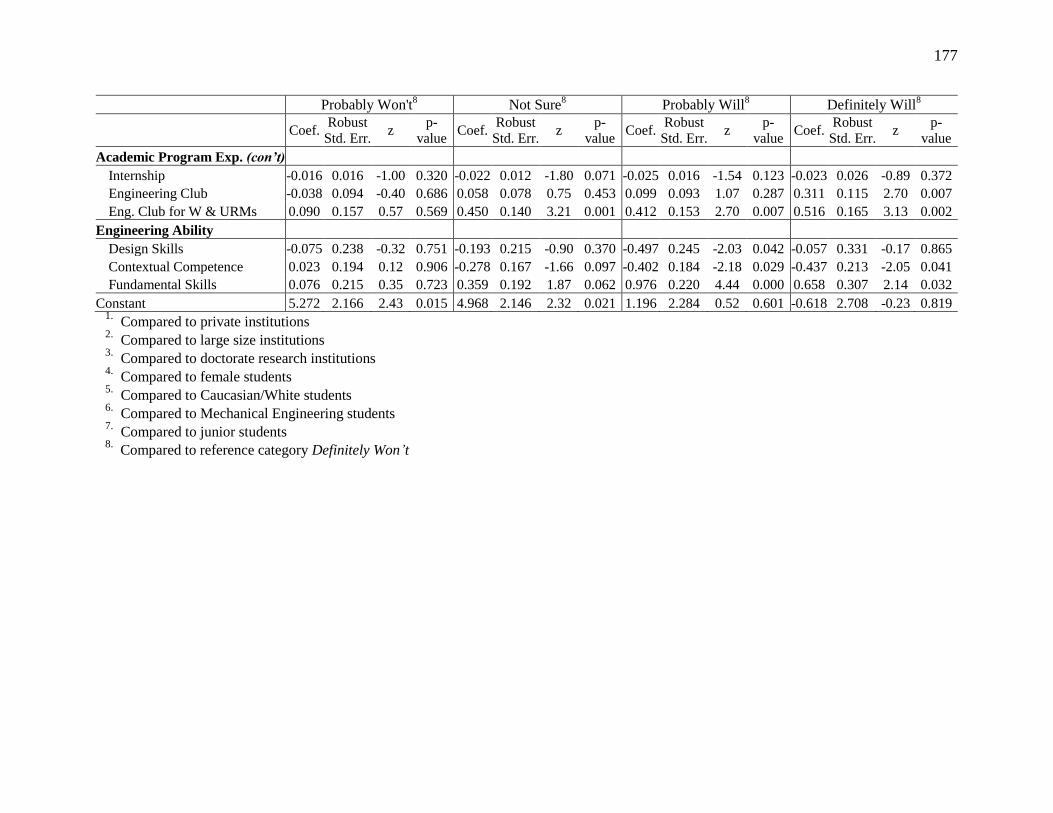
177
Probably Won't8 Not Sure
8 Probably Will8 Definitely Will
8
Coef. Robust
Std. Err. z
p-
value Coef.
Robust
Std. Err. z
p-
value Coef.
Robust
Std. Err. z
p-
value Coef.
Robust
Std. Err. z
p-
value
Academic Program Exp. (con’t)
Internship -0.016 0.016 -1.00 0.320 -0.022 0.012 -1.80 0.071 -0.025 0.016 -1.54 0.123 -0.023 0.026 -0.89 0.372
Engineering Club -0.038 0.094 -0.40 0.686 0.058 0.078 0.75 0.453 0.099 0.093 1.07 0.287 0.311 0.115 2.70 0.007
Eng. Club for W & URMs 0.090 0.157 0.57 0.569 0.450 0.140 3.21 0.001 0.412 0.153 2.70 0.007 0.516 0.165 3.13 0.002
Engineering Ability
Design Skills -0.075 0.238 -0.32 0.751 -0.193 0.215 -0.90 0.370 -0.497 0.245 -2.03 0.042 -0.057 0.331 -0.17 0.865
Contextual Competence 0.023 0.194 0.12 0.906 -0.278 0.167 -1.66 0.097 -0.402 0.184 -2.18 0.029 -0.437 0.213 -2.05 0.041
Fundamental Skills 0.076 0.215 0.35 0.723 0.359 0.192 1.87 0.062 0.976 0.220 4.44 0.000 0.658 0.307 2.14 0.032
Constant 5.272 2.166 2.43 0.015 4.968 2.146 2.32 0.021 1.196 2.284 0.52 0.601 -0.618 2.708 -0.23 0.819 1.
Compared to private institutions 2.
Compared to large size institutions 3.
Compared to doctorate research institutions 4.
Compared to female students 5.
Compared to Caucasian/White students 6.
Compared to Mechanical Engineering students 7.
Compared to junior students 8.
Compared to reference category Definitely Won’t
Curriculum Vita for Hyun Kyoung Ro
Education
Doctor of Philosophy in Higher Education, minor in Educational Psychology (Applied
Measurement) and Graduate Certificate in Institutional Research – The Pennsylvania State
University, 2011
Master of Science in Educational Administration – Korea University, 2006
Bachelor of Science in Education – Korea University, 2004
Professional Experience
Graduate Research Assistant, Penn State Higher Education Program, 2008-current
Research Analyst, Korean Education Development Institute, 2006-2007
Graduate Research Assistant, Korea University Department of Education, 2004-2006
Executive Secretary, Korean Society for the Studies of Educational Administration, 2004-2005
Teaching Experience
Teaching Assistant, Curriculum in Higher Education (HIED 548), Spring 2011
Teaching Assistant, Higher Education in the United States (HIED 545), Fall 2010
Publications
Ro, H. K. (2011, June 26-29). Predicting graduate school plans based on student‘ self-assessed
engineering knowledge and skills. Proceedings, American Society for Engineering
Education Conference, Vancouver, Canada.
Ro, H. K., Marra, R. M., Terenzini, P. T., Trautvetter, L. C. Walser, A., D, & Lord S. (2011,
June 26-29). If you build it they will come (and stay): Recruiting and retaining women
and underrepresented minority students. Panel session, Proceedings, American Society
for Engineering Education Conference, Vancouver, Canada.
McKenna, A., Plumb, C., Kremer, G. E., Yin, A. C., & Ro, H. K. (2011, June 26-29).
Approaches to engaging students in engineering design and problem solving. Proceedings,
American Society for Engineering Education Conference, Vancouver, Canada.
Ro, H.K (2006). Analyzing the structural relationships among parent factors, student factors, and
private tutoring expense, The Journal of Educational Administration, 24, 97-118.
Selected Presentations
Terenzini, P. T., Lattuca, L. R., Knight, D. B., & Ro, H. K. (2011, March 13-15). Early findings
from the Prototype-to-Production (P2P) study surveys. Poster session presented at the
NSF‘s Engineering Education and Centers Awardees Conference, Reston, VA.
Ro, H. K. & Lattuca, L. R. (2010, November 18-20). The Impact of College Experiences on
Engineering Students‘ Academic Persistence in Engineering Graduate Programs.
Research paper presented at the 35th
Annual Meeting of the Association for the Study of
Higher Education, Indianapolis, IN.
Terenzini, P. T., Ro, H. K., & Yin, A. C. (2010, November 18-20). Between-college effects on
students reconsidered. Paper presented to the meeting of the Association for the Study of
Higher Education, Indianapolis, IN.