Embed Size (px)
Citation preview

Technological University Dublin Technological University Dublin
ARROW@TU Dublin ARROW@TU Dublin
Doctoral Business
2011
An Optimisation-based Framework for Complex Business An Optimisation-based Framework for Complex Business
Process: Healthcare Application Process: Healthcare Application
Waleed Abo Hamad Technological University Dublin, [email protected]
Follow this and additional works at: https://arrow.tudublin.ie/busdoc
Part of the Health Services Research Commons
Recommended Citation Recommended Citation Abo-Hamad, W. (2011) An Optimisation-based Framework for Complex Business Process: Healthcare Application. Doctoral Thesis. Technological University Dublin. doi:10.21427/D7N597
This Theses, Ph.D is brought to you for free and open access by the Business at ARROW@TU Dublin. It has been accepted for inclusion in Doctoral by an authorized administrator of ARROW@TU Dublin. For more information, please contact [email protected], [email protected].
This work is licensed under a Creative Commons Attribution-Noncommercial-Share Alike 4.0 License

An Optimisation-Based Framework for Complex
Business Process: Healthcare Application
By
Waleed Abo-Hamad B.Sc. M.Sc.
Thesis submitted in fulfilment of the requirements for the Degree of
Doctor of Philosophy
Dublin Institute of Technology
Supervisor: Amr Arisha Ph.D
School of Management, College of Business.
2011
I
ABSTRACT
The Irish healthcare system is currently facing major pressures due to rising demand,
caused by population growth, ageing and high expectations of service quality. This
pressure on the Irish healthcare system creates a need for support from research
institutions in dealing with decision areas such as resource allocation and performance
measurement. While approaches such as modelling, simulation, multi-criteria decision
analysis, performance management, and optimisation can – when applied skilfully –
improve healthcare performance, they represent just one part of the solution.
Accordingly, to achieve significant and sustainable performance, this research aims to
develop a practical, yet effective, optimisation-based framework for managing complex
processes in the healthcare domain. Through an extensive review of the literature on the
aforementioned solution techniques, limitations of using each technique on its own are
identified in order to define a practical integrated approach toward developing the
proposed framework. During the framework validation phase, real-time strategies have
to be optimised to solve Emergency Department performance issues in a major hospital.
Results show a potential of significant reduction in patients average length of stay (i.e.
48% of average patient throughput time) whilst reducing the over-reliance on
overstretched nursing resources, that resulted in an increase of staff utilisation between
7% and 10%. Given the high uncertainty in healthcare service demand, using the
integrated framework allows decision makers to find optimal staff schedules that
improve emergency department performance. The proposed optimum staff schedule
reduces the average waiting time of patients by 57% and also contributes to reduce
number of patients left without treatment to 8% instead of 17%. The developed
framework has been implemented by the hospital partner with a high level of success.

II
DECLARATION
I certify that this Thesis, which I now submit for examination for the award of the
degree of Doctor of Philosophy, is entirely my own work and has not been taken from
the work of others, save and to the extent that such work has been cited and
acknowledged within the text of my work.
This Thesis was prepared according to the regulations for post graduate study by
research of the Dublin Institute of Technology, and has not been submitted in whole or
in part for an award in any institute
The Institute has permission to keep, to lend, or to copy this Thesis in whole or in part,
on condition that any such use of the material of the Thesis is duly acknowledged.
. . . . . . . . . . . . . . . . . . . . . . . . . . . . . . . . . . . .
Waleed Abo-Hamad
Dublin, Ireland
September 2011

III
ACKNOWLEDGEMENT
I am extremely thankful to God for everything he blessed me within life and grating me
patience and perseverance to complete my PhD and fulfil one of my finest dreams in
life.
Words may never be suffice to express how deeply indebted I am to my wonderful
parents for their endless support, sacrifice and understanding. I dedicate my PhD work
to you both in a hope to make you proud. I am grateful to my siblings: Manal, Abeer,
Tamer, and Mostafa for seeing me through this journey and for always standing by me
providing every possible help.
I am deeply indebted to my supervisor, Dr. Amr Arisha for many insightful
conversations throughout the entire journey of PhD. With his helpful guidance, I was
able to convert ideas into reality. Dr. Arisha simply helped me to find my finest form
and also supported me as a big brother and a real friend whenever I needed advice or
direction. I felt privileged having him around in the most difficult times and in
particular in writing this thesis. Dr. Arisha, I do value your patience and willingness to
discuss the minutiae of the different obstacles I faced through my project. I hope I made
you proud at the end.
Special thanks and much gratitude to the college dean & director Mr. Paul O‘Sullivan
for his constant support for me personally and for 3S Group. I would like also to thank
head of graduate business school, Dr. Katrina Lawlor and head of research, Mr. Paul
O‘Reilly for their continuous academic and genial support.
I am most grateful to my internal examiner Dr. Joseph Coughlan and my external
examiner Dr. Tillal Eldabi for the value they added to the work by their constructive
inputs.
Special thanks for all my friends in 3S Group; Amr Mahfous, Michael Thorwarth,
Khaled Ismail, Ayman Tobail, and John Crowe. I am deeply indebted to my MSc
supervisor, Prof Khaled Mostafa who taught me the craft of research. Thanks for all my
friends specially Rami Ghorab, Ahmed Shosha, Ashraf Sharabi, Mohamed Korayem,
Eid Emary, and Osama Abdel Hamid.

IV
ABBREVIATIONS LIST
AWT Average Waiting Time
ACU Ambulatory Care Area
AHP Analytic Hierarchy Process
AIS Artificial Immune System
ALOS Average Length Of Stay
ANN Artificial Neural Network
ANP Advanced Nurse Practitioner
BPM Business Process Management
BPR Business Process Reengineering
BSC Balanced Scorecard
CARP Capacitated Arc Routing Problem
CPR Cardiopulmonary Resuscitation
CSA Clonal Selection Algorithm
DEMATEL Decision-Making Trial And Evaluation Laboratory
DES Discrete-Event Simulation
DFD Data Flow Diagram
DOE Design Of Experiments
ED Emergency Department
EHCI Euro Health Consumer Index
GA Genetic Algorithm
GB Gradient-Based Methods
HMOEA Hybrid Multi-Objective Evolutionary Algorithm
HSE Health Service Executive
ICOM Input, Control, Output And Mechanism
IDEF Integrated Definition For Function Modelling
IPA Infinitesimal Perturbation Analysis
KPI Key Performance Indicators
LRE Likelihood Ratio Estimator
MCDA Multi-Criteria Decision Analysis
MCP Multiple Comparison Procedure
MH Meta-Heuristics Based Methods

V
MM Meta-Model Based Methods
MTS Manchester Triage System
NHS National Health Service
NSGA Non-Dominated Sorting Genetic Algorithm
OO Ordinal Optimisation
OSTD Object State Transition Description
OTM Optimisation Technique Map
PA Perturbation Analysis
PET Patient Experience Time
PFD Process Flow Description
POF Pareto Optimal Front
PRIME Preference Ratios In Multi-Attribute Evaluation
R&S Ranking-And-Selection
RAD Role Activity Diagram
SB Statistical-Based Methods
RSM Response Surface Methodology
SA Simulated Annealing
SADT Structured Analysis And Design Technique
SC Supply Chain
SCM Supply Chain Management
SHO Senior House Officer
SMART Simple Multi-Attribute Rating Technique
SSM Sequential Selection With Memory
TQM Total Quality Management
TS Tabu Search
VRP Vehicle Routing Problem

TABLE OF CONTENTS
1
TABLE OF CONTENTS
LIST OF FIGURES ........................................................................................... 6
LIST OF TABLES ............................................................................................ 8
CHAPTER 1: INTRODUCTION ..................................................................... 9
1.1 INTRODUCTION ............................................................................................. 9
1.2 PROBLEM DEFINITION ................................................................................ 12
1.2.1 Complexities of Business Process ............................................................... 12
1.2.2 Supply Chain and Healthcare services ........................................................ 16
1.3 RESEARCH MOTIVE .................................................................................... 21
1.4 RESEARCH QUESTION AND OBJECTIVES ................................................... 23
1.5 THESIS LAYOUT .......................................................................................... 26
CHAPTER 2: LITERATURE REVIEW ......................................................... 28
2.1 INTRODUCTION ........................................................................................... 28
2.2 PERFORMANCE MANAGEMENT .................................................................. 30
2.2.1 Balanced Scorecard ..................................................................................... 30
2.2.2 Applications of BSC in Healthcare ............................................................. 31
2.2.3 Performance Perspectives for Healthcare Systems ..................................... 32
2.2.4 Challenges and Limitations ......................................................................... 33
2.3 MULTI-CRITERIA DECISION ANALYSIS ..................................................... 36
2.3.1 Applications ................................................................................................ 36
2.3.2 Discussion ................................................................................................... 37
2.4 BUSINESS PROCESS MODELLING AND SIMULATION .................................. 38
2.4.1 Process Modelling Techniques ................................................................... 39
2.4.1.1 Flow Chart .......................................................................................... 39
2.4.1.2 Data Flow Diagrams .......................................................................... 40
2.4.1.3 Role Activity Diagrams ....................................................................... 40
2.4.1.4 IDEF .................................................................................................... 41

TABLE OF CONTENTS
2
2.4.2 Simulation Modelling in Healthcare ........................................................... 42
2.4.2.1 Inpatient Facilities .............................................................................. 42
2.4.2.2 Operating Rooms ................................................................................ 44
2.4.2.3 Emergency Departments ..................................................................... 45
2.4.3 Limitations .................................................................................................. 47
2.5 CONCLUDING REMARKS ............................................................................ 48
CHAPTER 3: BUSINESS PROCESS OPTIMISATION.................................... 49
3.1 INTRODUCTION ........................................................................................... 49
3.2 OPTIMISATION PRINCIPLES ....................................................................... 49
3.2.1 Pareto-Based Approach ............................................................................... 50
3.2.2 Aggregate-based Approach ......................................................................... 51
3.3 OPTIMISATION TECHNIQUES ..................................................................... 52
3.3.1 Gradient-Based Methods ............................................................................. 53
3.3.2 Meta-Model-Based Methods ....................................................................... 54
3.3.3 Statistical Methods ...................................................................................... 55
3.3.4 Meta-Heuristics ........................................................................................... 56
3.4 OPTIMISATION APPLICATIONS – A REVIEW ............................................. 58
3.4.1 Scheduling ................................................................................................... 62
3.4.2 Logistics and Inventory Management ......................................................... 71
3.4.3 Demand and Capacity Planning .................................................................. 78
3.4.4 Resource and Location Allocation .............................................................. 82
3.4.5 Vehicle Routing .......................................................................................... 85
3.5 DISCUSSION ................................................................................................. 89
CHAPTER 4: RESEARCH METHODOLOGY ............................................... 92
4.1 INTRODUCTION ........................................................................................... 92
4.2 RESEARCH APPROACHES ........................................................................... 92
4.3 THE PROPOSED INTEGRATED FRAMEWORK ............................................. 97
4.3.1 Business Process Modelling ........................................................................ 98
4.3.2 Data Analysis .............................................................................................. 99

TABLE OF CONTENTS
3
4.3.3 Simulation Modelling ............................................................................... 100
4.3.4 Integration of Balanced Scorecard and Simulation ................................... 104
4.3.5 Multi-Criteria Decision Analysis .............................................................. 105
4.3.6 Business Process Optimisation: Selection Dilemma ................................ 107
4.3.6.1 Selection Criteria of Optimisation Methods ..................................... 107
4.3.6.2 Optimisation Technique Map (OTM) ................................................ 109
4.3.7 Applying Optimisation .............................................................................. 112
4.4 RESEARCH DESIGN PROCESS ................................................................... 113
4.4.1 Research Strategy: A Case Study .............................................................. 114
4.4.2 An Emergency Department Case Study .................................................... 115
4.4.3 Modelling and Simulation as a Research Method..................................... 118
4.5 RESEARCH TECHNIQUES AND PROCEDURES ........................................... 122
4.5.1 Triangulation ............................................................................................. 122
4.5.2 Primary Data Collection ............................................................................ 123
4.5.3 Data Analysis ............................................................................................ 127
4.6 RELIABILITY AND VALIDITY .................................................................... 128
CHAPTER 5: EMERGENCY DEPARTMENT – A CASE STUDY ................. 131
5.1 INTRODUCTION ......................................................................................... 131
5.2 EMERGENCY DEPARTMENT PROCESS MAPPING ..................................... 132
5.2.1 Patient Flow Analysis ............................................................................... 132
5.2.2 Patient Routing .......................................................................................... 133
5.2.3 ED Process Mapping ................................................................................. 135
5.2.3.1 Triage Process .................................................................................. 136
5.2.3.2 Patient Allocation Process ................................................................ 138
5.2.3.3 Patient Assessment Process .............................................................. 139
5.2.4 Discussion and Remarks ........................................................................... 141
5.3 EMERGENCY DEPARTMENT BALANCED SCORECARD ............................. 142
5.3.1 Performance Perspectives and Measures .................................................. 142
5.3.1.1 Internal Business Processes Perspective .......................................... 142
5.3.1.2 Community Engagement Perspective ................................................ 143
5.3.1.3 Learning and Growth Perspective .................................................... 143

TABLE OF CONTENTS
4
5.3.1.4 Patient Perspective............................................................................ 144
5.3.2 Key Performance Indicators Selection ...................................................... 144
5.4 DATA ANALYSIS ........................................................................................ 150
5.4.1 Data Description........................................................................................ 150
5.4.2 Data Preparation and Pre-Processing ........................................................ 152
5.4.2.1 Missing values ................................................................................... 153
5.4.2.2 Outlier detection and elimination ..................................................... 153
5.4.2.3 Data Consistency .............................................................................. 155
5.4.3 Data Extraction, Grouping, and Analysis ................................................. 156
5.4.3.1 Patient Arrival Pattern ...................................................................... 156
5.4.3.2 Patient Grouping ............................................................................... 157
5.4.3.3 Patient Complaints ............................................................................ 160
5.4.3.4 Patient Allocation and Routing Analysis .......................................... 162
5.5 EMERGENCY DEPARTMENT SIMULATION MODEL .................................. 165
5.5.1 Model Construction ................................................................................... 165
5.5.2 Simulation Model Verification and Validation ......................................... 165
5.6 REAL-TIME STRATEGIES FOR THE EMERGENCY DEPARTMENT ............ 170
5.6.1 The Three Basic Strategies........................................................................ 170
5.6.1.1 Scenario Design ................................................................................ 170
5.6.1.2 Results Analysis ................................................................................. 171
5.6.1.3 Sensitivity Analysis ............................................................................ 175
5.6.2 Achieving Targets – Real-Time Strategies for the ED ............................. 176
5.6.2.1 Design of Experiments ...................................................................... 176
5.6.2.2 Analysis of Results ............................................................................ 177
5.6.2.3 The ED Preference Model ................................................................. 179
5.7 STAFF SCHEDULING .................................................................................. 182
5.7.1 Problem Definition .................................................................................... 182
5.7.2 Problem Formulation ................................................................................ 183
5.7.3 Results Analysis ........................................................................................ 185
5.8 FINDINGS ................................................................................................... 190
CHAPTER 6: CONCLUSION ..................................................................... 192

TABLE OF CONTENTS
5
6.1 INTRODUCTION ......................................................................................... 192
6.2 RESULTS DISCUSSION ............................................................................... 193
6.3 RESEARCH OUTCOMES............................................................................. 194
6.4 LIMITATIONS ............................................................................................ 199
6.5 RECOMMENDATIONS FOR FUTURE RESEARCH WORK ........................... 199
REFERENCES ............................................................................................. 202
APPENDICES .............................................................................................. 239
APPENDIX A: PATIENT FLOW PROCESS MAPPING ............................................ 240
APPENDIX B: STATISTICAL ANALYSIS OF SIMULATION OUTPUT ...................... 255
APPENDIX C: MULTI-CRITERIA DECISION TOOLS ............................................ 259
APPENDIX D: GENETIC ALGORITHM AND ARTIFICIAL IMMUNE SYSTEM ....... 261
LIST OF PUBLICATIONS ............................................................................. 263

LIST OF FIGURES
6
LIST OF FIGURES
Figure 1-1: Euro Health Consumer Index (EHCI, 2009). ................................................. 9
Figure 1-2 Irish healthcare system elements. .................................................................. 10
Figure 1-3 Typical supply chain business tiers. .............................................................. 17
Figure 1- 4 Health care chain. ......................................................................................... 18
Figure 1-5 Healthcare process complexity. ..................................................................... 20
Figure 1-6 Thesis layout and research methodology. ..................................................... 27
Figure 3-1 Variable space mapping to decision and objective space.............................. 50
Figure 3-2 A bi-objective optimisation problem. ........................................................... 51
Figure 3-3 Non-convex Pareto optimal front in the decision space. ............................... 52
Figure 3-4 Simulation modelling and optimisation interaction. ..................................... 53
Figure 3-5 A Meta-Model interacts with the simulation and the optimisation models .. 54
Figure 3-6 A Genetic algorithm integrated with simulation for fitness computation ..... 58
Figure 3-7 Optimisation application areas. ..................................................................... 62
Figure 3-8 Summary of the literature in the area of inventory management .................. 76
Figure 3-9 Examples of planning activities in supply chain management...................... 80
Figure 4-1 Alignment between research steps and research objectives. ......................... 94
Figure 4-2 Deductive and inductive reasoning. .............................................................. 95
Figure 4-3 An overview of the integrated framework. ................................................... 98
Figure 4-4 Discrete-event simulation developing steps. ............................................... 100
Figure 4-5 Balanced scorecard and simulation modelling integration.......................... 104
Figure 4-6 Integration of simulation, BSC, and MCDA. .............................................. 106
Figure 4-7 Optimisation Techniques Map (OTM). ....................................................... 110
Figure 4-8 A Multi-dimension classification scheme for optimisation methods. ......... 111
Figure 4-9 The optimisation procedure within the integrated framework. ................... 112
Figure 4-10 ED physical layout and main care areas. ................................................... 116
Figure 4-11 Primary data collection through the ED case study .................................. 124
Figure 5-1 Detailed patient flow through the ED. ........................................................ 133
Figure 5-2 Minor injury patients routing steps. ............................................................ 134
Figure 5-3 Patients with respiratory problems routing steps. ....................................... 135
Figure 5-4 Process mapping of main ED processes. ..................................................... 136
Figure 5-5 Triage process mapping............................................................................... 137
Figure 5-6 Patient allocation detailed flowchart. .......................................................... 139
Figure 5-7 Patient assessment process mapping. .......................................................... 140

LIST OF FIGURES
7
Figure 5-8 The emergency department balanced scorecard .......................................... 142
Figure 5-9 Performance measures value tree. ............................................................... 146
Figure 5-10 ED key performance indicators. ................................................................ 149
Figure 5-11 Triage waiting time cumulative percentage. ............................................. 154
Figure 5-12 Cumulative percentage of first clinical response time. ............................. 154
Figure 5-13 Demand seasonality and patient arrival pattern. ....................................... 157
Figure 5-14 Triage category distribution. ..................................................................... 158
Figure 5-15 Patient arrival mode distribution. .............................................................. 159
Figure 5-16 Inter-arrival time pattern – urgent patient. ................................................ 159
Figure 5-17 Relative frequency diagram – urgent patients. .......................................... 160
Figure 5-18 Main ED processes and patient routing. .................................................... 164
Figure 5-19 Confidence regions and intervals of ED KPIs........................................... 169
Figure 5-20 AHP weighted value tree. .......................................................................... 173
Figure 5-21 Percentage of patients treated value function. ........................................... 174
Figure 5-22 The ED performance for all the scenarios against the current ED. ........... 174
Figure 5-23 The change in ED performance with average LOS for all scenarios. ....... 175
Figure 5-24 ED performance with the burnout level of staff. ....................................... 176
Figure 5-25 Comparison of base scenario against scenario 1, 2, and 3 ........................ 178
Figure 5-26 The weighted value tree of the ED KPI‘s using PRIME. .......................... 180
Figure 5-27 Value intervals for all scenarios. ............................................................... 181
Figure 5-28 The ED optimal staffing levels matching the weekly patient arrival rate. 187
Figure 5-29 Overlapped staff work shifts comply with daily demand fluctuation. ...... 188
Figure 5-30 The optimal staff roster for the emergency department for three months . 189
Figure 6-1 A framework for optimisation software selection ....................................... 201

LIST OF TABLES
8
LIST OF TABLES
Table 1-1 Research question and corresponding objectives. .......................................... 25
Table 3-1 The review research questions and their corresponding objectives................ 59
Table 3-2 Literature review steps and methodology ....................................................... 61
Table 3-3 Summary of literature on optimisation techniques for scheduling problems. 71
Table 3-4 Optimisation of vehicle routing problems (VRPs) ......................................... 86
Table 3-5 A synopsis of literature on optimisation methods for process management. . 88
Table 4-1 The use of DES to cope with weaknesses of quantitative methods .............. 120
Table 4-2 DES coping with weaknesses of qualitative methods. ................................. 121
Table 5-1 The preference of ED senior manager of measures for each criterion ......... 147
Table 5-2 The relative importance of the evaluation criteria ........................................ 148
Table 5-3 Aggregated weights and values for ―% of Patients Treated‖ measure ......... 148
Table 5-4 The final score and rank of performance measure using SMART ............... 149
Table 5-5 Description of data fields in Patient data tables............................................ 151
Table 5-6 Complaints-based on the Pareto principle. ................................................... 161
Table 5-7 Analysis of patient allocation within the emergency department ................. 162
Table 5-8 ED simulation output .................................................................................... 167
Table 5-9 Simultaneous confidence intervals of ED key performance indicators ........ 167
Table 5-10 Simultaneous and Bonferroni confidence intervals .................................... 168
Table 5-11 Simulation variables for base scenario and scenario 1, 2, and 3. ............... 170
Table 5-12 Simulation results of scenario 1, 2, and 3. .................................................. 171
Table 5-13 The comparison matrix for the main KPIs in ED performance criteria. .... 172
Table 5-14 The comparison matrix for the KPIs of the Patient Throughput criterion. . 172
Table 5-15 Weighted results for all scenarios against the baseline scenario. ............... 174
Table 5-16 Simulation variables and their changing levels. ......................................... 176
Table 5-17 Scenario design for the three basic strategies and their combinations. ...... 177
Table 5-18 Simulation Results of the first three scenarios. .......................................... 177
Table 5-19 Simulation results of scenario 4, 5, 6, and 7. .............................................. 179
Table 5-20 Dominance structure of all scenarios. ......................................................... 181
Table 5-21 Feasible work-shifts in the emergency department. ................................... 183
Table 5-22 Binary representation of feasible work shifts. ............................................ 184
Table 5-23 Optimal weekly work stretches for the ED staff. ....................................... 186
Table 5-24 Simulation results of the optimal staff schedule and the baseline scenario 187

INTRODUCTION
9
CHAPTER 1: INTRODUCTION
1.1 INTRODUCTION
The global economic crisis is continuing to affect the Irish healthcare sector in the form
of cuts in finance and reduction in resources. The latest Euro Health Consumer Index
(EHCI, 2009) has spotted the slump of the healthcare system in Ireland by ranking it
23rd out of 33 surveyed countries in Europe (Figure 1-1).
0 50 100 150 200
Bulgaria
Czech Republic
Greece
Spain
Latvia
Romania
Malta
Slovakia
Cyprus
FYR Macedonia
Ireland
Italy
Portugal
Albania
Croatia
Poland
Sweden
Germany
United Kingdom
Belgium
Estonia
Hungary
Lithuania
Luxembourg
Norway
Switzerland
Finland
France
Iceland
Austria
Slovenia
Netherlands
Denmark
Figure 1-1: Euro Health Consumer Index (EHCI, 2009).
Long waiting lists, overcrowding, and patients dissatisfaction are the main symptoms of
the healthcare system in Ireland with over 46,400 adults and children waiting for
hospital treatment, according to the latest figures from the Health Service Executive
(HSE) in Ireland (HSE, 2010). Many elements are supposed to work in harmony to

INTRODUCTION
10
achieve one goal ―better health service‖; however, these four elements (Figure 1-2) need
to work harder together. Increasing the pressure on the Irish healthcare system leads to
calls for involvement of research institutions in many areas. Politicians as well as
decision makers are aware that changes are inevitable, due to the pressures which their
healthcare system is facing and the need to utilise better decision tools has risen in
importance.
Healthcare
Management
PublicService Level
Quality
Finance
Waiting Times
InsuranceMedication
Sta
te EU
Research
Regulations
Decision
Support Systems
Law & Legislation
General Policy
Insurance
Politics
EU Regulations
Consumer Index
Quality Level
Supply Chain
Risk
Strategic
Management
Resilience
Technology Enabling Innovation
Planning
Collaboration
Planning
Facilities
Systems
Staff
Delivery
Figure 1-2 Irish healthcare system elements.
Therefore, the HSE is currently under constant pressure to control rapidly escalating
expenses, while fulfilling the growing demand for high class patient service level and
satisfactory medical treatment. Resolving such challenges requires understanding the
complexity of the healthcare system at different levels. Accordingly, service providers
and healthcare managers have to recognise the types of sub-systems that constitute the
whole healthcare system, the operations within each sub-system, the main bottlenecks
and their causes, which actions are efficient and which are not, and the impact of
changes and actions on the overall system performance.

INTRODUCTION
11
However, arriving at a consistent degree of system understanding is an overwhelming
task due to the large number and diversity of the organisations and the high level of
uncertainty and interdependencies. As a result, service providers and healthcare
managers are continuously studying the efficiency of existing healthcare systems and
exploring improvement opportunities. The evaluation of such proposed interventions is
crucial prior to their actual implementation. Moreover, healthcare managers are
challenged by intrinsic uncertainty of the demands and outcomes of healthcare systems;
high level of human involvement at both patients level and resource level (doctor,
nurses, etc.); limited budget and resources; and large number of variables (e.g., staff
scheduling, number of beds, etc).
Patients, on the other hand, in addition to requiring a high level of service quality, are
understandably no longer prepared to wait in queues for essential health services.
Accordingly, the healthcare service concept has shifted from optimising resource
utilisation to finding a balance between service for patients and efficiency for providers
(Brailsford and Vissers, 2011). Dealing with these inevitable complexities within
healthcare processes and services and addressing the challenges in the decision making
process is the focus of this research.
Traditionally, critical decisions are made based on the vast arrays of data contained in
clinical and administrative records. This approach cannot succeed to represent the
dynamic interaction between the interconnected components of the healthcare system.
Consequently, this approach has limited use when it comes to predict the outcomes of
changes or proposed actions to the system. Analytical tools are needed to support
managers decisions at different levels within the healthcare system. If analytical models
are impractical in the healthcare settings it is usually due to the imposed simplifications

INTRODUCTION
12
on the model. Accordingly, important details and features of the underlined systems
cannot be captured. Recently, the techniques of Business Process Modelling, Operations
Research, Performance Management and Computer Science have been introduced to the
management of healthcare provision in different countries such as the UK, USA, and
Canada (Henderson, 1995, Murdick et al., 1990, Zairi, 1997, Aktas et al., 2007, and
Dickenson, 2010). However, there is no public reporting of similar activity within the
Irish healthcare services. Typically the effectiveness of such research depends on the
specific nature of the problems in the system; it can be reasonably expected that an
analysis of healthcare provision in the Irish context would reap benefits in gaining
deeper understanding of the problems, and is a step forward for filling the gaps and
developing an integrated healthcare management framework towards putting Ireland
among the leading countries in providing excellence in healthcare service quality.
1.2 PROBLEM DEFINITION
Health systems are complex. Although a significant fraction of many governments‘
budgets are allocated to health, results have hardly matched expectations as many health
system performance indicators have shown limited improvement. To understand the
different levels of complexity of healthcare business processes, first a brief definition of
complex business process is given, which in turn is divided into the definition of both
complexity and business process.
1.2.1 Complexities of Business Process
Complexity is ―a word-problem and not a word-solution" (Alhadeff Jones, 2008, p. 1);
at least this is how it used to be considered in many academic and non-academic circles.
Wildly varying opinions relating to the actual meaning of the word complex, have led to
considerable confusion. The term complex has been improperly associated with notions

INTRODUCTION
13
such as size, difficulty and order (Edmonds, 1999). Even the difference between what is
complex and what is complicated has not always been taken into account. What is
important though is that complexity is a pervasive feature of the real-world. The word
complex comes from Latin expression complexus meaning ―embracing or
comprehending several elements‖ that are ―plated together, interwoven‖ (Alhadeff
Jones, 2008, p. 2). The terms ―complex‖ and ―complexity‖ were involved in expressions
looking to indicate the opposite of simplicity. This is where the confusion between
―complex‖ and ―complicated‖ becomes clearer.
Complicated systems consist of a large number of elements, but these are all ―knowable,
definable and capable of being catalogued as are all of the relationships" among them;
in addition, ―cause and effect can be separated" effectively (Snowden, 2003). Examples
include are many engineered systems such as aircrafts and vehicles which are
predictable and usable because of these properties. On the other hand, complex systems
are those where the ―whole is more than the sum of its parts", as expressed by Aristotle
in the fourth century BC. Complex systems consist of many entities that interact in non-
linear ways resulting in complex behaviours at the global level, cause and effects are
entangled and thus cannot be separated (Juarrero, 2000). So overall, the system cannot
be reduced to just the set of its parts.
To understand the complexity levels within real-world systems, it is essential to
describe how their entities are structured. According to Simon (1973), complex systems
are composed of large number of interrelated sub-systems, each of the latter (i.e. sub-
systems) being structured hierarchically until the lowest level of elementary sub-system
is reached. Higher levels in the hierarchy display larger and slower entities, while lower
level entities are smaller and faster (Wu, 1999). The interactions between these levels of

INTRODUCTION
14
the system can be classified into: interactions within sub-systems, among sub-systems,
and between the system and its environment (Manson, 2001), where the inter-
relationships are described by higher order, nonlinear processes rather than just
feedback (Costanza et al., 1993). Given the properties of sub-systems and their
interactions, it is not a trivial matter to infer the behaviour of the whole system (Simon,
1982). Moreover, the behaviour of complex systems is also dependent on the way they
interact and integrate within their environment (Polack et al., 2010). This is due to the
difficulties encountered in the distinction between the system and its environment which
make them open systems and far-from-equilibrium (Cilliers, 1998).
Business process is an important variable in understanding the nature and interrelation
among activities within complex organisations (Modarres, 2006). It would, however,
seem that providing a suitable definition is more difficult than might appear to be the
case (Melao and Pidd, 2000). Most of the literature simply quotes (or adapts) the vague
definitions put forward by the re-engineering pioneers. Hammer and Champy (1993, p.
35) define a business process as:
“a collection of activities that takes one or more kinds of input and creates
an output that is of value to the customer. A business process has a goal
and is affected by events occurring in the external world or in other
processes”
Hence, in this definition, the product is the focus of the business process. According to
Davenport (1993), processes can also be defined as structured set of activities (e.g.,
cross functionally, or hierarchically within a particular function) designed to produce a
specified output for both internal and external customers. That definition implies an
action-focus with a strong emphasis on how work is performed rather than describing

INTRODUCTION
15
products or services that are a result of a process (Eriksson and Penker, 2000). On the
other hand, a customer-focused definition is described in Jacobson et al. (1994) by
concentrating on processes that provide value to customers which require a close
collaboration between individuals or groups to achieve individual customer‘s needs.
Their description concentrates on the interface between the internal business process
and the customer, which gives an external view of the business process and how it is
used by the external actors (Lindsay et al., 2003). Complex systems (e.g.,
manufacturing systems) support and maintain greater numbers of inter-connected and
hierarchical processes, where sub-processes are subordinated by a functional relation to
their higher-level business process in the hierarchy (Modarres, 2006). Intrinsically, the
output of a process tends to be used as an input for adjacent cross-functional processes.
As such, variations and changes which result from the interaction between sub-systems
(e.g., people, tasks, structure, technology, etc.) will be manifested at the macro (i.e.,
higher-level) level processes. Hence, the decomposability of higher level vertical
processes tends to lead to greater levels of process complexity.
In addition, the complexity of business processes tends to increase as a result of causal
connections within hierarchical processes and variability within sub-processes at
different level in the system. Moreover, open system, real-world business processes
have not only internal relationships, but also external relationships with their
environment in order to adapt and survive (Earl and Khan, 1994). Such dynamism is an
inevitable feature of business processes that increase complexity levels. Additionally,
the flows of resources and products (or services) of business resources are regulated by
policies and decisions, which represent explicit statements of actions to be taken in
order to achieve a desired result (Pidd, 1996). These interactions between policies and
internal structure add another dimension to the complexity of business processes by

INTRODUCTION
16
viewing a process as a set or network of interacting feedback loops (Scherr, 1993;
Melao and Pidd, 2000). The process view emphasises the entire process in order to
understand how a specific process fits within the larger process and ultimately within
the whole system (Harmon, 2007). However, the complexity of hierarchical processes
within complex systems tends to reduce the possibility of identifying the risks attached
to drastic changes or even opportunities for process improvement. That is, the impact of
change on other cross-functional processes, and the likelihood that a particular risk
event will occur (Roberts 1994). Nevertheless, organisations need to focus on their core
processes rather than individual departments. This is because they represent the flows
and relationships that actually add value and produce products or services for customers
(e.g., value chain in manufacturing or care chain in healthcare services).
1.2.2 Supply Chain and Healthcare services
The view of an organisation as a chain of interlinked operations or processes emerges
from the field of supply chain management (SCM). This is a discipline rooted in
business sectors where a set of business tiers are involved in the supply (i.e., upstream)
and distribution (i.e., downstream) of products or services between a source and a
customer (Mentzer et al., 2001) (see Figure 1-3). Similarly, the concept of a supply
chain (SC) has been introduced in manufacturing when individual organisations further
down the chain tried to reduce the risks of running out of supplies of materials or parts
delivered by organisations further up the chain. A number of definitions are used for the
‗supply chain‘, however they all share following: supply chain covers all activities from
raw materials to distributed products or services; an organisation can be part of more
than one supply chain; and every activity of the supply chain should add value to the
product for the end customer (Al-Mudimigh et al., 2004).

INTRODUCTION
17
Flow of Resources
Flow of Information
Supplier(s) Manufacturer (s) Distribution Centre(s) Retailer(s)
Figure 1-3 Typical supply chain business tiers.
Managing the resulting supply chain networks effectively is challenged by high levels
of uncertainty in supply and demand, conflicting objectives, vagueness of information,
numerous decision variables and constraints. Christopher (1992, p. 18) provides the
following definition of SCM ‗The management of upstream and downstream
relationships with suppliers and customers to deliver superior customer value‘.
Therefore, in order to survive, supply chain has to deliver the most value for their
customers at the lowest cost (Schary and Skjøtt-Larsen, 2002).
Analogously, the process of service delivery in healthcare can be viewed as the chain of
complex processes that require the coordination at different levels in the care chain to
provide the necessary care for patients (Figure 1- 4). Healthcare systems (e.g., hospitals)
consist of many complex business processes of different types ranging from
administrative tasks and protocols, to services provided to patients by doctors and
nurses such as assessment and treatment (Andrew, 2001). Healthcare systems are
mainly composed of patients and healthcare professionals, in addition to health

INTRODUCTION
18
technology and resources. Every patient who encounters the healthcare system goes
through a process (Bevan and Lendon, 2006).
Outpatient Facilities
Flow of Patients
Primary Care Services
Hospital (s)
Community Care(s)
General
Practitioner
Public Health
Nursing
Acute Care
Rehabilitation Centre (s)
Nursing Home
Elderly Home
Home with Home Care
Outpatient
Emergency Department
Referral
Wards/Beds
ICUOperating
Theatre
Arrival
Registration Triage
Assessment
Diagnostics
Admission
Discharge
Figure 1- 4 Health care chain.
In general, the healthcare process starts when the patient enters the healthcare system.
The patient‘s symptoms or complaints can be considered the process input, like raw
material in a manufacturing process. A combination of administrative and clinical
processes is then triggered by these inputs. Therefore, the healthcare process can be
viewed as the interaction of people, equipment, policies, and processes (Bente, 2005).

INTRODUCTION
19
The medical treatment processes of patients can be seen as a diagnostic–therapeutic
cycle (Mans et al., 2010). This cycle consists of patient observation, monitoring,
medical reasoning and decision making that requires various actions such as
determining necessary diagnostic tests and/or therapeutic treatments. The outcomes of
these processes are significantly influenced by many factors such as the patient‘s
general health status (co-morbidities), the skill level of staff (e.g., physicians, nurses,
technicians, registration clerks, and so forth), and the availability and reliability of
proper medical equipments (e.g., labs, X-Rays).
Depending on the patient‘s medical condition, the output of healthcare process can be
an admission order, a medication, or an order for inhalation therapy, which becomes an
input for other adjacent cross-functional processes. That is the point at which the
responsibility of patient is passed within the healthcare system (i.e. handoff). Healthcare
processes may involve hundreds of handoffs that are performed without considering
their contribution to the wider care process (Bevan and Lendon, 2006). This type of
inter-connection between healthcare processes requires coordination among different
people, units, and departments at different levels within the healthcare system
(Panzarasa and Stefanelli, 2006). Such interdepartmental collaboration among multiple
professions and healthcare units triggers many different types of business processes
within healthcare systems including resource planning and allocation, staff scheduling,
discharge planning, and bed management. This multifaceted interaction is the origin of
the dynamic nature of healthcare processes.
As processes are initiated, changes in technology, healthcare treatments, drugs, and
protocols may affect current processes, requiring reparative actions (Anyanwu et al.,
2003). For example, the discovery of new drugs results in a continuous change in

INTRODUCTION
20
patient care pathways. Consequently, healthcare processes are more likely to be highly
complex and dynamic, involving many interconnected elements with mutual influence
on each other (Figure 1-5).
Constraint(s)
Uncertainties
Dec
isio
n v
ari
ab
les
Healthcare Systemx1
x2
xN
o Resources Allocation
o Staff Levels
o Physical Space
o Resources (Staff, Medical Equipment, etc)
o Safety Regulations
o Patient Waiting Time
o Resources Utilisation
o Length of Stay
o Patient Arrival
o Patients Diversity
o Equipment Failure
o Human Behaviour
KPIM
KPI1
KPI2
Key
Per
form
an
ce I
nd
ica
tors
Figure 1-5 Healthcare process complexity.
Such dynamic interactions result in a circular chain of cause and effect relationships
between processes that cannot be adequately captured by linear representation. This
means that the response of an element in the system to an input can be completely
different from what may be intended or predicted because the response will depend on
the system‘s current condition. This indicates that the effects of the same managerial
action can be different as they are contingent upon the state of the system when the
action is taken. The presence of non-linear relationships makes it difficult to accurately
predict the behaviour of health systems and complicates the management decision-
making process. Furthermore, healthcare processes involve strong human interactions as
they are made and enacted by people with different values, experiences, and
expectations. Examples of these human behaviour issues are clinicians motivation,

INTRODUCTION
21
productivity, fatigue, quality of practice, patient anxiety, response to incentives, and the
responses of hospital managers to different pressures (Lebcir, 2006). The effects of
these aspects of human behaviour are not easily quantifiable which implies that
healthcare business processes not only exist in the objective and concrete sense but also
they are abstractions, meanings and judgements shaped by subjective construction
(Melao and Pidd, 2000). Due to a high labour contribution, the delivery of healthcare
services is highly variable and potentially inconsistent. Additionally, existing processes
in healthcare have mostly evolved and been adapted to particular circumstances; they
are produced and consumed at the same time; and they are not manufactured according
to precise standards or can be stored (Vincent, 2010). Despite this resemblance
between the healthcare processes and supply chain, the healthcare still lags far behind
other sectors such as manufacturing and industry, which widely applied a diversity of
sophisticated management tools, such as modelling and simulation, optimisation, and
performance management, to improve the quality and efficiency of their business
processes.
1.3 RESEARCH MOTIVE
The Irish healthcare delivery system is undergoing rapid change at the present time
(DoH, 2007). The goal of these changes is to provide a more efficient, more reliable,
more thorough delivery of healthcare services in a manner which meets the needs of the
population. However, the healthcare system in Ireland cannot meet the current demands
placed on it. For example, emergency departments (EDs) overcrowding has been
declared as a ―National Emergency‖ in Ireland since 2006. Several national reports have
highlighted a growing demand for emergency care (1.2 million patients attending EDs
annually) and a simultaneous decrease in the number of operating EDs. The result has

INTRODUCTION
22
increased crowding, high percentages of patients leaving EDs without being seen and
higher morbidity and mortality rates. Additionally, prolonged waiting times have been
reported with more than 500 patients on trolleys for hospital admission every day; 18 %
of patients are waiting more than 24 hours and 40% between 10-24 hours (HSE
Performance Monitoring Report, 2010).
Although Ireland is not alone in experiencing these figures (Schafermeyer and Asplin,
2003, Rowe et al., 2006, Forero et al., 2010), it is important not to underestimate the
sometimes catastrophic consequences this situation has on patients, staff and the
healthcare sector. Overcrowding in EDs has become a significant international crisis
that negatively affects patient safety, quality of care, and patient satisfaction (Graff,
1999). Therefore, analysing the patient flow in emergency departments to minimise
length of stay, improve efficiency, and reduce overcrowding has become a crucial
requirement.
Similar problems exist in other parts of the Irish healthcare system. For example,
according to Department of Health in 2004, waiting times in many surgical areas are
increasing despite the high level of expenditure on reducing waiting lists with over
27,000 people waiting for hospital treatment in the country, from which 16,000 waiting
for inpatient care and with the rest waiting for day case treatment. While the popular
response is that these problems will be solved by increasing resources, the inefficiency
of this approach leads to significant investment and expenses in the system without any
guarantee of a complete solution to the problem. The problem must be considered in its
full complexity before a solution can be found. Suggestions have been offered with
regard to changes in work practice for consultants, hospital doctors, nurses,
administrators and other professionals (e.g. radiology) to ease the impact of fluctuating

INTRODUCTION
23
demand on the system. The reluctance to commit to such wholesale changes comes, in
part, from not being able to predict the effectiveness of such changes or to understand in
full the impact of the change on the working patterns of those involved. There is a need
to be able to evaluate changes in delivery practice on the system performance without
disrupting the existing provision of services. The danger of such disruption comes from
two sources; the changes themselves might make the problem worse and, industrial
relations issues are most likely to arise when change is introduced. It is therefore
important that change is only introduced where there is clear benefit, which requires that
there be some means of demonstrating that the change will be effective and exactly
what those effects might be.
Therefore, this study aims to utilise a multi-disciplinary approach to develop an
integrated decision support framework that healthcare managers and planners can use in
a practical and reflective way. It is envisaged that the research can be expanded to form
the basis of a predictive planning and management tool for building new healthcare
facilities. For example, evidence based data on the effect of relationships, particularly
between physical layout and distribution of services and facilities within a building and
staffing requirements can be used to derive optimum layouts and inter-relationships
between departments. Variables such as staff levels and costs can be used to define the
size of clinical areas that can be supported or alternatively constraints on capital
expenditure will determine the size, staffing levels and associated running costs on a
department by department basis.
1.4 RESEARCH QUESTION AND OBJECTIVES
This research purposes is to investigate aspects and requirements for developing an
integrated decision support framework for managing complex business processes in

INTRODUCTION
24
healthcare facilities. The question that might be raised here is whether there is
something so unique and special about healthcare in general and managing healthcare
processes in particular, that it requires special attention and dedicated research.
Therefore, the aim of the research is to increase the understanding of what is required in
order to gain acceptance of decision support tools in the management of healthcare
business process. In order to gain acceptance and credibility in healthcare community,
the integration between different modeling and decision making tools has shown to be
beyond any doubt, that it works both as a tool for learning and decision making in real-
world cases. Consequently, the main question in this research is:
“Can an integrated decision support framework be developed for managing
complex dynamic business processes in healthcare facilities?”
This main question can be further divided into four major research questions:
RQ1: How applicable are existing solution techniques in handling the dynamics and
complexity within healthcare facilities and how efficient are they in supporting
their business processes?
RQ2: What are the similarities and differences between complex business processes in
the healthcare setting and in the supply chain context?
RQ3: What are the aspects and requirements involved in the design and development
of an integrated management framework for complex business processes?
RQ4: How useful is the developed framework for healthcare facilities and to what
extent it can be applied?
In order to address these questions and in turn achieve the aim of the research, the main
objective has been outlined:
“To develop an integrated optimisation-based decision support framework
that is applicable in managing healthcare business process “

INTRODUCTION
25
Based on this central objective, the specific objectives have been specified and
summarised in Table 1-1.
Table 1-1 Research question and corresponding objectives.
Research Questions Research Objectives
1. How applicable are existing
solution techniques in handling the
dynamics and complexity within
healthcare facilities and how
efficient are they in supporting
their business processes?.
1. To gain in-depth understanding of
existing solution techniques for
managing complex business process.
2. What are the similarities and
differences between complex
business processes in the
healthcare setting and in the supply
chain context?.
2a. To highlight the relationships and
common features of healthcare
facilities.
2b. To explore the common challenges
and problems of business processes in
the healthcare setting and supply chain
context.
3. What are the aspects and
requirements involved in the
design and development of an
integrated management framework
for complex business processes?.
3a. To investigate aspects and
requirements for developing an
integrated decision support framework
for managing complex business
processes in healthcare facilities.
3b. To develop an integrated framework
for supporting critical decisions.
4. How useful is the developed
framework for healthcare facilities
and to what extend it can be
applied?
4a. To evaluate and validate the proposed
framework.
4b. To deliver cost-effective solutions for
healthcare operations managers and
planners.
4c. To optimise operations and offer
excellence in healthcare delivery.

INTRODUCTION
26
1.5 THESIS LAYOUT
The layout of the thesis is illustrated in Figure 1-6.
Chapter two and three provides a summary of the literature review for the
existing solution techniques for complex business process in the context of
healthcare and supply chain. This is to gain thorough insights regarding
currently applicable approaches for managing complex business process in
general and in healthcare in particular.
Chapter four highlights the research philosophy and approach as the basis to
conduct this research. A detailed design of the research process is then given to
address the research questions with a description of the research methods and
procedures followed to achieve the objectives of this study. Besides, the chapter
addresses the gaps in the research those were derived from chapter two and three
for the design and development of the integrated framework.
Chapter five uses a case study of a healthcare facility (e.g., emergency
department) to empirically evaluate the developed framework.
Finally, chapter six concludes the thesis and highlights future work
recommendations.

INTRODUCTION
27
Literature Review
Framework Evaluation and Validation
Conclusion and Future
Work
Existing
Solution
Techniques
Chapter 2 & 3
Chapter 4
Chapter 5
Chapter 6
Objective 1
Objective 3a
Objective 3b
Objective 2a
Objective 2b
Objective 4b
Objective 4c
Objective 4a
Research Methodology and Theoritical
framework Developement
RQ 1
RQ 2
RQ 3
RQ 4
Framework related objectives
Application related objectives
Research questions
Healthcare
Facilities
Supply
Chain
Networks
Identification of
Gaps & Limitations
Figure 1-6 Thesis layout and research methodology.
LITERATURE REVIEW
28
CHAPTER 2: LITERATURE REVIEW
2.1 INTRODUCTION
From the beginning of the industrial revolution, the onus had been on improving and
automating production efficiency and costs (Lindsay et al., 2003). At early stage of the
20th
century, Frederick Taylor developed his theories of scientific management (Taylor,
1919) which involved breaking the organisation processes down to a cycle of a simple
sequence or chain of activities. The basis of such breaking down is that each activity is
carried out in the least amount of time possible with the minimum amount of effort.
In Taylor‘s time, specialisation was the state-of-the-art method to improve efficiency
(Davenport, 1995), however, technology did not allow large companies to design
processes in a cross-functional or cross-departmental manner. As technology changed
with time, the principles of scientific management have also evolved, which was a step
in the introduction of business process reengineering (BPR) (Hammer, 1990). As is
widely known, BPR is the fundamental rethinking and radical design of business
processes to achieve dramatic improvements in critical and contemporary measures of
performance, such as cost, quality, service and speed (Davenport, 1993).
In contrast to the radical approach of BPR, total quality management (TQM) philosophy
is based on an incremental approach for continuously improving the quality of products
and processes (Oakland, 1993). Several authors have illustrated the complementary
nature of BPR and TQM (Macdonald, 1995), while others have highlighted their
contradictory aspects (Mumford and Hendricks, 1996). The notion of balance between
incremental and radical organisational change has been a consistent theme across
several research approaches (Burgelman, 1994, Brown and Eisenhardt, 1998, Gavetti

LITERATURE REVIEW
29
and Levinthal, 2000), which resulted in the emergence of the concept of business
process management (BPM). BPM is concerned with how to manage processes on an
ongoing basis, and not just with the one-off radical changes associated with BPR
(Armistead and Machin, 1997).
That process view of systems increases the organisation flexibility to respond to the
demands of customers and facilitates increased reliability and consistency in products
and service delivery (Garvin, 1995). Therefore, assessing process performance is
essential because it provides the capability to identify performance bottlenecks and
taking corrective action before these problems escalate (Kueng, 2000). Over the past
two decades, several performance measurement systems were introduced in order to
offer a solution to the criticisms of traditional financial-based measurement models
(Fitzgerald et al., 1991, Kaplan and Norton, 1992, Lynch and Cross, 1995, Neely et al.,
2002).
Nevertheless achieving the full potential of performance measurement approaches
requires managing issues regarding business process performance improvement and the
provision of support to the associated decision-making processes. These issues and the
related problems of on currently used performance measurement systems are discussed
in Section 2.2 along with the unsuccessful attempts to support decision-makers in such
complex systems. This is followed by a discussion about multi-criteria decision analysis
(MCDA) tools and simulation modelling in section 2.3 and 2.4 respectively, by
highlighting their strengths and how they can contribute to support performance
measurement and management of complex business processes. Section 2.5 concludes
the chapter.

LITERATURE REVIEW
30
2.2 PERFORMANCE MANAGEMENT
Performance management is seen as having a key role for supporting the strategic as
well as the operational aspects in the decision making process. According to Meliones
et al. (2001, p. 28):
“When dramatic changes are inevitable, developing a strategic focus and
examining the business and quality of the healthcare in a measurable and
repeatable manner becomes each organisation’s opportunity”
In this section, an overview of the balanced scorecard (BSC) is given as one of the
powerful performance management tools (Kaplan and Norton, 1992). This is followed
by a discussion about the application of BSC in the healthcare context, along with
highlighting its current limitations.
2.2.1 Balanced Scorecard
The balanced scorecard (BSC), one of the main performance measurement frameworks
used by organisations, was originally introduced by Kaplan and Norton (1992). The
BSC is a systematic methodology that uses strategy-linked leading and lagging
performance measures and actions for planning and implementing an organisation‘s
strategy (Kaplan and Norton, 1996). Four performance perspectives are recommended
by the balanced scorecard; financial, customer, internal, and innovation and learning.
By using the BSC, organisations can ensure a clear link between their strategy,
performance measures and the risks of strategic and operational decisions (Kaplan and
Norton, 2001). As a conceptual tool, the BSC can also help staff and stakeholders better
understand an organisation‘s key strategies and how activities are related to it. Among
the main benefits of applying the BSC are; 1) an excellent way for communicating and
gaining insights into strategic initiatives, key objectives, and actions among decision

LITERATURE REVIEW
31
makers and other staff; 2) alignment of the organisation around its mission and
strategies and 3) facilitating, monitoring, and assessment of strategy implementation.
2.2.2 Applications of BSC in Healthcare
The BSC was discussed as an appropriate tool for healthcare organisations as early as
1994 where Griffith (1994) places the BSC in the broader notion of championship
management. He says that the BSC allows healthcare organisations to track their
performance on several dimensions and to establish integrated targets and goals. Several
articles have described financial success stories by using BSC in healthcare
organisations, whether by solving financial crises (Jones and Filip, 2000, Meliones,
2000, Mathias, 2001) or by reducing costs (Berger, 2004, Gonzalez et al., 2006,
Colman, 2006). Apart from financial, reasons the BSC has become a regular step in
quality improvement within several healthcare organisations (Moullin, 2004). It has
become a tool for developing quality plans and for evaluating quality improvement
processes (Peters and Ryan, 1999, Colaneri, 1999, Santiago, 1999).
Additionally, to assist progress toward performance targets and quality improvement,
Chow-Chua and Goh (2002) established a balance between critical performance
measures and quality improvement work which was combined with indicators of non-
financial characteristics. The BSC has been also used to measure quality of care and
patient satisfaction by Hall et al. (2003). The BSC has also been related to the
allocation of resources and as a rating and reward tool in several healthcare
organisations (Pineno, 2002, Biro et al., 2003, Gumbus et al., 2003). For example,
within the National Health Service (NHS) in the UK, the performance of hospitals is
monitored through a BSC-based rating system (Givan, 2005, Patel et al., 2008).

LITERATURE REVIEW
32
Another area for the application of BSC within healthcare organisations is
benchmarking, which can be found both internally within different organisations as well
as between organisations nationally and internationally. Benchmarking by means of the
BSC on a national level has also been found between hospitals in Canada in Ontario
(Pink et al., 2001), healthcare for veterans in the US (Biro et al., 2003), within hospitals
in Denmark (Ten Asbroek et al., 2004), and within the NHS in the UK (Chang et al.,
2002).
2.2.3 Performance Perspectives for Healthcare Systems
Although Kaplan and Norton originally emphasised four key perspectives (financial,
internal process, customer, and learning and growth), the unique features of healthcare
systems have resulted in many innovations and applications of the BSC. Consequently,
the number of considered perspectives varies from three (Bevan, 2006, Patel et al.,
2008) to as many as six perspectives in Kunz et al. (2005) and Peters et al., (2007).
Although, some of the scorecards were typical BSCs using the traditional four
perspectives, a number of organisations in a wide variety of health care sectors have
found it useful to make modifications to Kaplan and Norton's original formulation
according to their institutions current conditions. For example, Potthoff et al.(1999)
report a long-term care organisation creating a balanced scorecard containing the
perspectives of "development and community focus", "human resources", and "quality
of care and services". Curtright et al. (2000) describe how the Mayo Clinic modified the
balanced scorecard in line with its core business principles, including the interesting
perspectives of "mutual respect and diversity" and "social commitment". Santiago
(1999) argues that quality of care and outcomes are important to healthcare
organisations and cite the example of Carondelet Health Network that added

LITERATURE REVIEW
33
―outcomes‖ as a perspective. In addition to adding or modifying perspectives, some
organisations modify the basic structure of the balanced scorecard. Rimar (2000)
discusses how the physician practice plan at the Yale University School of Medicine
demonstrates that it values the customer perspective above others by placing the
customer domain at the top of the balanced scorecard. In another approach to tailoring
perspectives for an organisation, Zelman et al. (1999) focused on adapting the balanced
scorecard for academic health centres to reflect the research, teaching, and other unique
characteristics of this segment of the healthcare industry. In addition, new perspectives
and terminology, for example, clinical perspective, social commitments or employee
perspective (Kumar et al., 2005, Schmidt et al., 2006). Therefore, BSC in healthcare
organisations presents a different picture to other industries in relation to the range of
perspectives. In healthcare, the BSC scorecard appears more diverse than in other
sectors.
The financial perspective in a for-profit setting would show the results of the
organisation‘s strategy from the other perspectives while for a not-for-profit and public
sector setting it would show that the organisation achieves its results in an efficient
manner that minimises cost (Olve et al., 1999). However, it is recommended for not-for-
profit organisations to place their customers (patients) – not the financials – at the top of
its BSC (Kaplan and Norton, 2001). Moreover, Voelker et al. (2001) suggest that the
financial perspective can be excluded in some not-for-profit organisations from the BSC
since financial performance cannot demonstrate success.
2.2.4 Challenges and Limitations
Although remarkable advances have been made, the theoretical development of
effective integrated, balanced and strategically driven performance measurement

LITERATURE REVIEW
34
framework is still challenged by some issues on both the design and implementation
levels. While BSC has been applied successfully as a strategic management tool, there
are reports of evidence of many failures (Neely and Bourne, 2000). The design of the
BSC assumes that an overall vision can be defined and that the units within the
organisation are coordinated to accomplish that vision. However, healthcare
organisations are traditionally loosely coupled organisations where strategic planning
and management are not as vital as in more centralised organisations (Zelman et al.,
1999). The choice of performance perspectives to be included in the BSC is another
main challenge in designing BSCs in healthcare settings. In public healthcare
organisations, the focus of scorecards should be on patient health and on the change to
the lives of the people who these healthcare institutions are trying to help (Gurd and
Gao, 2007). Further, the ranking of these perspectives within the BSC can be
questioned (Zelman et al., 1999).
Another challenge related to the design of BSC for healthcare facilities is the selection
of performance measures that to be used within the scorecard. The BSC is supposed to
assist in identifying the most critical measures for monitoring performance and for
developing strategy direction. Consequently, the selected measures should support
strategic decisions as well as operational decisions. The attention in most of the work
presented in the literature focused on how the BSC was designed rather than how it was
used within healthcare organisations (Chow et al., 1998). Several studies indicate that
the BSC was initially regarded as a model for performance measurements with little or
no connection at all to strategy implementation (Castaneda-Mendez et al., 1998,
Griffith, 2000). Healthcare organisations have faced many challenges in implementing
the balanced scorecard in the healthcare settings (Zelman et al., 2003). For example,
many of the measures and indicators in the BSC (e.g., medical staff relations and quality

LITERATURE REVIEW
35
of care) can be difficult to measure and to interpret. This is further challenged by the
poor data warehousing of healthcare organisations and the existence of multiple
information systems that are not integrated (Dziuk, 2001). Furthermore, the number of
performance measures is challenged by the amount of resources tied up in the
measurement process, in terms of data collection and analysis and the representation
and interpretation of the measures (Gao et al., 2006).
Finally, the connections and interactions between the performance indicators within the
BSC are, in most articles, assumed and treated as unproblematic issues (Aidemark and
Funck, 2009), ignoring the fact that several of the indicators within the BSC can be in
conflict and can oppose each other (Patel et al., 2008). Providing information about the
causal–effect relationships between different types of indicators is then necessary to
reduce the split between different views about the performance indicators and to
conceptualise the dynamics and operations within the healthcare organisations.
However, due to the large number of variables and high levels of uncertainties and
dynamics associated with healthcare processes, the BSC alone has limitations in
measuring and inferring these relationships between performance indicators.
In summary, an analysis of the literature leads to two major conclusions. First,
effectively measuring and managing of process performance is a complex and
challenging task. Second, in order to provide a continuous and sustainable performance
improvement, then the different stages of the performance measurement and
management process starting with the design of measurement systems and their
implementation to the analysis of resulted information must be successfully completed
in an iterative and not a linear sequence of steps.

LITERATURE REVIEW
36
In the next two sections, a brief overview of MCDA and simulation modelling is given
along with their applications focusing on how these approaches can support the design,
implementation, analysis and use of measurement systems, providing an integrated
decision support system.
2.3 MULTI-CRITERIA DECISION ANALYSIS
The multi-criteria decision analysis (MCDA) approach takes explicit account of
multiple conflicting criteria in decision-making (Zionts, 1979). Multi-criteria methods
of dealing with complex problems of decision-making have been developed over the
last three decades, in which many alternatives can be evaluated with respect to many
quantitative and/or qualitative criteria (Kennerley and Neely, 2002).
2.3.1 Applications
Given the multi-dimensional nature of the BSC, several studies have combined multi-
criteria analysis techniques with the BSC. Clinton et al. (2002) and Searcy (2004) have
used the Analytic Hierarchy Process (AHP) (Saaty, 1990) for the selection of
performance measures to be used in the balanced scorecard. Similarly, Karra and
Papadopoulos (2005) applied the AHP to develop a BSC for a Cancer Hospital, where
the AHP was used to select the most important measures and then to evaluate their
weights. Other applications of the AHP method within a BSC system can be found in
Reisinger et al. (2003), Fletcher and Smith (2004), and Huang (2009); these place
emphasis on the development of a performance measurement system in for-profit
organisations. Furthermore, Chan (2006) used the AHP to select the appropriate
measures for developing an aggregate BSC of 95 acute-care hospitals where 39
indicators are grouped into the traditional four perspectives of the BSC. Moreover,
Leung et al. (2006) combined the BSC with Analytic Network Process in order to

LITERATURE REVIEW
37
overcome the feedback and interdependence between perspectives and measures.
Analytic network process enhances the function of AHP by incorporating
interdependent relationships between perspectives or measures (Saaty, 2004).
The decision-making trial and evaluation laboratory (DEMATEL) approach can also be
integrated with the analytic network process to deal with the interdependencies among
the performance measures (Tsai et al., 2008). Other multi-criteria analysis methods have
also been applied in the design and evaluation of BSCs. For example, Valiris et al.
(2005) use the Simple Multi-Attribute Rating Technique (SMART) in order to select
appropriate measures for the development of a BSC system in a financial institution.
Likewise, Bezama et al. (2007) combined several multi-criteria analysis tools in order
to develop a BSC model for remediation project. Similarly, Wu et al. (2009) applied a
fuzzy AHP to estimate the relative importance of the chosen BSC measures, while other
multi-criteria analysis methods are used for the performance evaluation of various for-
profit organisations.
2.3.2 Discussion
The achievement of high levels of performance on one measure is mostly obtained at
the expense of performance on one or more other performance measures, making trade-
off among these measures is inevitable (Skinner, 1974). Despite the recognised
importance of explicitly dealing with priorities and trade-off between different
performance indicators (Banks and Wheelwright, 1979; 1985; Eccles and Pyburn, 1992;
da Silveira and Slack, 2001), very little work in the literature has been done to examine
the nature of the trade-offs between these measures and their inter-dependencies
(Mapes et al., 1997, Neely et al., 2000). Understanding the causes of unsatisfactory
performance levels and determining proper corrective actions requires, in most cases,

LITERATURE REVIEW
38
understanding and detailed analysis of the underlined process and the consideration of
trade-offs. However, the lack of analytical tools prevents decision makers to effectively
process all the information necessary to develop and implement better-informed
decisions and plans. Consequently, to deal with the dynamic complexity inherent in
business processes, modelling and simulation is required (Senge, 1990; Sterman, 1989).
The combined use of qualitative and quantitative modelling enriches the analysis and
can provide very useful insights for the design of measurement models and decision
support systems.
An overview of literature on modelling and simulation is provided in the next section,
highlighting their potential applications and their capabilities to model the dynamic
complexity of business process under study.
2.4 BUSINESS PROCESS MODELLING AND SIMULATION
Business process modelling and simulation plays a major role in the perception and
understanding of business processes. In most cases, a business process is as expressive
and as communicative as the technique that has been used to model it. Therefore, the
elements and the capabilities of a business process model play a significant role in
describing and understanding a business process. Discrete-event simulation (DES) has
proven to be an effective tool for process modelling and improvement (Benneyan, 1997,
Jun et al., 1999). For simplicity, from this point and through this thesis the term
simulation is used to denote DES to avoid confusion with other types of simulation. An
overview of the main modelling techniques is given in the next section. Then, a review
of the literature on the application of simulation modelling in the healthcare sector is
presented, which is followed by a discussion about the limitations of modelling and
simulation.

LITERATURE REVIEW
39
2.4.1 Process Modelling Techniques
There is abundance of business process modelling techniques with approaches that
capture different aspects of a business process, each having distinctive advantages and
disadvantages. Authors such as Melao and Pidd (2000), Aguilar-Saven (2004), Ryan
and Heavey (2006), Vergidis et al. (2008), and Aldin and de Cesare (2009) have
provided frameworks for presenting and classifying different business process
modelling techniques. The following is a summary for the main techniques that were
found as the most frequently used.
2.4.1.1 Flow Chart
Flow charts are the most basic type of diagrams that show the flow of controls and
actions of a business process using graphical representations (Lakin et al., 1996). Flow
charts were initially developed for software specification (Knuth, 1963), but their
simplicity and flexibility have attracted managers to adopt this technique for modelling
their business processes (Aldin and de Cesare, 2009). The modelling elements of flow
charts are simple, yet powerful enough to illustrate the activities that occur within a
business process. Given that simplicity, flow charts are effective in fast and informal
representation of process representation, and therefore they are effective in
communication and discussions between analysts and stakeholders. However, flow
charts use a sequential flow of actions and do not support a breakdown of activities
(Aguilar-Saven, 2004). Moreover, flow charts lack the necessary semantics to support
more complex and standardized constructs (Havey, 2005). Finally, the other hand the
technique does not have the means to explicitly represent services, events and rules
(Aldin and de Cesare, 2009), and also cannot describe responsibilities or performers in
the chart, which results in difficulties to relate the organisational functions or
departments to activities (Aguilar-Saven, 2004).

LITERATURE REVIEW
40
2.4.1.2 Data Flow Diagrams
Data flow diagrams (DFD) are graphical representations that show the functionality of a
system, with its underlying processes and flow of data and how information enters and
leaves processes (Lee and Wyner, 2003). DFDs enable multi levels of representation by
breaking down each process into sub-processes at a lower level (Aguilar-Saven, 2004,
Aldin and de Cesare, 2009). These functional decomposition capabilities of DFDs allow
for the presentation of more abstract and more detailed representations of the same
process, and thus allowing represent the functional dependences among the activities of
a business process (Carnaghan, 2006). DFDs also specify the meaning of operations and
system constraints by showing where information is stored within the process, and the
organisational function to which the activity belongs (Aguilar-Saven, 2004).
Additionally, DFDs are simple and easily understood (Shen et al., 2004) and
accordingly are used for communication and in discussions between analysts and users,
as they are also easy to draw, improve and amend (Damij, 2007).
2.4.1.3 Role Activity Diagrams
Unlike flow charts and DFDs that focus more on procedures and data, role activity
diagrams (RADs) are a more process-oriented technique that allow a business process to
be modelled diagrammatically through roles, goals, activities, interactions and business
rules (Ould and Ould, 1995). RAD notation enables the representation of the process in
terms of: roles, resources, activities, users, states, and the interaction between
participants that represent actions and the speech of acts of a process (Cordes, 2008).
Roles are an abstraction of real behaviour that is represented in RAD by grouping
activities that carried out by an individual or a group (Phalp et al., 1998). Roles enable
modeller to refine and modify the process activities without affecting the whole model.
The approach provides a flexible and easy to use and understand support that can help

LITERATURE REVIEW
41
stakeholders to visualise the business process so that decisions can be made that leads
towards improvements (Aldin and de Cesare, 2009). However, the technique explicitly
excludes business objects such as physical resources (e.g., machines), products, and
services. Moreover, RAD does not support process decomposition as processes are only
presented as a sequence of activities (Aguilar-Saven, 2004).
2.4.1.4 IDEF
The Integrated Definition for Function Modelling (IDEF) is a family of methods that
supports a paradigm capable of addressing the modelling needs of an enterprise and its
business areas (Aguilar-Saven, 2004). For business process modelling, the most useful
members of the IDEF family are IDEF0 and IDEF3. IDEF0 was developed from the
Structured Analysis and Design Technique (SADT), which is a methodology to be used
as a regimented approach to analysing an enterprise (Marca and McGowan, 1987).
IDEF0 is a structural graphical representation of processes or complex systems that
allow the analysis and communication of the functional aspect of a system (NIST,
1993). Each process in IDEF0 is described as a combination of activities, inputs,
controls and mechanisms in a hierarchical fashion. At the highest level the
representation may be of an entire process. The processes can be further decomposed to
show lower-level activities. The breakdown of processes may continue until the point is
reached where sufficient detail is reached (Colquhoun et al., 1993). This hierarchical
structure of IDEF0 keeps the model scope within the boundaries and allows the system
to be easily refined into more detail until the model is as descriptive as necessary for the
decision maker (Kim and Jang, 2002). While IDEF0 shows what is done within the
organisation, in terms of its business processes, IDEF3 shows how things work within
the system by capturing behavioural aspects of a business process (Aguilar-Saven,
2004). Such behavioural aspects are captured by describing the causal relationships

LITERATURE REVIEW
42
between activities and events of the process. IDEF3 consists of two modelling modes:
the process flow description (PFD) and the object state transition description (OSTD).
PED describes how things actually work in the business process while OSTD which
describes the object‘s allowable transitions through a particular process. Both PFD and
OSTD contain units of information that makeup the description of the whole process
and the representation of resource interactions and queuing information (Ryan and
Heavey, 2006).
2.4.2 Simulation Modelling in Healthcare
Healthcare managers can apply simulation for assessing current performance, predicting
the impact of operational changes, and examining the tradeoffs between system
variables (Wierzbicki, 2007). Furthermore, identifying areas of improvement of service
through possible reorganisation of existing resources, for example; reorganisation of
surgical and anaesthesia care surrounding laparoscopic surgery (Stahl et al., 2004); and
planning for the geographical locations of new healthcare services taking into account
the demographics of the population and the location of the patients who need the
services (Harper et al., 2005). Simulation is well-suited to tackle problems in hospital
departments such as emergency departments and operating rooms, where resources are
scarce and patients arrive at irregular times (Jun et al., 1999) and effectively combine
data mining (Ceglowski et al., 2006) for better results. Simulation is also found to be
effective for other units such as outpatient clinics, where different alternative
configurations can be evaluated and tested (Swisher and Jacobson, 2002).
2.4.2.1 Inpatient Facilities
Efforts to develop DES models in healthcare have been advancing since the late 1980s
when Saunders et al. (1989) proposed a model to study the impact of key resources on

LITERATURE REVIEW
43
waiting times and throughput. Since that time, simulation models have been used to
study the effect of a wide range of health interventions on healthcare processes
performance, for example; designing a new house staff work schedule (Dittus et al.,
1996) or ambulance schedules (Ingolfsson et al., 2003); improving capacity utilisation
in intensive care units (Kim et al., 1999, Litvak et al., 2008); and planning healthcare
services (Oddoye et al., 2009). Patient flow to hospital beds, occupancy levels of beds,
and length of stay (LOS) are common areas that have been investigated for many years.
For example, in an acute hospital in the UK, the impact of the bed occupancy level on
the flow of inpatients has been investigated using discrete-event stochastic simulation
models (Bagust, 1999). Results show that hospitals operating at bed occupancy level of
90% or more are likely to face regular bed crises. Hospitals with a bed occupancy level
of less than 85% generally avoid a bed crisis as well as the associated risks to patients.
Management should therefore plan interventions on a long term basis to match future
demand growth (Bagust, 1999). Subsequently, this threshold of bed occupancy (i.e.,
85%) has been acknowledged by the national health (NHS) (Bourn, 2000).
Simulation models allow a more accurate interpretation of the utilisation of hospital
resources, which in turn supports the hospital management in their decisions on bed
usage and patient flow (Harper, 2002). This can be achieved by modelling the flow of
patients through the whole hierarchy of hospital. Scenarios can then be used to illustrate
the consequence of possible potential decisions suggested by the hospital management.
The participation of multiple hospitals in the development phase of simulation models
can result in a generic framework that allows for the incorporation of uncertainty or
trends in the arrival profiles of patient groups as well as duration variability (e.g. LOS
or surgery durations). A more general simulation-based framework was proposed by
Harper and Shahani (2002), for the planning and management of hospital beds,

LITERATURE REVIEW
44
operating theatres and workforce. The implementation of their integrated framework
resulted in a flattened occupancy rate and a drop of the overall surgery refusal rate from
5% to 3%.
2.4.2.2 Operating Rooms
Performance measures for a surgical unit were investigated by Sciomachen et al. (2005)
using a simulation model with special focus on wards‘ productivity in terms of
utilisation rate, patient throughput and overruns. The reported results from their model
concluded that applying the master surgery schedule reduces the waiting list and the
number of overruns by about 25% and 10% respectively. To compare the use of a
pooled list with scheduled lists, Vasilakis et al. (2006) presented a simulation model
that considered surgeons availability, which in turn depended on other clinic activities.
A 30% reduction of patients waiting time has achieved using their proposed model
under the pooled-list method. A study of a surgical unit using simulation was also
presented by Cardoen and Demeulemeester (2007) which shows the effects of the
changes bed capacity on the utilisation of beds.
A simulation model was presented by Marcon and Dexter (2007) to examine how
standard sequencing rules, such as longest case first or shortest case first, may assist in
reducing the peak number of patients in both the holding area and the post anaesthesia
care unit. A similar analysis of such sequencing rules was provided in Marcon and
Dexter (2006). In this study, however, the authors studied make-span of the unit and the
peak number of patients. The make-span represents in this case the completion time of
the last patient's recovery. Simulation models can effectively evaluate critical decisions
concerning date, room and time assignments (Testi et al., 2007). When patients are
scheduled consecutively in an operating room, i.e. without incorporation of idle time,

LITERATURE REVIEW
45
the planned surgery start times (time decision) are determined by sequencing the
patients. Niu et al. (2007) described a simulation model in which scenarios were tested
with adapted resource capacities. In particular, they examined how the LOS of patients
varies according to changes in the number of operating rooms, chairs in the holding
unit, and available beds. Persson and Persson (2009) developed a simulation model to
study how resource allocation policies at the department of orthopaedics affected the
waiting time and utilisation of emergency resources, taking into account both patient
arrival uncertainty and surgery duration variability.
2.4.2.3 Emergency Departments
Recently calls for improved performance have grown significantly. Therefore,
applications for operational decision support are widespread and have become
increasingly significant (Eldabi et al., 2006). Most of these undertakings have focussed
on departmental operations, especially emergency departments (EDs). Performance
bottlenecks can be identified and resolved using simulation. In Tan et al. (2002), a
simulation model was used to compare different alternatives to staff schedules with the
current schedule. The results identified the doctor‘s station as the bottleneck. The new
schedule, generated by queuing analysis, increased the capacity of the bottleneck and
hence reduced patient time in the system. Similarly, Coats and Michalis (2001)
compared different shift patterns via simulation and found that the doctor shift pattern
that best matched the patient arrival pattern gave the shortest wait times. The effect of
physical expansion of the ED on LOS is analysed by Samaha et al. (2003). However,
physician skills level was not considered in patients service time. In Duguay and
Chetouane (2007), a number of alternatives based on adding resources were investigated
with the objective of reducing patient waiting times and improving overall service
delivery and system throughput. The impact of different patient triage methods on

LITERATURE REVIEW
46
service times has been studied by Connelly and Bair (2004). Yet, variations in patients‘
arrival rate were not considered. Modelling the complex behaviour of an ED is a
challenging task, due to interaction of human and physical resources. Medical staff, for
example, are rarely dedicated to one patient or task, they treat several others while
waiting for other processes. This diversity of process interaction can be described as
multitasking, a common feature of ED operations. Yet, multitasking is rarely considered
in DES models of EDs (Gunal and Pidd, 2006). However, Thorwarth et al. (2009)
examined the impact of staff scheduling on overall utilisation and burnout issues related
to over-utilised staff. The tradeoffs between different alternatives such as adding more
beds or altering the admission rate was evaluated by Khare et al. (2009), where patient
LOS is considered as the key performance indicator (KPI). Measuring crowding in an
ED was achieved by Hoot et al. (2008). The theoretical model was validated with
patient data from an academic ED, which facilitated a patient tracking system. Metrics
such as patient waiting time, occupancy level, and length of stay, were used to apply
Pearson‘s correlation to achieve a forecast for the short term (eight hours).
Apart from the internal factors, there are many other external factors that affect the
crowding level of the ED, for instance, uncertainty in the arrival of patients. Simulation
models can effectively be used as a predictive tool to predict the maximum demand
level that the ED staff can handle, and consequently determine the required staffing
level to meet that increase in demand and at the same time to keep the average waiting
time of patients under a certain threshold (Baesler et al., 2003). A balance in the
utilisation of resources would be attained by analysing the arrival pattern of patients,
which can significantly improve staffing planning and resource allocation (Sinreich and
Marmor, 2005). Further, the effect of staffing levels was investigated to reduce patient‘s
length of stay (Sinreich and Jabali, 2007). Another factor that contributes highly to the

LITERATURE REVIEW
47
overcrowding of the ED is the shortage in hospital beds. The bed occupancy level has
been found to be strongly correlated with average length of stay of patients within the
ED (Forster et al., 2003). By using simulation models, Elbeyli and Krishnan (2000)
found that adding beds to other specialised units within the hospital decreased the
average time of patients waiting to be admitted from the ED. Lane et al. (2000) has also
examined how reductions in bed capacity in the hospital wards affected patient waiting
times in the ED. They examined the ED as part of the larger hospital wide system and
considered emergency patients and elective treatment patients.
2.4.3 Limitations
Although a substantial number of simulation studies were reported in the healthcare
literature as a decision support tool, most of these studies do not support continual
improvement philosophies. A number of performance measures are needed to achieve
this continual improvement by representing more than one perspective of the
performance. However, most of the reviewed studies consider only small number
performance measures such as waiting time and LOS, while other performance
measures such as resource utilisation, productivity, and layout efficiency are rarely
combined. Linking these measures to international standards and national metrics is
mostly neglected. There is a lack of simulation studies that use multiple perspectives of
performance, which is pivotal to support not only operational decisions, but also to
coordinate diverse staff categories toward the strategic direction and for dealing with the
multiple and complex criteria influencing decision making process in healthcare. These
limitations can be mitigated by combining BSC and MCDA tools with simulation
modelling. The BSC can be used to represent different performance areas in a balanced
manner while MCDA tools can explicitly consider the trade-offs among the selected
performance measures.

LITERATURE REVIEW
48
2.5 CONCLUDING REMARKS
Decision makers in both the private and public sectors are under constant pressure to
improve the performance of their business processes. However, making informed
decisions is challenged by the high level of dynamic complexity and uncertainty of
today‘s business processes; particularly, in the healthcare domain. Therefore, finding
effective solutions requires decision makers to change the way they think and
consequently, enabling a more effective use of the available information and
sophisticated decision support tools. While considerable progress has been made
recently towards designing and developing effective decision support systems, there still
remain some issues to be addressed. Particularly, helping decision makers 1) to build a
better understanding about the underlying process performance, 2) to understand the
implications of alternative solutions prior to their actual implementation and 3) to aid in
evaluating and eventually selecting appropriate plans and corrective actions. BSC,
MCDA, and simulation are approaches that have independently proved their potential to
support decision making. There is also a clear potential for these approaches to be
integrated and applied in a collaborative manner which can bring new insights to
support the different stages of the decision making process. Though simulation can
effectively contribute to the understanding of business process, it does not provide the
capability of finding the optimum values of decision variables in terms of predefined
objective function(s). This is the purpose of optimisation models, which allow decision
makers to find the best possible alternatives while their impact on the system
performance is evaluated using simulation models. Consequently, the incorporation of
optimisation capabilities with decision support systems will significantly help decision
makers to find answers for critical decisions such as staff scheduling, resource
allocation, and capacity planning, as will be discussed in the next chapter.

BUSINESS PROCESS OPTIMISATION
49
CHAPTER 3: BUSINESS PROCESS
OPTIMISATION
3.1 INTRODUCTION
Diagrammatic modelling of business process does not add much value without further
inspection and analysis of the business process model (Vergidis et al., 2008). Likewise,
though simulation modelling can effectively contribute to the understanding and
analysis of business process, it does not provide the capability of finding the optimum
values of decision variables and optimising a business process (van der Aalst et al.,
2003). An integrated approach toward the improvement of business processes should
support the modelling of business process, provide the necessary means to identify
performance bottlenecks, and to generate alternative decisions and optimum values for
decision variables in terms of specified objectives. Therefore, business process
optimisation is the automated improvement of business processes using through the
modelling, analysis, of the process and the generation of optimal solutions (Vergidis et
al., 2008). In this chapter, a brief description of optimisation principles and techniques
is provided in Section 3.2 and 3.3 respectively. This is followed by an extensive
literature review of optimisation techniques in the supply chain and healthcare contexts
in Section 3.4. Finally, the chapter in concluded in Section 3.5.
3.2 OPTIMISATION PRINCIPLES
Optimisation problems can be defined as determining the set of values of the decision
variables that are located in the feasible area determined by the underlying system
constraints that gives the optimum values of all objective functions. Formally:
Optimise )(xf i ,,, I1i

BUSINESS PROCESS OPTIMISATION
50
Subject to: 0)( xg j ,,, J1j
0)( xhk K1k ,,
Where )(xf iis the objective function i, )(xg j and )(xhk
are the set of inequalities and
equality constraints. The decision variables are represented as a vector Sx ; where S
is the region of search space that defines all possible combinations of decision variables
that satisfy all the constraints. As shown in Figure 3-1, the objective function vector F
maps decision variable space S into objective function space (i.e., search space).
Figure 3-1 Variable space mapping to decision and objective space.
For i = 1, it is considered as a single-objective optimisation problem; otherwise it is a
multi-objective optimisation problem. Multi-objectives can then be divided into two
major categories: the Pareto-based approach and the aggregate-based approach.
3.2.1 Pareto-Based Approach
For multi-objective optimisation problem (i.e., i ≥ 2), if all the objective functions are
to be considered concurrently, it is rare to find a common point x* that has an optimum
value for all the objective functions. Instead, Pareto optimality (Censor, 1977) has to be
applied that constitutes the origin of multi-objective optimisation.
To define Pareto optimal solutions, domination criteria have to be defined first. A
solution x1 S dominates another solution x2 S (denoted as x1 > x2) if solution x1 is no
x3
x2
x 1
F2SΩ

BUSINESS PROCESS OPTIMISATION
51
worse than solution x2 in all objectives and solution x1 is better than x2 in at least one
objective. According to this definition, a solution is Pareto optimal (x*) if there is exist
no x in the feasible search space that decreases some objective function without causing
a simultaneous increase in at least another objective function. The Pareto Optimality
always gives a set of optimal solutions called non-inferior or non-dominated solutions.
The mapping of Pareto optimal set into the objective function space represents the
Pareto Optimal Front (POF) as shown in Figure 3-2.
F2
F1
Ω
A
B
Pareto Optimal
Solutions
Ideal Solution
( non realistic)
Figure 3-2 A bi-objective optimisation problem.
3.2.2 Aggregate-based Approach
Aggregating functions are used to combine objectives into a single objective function,
known as weighted sum aggregation. The weighted sum approach transforms multi-
objective optimisation problem into a scalar one by adding all the objectives together
using different coefficients (i.e., weights) for each objective, formally:
Optimise
I
i ii xfwxF1
)()( , 1w0 i , and
I
i i 1w1
Where wi are the weighting coefficients of objective function fi(x). In weighted sum
approach, F maps the decision variable space S into a hyper-plane into the objective
function space Ω.
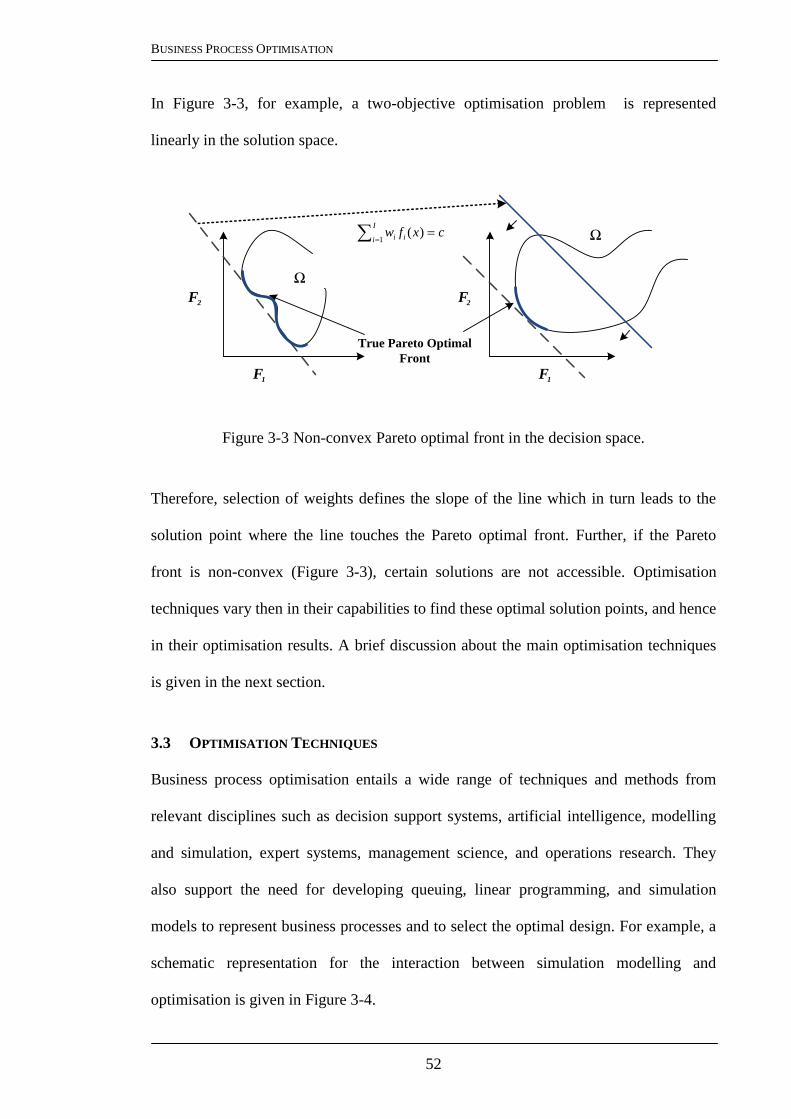
BUSINESS PROCESS OPTIMISATION
52
In Figure 3-3, for example, a two-objective optimisation problem is represented
linearly in the solution space.
Figure 3-3 Non-convex Pareto optimal front in the decision space.
Therefore, selection of weights defines the slope of the line which in turn leads to the
solution point where the line touches the Pareto optimal front. Further, if the Pareto
front is non-convex (Figure 3-3), certain solutions are not accessible. Optimisation
techniques vary then in their capabilities to find these optimal solution points, and hence
in their optimisation results. A brief discussion about the main optimisation techniques
is given in the next section.
3.3 OPTIMISATION TECHNIQUES
Business process optimisation entails a wide range of techniques and methods from
relevant disciplines such as decision support systems, artificial intelligence, modelling
and simulation, expert systems, management science, and operations research. They
also support the need for developing queuing, linear programming, and simulation
models to represent business processes and to select the optimal design. For example, a
schematic representation for the interaction between simulation modelling and
optimisation is given in Figure 3-4.
F1
Ω
F2
F1
Ω
F2
True Pareto Optimal
Front
I
i ii cxfw1
)(

BUSINESS PROCESS OPTIMISATION
53
Generally, optimisation techniques can be divided into four main categories: gradient-
based methods, statistical-based methods, meta-model-based, and meta-heuristics
methods.
Figure 3-4 Simulation modelling and optimisation interaction.
3.3.1 Gradient-Based Methods
Differentiation is usually used to simplify the objective function in order to find an
optimum solution. The gradient-based approach therefore requires a mathematical
expression of the objective function. When such a mathematical expression cannot be
obtained, there is a need to use an estimation technique to start the solution procedure.
The estimated gradient‘s direction guides the search process to move from one potential
solution to another in an iterative scheme in a process called stochastic approximation
(Robbins and Monro, 1951). Infinitesimal Perturbation Analysis (IPA) is one of the
gradient estimators that are considered to be unbiased (Glasserman, 1991). Its
convergence rate has been studied in L‘Ecuyer and Perron (1994), while variance
reduction and efficient implementation of IPA was investigated in Dai (2000). Another
important gradient estimator is Finite Difference Estimation (FDE), which determines
partial derivatives of the system performance measures (Dong and Krylov, 2005).
Constraint(s)
UncertaintiesD
ecis
ion
var
iab
les
Business Processx1
x2
xN
F1
F2
FM
Op
tim
isat
ion
?
?
?
Simulation
Model

BUSINESS PROCESS OPTIMISATION
54
In order to estimate the gradient at each search point, at least (n + 1) evaluations of the
simulation model are necessary, where n is the number of decision variables. For a more
reliable estimate, multiple observations for each derivative are required. On the other
hand, Likelihood Ratio Estimator (LRE) estimates the derivative of the performance
measure by mathematically differentiating the underlying probability measure of the
system (Glynn, 1990).
3.3.2 Meta-Model-Based Methods
While gradient-based estimators are used to estimate the derivatives of the objective
function, meta-model-based techniques use an analytical approach to approximate the
objective function. The meta-model can then replace part of the simulation model with a
mathematical function that mimics the input–output behaviour of that part. Such
integration of meta-models simplifies the simulation model in terms of computation
time, and consequently simplifies the optimisation process (Reis dos Santos and Reis
dos Santos, 2009). In Figure 3-5, the optimisation model interacts with the meta-model,
whilst the meta-model approximates the input–output behaviour of the simulation
model.
Simulation Model Optimisation
Meta-Model
Perfo
rm
an
ce
Measu
re(s
)
Decis
ion
Varia
ble
s
Figure 3-5 A Meta-Model interacts with the simulation and the optimisation models
The Response surface methodology (RSM) is based on procedures that allow regression
models to be applied to simulation model responses that are evaluated at several values
BUSINESS PROCESS OPTIMISATION
55
of decision variables using the design of experiments (DOE) method. A comprehensive
study of the use of statistical designs integrated with simulation models can be found in
Kleijnen (1998), which focuses on how RSM combines regression analysis, statistical
designs and the steepest descent/ascent method to optimise the objective function of the
simulated system. On the other hand, kriging (Hussain et al., 2002, Keys and Rees,
2004) is an interpolation method that predicts unknown values of a stochastic function
which are more flexible than polynomial models and less sensitive to small changes in
the experiment design (Meckesheimer et al., 2002). Another method is artificial neural
networks (ANNs), which has proven to be an effective method to approximate arbitrary
smooth functions and can be fitted using stochastic response values (Fonseca et al.,
2003). ANNs are developed to mimic neural processing, the inputs and outputs of which
are linked according to specific topologies.
3.3.3 Statistical Methods
Gradient-based and meta-model-based methods are used for continuous decision
parameters. In discrete decision parameters, the problem is to select one of the
predetermined system configurations. The task of optimisation algorithms is then to
select one of these configurations that optimise system performance based on the
selected criteria. Since the system performance is not deterministic, further statistical
analysis is required to compare alternatives. Different types of approaches were
developed for such optimisation problems, including ranking and selection (R&S),
multiple comparison procedures (MCP) and ordinal optimisation (OO). In R&S, there
are two main approaches. The first is the indifference zone approach, which finds the
decision variable values that make the value of the performance measure different from
the optimal performance by at most a small amount (i.e. the indifference zone). On the
other hand, subset selection is used to reduce the feasible solution region to a small

BUSINESS PROCESS OPTIMISATION
56
subset that at least contains the best solution. The indifference zone approach does not
require extensive computation efforts and can be applied to a single replication from
each solution (Kim and Nelson, 2001). The idea of MCP is to run a number of
replications and then evaluate system performance by constructing confidence intervals
(Swisher et al., 2003). However, it is difficult to precisely determine the best alternative
from a set of predefined solutions in terms of absolute values. OO determines which
solution is better, rather than focusing on the quantitative difference between the
available solutions. In addition, instead of looking for the best alternative, OO selects a
good enough solution (Ho et al., 2000). This crucial feature of OO makes it a robust
optimisation choice when the number of alternatives is very large (He et al., 2007).
3.3.4 Meta-Heuristics
Statistical methods are successfully used in the case of discrete decision parameters.
However, it is computationally unfeasible to evaluate every possible alternative or all
parameter combinations when the solution space is very large. Consequently,
determining which alternative(s) to simulate and evaluate is crucial. Also, most of the
aforementioned optimisation techniques fail to find an optimum solution when the
solution space is highly-dimensional and discontinuous, or when the decision variables
are qualitative. Meta-heuristics are used in such cases to efficiently guide the search
process towards potential solution points (Bianchi et al., 2009).
They ultimately provide balance between exploration of solution space and exploitation
of good solution(s) in an iterative process by initially starting with a solution (point-
based) or set of solutions (set-based or population-based), then in each iteration the
search progresses to new, possibly better, solution(s) in the neighbourhood of the
current solution. Each meta-heuristic method has its own mechanism to define the

BUSINESS PROCESS OPTIMISATION
57
neighbourhood structure (Andradottir, 2006). Simulated annealing (SA) is one of the
main meta-heuristics that starts with an initial solution, generally chosen randomly. A
neighbour of this solution is then generated by a suitable mechanism. The performance
of this solution is then calculated. If an improvement occurs, the generated neighbour
replaces the current solution. If there is no improvement in the performance, the SA
algorithm may accept this solution with some probability to avoid entrapment in a local
optimum (Kirkpatric et al., 1983).
Another common meta-heuristic method is the genetic algorithm (GA), which works on
a population of solutions in such a way that poor solutions are excluded, whereas good
solutions evolve to reach their optimum solution (Chaudhry and Luo, 2005). The GA
generates an initial population of solutions, which can then be evaluated through a
simulation model. This is followed by a selection process in which genetic operators are
applied to produce new solutions that are inserted into the population. Figure 3-6
demonstrates the integration process between a GA and a simulation model. This
process is repeated until some stopping criterion is reached. Artificial immune system
(AIS) is another meta-heuristics optimisation method which seeks to capture some
aspects of the natural immune system in a computational framework, either for the
purpose of modelling the natural immune system or for solving engineering
optimisation problems (Glickman et al., 2005).
Tabu Search (TS) is a constrained search procedure, where each step consists of solving
a secondary optimisation problem (Glover et al., 2007). At each step, the search
procedure removes a subset of the search space. This subset changes as the algorithm
proceeds and is usually defined by previously considered solutions which are called the
reigning tabu conditions (Chelouah and Siarry, 2000).

BUSINESS PROCESS OPTIMISATION
58
Problem
Formulation
Conceptual
Model
Data
Collection
Model
Costruction
Validated?
Verified?Simulation
Model
Fitness
Computation
Initial Population
Replacement
Mutation
Crossover
Selection
Optimal/Near Optimal
Solution(s)
Converged?
NO
NO
YES
YES NO
Simulation Modelling Genetic
Algorithm
Figure 3-6 A Genetic algorithm integrated with simulation for fitness computation
3.4 OPTIMISATION APPLICATIONS – A REVIEW
Optimisation techniques have contributed to resolve many challenges at different levels
of a supply chain (Abohamad and Arisha, 2011). These challenges emerge from the
increasing complexity of supply chain networks which is imputable to high level of
uncertainty in supply-demand, conflict objectives, and large number of decision
variables and constraints. Similar challenges are confronted in managing healthcare
processes.
Healthcare can significantly benefit from the application of optimisation techniques in
supply chain management. Therefore, and based on the research problem definition
discussed in Section 1.2 and the motive of this study (see Section 1.3), a systematic
review of the literature has been performed to address the first two research questions
and the corresponding objectives (Table 3-1). The resulted body of articles from the
systematic review are further critically reviewed and analysed to achieve these
objectives and to identify the gaps in the literature.

BUSINESS PROCESS OPTIMISATION
59
Table 3-1 The review research questions and their corresponding objectives.
Research Questions Research Objectives
1. How applicable are existing solution
techniques in handling the dynamics
and complexity within healthcare
facilities and how efficient are they in
supporting their business processes?
1. To gain in-depth understanding of
existing solution techniques for
managing complex business process.
2. What are the similarities and
differences between complex business
processes in the healthcare setting and
in the supply chain context?
2a. To highlight the relationships and
common features of healthcare
facilities.
2b. To explore the common challenges
and problems of business processes in
the healthcare setting and supply
chain context.
The methodology followed in the review is based on the process of ―systematic review‖
(McKibbon, 2006) and the literature review framework presented in Eldabi et al. (2008)
and Jahangirian et al. (2011), which are widely used for systematic review of the
literature (Naseer et al., 2009, Brailsford et al., 2009, Jahangirian et al., 2010).
The review covered academic, peer-reviewed publications of techniques applied in
managing and optimising complex processes in the healthcare and supply chain context.
Due to the increased complexity of business processes and the significant advances in
the wide application of optimisation techniques over the last decade, the review is
limited to the period 2000-2009. Papers that discuss theoretical aspects of optimisation
methods are also included to give a background to these techniques. Therefore, the main
criteria for inclusion of a paper in this review is that the paper should describe an

BUSINESS PROCESS OPTIMISATION
60
application in either the healthcare or supply chain context. A number of other exclusion
criteria were used at this stage to narrow down and filter out the initial batch of searched
academic papers. Because the focus of this research is on the management of business
process, papers that discussed disease and medicine are excluded from the review.
Further, data visualisation tools, such as CiteSpace (Chen, 2006) were employed to
identify irrelevant keywords and subject areas for each domain, and at the same time the
most cited references (Naseer et al., 2009, Jahangirian et al., 2010). Following the
screening, abstract reading and full-text reviewing of the resulting papers was carried
out. Applying filtering mechanisms can result in possible missing of some important
articles. Accordingly, reference chasing methods – both backward and forward
techniques (Greenhalgh and Peacock, 2005, Jahangirian et al., 2011) – have been
applied to identify the key papers and emerging issues. A summary of the review steps
methods is given in Table 3-2. Following the selection of the final set of 223 papers, the
following attributes were extracted for each article:
1. Application and problem areas: what is the general application orientation of the
paper: supply chain or healthcare? What is the specific area of application within
the context of these sectors? For example, what is the type of healthcare facility:
emergency department, outpatient clinic, intensive care unit or operating room?
2. Techniques and methods: what are the methods applied in the article: modelling,
simulation, optimisation or combination of methods? For each method, what is the
type of the method? For example, what specific optimisation technique is discussed
in the article: mathematical programming, greedy search and heuristics, or meta-
heuristics? And if it is meta-heuristics, what is the specific algorithm used: genetic
algorithm, tabu search, or stimulated annealing?

BUSINESS PROCESS OPTIMISATION
61
Table 3-2 Literature review steps and methodology
Review Step Methods and Details
Searching Database search (SCOPUS and ISI Web of
Knowledge)
Reference chasing methods (backward and
forward)
Literature Covered 5. Peer-reviewed academic papers
Time Covered 6. 2000-2009
Inclusion Criteria Applications in the healthcare and supply chain
context
Empirical and methodology studies
All peer-reviewed papers
Exclusion criteria: Non-healthcare or non-supply chain Applications
Disease modelling
Cost-benefit analysis
Medical modelling
Non-English language papers
Pre-2000
Sample Size Initial search: 3811
After screening and filtering: 632
After abstract reading: 174
After reference chasing: 223
Data Analyses Attributes By types of solution technique
By specific methods
By applications and problems
By types of healthcare facility
Through the analysis of literature on business process optimisation in healthcare and
supply chain, the common problems and decision areas have been identified and
grouped into five main categories as shown in Figure 3-7.
A detailed discussion about each of these problems is presented in the following
sections, where each problem is discussed first in the context of supply chain then
followed by similar problems in the healthcare sector.

BUSINESS PROCESS OPTIMISATION
62
Figure 3-7 Optimisation application areas.
3.4.1 Scheduling
Scheduling is an active area of research in supply chain as well as in healthcare
applications for increasing capacity utilisation, cost control measures and improving
tactical as well as operational efficiencies of services and facilities. Optimisation
techniques are used for a wide range of scheduling problems such as staff scheduling,
patient-staff/patient-facilities scheduling, planning and scheduling of operating room
surgeries, and production and dispatch planning and scheduling.
The intelligent search capabilities of the genetic algorithms are incorporated with
simulation and investigated by Feng and Wu (2006) to find the optimal dispatching
schedule for a batch plant. The modelling capability of discrete event simulation and
genetic algorithm is presented applied for solving a multi-attribute combinatorial
dispatching problem in a flow shop in a manufacturing plant (Yang et al., 2007).
Factorial experimental design was used to collect structured data from simulation results
which are then used to construct a response surface to optimise the parameters of
genetic algorithm. An integrated approach for the planning and scheduling of
Scheduling38%
Logistics & Inventory
Management25%
Demand & Capacity
Planning14%
Resource & Location
Allocation13%
Routing10%
43%
40%
17%
Patient scheduling
Operations Scheduling
Staff scheduling

BUSINESS PROCESS OPTIMISATION
63
generalised supply chains is introduced by Amaro and Barbosa-Póvoa (2008). The
supply chain is described not only by the traditional forward flow, that links suppliers to
customers through factories, warehouses and distribution centres, but also considers the
existence of reverse flows where recycling or non-conforming products are returned to
factories, for extra processing, or sent to disposal. A mixed integer linear programming
is used to model the complex structure of such transportation network. The model
provides two levels of information: (1) the optimal aggregated plan for a given planning
time domain and (2) its concretization at the scheduling level where detailed
information on supply, production, inventory, transportation and recovery of products is
optimised based on a pre-defined economical performance criterion. The Pareto
dominance concept is applied for solving no-wait flow shop scheduling problems with
make-span and maximum tardiness criteria in Pan et al. (2008).
Another integrated simulation optimisation framework is developed to minimise the
make-span for operations scheduling; operations sequences were improved through
genetic algorithm while a simulation model is used to evaluate objective functions
under different scheduling schemes in. Meanwhile, a surrogate model based on artificial
neural network is designed to predict objective function to decrease the times of running
the simulation model (Zeng and Yang, 2009). A large production loss can occur if
machine downtime and maintenance actions are neglected during the production
scheduling process. Consequently, maintenance and repair strategies for the
manufacturing plant have to be considered. The flexibility of simulation models allows
the inclusion of several practical aspects of these activities, such as stand-by operation
modes, deteriorating repairs, aging and sequences of periodic maintenances. An
optimisation method can be then utilised to optimise the components‘ maintenance
periods and the number of repair teams (Marseguerra and Zio, 2000).

BUSINESS PROCESS OPTIMISATION
64
A hybrid flow shop scheduling with machine unavailability intervals (due to
breakdowns and preventive maintenance) is used to minimise flow time and due date
(Allaoui and Artiba, 2004). In their integrated framework, the simulation module
evaluates the solutions generated by SA, which are combined with different dispatching
rules. The genetic algorithm is modified to deal with distributed scheduling in a multi-
factory production with machine maintenance considerations in Chung et al. (2009).
Production facilities are more complex than other stages in SC, such as warehouses and
distribution centres, in terms of resource constraints and the dynamics of production
(Griffiths and Margetts, 2000). Such dynamism and variation in factory schedules might
degrade the overall performance of SC. Consequently, integrating production planning
and scheduling with other SC units becomes evident. Coordination between two
successive stages of an SC is discussed by Mansouri (2005) for a sequencing problem to
minimise total set-ups and to minimise the maximum number of set-ups between the
two stages. For solving these two NP-hard problems, a multi-objective genetic
algorithm solution was proposed which had proven its capabilities of finding Pareto-
optimal solutions. An integrated framework based on GA and TS is presented for a
distributed hierarchical model for SC planning and scheduling optimisation with a
consideration of SC capacity, business strategies and customer requirements (Yin and
Khoo, 2007).
A simulation-optimisation framework is demonstrated for production planning, which
considered the interdependency between demand and material supplies and the
uncertainties emanating upstream and downstream in the SC. Production plans were
generated by GA while simulation is used for their evaluation in Sounderpandian et al.
(2008). A joint production–distribution planning is developed for multi-stage, multi-

BUSINESS PROCESS OPTIMISATION
65
product SCs where the coordination level between SC components is increased by the
parallel processing capabilities of their agent-based simulation framework suggested by
Kazemi and Zarandi (2008). Stockton et al. (2004) have discussed a wide range of
planning decision types, such as aggregate planning, lot sizing within material
requirements planning, and production line balancing using GA.
In the healthcare context, planning and scheduling of operating room surgeries has
received great attention in the literature. Mostly, there are two types of demand of
surgery, namely, emergency and elective. Emergency surgery is unplanned and arrives
randomly and must be performed on the day of arrival, on the other hand, elective
surgery can be planned ahead. Consequently, the planning problem consists of
scheduling elective surgeries in order to minimise the waiting time for elective patients
and minimise the overtime costs of the operating rooms. The issues of scheduling
operating rooms are discussed by Blake et al. (2002) and Blake and Donald (2002). An
integer programming model is formulated and solved to develop a consistent schedule
that minimises the shortfall between the target of each surgical group and actual
assignment of operating room time (also known as block time). A goal programming
procedure is applied for minimising idle time and overtime of operating rooms while
maximising staff and patients‘ satisfaction concurrently (Ozkarahan, 2000).
The problem of inpatient surgical scheduling and emergency room scheduling are
discussed in details by Carter and Blake (2005), where simulation has been used and
proven to be a powerful analysis tool in healthcare. A mixed integer programming
model is used to schedule surgical blocks in a medical facility presented in where the
availability of resources and schedules of surgeries has a significant impact on the
number of patients treated, patients waiting time, and number of cancellations. A system

BUSINESS PROCESS OPTIMISATION
66
wide model developed to allow management to explore trade-offs between operating
room availability, bed capacity, and waiting lists (Santibanez et al., 2007). The problem
of developing surgery schedules with special considerations of bed occupancy levels
was addressed by integrating a mixed integer programming model with meta-heuristic
methods to minimise the total bed shortage (Belien and Demeulemeester, 2007). Based
on the job shop scheduling problem, Pham and Klinkert (2008) proposed an approach
for surgical case scheduling in hospitals. A combination of Monte Carlo simulation and
mixed integer programming is used for operating room planning (Lamiri et al., 2008),
while Hans et al. (2008) proposed several constructive and local search heuristics for
optimising the assignment of surgeries.
Staff scheduling has been an active area of research in healthcare for increasing capacity
utilisation, cost control measures and improving tactical as well as operational
efficiencies of services and facilities. In general, the staff scheduling problem is that of
assigning shifts to staff having different skills while satisfying as many soft constraints
and personal preferences as possible. These constraints include number of consecutive
work hours, number of day and night shifts that should be worked by each staff
member, staffing requirements according to seniority levels for the day and night shifts,
restrictions on the number of consecutive day and night shifts assigned, vacation
periods, weekend time-off requests and a fair distribution of responsibilities among
staff.
The issues of scheduling physicians in emergency rooms are addressed in Beaulieu et
al. (2000). Heuristics based on branch-and-bound are used such that the sum of
penalties associated with ―deviation‖ constraints is minimised. An integer linear
programming model is integrated with tabu search meta-heuristics for scheduling

BUSINESS PROCESS OPTIMISATION
67
hospital nurse shifts (Valouxis and Housos, 2000). Similarly, mathematical
programming and heuristic approaches is used for assigning nurses to critically ill
newborn infants (Mullinax and Lawley, 2002). The scheduling of on-call residents
problem can also be modelled as a mixed integer program and solved by heuristic
procedures (Sherali et al., 2002), while genetic algorithms can be used to solve similar
problems for resident on-call scheduling considering departmental staffing needs, skill
requirements and resident preferences (Wang et al., 2007). An integrated framework
for solving a nurse-scheduling problem can be provided by combing genetic algorithms
with a decoding routine where genetic algorithm solves the unconstrained scheduling
problem leaving the constraint handling to the decoder (Aickelin and Dowsland, 2004).
The model presented by Felici and Gentile (2004) efficiently solved staff
scheduling problems that maximises staff satisfaction using a polyhedral approach. The
problem is formulated using an integer programming approach a number of constraints
are considered such as workload balancing, shift compatibility, and distribution of days
off.
A nurse preference scheduling problem can be solved using a combination of integer
programming and heuristics methods (Bard and Purnomo, 2005b). By incorporating a
downgrading option, the authors extended the work in Bard and Purnomo (2005a) and
improved the quality of schedules. They also presented a model that combines cyclical
as well as preference scheduling by formulating an integer programming model in Bard
and Purnomo (2007). Based on patient arrival rates, the problem of staff scheduling in
emergency rooms can be modelled using queuing models to identify the optimal
staffing patterns so that timely care of the patients is optimised and the percentage of
patients who leave without being seen is minimised (Green, 2005). A combination of
linear programming, constraint programming and meta-heuristics can be effectively

BUSINESS PROCESS OPTIMISATION
68
used for the problem of home healthcare and nursing to maximise satisfaction of both
patients and nurses and at the same time to minimise transportation costs (Bertels and
Fahle, 2006). A hybrid approach combining constraint programming with a
neighbourhood search meta-heuristic also can be utilised to minimise the number of
nurses that visit a patient (Steeg and Schroder, 2008). The Stochastic programming
approach can contributes to solving the nurse-to-patient assignment problem, where
patients need to be assigned to specific nurses with special skills (Punnakitikashem et
al., 2008). Along a similar line of research, Sundaramoorthi et al. (2009) developed a
simulation approach to evaluate nurse–patient assignments. A nurse scheduling
methodology is developed by Burke et al. (2006) that is more flexible than the
traditional fixed period-based approach while combining heuristic ordering with
variable neighbourhood search for solving a similar problem is proposed by Burke et
al., (2008). Pato and Moz (2008) solved the nurse re-scheduling problem using a
genetic algorithm while Moz and Pato (2005) addressed it as a multi-objective problem
and solved it using goal programming. Topaloglu (2006) considered the seniority rules
when assigning the weekday and weekend day shifts for staff, where branch-and-bound
procedure is used to solve scheduling problem.
The quality of service at a hospital emergency department can be improved by utilising
simulation and a genetic algorithm to appropriately adjust nurses‘ schedules without
hiring additional staff (Yeh and Lin, 2007). The simulation model is developed to cover
the complete flow for the patient through the ED. The GA is then applied to find a near-
optimal nurse schedule based on minimising the patients‘ queue time. Ant colony
optimisation approach is applied in Gutjahr and Rauner (2007) to nurse scheduling. The
proposed schedules assign nurses dynamically taking into account a variety of soft and
hard constraints regarding working date and time, working patterns, nurses
BUSINESS PROCESS OPTIMISATION
69
qualifications, nurses‘ and hospitals‘ preferences, as well as costs. Extensive
computational experiments based on simulation models are used to evaluate different
scenarios of varying the number of nurses and hospitals. Molema et al. (2007)
illustrated through a simulation of two case studies that introduction of a part-time work
option for doctors can improve service levels and system design. Ahmed and Alkhamis
(2008) integrate simulation with statistical methods to design a decision support tool for
the operation of an emergency department unit at a governmental hospital. Experimental
results show that by using current hospital resources, the optimisation simulation model
generates optimal staffing allocation that would allow 28% increase in patient
throughput and an average of 40% reduction in patients‘ waiting time.
Belien and Demeulemeester (2008) integrated the problem of operating room
scheduling with nurse scheduling and used linear programming with column generation
for solving the joint problem. Grano et al. (2009) developed an approach for nurse
scheduling for a hospital emergency department that considers both nurse preferences
and hospital requirements. An optimised patient–staff/patient–facilities schedule can
lead to a considerable cost reduction and an increase in service quality. Queuing models
are used by Shmueli et al. (2003) for scheduling patients admissions to a hospital
intensive care unit. The objective of their model was to maximise the expected number
of lives saved by operating at the unit. A hybrid simulation and integer programming
approach is used by Persson and Persson (2009) for the problem of scheduling patients
for surgery. A single-server model is used by Green (2005) to model cancellations of
patient appointments problem. Patrick and Puterman (2006) used simulation to improve
resource utilisation for diagnostic services through flexible inpatient scheduling.
Another queuing model is developed by Goddard and Tavakoli (2008) to manage
patients waiting lists for public health services.

BUSINESS PROCESS OPTIMISATION
70
Outpatient appointment scheduling is discussed in Kaandorp and Koole (2007) where a
local search procedure was derived with the objective to minimise average waiting
times of patients and maximise physician utilisation. Jiang and Giachetti (2008)
analysed the flow of patients through outpatient clinics. Their study has demonstrated
that parallelisation of activities can reduce the patients length of stay for the patients
needing multiple diagnostic or treatment procedures. A Markov decision process is used
by Patrick et al. (2008) to model patients having varying priorities. An approximate
dynamic programming is used to dynamically generate patients‘ schedules while
simulation is used to analyse the quality of generated schedules.
In Ogulata et al. (2008), a hierarchical mathematical model was developed for
scheduling patients and for assigning staff to patients. The objectives of their model
were to balance the workloads of physicians while minimising patients waiting time.
Chien et al. (2008) have modelled patients scheduling as a hybrid shop scheduling
problem where genetic algorithms is used for optimal generation of patient schedules.
The objective of their model is to increase the service quality through the reduction of
patient waiting times and the increase of resource utilisation. Based on discrete event
simulation, Rauner et al. (2008) have developed an interactive internet game that
illustrates the economic and organisational decision-making processes in hospitals.
Healthcare managers, based on various disease categories and budgets, can assess
different strategies for capacity planning and patient scheduling.
Table 3-3 summarises the literature on the application of various optimisation methods
and their integrations for solving scheduling problems.

BUSINESS PROCESS OPTIMISATION
71
Table 3-3 Summary of literature on optimisation techniques for scheduling problems.
Optimisation Methods
Meta-Heuristics-Based Methods Mathematical Programming
Op
era
tio
ns
Sch
edu
lin
g
-
Pan et al. (2008), Marseguerra & Zio (2000),
Chung et al. (2009), Mansouri (2005), Yin &
Khoo (2007), Hans et al. (2008)
Amaro & Barbos (2008), Blake
et al. (2002), Ozkarahan (2000)
MP Belien & Demeulemeester (2007)
DES
Feng & Wu (2006), Yang et al. (2007), Zeng &
Yang (2009), Allaoui & Artiba (2004),
Sounderpandian et al. (2008), Kazemi & Zarandi
(2008)
Santibanez et al. (2007), Lamiri
et al. (2008)
Sta
ff S
ched
uli
ng
- Wang et al. (2007), Aickelin & Dowsland
(2004), Burke et al. (2006), Pato & Moz (2008)
Topaloglu (2006), Moz & Pato
(2005), Green (2005), Belien &
Demeulemeester (2008)
MP
Beaulieu et al. (2000), Valouxis & Housos
(2000), Mullinax & Lawley (2002), Sherali et
al. (2002), Bard & Purnomo (2005a, 2005b),
Bard & Purnomo (2007), Bertels & Fahle (2006),
Steeg & Schroder (2008)
DES Yeh & Lin (2007), Gutjahr & Rauner (2007)
Pa
tien
t
Sch
edu
lin
g
- Kaandorp & Koole (2007), Chien et al. (2008)
Shmueli et al. (2003), Goddard
& Tavakoli (2008), Ogulata et
al. (2008)
DES Patrick et al. (2008)
Persson & Persson (2009)
MP: Mathematical Programming DES: Discrete-Event Simulation
3.4.2 Logistics and Inventory Management
Logistical activities may involve transporting raw materials, delivering them for
manufacturers, movement of the products to various warehouses, and eventually
distribution to customers or healthcare centres. Effective management for these
activities may lead to a considerable reduction in SC cost (Christopher, 1999).
In Rao et al. (2000), an integrated approach is proposed for the design and deployment
of a distribution logistics system under demand uncertainty using simulation
optimisation. In their framework, perturbation analysis is combined with simulation to
find the optimal configuration of the distribution network of that maximises the total

BUSINESS PROCESS OPTIMISATION
72
revenues and minimises the total supply chain cost. Based on integer programming
models, Rauner and Bajmoczy (2003) developed a decision support system for the
allocation problem of medical materials is discussed. Similarly, a multi-objective
optimisation heuristic is developed by Swaminathan (2003) for allocating scarce drugs
to clinics, with the considerations of the efficiency, effectiveness and equity of the drug-
allocation process. Simulation modelling has proven to be an attractive approach for
analysing logistics and distribution network (Iannoni and Morabito, 2006). A hybrid
optimisation–simulation modelling approach is presented in Ko et al. (2006) for
managing logistics activities. Genetic algorithms were used to determine the dynamic
distribution network structure while uncertainty in demands and travel time are captured
by a simulation model. Hospital logistics is addressed in Lapierre and Ruiz (2007) by
using a tabu search algorithm to coordinate the procurement and distribution operations
while considering inventory capacities. Due to its flexibility, ant colony optimisation
has been used by Silva et al. (2008) for supplier–logistic systems. A generic supply
chain model with suppliers, logistics and distributors is demonstrated in Silva et al.
(2009) with the objective of minimising the tardiness (i.e., the difference between the
release date and the delivery date of the order) of the total orders, minimising the
number of orders that are not delivered or delayed, maximising the number of orders
that delivered at the correct date, and minimising the total travelling costs of vehicles.
Logistics is also concerned with the definition of stock levels and allocation of
resources. The strategic impact of inventory stored at different stages of the SC is
significant. Determining the minimum and maximum levels of inventory and the
quantity of order to be placed are major challenges for decision makers. An (s, S)
ordering policy specifies these decision variables by placing an order when the level of
inventory is below s units, and by specifying the amount of the order by the difference

BUSINESS PROCESS OPTIMISATION
73
between maximum inventory level (S) and the current inventory position. Provided that
determining the optimal values of (s, S) is computationally expensive, simulation-based
optimisation is a potential tool for analysing alternatives and finding these optimal
values. Infinitesimal perturbation analysis is used by Gavirneni (2001) to compute the
appropriate order up-to level in a capacitated SC. Gavimeni (2001) measured the benefit
of sharing the inventory parameters of the retailer‘s ordering policy and demand data
with the supplier, which reduced the supplier‘s cost by a value from 1 per cent to 35 per
cent. Ranking and Selection procedures and simulated annealing algorithms are
combined by Ahmed and Alkhamis (2002) to find optimal values of (s, S) inventory
policy with the objective of minimising the inventory holding cost, shortage cost and
ordering cost. A two-stage integer programming was used for the scheduling of a multi-
product batch plant (Engell et al., 2004). Haksever and Moussourakis (2005) presented
a mixed integer programming model inventory optimisation for ordering multiple
inventory items subject to multiple resource constraints. Determining the optimal supply
chain configuration is a difficult problem since a lot of factors and objectives must be
taken into account when designing the network. Guillen et al. (2005) proposed a multi-
objective mixed integer linear programming model to capture the complexity of this
problem. By using this methodology, the trade-off between the considered objectives
(Pareto curve) can be obtained not only for the nominal case, but also when there is
uncertainty about some of the parameters defining the production/distribution scenario.
An efficient selection-of-the-best scheme called Sequential Selection with Memory
(SSM) is proposed by Pichitlamken et al. (2006) to be used during the neighbourhood
search. A hybrid between simulation and genetic algorithms is presented by Kochel and
Nielander (2005) to define optimal order policies in a multi-echelon inventory system.
Additionally, the causal relation between the inventory decision variables and process

BUSINESS PROCESS OPTIMISATION
74
performance can be constructed using meta-models. Subsequently, the constructed
meta-model can be used to determine the base-stock levels of different process stages in
order to minimise the backlogging costs at warehouses and the holding costs at supply
chain nodes. As an example for such integrated framework, Wan et al. (2005) optimised
inventory levels for a three-stage SC where each production node has inventories for
raw materials and products. In the same fashion, genetic algorithms can be used to
generate base-stock levels while being evaluated by simulation models. This integration
can be used to minimise the sum of holding and shortage costs in the entire supply chain
(Daniel and Rajendran, 2005, Daniel and Rajendran, 2006).
Determining optimal values of stock levels in the stochastic environment of the supply
chain is challenged by various sources of uncertainty such as the demand variability.
Such demand uncertainty is addressed in Crespo Marquez and Blanchar (2004) by
adding in-transit and warehoused inventories to asynchronous production and shipping
lead times while optimisation is used for measure the tradeoffs between alternative
suppliers. Alternatively, to cope with this uncertainty in demand, Jung et al. (2004)
proposed a simulation-based optimisation approach that incorporates the concept of
safety stock as a time-independent lower bound on the inventory level. However, a key
limitation of their approach lies in the large computing times required to address
business processes of increasing scope and scale, which consequently may result in
more difficulties in determining the relationship between inventory decision variables
and process performance.
Due to its gradient estimation capabilities, simultaneous perturbation stochastic
approximation (Spall, 1998) can be used in these cases to effectively determine the
optimal values of inventory stock levels (Schwartz et al., 2006). Similarly, infinitesimal

BUSINESS PROCESS OPTIMISATION
75
perturbation analysis is used by Zhao and Melamed (2007) to control inventory levels in
under demand uncertainty and random production capacity conditions.
Demand and production uncertainty are usually coupled with optimising more than one
objective, such as total inventory cost and customer service levels. Lee et al. (2008)
have presented a multi-objective simulation optimisation framework that integrates
simulation, computing budget allocation and multi-objective evolutionary algorithms to
optimise inventory and replacement policies. Another multi-objective inventory model
is proposed by Mahnam et al. (2009) for a multi-echelon SC that integrates multi-
objective particle swarm optimisation and simulation optimisation. Possibility theory
and fuzzy numbers (Zadeh, 1999) are incorporated into their simulation model to handle
the uncertainty in SCs. This incorporation has resulted in a flexible decision-making
framework that allows linguistic expressions to be used for modelling the reliability of
suppliers and to optimise both total inventory cost and fill rate simultaneously.
Inventory control is directly related to the quality of customer service, which is one of
the key performance measures in successful SC management. Customer service levels
can be computed as the percentage of times that received customer orders are fulfilled
by on-hand inventory. The requirements of service levels in a multi-item, multi-echelon
distribution system is studied in Caggiano et al. (2009) by developing a comprehensive
simulation model to compute optimal fill rates over a wide range of base stock levels. In
Karaman and Altiok (2009), production management is linked to stock levels in a multi-
echelon SC where a simulation-based optimisation framework is developed to analyse
SC performance using time averages of inventory, backorder levels and customer
service levels as the key performance metrics of the SC. The metrics are then used by
the optimisation algorithm to design the SC in order to minimise the expected total

BUSINESS PROCESS OPTIMISATION
76
system costs. In Yoo et al. (2009), a framework is proposed to maintain customer
service levels close to the target by stock levels of products at both wholesalers and
manufacturers. Such trade-offs between customer service levels and total inventory cost
is further detailed in Liao (2009). A summary of the literature work in inventory
management is given in Figure 3-8.
Gavirneni
(2001)
Köchel and Nieländer
( 2005)
Pichitlamken et al.
(2006)
Ahmed and Alkhamis
(2002)
Daniel and Rajendran
(2005, 2006)
Wan et al.
( 2005 )
Jung et al.
(2004 )
Schwartz et al.
(2006)
Zhao and Melamed
(2007)
Lee et al.
( 2008 )
Mahnam et al.
(2009)
Karaman and Altiok (2009)
Caggiano et al. (2009) Yoo et al.
(2009)
Liao
(2009)
Meta-heuristics
Algorithms
Meta-model-based
Methods
Statistical-based
Methods
Gradient-based
Methods
Inv
ento
ry P
oli
cies
Inv
ento
ry M
anag
emen
t
un
der
Un
cert
ain
ty
Inv
ento
ry M
anag
emen
t &
Cu
sto
mer
Ser
vic
e L
evel
s
Mu
lti-
ob
ject
ives
Figure 3-8 Summary of the literature in the area of inventory management
Due to the recent increase in outsourcing, the decision-making process of supplier
selection has been complicated by the fact that various criteria must be considered
simultaneously. These criteria has been analysed in Ding et al. (2005) by considering
purchasing costs, transportation costs, inventory costs and total backlogged demands as
the target key performance indicators (KPIs). The estimated values of these KPIs –
generated by a simulation model – are used to evaluate candidates‘ supplier portfolios.
Such portfolios are created by a GA optimiser, which continuously searches different

BUSINESS PROCESS OPTIMISATION
77
configurations of the SC, by selecting one or more suppliers plus corresponding
transportation modes. This work has been extended in Ding et al. (2006) by adopting a
multi-objective genetic algorithm for achieving the trade-off between conflicting
objectives, e.g. costs and customer service level.
Additionally, the framework addressed not only strategic decisions (e.g. network
configuration), but also operational aspects of each proposed network configuration,
such as inventory control parameters and transportation allocation. Koo et al. (2008)
demonstrated another application of simulation–optimisation to support inventory and
logistics decisions. The optimisation module generates values of decision variables such
as safety stock levels, investment throughput, capacity investment, production cycle
time and procurement cycle time, while the simulation model evaluate the performance
of the system using the generated values in terms of total revenue, total procurement
cost, total operating cost, total product inventory cost and customer satisfaction index.
In the healthcare context, a greedy heuristic procedure is developed by Nicholson et al.
(2004) for managing the cost of inventory in a healthcare setting. Specifically, the
authors compare the service levels and inventory costs of an in-house three-echelon
distribution network against an outsourced two-echelon distribution network. A
constraint programming optimisation model is developed by Little and Coughlan (2008)
determining the inventory needs in hospitals constrained by various product and service
levels. Their model is capable of determining optimal stock levels of products restricted
by the space, delivery and criticality of the items. In Haijema et al. (2007), simulation
is combined with Markov dynamic programming for production and inventory
management of platelets at a blood bank, and Kopach et al. (2008) investigated multi-
tier control policies for management of both urgent and non-urgent red blood cell

BUSINESS PROCESS OPTIMISATION
78
supplies. A simulation–optimisation approach is developed in Rytila and Spens (2006)
for managing blood inventory in a blood supply chain. They were able to determine the
optimal inventory control of blood stock that minimise outdating and backorder costs
while maintaining maximising the blood availability level. Discrete event simulation is
used in Katsaliaki and Brailsford (2007) for inventory management in a blood supply
chain. The model is used to determine ordering policies with the objective to minimise
cost and supply shortages and wastage, and to increase service levels and safety
procedures. As more hospitals added to the blood supply chain, the authors extended
their work in Mustafee et al. (2009) by using distributed simulation to reduce the time
needed to executing the model.
3.4.3 Demand and Capacity Planning
The challenges of capacity planning are common between the healthcare and supply
chain domain which involves deciding how available limited resources will be allocated
to meet customer or patient needs and achieve high level of service quality. Demand
uncertainty makes capacity planning a difficult and challenging task, whether the
uncertainty in demand is because the variations in forecasts of direct demand or by
variability in the business process. Therefore, forecasting activities are widely
performed for predicting important aspects such as demand volume and capacity
needed.
A two-stage simulation–optimisation framework for rough-cut capacity planning under
demand uncertainty is presented by Uribe et al. (2003) for a semiconductor
manufacturer. The first stage in their framework characterises the optimal response of
the manufacturing system under demand uncertainty while these characterisations are
used in the second stage to select a tool set with the addition of budget constraints. A

BUSINESS PROCESS OPTIMISATION
79
multi-scenario, mixed integer linear programming model is proposed by Gatica et al.
(2003) for the problem of capacity planning under uncertainty that is solved by branch-
and-bound technique. This optimisation-based approach selects the final product
portfolio and the production planning and investment strategy simultaneously subject to
the system uncertainty. The computational efforts needed by this approach are reduced
by Levis and Papageorgiou (2004) by adopting a hierarchical approach. The proposed
hierarchical methodology employs an aggregate mathematical formulation to determine
the strategic decision variables which are then fed into the detailed model in order to
derive the operational decision variables. Moreover, required labour force and machines
can be predicted by building a multiple regression meta-model based on simulating
manufacturing systems (Dengiz et al., 2006).
Forecasting activities are widely performed in the various areas of supply chains for
predicting important supply chain measurements such as demand volume in order
management, product quality in manufacturing processes, capacity usage in production
management and traffic costs in transportation management. Jeong et al. (2002)
presented a computerized system for implementing the forecasting activities required in
supply chain management. A linear causal forecasting model is proposed and its
coefficients are efficiently determined using guided genetic algorithm. A genetic
algorithm is used by O‘Donnell et al. (2006) to determine the optimal ordering policy
that effectively reduced the bullwhip effect. Figure 3-9 shows the application of
simulation–optimisation for the planning activities in supply chain.
Capacity planning in the healthcare setting involves deciding how resources will be
allocated to meet customer needs and achieve high level of service quality. A queuing
model is used by Green and Savin (2008) which addressed increasingly critical hospital

BUSINESS PROCESS OPTIMISATION
80
capacity planning decisions. Adapted from the overflow model of phone calls in
telecommunication, Litvak et al. (2008) presented a mathematical model for hospital
capacity to treat emergency patients, where simulation is used for validating the results.
A queuing model is developed by Mayhew and Smith (2008) to evaluate the emergency
departments of hospitals in United Kingdom. The focus was on achieving the
government mandated targets by discharging 98% of patients within four hours.
Forcast Resource Planning
Dem
and P
lannin
g
Purch
asing &
Material R
equirem
ent P
lannin
g
Production
Planning
Distribution
Planning
SchedulingTransport
Planning
Batch Sizes
Due Dates Due Dates
- Capacity
- Stock Levels
- Transport Modes
- Transport Quantities
- Batch Sizes
- Orders
Forecast
Purchasing Quantities
- Capacity
- Distribution Quantity
- Allocation
Grabowski and Wodecki
(2004), Feng and Wu (2006),
Geyik and Cedimoglu (2004),
Yang et al. (2007), Cavin et
al. (2004), Pan et al. (2008),
Allaoui and Artiba (2004),
Zeng and Yang (2009)
Yin and Khoo (2007),
Kazemi and Zarandi (2008),
Chung et al. (2009) Sounderpandian et al. (2008)
Uribe et al. (2003),
Dengiz et al. (2006)
Figure 3-9 Examples of planning activities in supply chain management
A multi-objective optimisation model was developed by Lovejoy and Li (2002) to study
the capacity planning problems of operating rooms. The model is integrated with
simulation to perform a trade-off analysis between three main objectives: maximising
hospital profit; minimising wait to get on schedule; and maximising the reliability of

BUSINESS PROCESS OPTIMISATION
81
schedule procedure start time. A transient modelling approach using simulation and
exponential functions is presented by Paul et al. (2006). The modelling approach allows
real-time capacity estimation of hospitals of various sizes and capabilities. The
parameters of the exponential model are regressed using outputs from designed
simulation experiments. Surgery waiting lists were analysed by discrete-event
simulation by VanBerkel and Blake (2007). They analysed performance measures for
improvement and developed a model for capacity planning decisions.
A stochastic multilevel model is proposed by Oliveira and Bevan (2008) to study and
identify the sources of inefficiencies in hospitals. They highlighted various
inefficiencies arising from bed distributions, incentives and economies of scale of
different kinds of hospitals. Kokangul (2008) provided another combination of
deterministic and stochastic approaches for capacity planning problem for a healthcare
system. A meta-model using quadratic polynomials is used to obtain a mathematical
relationship between the control parameters (e.g., the number of admissions per day,
service level and occupancy level) and size of the bed capacity using generated data
from a constructed simulation model. Nonlinear mathematical models are then used to
determine the optimum size of the required bed capacity based on target levels of the
control parameters. Adan et al. (2009) optimised the resource utilisation of a
cardiothoracic surgery centre. They modelled this problem as a mixed integer program
having stochastic lengths of stay.
Similarly, accurate demand forecasting is essential in healthcare planning, its results
providing the input to several optimisation problems. Cote and Tucker (2001) discussed
common demand forecasting methods for healthcare services such as seasonality
analysis, moving average, and trend line. Stepwise autoregressive and exponential

BUSINESS PROCESS OPTIMISATION
82
smoothing models are used by Xue et al.(2001) for analysing and forecasting the
continued growth of the end-stage renal disease population in the United States. A
market-based healthcare service forecasting study is conducted by Beech (2001) from a
broad range of data for estimating the future demand. The data sets include various
demographic groupings, discharge utilisation rates, market size and market share by
service lines. A facility master plan is developed by Myers and Green (2004) for
forecasting future demand along with capacity needs and physician requirements. A
comprehensive demand forecasting model is given by Finarelli Jr and Johnson (2004)
for healthcare services, while Jones et al. ( 2008) used historical data of patient arrivals
at the emergency departments of three different hospitals and considered different
forecasting methods such as time series regression, exponential smoothing, moving
average and artificial neural network models.
3.4.4 Resource and Location Allocation
Response surface methodology (RSM) has proven to be very effective to address
resource allocation problems in manufacturing system. Irizarry et al. (2001) applied
RSM to facilitate the design process, identify design settings, and optimise the
operating factors such as maintenance policy, quality policy, lot size, number of
operators. Different Tabu Search (TS) strategies has been investigated by Grabowski
and Wodecki (2004) and Geyik and Cedimoglu, (2004) for job-shop parameters for an
efficient resource allocation.
A large body of publications in healthcare addressed various issues concerning resource
management and location selection, both for healthcare services and medical material.
An integer programming model, combined with simulation, is developed by Zhang et
al. (2008) for allocating operating room capacity with the objective of minimising

BUSINESS PROCESS OPTIMISATION
83
inpatients' length of stay. The optimal location of healthcare facilities in rural areas is
modelled by Rahman and Smith (1999) as a maximal covering location model. The
model was solved by heuristic methods. An integer programming model was developed
by Branas et al. (2000) for a trauma resource allocation problem. The objective of the
model was to maximise coverage for severely injured patients. The planning issues
hospital location and service allocation is further discussed by Chu and Chu (2000)
where a goal-programming model was developed for supply and demand matching.
With the goal of maximising coverage for the low-income population, Marianov and
Taborga (2001) addressed the location planning for public healthcare centres. Verter
and Lapierre (2002) formulated the preventive healthcare facilities location as a
mathematical programming model.
A multi-objective decision-support system is developed by Stummer et al. (2004) for
determining locations and sizes of the medical departments in a hospital network. The
objective of the model was to minimise the total costs associated with location-
allocation in the hospital plan; the total travel costs incurred by the patients; the number
of unit moves necessary to restructure the current allocation; and the number of rejected
patients. A simulation model is developed by Harper et al. (2005) for the geographical
allocation of healthcare services locations. The model considers the necessary resource
capacities, variability in patient needs and travel considerations.
A comprehensive overview of blood banking supply chain is presented by Pierskalla
(2005) where blood banking locations are addressed. Specifically, they analysed how
many community blood centres should be in a region and where they should be located;
how supply and demand should be coordinated; and how donor areas should be covered
by community blood centres. Daskin and Dean (2005) reviewed location set covering

BUSINESS PROCESS OPTIMISATION
84
and maximal covering models for addressing the location planning issues in healthcare.
Additional location planning problems are discussed by Aaby et al. (2006) using
simulation modelling. The spatial distribution of the transplant centres is investigated by
Bruni et al. (2006) using a location model based on mathematical programming. The
strategic goal of achieving regional equity in healthcare was considered by allocating
transplantable organs across various regions using the proposed model. A mixed integer
programming model is presented by Cote et al. (2007) for locating new treatment units.
The objective of the model was to minimise the patient travelling time, and treatment
cost.
Ndiaye and Alfares (2008) have developed a binary integer programming model to
determine the optimal locations of primary healthcare units with special consideration
of seasonally varying demands. Smith et al., (2009) considered both top-down and
bottom-up hierarchical location models for the efficient planning of community health
schemes. They proposed a mixed integer programming model for determining the
locations of maximal number of sustainable healthcare facilities. Murawski and Church
(2009) consider the problem of improving health service accessibility by upgrading
links to the existing facility locations of the transport network to all-weather roads.
Their integer-programming model is adequate for rural areas of under-developed
countries where, during bad weather conditions, accessibility is diminished because of
the lack of all-weather roads. Their model addressed a real-world problem scenario in
Ghana. More recently, the work by Zhang et al. (2009) addressed preventive healthcare
facilities network design, regarding the number of facilities and their location, with the
aim of maximising the participation of the population in preventive healthcare
programmes.

BUSINESS PROCESS OPTIMISATION
85
3.4.5 Vehicle Routing
Optimising product delivery from suppliers to customers by vehicles is known as the
vehicle routing problem (VRP). A hybrid between tabu search and genetic algorithm is
developed by (Tan et al., 2001) to solve a vehicle routing problem. The objective in that
study was to find optimal route for vehicles that serve a number of customers within
predefined time windows at a minimum travelled distance, considering the capacity and
total trip time constraints for each vehicle. Tabu search is also investigated in Fu et al.
(2004) as a way of solving a special kind of VRP called Open-VRP, where vehicles
have to revisit their assigned customers in the reverse order. In Tan et al. (2006), a
hybrid multi-objective evolutionary algorithm (HMOEA) is developed with the
objective of minimising the routing distance and the number of vehicles required.
A hybrid multi-objective evolutionary algorithm (HMOEA) is applied to find the Pareto
optimal routing solutions for such TT-VRPs. Another genetic algorithm is presented in
Lacomme et al. (2006) based on the Non-Dominated Sorting Genetic Algorithm
(NSGA) for the bi-objective capacitated arc routing problem (CARP). Both the total
duration of trips and the duration of the longest trip (make-span) are to be minimised.
Zheng and Liu (2006) developed a hybrid intelligent algorithm that integrates
simulation and genetic algorithms to minimise the total travel distance of all vehicles.
A hybrid approach between simulation and multi-objective evolutionary algorithms
(MOEA) is discussed by Tan et al. (2007) for solving a vehicle routing problem under
demand uncertainty. In their framework, MOEA searches and generates routes while
simulation is used to evaluate the costs of routes in terms of travelling distance, driver
remuneration and number of vehicles required. Fuzzy variables are used in Erbao and
Mingyong (2009) to deal with uncertainties in demand by integrating simulation and

BUSINESS PROCESS OPTIMISATION
86
evolution algorithms to minimise the total travelled distance for vehicles. A summary of
reviewed articles on vehicle routing problem is given in Table 3-4.
Table 3-4 Optimisation of vehicle routing problems (VRPs)
Author(s) Optimisation Algorithm Objective Functions
Fu et al. (2004) Tabu Search Number of vehicles
Total travelling cost
Tan et al. (2006) HMOEA Number of trucks
Routing distance
Lacomme et al. (2006) NSGA Total trip duration
Longest trip (make-span)
Tan et al. (2001) Tabu Search
Simulated Annealing
Total travelled distance
Zheng and Liu (2006) Genetic Algorithm/Fuzzy Total travelled distance
Tan et al. (2007) MOEA Total travelled distance
Number of vehicles
Driver remuneration
Erbao and Mingyong (2009) DEA/Fuzzy Total travelled distance
Similarly, optimising the location and routing of emergency vehicles is very critical for
efficient delivery of healthcare services. The issues of planning mobile health services
are addressed in Hodgson et al. (1998) by developing a covering tour model. In their
approach, the problem is formulated using integer linear programming model where
heuristics methods are used with the objective to minimise mobile facilities travel
distances and maximise the coverage area for the population centres within a certain
feasible range.

BUSINESS PROCESS OPTIMISATION
87
Ambulance service planning and routing is discussed in Henderson and Mason (2005)
where a simulation and analysis software tool is investigated for that problem. A fuzzy
multi-objective model is presented in Araz et al. (2007) for determining the best base
location of a limited number of emergency vehicles. The objective of that model was to
optimise service levels in terms of maximisation of the population covered by one
vehicle; maximisation of the population with backup coverage; and minimisation of the
total travel distance. Akjiratikarl et al. (2007) proposed particle swarm optimisation for
home care worker scheduling to minimise the total distance travelled subjected to the
capacity and time constrains.
More near to optimal solutions to solve routing problems for a mobile healthcare facility
can be obtained by the combination between Pareo ant colony optimisation and multi-
objective genetic algorithms (Doerner et al., 2007). Multiple vehicle pickup and
delivery problem is considered by Lu and Dessouky (2007) with objective of
minimising the total travel cost and the fixed vehicle cost. The problem is formulated an
integer programming problem. A branch-and-cut algorithm is developed to optimally
solve the problem. A facility location model for ambulances is developed by Ingolfsson
et al. (2008) for minimising the number of units needed for performing at pre-specified
service levels. They incorporated uncertainties and randomness into their convex
optimisation mode.
A fixed-charge transportation problem is considered in Jo et al. (2008). The problem is
modelled as a network model that is associated with additional fixed cost for
establishing the facilities or fulfilling the demand of customers. Tree-based genetic
representation methods are employed as representation methods to solve the problem. A
synopsis of the literature on aforementioned application areas is given in Table 3-5.

BUSINESS PROCESS OPTIMISATION
88
Table 3-5 A synopsis of literature on optimisation methods for process management.
Ca
pa
city
& D
em
an
d P
lan
nin
g MH MM GB MP
- Jeong et al. (2002), O‘donnell
et al. (2006)
Xue et al.
(2001), Jones
et al. (2008)
Gatica et al. (2003),
Levis &
Papageorgiou
(2004), Green &
Savin (2008),
Mayhew & Smith
(2008)
DES
Dengiz et al.,
(2006), Paul et
al. (2006),
Kokangul
(2008)
Uribe et al. (2003) Litvak et al. (2008)
Res
ou
rce &
Lo
cati
on
All
oca
tio
n
-
Branas et al. (2000),
Verter & Lapierre
(2002), Cote et al.
(2007), Ndiaye &
Alfares (2008),
Smith et al. (2009)
MP Grabowski & Wodecki (2004),
Geyik & Cedimoglu (2004)
DES
Irizarry et al.
(2001)
Harper et al.
(2005), Aaby et al.
(2006
Zhang et al. (2008)
Lo
gis
tics
& I
nv
ento
ry M
an
ag
emen
t
MH MM SB – GB MP
-
Swaminathan (2003), Lapierre
& Ruiz, (2007), Kochel &
Nielander (2005)
Haksever &
Moussourakis,
2005), Guillen et
al., 2005), Rauner
& Bajmoczy, 2003)
GB Engell et al., 2004)
DES
Ko et al. (2006), Ko et al.
(2006), Silva et al. (2009),
Daniel & Rajendran (2006),
Crespo Marquez & Blanchar
(2004), Lee et al. (2008),
Mahnam et al. (2009), Liao,
(2009), Ding et al. (2006),
Koo et al. (2008)
Wan et al.
(2005), Yoo et
al. (2009
Ahmed &
Alkhamis (2002),
Pichitlamken et al.
(2006) , Rao et al.
(2000), Gavimeni
(2001), Jung et al.
(2004), Schwartz et
al. (2006)
Haijema et al.
(2007)
Veh
icle
&
Am
bu
lan
ce R
ou
tin
g MH MP
-
Tan et al. (2001, 2006), Fu et al. (2004),
Lacomme et al. (2006), Akjiratikarl et al.
(2007), Doerner et al. (2007), Jo et al. (2008)
MH Lu & Dessouky (2007)
DES Zheng & Liu, (2006), Tan et al. (2007), Erbao
& Mingyong (2009)
MH: Meta-Heuristics DES: Discrete-Event Simulation SB: Statistical-Based
GB: Gradient-Based MP: Mathematical Programming MM: Meta-Model-Based

BUSINESS PROCESS OPTIMISATION
89
3.5 DISCUSSION
The increased complexity of today‘s business processes has motivated both
practitioners and researchers to develop sophisticated, mostly integrated, optimisation
methods, resulting in the availability of large number of optimisation techniques.
Accordingly, managers and decision makers face numerous difficulties in selecting a
proper technique that best suits their needs and the problem under investigation.
Improper selection of optimisation technique may result in wrong decisions being made
by managers at different levels of the decision making process.
A variety of schemes have been proposed in the literature for classifying optimisation
techniques. Decision variables can be used to classify optimisation methods into
continuous input parameter methods and discrete input parameter methods (Swisher et
al., 2000). Continuous input parameter methods include gradient and non-gradient
methods; on the other hand, discrete input parameter methods include statistical
methods, ordinal as compared to local optimisation) can be used also to categorise
optimisation techniques into local optimisation techniques and global optimisation
techniques (Tekin and Sabuncuoglu, 2004). Local optimisation techniques are further
divided into discrete decision space methods and continuous decision space methods;
global optimisation techniques include meta-heuristics, sampling algorithms and
gradient surface methods. However, simulation models are only considered in the
aforementioned classifications, which neglect other modelling approaches. Different
modelling methods have to be considered to provide a consistent and comprehensive
classification of optimisation methods (Beyer and Sendhoff, 2007).
There is a lack of classification schemes which consider different aspects of both the
optimisation technique as well as its capability for solving the intended problem. For

BUSINESS PROCESS OPTIMISATION
90
example, gradient-based optimisation methods are suitable for handling optimisation
problems with continuous decision variables. Perturbation Analysis (PA) can estimate
all gradients of the performance measure by tracking the propagation of simulation
results sensitivity through the system (Ho, 1985). However, to have these tracking
capabilities, a deep understanding of the simulation model is required to allow system
optimisers to integrate their algorithms into the model. Simultaneous perturbation
stochastic approximation (SPSA) overcomes this problem by considering the simulation
model as a black box (Sadegh and Spall, 1998). On the other hand, statistical methods
are effective when the number of alternatives are small (i.e., finite). Subset selection
approaches are most useful when the number of alternatives is quite large. Indifference
zone approaches could then be used to select a single solution alternative that is within a
pre-specified difference from the true optimum. The major disadvantage of ranking-
and-selection (R&S) procedures is the requirement of independence over competing
solutions, which precludes the use of most variance reduction techniques. Ranking-and-
selection and multiple-comparisons procedures are only powerful for optimisation when
the parameter set is discrete.
Regarding scheduling and resource planning problems, these limitations of gradient-
based methods and statistical techniques are avoided with more emphasis on meta-
models and meta-heuristics. A key advantage of response surface methodology (RSM)
is its ability to optimise objective functions with unknown variance along with high
levels of uncertainty (Kleijnen et al., 2004). RSM can be extended to allow multiple
random system responses with multi-constraints (Kleijnen, 2008). For some meta-
model-based methods such as artificial neural networks (ANN), special attention has to
be given to the training set to avoid over-fitting, which directly affects the meta-model
predictive accuracy (Alam et al., 2004). The range of application domains solved by

BUSINESS PROCESS OPTIMISATION
91
meta-heuristics is far greater than other methods. Problem-specific knowledge (e.g. non-
standard goals, constraints, objectives and conditions) can be more easily incorporated
into the optimisation solution process, which broadens the range of problems to which
multi-objective methods are applied. Additionally, meta-heuristic algorithms can handle
models with integer variables, discrete variables and/or qualitative variables; whereas
continuous variables have to be approximated before the meta-heuristic is applied. More
computational efforts are needed at this stage in order to increase the degree of
accuracy. Meta-heuristic methods are not function optimisers. That is, their purpose is
to seek and find good solutions to the problem, rather than a guaranteed optimal
solution (i.e., exact solutions). Therefore, if the model is sufficiently simple, it is more
efficient to use mathematical programming methods to obtain an optimal solution,
rather than meta-heuristics. Obtaining a guaranteed optimal solution is challenged by
the high-level of inter-connected relationships between system variables and the
complexity and uncertainty imposed by an ever-changing environment such as
healthcare.
Consequently, the integration of optimisation capabilities with other decision support
approaches (i.e., BSC, MCDA, and simulation modelling) will provide a more
harmonised automation of the managing and improvement business processes by;
selecting appropriate optimisation technique(s) for the underlying optimisation problem;
selecting appropriate key performance indicators to be optimised; considering the
preferences of decision makers regarding their objective(s); handling multiple, mostly
conflicting objectives and constraints simultaneously; using the simulation model for
evaluating generated values of decision variables; and calculating the aggregated
performance for optimal solutions. That potential synergy, initially informed by
literature review, brought us to the framework proposed in the next chapter.

RESEARCH METHODOLOGY
92
CHAPTER 4: RESEARCH METHODOLOGY
4.1 INTRODUCTION
The importance of having relevant research methodology was emphasised by Irani et al.
(1999) based on the research problem in hand, either related to natural sciences or social
sciences both with their corresponding features. However, in deciding how to conduct
research or to select its methods, Robson (2002) and Bell (2005) noted that there is no
definitive rule regarding how what approach one should select when doing research as it
all depends on the nature and scope of research, the sources of data, and the research
questions and objectives.
Integrated frameworks for managing complex healthcare business process is a relatively
new topic with a limited available of data on applying integration between methods in
the healthcare setting, as a consequence an inductive approach has been applied. This
was followed by a deductive approach to test and validate the framework. A case study
is then used as a research strategy to achieve the research objectives. Finally, several
techniques for data collection are employed including observations, interviews, and
historical data for the primary data and multiple source data collection for secondary
data. A detailed discussion about the aforementioned steps is presented in the next
sections.
4.2 RESEARCH APPROACHES
The overall aim of this research is to investigate aspects and requirements for
developing an integrated decision support framework for managing complex business
process in healthcare facilities. Accordingly, the nature of this research is applied
research, where the emphasis is on producing relevant practical knowledge. According

RESEARCH METHODOLOGY
93
to Myers (1997), all type of research, whether quantitative or qualitative, is based on
some underlying assumptions about what ‗constitutes‘ valid research and which
research methods are appropriate. Researchers approach their subject via implicit or
explicit assumptions about the nature of the real world (i.e., ontology) and the way in
which it may be investigated (Burrell and Morgan, 1979).
Ontology is the reality that is being investigated in research which concerns the very
essence of the studied phenomena and whether ‗reality‘ is of an objective (objectivism)
or subjective (subjectivism) nature (Perry et al., 1999). On the other hand, epistemology
refers to the way knowledge is perceived and acquired from real world observations
(Becker and Niehaves, 2007). Epistemological assumptions are about what forms of
knowledge can be obtained and whether knowledge is something that can be acquired or
something personally experienced (Burrell and Morgan, 1979, Eldabi et al., 2002).
Positivism epistemology deals with the observable reality where knowledge is driven
from real observations, objectives and measurable phenomena and represented in the
form of hard facts (Phillips and Burbules, 2000). On the other hand, the nature of
knowledge in the interpretive epistemology is of a soft and subjective form and based
on personal experience. Accordingly, to achieve the aim of this research, a mixture of
these philosophies is used. The philosophy of this research can be identified as
pragmatism philosophy since positivism and interpretive philosophies are integrated to
satisfy all research objectives simultaneously. Using a pragmatist philosophy, the
research can be carried out interpretively using the induction approach in order to
determine theory or hypotheses, and after that using the stance of positivism to test the
hypotheses (Tashakkori and Teddlie, 2003). Figure 4-1 shows the steps of research
process utilised to achieve the research objectives.

RESEARCH METHODOLOGY
94
Interpretivism
Res
earc
h
Nat
ure
Res
earc
h
Ph
ilo
sop
hy
Induction Deduction
Case Study
Ethnography
Literature
Interpretivism
Pragmatism
Reality
―Healthcare Facility(s)‖
SubjectivismObjectivism
To develop an integrated optimisation-based decision support framework
that is applicable in managing healthcare business process
Theoretical
Framework
Framework
Evaluation
Observations Historical DataInterviews
QuantitativeQualitative
Results
Validation
Modelling and Simulation
Primary DataSecondary Data
Res
earc
h
Ap
pro
ach
Res
earc
h D
esig
n
Res
earc
h S
trat
egy
Res
earc
h M
eth
od
olo
gy
Res
earc
h P
roce
du
res
& T
ech
niq
ues
Dat
a C
oll
ecti
on
Data Analysis Tools
Res
earc
h
Ob
ject
ive
Applied Research
Dat
a
An
aly
sis
Interpretivism
Interpretivism
Positivism
Result
Analysis
Positivism
Figure 4-1 Alignment between research steps and research objectives.
There are two major approaches to theory development: deduction theory testing and
inductive theory building where the deduction approach is usually based on positivism
and the induction approach usually based on interpretivism (Saunders et al., 2009). The
deductive reasoning, also known informally as ‗top-down‘ approach, starts with the
general themes, and then expands upon them with time (Trochim and Donnelly, 2001).

RESEARCH METHODOLOGY
95
It begins with thinking up from broader more general about a topic of interest, which is
then narrowed down into more specific statements and hypothesis that can be tested
(Figure 4-2a).
Confirmation
Observation
Theory
Hypothesis
Theory
Tentative
Hypothesis
Observation
Pattern
a) A schematic representation of deductive reasoning
b) A schematic representation of inductive reasoning
Source: Trochim and Donnelly (2001)
Figure 4-2 Deductive and inductive reasoning.
While the inductive approach, also known as ‗bottom-up‘ approach, moves from
specific observations to broader generalisations and theories (Figure 4-2b).
Accordingly, the inductive reasoning starts with specific observations, where patterns
are identified and then hypothesis are formulated. Hypotheses then can be evaluated and
finally come up with developing more general conclusions and theories.
In this research, the application of integrated tools for improving, managing, and
optimising complex business process in the healthcare sector is a new topic, with
limited data availability and guidelines on development and deployment of integrated
decision support frameworks in a healthcare context. Thus an inductive approach has
been applied.

RESEARCH METHODOLOGY
96
Secondary data is a useful source of knowledge for the pursued research topic since it
provides a wide range of related information that are basically collected and analysed by
other researches or studies. It includes raw data – not processed before – or compiled
data which received some kind of summarising or analysis (Kervin, 1999). Starting the
research with secondary data saves a lot of time, cost and effort since research
objectives can be met by reanalysing or manipulating the collected data. Many
categories of secondary data are defined by several authors including documentary data,
survey-based data and multiple source data (Dale et al., 1988, Hakim, 1982, Robson,
2002).
In this research, literature review and other material (reports, surveys and others) are
used to collect the preliminary information about managing and improving complex
business process. By reviewing the literature a state of knowledge about research
elements and their potential integration have been explored. The purpose of secondary
data is to support the generation and refinement of the research idea and help to set
study‘s objectives, while the second is to provide the required secondary data that
contributes in achieving fowling three objectives:
1. to gain in-depth understanding of existing solution techniques for managing
complex business process;
2. to highlight the relationships and common features of healthcare facilities; and
3. to explore the common challenges and problems of business processes in the
healthcare setting and supply chain context.
As illustrated in chapters 2 and 3, the literature review has offered a wide view of the
applications of solution techniques such as simulation modelling and optimisation and
their role in managing complex business process in healthcare and supply chain context.

RESEARCH METHODOLOGY
97
This was followed by an analysis of the common problems in different types of
healthcare facilities, and between these problems and in the supply chain domain.
Finally, research gaps are concluded and utilised to develop the integrated framework
by providing a clear vision about the aspects and requirements for designing the
structure of the framework and its components.
Targeting the first two research questions, an extensive literature review has been
conducted systematically on business process modelling and optimisation on healthcare
and supply chain. An overview of different types of problems and techniques was
constructed. Through more precise scanning for the little available publications on
integrated methods in healthcare management and by taking into consideration the main
objectives of the healthcare system, a theoretical framework was developed to fill the
gaps in the application and techniques, which is detailed in the next section.
4.3 THE PROPOSED INTEGRATED FRAMEWORK
The main objective of this research is to utilise a multi-disciplinary approach in
developing an integrated decision support framework for healthcare managers and
planners to use in a practical and reflective way. This section discusses the aspects and
requirements for developing this framework. The integration between these methods
aim to addresses the gaps in the literature as well as providing a practical guidance on
managing and improving healthcare business process.
Figure 4-3 gives an overview of the framework where a detailed description of each
component is provided through the next sections. Further, the coordination between
these components is explained in details along with highlighting their points of
integration.

RESEARCH METHODOLOGY
98
Data Analysis
Business Process Modelling
Simulation
Balanced
Scorecard (BSC)
Patients Patterns
Patient Grouping
Inter-arrival Time
Data Seasonality
Data PreperationConceptual
Model
Multi-Criteria Decision Analysis (MCDA)
Performance
Measures
Selected
KPIs
Recommended
Optimisation
Technique (s)
Aggregated
Performance
Optimisation
OTM
KPIs Weights
Single/multi-objectives
Types and range
of decision variables
Decision Variables
Optimal values of
decision variables
Hospital Information System Direct Observations Site VisitWork Sampling
Patient Records Processing Time
Problem
Definition
Patient Flow
Resources Types
Main Processes
Layout Analysis
Patients AllocationTasks/Skills
Shifts/Issues
Problem Understanding
Decision Making Challenges
Solution Alternatives
Interviews (Staff)
Interviews
(Managers)
Data Collection
Preferences of
Decision Maker(s)
Scenarios
Actions
Plans
Populated
BSC
Performance
Value Tree
Performance
Perspectives &
Measures
Figure 4-3 An overview of the integrated framework.
4.3.1 Business Process Modelling
Problem definition is one of the key elements in developing the framework. Healthcare
systems contain a high level of social interactions that are characterised by complexity

RESEARCH METHODOLOGY
99
and in particular at decision points. Therefore, problems associated with healthcare
service delivery and managing patient flow are usually hard to define problems. Gaining
a better understanding of the healthcare process is essential for making correct
justifiable decisions and providing effective solutions. Accordingly, modelling the
underlined business process requires its understanding from the point of view of the
individuals who are directly involved in the process of service delivery. The data
collection phase combined interview method, focus group, and quality circles with
experts and practitioners. This in return provided holistic insights for various system
issues and aspects. The underlined business processes are then mapped into a
conceptual process model using one of the well-developed modelling languages (i.e.
IDEF) where sub-processes and activities are identified. The control flow definition is
created by identifying the entities that flow through the system (e.g., patients, staff, and
medical resources) and describing the connectors that link the different parts of the
process. Finally, the resources are identified and assigned to the activities where
necessary. The process model should be verified to ensure that the model does not
contain errors and is logically valid.
4.3.2 Data Analysis
Interviews and observations have a qualitative nature, which of a great benefit in
understanding and modelling of work flow in the healthcare facility. However, to
incorporate the time factor, patients records are collected from the hospital information
system (HIS), including valuable information about patients and their care steps such as
arrival time, mode of arrival, referral type, and time of discharge or admission. The
patients data are recorded by different types of staff such as administrators, doctors, and
nurses through the stages of patients care. Due to the high level of pressures within
healthcare processes, hospital records sometimes lack accuracy and consistency.

RESEARCH METHODOLOGY
100
Therefore, prior to extracting any set of data from these records, data mining procedures
are needed to extract the trustworthy set of records. This is followed by a further
analysis of the resulting records for extracting patient arrival patterns, patient groups,
distributions and seasonality features. The collected qualitative data through interviews
and observations are also used to build a business process model for the healthcare
facility, while this model along with the quantitative data (i.e., patients records) are
combined in a simulation model to dynamically analyse the healthcare process.
4.3.3 Simulation Modelling
The process models, along with the analysed empirical data are combined into a
dynamic simulation model (Figure 4-4) which puts the data collection phase and
business process modelling in the context of developing a simulation model.
Source: Banks et al. (1996)
Figure 4-4 Discrete-event simulation developing steps.
According to Banks et al. (1996), the simulation procedure starts with the problem
formulation. The objective of this step is to:
Problem
formulation
Setting of
objectives
and overall
project plan
Model conceptualisation
Data collection
Model translation Verified?
No
Validated?
No
No
Experimental
design
Production runs
and analysis
More runs?
Documentation
and reporting
No
Implementation
Yes
Yes
Yes
Yes

RESEARCH METHODOLOGY
101
• Defining the general objectives of the study
• Highlighting specific questions of interest that needs to be answered
• Ensuring and facilitating data accessibility
• Listing the key performance measures onto which the efficiency will be evaluated
• Encapsulating the scope and system configuration of the model
• Setting a time frame for the project
Once all of the issues are discussed, the modeller has got a clear roadmap with goals
and milestone to accomplish. Within this stage, it is difficult to foresee all eventualities,
but at least the modeller has got a general idea, as well as the stakeholders, of the
outcome of the project. Alternatively, Pidd (2004) proposes a technique for problem
structuring, where he assumes that the modeller faces a ―mess‖ of which its core
components can only be vaguely be described by the stakeholders. The task of the
modeller is then to apply structured interview method in order to get as much
information out of the ―mess‖ as possible without influencing or manipulating the
problem definition.
Accordingly, the data collection phase proceeds to gather relevant information about the
underlying processes, which focuses on the retrieval of the data and also on the
construction of a conceptual model (i.e., business process model). The quantitative data
is either stored in computer databases, written on documents, or recorded on any type of
storage medium. Access to the quantitative data may not always be easy because the
content may be protected by law and other restrictions, and also because the data may
be distributed over various systems. The quality of the data is also a crucial factor, as
the simulation model is deeply reliant on it. The modeller has therefore to question the

RESEARCH METHODOLOGY
102
credibility and validity of the data. However, perfect data assemblies that are without
error are rare; technical failure of automated input devices and typographical errors by
those who input the data are just some reasons for flawed data. The qualitative data can
be obtained via interviews from the experts. In the healthcare context, experts are those
who work in the ED - doctors, nurses, consultants, administrators and managers.
However, depending on the role of the expert the information provided may differ and
be biased due to the different perspectives of the employees. Based on the gathered data
from interviews and observations, the process of building a conceptual model (i.e.,
business process model) is initiated for application in developing the simulation model.
The conceptual model is used in the simulation model for two purposes: first it is
guidance for the later actual simulation model, which contains and considers a higher
degree of details, and second it is used as a communication platform in order to validate
the model with the experts working within the real system.
Once the conceptual model is completed, it is validated with the staff in the facility
including managers and medical staff. This is essential step in the credibility of the
simulation model and hence its output. Once the conceptual model is validated, the
model translation phase begins, which combines the validated conceptual model and the
results of the patients‘ records analysis. The simulation model can either be the
programming of code, or modelling with the use of simulation software package, which
provides the modeller with tools that are typical and essential for certain modelling. The
procedure is often referred as model translation, because it describes the transformation
of the abstract conceptual model into a higher detailed complex executable simulation
model. Verification during the modelling phase ensures that the model logic reflects the
underlying business process. The difference between verification and validation within
the context of simulation modelling is that verification ensures that the transformation

RESEARCH METHODOLOGY
103
of the conceptual model has been applied correctly, where validation considers the
representation of the model towards the system under investigation (Balci, 1997).
Verification and validation is an important part of simulation modelling as these provide
the techniques with which the credibility of the model can be guaranteed. Verification
of the simulation model is applied by comparing the outcome data of the simulation
model with the data obtained during the data collection phase. Once the simulation
model is verified and validated, the decision makers can us the replicated model to
investigate a number of decisions and alternatives (i.e., what-if scenarios) to foresee the
consequences of these decisions. For example, design of experiments (DOE) (Kleijnen,
2008) can be used to test a number of scenarios to obtain answers of these ―what-if‖
statements. Depending on the set up of the model and the number of the parameters, the
amount of potential scenarios and experiments increases significantly due to the
multiple possible parameter combinations. Following the experimental design,
production runs are necessary to provide the data, which is used to analyse the
simulation output, where performance measure(s) can be retrieved and compared with
the system under investigation.
The final step is then to document, present, and implement the potential alternative.
Documentation of the simulation result, as well of the project itself is necessary to
follow and to understand the simulation results as well as for the decision making
process. Because decision making is based on the results, the value therefore of the
presentation should not be underestimated. There are various ways to present simulation
results: written reports, graphs and diagrams, and animation. A combination of the three
methods is the best suited, however, an animation will probably be best in order to
visualise complex relationships within the simulation model. Thus the presentation can
be used to increase the transparency of complex systems.

RESEARCH METHODOLOGY
104
4.3.4 Integration of Balanced Scorecard and Simulation
Although applied in the context of healthcare management, the full potential of the BSC
is not recognised due to its limitations and its implementation challenges. In order to
alleviate the limitations of the BSC in terms of its measurement capabilities and the lack
of inferring the causal-effect among performance measures, an integration between BSC
and simulation is proposed in Figure 4-5.
Simulation Development Process
BSC Development process
Plan
Scenarios/
Actions
Analysis and
Evaluation
Monitor
Implementation
Satisfactory
Overall
Performance?
Balanced
Scorecard
Problem
Formulation
Conceptual
Model
Data
Collection & analysis
Model
Construction
Verification &
Validation?
NO
Simulation Model
YES
National Healthcare
Strategy
Set & Agree Performance
Perspectives and measures
Performance
Measures
YES
Populated BSC
NO
Benchmarking
Continual
Improvement
Cycle
Des
ign P
has
eIm
ple
men
tati
on P
has
e
Figure 4-5 Balanced scorecard and simulation modelling integration.
Simulation modelling and BSC can be integrated at the design level and the
implementation level. At the design level, the performance perspectives and
performance measures collected through interviewing senior managers of the healthcare
facility and based on national health strategy (e.g., HSE in Ireland). This is essential to
align the performance measures of the healthcare facility (e.g., emergency department)
with the strategic objectives of the national health authorities. Consequently, the
RESEARCH METHODOLOGY
105
simulation model will provide quantitative values of the provided performance
measures where qualitative measures such as patient satisfaction can be related to
measurable indicators such as average waiting time and LOS. Such integration allows
the evaluation of a wide range of actions and plans based on the recommendations of
national reports and surveys. These plans can then be evaluated in the form of what-if
scenarios, with the results are used to populate the design BSC.
The results are then evaluated and interpreted by experts and decision makers, which
provide guidance on the implementation of suggested alternatives and plans, as well as
set benchmarks of the maximum performance that can be achieved using the available
resources and staffing levels. Hence, more practical solutions and plans can be
recommended and tested using the simulation model. Therefore, such integration
between simulation and BSC helps to focus on strategic visions to obtain desired
outcomes, assists in making better decisions, improves communication within the
organisation, provides continual feedback on strategies, promotes adjustments to
changes and assists both individuals and organisations in achieving their goals and
objectives. Moreover, the capabilities of the simulation can provide interesting
information about the causal-effect relationships among performance.
4.3.5 Multi-Criteria Decision Analysis
Though limitations of BSC, in terms of its measurement capabilities, are resolved by its
integration with simulation, there are still challenges in the selection of the key
performance measures. In the simulation context, these performance measures are the
only inputted from a preceding process in which selection of these measures is
performed. The selection of these measures is challenged by the split between different
views about the key performance indicators (KPIs). Furthermore, the number of
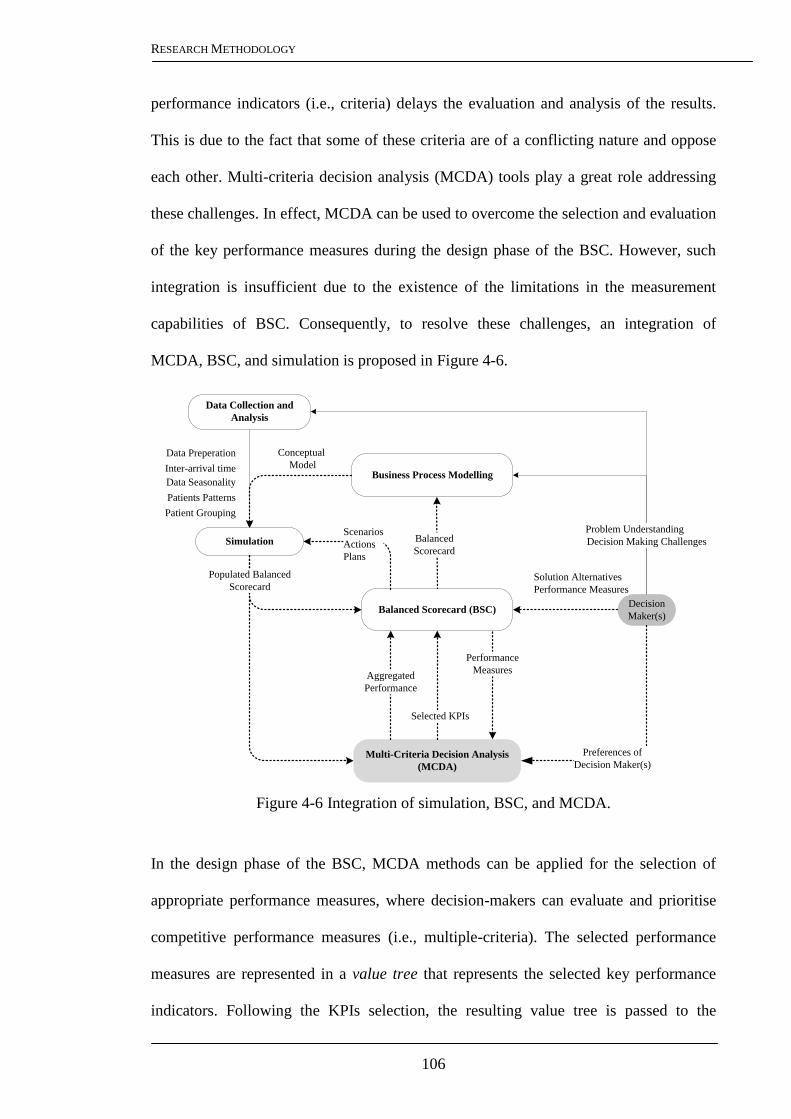
RESEARCH METHODOLOGY
106
performance indicators (i.e., criteria) delays the evaluation and analysis of the results.
This is due to the fact that some of these criteria are of a conflicting nature and oppose
each other. Multi-criteria decision analysis (MCDA) tools play a great role addressing
these challenges. In effect, MCDA can be used to overcome the selection and evaluation
of the key performance measures during the design phase of the BSC. However, such
integration is insufficient due to the existence of the limitations in the measurement
capabilities of BSC. Consequently, to resolve these challenges, an integration of
MCDA, BSC, and simulation is proposed in Figure 4-6.
Figure 4-6 Integration of simulation, BSC, and MCDA.
In the design phase of the BSC, MCDA methods can be applied for the selection of
appropriate performance measures, where decision-makers can evaluate and prioritise
competitive performance measures (i.e., multiple-criteria). The selected performance
measures are represented in a value tree that represents the selected key performance
indicators. Following the KPIs selection, the resulting value tree is passed to the
Data Collection and
Analysis
Business Process Modelling
Simulation
Balanced Scorecard (BSC)
Patients Patterns
Patient Grouping
Inter-arrival time
Data Seasonality
Data Preperation Conceptual
Model
Balanced
Scorecard
Scenarios
Actions
Plans
Decision
Maker(s)
Multi-Criteria Decision Analysis
(MCDA)
Preferences of
Decision Maker(s)
Performance
Measures
Solution Alternatives
Performance Measures
Selected KPIs
Problem Understanding
Decision Making Challenges
Aggregated
Performance
Populated Balanced
Scorecard

RESEARCH METHODOLOGY
107
simulation model in the form of balanced scorecard, as explained in the previous
section. Due to the large number of performance indicators in the populated BSC,
MCDA can effectively aggregate the marginal performance of the indicators
considering the preferences of the decision makers regarding the achievement of the
defined strategic objective. This dual usage of MCDA within the integrated framework
can contributes greatly in the decision making process and in making informed
decisions for improving and managing healthcare business process.
4.3.6 Business Process Optimisation: Selection Dilemma
4.3.6.1 Selection Criteria of Optimisation Methods
The literature on business process optimisation has highlighted on the wide variety of
optimisation techniques and their applications. Such diversity results in a selection
dilemma for managers attempting to optimise their business process. Improper selection
of the optimiser may result in inadequate decisions made by managers, which can have
critical consequences economically as well as in the people lives, especially in the
context of healthcare. Though a variety of schemes have been proposed in the literature
for classifying these techniques, only few dimensions of the problem are considered.
There is a lack of classification schemes which consider different aspects of both the
optimisation technique as well its capability for solving the intended problem. The
suitability of the optimisation technique depends on many factors related to the
application as well as the optimisation technique. These factors have been identified and
discussed in this section.
Optimisation Objective Function: most real-world problems, such as healthcare
systems and supply chain networks, are inherently characterised by multiple and mostly
conflicting objectives. There are a wide diversity of approaches that can manage multi-

RESEARCH METHODOLOGY
108
objectives such as Pareto-based methods and aggregate-based methods. Optimisation
methods are then distinguished according to the underlined multi-objective approach.
Decision Variables Space: in a discrete space, decision variables take a discrete set of
values such as the number of beds, medical equipments, locations of healthcare facilities
and scheduling rules. On the other hand, in a continuous space, the feasible region
consists of real valued decision variables such as throughput rates, staff utilisation,
order quantity and reorder quantity in inventory problems. Equally, decision variables
can be qualitative (e.g. queuing strategies) or a mixture of discrete and continuous
values. Optimisation methods differ in the way they can handle these situations.
Solution Space: solution space is the space of all possible solutions that satisfy all the
problem constraints. Some categories of optimisation methods are preferred when the
search space is finite, for example the decision alternatives are small or the combination
of variable values has a small range. Other categories of optimisation methods are more
effective when the solution space is very large or infinite, which is usually associated
with continuous variable space, or combinatorial problems where the combination of
decision variables is invisible to be enumerated.
Modelling Approach: an optimisation algorithm interacts with the model of the
underlined system or process in order to provide optimal values of decision variables.
Optimisation approaches are different according to the modelling technique used,
whether analytical and deterministic models (e.g., mathematical models) or dynamic
stochastic models (e.g., simulation models). Therefore, the modelling approach used for
modelling the system performance to be optimised has to be considered to determine a
suitable optimisation technique.

RESEARCH METHODOLOGY
109
Optimisation Searching Mechanism: optimisation methods use different mechanisms
for searching for the optimal solution. This is highly dependent on many factors, such as
the modelling approach, problem complexity and the objectives of the decision makers.
The optimum solution is the vector that gives the global optimum value
(maximum/minimum) of the objective function, and avoids the local optimum. Based
on the reviewed articles, optimisation methods can be characterised as local search
methods, global search methods or guaranteed optimal methods.
4.3.6.2 Optimisation Technique Map (OTM)
Upon the identification of the main factors that contribute to a proper selection of
optimisation technique, an Optimisation Technique Map (OTM) is proposed as a
classification scheme of optimisation techniques (Figure 4-7). All optimisation selection
criteria are included in the classification concurrently: optimisation mechanism,
decision variables, solution space and modelling approach. From the right hand side, the
OTM begins with the modelling approach to classify the optimisation techniques, then
decision variables and solution space are used respectively for further categorisation; on
the other hand, the OTM can also be viewed from the left hand side of the figure as a
classification of methods in terms of the optimisation mechanism: mathematical
programming, gradient-based, meta-model-based and statistical methods, and meta-
heuristics.
Adding the ―optimisation objective function‖ to the classification scheme is shown in
Figure 4-8. The horizontal dimension represents the searching mechanism of the
techniques, while the vertical axis for the nature of the solution space.

RESEARCH METHODOLOGY
110
Ma
them
ati
cal
Pro
gra
mm
ing
Dir
ect
Sea
rch
Met
ho
ds
Gradient-
Based
Meta-Model-
Based
Random
Search/Meta-
Heuristics
Response Surface
Methodology (RSM)
Kriging
Finite Difference
Estimation
Likelihood Ratio
Estimator (LR)
Perturbation Analysis
(PA)
Artificial Neural
Network (ANN)
Multiple Comparison
Procedures (MCP)
Ordinal Optimisation
(OO)
Ranking & Selection (R
& S)
Simulated Annealing
(SA)
Tabu Search (TS)
Evolutionary Algorithms
(EAs)
Continuous
Decision
Variables
Mixed/Qualitative
Decision Variables
Finite
Solution
Space
Discrete
Decision
Variables
System
Mod
el
Branch & Bound
Cutting Plane
Simplex Method
Interior Point
ε-optimal
Linear
Programming
Integer/Mixed
Integer
Programming
Nonlinear
Programming
Linear Objective
Function /Constraints
Continuous Decision Variables
Integer & Mixed
Decision
Variables
Infinite Solution
Space
Finite Solution
Space
Nonlinear Objective
Function /Constraints
Infinite
Solution
Space
Op
tim
isati
on
Tec
hn
iqu
es
Mathematical
Model
Simulation ModelStatistical
Methods
Figure 4-7 Optimisation Techniques Map (OTM).

RESEARCH METHODOLOGY
111
Op
tim
isa
tio
n
Tec
hn
iqu
es
Mix
ed/Q
uali
tati
ve
Dir
ect
Sea
rch
R&
SO
O
MC
P
Met
a-
heu
rist
ics
SA
AIS
TS
GA
NS
GA
VE
GA
NP
GA
SP
EA
MO
GA
PA
ES
Aggregate based
Aggre
gate
Pare
to-
base
d
Par
eto
base
d
FD
EL
RE
PA
RS
M
AN
N
Kri
gin
g
Gra
die
nt
base
d
Met
a-
mod
el
base
d
Bra
nch
&
Bou
nd
Cu
ttin
g
Pla
ne
Sim
ple
x
Met
hod
Inte
rior
Poin
t
ε-opti
mal
Con
tin
uou
s
Dis
cret
e
Mix
ed
Exact
Solu
tion
s
Lo
cal
Sea
rch
Glo
ba
l
Op
tim
isa
tio
n
Gu
ara
nte
ed
Op
tim
um
Infinite Solution
Space
Finite Solution
Space
PS
O
AC
O
Aggre
gate
-
base
d
Aggre
gate
-
base
d
Pare
to-
base
d
Aggre
gate
-
base
d
Sta
tist
ical
Simulation Model
Mathematical Model
Co
nti
nu
ou
sD
iscr
ete
Figure 4-8 A Multi-dimension classification scheme for optimisation methods.

RESEARCH METHODOLOGY
112
4.3.7 Applying Optimisation
The steps of applying optimisation within the integrated framework are shown in Figure
4-9. Prior to the optimisation, the OTM is used to select an appropriate optimisation
technique for the underlying optimisation problem (e.g., capacity planning, resource
allocation, and scheduling). The decision variables and its range of values are used to
specify the decision variable space (i.e., discrete, continues, or mixed) and whether the
solution space is finite or infinite.
Figure 4-9 The optimisation procedure within the integrated framework.
The selected KPIs are then used, based on the preferences of decision makers, to
determine whether the optimisation objective function is single-or multi-objective
Data Collection and
Analysis
Business Process
Modelling
Simulation
Balanced Scorecard
(BSC)
Patients Patterns
Patient Grouping
Inter-arrival time
Data Seasonality
Data Preperation
Conceptual
Model
Balanced Scorecard
Multi-Criteria Decision Analysis (MCDA)
Performance
Measures
Selected
KPIsRecommended
Optimisation
technique (s)
Aggregated
Performance
Populated
BSC
MCDA
Optimisation
OTM
Weights of
selected
KPIs
Single/multi-objectives
Types and range
Of decision variables
Decision Variables
Optimal values of
decision variables

RESEARCH METHODOLOGY
113
optimisation problem. In the case of multi-objectives, the weights of the selected KPIs
can be used by the optimisation technique for calculating the aggregated performance
using the weighted sum approach. Along with the modelling approach (which is
simulation modelling in this study); optimisation technique is recommended for starting
the optimisation process. The initial values of the decision variables (e.g., the currently
used number of medical equipments or beds) are used by the optimisation technique to
generate new values towards improving the objective function(s). Thereupon, the
simulation runs the scenarios generated by the optimisation model and the BSC is
populated with the scenario results. MCDA is then aggregating the performance using
the populated BSC (i.e., value tree). The aggregated performance can then be used by
the optimisation model to search for better set of values that optimise the required set of
objectives.
4.4 RESEARCH DESIGN PROCESS
In order to test the propose framework, a deduction approach is needed. This is achieved
by proper selection of the research design for further refinement and development, and
to evaluate and validate the framework. The research design is the set of guidelines that
form the connection between theory and research, ontological and epistemological
considerations, and qualitative and quantitative research (Bryman and Bell, 2007).
Further, the process of research design provides the link between the questions that the
study is asking, the data that are to be collected and the conclusions drawn (Robson,
1994). A discussion about the design of this research is given in this section in terms of
research strategies and methods. The objective is to describe the general plan that links
the research paradigm of this research to the research strategies, and subsequently to
research methods for collecting and analysing empirical material for the validation of
the proposed framework.

RESEARCH METHODOLOGY
114
4.4.1 Research Strategy: A Case Study
The choice of research strategy is guided by investigating the extent of existing
knowledge base, it philosophical underpinnings, and the questions and objectives which
it must address (Yin, 2008). Some of these strategies entail deductive approach, others
an inductive approach. However, often allocating strategies from one approach or the
other can be misleading. Moreover, one or more research strategy can be part of another
strategy (Saunders et al., 2009). For example, the survey strategy can be used as part of
a case study. Therefore, research strategies should not be thought of as being mutually
exclusive.
A case study strategy is one that is used as a systemised way of observing (Weick,
1984). A case study strategy was adapted in this research for three main reasons; firstly,
the ability to study a phenomena in its natural context; secondly, the possibility of
undertaking a deeper investigation in a case study which can provide additional insight
which is hard to capture using other alternatives, such as surveys. Finally, the case study
strategy does not explicitly manipulate or control variables; rather it studies them in
their context. These features are quite suitable for research into identifying an integrated
framework where the aim is to perform the study within realistic settings. Therefore, the
case study strategy has been employed in this research for the evaluation, refinement,
and validation of the developed framework. Due to the common features and challenges
between healthcare facilities, the emergency department has been chosen for this
research as a case study. The characteristics and features of the ED are similar to those
of other hospital departments (e.g., intensive care unit, operating rooms, and radiology
department), such as high level of complexity, demand uncertainty, limited resources,
and high level of human interactions. The issues of capacity planning, scheduling (staff,
operations, and patients), demand planning, and resource allocation are all common

RESEARCH METHODOLOGY
115
between these departments. Moreover, addressing these issues usually involves
multiple, often conflicting, objective such as reducing waiting times for patients,
increasing efficiency, and achieving a high level of service quality. For these reasons,
the ED is a typical case study in the healthcare settings, and a great deal in terms of
providing answers to the research questions and to achieve the research objectives.
Moreover, studying and improving the ED performance has recently increased and
attracted the attention of many authors such as Coats and Michalis (2001), Tan et al.
(2002), Samaha et al. (2003), Connelly and Bair (2004), Gunal and Pidd (2006),
Duguay and Chetouane (2007), and Khare et al. (2009). A detailed description of the
case study used in this research is given in the next section.
4.4.2 An Emergency Department Case Study
The university hospital partner in this research is a an acute, public, voluntary, and adult
teaching hospital that holds a unique place in the delivery of healthcare not only to the
community of North Dublin but also to the rest of the Republic of Ireland. This 570-bed
hospital provides primary, specialised, and tertiary healthcare services, with a 24hr ―on-
call‖ ED which services over 55,000 patients annually. The department has officially,
13 monitored trolley spaces; 3 of these trolley spaces (resuscitation area) are reserved
for major trauma and critical care patients. The ED also has an ambulatory care area
with a capacity of six trolley spaces. Two isolation rooms, 1 psychiatric assessment
room, two rapid assessment triage bays, and two triage rooms are also provided by the
ED. The layout of the ED is shown in Figure 4-10.
Five distinct areas can be identified: a waiting room for walk-in patients waiting for
triage, a diagnostics area (X-Ray and CT scan), an ambulatory care unit area (ACU), a
ED resuscitation area (CPR) and an ED major (Majors) assessment area. Patients arrive

RESEARCH METHODOLOGY
116
by ambulance – usually in a critical condition – are routed directly to the resuscitation
area, while patients who require their conditions to be monitored stay in the major
assessment area. The ambulatory care area is for patients suffering from abdominal
pain, headache, limb problems, wounds, head injuries, and facial problems (amongst all
other ambulant patients).
Walk in Patient
Waiting Room
Registration
Office
Triage
Room
2
RAT
1
Nursing Station
M1M2M3
M4
M5
M6
M9 M10
Ambulance/Trolley
Respiratory
M7
RAT
2
Hospital
Admission
Isolation Room 1
Isolation Room 2
Family Room
X-RayCT Room
Triage
Room
1
Resuscitation Area
ED Major Assessment
Area
Ambulatory Care
Psychiatric
Assessment
Room
Figure 4-10 ED physical layout and main care areas.
As a 24hr department, the ED has three consultants, two nursing managers, and eleven
nurses during the day and nine nurses at night which collectively are divided into six
types of nurse; Advanced Nurse Practitioner (ANP), triage nurse, resuscitation nurse,
respiratory nurse, majors/minors nurse, and healthcare assistant. Physicians (excluding
the 3 Consultants who provide shop floor cover between 9-5 or 8-8 with 24/7 on-call
provision) are divided into three types: registrar/specialist registrar, Senior House
Officer (SHO), and intern that are distributed as follows when the roster allows: three
registrars per day with a 10hr shift starting at 8am, 12pm, and 10pm; two interns with a

RESEARCH METHODOLOGY
117
one shift per day from 8am to 5pm Monday to Friday; and fixed shifts of SHOs during
the day and night to keep the ED running by having more than one doctor at specific
time (i.e. from 2 to 7 doctors during the day).
According to the task force report in 2007, the overall ED physical space and
infrastructure is inadequate. Additionally, the partner hospital is operating at
approximately 99% occupancy, according to the task force report in 2007, with resultant
difficulty in accommodating surges in numbers of ED admissions. This is often
aggravated by delays in patient transfer to critical care (ICU/HDC) beds. Consequently,
the hospital is not compliant with volume and wait time targets (6 hour patient
experience time target). The ED figures show a clear evidence of overcrowding with an
average of 17% of patients leaving the ED before being seen. Moreover, the average
time from registration to discharge is 9.16 hrs with 2.58 hrs standard deviation, i.e. 3.16
hrs over the HSE metric (0-6 hrs). Also, the average time from registration to acute
admission is 21.3 hrs with a standard deviation of 17.2 hrs, which is 15.3 hrs above the
national metric. Obviously, patients to be admitted usually experience a longer LOS
than discharged patients due to the delays which can occur between admission referral
by an ED doctor, bed allocation, and patient transferral from ED to the allocated bed.
Therefore, the introduction of the proposed framework has the potential to model and
manage the aforementioned complexities in a cost neutral, safe and controlled
environment, without the need to implement risky and potentially costly change
prematurely in real systems. The advantages of modelling and simulation are further
highlighted in the next section with a more focus on its usage as a research
methodology.

RESEARCH METHODOLOGY
118
4.4.3 Modelling and Simulation as a Research Method
Quantitative research emphasises a quantification method in the collection and analysis
of data that entails a deductive approach to the relationship between theory and research
and emphasises the testing of theories (Bryman and Bell, 2007). The quantitative
method incorporates the practices and norms of the natural scientific model of
positivism, where numbers are assigned to measurements and reality is perceived as an
external, objective reality (Hussey and Hussey, 1997). While the quantitative method
focuses on the meanings derived from numbers, the qualitative method emphasises on
words and its meaning, which entails an inductive approach to the relationship between
theory and research (Bryman and Bell, 2007). The qualitative research is then concerned
with gaining an understanding of the phenomenon natural setting through observation,
rather than the measurement and quantification of the phenomenon (Weick, 1984, Irani
et al., 1999).
The underlying assumptions of quantitative and qualitative research are seen as
contradictory by many authors (Burrell and Morgan, 1979) who argue that there is a
mutually exclusive relationship between both strategies. For example, reality is seen
objectively by positivist research and is considered measurable, controllable and
explainable and therefore many researchers align the epistemology of positivism with
the quantitative research (Easterby-Smith et al., 2002). Qualitative methods, however,
has been brought together with the constructive researches since the methods can deal
effectively with the human perspectives, opinions and experiences and conclude
findings based on the relationship between subjective parameters (Ticehurst and Veal,
2000). However, several authors have highlighted that researchers who focus on one
research approach all the time will possibly lose sight of the bigger picture (Waring,
2000). Similarly, Gable (1994) and Remenyi and Williams (1996) argue that these

RESEARCH METHODOLOGY
119
alternative research methods should be seen as the ends of a continuum. According to
(Ticehurst and Veal, 2000), the merits and values of qualitative and quantitative
business research are always aligned with different philosophical positions. Moreover,
in order to address a wider range of the research aspects, it is necessary to blend
quantitative and qualitative methods (Crotty, 1998).
One way to get an understanding of a phenomenon or a complex process is by directly
observing it and studying its mechanisms. This delivers knowledge and understanding
of how the system reacts to internal and external changes. In order to deepen this
understanding, another way is to rebuild this system. Replication is done by building
representative models of the original system (i.e., simulation). Once a representative
model is established, controlling the parameters of the model allow knowledge to be
retrieved about the system behaviour towards changes. Testing of hypotheses can then
be conducted using the system model (Law and Kelton, 1991).
The procedure of developing a simulation model (described in Section 4.3.3) is
considered as a quantitative method based on the positivist paradigm due to the
emphasis on tangible data and results, and the causality and generalisation. However,
due to the simulations flexibility to incorporate variability and uncertainty, there are
major differences between simulation and other quantitative methods. Simulation, for
example, can deal with the variability and complexity of business processes while
conventional methods are generally linear and cannot recognise the variability that is
inherent in human behaviour. Moreover, it is possible to include and generate both
measurable and intangible data and results using the simulation. Generally, simulation
can cope with the main limitations of conventional quantitative methods as highlighted
in Table 4-1.

RESEARCH METHODOLOGY
120
Table 4-1 The use of DES to cope with weaknesses of quantitative methods
Quantitative Methods Discrete Event Simulation
Orderliness and linearity Deals with non-linear relationships and
incorporates feedback loops
Lack of concern over the influence of
constraints
Ability to incorporate resources and resource
constraints
Exercise in ―post-decision rationalisation‖
Can be used for problem structuring and
discovery
Use of closed survey instrument reduces deeper
understanding of what is actually occurring
Possible to include soft variables from open
surveys and expert opinions
Relatively weak when used with the objective
of discovery; relatively poor discoverability
during data collection
Rich in discovering problems during
development and processing as well
Methodology of verification rather discovery Used for enhancing understanding and testing
hypotheses
Inability of researchers to observe something
without changing it
Provides rich pictures of interactions
and helps in objective analysis
Positivism demands an absolute level of
generalisation
Offers capabilities to model different
possible scenarios
Relies on measurable evidence and therefore
influences a high degree of control over the
phenomenon
Able to generate measurable evidence as well as
intangible evidence
Do not recognise the variability that is inherent
in human behaviour
Cope with high levels of variability
within/between the modelled variables
Source: Eldabi et al. (2002)
Simulation models provide the flexibility to accommodate arbitrary stochastic elements,
and generally allow modelling of all the complexities and dynamics of business
processes without undue simplifying assumptions (Terzi and Cavalieri, 2004). Its
modelling capabilities incorporate information about problem structure and resources
constraints which help decision makers to build better understanding about their
processes and safer environment for evaluating and testing solution alternatives.
Moreover, simulation can incorporate intangible data as part of the modelling process
which is used to understand the behaviour of most complicated business processes
(Eldabi et al., 2002). The overall procedure of simulation allows for the retrieval of
intangible information with the conjunction of the feedback from the stakeholders – that
would be possible to incorporate the feedback either during the verification or the

RESEARCH METHODOLOGY
121
validation phase. However, simulation offers more facilities to deal with the main
deficiencies of traditional qualitative methods (Table 4-2).
Table 4-2 DES coping with weaknesses of qualitative methods.
Qualitative Methods Discrete Event Simulation
The collection and analysis of data are
time-consuming and demanding because
many types of data are collected
Does not require high volumes of data for
development
Large variety of data may inhibit data
analysis
Can be used to identify key variables to avoid
unnecessary data collection
Qualitative data analysis techniques are also
considered ―not easy‖
May rely on expert opinions for fitting
available data
The inability of the researcher to interpret events
from the subject point of
view without biases
Capable of giving independent picture of the
situation by dynamic mimicking
The relationship between theory and research can
be weak, as qualitative research approaches are
criticised for not
instilling theoretical elements
Offers facility for adding or removing any
theoretical assumptions whilst examining their
impacts
The extent to which qualitative research can
be generalised beyond the confines
of a particular case, is questioned
It is possible to examine as many hypothetical
situations(what-if scenarios) expanded from the
base cases
Qualitative research does not offer the
pretence of replication, as controlling
the research setting destroys the interaction of
variables, and therefore affects
the underlying philosophy of this
research method
Ability to conduct experiments with
replications without destroying elements of the
model
Unstructured research is endangered of
being to be meaningless
The research may start as unstructured yet it
becomes more refined and structured in later
stages as more understanding
is gained from the process
It is possible to loose detachment of
the researcher, i.e. ―going native‖
Researcher is able to experience a simulated
environment without risking to loose
detachment
Potentially poor reliability, as qualitative
research often involves a single event
being observed by a single
researcher
It is possible to produce reliable qualitative
analysis, as model could be replicated and
observed by different researchers
Source: Eldabi et al. (2002)
Consequently, simulation models can contain both empirical and a priori knowledge,
where both inductive and deductive conclusions can be accessed in the context of the
model creation (Becker et al., 2005). The deductive approach is a common part in the
simulation modelling procedure, where a set of explicit assumptions (i.e., theories) are
tested while the results of the model (i.e., observations) can then be investigated
inductively (Axelrod, 2007). In all parts of the simulation process, assumptions about

RESEARCH METHODOLOGY
122
the "real world" (ontology) and about human cognition processes (epistemology) come
into play. The development of a simulation model and the interpretation and validation
of the simulation results, primarily depend on the inherent epistemological orientation
of the research study (Becker et al., 2005).
Based on the above discussion, the simulation modelling procedure would be applicable
as qualitative and quantitative research approach, where the process of modelling and
simulation is developed on a sound framework which does not only provide a deeper
understanding of the by-products of scientific enquiry but also of the research process
itself (Eldabi et al., 2002). Due to the complexity of healthcare processes and the
unstructured nature of the system behaviour, simulation is used in this study, where
quantitative and qualitative data and results are combined.
4.5 RESEARCH TECHNIQUES AND PROCEDURES
4.5.1 Triangulation
Triangulation aims at the integration of multiple data sources in a multi-method design.
The basic assumption of triangulation is that the weaknesses in each single data
collection method/source are compensated by the counter-balancing strengths of another
method/source (Jick, 1979). Triangulation during data collection and analysis serves
two goals. First, it is proposed as a near-talismanic method of confirming findings
(Miles and Huberman, 1994). In this perspective, data-source triangulation mainly
reduces random measurement error (Kumar et al., 1993). Second, triangulation is useful
in so far as different facets of the phenomenon are investigated through the most
appropriate combination of method and sources (Yeung, 1995). In this way,
triangulation increases the internal validity of the study. Practically, triangulation can be
accomplished in many ways. For instance, triangulation during data collection can be

RESEARCH METHODOLOGY
123
performed by interviewing various respondents on the same topic, by interviewing the
same respondent on a particular topic more than once, as well as by the combination of
primary and secondary data sources. Analytical triangulation can be performed by using
dissimilar analytical methods (between-method triangulation) or by using variations
within the same basic analytical technique (within-method triangulation) (Begley,
1996).
4.5.2 Primary Data Collection
Primary data collection was commenced to satisfy any additional data required to
achieve research objectives. Primary data is defined as the new data which is gathered
specifically for the conducted research and has not been collected or analysed before in
any other study. The collection of primary data is time and cost consuming as
researchers need access to the organisations or research participants on more than one
occasion to get the required data. Most research objectives are achieved using a
combination of secondary and primary data, however if there are limitations in
providing secondary data, the study has to rely completely on the primary data. Three
basic methods for primary data collection include:
Interviews: a conversation between two or more people in which one person (the
interviewers) seeks to obtain specific information via asking a series of
questions to the other person or persons (the interviewee).
Observations: careful viewing and documenting for the studied system.
Historical data: quantifiable data about the studies system under study.
The aforementioned data collection methods were used concurrently in the context of
previously discussed case study where the data the data collection phase started in July
2008 (Figure 4-11).

RESEARCH METHODOLOGY
124
Sep
-08
Oct
-08
No
v-0
8D
ec-0
8Ja
n-0
9F
eb-0
9M
ar-0
9A
pr-
09
Ad
min
istr
atio
n/m
edic
al s
taff
Inte
rvie
ws
His
tori
cal
Dat
aP
erfo
rman
ce M
easu
res
Fo
cus
Gro
up
s
Wo
rk F
low
/Sam
pli
ng
Sit
Vis
its
/ O
bse
rva
tio
ns
Dat
a E
ntr
y
Au
g-0
8
Pat
ien
t F
low
Do
cto
rs,
nu
rses
ED
Lay
ou
t, r
eso
urc
es,
wo
rk f
low
Jul-
08
Sen
ior
Man
ager
sS
enio
r M
anag
ers
Pat
ien
t F
low
Co
nce
ptu
al M
od
el
Figure 4-11 Primary data collection through the ED case study

RESEARCH METHODOLOGY
125
Four preliminary interview sessions with senior managers (two ED consultants and two
nursing managers) were carried out in order to get insights about the current challenges
they face in managing their department. The current awareness of business process
management methods (e.g., simulation modelling, multi-criteria decision analysis, and
optimisation) was also a key topic in the discussions and interviews.
A better understanding for healthcare processes, activities, challenges, and variables
was acquired with valuable insights of the challenges in the decision making process.
The interviews helped to develop significant inputs that critically supported the
development and validation phases of the proposed framework. This was followed by
constructing a focus group of ED doctors (one registrar and three SHOs) and nurses (a
triage nurse, one ANP, and two general nurses) where a weekly meeting was scheduled
for discussing issues such as general patient care paths, categories of patients and their
complexities, and resources availability and capacity issues. Meanwhile, a number of
visits have been made to the ED (i.e., site visits) with an objective to analyse the ED
layout that reflects how resources are allocated and utilised within the ED.
Site visits were carried out two times per week where different weekdays were selected
at different hours (i.e., morning, afternoon, and night time). This was an essential step in
order to observe the variability of care service demand (i.e., patient arrival) and the ED
performance at different time intervals. Furthermore different levels of details about the
work flow (i.e., patient flow) within the ED were collected in that stage by using two
sampling methods. The first was the stationary sampling, where times are taken for
specific process steps such as medical assessment time, treatment time, and lab results.
The second sample method was to follow certain patients through the system and to
note the processes that the patient goes through.

RESEARCH METHODOLOGY
126
Upon the completion of that stage, the conceptual model phase started where the main
ED processes were mapped and detailed into a conceptual process model using IDEF
modelling languages. For the validation of the ED conceptual model, it was circulated
among the senior managers and the patient flow focus group, where it was then refined
through another cycle of interviews and observations. In conjunction with the process
mapping phase, a number of interviews with ED senior managers (two consultants, and
two nurse managers) has been taken place to collect information about the performance
areas and performance measures. Incorporating these measures at that stage was very
useful for developing the balanced scorecard for the ED and setting the objectives of the
simulation model (i.e., the simulation output).
Concurrently, a focus group for historical data collection started in November 2008 to
discuss issues related to electronic patients records, existing information systems, and
data entry procedures. That focus group included members from the information system
department in the partner hospital. The discussions with that focus group was supported
a close observation of the data entry procedures through the patient journey through the
ED and by a series of short interviews with the ED staff (e.g. registration staff, triage
nurses, and physicians). Initially, and after the approval of the ED consultants, a sample
of two months (January 2009 and February 2009) was provided by the information
system department. By June 2010, a total of 59,986 anonymous patient records have
been collected over a 16-month period (1st January 2009 to 30
th April 2010), which was
provided by hospital managers, that track the patient data during normal operations by
using a real-time patient tracking information system. Each patient record is described
by the different patient-level variables such as patient severity index, patient presenting
medical complaint, mode of patient arrival, patient attend date/time, time patient seen
by doctor, and whether the patient left without seen, discharged, or admitted to the

RESEARCH METHODOLOGY
127
hospital. The analysis of these data is of great value in building a model that account to
the pattern of patients arrival and the demand seasonality. A detailed description about
the collected data and its analysis is given in chapter 5.
4.5.3 Data Analysis
Having collecting detailed data about the studied facility, the first step is to extract
information and knowledge from raw data. A number of ways of analysing case data is
presented in Miles and Huberman (1994). A very common starting point is to construct
a display of the data. A display is a visual format that presents information
systematically so that valid conclusions can be drawn. Displays can be simple arrays,
but might also be event listings, critical incident charts, networks, time-ordered
matrices, taxonomies (Miles and Huberman, 1994). A number of statistical tests can be
applied to check the consistency of the collected data and for the detection of outliers
and missing values. Patterns in data can be extracted by discovering clusters or patterns
that have similarities or differences; for example, grouping patients according to their
severity levels or medical complaints. A number of considerations have to be taken in
this step such as the number of combinations between groups. A similar approach is to
select pairs of groups and to look for similarities and differences in terms of required
resources and care services. With well quantified case data, continuous measures can be
developed. This lends itself to simple analysis such as graphing and more sophisticated
statistical tests such as seasonality detection and demand pattern. This can be performed
on the whole healthcare process (e.g., seasonality) or at the entity level (e.g., patient
inter-arrival time for each patient group). Another form of analysis is making
predictions (e.g., suggested alternatives from senior managers) and then using the
framework to evaluate them. This might consist of gathering, in tabular form, the
evidence supporting and evidence working against a prediction and examining it.
RESEARCH METHODOLOGY
128
A third method is the causal network. A causal network is ― a display of the most
important independent and dependent variables in a field study and of the relationships
among them‖ (Miles and Huberman, 1994, p. 153); such as the relationships between
variables and key performance measures, and inter-dependencies within variables. In
the whole process, several tactics for generating meaning were used such as noting
patterns, grouping, counting, making contrasts/comparisons, subsuming particulars into
the general, noting relations between variables, finding intervening variables making
conceptual coherence. As more knowledge became available during the course of the
field work and associated conceptualisation, recurrent patterns of interaction between
variables within the proposed framework started to emerge. Some variables looked to be
connected, while others looked random or unconnected. A detailed data analysis of
historical data and framework results is given in chapter 5.
4.6 RELIABILITY AND VALIDITY
According to Hammersley (1992, p. 67):
“Validity is another word for truth and reliability refers to the degree of
consistency with which instances are assigned to the same category by
different observers or by the same observer on different occasions”
It is particularly important to pay attention to reliability and validity in order to evaluate
the quality of the research design in case study research. According to Yin (1994) who
cited Kidder and Judd (1986), reliability and validity have a number of dimensions:
Construct validity, internal validity, and external validity.
Construct validity is the extent to which correct operational measures are established for
the concepts being studied. As Eisenhardt (1989, p. 546) points out:

RESEARCH METHODOLOGY
129
“We are poor processors of information. We tend to leap to conclusions
based on a limited set of data, be overly influenced by individuals, ignore
basic statistical properties and inadvertently drop conflicting evidence.”
Construct validity is achieved by using multiple sources of evidence (Yin, 1994,
Marshall and Rossman, 1999). For this study, triangulation was employed to strengthen
construct validity by using multiple sources of evidence for data collection: namely
documentation, historical records, interviews, direct observations, and participant
observation. Deliberately seeking confirmation from multiple data sources leads to more
reliable results. Internal validity is the extent to which a causal relationship can be
established, whereby certain conditions are shown to lead to other conditions, as
distinguished from spurious relationships, while for external validity, establishing the
domain to which a study‘s findings can be generalised (Yin, 1994). Accordingly, in this
study, a number of validation and verification techniques were performed during the
case study to validate the collected data from interviews and observations with staff and
senior managers. The analysis of these data has also been validated. Moreover, the
results of the framework have been validated statistically as well as qualitatively with
decision makers. This is to ensure the internal validity of the framework.
The strategy of the case study method can be divided into a single case study or
multiple cases. One of the criticisms of the case study method is that the results cannot
be generalised, because they relate to specific situations and localities. In response,
Woods (1997) and Yin (2008) argue that multiple-case studies can provide analytical
generalisations. There seems to be a general belief that multiple case studies are
preferred over single case studies. It is argued that more cases allows for more
generalisation and eventually results in a more externally valid outcomes (Leonard-

RESEARCH METHODOLOGY
130
Barton, 1990). However, this argument relies upon the inappropriate notion of potential
statistical significance of multiple case study research (Dubois and Gadde, 2002). As
such, the number of cases is not a quality criterion for multiple-case study research
(Eisenhardt, 1989). The only argument for switching from single to multiple case study
research (at the risk of losing depth) is to create more theory-driven variance and
divergence in the data, not to create more of the same.
However, in the context of this study, there are many factors that strengthen its external
validity. Due to the common features and challenges between healthcare facilities, the
emergency department has been chosen for this research as a case study. The
characteristics and features of the ED are similar to those of other hospital departments
(e.g., intensive care unit, operating rooms, and radiology department), such as high level
of complexity, demand uncertainty, limited resources, and high level of human
interactions. The issues of capacity planning, scheduling (staff, operations, and
patients), demand planning, and resource allocation are all common between these
departments. In addition, addressing these issues usually involves multiple, often
conflicting, objectives such as reducing waiting time for patients, increasing the
efficiency, and achieving high levels of service quality. Therefore, the framework was
used for resolving many of these problems such as capacity planning, staff scheduling,
demand planning, and throughput analysis, which are common problems that occurs in
other healthcare facilities as well as other service sectors and supply chain business
processes. Therefore, it is believed that the empirical evaluation of the framework
through all these phases of the case study contributes towards increased confidence in
the transferability of findings to a broad range of healthcare settings.

EMERGENCY DEPARTMENT – A CASE STUDY
131
CHAPTER 5: EMERGENCY DEPARTMENT –
A CASE STUDY
5.1 INTRODUCTION
Overcrowding is widely prevalent amongst Emergency Departments (EDs) in Ireland
and has reached ‗National Emergency‘ proportions in the last decade. Emergency
Departments overcrowding is an increasing feature of many healthcare systems
worldwide and many of the causes are from outside individual EDs. The evidence to
suggest ED overcrowding is associated with poor health outcomes for all patient groups
is compelling, as is the proof that these adverse outcomes extend into the wider
healthcare system.
Healthcare systems must thus constantly seek cost-effective organisational strategies to
reduce ED crowding and improve patient outcomes. However, due to the backdrop of
contracting national health budgets, the health service executive (HSE) aims to provide
tangible reforms that can lead to better service quality and patient care experiences. As
part of its strategy, HSE uses a KPI of a 6 hour maximum Patient Experience Times
(PETs) to nationally benchmark quality ED care; yet complex change implementation is
constrained by the necessity of maintaining concurrent safe patient-care in a cost-
effective fashion. Therefore, the introduction of the proposed framework has the
potential to model and manage the aforementioned complexities in a cost neutral, safe
and controlled environment, without the need to implement risky and potentially costly
change prematurely in real systems. Consequently, the integrated framework has been
utilised to determine the best effective ―real-time strategies to improve PETs whilst the
considering the difficulty in recruitment of emergency clinical staff.

EMERGENCY DEPARTMENT – A CASE STUDY
132
5.2 EMERGENCY DEPARTMENT PROCESS MAPPING
5.2.1 Patient Flow Analysis
Upon arrival at the ED and registration, walk-in patients (self-referral or GP referral)
remain in the waiting area to be triaged. When a patients name is called, depending on
triage staff availability, the patient is assessed by a triage nurse. Based on the patient‘s
condition and triage assessment, each patient is assigned a clinical priority (triage
category) according to the Manchester Triage System (MTS) that is widely used in UK,
Europe, and Australia (Cronin, 2003). The MTS uses a five level scale for classifying
patients according to their care requirements; immediate, very urgent, urgent, standard,
and non-urgent. Once a triage category is assigned, the patient may be sent back to the
waiting room until a bed or trolley is available in an appropriate treatment area, based
on the type and intensity of their care requirements.
The patients waiting time depends on the triage category of patient and the availability
of both medical staff (i.e. ED physician or ANP) and empty trolleys, which are a
prerequisite for a complete and accurate assessment. Following the patients assessment
by ED clinician, a decision is made: either the patient is to be discharged or admitted to
the hospital. These are the primary care stages which are relevant for all patients,
whether they are discharged from or admitted to the hospital. Secondary patient stages
are those steps involved in the care of some but not all patients such as diagnostics (e.g.
X-Ray and blood test), and second patient assessment by ED doctor. Consultation may
be requested by ED staff from a medical/surgical speciality doctor to confirm that a
patient should be admitted or to obtain advice on the best possible treatment for the
patient who is to be discharged. Figure 5-1 shows a detailed flowchart for patient
journey through the ED.

EMERGENCY DEPARTMENT – A CASE STUDY
133
Patient
Arrival
Registration Triage
Assessment by
ED Doctor
ED doctor
available ?
Yes
Diagnostics
needed ?
Diagnostics
Yes
Patient wait
results
Opinion
needed ?
Request
Opinion
No
Yes
Admit patient to
hospital ?No
Request Patient
Admission
Hospital bed
available ?
Yes
No
Speciality
doctor available
?
Yes
Patient wait
opinion
Patient wait bed
Discharge
Patient
Transfer patient to the
Hospital bed ―inpatient‖
Yes
Triage nurse
available ?
Walk-in Patient
Yes
Patients arrive by ambulance
Patient wait in
the waiting Room
Patient wait Doctor
No
NoNo
Patient
Placement
Patient
No
Figure 5-1 Detailed patient flow through the ED.
5.2.2 Patient Routing
The ED layout is used to represent the routes of different patient with various medical
complaints and triage categories. For example, for Minor Injury (MI) patients, Figure
5-2 shows the sequence of the steps that take place upon the arrival of minor injury
patient. A patient with minor injuries goes to the triage room where patients are triaged
and a triage category is assigned (step 1). Then, the patient sent back to the waiting
room waiting ED doctor or an Advanced Nurse Practitioner (ANP) (step 2). The triage
nurse puts the patient record in a queue in the nursing station corresponding to the
patient severity level (i.e., triage category) (step 3). In step 4, the ANP comes from the
ambulatory care unit to the nursing station to check for new patients cards in the queue.
The ANP then collects the patient from the waiting room (step 5), and then in step 6, the
ANP escorts the patient to the ambulatory care unit, where the assessment process
starts. The ANP orders X-Ray tests for the patient if needed (step 7, 8).

EMERGENCY DEPARTMENT – A CASE STUDY
134
Depending on the patient condition, the patient is then discharged or waits to be
admitted to hospital.
Walk in
Patient
Waiting Room
Registration
Office
Triage Room
2
RAT
1
Nursing Station
M1M2M3
M4
M5
M6
M9 M10
Ambulance/
Trolley
Respiratory
M7
RAT
2
Hospital
Admission
Isolation Room
1
Isolation Room
2
Family
Room
X-RayCT Room
Triage
Room
1
Resuscitation Area
ED Major Assessment
Area
Ambulatory Care
Psychiatric Assessmen
t Room
1
2
3
4
5
6
78
Figure 5-2 Minor injury patients routing steps.
Another example with more complications is the routing steps for patients with
Respiratory Problems (see Figure 5-3). While the patient is in the triage room, the triage
nurse searches for the respiratory nurse (step 1) and then back to the patient in the triage
room (step 2). The patient is then move to the respiratory room (step 3), where the
respiratory nurse goes to search for oxygen bottles near the CPR (step 4A) of inside the
X-Ray area (step 4B). The nurse then goes back to the respiratory room with the oxygen
bottle (step 5A, 5B), usually with help from the ED porters to carry the O2 bottle. The
nurse then brings a respiratory mask (step 6, 7) to be used with the O2 bottle. Finally,
the nurse records her notes about the patient and his/her status (step 8). In some cases,
the respiratory nurse is not available, in which case the triage nurse searches for a doctor
or senior nurse to assist in assessing the patient. The respiratory room may not be
available, thus patient assessment takes place in another area within the ED, such as a

EMERGENCY DEPARTMENT – A CASE STUDY
135
majors trolleys, a minor injuries clinic or a trolley in the ED corridors. Similarly, the
routing information about other patient care paths has been analysed and mapped by
identifying the movement of patients and resources for each underlying care path.
Walk in Patient
Waiting Room
Registration
Office
Triage Room
2
RAT
1
Nursing Station
M1M2M3
M4
M5
M6
M9 M10
Ambulance/
Trolley
Respiratory
M7
RAT
2
Hospital
Admission
Isolation Room
1
Isolation Room
2
Family
Room
X-RayCT Room
Triage
Room
1
Resuscitation Area
ED Major Assessment
Area
Ambulatory Care
Psychiatric Assessmen
t Room
11 22
33
4A4A
4B4B
5A5A
5B5B
66
77
88
Figure 5-3 Patients with respiratory problems routing steps.
5.2.3 ED Process Mapping
Based on the analysis of patient flow through the ED, a detailed flowchart is built which
highlights the common processes and decision points involved in the care of patients
through the ED. Each ED process is then broken down into smaller sub-functions with
key resources (e.g. staff and medical equipments) at each care stage are identified and
detailed using IDEF0. IDEF0 is a powerful tool for modelling complex systems which
allows users (e.g. ED managers, decision makers, system analysts) to comprehensively
understand the system through modelling decisions, actions, and processes in a
hierarchical form. Such an organisational strategy allows the system to be easily refined
into more detail until the model is as descriptive as necessary for the decision maker
(Kim and Jang, 2002). The top level of the developed IDEF0 model is shown in Figure

EMERGENCY DEPARTMENT – A CASE STUDY
136
5-4. The main unit of an IDEF0 model is an activity block that describes the main
function of the process. ICOMs (Input, Control, Output and Mechanism) are
represented by horizontal and vertical arrows. Process control (top arrow) can be patient
information (e.g. arrival time, triage category, and presenting complaint), safety
regulations, or national/international standards whereas process mechanisms are usually
the agents/resources which facilitate the activity (e.g. ED physicians, nurses, and
physical beds/trolleys).
A0
ED
Processes
A1
Patient
Arrival
A2
Registration
A3
Triage
A6
Patient
Transfer
Patient
PatientPatient
A4
Patient
Allocation
Patient
Information
Mode of Arrival
Triage Category
Medical Staff
Cubicles
Bed/Trolleys/Seats
Medical Equipments
Administrative Staff
Ward/
Hospital
Capacity
Patient
A5
Patient
Assessment
& Treatment Patient
NODE: A0 NO.:ED Processes
NODE: A0 NO.:ED Processes
Constraints
Patient Information
PatientPatient
Transfer
Figure 5-4 Process mapping of main ED processes.
5.2.3.1 Triage Process
The triage process is usually performed inside one of the triage rooms where a number
of other activities are also performed such as initial diagnosis and assessment, blood

EMERGENCY DEPARTMENT – A CASE STUDY
137
test, patient allocation, and updating patient record (see Figure 5-5). In the initial
diagnosis and assessment, the triage nurse asks the patient about his/her complaint and
medical history. For each medical complaint, the nurse observes a series of
discriminators to specify the triage category of the patient, which indicate the patient‘s
severity level. These discriminators can be measured by recording some vital signs of
the patient and/or verbal description from the patient. The triage nurse orders blood test
for the patient if needed.
Medical Staff
Cubicles
Bed/Trolleys/Seats
Medical Equipments/
Computer Terminals
A31
Intial
Diagnosis
and
Assessment
A32
Blood Test
A33
Patient
Allocation
A34
Patient
Record
Update
Patient
Patient
Information
Patient Details
Patient Details
Patient Details
Patient
Patient
Patient
NODE: A3 NO.: 3Triage Process
A1
Patient
Arrival
A2
Registration
A3
Triage
A6
Patient
Transfer
Patient
Patient
Patient
A4
Patient
Allocation
Patient
Information
Mode of Arrival
Triage Category
Medical Staff
Cubicles
Bed/Trolleys/Seats
Medical Equipments
Administrative Staff
Ward/
Hospital
Capacity
Patient
A5
Patient
Assessment
&
Treatment
Patient
NODE: A0 NO.:ED Processes
Figure 5-5 Triage process mapping.

EMERGENCY DEPARTMENT – A CASE STUDY
138
The collected patient details along with the lab results, if available, are recorded by the
triage nurse in the patient record (soft copy), which in turn is printed out and handed
into the nursing area where the patient record is inserted in to a queue corresponding to
the patient triage category. Meanwhile the triage nurse works on placing the patient in a
proper location based on his/her severity level. The triage process can also be
performed, in severe cases, by rapid assessment triage team or inside the ambulance en
route to the hospital in accident and major trauma cases. There are many issues
concerning the triage process. First, the triage nurse consumes a considerable amount of
time searching for available place for the patient, which depends on the availability of
ED resources such as cubicles and trolleys. Second, the triage nurse can also be delayed
due to interruptions by patients in the waiting room asking about their turn for diagnosis
or complaining about longer waiting time.
Finally, the triage nurse can give inaccurate decisions about the patient triage category,
which can be altered by the doctor later on in the assessment phase. All these factors
contribute to longer waiting times for patients waiting to be triaged which in turn
contributes to overcrowding of the ED.
5.2.3.2 Patient Allocation Process
For patients arriving by ambulance, the allocation process is carried out by the rapid
assessment triage team or by any floor nurse(s), while for walk-in patients, this process
is performed by triage nurse as part of the triage process. For patients who need
constant monitoring (e.g., triage category one and two), they are allocated to CPR beds
or Majors area trolleys, while for less severe cases, patients are sent to ACU or wait in
the X-Ray waiting area inside the ED (Figure 5-6). There are a number of
considerations before sending patient to the waiting room again, for example, for
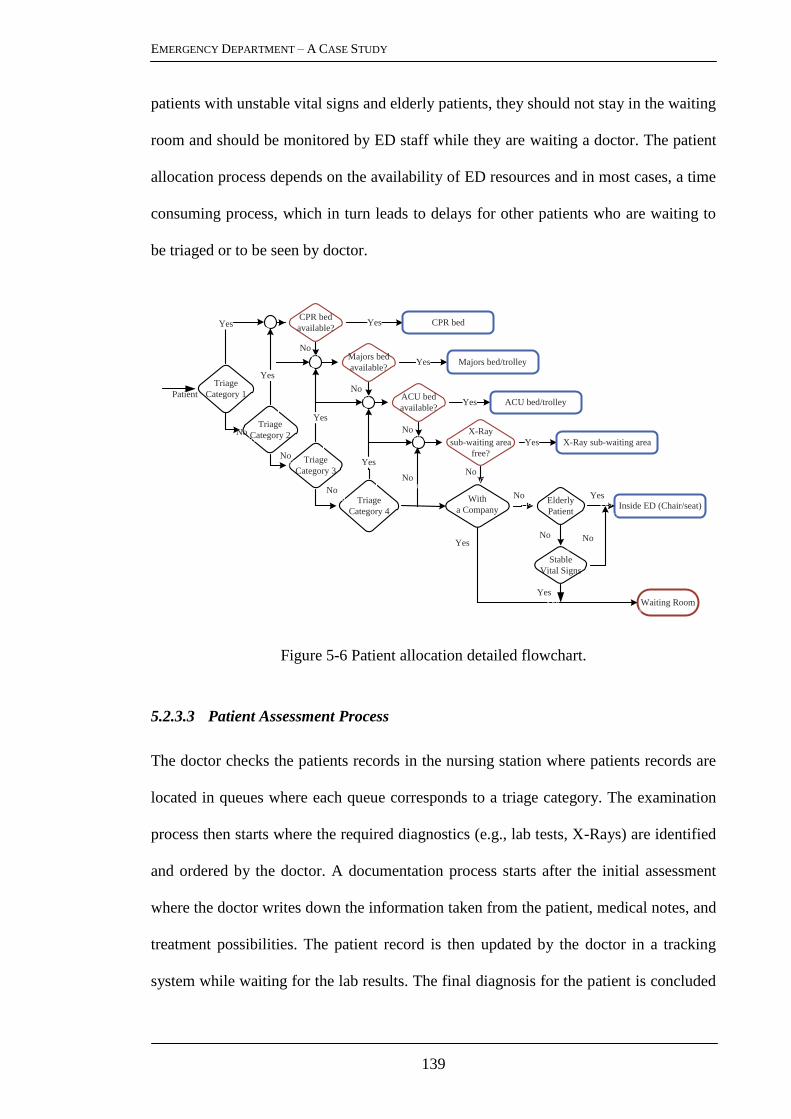
EMERGENCY DEPARTMENT – A CASE STUDY
139
patients with unstable vital signs and elderly patients, they should not stay in the waiting
room and should be monitored by ED staff while they are waiting a doctor. The patient
allocation process depends on the availability of ED resources and in most cases, a time
consuming process, which in turn leads to delays for other patients who are waiting to
be triaged or to be seen by doctor.
CPR bed
available?
CPR bed
available?
Majors bed
available?
Majors bed
available?
ACU bed
available?
ACU bed
available?
X-Ray
sub-waiting area
free?
X-Ray
sub-waiting area
free?
Waiting RoomWaiting Room
Yes
Yes
Yes
Yes
Yes
Triage
Category 1
Triage
Category 1
Triage
Category 2
Triage
Category 2
Triage
Category 3
Triage
Category 3
Yes
Yes
Triage
Category 4
Triage
Category 4
Yes
NoNo
NoNo
NoNo
NoNo
NoNo
NoNo
NoNo
NoNo
With
a Company
With
a Company Elderly
Patient
Elderly
Patient Inside ED (Chair/seat)Inside ED (Chair/seat)
Stable
Vital Signs
Stable
Vital Signs
PatientPatient
NoNo
NoNo
NoNo
YesYes
YesYes
YesYes
CPR bedCPR bed
Majors bed/trolleyMajors bed/trolley
ACU bed/trolleyACU bed/trolley
X-Ray sub-waiting areaX-Ray sub-waiting area
Figure 5-6 Patient allocation detailed flowchart.
5.2.3.3 Patient Assessment Process
The doctor checks the patients records in the nursing station where patients records are
located in queues where each queue corresponds to a triage category. The examination
process then starts where the required diagnostics (e.g., lab tests, X-Rays) are identified
and ordered by the doctor. A documentation process starts after the initial assessment
where the doctor writes down the information taken from the patient, medical notes, and
treatment possibilities. The patient record is then updated by the doctor in a tracking
system while waiting for the lab results. The final diagnosis for the patient is concluded

EMERGENCY DEPARTMENT – A CASE STUDY
140
after the arrival of lab results. At this juncture the treatment process is initiated (see
Figure 5-7).
There many challenge facing ED doctors in the assessment process. Patients are usually
not usually placed at the locations recorded in the patient tracking system.
Consequently, the doctor starts searching for the patient in the ED after the selection of
the patient records. This typically occurs due to the absence of a proper place for patient
assessment not being available due to overcrowding of the ED. Thus doctors have to
search for a proper location to complete the assessment process. Doctors experience
delays due to insufficient resources such as computer terminals, medical equipment, and
nurses. All of the above issues have to be analysed and represented using detailed
flowcharts and IDEF0.
Medical Staff
Medical Equipments/
Computer Terminals
A42
Diagnostics
A43
Patient Record
Update
A44
Patient Primary/
Final Diagnosis
A45
Intial Treatment
X-Ray Images
Blood Test Results
Patient Record updated with
blood results and X-ray Images
A41
Patient
Assessment and
Care
Figure 5-7 Patient assessment process mapping.

EMERGENCY DEPARTMENT – A CASE STUDY
141
5.2.4 Discussion and Remarks
The findings of this stage have highlighted many causes of the overcrowding of the ED.
Some of the causes are: the demand for emergency services exceeds the ability of the
ED to provide quality care within acceptable time frames; and limited physical space to
meet the timely needs of the next patient who needs emergency care. Due to the under-
provision in the non-acute sectors (e.g. primary care and community care services, out
of hours services, and rehabilitation services), patients who have no place to go for
medical care frequently seek the ED for urgent and primary care needs, as a result,
attributing to the increase in demands on emergency departments and acute admissions.
Moreover, over the last decade, a significant proportion of the Irish population has aged
and now exhibit increasingly chronic conditions that require emergency care services.
These patients with increased complications or with several acute conditions often
require lengthy and complex assessments, thus complicating the evaluation process and
making it more time-consuming.
The effect of these factors is usually compounded with the shortage of physical space
within the ED to cope with this increased volume of ED visits. Equally the lack of
inpatients beds with the studied hospital results in a long boarding time for ED patients
(i.e., the waiting time of patients to move from the ED to an inpatient bed inside the
hospital). On the other hand, hospitals suffer from a significant shortage in experienced
and dedicated nursing staff which provides the backbone of care in ED. While many of
these factors are outside the immediate control of the hospital, many more are the result
of operational inefficiencies in the management of the ED patient flow. In order to
identify these performance bottlenecks and operational inefficiencies, a comprehensive
simulation model has been developed for the ED.

EMERGENCY DEPARTMENT – A CASE STUDY
142
5.3 EMERGENCY DEPARTMENT BALANCED SCORECARD
5.3.1 Performance Perspectives and Measures
The outcomes of the interviews, focus groups, and quality circles include the agreement
on four performance perspectives that formed the ED balanced scorecard: internal ED
business processes, learning and growth, patient, and community engagement
perspectives (Figure 5-8).
Patient Satisfaction
Patient Throughput ED ProductivityLayout Efficiency Resource Utilisation
Avg. Service Time
Diagnosis
Registration
Triage
Patient : Doctor Ratio
Patient : Nurse Ratio
% Patient Treated
% of Patients
Admitted to Hospital
%Patients Left
Without Treatment
Pa
tien
tIn
tern
al
ED
Bu
sin
ess
Pro
cess
esL
earn
ing
& G
row
th
Upgrading Staff skills Staff Satisfaction
Avg. Doctor
Distance
Cycle Time
Patient
Registration
Triage
Doctor
Nurse
Admin
Staff
CPR
ACU
Majors
Assets
HSE and EMP Performance Targets
Co
mm
un
ity
Per
spec
tiv
e
Diagnosis
LoS Admitted
LoS
Discharged
Avg. Waiting
Time
Triage
Discharge
Diagnostics
Doctor
Admission
Avg. Nurse
Distance
Figure 5-8 The emergency department balanced scorecard
5.3.1.1 Internal Business Processes Perspective
The main objective in the internal ED business processes perspective is to improve the
ED performance which is driven by layout efficiency, patient throughput, ED
productivity, and resources utilisation. The layout efficiency measures the average
distance travelled for doctors and nurses per day, while the ED productivity is measured
in terms of five indicators: the ratio of patient per doctor, the ratio of patient per nurse,
the percentage of patients treated, the percentage of patients admitted to the hospital,

EMERGENCY DEPARTMENT – A CASE STUDY
143
and the percentage of patients who left the ED without treatment. The resources
utilisation further measured for two types of resources: ED staff (i.e., doctors and
nurses, and administrators) and ED assets such as majors trolleys, ambulatory care units
(ACUs), and resuscitation rooms (CPRs). The patient throughput is measured through
three dimensions: patient average cycle time, patient average waiting time, and patient
average service time. The patient cycle time is measured across the different stages of a
patients journey in the ED such as registration, triage, treatment, and diagnostics. This
includes LOS for both admitted and discharged patients. Similarly, the average waiting
time of patients is detailed for each stage, for example, average waiting time for triage,
to be seen by ED physician, for Diagnostics (e.g., lab or X-Ray results), for discharge or
hospital admission. Detailing these indicators is crucial for the detection of performance
bottle necks and for taking effective decisions. Moreover, these indicators/measures of
operations may be in fact drivers of others goals such as patient and staff satisfaction.
5.3.1.2 Community Engagement Perspective
The HSE performance targets and the national emergency medicine programme (EMP)
are considered in this perspective. The performance target of the HSE is that all patients
are processed through the ED in 6 hours or less from time of arrival to time of
separation (including admission for designated cases). The overarching aim of the EMP
is to improve the safety and quality of patient care in EDs and to reduce waiting times
for patients.
5.3.1.3 Learning and Growth Perspective
Due to the critical role of healthcare professionals, two main performance measures are
selected in this perspective: staff development and staff satisfaction levels. The staff
development is measured in terms of the effect of training the staff to do more than one

EMERGENCY DEPARTMENT – A CASE STUDY
144
task and to be dynamically allocated within the ED, while the staff satisfaction levels
are related to ―internal ED business processes‖ perspective through the following
indicators: staff utilisation, ratio of patients per doctor, and ratio of patients per nurse.
5.3.1.4 Patient Perspective
In designing the ED BSC, ―patient‖ was selected as a sole perspective with and ―patient
satisfaction‖ as the main measure for this perspective. The efficiency of internal ED
processes impacts the patient satisfaction level, therefore patient average waiting time
and patient average length of stay are connected to the patient satisfaction performance
measure.
5.3.2 Key Performance Indicators Selection
The balanced scorecard developed in the previous section for the ED includes
qualitative as well as quantitative measures. Examples of qualitative measures are the
patient satisfaction, staff skills upgrading and staff satisfaction. These measures cannot
be measured directly in the simulation model. However, these measures are directly
related to the performance measures in the ―Internal Business Processes‖ perspective,
which are of a quantitative nature and can be directly measured using simulation.
Nevertheless, there is redundancy among performance measures in that perspective (i.e.,
internal ED business process perspective).
For example, ―% of Patients Treated‖ and ―% Patients Left without Treatment‖ are of
complementary meaning. Moreover, some of the ED measures are of a conflicting
nature such as staff utilisation and staff satisfaction. Maximising staff utilisation may
lead to reaching the burnout level (i.e., 85% utilisation) which decrease the satisfaction
level of staff and in turn can deteriorate the whole ED performance. Consequently, to

EMERGENCY DEPARTMENT – A CASE STUDY
145
narrow down the list of the measures and to achieve the trade-off between conflicting
objectives, MCDA tools are used to systematically select the main key performance
indicators (KPIs). The selection process is based on the simple multi-attribute rating
technique (SMART) to identify the alternatives and criteria, which are relevant to the
decision problem. SMART begins with identifying the alternatives (in this case,
performance measures), and specifying the criteria to be used for evaluating these
alternatives. The SMART procedure is applied to the performance measures in the
―Internal ED business processes‖ perspective; this is because these measures are
interrelated with other performance perspectives and measures, such as patient and staff
satisfaction indicators.
Consequently, the 26 performance measures within this perspective are considered the
―decision alternatives‖ for the SMART procedure. Performance measures are then
evaluated against the main drivers of the ED performance, namely, layout efficiency,
patient throughput, ED productivity, and resource utilisation. Within the SMART
procedure, criteria are corresponding to these four performance dimensions. Once the
criteria and alternatives were identified, a value tree was produced as shown in Figure
5-9. The root of the tree represents the ED performance, the first level represents the
evaluation criteria and finally the second level represents the candidate performance
measures (alternatives).
The ED managers (three consultants) have been asked to rank the alternatives
(measures) against each criterion from most preferred to least preferred (i.e., from best
to worst). The degree of agreement among the ED consultants was very high indicating
a high level of consistency or inter-rater reliability (Gwet, 2008).
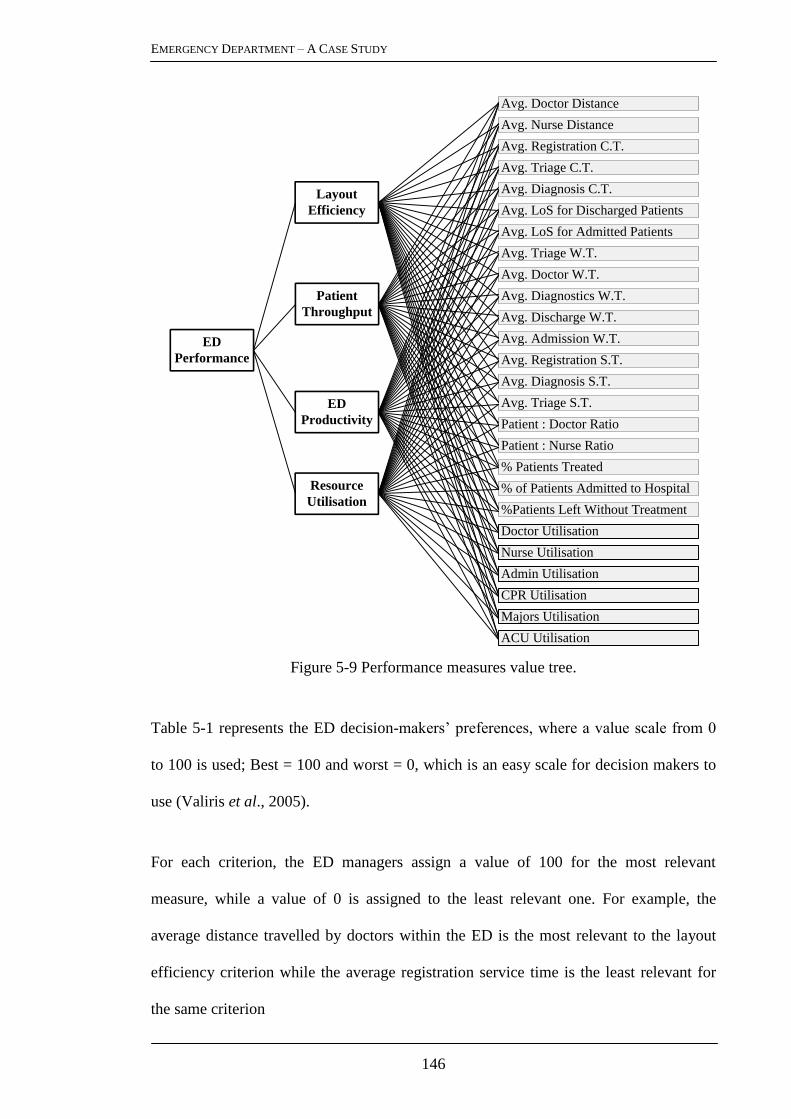
EMERGENCY DEPARTMENT – A CASE STUDY
146
Figure 5-9 Performance measures value tree.
Table 5-1 represents the ED decision-makers‘ preferences, where a value scale from 0
to 100 is used; Best = 100 and worst = 0, which is an easy scale for decision makers to
use (Valiris et al., 2005).
For each criterion, the ED managers assign a value of 100 for the most relevant
measure, while a value of 0 is assigned to the least relevant one. For example, the
average distance travelled by doctors within the ED is the most relevant to the layout
efficiency criterion while the average registration service time is the least relevant for
the same criterion
Avg. Diagnosis S.T.
Avg. Registration S.T.
Avg. Triage S.T.
Patient : Doctor Ratio
Patient : Nurse Ratio
% Patients Treated
% of Patients Admitted to Hospital
%Patients Left Without Treatment
Avg. Doctor Distance
Avg. Registration C.T.
Avg. Triage C.T.
Doctor Utilisation
Nurse Utilisation
Admin Utilisation
CPR Utilisation
Majors Utilisation
ACU Utilisation
Avg. Diagnosis C.T.
Avg. LoS for Discharged Patients
Avg. LoS for Admitted Patients
Avg. Triage W.T.
Avg. Discharge W.T.
Avg. Diagnostics W.T.
Avg. Doctor W.T.
Avg. Admission W.T.
Avg. Nurse Distance
Layout
Efficiency
ED
Performance
Patient
Throughput
ED
Productivity
Resource
Utilisation

EMERGENCY DEPARTMENT – A CASE STUDY
147
Table 5-1 The preference of ED senior manager of measures for each criterion
Evaluation Criteria
Performance Measures Layout
Efficiency
Patient
Throughput
ED
Productivity
Resource
Utilisation
Avg. Doctor Distance 100 50 70 90
Avg. Nurse Distance 90 50 70 80
Avg. Registration C.T. 10 60 20 20
Avg. Diagnosis C.T. 20 60 50 20
Avg. Triage C.T. 20 30 50 10
Avg. LoS for Discharged Patients 30 100 30 70
Avg. LoS for Admitted Patients 40 90 30 70
Avg. Triage W.T. 30 20 0 10
Avg. Doctor W.T. 60 70 40 40
Avg. Diagnostics W.T. 10 0 10 10
Avg. Admission W.T. 20 20 10 20
Avg. Discharge W.T. 20 10 10 0
Avg. Registration S.T. 0 10 10 20
Avg. Diagnosis S.T. 20 10 20 10
Avg. Triage S.T. 20 10 10 20
Patient to Doctor Ratio 40 80 90 90
Patient to Nurse Ratio 40 80 80 90
% of Patients Treated 50 90 100 80
% of Patients Admitted 30 60 20 70
% of Patients Left Without
Treatment 20 30 30 30
Doctor Utilisation 70 70 90 100
Nurse Utilisation 70 70 90 90
Admin. Utilisation 10 20 30 20
CPR Trolleys Utilisation 70 70 80 80
Majors Trolleys Utilisation 80 70 80 80
ACU Trolleys Utilisation 60 60 70 70
The other set of remaining measures are then rated regarding the most relevant and the
least relevant measures and assigned a value ranges from 0 to 100 by the ED manager.
Because the evaluation criteria are not equally important, the relative importance of the
criteria was ranked by the manager (Table 5-2).

EMERGENCY DEPARTMENT – A CASE STUDY
148
Table 5-2 The relative importance of the evaluation criteria
Rank Criterion Value score Normalised weighting
1 Patient Throughput 100 0.37
2 ED Productivity 80 0.29
3 Resource Utilisation 60 0.22
4 Layout Efficiency 30 0.11
The normalised weighting is calculated by dividing the value score by the total for all
value scores i.e. for rank 1, 100/270 = 0.37. The total score for each alternative is then
calculated as the weighted average of the value scores for all criteria for that alternative.
For example, for ―% of Patients Treated‖ measure see Table 5-3.
Table 5-3 Aggregated weights and values for ―% of Patients Treated‖ measure
Criterion Value score Criterion weight Measure weight
Layout Efficiency 50 0.11 5.56
Patient Throughput 90 0.37 33.33
ED Productivity 100 0.29 29.63
Resource Utilisation 80 0.22 17.78
Total 86.30
Table 5-4 summarises the final weighted scores for all the measures (alternatives),
where the rank of each measure is specified.
Finally, a threshold of 50 for the total score for the measures is set by the ED senior
managers for the final set of KPIs (Figure 5-10). KPIs are then passed to the simulation
model where they are measured and presented as the simulation output.

EMERGENCY DEPARTMENT – A CASE STUDY
149
Table 5-4 The final score and rank of performance measure using SMART
Performance Measures Total
Score Rank Performance Measures
Total
Score Rank
Avg. Doctor Distance 70.37 8 Avg. Diagnosis S.T. 14.07 21
Avg. Nurse Distance 67.04 9 Avg. Triage S.T. 13.33 22
Avg. Registration C.T. 33.70 16 Patient to Doctor Ratio 80.74 3
Avg. Diagnosis C.T. 43.70 15 Patient to Nurse Ratio 77.78 5
Avg. Triage C.T. 30.37 17 % of Patients Treated 86.30 1
Avg. LoS for Discharged
Patients 64.81 11 % of Patients Admitted 47.04 14
Avg. LoS for Admitted
Patients 62.22 12
% of Patients Left Without
Treatment 28.89 18
Avg. Triage W.T. 12.96 23 Doctor Utilisation 82.59 2
Avg. Doctor W.T. 53.33 13 Nurse Utilisation 80.37 4
Avg. Lab W.T. 6.30 26 Admin. Utilisation 21.85 19
Avg. Admission W.T. 17.04 20 CPR Trolleys Utilisation 75.19 7
Avg. Discharge W.T. 8.89 25 Majors Trolleys Utilisation 76.30 6
Avg. Registration S.T. 11.11 24 ACU Trolleys Utilisation 65.19 10
Patient : Doctor Ratio
Patient : Nurse Ratio
% Patients Treated
Avg. Doctor Distance
Doctor Utilisation
Nurse Utilisation
CPR Utilisation
Majors Utilisation
ACU Utilisation
Avg. LoS for Discharged Patients
Avg. LoS for Admitted Patients
Avg. Doctor W.T.
Avg. Nurse Distance
Layout
Efficiency
ED Performance
Patient
Throughput
ED Productivity
Resource
Utilisation
Figure 5-10 ED key performance indicators.

EMERGENCY DEPARTMENT – A CASE STUDY
150
5.4 DATA ANALYSIS
The analysis of empirical data is essential in developing a robust simulation model that
considers the time features of the intended system in terms of demand volume and
patterns. A thorough analysis of data enables the discovery of different type of patterns
(i.e., clustering) that are essential to reduce the complexity of the simulated system in
terms of patient groupings and patient allocation and routing analysis. This valuable
information is needed to build a comprehensive and representative dynamic model for
the underpinned healthcare system. Historical patients records have been gathered for
the ED during a 16-month period (1st January 2009 to 30
th April 2010) provided by
hospital managers. A total of 59,986 anonymous patient records have been collected
through the ED information system (patient centre), which is used by ED staff (e.g.,
administrators, doctors, and nurses) to record data about each patient through the stages
of their care. The quality of patients records is subject to level of pressures within
healthcare processes, which can significantly affect the accuracy and consistency levels
of these records. Therefore, prior to extracting knowledge from these records, data
mining procedures are needed to validate records.
5.4.1 Data Description
As shown in Table 5-5, the dataset consists of three tables: Patient Data table, Awaiting
Triage and Seen table, and Patient Tracking Data table. Each record in ―Patient Arrival
Data‖ table represents one patient using the following attributes: the patient
identification number, patient triage category, the HSE triage code, the patient
presenting complaint, mode of arrival, gender and patient date of birth, and whether the
patient attendance is new or a return attendance and total number of ED attends. With
the exception of ―Mode of Arrival‖ attribute, the ―Awaiting Triage and Seen‖ table
gives more information about what date and time the patient arrived, triaged, and was

EMERGENCY DEPARTMENT – A CASE STUDY
151
seen by an ED physician. Two important flags are also included in that table which
indicate if the patient was triaged or not, and if yes, whether the patient was seen by ED
physician or left without been seen. Additional redundant information is provided in
tables ‗Awaiting Triage and Seen‘ and ‗Patient Tracking Data‘ which shows the patient
waiting time, in minutes, from attendance to being triaged, and from being triaged to
being seen by ED member are repeated in both tables with the same data fields: namely
‗ Triage Wait‘ and ‗ Seen Response Time‘ respectively.
Table 5-5 Description of data fields in Patient data tables
Table Name Patient Arrival Data Awaiting Triage and Seen Patient Tracking Data
Table Fields
Patient ID Patient ID Patient ID
Triage Category Triage Category Triage Category
HSE Triage Code HSE Triage Code HSE Triage Code
Presenting Complaint Attend Date/Time Attend Date/Time
Mode of Arrival Patient Triaged Patient Triaged
Gender Triage Date/Time Triage Date/Time
Date of Birth Presenting Complaint Presenting Complaint
New Attendances Patient Seen Patient Seen
Reattendances Seen Date/Time Seen Date/Time
Attendances Seen Step Seen Step
Date of Birth Date of Birth
Gender Gender
Attendances Tracking Step Identifier
New Attendances Tracking Step Name
Reattendances Tracking Step Date/Time
Triage Wait (mins) Location
Seen Response Time (mins) Tracked by user group
Seen Wait (mins)
Triage Wait (mins)
Attendances
New Attendances
Reattendances

EMERGENCY DEPARTMENT – A CASE STUDY
152
Regarding the ―Patient Tracking Data‖ table, each record represents one process stage
of the patient journey in the ED. For each tracking step (i.e. process stage), the
following attributes were provided: a unique identifier of the tracking step, the name of
that step, the date and time, the location within the ED where the step was taken, and
the type of user group or staff who performed that step.
5.4.2 Data Preparation and Pre-Processing
There are a number of issues concerning the quality of the dataset. Firstly, there is a lack
of consistency in the data tables. For example, the number of patient records in the first
and second table is not the same. Additionally, in the ―Patient Tracking Data‖ table,
there are multiple entries for the same patient and the same tracking step name but with
different timestamp. While these multiple entries can be valid to some tracking steps
such as ―seen by doctor‖, it is invalid for other tracking steps such as ―attend‖ or
―triage‖. Secondly, there is a great amount of redundant information in the dataset. This
is due to the great number of common attributes between the provided tables as
highlighted in Table 5-5. Finally, there are missing data values for some attributes, for
example, the use of the value ―n/a‖ for some entries in ―Triage Category‖ and ―Seen
Step‖ attributes and the value ―other‖ for ―Tracked by User Group‖ attribute.
There are several reasons for such quality issues. Among these reasons is that the
majority of patient data is recorded in the tracking information system by the ED staff
after the patient has already completed the process stage (e.g. triage, treatment, or
discharged). This indicates that the staff member either needed a good memory or made
a good guess of the accurate time when the patient has been seen. Additionally, the
stressful working conditions within the ED, that have been observed during the
observation phases of this research, contribute to a great extend to the accuracy of the

EMERGENCY DEPARTMENT – A CASE STUDY
153
data recording process. However, the dataset provides a valuable source for extracted
detailed information about patient arrival pattern, patient routing through the different
ED processes, and the allocation of critical ED resources such as staff and physical
capacity. Prior to the extraction of these parameters, a number of procedures were
performed in order to overcome the aforementioned data quality issues and to obtain a
trustworthy set of data records.
5.4.2.1 Missing values
Patient records with the value ―n/a‖ in the ―Triage category‖ attribute were removed
from the dataset. The removal of these records was supported by many reasons. First,
for these records, the range of values of the ―HSE Triage code‖ was not one of the five
standard severity levels. It was however an indication that the patient was visiting the
ED for the ―Wound Care‖ or other ED clinics. This was confirmed by the finding that
the value of the ―Patient Triage‖ field was ―No‖ for all these records and there was no
date and time value for the ―Triage Date/Time‖ attribute. The last attribute checked for
these patient records was the ―Presenting Complaint‖ which was ―No Code Value
Recorded‖ for all the mentioned records.
5.4.2.2 Outlier detection and elimination
In order to detect the outliers in the dataset, the range of values for each attribute in the
dataset was analysed. Two attributes were found to have unexplained and extreme
values, namely, the ―Triage wait (mins)‖ and the ―Seen Response Time‖ attributes in
―Awaiting Triage and Seen‖ table. For example, in the ―Triage wait (mins)‖ attribute,
some patient records have the values ―41524‖ and ―7629‖, which is corresponding to
28.8 and 5.5 Triage waiting days respectively. After inquiring with the ED staff about
these values, they confirmed that these are errors in entering the data in the ED

EMERGENCY DEPARTMENT – A CASE STUDY
154
information system; however, they also said that similar values can be valid for other
tracking steps such as patients waiting to be admitted to the hospital. Based on the
cumulative percent distribution in Figure 5-11 for the triage waiting time attribute, it
was found that 95% of patients have a triage waiting time of less than 53 minutes.
Patient records with a value greater than this threshold have been identified as an outlier
and subsequently have been removed from the dataset.
Figure 5-11 Triage waiting time cumulative percentage.
Similarly, a cumulative percent distribution was created for the ―Seen Response Time‖
attribute (see Figure 5-12), where 95 per cent of patient were waiting to be seen by ED
staff within a value less than or equal to 544 minutes. Therefore, patient records with a
value greater than 544 minutes were removed from all the tables of the dataset.
Figure 5-12 Cumulative percentage of first clinical response time.
.0
10.0
20.0
30.0
40.0
50.0
60.0
70.0
80.0
90.0
100.0
0 2 4 6 8 10 12 14 16 18 20 22 24 26 28 30 32 34 36 38 40 42 44 46 48 50 52
Cum
ulat
ive
Perc
ent
Triage Waiting Time (mins)
.0
10.0
20.0
30.0
40.0
50.0
60.0
70.0
80.0
90.0
100.0
1
17
33
49
65
81
97
11
3
12
9
14
5
16
1
17
7
19
3
20
9
22
5
24
1
25
7
27
3
28
9
30
5
32
1
33
7
35
3
36
9
38
5
40
1
41
7
43
3
44
9
46
5
48
1
49
7
51
3
52
9
Cu
mu
lati
ve
Per
cen
tag
e
Seen Response Time (mins)

EMERGENCY DEPARTMENT – A CASE STUDY
155
5.4.2.3 Data Consistency
In the ―Patient Tracking Data‖ table, each record corresponds to one tracking step
through the patient journey in the ED. Examples of these steps are: attended, triaged,
doctor seen, and discharged. For each of these tracking steps, supplementary data is
recorded such as a unique identifier for the step, step name, timestamp, location, and the
type of staff performed the step. For each patient, the chronological order of these steps
gives complete information about the steps that patient has be put through his or her
journey in the ED. However, in that chronological order of patient records, it was found
that there are multiple entries for similar steps but with different timestamps. For
example, for some patient records, the ―attended‖ step was found repeated
consecutively but within few minutes of difference between the timestamps.
While it is possible the same patient attended more than one time to the ED, however, it
is unlikely this can happen within minutes. Similarly, for other tracking steps, such as
―Triaged‖ and ―Discharged‖, the same problem was found. However, for some tracking
steps, this assumption is invalid. For example, the ―Doctor Seen‖ step can be repeated
for the same patient within a few minutes. For eliminating these inconsistencies within
the dataset, both ―Triage wait‖ and ―Seen Wait‖ attribute in the ―Patient Tracking Data‖
table were used to select the step with the right timestamp, and to eliminate the
redundant ones. For example, for a repeated ―triaged‖ step, the difference between the
patient attendance time and the triage time is calculated for both entries, which
corresponds to the patient ‗time to be triaged‘ wait. The entry with a match between the
calculated triage time and the one recorded in the ―Triage Wait‖ field is the valid record,
while the other record is removed from the table. The total number of patient records
after these pre-processing procedures is 35,800 and 14,133 for the year 2009 and 2010
respectively, with a total of 49,933 patient records and 83 per cent trustworthy dataset.

EMERGENCY DEPARTMENT – A CASE STUDY
156
5.4.3 Data Extraction, Grouping, and Analysis
In order to developing a comprehensive and representative simulation model of the ED,
several parameters have to be investigated and taken into account such as processing
times for deferent processes, patient arrival characteristics, patient routing information
within the ED, the allocation of resources and medical staff. These parameters can be
obtained by analysis of hospital records, staff interviews or by direct observations of the
processes.
5.4.3.1 Patient Arrival Pattern
Regarding the patient arrival patterns, different analysis scales has been used to analysis
the patient arrival to the ED: monthly, weekly, and daily arrival patterns (see Figure
5-13). Based on the monthly analysis (Figure 5-13a), the seasonality of patient arrival
was detected, where the characteristics of patients arrival are similar every four
consecutive months. This was supported by the senior managers of the ED where they
confirmed this pattern by the stability of the ED staff over each period. Moreover, the
patient demand is the highest around working days, whereas the demand is at its lowest
levels around weekends (Figure 5-13b). During the course of the day, the demand
increases, where the peak is around the midday and which then decays slowly
afterwards to its lowest levels during the night time (Figure 5-13c).
These arrival patterns give an overview about the demand for services in the ED and
different scales for the patient arrival characteristics. However, it is inaccurate to use
only one arrival pattern for all patients in the simulation model. In order to approximate
the arrival pattern of patients, patients has to be grouped and each group has its own
unique arrival characteristics and patterns.
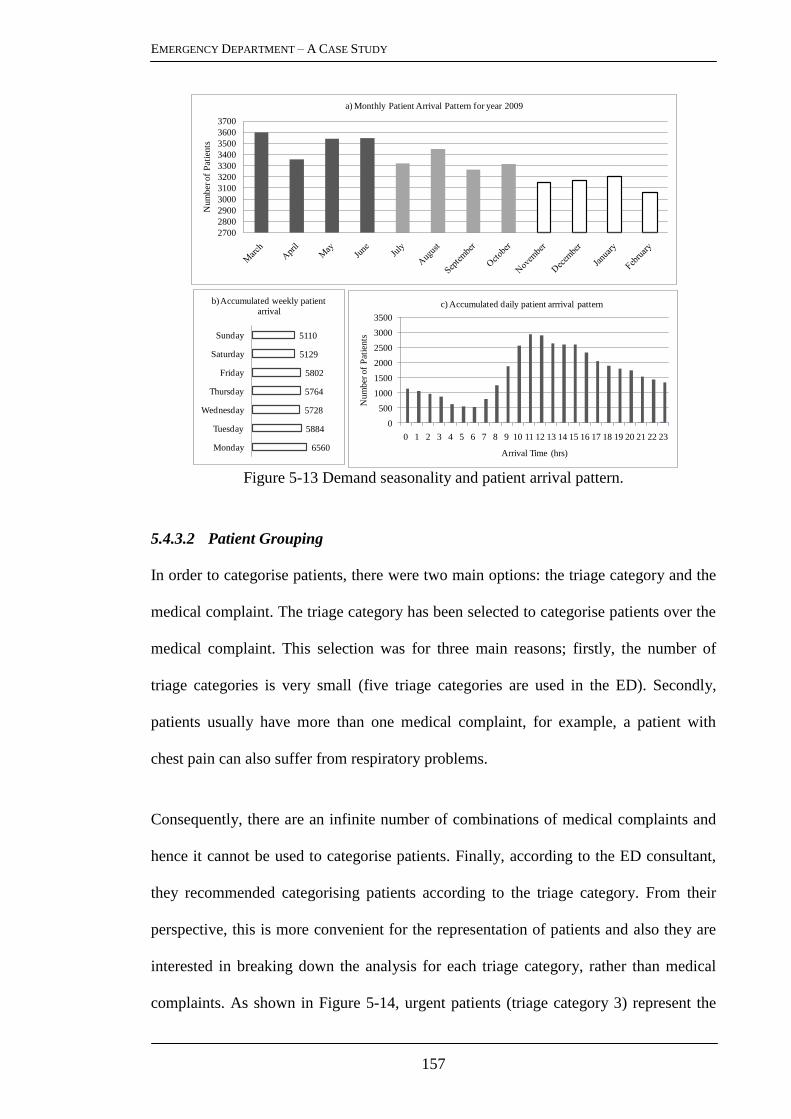
EMERGENCY DEPARTMENT – A CASE STUDY
157
Figure 5-13 Demand seasonality and patient arrival pattern.
5.4.3.2 Patient Grouping
In order to categorise patients, there were two main options: the triage category and the
medical complaint. The triage category has been selected to categorise patients over the
medical complaint. This selection was for three main reasons; firstly, the number of
triage categories is very small (five triage categories are used in the ED). Secondly,
patients usually have more than one medical complaint, for example, a patient with
chest pain can also suffer from respiratory problems.
Consequently, there are an infinite number of combinations of medical complaints and
hence it cannot be used to categorise patients. Finally, according to the ED consultant,
they recommended categorising patients according to the triage category. From their
perspective, this is more convenient for the representation of patients and also they are
interested in breaking down the analysis for each triage category, rather than medical
complaints. As shown in Figure 5-14, urgent patients (triage category 3) represent the
0
500
1000
1500
2000
2500
3000
3500
0 1 2 3 4 5 6 7 8 9 10 11 12 13 14 15 16 17 18 19 20 21 22 23
Nu
mb
er o
f P
atie
nts
Arrival Time (hrs)
c) Accumulated daily patient arrrival pattern
6560
5884
5728
5764
5802
5129
5110
Monday
Tuesday
Wednesday
Thursday
Friday
Saturday
Sunday
b) Accumulated weekly patient arrival
2700
2800
2900
3000
3100
3200
3300
3400
3500
3600
3700
Num
ber
of
Pat
ients
a) Monthly Patient Arrival Pattern for year 2009

EMERGENCY DEPARTMENT – A CASE STUDY
158
largest group of new attendees to the ED annually (58% on average) who are presented
to the ED with a wide range of medical complaints and aging conditions.
1.1%
16.5%
58.0%
23.9%
0.5%
Immediate Very Urgent Urgent Standard Non-Urgent
Figure 5-14 Triage category distribution.
Due to the small percentage of ―Non-Urgent‖ patients (0.5%), and based on senior
managers suggestions, this patient group has been merged with the ―Standard‖ patient
group. This is not only because their small percentage but also for the similarities in the
medical conditions and care paths for both patient groups. Likewise, the ―Immediate‖
patient group is combined with the ―Very Urgent‖ patient group. The mode of arrival
for each group is then extracted from the dataset (Figure 5-15), which is essential to
determine the distribution of walk-in patients and those who arrive by ambulance. This
will be used in the simulation model to determine the percentage of patient that will go
through the registration and triage process.
Inter-arrival Time for Patients: for each patient group, an estimation of patient arrival
distribution is used to replicate the arrival pattern in the simulation model. The Poisson
distribution is commonly used to represent these arrival patterns in the literature. For
example, Bowers and Mould (2004) investigated the arrival pattern of an orthopaedic
trauma centre which resulted in a stochastic pattern, where the Poisson distribution
produced the best fit. This distribution was varied in their means to adjust to arrival
hour, day and season which is then applied to the simulation model. Another example of

EMERGENCY DEPARTMENT – A CASE STUDY
159
fitting distributions to arrival data can be obtained by (de Bruin et al., 2007), where the
frequencies – according to the grouped arrival minute category – display an exponential
distribution, which is later, also shown to be Poisson.
Figure 5-15 Patient arrival mode distribution.
From the simulation perspective, the inter-arrival data is required, not the arrival time,
which describe the time delay between two consecutive patient arrivals. To do so, the
difference between the arrival times of patients is obtained for each group. For example,
for ―Urgent‖ patients group, Figure 5-16 shows the sequential inter-arrival time of 54
patients arriving on the same day, where the inter-arrival time ranges from 1 minute and
54 minutes.
Figure 5-16 Inter-arrival time pattern – urgent patient.
27%17%
38%
58%
95%
72%81%
61%
40%
5%
Non-Urgent Standard Urgent Very Urgent Immediate
Mode of Arrival for Each Patient Triage Category
Ambulance Patients Walk-in Patients
0
5
10
15
20
25
30
35
40
45
50
55
0 10 20 30 40 50 60
Inte
rarr
iva
l Tim
e (
min
s)
Patients in their order of arrival

EMERGENCY DEPARTMENT – A CASE STUDY
160
These inter-arrival times are then grouped into time slots where the relative frequency
(i.e., percentage) of each time slot is accumulated and represented in a histogram (see
Figure 5-16a). This is followed by the determination of a fitted distribution for each
inter-arrival histogram using Stat::Fit software, which is a curve fitting program that fits
analytical distributions to data. For example, Figure 5-17b shows different possible
distributions for the inter-arrival time for ―Urgent‖ patient group. The best fit
distribution is then determined for each patient group and validated by using
Kolmogorov Smirnov goodness of fit test with a 5 % significance level.
Figure 5-17 Relative frequency diagram – urgent patients.
5.4.3.3 Patient Complaints
An important aspect in developing a simulation model is which level of details to be
considered in order to build a representative model, without considering all irrelevant
details. For example, about 80 per cent of ―standard‖ patients (triage category four) visit
the ED with 7 common medical complaints out of 50 presenting complaints in the
Manchester Triage System (MTS) that is used by the ED staff. This is known as the
Pareto‘s principle or the 80-20 rule and used in many analyses and simulation studies
(Forces, 2001, de Bruin et al., 2007). Accordingly, for each triage category, medical
complaints that represent about 80 per cent of patients are considered in the simulation
Intervals of Patient Inter-arrival
Inter-arrival Time Density
Intervals of Patient Inter-arrival
Rel
ativ
e F
req
uen
cy
Fitted Density for Inter-arrival Time R
elat
ive
Fre
qu
ency
Intervals of Patient Inter-arrival

EMERGENCY DEPARTMENT – A CASE STUDY
161
model. Table 5-6 shows the patients‘ complaints that represent 80% for each triage
category with each cell represents the percentage of patients in the triage category that
have the corresponding medical complaint. The summation of each column in the table
(i.e., triage category) is approximately 80% according to the Pareto principle.
Table 5-6 Complaints-based on the Pareto principle.
Presenting Complaints Triage Category
Immediate Very Urgent Urgent Standard Non-Urgent
Unwell Adult 11% 14% 18% 8% 39%
Limb Problems
7% 11% 47% 13%
Collapsed Adult 46% 6% 4%
Apparently Drunk
26%
Chest Pain
14% 9%
Abdominal Pain in Adults
9% 12%
Overdose and Poisoning 9% 4%
Shortness of Breath
8% 4%
Back Pain
4% 5%
Assault
2% 3% 4%
Diabetes 8%
Wounds
8%
Head Injury
3% 4%
Fits 7%
Headache
3% 2%
Falls
2% 3%
Abscesses and Local Infections
3%
Facial Problems
3%
Mental Illness
3%
GI Bleeding
2%
Urinary Problems
2%
Diarrhoea and Vomiting
2%
Total Percentage 81 % 78 % 79 % 77 % 78 %
ED Resuscitation Area ED Major Assessment Ambulatory care Minor Injuries Provision

EMERGENCY DEPARTMENT – A CASE STUDY
162
The presentation-priority matrix shown in Table 5-6 also displays the most appropriate
disposition of each patient group according to the MTS recommendations. For
example, a patient presenting with a limb problem and allocated to the standard priority
should be seen in a minor injury area, while a patient with chest pain allocated to the
very urgent priority is best seen in the resuscitation room. However, these disposition
recommendations are subject to the availability of the care services in the ED, the
current pressures on them, and the crowding status of the ED.
5.4.3.4 Patient Allocation and Routing Analysis
Based on the analysis of patients allocation within the ED (Table 5-7), the ED staff
failed to fully implement the recommendations of the MTS concerning the disposition
of patients, which is due to the overcrowding of the ED. For example, in Table 5-7,
88% of immediate patients are seen in the resuscitation room and 9% in the majors‘
cubicles, while only 40% percent of very urgent patient are seen in inappropriate
assessment areas. Moreover, due to the overcrowding status of the ED, the majority of
standard and non-urgent patient are assessed and treated in inappropriate areas (e.g.,
chairs) or wait in waiting areas.
Table 5-7 Analysis of patient allocation within the emergency department
ED Areas Triage Category
IMM VURG URG STD NURG
Resuscitation Room 88% 25% 2% 0% 0%
Majors Area 9% 15% 8% 1% 0%
Ambulatory Care Unit 0% 12% 10% 20% 11%
Majors Chairs 0% 7% 6% 1% 1%
Rapid Assessment Triage 3% 12% 7% 2% 2%
Waiting Room 0% 14% 56% 74% 85%
X-Ray Sub-Wait Area 0% 15% 12% 4% 1%
IMM: Immediate VURG: Very Urgent URG: Urgent STD: Standard NURG: Non-Urgent
EMERGENCY DEPARTMENT – A CASE STUDY
163
Through their journey within the ED, patients go through different stages of care,
depending on the acuity and severity level of their cases. Based on the analysis of
patient flow, the main stages of care (i.e., tracking steps) have been identified: patient
arrival, triaged, seen by doctor, seen by advanced nurse practitioner (ANP), referrer to
opinion, referrer to admission, waiting admission, admitted to the hospital, and
discharged. These steps were broken down for each triage category, from the patient
arrival until the patient was discharged from the ED or admitted to the hospital.
Following each stage of care, there are different routing possibilities for patients, which
is subject to their conditions and the requirements for their treatment.
For example, the patient after being referred for opinion can be discharged, referred to
admission or admitted directly to the hospital. Thereupon, for each stage, the different
possibilities of routing are determined for each triage category and its distribution was
estimated based on the patient records. This routing information was then validated with
the ED staff in order to have robust and reliable routing information. Figure 5-18 shows
a detailed flowchart representation of patient routing for all triage categories, where the
number on each connection represents the percentage of patients from one tracking step
to the following one.

EMERGENCY DEPARTMENT – A CASE STUDY
164
45 %
40 %
65 %S
EE
N B
Y
DO
CT
OR
REFERRER
TO
ADMISSION
AWAITING
ADMISSION
PA
TIE
NT
AD
MIT
TE
D T
O H
OS
PIT
AL
PATIENT
DISCHARGE
100 %
100 %
75 %
50 %
5 %
30 %
20 %
15 %
50 %
35 %
15 %
35 %
25 %
75 %
15 %
REFERRER
TO
OPINION
SEEN
BY
ANP
40 %
15 %
10 %
35 %
10 %
5 %
20
10 %
5 %
85 %
IMM
VURG
STD
URG
VURG
URG
IMM
VURG
STD
URG
IMM
VURG
STD
URG
50 %
95 %
5 %
95 %
5 %
95 %
5 %
100 %
STD
URG
10 %
90 %
10 %
90 %
IMM
URG
VURG
85 %
15 %
90 %
10 %
90 %
10 %
TR
IAG
E
20 %
IMM
VURG
STD
URG
5 %
95 %
35 %
65 %
65 %
35 %
85 %
15 %
STD
Patient Arrival
Figure 5-18 Main ED processes and patient routing.

EMERGENCY DEPARTMENT – A CASE STUDY
165
5.5 EMERGENCY DEPARTMENT SIMULATION MODEL
5.5.1 Model Construction
Based on the ED business process model, the designed BSC, and the empirical data
analysis, a comprehensive simulation model for the ED was constructed using Extend
Suite v.7 simulation package. Modules of the simulation model were connected to
resemble the ED business process model, where blocks are connected similar to the
conceptual flow chart, which eases the model construction phase. Accordingly, the top-
level of the simulation model define the overall model structure, where sub-level blocks
containing additional modules with more details. Object-oriented programming was
used to customise pre-defined block for constructing the ED simulation model. A
database was used to save the measured KPIs after each simulation run (i.e., replicate),
followed by exporting the populated BSC in a tabular form for future analysis and
validation.
5.5.2 Simulation Model Verification and Validation
To reduce the model development cycle time and to increase the confidence in the
simulation model results, the verification and validation were carried out all the way
through the development phases of the ED simulation model. After each model
development phase, the model was verified and validated with respect to other
previously completed phases. For the verification process, the model logic is verified to
ensure that the patients follow the correct care path as expected. This was achieved by
visual tracking of patients using animation and by checking intermediate output values
such as queue lengths and waiting times between processes. The conceptual model had
been documented and validated by circulating the document among ED senior managers
and senior nursing staff. This was crucial in ensuring that the logic of the model and ED

EMERGENCY DEPARTMENT – A CASE STUDY
166
activities was correct. All distributions determined from the data and used in the model
were validated by using Kolmogorov Smirnov goodness of fit test with a 5%
significance level (Massey, 1951). Simulation variables – such as patients inter-arrival
time, mode of arrival, presenting medical complaints, processing time, routing and
allocation – were initialised based on the analysis of empirical data and also the analysis
of the ED layout and patient flow given in previous sections. Queues at each stage of
patient care (e.g. triage, seen by doctor, awaiting admission, and discharge) were set as
empty and idle. A warm-up period of two months was found to mitigate any bias
introduced by the initial conditions of the simulation model. The simulation outputs are
shown in the form of performance value tree (section 5.4.2) that represents the main
KPIs of the ED performance.
However, in order to validate the simulation model results, only three KPIs were used,
namely average waiting time for doctor (A.W.T), average length of stay for discharged
patients (D_ALOS), and average length of stay for admitted patients (A_ALOS). The
actual values of these KPIs were calculated from the analysis of the collected patients
records. Each of these three KPIs was further explored for each triage category patients
to provide a robust validation of the simulation output. A total number of p KPIs were
used for validating the simulation output, where p = 12. The simulation model was run
for n=10 independent replications to obtain independent and identically distributed (iid)
of aforementioned p KPIs, with each replicate re-initialised by different pseudo-random
number seed. Table 5-8 shows the simulation output for the p KPIs for all n replications.
For each KPI, a 100(1 - α) % two-sided confidence interval was constructed with α =
0.05. As show in Table 5-9, the t-value for all the KPIs is less than t-critical which is the
upper (100α/2)th
percentile of the t distribution with n - 1 degrees of freedom (i.e.
)2/(1 nt ).

EMERGENCY DEPARTMENT – A CASE STUDY
167
Table 5-8 ED simulation output
Key Performance Indicators (KPIs)
A.W.T (mins) ALOS (hrs)
Discharged Patients (D_ALOS) Admitted Patients (A_ALOS)
TC VURG URG STD AL VURG URG STD AL IMM VURG URG AL
R1 56.00 249.87 290.07 186.84 9.67 10.82 5.12 8.91 18.52 19.38 23.19 21.44
R2 56.13 265.04 310.97 193.88 9.79 11.28 5.36 9.22 23.27 18.18 22.97 20.37
R3 55.45 187.26 254.42 143.63 9.89 10.74 4.98 8.88 17.07 2.26 20.69 21.79
R4 63.11 248.46 290.76 188.83 10.38 11.22 5.32 9.24 15.61 19.46 24.85 23.90
R5 59.25 249.36 242.18 186.49 9.83 10.76 5.13 8.89 15.82 20.11 23.78 22.99
R6 59.55 204.77 247.21 158.61 9.15 9.73 4.77 8.08 14.89 17.10 22.14 20.34
R7 56.39 357.86 312.04 242.00 10.38 13.16 5.48 10.08 14.64 20.30 24.17 21.90
R8 57.33 207.26 240.91 157.41 10.62 11.89 5.26 9.69 12.66 21.53 23.18 18.11
R9 72.25 202.89 239.28 159.88 11.75 10.21 4.87 8.48 14.73 19.12 22.64 20.99
R10 60.51 202.08 216.40 156.72 9.02 8.72 6.56 8.00 17.32 18.71 25.06 21.09
µav 55.99 262.17 265.97 189.02 10.23 10.01 5.45 9.16 15.45 20.22 24.05 21.98
A.W.T: Average Waiting Time TC: Triage Category Ri: Replicate i IMM: Immediate URG: Urgent
ALOS: Average Length of Stay µav: Actual Value Mean AL: All Patients VURG: Very Urgent STD: Standard
Therefore, the null hypothesis that the simulation model output represents the actual
system (i.e. 0 ) is not rejected for all the KPIs with at least 95% confidence level.
Table 5-9 Simultaneous confidence intervals of ED key performance indicators
t-value || t t-critical CI_ Half Length CI of avx µ
µav x s
ns
X
/
0 )2/(1 nt nstn /)2/(1 CI Left CI Right
A.W
.T (
min
s)
VURG 55.99 59.60 05.07 2.25 2.262 03.62 -00.01 07.24
URG 262.17 237.48 50.14 1.56 2.262 35.86 -60.54 11.18
STD 265.97 264.43 33.61 0.15 2.262 24.04 -25.59 22.50
AL 189.02 177.43 28.63 1.28 2.262 20.48 -32.07 08.88
AL
OS
(h
rs)
D_
AL
OS
VURG 10.23 10.05 00.79 0.73 2.262 00.56 -00.75 00.38
URG 10.01 10.85 01.20 2.23 2.262 00.86 -00.01 01.70
STD 05.45 05.28 00.50 1.05 2.262 00.36 -00.52 00.19
AL 09.16 08.95 00.65 1.00 2.262 00.47 -00.68 00.26
A_
AL
OS
IMM 15.45 16.45 02.91 1.09 2.262 02.08 -01.08 03.08
VURG 20.22 17.62 05.53 1.49 2.262 03.95 -06.56 01.35
URG 24.05 23.27 01.30 1.90 2.262 00.93 -01.71 00.15
AL 21.98 21.29 01.58 1.38 2.262 01.13 -01.82 00.44
x : Point estimate mean s: Point estimate standard deviation CI: Confidence Interval

EMERGENCY DEPARTMENT – A CASE STUDY
168
In order to obtain a lower bound on the overall level of confidence of the simulation
output, Bonferroni inequality (Appendix B) was used for constructing individual
confidence levels of the p KPIs at 1 – α/p, with α = 0.05 and p = 12. This resulted in a
new t-value of 4.297 for each KPI, and consequently new confidence intervals (Table
5-10).
Table 5-10 Simultaneous and Bonferroni confidence intervals
t-critical = 2.262 t-critical = 4.297
CI_ Half Length CI of avx µ CI_ Half Length CI of avx µ
nstn /)2/(1 CI Left CI Right nsptn /)2/(1 CI Left CI Right
A.W
.T
(min
s)
VURG 03.62 -00.01 07.24 6.89 -3.27 10.49
URG 35.86 -60.54 11.18 68.13 -92.80 43.44
STD 24.04 -25.59 22.50 45.67 -47.21 44.13
AL 20.48 -32.07 08.88 38.89 -50.49 27.31
AL
OS
(h
rs)
D_
AL
OS
VURG 00.56 -00.75 00.38 1.07 -1.25 0.89
URG 00.86 -00.01 01.70 1.63 -0.786 2.47
STD 00.36 -00.52 00.19 0.68 -0.85 0.51
AL 00.47 -00.68 00.26 0.89 -1.10 0.68
A_
AL
OS
IMM 02.08 -01.08 03.08 3.95 -2.95 4.95
VURG 03.95 -06.56 01.35 7.51 -10.11 4.91
URG 00.93 -01.71 00.15 1.76 -2.54 0.99
AL 01.13 -01.82 00.44 2.14 -2.83 1.45
Therefore, an overall confidence of interval of the simulation output was obtained with
at least 95 % that all the p KPIs lie in the p-dimensional ―box‖ defined by the p
confidence intervals. Due to the large number of KPIs, the resulted Bonferroni intervals
was wider than the simultaneous confidence intervals (Table 5-10), and thus not precise.
To avoid the inflated error rate (i.e. α) that resulted from using separate confidence
intervals, a joint confidence region was constructed, based on Hotelling‘s T2 distribution
which is a generalisation of the univariate t-distribution. The main three KPIs were
chosen for calculating the T2 value, namely, the A.W.T, A_ALOS, and D_ALOS for all
patients. Based on the correlation matrix of these three means, the Hotelling‘s T2 value

EMERGENCY DEPARTMENT – A CASE STUDY
169
was 3.027 (Appendix B gives a description about the computation procedure). The T2
was then multiplied by (n – p)/(np – p) with n = 10 and p = 3. Such transformation of
T2 yields an exact F distribution with p and n – p degrees of freedom. A 95%
confidence region for mean vector all was then constructed such that the transformed T2
(0.785) is less than the upper (100α)th
percentile of the F distribution ( )(, pnpF = 4.346
and α = 0.05). This procedure gave a formula for the simulation model confidence
region as an ellipsoidal region, the exact shape of which depends on the magnitude and
sign of the covariance of the KPIs. For simplicity, Figure 5-19 shows confidence
regions between each pair of the three main ED KPIs along with their individual
confidence intervals.
-3
-2
-1
0
1
2
-3 -2 -1 0 1 2
-3
-2
-1
0
1
2
-3 -2 -1 0 1 2
-3
-2
-1
0
1
2
A.W.T (hrs)
D_
AL
OS
(h
rs)
A_ALOS (hrs)
-3 -2 -1 0 1 2
A.W.T (hrs)
A_
AL
OS
(h
rs)
D_
AL
OS
(h
rs)
Figure 5-19 Confidence regions and intervals of ED KPIs.

EMERGENCY DEPARTMENT – A CASE STUDY
170
5.6 REAL-TIME STRATEGIES FOR THE EMERGENCY DEPARTMENT
5.6.1 The Three Basic Strategies
5.6.1.1 Scenario Design
The simulation scenarios tested were the impact of variation in medical staffing,
increasing clinical assessment space and finally assessing the impact of incorporating a
‗zero-tolerance‘ policy regarding exceeding the national 6-hour boarding PET (i.e.,
length of stay). Distinct study scenario variables (Table 5-11) were added to the
simulation model and run for a 3 month continuous blocks. The three months was
chosen for the stability of ED staffing levels offer this period, according to the ED
managers.
Table 5-11 Simulation variables for base scenario and scenario 1, 2, and 3.
Decision Variables
Access Block
(zero-tolerance PET)
Physical capacity
(number of trolleys) Additional physician shift
Base Line Yes 13 -
Scenario 1 Yes 19 -
Scenario 2 Yes 13 1 SHO [9pm to 7am]
Scenario 3 No 13 -
The principle variables introduced had increased clinical assessment capacity (extra 6
trolley cubicles), increased clinical assessors (1 Senior House Officer shift at night), and
absolute compliance with the national 6 –hour admission target for ED boarders. These
scenarios were suggested by the ED senior managers to evaluate the intended new
extension of the hospital which will include rebuilding of key parts of the hospital
including the ED. Expanding the capacity of the ED may eventually necessitate a
corresponding increase in the staffing levels. Therefore, the hospital managers and the

EMERGENCY DEPARTMENT – A CASE STUDY
171
planners of the new ED express their interest to evaluate the effect of capacity
expansion and increasing the staffing levels against the effect of unblocking critical
performance bottlenecks such as the access block from the ED to the hospital.
5.6.1.2 Results Analysis
The results of the simulation model showed that adoption of the scenario 3, which is
absolute enforcement of the national 6-hour admission target (Table 5-12) had the
greatest impact on the patients ALOS at every stage of the patient journey through the
ED, especially amongst patients who are ultimately discharged directly from ED care
(48% improvement in ALOS).
Table 5-12 Simulation results of scenario 1, 2, and 3.
Key Performance Indicators (KPIs) Base
Line
Capacity
Expansion Increasing Staff
Zero
Tolerance
O/P O/P O/P
Patient
Throughput
A.W.T Doctor
(hrs) 2.96 2.50 15% 2.80 5% 1.80 39%
ALOS Dis. Pts.
(hrs) 10.23 8.40 18% 9.80 4% 5.30 48%
ALOS Adm. Pts.
(hrs) 21.30 18.20 15% 19.80 7% 5.70 73%
Resource
Utilisation
Doctor Utilisation 81% 84% 4% 73% 10% 86% 7%
Nurse Utilisation 82% 87% 7% 83% 1% 74% 10%
CPR Utilisation 91% 86% 6% 91% 0% 87% 5%
Majors Utilisation 94% 82% 13% 92% 2% 85% 10%
ACU Utilisation 93% 75% 19% 94% 2% 83% 11%
Layout
Efficiency
Avg. Doctor
Distance (km/d) 3.24 3.63 12% 2.83 13% 3.91 21%
Avg. Nurse
Distance (km/d) 6.48 7.32 13% 6.55 1% 5.34 18%
ED
Productivity
Patient : Doctor
Ratio 7.34 7.52 2% 7.14 3% 7.9 8%
Patient : Nurse
Ratio 9.84 10.22 4% 10.16 3% 10.8 10%
% Patients Treated 83% 85% 2% 90% 8% 96% 16
Scenarios 1 and 2 resulted in minimal improvements and these changes were not
clinically significant or palatable for patients. Scenario 3 reduced an over-reliance on
overstretched nursing resources, whilst improving the utility of physicians as well as

EMERGENCY DEPARTMENT – A CASE STUDY
172
expected improving the PETs of boarders. The more potentially expensive change
Scenarios 1 and 2 had a negligible impact on ED boarding times. AHP was then used to
evaluate these scenarios considering the ED decision makers preferences (Appendix C).
The AHP comparison matrix for the four main performance criteria of the ED and their
corresponding weights are represented in Table 5-13. For simplicity, LE was given as
an abbreviation for Layout Efficiency, PT for Patient Throughput, PR for ED
Productivity and RU for Resource Utilisation.
Table 5-13 The comparison matrix for the main KPIs in ED performance criteria.
LE PT PR RU Resulting AHP Weight
LE 1 0.125 0.167 0.25 0.046
PT 8 1 3 6 0.581
PR 6 0.33 1 3 0.285
RU 4 0.167 0.33 1 0.116
A comparison matrix for each criterion in Figure 5-9 was then constructed to obtain the
weights of individual KPIs (i.e., the leaves of the performance value tree). Table 5-14
shows the comparison matrix for the three KPIs that represent the Patient Throughput
criterion and their AHP weight.
Table 5-14 The comparison matrix for the KPIs of the Patient Throughput criterion.
ALOS Dis. ALOS Ad. A.W.T Doc. AHP Weight
ALOS Dis. 1 0.33 4 0.304
A.LOS Ad. 3 1 3 0.575
A.W.T Doc. 0.25 0.33 1 0.121
The same process of pair comparison among KPI‘s for each main criterion was repeated
until the last level was reached. Figure 5-20 shows the final weights for all the levels in
the performance value tree.

EMERGENCY DEPARTMENT – A CASE STUDY
173
Figure 5-20 AHP weighted value tree.
Upon the determining the weights, the acceptable range for each KPI was determined by
the ED manager. For example, the utilisation of staff – for nurses or doctor – had a
range between 50% and 85%. This is to avoid the burnout level of the staff (85 %) and
at the same time avoid under-utilisation of resource. Similarly, the LOS KPI specified a
range between 0 and 6 for both admitted and discharged patients; this is to measure the
achievement level of each scenario taking into consideration the HSE target (6-hours
maximum LOS). Following assigning acceptable ranges, a value function was then used
for each individual KPI to describe the importance and desirability of achieving
different performance levels of each KPI based on its measurement level from the
simulation model. For example, the desirability increases from 0.5 to 1.0 when the
percentage of treated patients increases from 70% to 100% as shown in Figure 5-21.
Given the results of the simulation model in Table 5-12 and the AHP preference model,
the final value for each scenario including the base line scenario (current ED) was
aggregated and summarised in Table 5-15.
Avg. Doctor Distance
Patient : Doctor Ratio
Patient : Nurse Ratio
% Patients Treated
Doctor Utilisation
Nurse Utilisation
CPR Utilisation
Majors Utilisation
ACU Utilisation
Avg. LoS for Discharged Patients
Avg. LoS for Admitted Patients
Avg. Doctor W.T.
Avg. Nurse Distance
Layout
Efficiency
ED
Performance
Patient
Throughput
ED
Productivity
Resource
Utilisation
0.046
0.581
0.258
0.116
0.25
0.75
0.297
0.54
[0.2 – 0.28]
0.238
0.136
0.625
0.419
0.263
0.097
0.16
0.062
BaseLine
Zero-Tolerance
Capacity Expansion
Additional Staff

EMERGENCY DEPARTMENT – A CASE STUDY
174
Desirability Level
0.0
0.0
100 %
1.0
75.0
0.5
Treated Patients
Figure 5-21 Percentage of patients treated value function.
Table 5-15 Weighted results for all scenarios against the baseline scenario.
Base Line Zero-Tolerance Capacity Expansion Increasing Staff
Resource Utilisation 0.11 0.19 0.14 0.108
ED Productivity 0.169 0.215 0.18 0.194
Patient Throughput 0.214 0.546 0.38 0.289
Layout Efficiency 0.031 0.029 0.034 0.031
ED Performance 0.524 0.98 0.734 0.622
The implementation of the ―zero-tolerance‖ strategy had the greatest impact on the
throughput of patients (54.6% increases), and on the overall ED performance (Figure
5-22). Accordingly, the zero-tolerance scenario is clearly a recommended strategy for
the ED.
Figure 5-22 The ED performance for all the scenarios against the current ED.
0
0.2
0.4
0.6
0.8
1
1.2
Base Line Zero-Tolerance Capacity Expansion
Increasing Staff
Layout Efficiency
Patient Throughput
ED Productivity
Resource Utilisation

EMERGENCY DEPARTMENT – A CASE STUDY
175
5.6.1.3 Sensitivity Analysis
A sensitivity analysis was performed to explore how the ED performance may change
in each strategy regarding the changes in variables. This is essential because recognising
the aspects to which the decision is sensitive enables the ED manager to concentrate on,
or possibly reconsider the issues, which may cause changes in the decision. Due to the
increase of the ALOS for the current ED above 6-hrs, the performance of the current ED
deteriorated at all levels, while adding more staff and increasing the capacity of the ED
was needed at this stage. However, enforcing the 6-hrs target (i.e., zero-tolerance
scenario) outperformed these more expensive scenarios (i.e., Capacity expansion and
Additional staff) as shown on Figure 5-23.
Figure 5-23 The change in ED performance with average LOS for all scenarios.
The performance of the current ED will deteriorate due to over-utilisation of staff
because they have reached their burnout level (Figure 5-24). Staff burnout (85%
utilisation) can be better mitigated by increasing the staffing level on the ED than
expanding the physical capacity of the ED which does not lower the work load on an
individual staff member.
0.1
0.2
0.3
0.4
0.5
0.6
0.7
0.8
0.9
1
0 2 4 6 8 10 12
ED
Perfo
rm
an
ce
Average LoS (hrs)
Base Lin Additional Staff Capacity Expansion Zero-Tolerance

EMERGENCY DEPARTMENT – A CASE STUDY
176
Figure 5-24 ED performance with the burnout level of staff.
5.6.2 Achieving Targets – Real-Time Strategies for the ED
5.6.2.1 Design of Experiments
The basis of the three basic strategies tested in the previous section is that the same
demand pattern (i.e., patient arrival time) does not change according to the changes in
ED capacity or staffing levels. However, the increase in ED physical capacity will
eventually lead to more patients arriving at the ED. The effects of changes in the three
principle variables that were introduced in the previous section were considered to
evaluate the effect of the expected increase in demand. Table 5-17 shows the decision
variables, namely the physical capacity represented with number of trolleys, the staffing
level, and the access block which represents the absolute compliance with the national 6
–hour admission target for ED boarders. Every variable has two levels of changes as
shown in Table 5-16.
Table 5-16 Simulation variables and their changing levels.
Access Block Physical Capacity Staffing Level
Number of Levels 2 2 2
Level 1 No 13 Same Staff
Level 2 Yes 19 One SHO Shift
0
0.1
0.2
0.3
0.4
0.5
0.6
0.7
0.8
0.9
1
0 10 20 30 40 50 60 70 80 90 100
ED
Per
form
an
ce
Staff Utilisation
Base Lin Additional Staff Capacity Expansion Zero-Tolerance

EMERGENCY DEPARTMENT – A CASE STUDY
177
A full factorial design of experiments (DOE) is used to evaluate all combinations
between the different levels of changes of the aforementioned variables (Table 5-17).
Table 5-17 Scenario design for the three basic strategies and their combinations.
Decision Variables
Access Block Physical Capacity ( trolleys) Staffing Level
Base Line Yes 13 -
Scenario 1 No 13 -
Scenario 2 Yes 19 -
Scenario 3 Yes 13 1 SHO [9pm to 7am]
Scenario 4 No 19 -
Scenario 5 No 13 1 SHO [9pm to 7am]
Scenario 6 Yes 19 1 SHO [9pm to 7am]
Scenario 7 No 19 1 SHO [9pm to 7am]
5.6.2.2 Analysis of Results
With expected increase in patients arrivals, resolving the access blockage from the ED
to the hospital (i.e., scenario 1) resulted in a significant decrease in admitted patients
LOS from 21.3hrs to 7.75hrs with a 49% decrease in the average distance travelled by
nurses (Table 5-18).
Table 5-18 Simulation Results of the first three scenarios.
Key Performance Indicators (KPIs) Base
Scenario
Scenario 1
(no blockage)
Scenario 2
(increase
capacity)
Scenario 3
(more staff)
Patient
Throughput
A.W.T Doctor (hrs) 177.43 204.05 185.85 98.68
ALOS Dis. Pts. (hrs) 8.95 9.78 9.38 7.53
ALOS Adm. Pts. (hrs) 21.30 7.75 19.65 19.00
ED
Productivity
Patient : Doctor Ratio 7.34 7.47 7.52 7.14
Patient : Nurse 9.94 10.22 10.22 10.16
% Patients Treated 83% 83% 85% 94%
Resource
Utilisation
Doctor 81% 80% 79% 63%
Nurse 82% 71% 82% 83%
CPR 81% 67% 80% 79%
Majors 91% 85% 87% 88%
ACU 90% 85% 87% 85%
Layout
Efficiency
Avg. Doctor Distance
(km/d) 3.24 2.86 2.83 3.25
Avg. Nurse Distance
(km/d) 6.48 3.32 6.35 6.72

EMERGENCY DEPARTMENT – A CASE STUDY
178
The significant decrease in patients ALOS is a result of the availability of ED resources
that were utilised by patients awaiting admission. For example, physical beds and
trolleys that were occupied by patients waiting admission were available for new
emergency patients, especially acute patients. Moreover, nursing staff that were
frequently monitoring patients in critical medical conditions in corridors or trolleys
could be reallocated to more pressurised areas in the ED. The expectation that
increasing the number of trolleys (i.e., scenario 2) will decrease the patient A.W.T was
proven wrong due to the shortage in staffing levels to meet the growing increase of
patients arrivals. Such decrease in waiting time was attained on the short term, as
patients waited doctors inside the ED and utilised the new trolleys. However, due to the
crowded ED and the insufficient number of staff, the A.W.T of patients, particularly
less acute patients, A.W.T increased by 15 % and consequently the ALOS of discharged
patients increased by 5% (Figure 5-25). This effect cascaded back through the ED
progressively with more patients waiting on trolleys to be admitted to the hospital. As a
result, there was no space left to meet the timely needs of the next patients who needed
emergency care.
15%
9%
-64%
-13%-18%
-7% -6%
-12%
-49%
5% 5%
-8%-4%
-13%
-44%
-16% -11%
-22%
-5%
4%
Avg. Waiting
Time(min)
Discharged Patients
Admitted Patients
Doctor General Nurse
CPR Majors Trolleys
Ambulatory Care Unit
Doctor Nurse
Avg. LOS (hrs) Resource Utilisation Avg. Distance (km/day)
Scenario 1 Scenario 2 Scenario 3
Figure 5-25 Comparison of base scenario against scenario 1, 2, and 3

EMERGENCY DEPARTMENT – A CASE STUDY
179
On the other hand, adding one SHO doctor from 9pm to 7am inn scenario 3 would
reduce the queue length in the waiting room that keeps building up over the night time
(especially weekends). Subsequently, the average waiting time of patients would
shorten by 44% (98.68mins) and the percentage of treated patients will increase to 94%.
Nevertheless, the average LOS of patients is still beyond the national metric (6hrs
compared to 7.53hrs for discharged patients and 19hrs for admitted patients).
5.6.2.3 The ED Preference Model
A preference model was then developed to analyse the combined effects of decision
variables (scenario 4 – 7) against all KPIs simultaneously. Based on base line scenario,
and the results the first three scenarios (Table 5-18), along with the simulation results of
the simulation output for their combinations (Table 5-19), PRIME (Appendix C) was
used for building the ED preference model.
Table 5-19 Simulation results of scenario 4, 5, 6, and 7.
KPIs Scenario 4 Scenario 5 Scenario 6 Scenario 7
Patient
Throughput
A.W.T Doctor (hrs) 141.32 110.80 105.20 99.25
ALOS Dis. Pts. (hrs) 8.47 7.45 7.54 7.36
ALOS Adm. Pts. (hrs) 6.91 6.55 18.81 6.36
ED
Productivity
Patient : Doctor 7.69 7.28 7.23 7.31
Patient : Nurse 10.19 10.43 10.34 10.44
% Patients Treated 90% 94% 93% 95%
Resource
Utilisation
Doctor 71% 61% 63% 60%
Nurse 67% 69% 83% 68%
CPR 64% 62% 79% 62%
Majors Trolleys 70% 74% 83% 64%
ACU 75% 73% 81% 68%
Layout
Efficiency
Doctor 2.50 2.89 2.87 2.62
Nurse 2.65 2.84 6.45 2.47

EMERGENCY DEPARTMENT – A CASE STUDY
180
The main reason behind the selection of PRIME is due to the uncertainty of the ED
managers about the expected increase of patients arrival, therefore the imprecise
preferences of the ED mangers were used to construct weighted intervals of the ED
KPIs as shown in Figure 5-26.
Avg. Doctor Distance
Patient : Doctor Ratio
Patient : Nurse Ratio
% Patients Treated
Doctor Utilisation
Nurse Utilisation
CPR Utilisation
Majors Utilisation
ACU Utilisation
Avg. LoS for Discharged Patients
Avg. LoS for Admitted Patients
Avg. Doctor W.T.
Avg. Nurse Distance
Layout
Efficiency
ED
Performance
Patient
Throughput
ED
Productivity
Resource
Utilisation
[0.138 – 0.29]
[0.715 – 0.8]
[0.588 – 0.7698]
[0.067 – 0.17]
[0.87 – 0.952]
[0.048 – 0.13]
[0.13 – 0.31]
[0.69 – 0.87]
[0.2 – 0.28]
[0.182 – 0.294]
[0.118 – 0.212]
[0.541 – 0.667]
[0.606 – 0.769]
[0.231 – 0.39]
[0.167 – 0.241]
[0.625 – 0.741]
[0.069 – 0.167]
Scenario 1
Scenario 2
Scenario 3
Scenario 4
Scenario 5
Scenario 6
Scenario 7
Figure 5-26 The weighted value tree of the ED KPI‘s using PRIME.
The marginal performance of the KPIs was then aggregated using the PRIME value tree
and resulted in a performance value interval for each scenario Figure 5-27. An increase
between 38% and 54% in the performance is achieved for scenario 1 while the
expansion of the physical ED capacity (scenario 2) enhanced the ED performance only
by 8% to 19%. By the visual inspection of value intervals in Figure 5-27, scenario 1,
scenario 2, scenario 3, and scenario 6 are dominated by scenario 4, scenario 5, and
scenario 7 respectively.

EMERGENCY DEPARTMENT – A CASE STUDY
181
Figure 5-27 Value intervals for all scenarios.
The dominance structure of all the scenarios is shown in Table 5-20, where the ―+‖
highlights that alternative in the row dominates the alternative in the corresponding
column, and the ―-‖ indicated that the alternative in the row is dominated by the one in
the corresponding column. The effect of inpatient admission blockage (i.e., scenario 1)
on the ED performance is greater than that by adding more ED beds or having an
additional physician. However, when combined other scenarios, the performance
improved significantly. Scenario 7 dominates all other scenarios in terms of ED
performance. As shown in Table 5-19, the ALOS for admitted patients is approximately
6-hrs, and percentage of patients treated patients is 95% which meet the national metric
for both indicators.
Table 5-20 Dominance structure of all scenarios.
Scenario 1 Scenario 2 Scenario 3 Scenario 4 Scenario 5 Scenario 6 Scenario 7
Scenario 1 + - - - Scenario 2 - - - - - - Scenario 3 + - - - Scenario 4 + + + - + - Scenario 5 + + + + + - Scenario 6 + - - - Scenario 7 + + + + + +

EMERGENCY DEPARTMENT – A CASE STUDY
182
5.7 STAFF SCHEDULING
Unblocking the performance bottleneck highlighted in previous section access
necessitates collaboration between different departments within the hospital.
Additionally, recruiting clinical staff is not a feasible alternative for the ED given the
currently limited budget. More effective solution is achieved using the integrated
framework by optimising required staffing level for the ED. Staff scheduling had
contributed to resolve the ED overcrowding problem by dynamically adapting the time-
varying patient arrival to the ED.
5.7.1 Problem Definition
The scheduling problem for the ED is to create weekly schedules for ED doctors of up
to 50 doctors by assigning one of a number of possible shift patterns to each nurse.
These schedules have to satisfy working contracts, whilst meeting the variable demand
in the arrival of patients. Furthermore, the problem has a special day-evening-night
structure as most of the doctors are contracted to work either days/evening or nights in
one week but not both. However due to working contracts, the number of days worked
is not usually the same as the number of nights.
Due to the combinatorial nature of the scheduling problem and the existence of multi-
objective represented in the ED value tree, the optimisation technique map (OTM)
developed in section 4.3.6.2 guided the selection process of the optimisation technique
to the meat-heuristics optimisation techniques to be used for the scheduling problem.
Scheduling problems are challenging for any local search algorithm as finding and
maintaining feasible solutions is extremely difficult in the existence of feasible
schedules constraints. Accordingly, meta-heuristics optimisation techniques have been
used for the scheduling problem. The Genetic algorithm (GA) has been extensively used

EMERGENCY DEPARTMENT – A CASE STUDY
183
for scheduling problems in the healthcare and other sectors. However, due to this
special structure of the staff scheduling problem, an integration between the GA and the
Clonal Selection Algorithm (CSA) has been used (Abohamad et al., 2010, Mohamed
Korayem et al., 2010). CSA is an adaptive search algorithm search that is inspired from
the natural immune system, where CSA seeks to capture a variety of evolutionary and
adaptive mechanisms for improving the searching process. A detailed description of applying
the GA/CSA hybrid for finding optimal staff schedule is described in Appendix D.
5.7.2 Problem Formulation
As suggested by the ED manager, the re-scheduling will be for the Senior House Officer
Doctors (SHOs) that currently exist in the ED, which is constrained with the feasible
doctor work-shifts. For simplicity, doctor will be used instead of SHOs from this point
to the end of this section. For keeping the ED running, only twelve SHOs are considered
in the schedule, as a roster is used then to rotate the work-stretch for the remaining
doctors. A work-stretch is a set of consecutive work-shifts between at least two days
off. The work-shift is a period of time within a working day during which a doctor will
be assigned. Table 5-21 shows feasible range of available work-shifts provided by the
ED managers, where each work-shift has a starting and ending times with a length of 10
hours.
Table 5-21 Feasible work-shifts in the emergency department.
Work-shift Time Shift Name
Day shift
06 - 16:00 D1
08 - 18:00 D2
10 - 20:00 D3
11 - 21:00 D4
Evening shift 14 - 00:00 E1
16 - 02:00 E2
Night Shift 22 - 08:00 N

EMERGENCY DEPARTMENT – A CASE STUDY
184
The day is generally partitioned into generally three working shifts: day, evening and
night shifts. The day shift is in turn has 4 types D1, D2, D3, and D4. Each day shift is of
10hrs length but with a different starting working hour. Two available evening shifts:
E1 and E2, and only one night shift, namely N. There are several rules and assumptions
have to be considered during the optimisation procedure; first, the roster assigned to
each doctor must contain only feasible work-stretches; and at least two days off after
each work-stretch. In order to address these constraints, a binary representation of the
roster had introduced for staff work-shifts (Table 5-22).
Table 5-22 Binary representation of feasible work shifts.
Day shift Evening shift Night
Shift
06 - 16:00 08 - 18:00 10 - 20:00 11 - 21:00 14 - 00:00 16 - 2:00 22 - 8:00
D1 1 0 0 0 0 0 0
D2 0 1 0 0 0 0 0
D3 0 0 1 0 0 0 0
D4 0 0 0 1 0 0 0
E1 0 0 0 0 1 0 0
E2 0 0 0 0 0 1 0
N 0 0 0 0 0 0 1
OFF 0 0 0 0 0 0 0
The work stretch can then be represented in terms of these work shifts as a binary vector
W7x1 as s work stretch for the whole week. For example, a work stretch for a doctor can
be represented as (D1, D1, E2, N, N, OFF, OFF), where each of these consecutive work
shifts is replaced by its binary representation in Table 5-22.
Subsequently, the doctor roster is a Vector R12x7, for the total number of SHOs in the
ED. Following the encoding of the scheduling problem, the hybrid GA/CSA is then
used to find the optimal doctor‘s roster that maximises the ED performance. The main
steps of the GA/CSA are as following:

EMERGENCY DEPARTMENT – A CASE STUDY
185
1. Generate randomly an initial population of N doctor rosters.
2. Calculate the fitness for each individual (i.e., doctor roster) in the current
population.
3. Produce new individuals (off-springs) from current population using crossover.
4. Combine the resulted off-springs from step 3 with current population.
5. Select individuals from the combined population that gives the highest fitness
values, which will be used to generate new individuals.
6. For each individual, generate clones and mutate each clone according to its fitness.
7. Select the best mutated individual from each group of clones and add it to the
population.
8. Delete individuals with lower fitness form the population, then add to the
population of the new individuals.
9. Repeat the steps from 2- 8 until the optimal schedule is obtained or to the maximum
number of iterations.
According to (Haupt and Haupt, 1998), the initial number of population is N = 84, as a
multiple of the binary string length, which represents each individual in the
population.
5.7.3 Results Analysis
The main reason for the optimisation process is to generate the optimal or near-optimal
staff schedule that can improve the ED performance and in turn to minimise the average
patient LOS. Therefore, the ED simulation model is used to calculate the fitness of each
individual. Each individual is passed to the simulation model as a scenario, where the
output is passed in the form of populated balanced scorecard to the AHP tool (section

EMERGENCY DEPARTMENT – A CASE STUDY
186
4.3.7). The aggregated ED performance obtained from the MCDA becomes the fitness
value for each individual in the population. After appropriate operations, based on
selection, crossover, and Cloning operators, off-springs are obtained to replace some of
the individuals (i.e., schedules), which in turn are evaluated and analysed to decide
whether to stop or continue through the evolution process.
The final output of the optimisation procedure is the near-optimal doctor schedule for
the ED. Table 5-23 shows the optimal weekly work stretches for the ED staff, along
with the total number of physician hours for achieved for each day in the week.
Table 5-23 Optimal weekly work stretches for the ED staff.
Work stretch no. M T W T F S S
1 OFF D2 D2 D2 D2 OFF
2 E1 E1 E1 E1 E1 OFF
3 N N N N N N N
4 OFF
6 D4 D4 OFF D4 D4 D4
7 E2 E2 E2 E2 OFF E2
8 E2 E2 E2 X X E2 E2
9 OFF
10 D1 D1 D1 OFF D1 D1
11 D2 D2 D2 D2 D2 OFF
12 N N N N N N X
Daily staffing
level (hrs) 90 100 90 70 70 50 50
Using the ED simulation model has resulted in directing the adaptive search capabilities
of the GA/CSA algorithm towards obtaining optimal staff working stretches that meet
the patient demand which is the highest around working days, whereas the demand is at
its lowest levels around the weekends (Figure 5-28).

EMERGENCY DEPARTMENT – A CASE STUDY
187
Figure 5-28 The ED optimal staffing levels matching the weekly patient arrival rate.
As a result, the average patient waiting time was reduced by 57% due to the new
schedule. Table 5-24 shows that the percentage of treated patients has approached 92%
converging on the HSE 6-hours target.
Table 5-24 Simulation results of the optimal staff schedule and the baseline scenario
KPI’s Base Line Optimal schedule
Avg. A. W.T. (mins) 177.43 75.68 57%
ALOS Discharged Patients (hrs) 8.95 7.13 20%
% Patients Treated 83% 92% 11%
In order to statistically compare the EDs performance of the optimal schedule scenario
with the current ED performance (i.e., base line), a confidence interval was constructed
for the difference between µ1 and µ2 with overall confidence level of 1 – α, where α =
5%. After two tailed t-test computation, the results implied that there are significant
differences in the comparison between the optimal schedule and the current one, which
means that the new staff schedule showed improvements in the quality care in the ED.
The resulting optimal work shifts accounts for the time-varying characteristics of the
daily patient arrival by allocating the optimal staffing level over the ED 24-hours. For
example, Figure 5-29 shows the overlapping between staff working shifts on Tuesday,
141
119135
114 113
8889
90 10090
7070
50
50
Monday Tuesday Wednesday Thursday Friday Saturday Sunday
Patient Arrival Total Physician Hours

EMERGENCY DEPARTMENT – A CASE STUDY
188
which is one of the busiest days with high patient arrival rate at the ED. Due to the short
in staff during the peak times (between 14:00 and 18:00) that resulted in the
overcrowding of the ED, the optimal schedule effectively overcome this problem by a
dynamic overlapping between staff working shifts to meet such fluctuation in the
demand, where the staffing level ranges from 6 to 7 doctors (Figure 5-29).
Doctor 1 D2 D2 D2 D2 D2 D2 D2 D2 D2 D2
Doctor 2 E1 E1 E1 E1 E1 E1 E1 E1 E1 E1
Doctor 3 N N N N N N N N N N
Doctor 4
Doctor 5 D2 D2 D2 D2 D2 D2 D2 D2 D2 D2
Doctor 6 D4 D4 D4 D4 D4 D4 D4 D4 D4 D4
Doctor 7 E2 E2 E2 E2 E2 E2 E2 E2 E2 E2
Doctor 8 E2 E2 E2 E2 E2 E2 E2 E2 E2 E2
Doctor 9
Doctor 10 D1 D1 D1 D1 D1 D1 D1 D1 D1 D1
Doctor 11 D2 D2 D2 D2 D2 D2 D2 D2 D2 D2
Doctor 12 N N N N N N N N N N
Day Hour 0 1 2 3 4 5 6 7 8 9 10 11 12 13 14 15 16 17 18 19 20 21 22 23
Staffing Level 4 4 2 2 2 2 3 3 3 3 4 5 5 5 6 6 7 7 5 5 4 3 5 5 100
OFF
OFF
Figure 5-29 Overlapped staff work shifts comply with daily demand fluctuation.
To avoid staff under-utilisation, staff levels were reduced by overlapping between staff
shifts to adopt to the slowly decayed patient arrivals rates, where the staffing levels
reached its lowest levels during the night time (from 2 to 3 doctors over the night
shifts). Due to the consideration of the seasonality in the arrivals of patients during the
construction phase of simulation model, the resulted staffing roster comply with the
weekly patients arrival pattern as demand is the highest around working days, whereas
the demand is at its lowest levels around weekends (Figure 5-30).

EMERGENCY DEPARTMENT – A CASE STUDY
189
w1
w2
w3
w4
w5
w6
w7
w8
w9
w10
w11
w12
DO
CT
OR
11
23
45
67
89
1011
12
DO
CT
OR
311
121
23
45
67
89
10
DO
CT
OR
410
1112
12
34
56
78
9
DO
CT
OR
59
1011
121
23
45
67
8
DO
CT
OR
68
910
1112
12
34
56
7
DO
CT
OR
77
59
1011
121
23
45
6
DO
CT
OR
86
78
910
1112
12
34
5
DO
CT
OR
95
67
89
1011
121
23
4
DO
CT
OR
10
45
67
89
1011
121
23
DO
CT
OR
11
34
56
78
910
1112
12
DO
CT
OR
12
23
45
67
89
1011
121
DO
CT
OR
1X
D2
D2
D2
D2
E1
E1
E1
E1
E1
NN
NN
NN
ND
2D
2D
2D
2D
2
DO
CT
OR
2N
NN
NN
ND
2D
2D
2D
2E
1E
1E
1E
1E
1N
NN
NN
NN
DO
CT
OR
3D
2D
2D
2D
2D
2N
NN
NN
ND
2D
2D
2D
2E
1E
1E
1E
1E
1N
NN
NN
NN
DO
CT
OR
4D
1D
1D
1D
1D
1D
2D
2D
2D
2D
2N
NN
NN
ND
2D
2D
2D
2E
1E
1E
1E
1E
1
DO
CT
OR
5D
1D
1D
1D
1D
1D
2D
2D
2D
2D
2N
NN
NN
ND
2D
2D
2D
2
DO
CT
OR
6E
2E
2E
2E
2E
2D
1D
1D
1D
1D
1D
2D
2D
2D
2D
2N
NN
NN
NO
FF
DO
CT
OR
7E
2E
2E
2E
2E
2E
2E
2E
2E
2E
2D
1D
1D
1D
1D
1D
2D
2D
2D
2D
2
DO
CT
OR
8D
4D
4D
4D
4D
4E
2E
2E
2E
2E
2E
2E
2E
2E
2E
2D
1D
1D
1D
1D
1
DO
CT
OR
9D
2D
2D
2D
2D
2D
4D
4D
4D
4D
4E
2E
2E
2E
2E
2E
2E
2E
2E
2E
2
DO
CT
OR
10
D2
D2
D2
D2
D2
D4
D4
D4
D4
D4
E2
E2
E2
E2
E2
E2
E2
E2
E2
E2
DO
CT
OR
11
NN
NN
NN
ND
2D
2D
2D
2D
2D
4D
4D
4D
4D
4E
2E
2E
2E
2E
2
DO
CT
OR
12
E1
E1
E1
E1
E1
NN
NN
NN
ND
2D
2D
2D
2D
2D
4D
4D
4D
4D
4
WE
EK
2W
EE
K 3
WE
EK
4W
EE
K 5
WE
EK
1
OF
F
OF
F
OF
F
OF
FO
FF O
FF
OF
F
OF
F
OF
F OF
F
OF
F
OF
F
OF
F OF
F
OF
F
OF
F
OF
F
OF
F
OF
F
OF
F
OF
F
OF
F
OF
F
OF
F
OF
F
OF
F
OF
F OF
F
OF
F
OF
F
OF
F
OF
FO
FF
OF
F
OF
F
OF
F
OF
F
OF
F
OF
F
OF
F
OF
FO
FF
OF
FOF
F OF
F
OF
F
OF
F
OF
F
OF
F OF
F
OF
F
OF
F
OF
F
OF
F
Figure 5-30 The optimal staff roster for the emergency department for three months

EMERGENCY DEPARTMENT – A CASE STUDY
190
5.8 FINDINGS
This case study has shown that the developed integrated framework, when properly
conceived and designed in a collaborative fashion between scientists and clinicians can
provide a valid and verifiable dynamic comparator (i.e., model) to a real-life
overcrowded ED. Furthermore development of the computer model allows the safe and
non-disruptive study of potential process strategies in an accurate alternative virtual
reality without unnecessary disruption to patients, clinicians and healthcare managers.
This low cost framework may also prevent the introduction of potentially expensive
unsuccessful strategies to improve patient care and to improve the internal process of
the healthcare facility. Whilst increasing medical staffing at busy periods or increasing
clinical assessment capacity might seem intuitively beneficial to overall patient LOS,
the integrated framework reveals that enforcement of the national KPI 6-hour boarding
limit for EDs, would have a significantly greater impact on reducing LOS for all ED
patients than increasing medical staff or assessment cubicles. The prolonged waits for
admission from the ED increases the total hospital average length of stay and also
impacts on the morbidity of elderly patients. Access block therefore, has been shown by
the developed framework to have the greatest impact on prolonged waiting time for
patients and successful strategies are available to reduce hospital access block especially
in situations of ED surge and reduced hospital bed capacity.
Considering the variability in patient arrival rates, the optimised staff scheduling
strongly contributed to solving ED crowding problem and reduced the average waiting
time for patients significantly by 57% compared to the current waiting time. That is
achieved by optimising the staffing level and accordingly the number of physicians
hours required to meet such variability in demand.

EMERGENCY DEPARTMENT – A CASE STUDY
191
In conclusion, the use of the integrated framework in hospitals has a significant benefit
in ensuring the quality of implementation of strategies and supporting decision makers.
It also provides a safer, less disruptive and potentially less expensive tool than
instigating de novo untested ineffectual strategies.

CONCLUSION
192
CHAPTER 6: CONCLUSION
6.1 INTRODUCTION
Science and technology are advancing at a rapid pace; however, the Irish healthcare
delivery system struggles to cope in especially in its ability to provide high-quality
service levels consistently. Irish Healthcare systems are in need of fundamental changes
in the way care services are managed. Many patients, doctors, nurses, and healthcare
providers are concerned that the care delivered is not, essentially, the care that should be
received. The frustration levels of both patients and clinicians have probably never been
higher. Policy makers, healthcare providers and managers should provide the quality of
care that meets people need while improving the efficiency of their business processes
based on the best scientific knowledge available. Yet there is strong evidence that this
frequently is not the case. Large numbers of disciplined review bodies have reported the
scale and gravity in healthcare problems world-wide. More systematic and sophisticated
approaches are needed to analyse and manage healthcare processes and to support
decision makers and healthcare mangers in the provision of informed decisions and
strategies for delivering safe and effective care. The main purpose of this research was
to introduce an integrated framework that allows healthcare decision makers to sort out
complex issues and to make the best possible use of available resources. The following
sections summarise the stages of this research in order to address the gaps in the
existing knowledge domain and develop a practical, yet robust framework for healthcare
business process management. Subsequently, a discussion of the main research findings
is provided which is followed by the main contributions to existing knowledge.
Research limitations are then highlighted and finally directions and guidelines of future
work conclude the chapter.

CONCLUSION
193
6.2 RESULTS DISCUSSION
The developed integrated framework brought together scientists and clinicians to
resolve many challenges that face healthcare providers and managers at different levels
of the decision making process. Through the development of a detailed and
comprehensive model that duplicated a real process, managers used a ‗what if’ analysis
approach to examine solutions. In this way they can enhance decision making by
simulating situations that are too complicated to be modelled mathematically.
Furthermore, the integrated framework provides a safe and non-disruptive management
environment to assess potential process strategies without unnecessary disruption to the
healthcare delivery process. Consequently, potentially expensive unsuccessful strategies
can be detected prior to their actual implementation.
The integrated optimisation-based framework has successfully provided real-time
strategies for emergency departments to improve patient care, by improving their
internal processes. By applying and analysing the results, a number of potential
performance bottlenecks have been identified and analysed. One of the main
performance bottlenecks in healthcare systems and especially in hospitals is the access
blockage from the emergency department to the inpatient facilities within hospitals.
The lack of alignment and coordination among hospitals units resulted in unbalanced
utilisation of hospital resources which in turn affects the whole care delivery process.
Moreover, the prolonged waits for admission from EDs increases total hospital average
length of stay and also impacts the morbidity of elderly patients. Increasing medical
staffing at busy periods might seem intuitively beneficial to overall patient LOS.
However, the reduction in LOS for patients awaiting admission is on average of 7%.
This potentially expensive change has limited impact on ED boarding time. Similarly,
the impact of increasing the clinical assessment capacity was negligible (15% decrease)

CONCLUSION
194
compared to the synchronisation of patient flow through the hospital (i.e., enforcing the
maximum boarding time from emergency department to hospital beds). Resolving this
performance blockage can free valuable resources (e.g., doctors, nurses, and trolleys)
consumed by patients waiting for hospital admission, which in turn reduced ALOS by
48 %. Moreover, the average waiting time was reduced by 39 % for patients waiting to
be seen by ED clinician, while reducing the over-reliance on overstretched nursing
resources, and improving the utility of doctors and nurses by 7% and 10% respectively.
The combination of the three strategies produced a higher level of service quality that
leads to a significant increase in patient throughput (95% treated patients) and achieved
the strategic target of 6-hour maximum patient experience time (i.e., LOS), while
accounting for the expected increase in patient arrival rates.
The integrated framework also produces optimal staffing patterns that match the
available human resources (i.e., staff) in order to cope with the high uncertainty level in
demand. This solution can then helps healthcare managers and provide a useful
decision support tool. Optimal staff scheduling capabilities of the proposed framework
allocated budgeted physicians to the proper patients at the proper times. Considering the
variability in patient arrival rates, the optimised staff scheduling reduced the average
waiting time of patients by 57% and also provided a significant increase in productivity
(i.e. on average of 92% of patients were treated instead of 83%). The optimised
schedule maintained continuity of care delivery for patients while ensuring uniformity
of rotation, weekends, days off, and work stretch among available staff.
6.3 RESEARCH OUTCOMES
Due to the high level of complexities and uncertainties embedded in healthcare systems,
this research utilises a multi-disciplinary approach to bridge the gaps between

CONCLUSION
195
researchers and healthcare professionals. The main objective of this research was
achieved by developing and implementing an integrated optimisation-based decision
support framework that is applicable in managing complex healthcare business process.
Although significant advances were made, over the past two decades, for developing
integrated methods and approaches for business process improvement (Clinton et al.,
2002, Searcy, 2004, Bezama et al., 2007, Karaman and Altiok ,2009), there are issues
have to be addressed to improve business process performance through the provision of
support to the associated decision-making processes. The development of a high-level
process model prior to the development of the simulation model could greatly help in
the collection of relevant information on the operation of the system (i.e. data
collection) and, therefore, reduce the effort and time consumed to develop a simulation
model (Nethe and Stahlmann, 1999). Although methods from the IDEF approach have
been used to support simulation of manufacturing systems (Al-Ahmari and Ridgway
1999; Jeong, 2000; Perera and Liyanage, 2000), their potential has not been explored in
the healthcare sector (Brailsford, 2009). The utilisation of IDEF in this research for
process modelling has not only improved the quality of simulation models but also it
enhanced the communication levels among decision makers and the staff (e.g., doctors
and nurses) through modelling the underlined work flow, decision points, and processes
in a hierarchical form. This hierarchical structure kept the model scope within the
boundaries represented by breaking down processes into smaller sub-functions. Such
organisational strategy allowed the system to be easily refined into more details until the
model is as descriptive as necessary for the decision maker.
The integration between simulation modelling and balanced scorecard contributed to the
alleviation of BSC limitations in terms of its measurement capabilities and the lack of

CONCLUSION
196
inferring the causal-effect among performance measures, which was highlighted by a
number of authors such as Chow et al. (1998), Neely and Bourne (2000), Zelman et al.
(2003), and Patel et al. (2008). Further, the combination of multi-criteria decision
analysis tools along with simulation and BSC contributed significantly in the decision
making process by explicitly dealing with priorities and trade-offs between different
performance indicators (Banks and Wheelwright, 1979; 1985; Eccles and Pyburn, 1992;
da Silveira and Slack, 2001). Such integration resulted in building a better
understanding about the problem structure, the implications of potential corrective
actions prior to their actual implementation, and selecting appropriate and informed
decisions.
Consequently, the integration between simulation modelling, BSC, and MCDA within
the proposed framework has brought new insights to inform and support the different
stages of the decision making process. A synergy between supply chain networks and
healthcare systems was established to identify the similarities and the lessons that can
be learned. Although a number of attempts in the literature to draw such analogy have
been introduced (Huijsman and Vissers, 2004, Ahgren and Axelssson, 2007), there is
very little work to integrate optimisation techniques with MCDA, BSC, and simulation
modelling. The optimisation capabilities of the framework has significantly contributed
to the decision making process by offering help to decision makers to find the optimum
values of decision variables, particularly for critical decisions such as staff scheduling,
resource allocation, and capacity planning. Furthermore, the developed optimisation
technique map (OTM) contributed to resolving the selection dilemma that faces system
modellers and optimisers. The OTM mitigated the limitations of existing classifications
of optimisation methods, which consider only small number of criteria such as decision

CONCLUSION
197
variables (Swisher et al., 2000), optimisation capabilities (Tekin and Sabuncuoglu,
2004), or system modelling technique (Beyer and Sendhoff, 2007).
Therefore, the integration of optimisation within the framework provided a more
harmonised automation of the improvement of healthcare processes. This was achieved
by first selecting appropriate optimisation technique for underlying optimisation
problem. For example, obtaining optimal schedules for ED staff is a combinatorial
problem with multiple constraints and objectives to be satisfied. By considering these
factors, the OTM has guided the selection process of the optimisation technique to the
meta-heuristics methods to be used for the scheduling problem.
Many researchers have treated the staff-scheduling problem as an optimisation problem
or a decision problem. For example, Cheng et al. (1997) described the design and
implementation of a constraint-based nurse roster system using a redundant modelling
approach. They modelled the nurse roster problem as a constraint satisfaction problem
(CSP). Feasible solutions to the CSP are the assignments of values to variables
satisfying all constraints. Jaumard et al. (1998) proposed a generalised linear
programming model for nurse scheduling. The configuration of their work is to fulfil
the hospital staffing demand coverage while minimising the salary cost and maximising
nurse preferences. Carter and Lapierre (1999) extracted the characteristics of the generic
emergency room physician scheduling problem and presented the schedule
requirements and constraints to establish a mathematical programming model. Their
objective function depended on the physician‘s preferences. Valouxis and Housos
(2000) presented a hybrid methodology for the work-shift a d rest assignment of nursing
personnel. An approximate integer linear programming (ILP) model is first solved and
its solution is further improved by using local search techniques. The objective function

CONCLUSION
198
serves to minimise the total cost of rosters by giving a solution with the minimum
number of work-shifts and with the maximum desirability. Dowsland (1998) applied
tabu search and strategic oscillation for nurse roster problems. The objective is to ensure
that enough nurses are on duty at all times while taking account of individual
preferences and requests for days off. Yeh and Lin (2007) utilised simulation and GA to
adjust staff schedules without hiring additional staff, with the objective to minimise the
patients queue time.
However, the aforementioned studies considered only few performance measures which
are mostly not related to patient satisfaction and national performance metrics.
Moreover, the complete flow of patients through the healthcare facility is neglected.
Therefore, the developed framework in this research utilised the BSC as a systematic
procedure for the collection of performance measures and KPIs. The selected KPIs,
using SMART method, were then represented as the objective functions for the
optimisation problem. The initial values of the decision variables (e.g., the currently
used staff schedules) were used by the GA to generate new values (i.e., schedules)
towards improving the objective function(s). Thereupon, a comprehensive simulation
model, which covered the complete patient flow, run the scenarios generated by the GA
model and the BSC was populated with the scenario results. AHP was then aggregating
the performance using the populated BSC. The aggregated performance was then used
by the GA to search for better set of values that optimise the required set of objectives.
Such integrated optimisation features has contributed to significant improvement when
applied to a real-world case study of an emergency department, in terms of patient
waiting time, LOS, and staff utilisation. The obtained remarkable results outperform
recently introduced decision support framework for solving staff scheduling issues,

CONCLUSION
199
where only optimisation is integrated with simulation (Yeh and Lin, 2007, Gutjahr and
Rauner, 2007). Therefore, the integrated framework considered healthcare problems in
its full complexity before a solution can be found. It provided a significant aid to the
decision makers and facility planners to foresee the consequences of a wide range of
plans and potential solutions and predict the impact of the changes without disrupting
the existing provision of services, which is another main contribution of this research
that provides a practical decision support system that has been not only tested and
validated, but also implemented.
6.4 LIMITATIONS
This research contributes towards integrated frameworks for business process
management in healthcare systems. Although it has attempted to cover all the different
aspects of the decision making process, we do not claim to have exhausted this area.
The framework is limited to only to discrete-event simulation (DES), other simulation
methods such as system dynamics (SD) and agent-based simulation (ABS) are emerging
as potential tools for analysing the inter-connected relationships between healthcare
components on the macro-level of the system, the inclusion of these simulation methods
into the framework will enhance its utility and wider impact on the healthcare system.
6.5 RECOMMENDATIONS FOR FUTURE RESEARCH WORK
Due to the positive feedback from the executive board of the partner hospital, the
framework is currently used to model other hospital units to achieve the alignment and
coordination between their processes. Due to its ability to study inter-relationship
between healthcare units, the inclusion of system dynamics provides valuable
knowledge about the inter-relationships between the studied hospital units.

CONCLUSION
200
The integration between the hospital information system and the framework is to be
investigated as recommended by the hospital managers. This will be of a great benefit in
providing real-time simulation for the healthcare process and for making appropriate
decisions in real-time manner. Such integration is to be provided by a web-based
intelligent agent to facilitate the decision making process across the whole hospital. The
framework is also used in collaboration with the facility planners and project managers
of the new extension of the hospital to test the efficiency of the proposed layouts and
capacities using the current staffing levels of the hospital.
Consequently, it is envisaged that this research can be expanded to form the basis of a
predictive planning and management tool for building new healthcare facilities. For
example, evidence based data on the effect of relationships, particularly between
physical layout and distribution of services and facilities within building and staffing
requirements can be used to derive optimum layouts and inter-relationships between
departments. Variables such as staff levels and costs can be used to define the size of
clinical areas that can be supported or alternatively constraints on capital expenditure
will determine the size, staffing levels and associated running costs on a department by
department basis. The optimisation technique map (OTM) can be used as an initial
phase to develop a knowledge-based framework (Figure 6-1) for selecting a best-fit
optimisation software package (Abohamad and Arisha 2010).

CONCLUSION
201
1. Describe The Underling Problem
2. Determine Needs and Requirements
3. Produce Candidate Packages Short List
4. Evaluate and Rank Alternatives
5. Select Optimisation Software Package
EXPERTISE RATING
Rating each feature for each package
D ATA COLLECTION
Literature
Review
Vendor
Appraisals
Hands - on
techniques
CRITERIA SELECTION
Optimisation
CapabilitiesVendor
Quality
Features
Requirements
• Compatibility
• Adaptability
• Integrity
• Vendor Support
• Documentation
Organisational Constraints
• Budget
• Time
• Existing Hardware
• Existing Software
• Available Models
Application Area
• Capacity Planning
• Demand Planning
• Inventory
Management
• etc...
Problem Description
• Decision Variables• Constraints
• Objective(s)
Criteria Weighting
• Unstructured
Weighting
• Linguistic
Weighting
Optimisation Packages
Knowledge-BaseOPTIMISATION TECHNIQUE MAP
(OTM)
EVALUATION & RANKING
PACKAGE SCREENING
INT
ER
FA
CE
LA
YE
RA
PP
LIC
AT
ION
LA
YE
R
Candidate Optimisation Software
Final VisionInterviews
Brainstorming
Questionnaire
EVALUATION AND SELECTION
METHODOLOGY
Figure 6-1 A framework for optimisation software selection

REFERENCES
202
REFERENCES
AABY, K., ABBEY, R. L., HERRMANN, J. W., TREADWELL, M., JORDAN, C. S.
& WOOD, K. 2006. Embracing computer modeling to address pandemic influenza in
the 21st century. Journal of Public Health Management and Practice, 12, 365.
ABOHAMAD, W. & ARISHA, A. 2011. Simulation Optimisation Methods in Supply
Chain Applications: A Review. Irish Journal of Management, 30, 95-124.
ABOHAMAD, W. & ARISHA, A. Evaluating and Selecting Optimization Software
Packages: A Framework for Business Application. Proceedings of International
Conference on Operations Research. (ICOR‘10), 2010 Venice, Italy.
ABOHAMAD, W., KORAYEM, M. & MOUSTAFA, K. Biclustering of DNA
Microarray Data Using Artificial Immune System. Proceedings of International
Conference on Intelligent Systems Design and Applications (ISDA‘10), 2010 Cairo,
Egypt.
ADAN, I., BEKKERS, J., DELLAERT, N., VISSERS, J. & YU, X. 2009. Patient mix
optimisation and stochastic resource requirements: A case study in cardiothoracic
surgery planning. Health Care Management Science, 12, 129-141.
AGUILAR-SAVEN, R. S. 2004. Business process modelling: Review and framework.
International Journal of Production Economics, 90, 129-149.
AHGREN B, AXELSSSON R. 2007. Determinants of integrated health care
development: chains of care in Sweden. International Journal of Health Planning and
Management, 22, 145-157.
AHMED, M. A. & ALKHAMIS, T. M. 2002. Simulation-based optimization using
simulated annealing with ranking and selection. Computers and Operations Research,
29, 387-402.
AHMED, M. A. & ALKHAMIS, T. M. 2008. Simulation optimization for an
emergency department healthcare unit in Kuwait. European Journal of Operational
Research, 198, 936-942.
AICKELIN, U. & DOWSLAND, K. A. 2004. An indirect genetic algorithm for a nurse-
scheduling problem. Computers and Operations Research, 31, 761-778.
AIDEMARK, L. G. & FUNCK, E. K. 2009. Measurement and health care management.
Financial Accountability and Management, 25, 253–276.
AKJIRATIKARL, C., YENRADEE, P. & DRAKE, P. R. 2007. PSO-based algorithm
for home care worker scheduling in the UK. Computers & Industrial Engineering, 53,
559-583.

REFERENCES
203
AKTAS, E., ULENGIN, F. & ONSEL SAHIN, S. 2007. A decision support system to
improve the efficiency of resource allocation in healthcare management. Socio-
Economic Planning Sciences, 41, 130-146.
ALAM, F. M., MCNAUGHT, K. R. & RINGROSE, T. J. 2004. A comparison of
experimental designs in the development of a neural network simulation metamodel.
Simulation Modelling Practice and Theory, 12, 559-578.
AL-AHMARI, A. M. & RIDGWAY, K. 1999. An integrated modelling method to
support manufacturing systems analysis and design. Computers in Industry, 38, 225-
238.
ALDIN, L. & DE CESARE, S. 2009. A comparative analysis of business process
modelling techniques. Journal of the Association for Information Systems, 10, 333-363.
ALHADEFF JONES, M. 2008. Three generations of complexity theories: Nuances and
ambiguities. Educational Philosophy and Theory, 40, 66-82.
ALLAOUI, H. & ARTIBA, A. 2004. Integrating simulation and optimization to
schedule a hybrid flow shop with maintenance constraints. Computers & Industrial
Engineering, 47, 431-450.
AL-MUDIMIGH, A. S., ZAIRI, M. & AHMED, A. M. M. 2004. Extending the concept
of supply chain: The effective management of value chains. International Journal of
Production Economics, 87, 309-320.
AMARO, A. C. S. & BARBOSA-PÓVOA, A. 2008. Planning and scheduling of
industrial supply chains with reverse flows: A real pharmaceutical case study.
Computers and Chemical Engineering, 32, 2606-2625.
ANDRADOTTIR, S. 2006. An overview of simulation optimization via random search.
Handbooks in Operations Research and Management Science: Simulation, Elsevier.
ANDREW, W. 2001. Workflow Concepts: The Challenges of Managing Healthcare
Business Processes. In: KIEL, J. M. (ed.) Information Technology for the Practicing
Physician. New York: Springer
ANYANWU, K., SHETH, A., CARDOSO, J., MILLER, J. & KOCHUT, K. 2003.
Healthcare enterprise process development and integration. Journal of Research and
Practice in Information Technology, 35, 83-98.
ARAZ, C., SELIM, H. & OZKARAHAN, I. 2007. A fuzzy multi-objective covering-
based vehicle location model for emergency services. Computers and Operations
Research, 34, 705-726.

REFERENCES
204
ARMISTEAD, C. & MACHIN, S. 1997. Implications of business process management
for operations management. International Journal of Operations & Production
Management, 17, 886-898.
ARMISTEAD, C. & ROWLAND, P. 1996. Managing Business Processes: BPR and
Beyond, Chichester, John Wiley.
AXELROD, R. 2007. Simulation in Social Sciences. In: RENNARD, J.-P. (ed.)
Handbook of research on nature-inspired computing for economics and management.
IGI Global.
BAESLER, F. F., JAHNSEN, H. E. & DACOSTA, M. Emergency departments I: the
use of simulation and design of experiments for estimating maximum capacity in an
emergency room. In: CHICK, S., SANCHEZ, P. J., FERRIN, D. & MORRICE, D. J.,
eds. Proceedings of the 35th conference on Winter simulation, 2003 New Orleans,
Louisiana. 1903-1906.
BAGUST, A. 1999. Dynamics of bed use in accommodating emergency admissions:
stochastic simulation model. British Medical Journal, 319, 155-158.
BALCI, O. Verification validation and accreditation of simulation models. In: S.
ANDRADÓTTIR, K. J. HEALY, D. H. WITHERS & NELSON, B. L., eds.
Proceedings of the 1997 Winter simulation Conference, 1997 Atlanta, Georgia, USA.
135-141.
BANKS, J., CARSON, J. S. & NELSON, B. L. 1996. Discrete event system simulation,
Englewood Cliffs, NJ, Prentice-Hall.
BANKS, R. L. & WHEELWRIGHT, S. C. 1979. Operations versus strategy–trading
tomorrow for today. Harvard business review, 57, 112-20.
BARD, J. & PURNOMO, H. 2007. Cyclic preference scheduling of nurses using a
Lagrangian-based heuristic. Journal of Scheduling, 10, 5-23.
BARD, J. F. & PURNOMO, H. W. 2005a. A column generation-based approach to
solve the preference scheduling problem for nurses with downgrading. Socio-Economic
Planning Sciences, 39, 193-213.
BARD, J. F. & PURNOMO, H. W. 2005b. Preference scheduling for nurses using
column generation. European Journal of Operational Research, 164, 510-534.
BARTLETT, D. & PAYNE, S. 1997. Grounded theory: its basis, rationale and
procedures. In: MCKENZIE, G., POWELL, J. & USHER, R. (eds.) Understanding
Social Research: Perspectives on Methodology and Practice. London: Falmer Press.

REFERENCES
205
BECKER, J. & NIEHAVES, B. 2007. Epistemological perspectives on IS research: a
framework for analysing and systematizing epistemological assumptions. Information
Systems Journal, 17, 197-214.
BECKER, J., NIEHAVES, B. & KLOSE, K. 2005. A framework for epistemological
perspectives on simulation. Journal of Artificial Societies and Social Simulation, 8, 1-
15.
BEECH, A. J. 2001. Market-based demand forecasting promotes informed strategic
financial planning. Healthcare Financial Management, 55, 46-56.
BEGLEY, C. M. 1996. Using triangulation in nursing research. Journal of Advanced
Nursing, 24, 122-128.
BELIEN, J. & DEMEULEMEESTER, E. 2007. Building cyclic master surgery
schedules with leveled resulting bed occupancy. European Journal of Operational
Research, 176, 1185-1204.
BELIEN, J. & DEMEULEMEESTER, E. 2008. A branch-and-price approach for
integrating nurse and surgery scheduling. European Journal of Operational Research,
189, 652-668.
BELL, J. 2005. Doing your Research Project, Buckingham, Open University Press.
BENNEYAN, J. C. 1997. An introduction to using computer simulation in healthcare:
patient wait case study. Journal of the Society for Health Systems, 5, 1-15.
BENTE, J. R. 2005. Performance Measurement, Health Care Policy, and Implications
for Rehabilitation Services. Rehabilitation Psychology, 50, 87-93.
BERGER, S. H. 2004. 10 ways to improve healthcare cost management. Healthcare
Financial Management Journal, 58, 76-80.
BERTELS, S. & FAHLE, T. 2006. A hybrid setup for a hybrid scenario: combining
heuristics for the home health care problem. Computers and Operations Research, 33,
2866-2890.
BEVAN, G. 2006. Setting Targets for Health Care Performance. National Institute
Economic Review, 197, 67-79.
BEVAN, H. & LENDON, R. 2006. Improving performance by improving processes
and systems. In: WALBURG, J., BEVAN, H., WILDERSPIN, J. & LEMMENS, K.
(eds.) Performance management in health care: improving patient outcomes: an
integrated approach. New York: Routledge.
REFERENCES
206
BEYER, H. G. & SENDHOFF, B. 2007. Robust optimization-a comprehensive survey.
Computer methods in applied mechanics and engineering, 196, 3190-3218.
BEZAMA, A., SZARKA, N., WOLFBAUER, J. & LORBER, K. E. 2007. Application
of a balanced scorecard system for supporting decision-making in contaminated sites
remediation. Water, Air, & Soil Pollution, 181, 3-16.
BIANCHI, L., DORIGO, M., GAMBARDELLA, L. M. & GUTJAHR, W. J. 2009. A
survey on metaheuristics for stochastic combinatorial optimization. Natural Computing,
8, 239-287.
BIRO, L. A., MORELAND, M. E. & COWGILL, D. E. 2003. Achieving excellence in
veterans healthcare--a balanced scorecard approach. Journal for Healthcare Quality, 25,
33-39.
BLAKE, J. T., DEXTER, F. & DONALD, J. 2002. Operating room managers‘ use of
integer programming for assigning block time to surgical groups: A case study.
Anesthesia and Analgesia, 94, 143.
BLAKE, J. T. & DONALD, J. 2002. Mount Sinai Hospital Uses Integer Programming
to Allocate Operating Room Time. Interfaces, 32, 63-73.
BOURN, J. 2000. Inpatient admissions and bed management in NHS acute hospitals
and Auditor General. National Audit Office – NHS, UK.
BOWERS, J. & MOULD, G. 2004. Managing uncertainty in orthopaedic trauma
theatres. European Journal of Operational Research, 154, 599-608.
BRAILSFORD, S., HARPER, P., PATEL, B. & PITT, M. 2009. An analysis of the
academic literature on simulation and modelling in health care. Journal of Simulation,
3, 130-140.
BRAILSFORD, S. & VISSERS, J. 2011. OR in healthcare: A European perspective.
EuropeanJjournal of Operational Research, 212, 223-234.
BRANAS, C. C., MACKENZIE, E. J. & REVELLE, C. S. 2000. A trauma resource
allocation model for ambulances and hospitals. Health Services Research, 35, 489-507.
BRANNICK, T. & ROCHE, W. K. 1997. Business research methods: strategies,
techniques and sources, Oak Tree Press, Dublin.
BROWN, S. L. & EISENHARDT, K. M. 1998. Competing on the edge: Strategy as
structured chaos, Boston, MA, Harvard Business School Press.

REFERENCES
207
BRUNI, M., CONFORTI, D., SICILIA, N. & TROTTA, S. 2006. A new organ
transplantation location–allocation policy: a case study of Italy. Health Care
Management Science, 9, 125-142.
BRYMAN, A. 1988. Quantity and Quality in Social Research, London, UK,
Loughborough University.
BRYMAN, A. & BELL, E. 2007. Business research methods, Oxford, USA, Oxford
University Press.
BURGELMAN, R. A. 1994. Fading memories: A process theory of strategic business
exit in dynamic environments. Administrative Science Quarterly, 39, 24-56.
BURKE, E. K., CURTOIS, T., POST, G., QU, R. & VELTMAN, B. 2008. A hybrid
heuristic ordering and variable neighbourhood search for the nurse rostering problem.
European Journal of Operational Research, 188, 330-341.
BURKE, E. K., DE CAUSMAECKER, P., PETROVIC, S. & BERGHE, G. V. 2006.
Metaheuristics for Handling Time Interval Coverage Constraints in Nurse Scheduling.
Applied Artificial Intelligence: An International Journal, 20, 743 - 766.
BURRELL, G. & MORGAN, G. 1979. Sociological paradigms and organisational
analysis, London, UK, Heinemann.
CAGGIANO, K. E., JACKSON, P. L., MUCKSTADT, J. A. & RAPPOLD, J. A. 2009.
Efficient computation of time-based customer service levels in a multi-item, multi-
echelon supply chain: A practical approach for inventory optimization. European
journal of operational research, 199, 744-749.
CARDOEN, B. & DEMEULEMEESTER, E. 2007. Evaluating the capacity of clinical
pathways through discrete-event simulation. Working Paper, Katholieke Universiteit
Leuven, Belgium.
CARNAGHAN, C. 2006. Business process modeling approaches in the context of
process level audit risk assessment: An analysis and comparison. International Journal
of Accounting Information Systems, 7, 170-204.
CARTER, M. & BLAKE, J. 2005. Using Simulation in an Acute-care Hospital: Easier
Said Than Done. In: BRANDEAU, M. L., SAINFORT, F. & PIERSKALLA, W. P.
(eds.) Operations Research and Health Care. Springer US.
CARTER, M. W., & LAPIERRE, S. D. 1999. Scheduling emergency room physicians.
Technical Report, Mechanical and Industrial Engineering, University of Toronto.

REFERENCES
208
CASTANEDA-MENDEZ, K., MANGAN, K. & LAVERY, A. 1998. The role and
application of the balanced scorecard in healthcare quality management. Journal for
Healthcare Quality, 20, 10-13.
CEGLOWSKI, R., CHURILOV, L. & WASSERTHIEL, J. 2006. Combining Data
Mining and Discrete Event Simulation for a value-added view of a hospital emergency
department. Journal of the Operational Research Society, 58, 246-254.
CENSOR, Y. 1977. Pareto optimality in multiobjective problems. Applied Mathematics
and Optimization, 4, 41-59.
CHAN, Y. C. 2006. An analytic hierarchy framework for evaluating balanced
scorecards of healthcare organizations. Canadian Journal of Administrative Sciences,
23, 85-104.
CHANG, L., LIN, S. W. & NORTHCOTT, D. N. 2002. The NHS Performance
Assessment Framework: A ―balanced scorecard‖ approach? Journal of Management in
Medicine, 16, 345-358.
CHAUDHRY, S. S. & LUO, W. 2005. Application of genetic algorithms in production
and operations management: a review. International Journal of Production Research,
43, 4083-4101.
CHELOUAH, R. & SIARRY, P. 2000. Tabu search applied to global optimization.
European Journal of Operational Research, 123, 256-270.
CHEN, C. 2006. CiteSpace II: Detecting and visualizing emerging trends and transient
patterns in scientific literature. Journal of the American Society for Information Science
and Technology, 57, 359-377.
CHENG, B., LEE, J. H. M. & WU, J. 1997. A nurse rostering system using constraint
programming and redundant modeling. IEEE Transactions on Information Technology
in Biomedicine, 1, 44-54.
CHIEN, C.-F., TSENG, F.-P. & CHEN, C.-H. 2008. An evolutionary approach to
rehabilitation patient scheduling: A case study. European Journal of Operational
Research, 189, 1234-1253.
CHOW-CHUA, C. & GOH, M. 2002. Framework for evaluating performance and
quality improvement in hospitals. Managing Service Quality, 12, 54-66.
CHOW, C. W., GANULIN, D., TEKNIKA, O., HADDAD, K. & WILLIAMSON, J.
1998. The balanced scorecard: a potent tool for energizing and focusing healthcare
organization management. Journal of healthcare management, 43, 263-280.

REFERENCES
209
CHRISTOPHER, M. 1999. Logistics and supply chain management: strategies for
reducing cost and improving service. International Journal of Logistics Research and
Applications, 2, 103-104.
CHU, S. C. K. & CHU, L. 2000. A modeling framework for hospital location and
service allocation. International Transactions in Operational Research, 7, 539-568.
CHUNG, S. H., CHAN, F. T. S. & CHAN, H. K. 2009. A modified genetic algorithm
approach for scheduling of perfect maintenance in distributed production scheduling.
Engineering Applications of Artificial Intelligence, 22, 1005-1014.
CILLIERS, P. 1998. Complexity and postmodernism: Understanding complex systems,
London, UK, Routledge.
CLINTON, D., WEBBER, S. A. & HASSELL, J. M. 2002. Implementing the balanced
scorecard using the analytic hierarchy process. Management accounting quarterly, 3, 1-
11.
COATS, T. & MICHALIS, S. 2001. Mathematical modelling of patient flow through an
accident and emergency department. Emergency Medicine Journal, 18, 190-192.
COLANERI, J. 1999. A balanced scorecard approach to quality improvement in a renal
transplant program. Nephrology news & issues, 13, 19-26.
COLMAN, R. 2006. Improving the health care pulse. CMA MANAGEMENT, 80, 38-40.
COLQUHOUN, G. J., BAINES, R. W. & CRO, S. 1993. A state of the art review of
IDEF0. International Journal of Computer Integrated Manufacturing, 6, 252-264.
CONNELLY, L. G. & BAIR, A. E. 2004. Discrete Event Simulation of Emergency
Department Activity: A Platform for System level Operations Research. Academic
Emergency Medicine, 11, 1177-1185.
CORDES, S. 2008. Process management for library multimedia development service.
Library Management, 29, 185-198.
COSTANZA, R., WAINGER, L., FOLKE, C. & MÄLER, K. G. 1993. Modeling
complex ecological economic systems. BioScience, 43, 545-555.
COTE, M., SYAM, S., VOGEL, W. & COWPER, D. 2007. A mixed integer
programming model to locate traumatic brain injury treatment units in the Department
of Veterans Affairs: a case study. Health Care Management Science, 10, 253-267.
COTE, M. J. & TUCKER, S. L. 2001. Four methodologies to improve healthcare
demand forecasting. Healthcare Financial Management, 55, 54-58.

REFERENCES
210
CRESPO MARQUEZ, A. & BLANCHAR, C. 2004. The procurement of strategic parts.
Analysis of a portfolio of contracts with suppliers using a system dynamics simulation
model. International Journal of Production Economics, 88, 29-49.
CRESWELL, J. 1994. Research Design: Quantitative and Qualitative Approaches,
Thousand Oaks, CA, Sage.
CRONIN, J. 2003. The introduction of the Manchester triage scale to an emergency
department in the Republic of Ireland. Accident and Emergency Nursing, 11, 121-125.
CROTTY, M. 1998. The foundations of social research: Meaning and perspective in
the research process, London, UK, Sage Publications.
CURTRIGHT, J. W., STOLP-SMITH, S. C. & EDELL, E. S. 2000. Strategic
performance management: development of a performance measurement system at the
Mayo Clinic. Journal of Healthcare Management, 45, 58-68.
DAI, L. 2000. Perturbation analysis via coupling. IEEE Transactions on Automatic
Control, 45, 614-628.
DALE, A., ARBER, S. & PROCTOR, M. 1988. Doing Secondary Analysis, London,
UK, Unwin Hyman
DAMIJ, N. 2007. Business process modelling using diagrammatic and tabular
techniques. Business Process Management Journal, 13, 70-90.
DANIEL, J. S. R. & RAJENDRAN, C. 2005. A simulation-based genetic algorithm for
inventory optimization in a serial supply chain. International Transactions in
Operational Research, 12, 101-127.
DANIEL, J. S. R. & RAJENDRAN, C. 2006. Heuristic approaches to determine base-
stock levels in a serial supply chain with a single objective and with multiple objectives.
European Journal of Operational Research, 175, 566-592.
DASKIN, M. & DEAN, L. 2005. Location of health care facilities. In: BRANDEAU,
M. L., SAINFORT, F. & PIERSKALLA, W. P. (eds.) Operations Research and Health
Care. Dordrecht: Kluwer's International Series.
DA SILVEIRA, G. & SLACK, N. 2001. Exploring the trade-off concept. International
Journal of Operations & Production Management, 21, 949-964.
DAVENPORT, T. H. 1993. Process innovation: reengineering work through
information technology, Cambridge, MA, Harvard Business School Press.
DAVENPORT, T. H. 1995. Business process reengineering: its past, present, and
possible future, Harvard Business School.

REFERENCES
211
DE BRUIN, A. M., VAN ROSSUM, A. C., VISSER, M. C. & KOOLE, G. M. 2007.
Modeling the emergency cardiac in-patient flow: an application of queuing theory.
Health Care Management Science, 10, 125-137.
DENGIZ, B., BEKTAS, T. & ULTANIR, A. E. 2006. Simulation optimization based
DSS application: A diamond tool production line in industry. Simulation Modelling
Practice and Theory, 14, 296-312.
DENZIN, N. & LINCOLN, Y. 2000. Handbook of Qualitative Research, London, UK,
Sage Publications.
DICKENSON, P. 2010. Operations Management-Principle Healthcare, GRIN Verlag.
DING, H., BENYOUCEF, L. & XIE, X. 2005. A simulation optimization methodology
for supplier selection problem. International Journal of Computer Integrated
Manufacturing, 18, 210-224.
DING, H., BENYOUCEF, L. & XIE, X. 2006. A simulation-based multi-objective
genetic algorithm approach for networked enterprises optimization. Engineering
Applications of Artificial Intelligence, 19, 609-623.
DITTUS, R. S., KLEIN, R. W., DEBROTA, D. J., DAME, M. A. & FITZGERALD, J.
F. 1996. Medical resident work schedules: design and evaluation by simulation
modeling. Management Science, 891-906.
DOERNER, K., FOCKE, A. & GUTJAHR, W. J. 2007. Multicriteria tour planning for
mobile healthcare facilities in a developing country. European Journal of Operational
Research, 179, 1078-1096.
DOH 2007. Health in ireland - key trends 2007. Department of Health & Children,
Government of Ireland.
DONG, H. & KRYLOV, N. V. 2005. Rate of convergence of finite-difference
approximations for degenerate linear parabolic equestions with c1 and c2 coefficients.
Electronic Journal of Differential Equations, 2005, 1-25.
DOWSLAND, K. A. 1998. Nurse scheduling with tabu search and strategic oscillation.
European Journal of Operational Research, 106, 393-407.
DUBOIS, A. & GADDE, L. E. 2002. Systematic combining: an abductive approach to
case research. Journal of Business Research, 55, 553-560.
DUGUAY, C. & CHETOUANE, F. 2007. Modeling and improving emergency
department systems using discrete event simulation. Simulation, 83, 311.
REFERENCES
212
DZIUK, D. 2001. So many systems, so little communication. How a mega-HMO made
the transition to a single source for financial applications. Health Management
Technology, 22, 50-51.
EARL, M. & KHAN, B. 1994. How new is business process redesign? European
Management Journal, 12, 20-20.
EASTERBY-SMITH, M., THORPE, R. & LOWE, A. 2002. Management research: An
introduction, London, UK, Sage Publications.
ECCLES, R. G. & PYBURN, P. J. 1992. Creating a comprehensive system to measure
performance. Management Accounting, 74, 41-44.
EDMONDS, B. 1999. What is Complexity: the philosophy of Complexity per se with
application to some examples in evolution. In: HEYLIGHEN, F. & AERTS, D. (eds.)
The evolution of complexity. Kluwer, Dordrecht.
EDWARDS, W. & BARRON, F. H. 1994. SMARTS and SMARTER: Improved simple
methods for multiattribute utility measurement. Organizational Behavior and Human
Decision Processes, 60, 306-325.
EISENHARDT, K. M. 1989. Building theories from case study research. The Academy
of Management Review, 14, 532-550.
ELBEYLI, S. & KRISHNAN, P. In-Patient flow analysis using ProModelTM
simulation
package. FREC SP00-02, University of Delaware, 2000.
ELDABI, T., IRANI, Z., PAUL, R. J. & LOVE, P. E. D. 2002. Quantitative and
qualitative decision-making methods in simulation modelling. Management Decision,
40, 64-73.
ELDABI, T., JAHANGIRIAN, M., NASEER, A., STERGIOULAS, L., YOUNG, T. &
MUSTAFEE, N. A survey of simulation techniques in commerce and defence.
Proceedings of the Operational Research Society, 4th
Simulation workshop, 2008.
ELDABI, T., PAUL, R. & YOUNG, T. 2006. Simulation modelling in healthcare:
reviewing legacies and investigating futures. Journal of the Operational Research
Society, 58, 262-270.
ENGELL, S., MÄRKERT, A., SAND, G. & SCHULTZ, R. 2004. Aggregated
scheduling of a multiproduct batch plant by two-stage stochastic integer programming.
Optimization and Engineering, 5, 335-359.
ERBAO, C. & MINGYONG, L. 2009. A hybrid differential evolution algorithm to
vehicle routing problem with fuzzy demands. Journal of computational and applied
mathematics, 231, 302-310.

REFERENCES
213
ERIKSSON, H. E. & PENKER, M. 2000. Business modeling with UML, John Wiley
and Sons.
FELICI, G. & GENTILE, C. 2004. A Polyhedral Approach for the Staff Rostering
Problem. Management Science, 50, 381-393.
FENG, C.-W. & WU, H.-T. 2006. Integrating fmGA and CYCLONE to optimize the
schedule of dispatching RMC trucks. Automation in Construction, 15, 186-199.
FINARELLI JR, H. J. & JOHNSON, T. 2004. Effective demand forecasting in 9 steps.
Healthcare Financial Management, 58, 52.
FITZGERALD, L. & ACCOUNTANTS, C. I. O. M. 1991. Performance measurement
in service businesses, Chartered Institute of Management Accountants Publishing,
London.
FLETCHER, H. D. & SMITH, D. B. 2004. Managing for value: Developing a
performance measurement system integrating economic value added and the balanced
scorecard in strategic planning. Journal of Business Strategies, 21, 1-17.
FONSECA, D. J., NAVARESSE, D. O. & MOYNIHAN, G. P. 2003. Simulation
metamodeling through artificial neural networks. Engineering Applications of Artificial
Intelligence, 16, 177-183.
FORCES, M. P. C. 2001. Decision Criteria Consolidation: A Theoretical Foundation of
Pareto Principle to. Journal of Organizational Computing and Electronic Commerce,
11, 1-14.
FORERO, R., HILLMAN, K., MCCARTHY, S., FATOVICH, D., JOSEPH, A. &
RICHARDSON, D. 2010. Access block and ED overcrowding. Emergency Medicine
Australasia: EMA, 22, 119.
FORSTER, A. J., STIELL, I., WELLS, G., LEE, A. J. & VAN WALRAVEN, C. 2003.
The effect of hospital occupancy on emergency department length of stay and patient
disposition. Academic Emergency Medicine, 10, 127-133.
FU, Z., EGLESE, R. & LI, L. Y. O. 2004. A new tabu search heuristic for the open
vehicle routing problem. Journal of the Operational Research Society, 56, 267-274.
GABLE, G. G. 1994. Integrating case study and survey research methods: an example
in information systems. European Journal of Information Systems, 3, 112-126.
GAO, T., GURD, B. & BAULDERSTONE, J. 2006. Lives in the balance: managing
with the scorecard in not for profit healthcare settings. Australia and New Zealand
Third Sector Research, Navigating New Waters.

REFERENCES
214
GARVIN, D. A. 1995. Leveraging processes for strategic advantage. Harvard Business
Review, 73, 77-90.
GATICA, G., PAPAGEORGIOU, L. G. & SHAH, N. 2003. Capacity planning under
uncertainty for the pharmaceutical industry. Chemical Engineering Research and
Design, 81, 665-678.
GAVETTI, G. & LEVINTHAL, D. 2000. Looking forward and looking backward:
Cognitive and experiential search. Administrative Science Quarterly, 45, 113-137.
GAVIRNENI, S. 2001. An efficient heuristic for inventory control when the customer is
using a (s,S) policy. Operations Research Letters, 28, 187-192.
GEYIK, F. & CEDIMOGLU, I. H. 2004. The strategies and parameters of tabu search
for job-shop scheduling. Journal of Intelligent Manufacturing, 15, 439-448.
GIVAN, R. K. 2005. Seeing stars: human resources performance indicators in the
National Health Service. Personnel Review, 34, 634-647.
GLASER, B. & STRAUSS, A. 1967. The Discovery of Grounded Theory, Chicago, IL.,
Aldine Publishing.
GLASSERMAN, P. 1991. Structural conditions for perturbation analysis derivative
estimation: finite-time performance indices. Operations Research, 724-738.
GLICKMAN, M., BALTHROP, J. & FORREST, S. 2005. A machine learning
evaluation of an artificial immune system. Evolutionary Computation, 13, 179-212.
GLOVER, F., LAGUNA, M. & MARTI, R. 2007. Principles of tabu search.
Approximation Algorithms and Metaheuristics, 23, 1–12.
GLYNN, P. W. 1990. Likelihood ratio gradient estimation for stochastic systems.
Communications of the ACM, 33, 75-84.
GODDARD, J. & TAVAKOLI, M. 2008. Efficiency and welfare implications of
managed public sector hospital waiting lists. European Journal of Operational
Research, 184, 778-792.
GONZALEZ, M. E., QUESADA, G., URRUTIA, I. & GAVIDIA, J. V. 2006.
Conceptual design of an e-health strategy for the Spanish health care system.
International Journal of Health Care Quality Assurance, 19, 146-157.
GOODWIN, P. & WRIGHT, G. 2004. Decision analysis for management judgment,
Chichester, UK, John Wiley and Sons.

REFERENCES
215
GOULDING, C. 2002. Grounded theory: A practical guide for management, business
and market researchers, London, UK, Sage Publications.
GRABOWSKI, J. & WODECKI, M. 2004. A very fast tabu search algorithm for the
permutation flow shop problem with makespan criterion. Computers and Operations
Research, 31, 1891-1909.
GRAFF, L. 1999. Overcrowding in the ED: an international symptom of health care
system failure. The American Journal of Emergency Medicine, 17, 208-209.
GRANO, M. L. D., MEDEIROS, D. & EITEL, D. 2009. Accommodating individual
preferences in nurse scheduling via auctions and optimization. Health Care
Management Science, 12, 228-242.
GREEN, L. 2005. Capacity Planning and Management in Hospitals. In: BRANDEAU,
M. L., SAINFORT, F. & PIERSKALLA, W. P. (eds.) Operations Research and Health
Care. Springer US.
GREEN, L. V. & SAVIN, S. 2008. Reducing Delays for Medical Appointments: A
Queueing Approach. OPERATIONS RESEARCH, 56, 1526-1538.
GREENHALGH, T. & PEACOCK, R. 2005. Effectiveness and efficiency of search
methods in systematic reviews of complex evidence: audit of primary sources. BMJ,
331, 1064-1065.
GRIFFITH, J. R. 1994. Reengineering health care: management systems for survivors.
Hospital & Health Services Administration, 39, 451-470.
GRIFFITH, J. R. 2000. Championship management for healthcare organizations.
Journal of Healthcare Management, 45, 17-31.
GRIFFITHS, J. & MARGETTS, D. 2000. Variation in production schedules-
implications for both the company and its suppliers. Journal of Materials Processing
Technology, 103, 155-159.
GUILLEN, G., MELE, F. D., BAGAJEWICZ, M. J., ESPUNA, A. & PUIGJANER, L.
2005. Multiobjective supply chain design under uncertainty. Chemical Engineering
Science, 60, 1535-1553.
GUMBUS, A., BELTHOUSE, D. E. & LYONS, B. 2003. A Three Year Journey to
Organizational and Financial Health Using the Balanced Scorecard: A Case Study at a
Yale New Haven Health System Hospital. Journal of Business Economic Studies, 9, 54-
64.
GUNAL, M. & PIDD, M. Understanding accident and emergency department
performance using simulation. In: PERRONE, L. F., F. P. WIELAND, LIU, J.,

REFERENCES
216
LAWSON, B. G., NICOL, D. M. & FUJIMOTO, R. M., eds. Proceedings of the 2006
Conference on Winter Simulation Conference, 2006. 446-452.
GURD, B. & GAO, T. 2007. Lives in the balance: an analysis of the balanced scorecard
(BSC) in healthcare organizations. International Journal of Productivity and
Performance Management, 57, 6-21.
GUTJAHR, W. J. & RAUNER, M. S. 2007. An ACO algorithm for a dynamic regional
nurse-scheduling problem in Austria. Computers and Operations Research, 34, 642-
666.
GWET, K. L. 2008. Computing inter rater reliability and its variance in the presence of
high agreement. British Journal of Mathematical and Statistical Psychology, 61, 29-48.
HAIJEMA, R., VAN DER WAL, J. & VAN DIJK, N. M. 2007. Blood platelet
production: Optimization by dynamic programming and simulation. Computers and
Operations Research, 34, 760-779.
HAKIM, C. 1982. Secondary analysis in Social Research, London, UK, Allan and
Unwin Dale.
HAKSEVER, C. & MOUSSOURAKIS, J. 2005. A model for optimizing multi-product
inventory systems with multiple constraints. International Journal of Production
Economics, 97, 18-30.
HALL, L. M. G., DORAN, D., LASCHINGER, H. S., MALLETTE, C., PEDERSEN,
C. & O'BRIEN-PALLAS, L. L. 2003. A balanced scorecard approach for nursing report
card development. Outcomes Management, 7, 17-22.
HAMMER, M. 1990. Reengineering work: don't automate, obliterate. Harvard Business
Review, 68, 104-112.
HAMMER, M. & CHAMPY, J. 1993. Reengineering the corporation: A manifesto for
business revolution, New York, Harper Business.
HAMMERSLEY, M. 1992. The relationship between qualitative and quantitative
research: Paradigm loyalty versus methodological eclecticism. In: RICHARDSON, J. T.
(ed.) Handbook of Research Methods for Psychology and the Social Sciences. Leicester
BPS Books.
HANS, E., WULLINK, G., VAN HOUDENHOVEN, M. & KAZEMIER, G. 2008.
Robust surgery loading. European Journal of Operational Research, 185, 1038-1050.
HARMON, P. 2007. Business Process Change: a guide for business managers and
BPM and Six Sigma Professionals, Morgan Kaufmann.

REFERENCES
217
HARPER, P. & SHAHANI, A. 2002. Modelling for the planning and management of
bed capacities in hospitals. Journal of the Operational Research Society, 53, 11-18.
HARPER, P. R. 2002. A framework for operational modelling of hospital resources.
Health Care Management Science, 5, 165-173.
HARPER, P. R., SHAHANI, A. K., GALLAGHER, J. E. & BOWIE, C. 2005. Planning
health services with explicit geographical considerations: a stochastic location-
allocation approach. Omega, 33, 141-152.
HAUPT, R. L. & HAUPT, S. E. 1998. Practical genetic algorithms, New York, Wiley
Interscience.
HAVEY, M. 2005. Essential business process modeling, Sebastopol, CA, O'Reilly
HE, D., CHICK, S. E. & CHEN, C. H. 2007. Opportunity cost and OCBA selection
procedures in ordinal optimization for a fixed number of alternative systems. IEEE
Transactions on Systems, Man, and Cybernetics, Part C: Applications and Reviews, 37,
951-961.
HENDERSON, M. 1995. Operations management in health care. Journal of Health
Care Finance, 21, 44-47.
HENDERSON, S. & MASON, A. 2005. Ambulance Service Planning: Simulation and
Data Visualisation. In: BRANDEAU, M. L., SAINFORT, F. & PIERSKALLA, W. P.
(eds.) Operations Research and Health Care. Springer US.
HO, Y. C. 1985. A survey of the perturbation analysis of discrete event dynamic
systems. Annals of Operations Research, 3, 393-402.
HO, Y. C., CASSANDRAS, C. G., CHEN, C. H. & DAI, L. Y. 2000. Ordinal
optimization and simulation. Journal of Operations Research Society, 51, 490-500.
HODGSON, M. J., LAPORTE, G. & SEMET, F. 1998. A Covering Tour Model for
Planning Mobile Health Care Facilities in SuhumDistrict, Ghama. Journal of Regional
Science, 38, 621-638.
HOOT, N. R., LEBLANC, L. J., JONES, I., LEVIN, S. R., ZHOU, C., GADD, C. S. &
ARONSKY, D. 2008. Forecasting emergency department crowding: a discrete event
simulation. Annals of Emergency Medicine, 52, 116-125.
HUANG, H. C. 2009. Designing a knowledge-based system for strategic planning: A
balanced scorecard perspective. Expert Systems with Applications, 36, 209-218.
HUIJSMAN R. and J.M.H. VISSERS. Supply chain management in health care: state of
the art and potential. In T. CAMPS, P. DIEDEREN, G.J. HOFSTEDE and B. VOS

REFERENCES
218
(eds) The Emerging World of Chains and Networks. Bridging Theory and Practice.
Reed Business Information, Gravenhage, 2004.
HUSSAIN, M. F., BARTON, R. R. & JOSHI, S. B. 2002. Meta-Modeling: Radial basis
functions, versus polynomials. European Journal of Operational Research, 138, 142-
154.
HUSSEY, J. & HUSSEY, R. 1997. Business Research: A practical guide for
undergraduate and postgraduate students, Macmillan, Basingstoke.
IANNONI, A. P. & MORABITO, R. 2006. A discrete simulation analysis of a logistics
supply system. Transportation Research, 42, 191-210.
INGOLFSSON, A., BUDGE, S. & ERKUT, E. 2008. Optimal ambulance location with
random delays and travel times. Health Care Management Science, 11, 262-274.
INGOLFSSON, A., ERKUT, E. & BUDGE, S. 2003. Simulation of single start station
for Edmonton EMS. Journal of the Operational Research Society, 54, 736-746.
IRANI, Z., EZINGEARD, J. N., GRIEVE, R. & RACE, P. 1999. A case study strategy
as part of an information systems research methodology: a critique. International
Journal of Computer Applications in Technology, 12, 190-198.
IRIZARRY, M., WILSON, J. R. & TREVINO, J. 2001. A Flexible Simulation Tool for
Manufacturing-cell Design. IIE transactions, 33, 837-846.
JACOBSON, I., ERICSSON, M. & JACOBSON, A. 1994. The object advantage:
business process reengineering with object technology, ACM Press/Addison-Wesley
Publishing Co. New York, NY, USA.
JAHANGIRIAN, M., ELDABI, T., GARG, L., JUN, G. T., NASEER, A., PATEL, B.,
STERGIOULAS, L. & YOUNG, T. 2011. A rapid review method for extremely large
corpora of literature: Applications to the domains of modelling, simulation, and
management. International Journal of Information Management, 31, 234-243.
JAHANGIRIAN, M., NASEER, A., STERGIOULAS, L., YOUNG, T., ELDABI, T.,
BRAILSFORD, S., PATEL, B. & HARPER, P. 2010. Simulation in health-care: lessons
from other sectors. Operational Research, 1-11.
JAUMARD, B., SEMET, F. & VOVOR, T. 1998. A generalized linear programming
model for nurse scheduling. European Journal of Operational Research, 107, 1-18.
JEONG, B., JUNG, H. S. & PARK, N. K. 2002. A computerized causal forecasting
system using genetic algorithms in supply chain management. The Journal of Systems &
Software, 60, 223-237.

REFERENCES
219
JEONG, K. Y. 2000. Conceptual frame for development of optimized simulation-based
scheduling systems. Expert Systems with Applications, 18, 299-306.
JIANG, L. & GIACHETTI, R. 2008. A queueing network model to analyze the impact
of parallelization of care on patient cycle time. Health Care Management Science, 11,
248-261.
JICK, T. D. 1979. Mixing qualitative and quantitative methods: Triangulation in action.
Administrative Science Quarterly, 24, 602-611.
JO, J. B., KIM, B. K. & KIM, J. R. 2008. Evolutionary Algorithm-based Methods to
Choose Fixed Charge Transportation Plan. International Journal of Information, 3, 95-
106.
JONES, M. L. H. & FILIP, S. J. 2000. Implementation and outcomes of a balanced
scorecard model in women's services in an academic health care institution. Quality
Management in Healthcare, 8, 40-51.
JONES, S. S., THOMAS, A., EVANS, R. S., WELCH, S. J., HAUG, P. J. & SNOW, G.
L. 2008. Forecasting Daily Patient Volumes in the Emergency Department. Academic
Emergency Medicine, 15, 159-170.
JUARRERO, A. 2000. Dynamics in action: intentional behavior as a complex system.
Emergence, 2, 24-57.
JUN, J., JACOBSON, S. & SWISHER, J. 1999. Application of discrete-event
simulation in health care clinics: a survey. Journal of the Operational Research Society,
50, 109-123.
JUNG, J. Y., BLAU, G., PEKNY, J. F., REKLAITIS, G. V. & EVERSDYK, D. 2004.
A simulation based optimization approach to supply chain management under demand
uncertainty. Computers & Chemical Engineering, 28, 2087-2106.
KAANDORP, G. & KOOLE, G. 2007. Optimal outpatient appointment scheduling.
Health Care Management Science, 10, 217-229.
KAPLAN, R. S. & NORTON, D. P. 1992. The balanced scorecard–measures that drive
performance. Harvard Business Review, 70, 71-79.
KAPLAN, R. S. & NORTON, D. P. 1996. Using the balanced scorecard as a strategic
management system. Harvard Business Review, 74, 75-85.
KAPLAN, R. S. & NORTON, D. P. 2001. The strategy-focused organization: How
balanced scorecard companies thrive in the new business environment, Boston, MA,
Harvard Business Press.

REFERENCES
220
KAPLAN, R. S. & NORTON, D. P. 2004. Strategy maps: Converting intangible assets
into tangible outcomes, Boston, MA, Harvard Business Press.
KARAMAN, A. & ALTIOK, T. 2009. Approximate analysis and optimization of batch
ordering policies in capacitated supply chains. European Journal of Operational
Research, 193, 222-237.
KARRA, E. D. & PAPADOPOULOS, D. L. 2005. Measuring performance of
Theagenion Hospital of Thessaloniki, Greece through a Balanced Scorecard.
Operational Research, 5, 289-304.
KATSALIAKI, K. & BRAILSFORD, S. C. 2007. Using simulation to improve the
blood supply chain. Journal of the Operational Research Society, 58, 219-227.
KAZEMI, A. & ZARANDI, M. H. F. 2008. An Agent-Based Framework for Building
Decision Support System in Supply Chain Management. Journal of Applied Sciences, 8,
1125-1137.
KENNERLEY, M. & NEELY, A. 2002. A framework of the factors affecting the
evolution of performance measurement systems. International Journal of Operations &
Production Management, 22, 1222-1245.
KERVIN, J. B. 1999. Methods for Business Research, Reading, MA Addison-Wesley.
KEYS, A. C. & REES, L. P. 2004. A sequential-design metamodeling strategy for
simulation optimization. Computers and Operations Research, 31, 1911-1932.
KHARE, R. K., POWELL, E. S., REINHARDT, G. & LUCENTI, M. 2009. Adding
More Beds to the Emergency Department or Reducing Admitted Patient Boarding
Times: Which Has a More Significant Influence on Emergency Department
Congestion? Annals of Emergency Medicine, 53, 575-585. e2.
KIDDER, L. H. & JUDD, C. M. 1986. Research Methods in Social Relations New
York, Holt, Rinehart and Winston.
KIM, S. C., HOROWITZ, I., YOUNG, K. K. & BUCKLEY, T. A. 1999. Analysis of
capacity management of the intensive care unit in a hospital. European Journal of
Operational Research, 115, 36-46.
KIM, S. H. & JANG, K. J. 2002. Designing performance analysis and IDEF0 for
enterprise modelling in BPR. International Journal of Production Economics, 76, 121-
133.
KIM, S. H. & NELSON, B. L. 2001. A fully sequential procedure for indifference-zone
selection in simulation. ACM Transactions on Modeling and Computer Simulation
(TOMACS), 11, 251-273.

REFERENCES
221
KIRKPATRIC, S., GELATT, C. D. & VECCHI, M. P. 1983. Optimization by
simulated annealing. Science, 220, 671-680.
KLEIJNEN, J. P. C. 1998. Experimental design for sensitivity analysis, optimization,
and validation of simulation models. Handbook of Simulation: Principles, Methodology,
Advances, Applications, and Practice, JohnWiley & Sons, NewYork.
KLEIJNEN, J. P. C. 2005. An overview of the design and analysis of simulation
experiments for sensitivity analysis. European Journal of Operational Research, 164,
287-300.
KLEIJNEN, J. P. C. 2008. Response surface methodology for constrained simulation
optimization: An overview. Simulation Modelling Practice and Theory, 16, 50-64.
KLEIJNEN, J. P. C., DEN HERTOG, D. & ANGÜN, E. 2004. Response surface
methodology's steepest ascent and step size revisited. European Journal of Operational
Research, 159, 121-131.
KNUTH, D. E. 1963. Computer-drawn flowcharts. Communications of the ACM, 6,
555-563.
KO, H. J., KO, C. S. & KIM, T. 2006. A hybrid optimization/simulation approach for a
distribution network design of 3PLS. Computers & Industrial Engineering, 50, 440-
449.
KOCHEL, P. & NIELANDER, U. 2005. Simulation-based optimisation of multi-
echelon inventory systems. International Journal of Production Economics, 93, 505-
513.
KOCK, N. & MCQUEEN, R. J. 1996. Product flow, breadth and complexity of
business processes: An empirical study of fifteen business processes in three
organizations. Business Process Re-engineering & Management, 2, 8-22.
KOKANGUL, A. 2008. A combination of deterministic and stochastic approaches to
optimize bed capacity in a hospital unit. Computer Methods and Programs in
Biomedicine, 90, 56-65.
KOO, L. Y., ADHITYA, A., SRINIVASAN, R. & KARIMI, I. A. 2008. Decision
support for integrated refinery supply chains: Part 2. Design and operation. Computers
& Chemical Engineering, 32, 2787-2800.
KOPACH, R., BALCIOGLU, B. & CARTER, M. 2008. Tutorial on constructing a red
blood cell inventory management system with two demand rates. European Journal of
Operational Research, 185, 1051-1059.

REFERENCES
222
KUENG, P. 2000. Process performance measurement system: a tool to support process-
based organizations. Total Quality Management, 11, 67-85.
KUMAR, A., OZDAMAR, L. & NG, C. P. 2005. Procurement performance
measurement system in the health care industry. International Journal of Health Care
Quality Assurance, 18, 152-166.
KUMAR, N., STERN, L. W. & ANDERSON, J. C. 1993. Conducting
interorganizational research using key informants. The Academy of Management
Journal, 36, 1633-1651.
KUNZ, H., SCHAAF, T., BRAUN, J. & TOLXDORFF, T. 2005. Framework for an IT-
supported balanced scorecard in health care. Proceedings of the Third International
Conference on Information Technology and Applications, 2, 165-168.
KVALE, S. 1996. Interviews: An introduction to qualitative research interviewing,
London, UK, Sage Publications.
L‘ECUYER, P. & PERRON, M. 1994. On the convergence rates of PA algorithms.
Operations Research, 42, 643–656.
LACOMME, P., PRINS, C. & SEVAUX, M. 2006. A genetic algorithm for a bi-
objective capacitated arc routing problem. Computers and Operations Research, 33,
3473-3493.
LAKIN, R., CAPON, N. & BOTTEN, N. 1996. BPR enabling software for the financial
services industry. Management Services, 40, 18-20.
LAMIRI, M., XIE, X., DOLGUI, A. & GRIMAUD, F. 2008. A stochastic model for
operating room planning with elective and emergency demand for surgery. European
Journal of Operational Research, 185, 1026-1037.
LANE, D., MONEFELDT, C. & ROSENHEAD, J. 2000. Looking in the wrong place
for healthcare improvements: A system dynamics study of an accident and emergency
department. Journal of the Operational Research Society, 51, 518-531.
LAPIERRE, S. D. & RUIZ, A. B. 2007. Scheduling logistic activities to improve
hospital supply systems. Computers and Operations Research, 34, 624-641.
LAW, A. M. & KELTON, W. D. 1991. Simulation modeling and analysis, New York,
McGraw-Hill
LEBCIR, M. R. 2006. Health Care Management: The Contribution of Systems
Thinking. University of Hertfordshire, Business School Working Papers UHBS 2006-7.

REFERENCES
223
LEE, J. & WYNER, G. M. 2003. Defining specialization for dataflow diagrams.
Information Systems, 28, 651-671.
LEE, L. H., CHEW, E. P., TENG, S. & CHEN, Y. 2008. Multi-objective simulation-
based evolutionary algorithm for an aircraft spare parts allocation problem. European
Journal of Operational Research, 189, 476-491.
LEONARD-BARTON, D. 1990. A dual methodology for case studies: synergistic use
of a longitudinal single site with replicated multiple sites. Organization Science, 1, 248-
266.
LEUNG, L. C., LAM, K. C. & CAO, D. 2006. Implementing the balanced scorecard
using the analytic hierarchy process the analytic network process. Journal of the
Operational Research Society, 57, 682-691.
LEVIS, A. A. & PAPAGEORGIOU, L. G. 2004. A hierarchical solution approach for
multi-site capacity planning under uncertainty in the pharmaceutical industry.
Computers and Chemical Engineering, 28, 707-725.
LIAO, H. C. 2009. Using GA to dispatch the obtaining quantity for minimizing the total
cost based on consideration of patient safety in HSCM. Expert Systems with
Applications, 26, 11358-11362.
LINDSAY, A., DOWNS, D. & LUNN, K. 2003. Business processes--attempts to find a
definition. Information and Software Technology, 45, 1015-1019.
LITTLE, J. & COUGHLAN, B. 2008. Optimal inventory policy within hospital space
constraints. Health Care Management Science, 11, 177-183.
LITVAK, N., VAN RIJSBERGEN, M., BOUCHERIE, R. J. & VAN
HOUDENHOVEN, M. 2008. Managing the overflow of intensive care patients.
European journal of operational research, 185, 998-1010.
LOVEJOY, W. S. & LI, Y. 2002. Hospital Operating Room Capacity Expansion.
Management Science, 48, 1369-1387.
LU, Q. & DESSOUKY, M. 2007. An Optimization Algorithm for The Pickup and
Delivery Problem With Time Windows. Journal of the Korean Institute of Industrial
Engineers, 33, 33-43.
LYNCH, R. L. & CROSS, K. F. 1995. Measure up! How to measure corporate
performance. Auflage, London.
MACDONALD, J. 1995. Together TQM and BPR are winners. The TQM Magazine, 7,
21-25.

REFERENCES
224
MAHNAM, M., YADOLLAHPOUR, M. R., FAMIL-DARDASHTI, V. & HEJAZI, S.
R. 2009. Supply chain modeling in uncertain environment with bi-objective approach.
Computers & Industrial Engineering, 56, 1535-1544.
MAPES, J., NEW, C. & SZWEJCZEWSKI, M. 1997. Performance trade-offs in
manufacturing plants. International Journal of Operations & Production Management,
17, 1020-1033.
MANS, R., AALST, W., RUSSELL, N., MOLEMAN, A., BAKKER, P. & JASPERS,
M. 2010. YAWL4Healthcare. In: TER HOFSTEDE, A. H. M., VAN DER AALST, W.
M. P., ADAMS, M. & RUSSELL, N. (eds.) Modern Business Process Automation. New
York: Springer.
MANSON, S. M. 2001. Simplifying complexity: a review of complexity theory.
Geoforum, 32, 405-414.
MANSOURI, S. A. 2005. Coordination of set-ups between two stages of a supply chain
using multi-objective genetic algorithms. International Journal of Production Research,
43, 3163-3180.
MARCA, D. A. & MCGOWAN, C. L. 1987. SADT: Structured Analysis and Design
Technique, New York, McGraw-Hill.
MARCON, E. & DEXTER, F. 2006. Impact of surgical sequencing on post anesthesia
care unit staffing. Health Care Management Science, 9, 87-98.
MARCON, E. & DEXTER, F. 2007. An observational study of surgeons' sequencing of
cases and its impact on postanesthesia care unit and holding area staffing requirements
at hospitals. Anesthesia & Analgesia, 105, 119-126.
MARIANOV, V. & TABORGA, P. 2001. Optimal location of public health centres
which provide free and paid services. Journal of the Operational Research Society, 52,
391-400.
MARSEGUERRA, M. & ZIO, E. 2000. Optimizing maintenance and repair policies via
a combination of genetic algorithms and Monte Carlo simulation. Reliability
Engineering & System Safety, 68, 69-83.
MARSHALL, C. & ROSSMAN, G. 1999. Designing Qualitative Research . London,
UK, Sage Publication.
MASSEY, F. J. 1951. The Kolmogorov-Smirnov test for goodness of fit. Journal of the
American Statistical Association, 46, 68-78.
MATHIAS, J. M. 2001. Balanced scorecard helps ORs to weigh clinical, fiscal issues.
OR manager, 17, 18-22.

REFERENCES
225
MAYHEW, L. & SMITH, D. 2008. Using queuing theory to analyse the Government‘s
4-h completion time target in Accident and Emergency departments. Health Care
Management Science, 11, 11-21.
MCKIBBON, A. 2006. Systematic reviews and librarians. Library Trends, 55, 202-215.
MECKESHEIMER, M., BOOKER, A. J., BARTON, R. R. & SIMPSON, T. W. 2002.
Computationally inexpensive metamodel assessment strategies. AIAA journal, 40, 2053-
2060.
MELAO, N. & PIDD, M. 2000. A conceptual framework for understanding business
processes and business process modelling. Information Systems Journal, 10, 105-129.
MELIONES, J. 2000. Saving money, saving lives. Harvard Business Review, 78, 57-65.
MELIONES, J. N., BALLARD, R., LIEKWEG, R. & BURTON, W. 2001. No mission,
no margin: it's that simple. Journal of Health Care Finance, 27, 21.
MENTZER, J. T., DEWITT, W., KEEBLER, J. S., MIN, S., NIX, N. W., SMITH, C. D.
& ZACHARIA, Z. G. 2001. Defining supply chain management. Journal of Business
Logistics, 22, 1-26.
MILES, M. B. & HUBERMAN, A. M. 1994. Qualitative Data Analysis, Thousand
Oaks, CA, Sage Publications. .
MODARRES, M. 2006. Predicting and improving complex business processes: values
and limitations of modeling and simulation technologies. Proceedings of 2006 Winter
Simulation Conference, December 2006 Monterey, CA, USA. 598-603.
MOHAMED KORAYEM, ABOHAMAD, W. & MOUSTAFA, K. 2010. A Hybrid
Genetic Algorithm and Artificial Immune System for Informative Gene Selection.
International Journal of Computer Science and Network Security (IJCSNS), 10, 76-83.
MOLEMA, J., GROOTHUIS, S., BAARS, I., KLEINSCHIPHORST, M., LEERS, E.,
HASMAN, A. & VAN MERODE, G. 2007. Healthcare system design and parttime
working doctors. Health Care Management Science, 10, 365-371.
MORGAN, G. & SMIRCICH, L. 1980. The case for qualitative research. The Academy
of Management Review, 5, 491-500.
MOULLIN, M. 2004. Evaluating a health service taskforce. International Journal of
Health Hare Quality Assurance, 17, 248-257.
MOZ, M. & PATO, M. V., 2005. A bi-objective network flow approach for nurse
rerostering. In: GOUVEIA, L. & MOURO, C., eds. Proceedings of the INOC 2005—
International Network Optimization Conference, 2005 Lisbon. 817–824.

REFERENCES
226
MUECKE, M. 1994. On the evaluation of ethnographies. In: MORSE, J. M. (ed.)
Critical Issues in Qualitative Research Methods. London: Sage Publications.
MULLINAX, C. & LAWLEY, M. 2002. Assigning Patients to Nurses in Neonatal
Intensive Care. Journal of the Operational Research Society, 53, 25-35.
MUMFORD, E. & HENDRICKS, R. 1996. Business process reengineering RIP. People
management, 2, 22-29.
MURAWSKI, L. & CHURCH, R. L. 2009. Improving accessibility to rural health
services: The maximal covering network improvement problem. Socio-Economic
Planning Sciences, 43, 102-110.
MURDICK, R. G., RENDER, B. & RUSSELL, R. S. 1990. Service operations
management, Allyn & Bacon.
MUSTAFEE, N., TAYLOR, S. J. E., KATSALIAKI, K. & BRAILSFORD, S. 2009.
Facilitating the analysis of a UK national blood service supply chain using distributed
simulation. Simulation, 85, 113-128.
MYERS, C. & GREEN, T. 2004. Forecasting demand and capacity requirements.
Healthcare Financial Management, 58, 34-37.
MYERS, M. 1997. Qualitative research in information systems. Management
Information Systems Quarterly, 21, 6.
NANDHAKUMAR, J. 1997. Issues in participant observation: a study of the practice of
information. In: MCKENZIE, G., POWELL, J. & USHER, R. (eds.) Understanding
Social Research: Perspectives on Methodology and Practice. London: Falmer Press.
systems development‖. In: MCKENZIE, G., POWELL, J. & USHER, R. (eds.)
Understanding Social Research: Perspectives on Methodology and Practice. London:
Falmer Press.
NASEER, A., ELDABI, T. & JAHANGIRIAN, M. 2009. Cross-sector analysis of
simulation methods: a survey of defense and healthcare. Transforming Government:
People, Process and Policy, 3, 181-189.
NDIAYE, M. & ALFARES, H. 2008. Modeling health care facility location for moving
population groups. Computers and Operations Research, 35, 2154-2161.
NEELY, A., ADAMS, C. & KENNERLEY, M. 2002. The performance prism: the
scorecard for measuring and managing business success, Financial Times/Prentice
Hall, London.

REFERENCES
227
NEELY, A. & BOURNE, M. 2000. Why measurement initiatives fail. Measuring
Business Excellence, 4, 3-7.
NEELY, A., MILLS, J., PLATTS, K., RICHARDS, H., GREGORY, M., BOURNE, M.
& KENNERLEY, M. 2000. Performance measurement system design: developing and
testing a process-based approach. International Journal of Operations & Production
Management, 20, 1119-1145.
NETHE, A. & STAHLMANN, H. Survey of a general theory of process modelling.
International Conference on Process Modelling, 1999 Cottbus, Germany.
NICHOLSON, L., VAKHARIA, A. J. & SELCUK ERENGUC, S. 2004. Outsourcing
inventory management decisions in healthcare: Models and application. European
journal of operational research, 154, 271-290.
NIST 1993. Integration definition for function modelling (IDEF0). Technical Report
Federal information processing standards publication (FIPS) 183. National Institute of
Standards and Technology.
NIU, Q., PENG, Q., ELMEKKAWY, T., TAN, Y. Y., BRYANT, H. & BERNAERDT,
L. Performance analysis of the operating room using simulation. Proceedings of the
2007 CDEN and CCEE Conference, 2007.
O‘DONNELL, T., MAGUIRE, L., MCIVOR, R. & HUMPHREYS, P. 2006.
Minimizing the bullwhip effect in a supply chain using genetic algorithms.
International Journal of Production Research, 44, 1523-1544.
OAKLAND, J. S. 1993. Total quality management: the management of change through
process improvement, Oxford, Butterworth-Heinemann.
ODDOYE, J., JONES, D., TAMIZ, M. & SCHMIDT, P. 2009. Combining simulation
and goal programming for healthcare planning in a medical assessment unit. European
Journal of Operational Research, 193, 250-261.
OGULATA, S., KOYUNCU, M. & KARAKAS, E. 2008. Personnel and Patient
Scheduling in the High Demanded Hospital Services: A Case Study in the
Physiotherapy Service. Journal of Medical Systems, 32, 221-228.
OLIVEIRA, M. D. & BEVAN, G. 2008. Modelling hospital costs to produce evidence
for policies that promote equity and efficiency. European Journal of Operational
Research, 185, 933-947.
OLVE, N. G., ROY, J. & WETTER, M. 1999. Performance drivers: A practical guide
to using the balanced scorecard, Chichester, John Wiley.

REFERENCES
228
OULD, M. A. & OULD, M. 1995. Business Processes: Modelling and analysis for re-
engineering and improvement, Chichester, John Wiley.
OZKARAHAN, I. 2000. Allocation of Surgeries to Operating Rooms by Goal
Programing. Journal of Medical Systems, 24, 339-378.
PAN, Q. K., WANG, L. & B, Q. 2008. A novel multi-objective particle swarm
optimization algorithm for no-wait flow shop scheduling problems. Journal of
Engineering Manufacture, 222, 519-539.
PANZARASA, S. & STEFANELLI, M. 2006. Workflow management systems for
guideline implementation. Neurological Sciences, 27, 245-249.
PARTINGTON, D. 2002. Grounded theory: Essential Skills for Management
Research,, London, UK, Sage Publications.
PATEL, B., CHAUSSALET, T. & MILLARD, P. 2008. Balancing the NHS balanced
scorecard! European Journal of Operational Research, 185, 905-914.
PATO, M. & MOZ, M. 2008. Solving a bi-objective nurse rerostering problem by using
a utopic Pareto genetic heuristic. Journal of Heuristics, 14, 359-374.
PATRICK, J. & PUTERMAN, M. L. 2006. Improving resource utilization for
diagnostic services through flexible inpatient scheduling: A method for improving
resource utilization. Journal of the Operational Research Society, 58, 235-245.
PATRICK, J., PUTERMAN, M. L. & QUEYRANNE, M. 2008. Dynamic Multipriority
Patient Scheduling for a Diagnostic Resource. Operations Research, 56, 1507-1525.
PAUL, J. A., GEORGE, S. K., YI, P. & LIN, L. 2006. Transient modeling in simulation
of hospital operations for emergency response. Prehospital and Disaster Medicine, 21,
223.
PERERA, T. & LIYANAGE, K. 2000. Methodology for rapid identification and
collection of input data in the simulator of manufacturing systems. Simulation Practice
and Theory, 7, 645–656
PERRY, C., RIEGE, A. & BROWN, L. 1999. Realisms role among scientific
paradigms in marketing research. Irish Marketing Review, 12, 16-23.
PERSSON, M. & PERSSON, J. A. 2009. Health economic modeling to support surgery
management at a Swedish hospital. Omega, 37, 853-863.
PETERS, D. H., NOOR, A. A., SINGH, L. P., KAKAR, F. K., HANSEN, P. M. &
BURNHAM, G. 2007. A balanced scorecard for health services in Afghanistan. Bulletin
of the World Health Organization, 85, 146-151.

REFERENCES
229
PETERS, K. & RYAN, H. 1999. An integrated dialysis delivery network in Ontario.
CANNT journal: the journal of the Canadian Association of Nephrology Nurses and
Technicians, 9, 20-23.
PHALP, K. T., HENDERSON, P., WALTERS, R. J. & ABEYSINGHE, G. 1998.
RolEnact: role-based enactable models of business processes. Information and Software
Technology, 40, 123-133.
PHAM, D.-N. & KLINKERT, A. 2008. Surgical case scheduling as a generalized job
shop scheduling problem. European Journal of Operational Research, 185, 1011-1025.
PHILLIPS, D. C. & BURBULES, N. C. 2000. Postpositivism and educational research,
New York, Rowman and Littlefield.
PICHITLAMKEN, J., NELSON, B. L. & HONG, L. J. 2006. A sequential procedure
for neighborhood selection-of-the-best in optimization via simulation. European
Journal of Operational Research, 173, 283-298.
PIDD, M. 1996. Tools for thinking: modelling in management science, Chichester, UK,
John Wiley.
PIDD, M. 2004. Computer Simulation in Management Science, Hoboken, N.J., John
Wiley and Sons.
PIERSKALLA, W. 2005. Supply Chain Management of Blood Banks. In:
BRANDEAU, M. L., SAINFORT, F. & PIERSKALLA, W. P. (eds.) Operations
Research and Health Care. Springer US.
PINENO, C. J. 2002. The balanced scorecard: an incremental approach model to health
care management. Journal of Health Care Finance, 28, 69-80.
POLACK, F. A. C., ANDREWS, P. S., GHETIU, T., READ, M., STEPNEY, S.,
TIMMIS, J. & SAMPSON, A. T. Reflections on the Simulation of Complex Systems
for Science. Proceedings of the 2010 15th IEEE International Conference on
Engineering of Complex Computer Systems, March 2010 Oxford, UK. 276-285.
POTTHOFF, S. O., ISON, D., THOMPSON, N. & KISSNER, M. 1999. Long-term care
management: a balanced performance measurement system. Journal of Strategic
Performance Measurement, 31, 16-22.
PUNNAKITIKASHEM, P., ROSENBERGER, J. & BUCKLEY BEHAN, D. 2008.
Stochastic programming for nurse assignment. Computational Optimization and
Applications, 40, 321-349.
RAHMAN, S. U. & SMITH, D. K. 1999. Deployment of Rural Health Facilities in a
Developing Country. Journal of the Operational Research Society, 50, 892-902.

REFERENCES
230
RAO, U., SCHELLER-WOLF, A. & TAYUR, S. 2000. Development of a rapid-
response supply chain at Caterpillar. Operations Research, 189-204.
RAUNER, M. S. & BAJMOCZY, N. 2003. How many AEDs in which region? An
economic decision model for the Austrian Red Cross. European Journal of Operational
Research, 150, 3-18.
RAUNER, M. S., KRAUS, M. & SCHWARZ, S. 2008. Competition under different
reimbursement systems: The concept of an internet-based hospital management game.
European Journal of Operational Research, 185, 948-963.
REIS DOS SANTOS, P. M. & ISABEL REIS DOS SANTOS, M. 2009. Using
subsystem linear regression metamodels in stochastic simulation. European Journal of
Operational Research, 196, 1031-1040.
REISINGER, H., CRAVENS, K. S. & TELL, N. 2003. Prioritizing performance
measures within the balanced scorecard framework. MIR: Management International
Review, 43, 429-437.
REMENYI, D. & WILLIAMS, B. 1996. The nature of research: qualitative or
quantitative, narrative or paradigmatic? Information Systems Journal, 6, 131-146.
RIMAR, S. 2000. Strategic planning and the balanced scorecard for faculty practice
plans. Academic Medicine, 75, 1186-1188.
ROBBINS, H. & MONRO, S. 1951. A stochastic approximation method. The Annals of
Mathematical Statistics, 400-407.
ROBSON, C. 1994. Real World Research Oxford, Blackwell
ROBSON, C. 2002. Real World Research, Oxford, Blackwell.
ROSEN, S. L., HARMONOSKY, C. M. & TRABAND, M. T. 2008. Optimization of
systems with multiple performance measures via simulation: Survey and
recommendations. Computers & Industrial Engineering, 54, 327-339.
ROWE, B. H., BOND, K., OSPINA, M. B., BLITZ, S., AFILALO, M., CAMPBELL,
S. G. & SCHULL, M. 2006. Frequency, determinants, and impact of overcrowding in
emergency departments in Canada: a national survey of emergency department
directors. Academic Emergency Medicine, 13, S27.
RYAN, J. & HEAVEY, C. 2006. Process modeling for simulation. Computers in
industry, 57, 437-450.
RYTILA, J. S. & SPENS, K. M. 2006. Using simulation to increase efficiency in blood
supply chains. Management Research News, 29, 801-819.

REFERENCES
231
SAATY, T. L. 1990. How to make a decision: the analytic hierarchy process. European
Journal of Operational Research, 48, 9-26.
SAATY, T. L. 2004. Fundamentals of the analytic network process—Dependence and
feedback in decision-making with a single network. Journal of Systems Science and
Systems Engineering, 13, 129-157.
SADEGH, P. & SPALL, J. C. 1998. Optimal random perturbations for stochastic
approximation using a simultaneous perturbation gradient approximation. IEEE
Transactions on Automatic Control, 43, 1480-1484.
SAMAHA, S., ARMEL, W. S. & STARKS, D. W. The use of simulation to reduce the
length of stay in an emergency department. In: S. CHICK, P. J. SÁNCHEZ, D.
FERRIN & MORRICE, D. J., eds. Proceedings of the 2003 Winter Simulation
Conference, 2003. 1907-1911.
SANTIAGO, J. M. 1999. Use of the balanced scorecard to improve the quality of
behavioral health care. Psychiatric Services, 50, 1571-1576.
SANTIBANEZ, P., BEGEN, M. & ATKINS, D. 2007. Surgical block scheduling in a
system of hospitals: an application to resource and wait list management in a British
Columbia health authority. Health Care Management Science, 10, 269-282.
SAUNDERS, C. E., MAKENS, P. K. & LEBLANC, L. J. 1989. Modeling emergency
department operations using advanced computer simulation systems. Annals of
Emergency Medicine, 18, 134-140.
SAUNDERS, M., LEWIS, P. & THORNHILL, A. 2009. Research methods for business
students, UK, Pearson Education Limited.
SCHAFERMEYER, R. W. & ASPLIN, B. R. 2003. Hospital and emergency
department crowding in the United States. Emergency Medicine, 15, 22-27.
SCHARY PB, SKJØTT-LARSEN T. 2002. Managing the global supply chain,
Copenhagen Business School Press: Copenhagen.
SCHERR, A. 1993. A new approach to business processes. IBM Systems Journal, 32,
80-98.
SCHMIDT, S., BATEMAN, I., BREINLINGER-O'REILLY, J. & SMITH, P. 2006. A
management approach that drives actions strategically: Balanced scorecard in a mental
health trust case study. International Journal of Health Care Quality Assurance, 19,
119-135.
REFERENCES
232
SCHWARTZ, J. D., WANG, W. & RIVERA, D. E. 2006. Simulation-based
optimization of process control policies for inventory management in supply chains.
Automatica, 42, 1311-1320.
SCIOMACHEN, A., TANFANI, E. & TESTI, A. 2005. Simulation models for optimal
schedules of operating theatres. International Journal of Simulation, 6, 26–34.
SEARCY, D. L. 2004. Aligning the balanced scorecard and a firm‘s strategy using the
analytic hierarchy process. Management Accounting Quarterly, 5, 1-10.
SENGE, P. M. 1991. The fifth discipline, the art and practice of the learning
organization, New York, NY, Doubleday Currency.
SHEN, H., WALL, B., ZAREMBA, M., CHEN, Y. & BROWNE, J. 2004. Integration
of business modelling methods for enterprise information system analysis and user
requirements gathering. Computers in industry, 54, 307-323.
SHERALI, H. D., RAMAHI, M. H. & SAIFEE, Q. J. 2002. Hospital resident
scheduling problem. Production Planning and Control: The Management of
Operations, 13, 220 - 233.
SHMUELI, A., SPRUNG, C. L. & KAPLAN, E. H. 2003. Optimizing Admissions to an
Intensive Care Unit. Health Care Management Science, 6, 131-136.
SILVA, C. A., SOUSA, J. M. C. & RUNKLER, T. A. 2008. Rescheduling and
optimization of logistic processes using GA and ACO. Engineering Applications of
Artificial Intelligence, 21, 343-352.
SILVA, C. A., SOUSA, J. M. C., RUNKLER, T. A. & SÁ DA COSTA, J. M. G. 2009.
Distributed supply chain management using ant colony optimization. European Journal
of Operational Research, 199, 349-358.
SIMON, H. A. 1973. The organization of complex systems. In: PATTEE, H. H. (ed.)
Hierarchy theory: The challenge of complex systems. New York: George Braziller.
SIMON, H. A. 1982. The science of the artificial, Cambridge Massachusetts, MIT
press.
SINREICH, D. & JABALI, O. 2007. Staggered work shifts: a way to downsize and
restructure an emergency department workforce yet maintain current operational
performance. Health Care Management Science, 10, 293-308.
SINREICH, D. & MARMOR, Y. 2005. Emergency department operations: the basis for
developing a simulation tool. IIE Transactions, 37, 233-245.
SKINNER, W. 1974. The focused factory. Harvard business review, 52, 113-121.

REFERENCES
233
SMITH, H. K., HARPER, P. R., POTTS, C. N. & THYLE, A. 2009. Planning
sustainable community health schemes in rural areas of developing countries. European
Journal of Operational Research, 193, 768-777.
SNOWDEN, D. 2003. Complex Acts of Knowing: Paradox and Descriptive Self
Awareness. Bulletin of the American Society for Information Science and Technology,
29, 23-28.
SOUNDERPANDIAN, J., PRASAD, S. & MADAN, M. 2008. Supplies from
developing countries: Optimal order quantities under loss risks. Omega, 36, 122-130.
SPALL, J. C. 1998. Implementation of the simultaneous perturbation algorithm for
stochastic optimization. IEEE Transactions on aerospace and electronic systems, 34,
817.
STAHL, J. E., RATTNER, D., WIKLUND, R., LESTER, J., BEINFELD, M. &
GAZELLE, G. S. 2004. Reorganizing the system of care surrounding laparoscopic
surgery: a cost-effectiveness analysis using discrete-event simulation. Medical Decision
Making, 24, 461.
STEEG, J. & SCHRODER, M. 2008. A Hybrid Approach to Solve the Periodic Home
Health Care Problem. In: KALCSICS, J. & NICKEL, S. (eds.) Operations Research
Proceedings 2007, Selected Papers of the Annual International Conference of the
German Operations Research Society (GOR), Saarbrücken, September 5–7, 2007.
Heidelberg: Springer Berlin.
STERMAN, J. D. 1989. Modeling managerial behavior: misperceptions of feedback in
a dynamic decision making experiment. Management Science, 35, 321-339.
STOCKTON, D. J., QUINN, L. & KHALIL, R. A. 2004. Use of genetic algorithms in
operations management Part 1: applications. Journal of Engineering Manufacture, 218,
315-327.
STRAUSS, A. & CORBIN, J. 1990. Basics of Qualitative Research, London, Sage
Publications.
STUMMER, C., DOERNER, K., FOCKE, A. & HEIDENBERGER, K. 2004.
Determining Location and Size of Medical Departments in a Hospital Network: A
Multiobjective Decision Support Approach. Health Care Management Science, 7, 63-
71.
SUNDARAMOORTHI, D., CHEN, V. C. P., ROSENBERGER, J. M., KIM, S. B. &
BUCKLEY-BEHAN, D. F. 2009. A data-integrated simulation model to evaluate
nurse–patient assignments. Health Care Management Science, 12, 252-268.
SWAMINATHAN, J. M. 2003. Decision Support for Allocating Scarce Drugs.
Interfaces, 33, 1-11.
REFERENCES
234
SWISHER, J. R., HYDEN, P. D., JACOBSON, S. H. & SCHRUBEN, L. W.
Simulation optimization: a survey of simulation optimization techniques and
procedures. Proceedings of the 32nd conference on Winter simulation, 2000. Society
for Computer Simulation International San Diego, CA, USA, 119-128.
SWISHER, J. R. & JACOBSON, S. H. 2002. Evaluating the design of a family practice
healthcare clinic using discrete-event simulation. Health Care Management Science, 5,
75-88.
SWISHER, J. R., JACOBSON, S. H. & YÜCESAN, E. 2003. Discrete-event simulation
optimization using ranking, selection, and multiple comparison procedures: A survey.
ACM Transactions on Modeling and Computer Simulation (TOMACS), 13, 134-154.
TAN, B. A., GUBARAS, A. & PHOJANAMONGKOLKIJ, N. Schedule evaluation:
simulation study of Dreyer urgent care facility. In: YÜCESAN, E., CHEN, C.-H.,
SNOWDON, J. L. & CHARNES, J. M., eds. Proceedings of the 34th Winter Simulation
Conference, 2002 San Diego, California. 1922-1927.
TAN, K. C., CHEONG, C. Y. & GOH, C. K. 2007. Solving multiobjective vehicle
routing problem with stochastic demand via evolutionary computation. European
Journal of Operational Research, 177, 813-839.
TAN, K. C., CHEW, Y. H. & LEE, L. H. 2006. A hybrid multi-objective evolutionary
algorithm for solving truck and trailer vehicle routing problems. European Journal of
Operational Research, 172, 855-885.
TAN, K. C., LEE, L. H., ZHU, Q. L. & OU, K. 2001. Heuristic methods for vehicle
routing problem with time windows. Artificial Intelligence in Engineering, 15, 281-295.
TASHAKKORI, A. & TEDDLIE, C. 2003. Handbook of mixed methods in social &
behavioral research, London, UK, Sage Publications.
TAYLOR, F. W. 1919. The principles of scientific management, New York, Harper &
brothers.
TEKIN, E. & SABUNCUOGLU, I. 2004. Simulation optimization: A comprehensive
review on theory and applications. IIE transactions, 36, 1067-1081.
TEN ASBROEK, A. H. A., ARAH, O. A., GEELHOED, J., CUSTERS, T., DELNOIJ,
D. M. & KLAZINGA, N. S. 2004. Developing a national performance indicator
framework for the Dutch health system. International Journal for Quality in Health
Care, 16, 165-171.
TERZI, S. & CAVALIERI, S. 2004. Simulation in the supply chain context: a survey.
Computers in industry, 53, 3-16.

REFERENCES
235
TESTI, A., TANFANI, E. & TORRE, G. 2007. A three-phase approach for operating
theatre schedules. Health Care Management Science, 10, 163-172.
THORWARTH, M., ARISHA, A. & HARPER, P. Simulation model to investigate
flexible workload management for healthcare and servicescape environment. In: M. D.
ROSSETTI, R. R. HILL, B. JOHANSSON, A. DUNKIN & INGALLS, R. G., eds.
Proceedings of the 2009 Winter Simulation Conference, 2009 Austin, Texas, USA.
1946-1956.
TICEHURST, G. & VEAL, A. 2000. Business research methods, Longman, Pearson
Education Pty Limited.
TOPALOGLU, S. 2006. A multi-objective programming model for scheduling
emergency medicine residents. Computers & Industrial Engineering, 51, 375-388.
TROCHIM, W. M. K. & DONNELLY, J. P. 2001. Research methods knowledge base,
Cincinnati, OH, Atomic Dog Publishing.
TSAI, W. H., CHOU, W. C. & HSU, W. 2008. The sustainability balanced scorecard as
a framework for selecting socially responsible investment: an effective MCDM model.
Journal of the Operational Research Society, 60, 1396-1410.
URIBE, A. M., COCHRAN, J. K. & SHUNK, D. L. 2003. Two-stage simulation
optimization for agile manufacturing capacity planning. International Journal of
Production Research, 41, 1181-1197.
VALIRIS, G., CHYTAS, P. & GLYKAS, M. 2005. Making decisions using the
balanced scorecard and the simple multi-attribute rating technique. Performance
Measurement and Metrics, 6, 159-171.
VALOUXIS, C. & HOUSOS, E. 2000. Hybrid optimization techniques for the
workshift and rest assignment of nursing personnel. Artificial Intelligence In Medicine,
20, 155-175.
VAN DER AALST, W., TER HOFSTEDE, A. & WESKE, M. 2003. Business Process
Management: A Survey. In: WESKE, M. (ed.) Business Process Management.
Heidelberg, Berlin: Springer
VANBERKEL, P. & BLAKE, J. 2007. A comprehensive simulation for wait time
reduction and capacity planning applied in general surgery. Health Care Management
Science, 10, 373-385.
VASILAKIS, C., SOBOLEV, B., KURAMOTO, L. & LEVY, A. 2006. A simulation
study of scheduling clinic appointments in surgical care: individual surgeon versus
pooled lists. Journal of the Operational Research Society, 58, 202-211.

REFERENCES
236
VERGIDIS, K., TIWARI, A. & MAJEED, B. 2008. Business process analysis and
optimization: beyond reengineering. Systems, Man, and Cybernetics, Part C:
Applications and Reviews, IEEE Transactions on, 38, 69-82.
VERTER, V. & LAPIERRE, S. D. 2002. Location of Preventive Health Care Facilities.
Annals of Operations Research, 110, 123-132.
VINCENT, C. 2010. Clinical Interventions and Process Improvement. Patient Safety.
Wiley-Blackwell.
VOELKER, K. E., RAKICH, J. S. & FRENCH, G. R. 2001. The balanced scorecard in
healthcare organizations: a performance measurement and strategic planning
methodology. Hospital Topics, 79, 13-24.
WAN, X., PEKNY, J. F. & REKLAITIS, G. V. 2005. Simulation-based optimization
with surrogate models--Application to supply chain management. Computers &
Chemical Engineering, 29, 1317-1328.
WANG, C.-W., SUN, L.-M., JIN, M.-H., FU, C.-J., LIU, L., CHAN, C.-H. & KAO, C.-
Y. A genetic algorithm for resident physician scheduling problem. Proceedings of the
9th annual conference on Genetic and evolutionary computation, 2007 London,
England. 1277380, 2203-2210.
WARING, A. 2000. Practical systems thinking, London, International Thomson
Publishing.
WEICK, K. E. 1984. Theoretical assumptions and research methodology selection. In:
MCFARLAN, F. W. (ed.) The information systems research challenge. Bostom, MA:
Harvard Business School.
WIERZBICKI, A. P. 2007. Modelling as a way of organising knowledge. European
Journal of Operational Research, 176, 610-635.
WOODS, L. P. 1997. Designing and conducting case study research in nursing. Nursing
Times Research, 2, 48-56.
WU, H. Y., TZENG, G. H. & CHEN, Y. H. 2009. A fuzzy MCDM approach for
evaluating banking performance based on Balanced Scorecard. Expert Systems with
Applications, 36, 10135-10147.
WU, J. 1999. Hierarchy and scaling: extrapolating information along a scaling ladder.
Canadian Journal of Remote Sensing, 25, 367-380.
XUE, J. L., MA, J. Z., LOUIS, T. A. & COLLINS, A. J. 2001. Forecast of the number
of patients with end-stage renal disease in the United States to the year 2010. Journal of
the American Society of Nephrology, 12, 2753-2758.

REFERENCES
237
YANG, T., KUO, Y. & CHO, C. 2007. A genetic algorithms simulation approach for
the multi-attribute combinatorial dispatching decision problem. European Journal of
Operational Research, 176, 1859-1873.
YEH, J.-Y. & LIN, W.-S. 2007. Using simulation technique and genetic algorithm to
improve the quality care of a hospital emergency department. Expert Systems with
Applications, 32, 1073-1083.
YEUNG, H. W. 1995. Qualitative personal interviews in international business
research: some lessons from a study of Hong Kong transnational corporations.
International Business Review, 4, 313-339.
YIN, R. K. 1994. Applications of Case Study Research London Sage Publications.
YIN, R. K. 2008. Case Study Research: Design and Methods, London, Sage
Publications.
YIN, X. F. & KHOO, L. P. 2007. Multiple population search strategy for routing
selection and sequence optimization of a supply chain. International Journal of
Computer Integrated Manufacturing, 20, 39-56.
YOO, J. S., HONG, S. R. & KIM, C. O. 2009. Service level management of
nonstationary supply chain using direct neural network controller. Expert Systems with
Applications, 36, 3574-3586.
ZADEH, L. A. 1999. Fuzzy sets as a basis for a theory of possibility. Fuzzy Sets and
Systems, 100, 9-34.
ZAIRI, M. 1997. Business process management: a boundaryless approach to modern
competitiveness. Business Process Management Journal, 3, 64-80.
ZELMAN, W. N., BLAZER, D., GOWER, J. M., BUMGARNER, P. O. &
CANCILLA, L. M. 1999. Issues for academic health centers to consider before
implementing a balanced-scorecard effort. Academic Medicine, 74, 1269-1277.
ZELMAN, W. N., PINK, G. H. & MATTHIAS, C. B. 2003. Use of the balanced
scorecard in health care. Journal of Health Care Finance, 29, 1-16.
ZENG, Q. & YANG, Z. 2009. Integrating simulation and optimization to schedule
loading operations in container terminals. Computers and Operations Research, 36,
1935-1944.
ZHANG, B., MURALI, P., DESSOUKY, M. M. & BELSON, D. 2008. A mixed integer
programming approach for allocating operating room capacity. Journal of the
Operational Research Society, 60, 663-673.

REFERENCES
238
ZHANG, Y., BERMAN, O. & VERTER, V. 2009. Incorporating congestion in
preventive healthcare facility network design. European Journal of Operational
Research, 198, 922-935.
ZHAO, Y. & MELAMED, B. 2007. IPA derivatives for make-to-stock production-
inventory systems with lost sales. IEEE Transactions on Automatic Control, 52, 1491.
ZHENG, Y. & LIU, B. 2006. Fuzzy vehicle routing model with credibility measure and
its hybrid intelligent algorithm. Applied Mathematics and Computation, 176, 673-683.
ZIONTS, S. 1979. MCDM: If Not a Roman Numeral, then What? Interfaces, 9, 94-101.

APPENDICES
239
APPENDICES
APPENDIX A: PATIENT FLOW PROCESS MAPPING
APPENDIX B: STATISTICAL ANALYSIS OF SIMULATION OUTPUT
APPENDIX C: MULTI-CRITERIA DECISION TOOLS
APPENDIX D: GENETIC ALGORITHM AND ARTIFICIAL IMMUNE SYSTEM

APPENDIX A
240
Appendix A: Patient Flow Process Mapping
A0
Trauma
PatientPatient
Patient
Information
Patient Transfer
Resource
Constraints

APPENDIX A
241
Triage
Area I
[M1:M8]
Severe Cases
Assessment & Decision Unit
HomeWard
Patient Transfer
Ambulance
Area II
[M9:M14]
Less Severe Cases
General Treatment
Trauma Patient
Trauma Patient arrive the A&E department via
ambulance in which the triage is performed.
Patient is then placed in the cardio-pulmonary
resuscitation (CRP)/trauma unit. Area-I,II can be
used depending on the severity case of the
patient. Based on the diagnosis and other lab
results, a decision is made about the patient to be
hospitalised or sent home.
Cardio-Pulmonary
Resuscitation (CPR)
A0
Trauma
PatientPatient
Patient
Information
Patient Transfer
Resource
Constraints

APPENDIX A
242
A1
Triage
A2
Cardio-Pulmonary
Resuscitation
(CPR)
A3
Area I
A4
Area II
A5
Assessment &
Decision Unit
A6
Patient Transfer
Medical Staff
Cubicles
Bed/Trolleys/Seats
Medical Equipments
Patient
Patient Information
Patient
Triage Category
(Case Severity)
Patient
Patient
Patient
Patient
Ward/Hospital
Capacity

APPENDIX A
243
A1
Triage
A2
Cardio-Pulmonary
Resuscitation
(CPR)
A3
Area I
A4
Area II
A5
Assessment &
Decision Unit
A6
Patient Transfer
Medical Staff
Cubicles
Bed/Trolleys/Seats
Medical Equipments
Patient
Patient Information
Patient
Triage Category
(Case Severity)
Patient
Patient
Patient
Patient
Ward/Hospital
Capacity
Triage
In trauma cases, patients are often triaged in their way to the
emergency department (inside the ambulance). Once they arrive
the department, they moved to CPR, Area-I, or Area-II
depending on the severity level of the case and the available
capacity. Blood test is ordered, if needed. Details collected from
patient along with lab results are recorded in the patient record
(soft copy), which in turn printed by the triage nurse to be
handed to the administrational area. In the administrational area,
the triage nurse put the patient record in a queue depending on
his/her triage category. Meanwhile, triage nurse directing the
patient to his proper location based on his/her severity level. A
bed or a trolley is arranged and placed for patient either in a
cubicle (CPR, Area I, or Area II) or a free space of the corridor
inside the A&E department. Blood test can be exchanged with
patient allocation depending on the triage category given and the
available capacity.

APPENDIX A
244
Medical Staff
Cubicles
Bed/Trolleys/Seats
Medical Equipments/Computer
Terminals
A11
Intial Diagnosis
and Assessment
A12
Patient Allocation
A13
Blood Test
A14
Patient Record
Update
Patient
Patient
Information
Patient Details
Patient Details
Patient Details
Patient
Patient
Patient

APPENDIX A
245
Cardio-Pulmonary Resuscitation (CPR)
The CPR/trauma room is dedicated to trauma cases where it is
equipped with monitoring devices and advanced medical
equipments.
Staff assess the patient immediately to make him/her more
stable. If needed, patient will be guided to the X-Ray room
using a wheelchair or the entire bed/trolley. Patient record is
then updated by the X-Ray image(s). Based on patient data,
lab results, and X-Ray image(s), a primary/final diagnosis is
made. The patient is then advised to the proper treatment and
receive the necessary care.
A1
Triage
A2
Cardio-Pulmonary
Resuscitation
(CPR)
A3
Area I
A4
Area II
A5
Assessment &
Decision Unit
A6
Patient Transfer
Medical Staff
Cubicles
Bed/Trolleys/Seats
Medical Equipments
Patient
Patient
Information
Patient
Triage Category
(Case Severity)
Patient
Patient
Patient
Patient
Ward/Hospital
Capacity

APPENDIX A
246
Medical Staff
Cubicles
Bed/Trolleys/Seats
Medical Equipments/Computer
Terminals
A22
X-Ray
A23
Patient Record
Update
A24
Patient Primary/
Final Diagnosis
A25
Intial Treatment
X-Ray Images
Blood Test Results
Patient Record updated with
blood results and X-ray Images
A21
Patient
Assessment and
Care

APPENDIX A
247
Area-I
In case of overcrowdings, Area-I,II cab be used for trauma
patients.
Staff assess the patient immediately to make him/her more
stable. If needed, patient will be guided to the X-Ray room
using a wheelchair or the entire bed/trolley. Patient record is
then updated by the X-Ray image(s). Based on patient data,
lab results, and X-Ray image(s), a primary/final diagnosis is
made. The patient is then advised to the proper treatment and
receive the necessary care.
A1
Triage
A2
Cardio-Pulmonary
Resuscitation
(CPR)
A3
Area I
A4
Area II
A5
Assessment &
Decision Unit
A6
Patient Transfer
Medical Staff
Cubicles
Bed/Trolleys/Seats
Medical Equipments
Patient
Patient Information
Patient
Triage Category
(Case Severity)
Patient
Patient
Patient
Patient
Ward/Hospital
Capacity

APPENDIX A
248
Medical Staff
Cubicles
Bed/Trolleys/Seats
Medical Equipments/Computer
Terminals
A32
X-Ray
A33
Patient Record
Update
A34
Patient Primary/
Final Diagnosis
A35
Intial Treatment
X-Ray Images
Blood Test Results
Patient Record updated with
blood results and X-ray Images
A31
Patient
Assessment and
Care

APPENDIX A
249
Area-II
Staff assess the patient immediately to make him/her more
stable. If needed, patient will be guided to the X-Ray room
using a wheelchair or the entire bed/trolley. Patient record is
then updated by the X-Ray image(s). Based on patient data,
lab results, and X-Ray image(s), a primary/final diagnosis is
made. The patient is then advised to the proper treatment and
receive the necessary care.
A1
Triage
A2
Cardio-Pulmonary
Resuscitation
(CPR)
A3
Area I
A4
Area II
A5
Assessment &
Decision Unit
A6
Patient Transfer
Medical Staff
Cubicles
Bed/Trolleys/Seats
Medical Equipments
Patient
Patient
Information
Patient
Triage Category
(Case Severity)
Patient
Patient
Patient
Patient
Ward/Hospital
Capacity

APPENDIX A
250
Medical Staff
Cubicles
Bed/Trolleys/Seats
Medical Equipments/Computer
Terminals
A42
X-Ray
A43
Patient Record
Update
A44
Patient Primary/
Final Diagnosis
A45
Intial Treatment
X-Ray Images
Blood Test Results
Patient Record updated with
blood results and X-ray Images
A41
Patient
Assessment and
Care
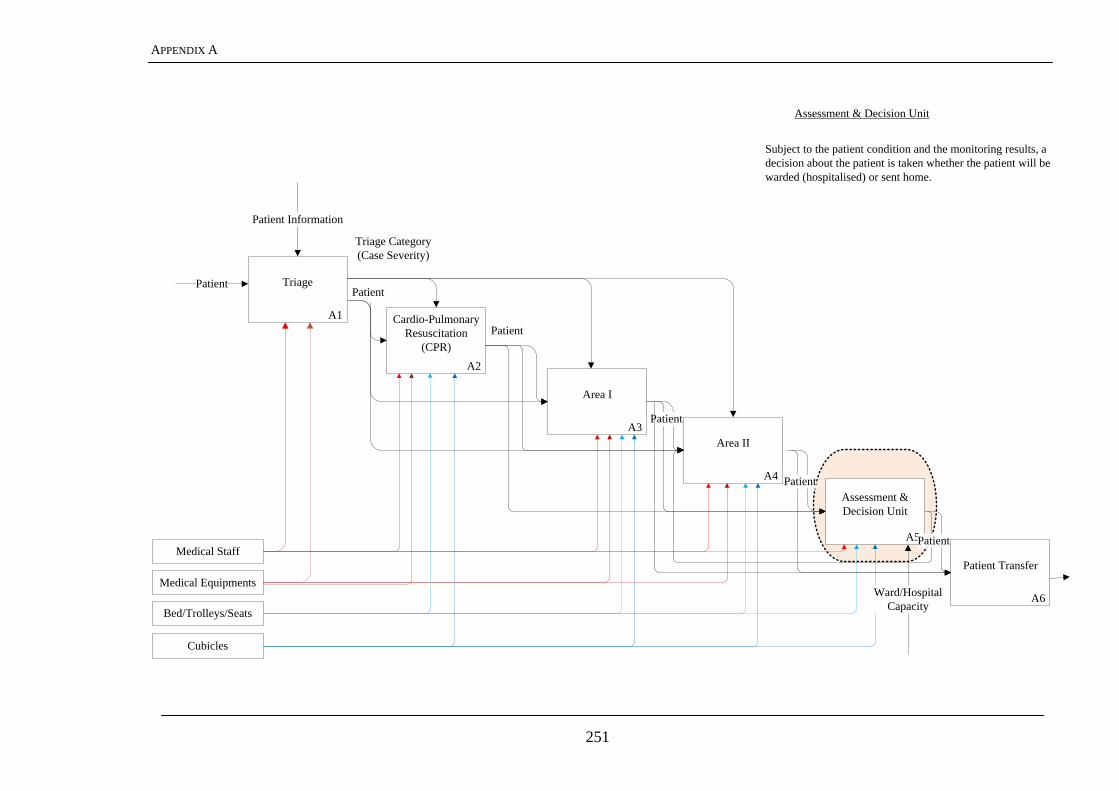
APPENDIX A
251
A1
Triage
A2
Cardio-Pulmonary
Resuscitation
(CPR)
A3
Area I
A4
Area II
A5
Assessment &
Decision Unit
A6
Patient Transfer
Medical Staff
Cubicles
Bed/Trolleys/Seats
Medical Equipments
Patient
Patient Information
Patient
Triage Category
(Case Severity)
Patient
Patient
Patient
Patient
Ward/Hospital
Capacity
Subject to the patient condition and the monitoring results, a
decision about the patient is taken whether the patient will be
warded (hospitalised) or sent home.
Assessment & Decision Unit

APPENDIX A
252
A51
Patient
Assessment
A52
Patient Monitoring
A53
Patient Decision
Medical Staff
Cubicles
Bed/Trolleys/Seats
Medical Equipments/Computer
Terminals
Patient data & case
details
Patient
Patient case
details
PatientPatient data & case
details
Patient

APPENDIX A
253
A1
Triage
A2
Cardio-Pulmonary
Resuscitation
(CPR)
A3
Area I
A4
Area II
A5
Assessment &
Decision Unit
A6
Patient Transfer
Medical Staff
Cubicles
Bed/Trolleys/Seats
Medical Equipments
Patient
Patient Information
Patient
Triage Category
(Case Severity)
Patient
Patient
Patient
Patient
Ward/Hospital
Capacity
Patient Transfer
If the patient case is not stable the patient can be sent
back to Area II for further assessment and monitoring, or
can be hospitalised (warded). If patient condition is
stable, s(he) is sent home. Patient record is updated to
reflect patient transfer/discharge decision. If the patient
occupies a cubicle, s(he) waits in this cubicle or moved
to the corridor to free up space for more severe cases.
These patients are looked after by nurses until they
warded or collected home.

APPENDIX A
254
Medical Staff
Cubicles
Bed/Trolleys/Seats
Medical Equipments/Computer
Terminals
A61
Patient Move
preparation
A62
Home Preparation
A63
Ward Preparation
Patient
Decision
Patient sent to Area II
Patient sent home
Patient warded

APPENDIX B
255
Appendix B: Statistical Analysis of Simulation Output
B.1 NOTATION AND DESCRIPTIVE STATISTICS
Data: p variables, n observations
X1 X2 … Xp
x11 x12 … x1p
x21 x22 … x2p
xn1 xn2 … xnp
Data matrix:
X =
npnn
p
p
xxx
xxx
xxx
...
...
...
21
22221
11211
B.2 DESCRIPTIVE STATISTICS
Sample means:
j
jkkx
nx
1 k = 1,2,…,p
Sample variances:
22 )(1
xxn
ssjk
j
kkk k = 1,2,…,p
Sample standard deviations:
kks
k = 1,2,…,p
Sample covariance:
j
kjkijiikxxxx
ns ))((
1
i = 1,2,…,p, k = 1,2,…,p
Sample correlations:
kkii
ik
ik
ss
sr
i = 1,2,…,p, k = 1,2,…,p

APPENDIX B
256
B.3 ARRAYS AND MATRICES
p
xp
x
x
x
x 2
1
)1(
Covariance Matrix:
pppp
p
p
n
sss
sss
sss
S
...
...
...
21
22221
11211
(p x p)
Correlation Matrix:
1...
...1
...1
21
221
112
pp
p
p
rr
rr
rr
R
(p x p)
11 : ikn rwheresymmetricRandSNotes
B.4 CONFIDENCE INTERVALS
Assume ),(,,, 2
21NtindependenXXX
n and
2 unknown.
01
00
:
:
H
H
10
/
ntis
ns
Xt
Reject H0 if:
)2/(|| 1 ntt
Alternatively, since 1,12
1 nn Ft , reject H0 if:
)()2/()()(/
1,12
10
12
0
2
02
nn
Ftxn
sx
ns
xt

APPENDIX B
257
Also, not reject H0 if: )2/(
/|| 1
0
ntns
xt
Or
nstx n /)2/(10 100(1) % confidence interval for
B.5 MULTIVARIATE GENERALISATION – HOTELLING’S T2
Assume X1, X2,…, Xn independent Np(, ) and unknown.
01
00
:
:
H
H
Hotelling‘s T
2 ( n 1 > p )
)()()()( 01
00
1
02
xSxnxn
SxT
Under H0 , T2 is: pnpF
pn
pn
,
)1(
Reject H0 at level if
)(αFpn
1)p(n)μx(S)μx(nT pp,n0
10
2
(Note: t2 = T
2 if p = 1)
B.6 CONFIDENCE REGIONS
A 100(1 - ) % confidence region for all :
2,
1 )()1(
)()( cFpn
pnxSxn pnp
The relationship between confidence region and tests of H0 is that any 0 in 100(1) %
confidence region is consistent with the data (not reject H0) at the level.
B.7 SIMULTANEOUS CONFIDENCE INTERVALS
Assume: unknownNisX pj ),(
Consider: ppaaaa 2211

APPENDIX B
258
Simultaneous intervals of 100(1) % for all a given by:
n
Saacxa
Where )()1(
,2 pnpF
pn
pnc
Notes:
10,,0,1 aa
210,,1,1 aa
, and so forth.
a fixed, 100(1)% confidence interval for a given by
n
Saatxa n
)2/(1
B.8 BONFERRONI INTERVALS
Consider:
',,','21 paaa
And p confidence levels for each component = 1i i = 1, 2 … p, with confidence
intervals:
pin
Saatxa ii
ini ,,2,1'
)2/(' 1
Where pi / , have overall confidence level greater than or equal to 1.
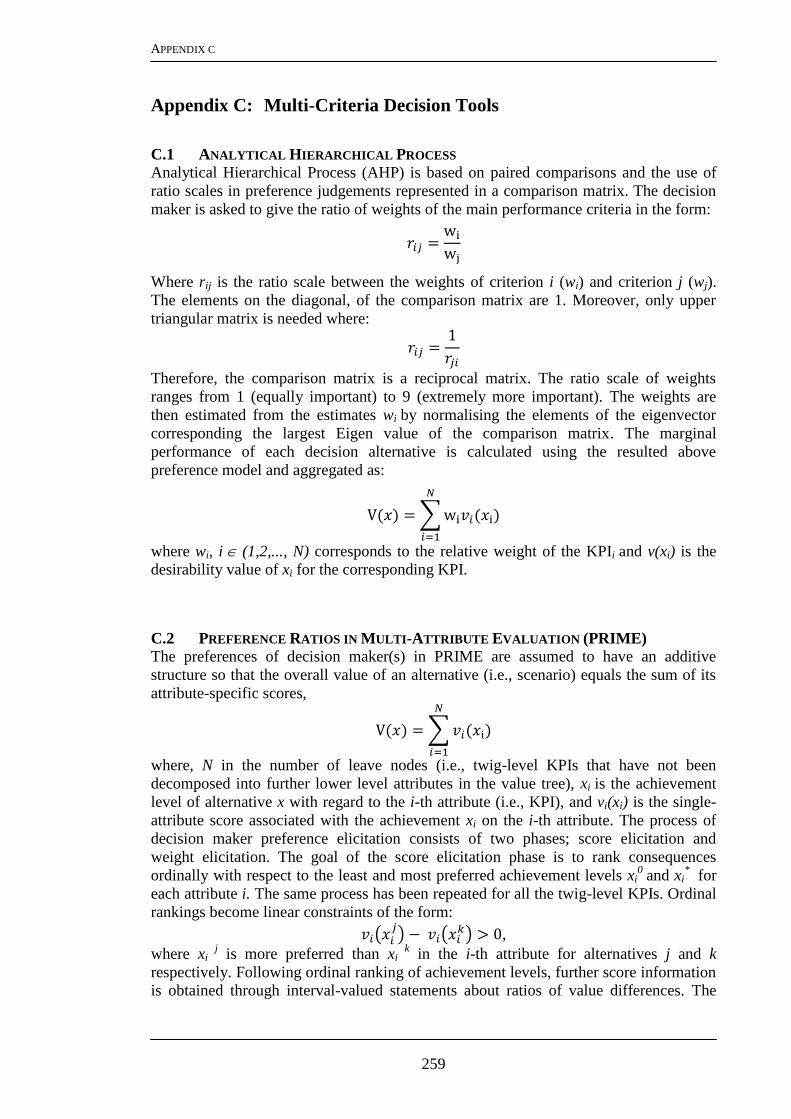
APPENDIX C
259
Appendix C: Multi-Criteria Decision Tools
C.1 ANALYTICAL HIERARCHICAL PROCESS
Analytical Hierarchical Process (AHP) is based on paired comparisons and the use of
ratio scales in preference judgements represented in a comparison matrix. The decision
maker is asked to give the ratio of weights of the main performance criteria in the form:
Where rij is the ratio scale between the weights of criterion i (wi) and criterion j (wj).
The elements on the diagonal, of the comparison matrix are 1. Moreover, only upper
triangular matrix is needed where:
Therefore, the comparison matrix is a reciprocal matrix. The ratio scale of weights
ranges from 1 (equally important) to 9 (extremely more important). The weights are
then estimated from the estimates wi by normalising the elements of the eigenvector
corresponding the largest Eigen value of the comparison matrix. The marginal
performance of each decision alternative is calculated using the resulted above
preference model and aggregated as:
where wi, i (1,2,..., N) corresponds to the relative weight of the KPIi and v(xi) is the
desirability value of xi for the corresponding KPI.
C.2 PREFERENCE RATIOS IN MULTI-ATTRIBUTE EVALUATION (PRIME)
The preferences of decision maker(s) in PRIME are assumed to have an additive
structure so that the overall value of an alternative (i.e., scenario) equals the sum of its
attribute-specific scores,
where, N in the number of leave nodes (i.e., twig-level KPIs that have not been
decomposed into further lower level attributes in the value tree), xi is the achievement
level of alternative x with regard to the i-th attribute (i.e., KPI), and vi(xi) is the single-
attribute score associated with the achievement xi on the i-th attribute. The process of
decision maker preference elicitation consists of two phases; score elicitation and
weight elicitation. The goal of the score elicitation phase is to rank consequences
ordinally with respect to the least and most preferred achievement levels xi0
and xi*
for
each attribute i. The same process has been repeated for all the twig-level KPIs. Ordinal
rankings become linear constraints of the form:
,
where xi j
is more preferred than xi k
in the i-th attribute for alternatives j and k
respectively. Following ordinal ranking of achievement levels, further score information
is obtained through interval-valued statements about ratios of value differences. The

APPENDIX C
260
decision maker sets lower and upper bounds [L,U] on the ratio between the value
difference from xi0 to the achievement level xi
j and the value difference from xi
0 to xi
* :
For the weight elicitation phase, trade-off information about the relative importance of
attributes is elicited through interval-valued (i.e., ratio) judgments. A reference attribute
(e.g., the most important one) is selected and one hundred points are assigned to it. The
decision maker is then asked to assign a range of points [L,U] to the other attributes in
accordance with the perceived importance of these attributes:
This process is repeated for each level in the value tree where the relative importance of
KPIs is specified by the decision maker. PRIME converts the imprecise preference
model then into preference synthesis structure and consists of; 1) weight intervals of the
attributes, 2) value intervals for the alternatives, and 3) dominance structures and
decision rules for the alternatives comparison. Weight intervals are obtained by solving
the linear constraints imposed on weights (represented by lower and upper inequalities).
Following weight interval calculation, value intervals are calculated for each alternative:
While
are the linear programs that give bounds for the
weight of the i-th attribute. The dominance structure for alternatives is then inferred.
Computationally, alternative x j is preferred to x
k in the sense of absolute dominance if
and only if the smallest value of x j exceeds the largest value of x
k, i.e.,

APPENDIX D
261
Appendix D: Genetic Algorithm and Artificial Immune System
D.1 GENETIC ALGORITHM
GA is a search technique that has a representation of the problem states and also has a
set of operations to move through the search space. The states in the GA are represented
using a set of chromosomes. Each chromosome represents a candidate solution to the
problem. The set of candidate solutions forms a population. In essence, the GA
produces more generations of this population hoping to reach a good solution for the
problem. Members (candidate solutions) of the population are improved across
generation through a set of operations that GA uses during the search process. GA has
three basic operations to expand a candidate solution into other candidate solutions.
These basic operations are:
Selection: an objective function (i.e., fitness function) is used to assess the quality of
the generated solutions. Solutions with higher fitness values are selected for the
following iteration (i.e., generation) of the algorithm.
Crossover: This operation generates new solutions given a set of selected members
of the current population. Crossover exchanges genetic material between two single
chromosome parents This set of selected members is the outcome of the selection
operation.
Mutation: biological organisms are often subject to a sudden change in their
chromosomes in an unexpected manner. Such a sudden change is simulated in GA in
the mutation operation. This operation is a clever way to escape from local optima
trap in which state-space search algorithms may fall into. In this operation, some
values of a chromosome are changed by adding random values for the current values.
This action changes the member values and hence produces a different solution.
Genetic Algorithm pseudo code:
1. Generate initial random population of chromosomes.
2. Compute the fitness for each chromosome in the current population.
3. Make an intermediate population from the current population using the
reproduction operator.
4. Using the intermediate population, generate a new population by applying the
crossover and mutation operators.
5. If you get a member the population that satisfies the requirements stop,
otherwise go to step 2.
D.2 CLONAL SELECTION ALGORITHM
The Clonal selection algorithm (CSA) is a special kind of immune algorithms using the
clonal expansion and the affinity maturation as the main forces of the evolutionary
process.
CSA Algorithm pseudo code:
1- Generate initial antibodies (each antibody represents a solution that represents
the parameters of HMM in our case the A and B matrices).
2- Compute the fitness of each antibody. The used fitness function computes the
average log probability over training data.
3- Select antibodies from population which will be used to generate new antibodies
(the selection can be random or according to the fitness rank). The antibodies

APPENDIX D
262
with highest fitness are selected such that they are different enough as described
later.
4- For each antibody, generate clones and mutate each clone according to fitness.
5- Delete antibodies with lower fitness form the population, then add to the
population the new antibodies.
6- Repeat the steps from 2- 5 until stop criterion is met. The number of iterations
can be used as the stop criterion.
D.3 HYBRID GENETIC -IMMUNE SYSTEM METHOD
The main forces of the evolutionary process for the GA are crossover and the mutation
operators. For the CSA, the main force of the evolutionary process is the idea of clone
expansion in which new clones of – potentially good solutions – are generated. These
new clones are then mutated and the best of these clones are added to the population
plus adding new generated members to the population. The hybrid method takes the
main force of the evolutionary process for the two algorithms.
GA/CSA Algorithm pseudo code:
1- Generate the initial population (candidate solutions).
2- Select the (N) best items from the population.
3- For each selected item generate a number of clones (Nc) and mutate each item
form (Nc).
4- Select the best mutated item from each group (Nc) and add it to the population.
5- Select from the population the items on which the crossover will be applied. We
select them randomly in our system but any selection method can be used.
6- After selection make a crossover and add the new items (items after crossover)
to the population by replacing the low fitness items with the new ones.
7- Add to the population a group of new generated random items.
8- Repeat step 2- 7 according to meeting the stopping criterion.
The steps 2 -5 were repeated for a number of times before adding new group of
generated solutions.

LIST OF PUBLICATIONS
263
LIST OF PUBLICATIONS
Peer-Reviewed Journals
Waleed Abo-Hamad and Amr Arisha (2011), ―Simulation Optimisation Methods
in Supply Chain Applications: A Review‖, Irish Journal of Management, 30 (2),
95-124.
Waleed Abo-Hamad, John McInerney and Amr Arisha (2011), ―Virtual ED‘:
Utilisation of a Discrete Event Simulation-based Framework in Identifying ‗real-
time‘ Strategies to Improve Patient Experience Times in an Emergency
Department‖, Emergency Medicine Journal, 28, A3-A4.
Waleed Abohamad and Amr Arisha (2011), ―Simulation-based Framework to
Improve Patient Experience in an Emergency Department‖, European Journal of
Operational Research, Accepted.
Peer-Reviewed Conferences
Khaled Ismail, Waleed Abo-Hamad, and Amr Arisha (2010), ― Integrating
Balanced Scorecard And Simulation Modelling To Improve Emergency
Department Performance In Irish Hospitals‖, Proceedings of the 2010 Winter
Simulation Conference, B. Johansson, S. Jain, J. Montoya-Torres, J. Hugan, and E.
Yücesan, eds., 5 – 8 December 2010, Baltimore, Maryland, USA.
Waleed Abohamad and Amr Arisha (2010), ―Evaluating and Selecting
Optimization Software Packages: A Framework for Business Applications‖,
Proceedings of International Conference on Operations Research (ICOR’10), 24 -
26 November 2010, Venice, Italy.
Waleed Abo-Hamad and Amr Arisha (2009), ―Optimisation Methods in Supply
Chain Applications: A Review‖, Proceedings of the 12th annual Irish Academy of
Management Conference. 2 – 4 September 2009, Galway - Mayo Institute of
Technology, Ireland.
Conference Abstracts
Waleed Abohamad, John McInerney, and Amr Arisha (2011), ―‗Virtual ED‘ –
Utilisation of a Discrete Event Simulation-based Framework in Identifying ‗real-
time‘ Strategies to Improve Patient Experience Times in an Emergency
Department‖, The Sixth Mediterranean Emergency Medicine Congress (MEMC
VI), 10 – 14 September 2011, Kos, Greece.
Posters
Khaled Ismail, Waleed Abo-Hamad, and Amr Arisha (2010), ―A Simulation
Based Framework to Improve Emergency Department Performance in Irish Public
Hospitals‖, Winter Simulation Conference (WSC’10), 5 - 8 December 2010,
Baltimore, Maryland, USA.
Waleed Abo-Hamad, and Amr Arisha (2011), ―An Optimization-based
Framework for Complex Business Process: Healthcare Application‖, Winter
Simulation Conference (WSC’11), 11 – 14 December 2011, Phoenix, Arizona,
USA.


![Performance Analysis and Optimisation of the OP2 Framework ... · Performance Analysis and Optimisation of the OP2 Framework on Many-core Architectures 3 been presented in [12]. The](https://img.pdfslide.net/doc/110x75/5f1acfabfd86c837843acd80/performance-analysis-and-optimisation-of-the-op2-framework-performance-analysis.jpg)