Embed Size (px)
Citation preview

1
©2012 Waters Corporation 1
An Overview of Current Tools for Quantitative LC-MS in the Clinical Laboratory
Donald MasonGlobal Scientific Affairs Manager
Waters [email protected]
©2012 Waters Corporation 2
Disclosure
Employment: Waters Corporation Stock Ownership: Waters Corporation
During the course of this presentation I will speak about both Waters and non-Waters products. Any representation of any product is designed to be illustrative of a general principle of liquid chromatography or mass spectrometry and does not represent a product endorsement. I encourage you to speak with the respective vendor representatives for additional information about specific products.
©2012 Waters Corporation 3
Acknowledgements
Michael Jarvis (AB Sciex) Jeff Zonderman (ThermoFisher Scientific) John Hughes (Agilent Technologies) Tom Rosano (Albany Medical Center) Tom Swift (Albany Medical Center) Scott Freeto (Waters) Kara Lynch (University of California, San Francisco)
2
©2012 Waters Corporation 4
Outline
Sample pretreatmento Single-use SPE, Multi-use SPE, SPE-MS/MS, Immuno-affinity
purification
HPLC vs. UHPLC Ionization
– Differential Mobility Separation
Mass Analyzers– Nominal mass vs. High Res./Exact Mass– Ion ratios and product ion spectra for confirmation
Data reduction software What’s available and what’s needed
– Audience participation: Your input is desired for this ever-growing list…
©2012 Waters Corporation 5
Strategies for sample pretreatment
Dilute-and-shoot Protein precipitation (PPT) Liquid/liquid extraction (LLE) Solid phase extraction (SPE)
– Manual, e.g. vacuum manifold– Integrated, e.g. on-line
o Reusable extraction columnso Single-use extraction cartridges
Supercritical fluid extraction (SFE)– extraction using supercritical carbon dioxide instead of an organic
solvent
6 Proprietary & Confidential
Less steps using an integrated pretreatment approach

3
7 Proprietary & Confidential
Online SPE using reusable cartridge columns
Internal “T”
Rotor
StandardRotor
TurboFlow®column
MS
LOADINGPUMP
matrix proteinselute to waste analyte(s) retained
analytical column
A B
ELUTINGPUMPAS
C D
waste
8 Proprietary & Confidential
Multiplexing Increases Throughput
System diagram above is representative of a Thermo Scientific TranscendTM LX-4 system
1 min 4 min.
Sys
tem
1
3 min .
4 min .
2 min
Sys
tem
2S
yste
m3
Sys
tem
4
MS Data
Acquisition Window
Idle Time Idle Time
Each LC system only requires the MS during
the elution step
9 Proprietary & Confidential
Rapid determination of steroids for newborn screening for congenital adrenal hyperplasia (CAH) by turbulent flow liquid chromatography-tandem mass spectrometry (TFLC-MS/MS)
Jean M. Lacey1; Mark J. Magera1; Joseph M. Di Bussolo2; Silvia Tortorelli1; SiHoun Hahn1; Piero Rinaldo1; Dietrich Matern1
1. Mayo Clinic, Rochester, MN; 2. Cohesive Technologies, Franklin, MA54th ASMS Conference on Mass Spectrometry

4
©2012 Waters Corporation 10
Gripper Places Cartridge In Right Clamp— Specified in sample list
HPD Applies Conditioning And Equilibration Solvents To Cartridge
On-line SPE using single-use extraction cartridges
©2012 Waters Corporation 11
Sample Manager Draws Sample During Conditioning And Equilibration Steps
Loop Brought In Line With Loading Solvent From HPD
Sample Pushed Through Cartridge, Analyte Trapped And Stream Diverted To Waste
Sample Extraction Mode: Sample Loading
©2012 Waters Corporation 12
HPD Supplies Wash Solvents Across The Cartridges
Up To 23 SPE Solvents Can Be Used— Mix ratios of 2 solvents can
be used in steps of 10% for method development
Sample Extraction Mode:Sample Wash

5
©2012 Waters Corporation 13
Gripper Moves Cartridge To Left Clamp For Elution Step
Elution Time Is Defined In The Inlet Editor— Selectivity of extraction
HDP Supplies Clamp Flush Solvent To Left Clamp Tubing— Numerous wash steps can be
applied to minimize carryover
Sample Extraction Mode: Sample Elution
©2012 Waters Corporation 14
Sirolimus 1ng/mL
Improved Sensitivity: Online SPE vs Protein Crash
1 ng/mL tacrolimus from protein precipitated whole blood
©2012 Waters Corporation 15
Improved Sample Clean-up: Removal Of Phospholipids
Whole Blood without SPE
Whole Blood with Online SPE

6
©2012 Waters Corporation 16
SPE/MS/MS
©2012 Waters Corporation 17
Immuno-affinity purification
Should I Be Embarrassed That My Mass Spec Assay Uses an Antibody?– NACBBlog, 06 March 2012 by Fred
Strathmann– Short answer is “no”– Reduction in final sample complexity– Immunoassays possess sensitivity,
but lack specificity. MS detection overcomes this
Applied primarily to low abundance analytes, e.g. 1,25(OH)2-vitamin D and peptides/proteins, e.g. SISCAPA®
Clinical Chemistry 57:9;1279–1285 (2011)
©2012 Waters Corporation 18
ChromatographyHPLC vs. UHPLC

7
©2012 Waters Corporation 19
Particle Technology
Images are on the same scale (Bar = 10 μm)
5 μm Analytical Particles
(can fit 12 across hair)
< 2 μm UHPLC Particles
(can fit 33 across hair)
60 μm Human Hair (very fine hair)
©2012 Waters Corporation 20
Particle Size andMechanical Separating Power*
Columns contain the same packing material chemistry, are the same length with the same mobile phase. One column has particles which are a third the size.
Smaller particle sizes provide for better separation with the same run time.
* This is also called “Efficiency”
©2012 Waters Corporation 21
Analytical Challenges -Sensitivity and Throughput
10 µm – 250 mm
Rs (2,3) = 1.54
5 µm – 150 mmRs (2,3) = 2.69
3.0 µm – 100 mmRs (2,3) = 2.29
1.7 µm – 50 mmRs (2,3) = 2.25
AU
0.00
0.05
0.10
0.15
Minutes0.00 0.10 0.20 0.30 0.40 0.50 0.60 0.70 0.80 0.90 1.00
AU
0.00
0.05
0.10
0.15
Minutes0.00 0.50 1.00 1.50 2.00 2.50 3.00 3.50 4.00
AU
0.00
0.05
0.10
0.15
Minutes0.00 1.00 2.00 3.00 4.00 5.00 6.00 7.00 8.00
AU
0.00
0.05
0.10
0.15
Minutes0.00 5.00 10.00 15.00 20.00 25.00 30.00
1.10 min.
4.50
9.50
35.00 min.
Set to same scale
1970’s
1980’s
1990’s
2012

8
©2012 Waters Corporation 22
AU
-0.002
0.000
0.002
0.004
0.006
0.008
0.010
0.012
0.014
0.016
0.018
0.020
0.022
Minutes
0.00 1.00 2.00 3.00 4.00
UHPLC Column on HPLC System:What are the benefits?FIRST -----
XTerra® MS C18
2.1 x 50 mm, 2.5 µmF = 0.5 mL/minPSIMAX = 3,950
T(4) = 1.30N (4) = 4,100
Rs (2,3) = 1.10
1
2
3
4
Fully optimized HPLC instrument:Band spreading contribution reduced as much as possible, but still relatively high.
HPLC column on HPLC instrument
©2012 Waters Corporation 23
AU
-0.002
0.000
0.002
0.004
0.006
0.008
0.010
0.012
0.014
0.016
0.018
0.020
0.022
Minutes
0.00 1.00 2.00 3.00 4.00
UHPLC Column on HPLC System:What are the benefits?Does not look any better!!
AU
-0.002
0.000
0.002
0.004
0.006
0.008
0.010
0.012
0.014
0.016
0.018
0.020
0.022
Minutes
0.00 1.00 2.00 3.00 4.00
ACQUITY UPLC® BEH C18
2.1 x 50 mm, 1.7 µmF = 0.3 mL/minPSIMAX = 4,200
T (4) = 1.63N (4) = 5,400
Rs (2,3) = 0.97
XTerra® MS C18
2.1 x 50 mm, 2.5 µmF = 0.5 mL/minPSIMAX = 3,950
T(4) = 1.30N (4) = 4,100
Rs (2,3) = 1.101
2
3
4
1
2
3
4
Fully optimized HPLC instrument:Minimal benefits realized with UHPLC column
A) Flow rate too slow (pressure)B) Still more instrument band spreading than UHPLC instrument
UHPLC column on HPLC instrumentHPLC column on HPLC instrument
©2012 Waters Corporation 24
AU
0.00
0.02
0.04
0.06
0.08
0.10
0.12
0.14
0.16
Minutes
0.00 0.50 1.00 1.50 2.00 2.50 3.00
UHPLC Column on UHPLC System:What are the benefits?Does not look any better!!
ACQUITY UPLC® BEH C18
2.1 x 50 mm, 1.7 µmF = 0.3 mL/minPSIMAX = 4,200
T (4) = 1.63N (4) = 5,400
Rs (2,3) = 0.97
Reset AU Scale
UHPLC column on HPLC instrument
1 23
4
HPLCNon-Optimal Linear Velocity
Higher Band Spreading

9
©2012 Waters Corporation 25
AU
0.00
0.02
0.04
0.06
0.08
0.10
0.12
0.14
0.16
Minutes
0.00 0.50 1.00 1.50 2.00 2.50 3.00
UHPLC Column on UHPLC System:What are the benefits?The results look much better!!
ACQUITY UPLC® BEH C18
2.1 x 50 mm, 1.7 µmF = 0.3 mL/minPSIMAX = 4,200
T (4) = 1.63N (4) = 5,400
Rs (2,3) = 0.97
Reset AU Scale
1 23
4
AU
0.00
0.02
0.04
0.06
0.08
0.10
0.12
0.14
0.16
Minutes
0.00 0.50 1.00 1.50 2.00 2.50 3.00
ACQUITY UPLC® BEH C18
2.1 x 50 mm, 1.7 µmF = 0.6 mL/minPSIMAX = 8,400
T (4) = 1.02N (4) = 10,100Rs (2,3) = 2.25
~2 x Plate Count~2 x Rs~2 x Pressure~8 x Sensitivity
UHPLC column on UHPLC instrument
UHPLCOptimal Linear VelocityLow Band Spreading
1
2 3
4
HPLCNon-Optimal Linear Velocity
Higher Band Spreading
UHPLC column on HPLC instrument
©2012 Waters Corporation 26
Differential Mobility Separation
27
Ion Mobility Technology
ions in transport gas
to mass spectrometer
Differential ion mobility device

10
28
Ion Mobility Technology
©2012 Waters Corporation 29
Quantitation using tandem quadrupole and hi-res instruments
©2012 Waters Corporation 30
Tacrolimus: Product Ion Spectrum
Mass spectrum from MS1
Product ion spectrum from MS2
Specificity is achieved by: 1) chromatography, 2) pre-cursor ion selection (0.7 – 1.0 amu), and 3) product ion selection (0.7 – 1.5 amu).

11
©2012 Waters Corporation 31
Tacrolimus:Single column method, SIR vs MRM
SIR m/z 821
MRM m/z 821>768
3µg / L 30µg / L
©2012 Waters Corporation 32Meikle et al. J Clin Endo Metab 88(8):3521-24, 2003
2 Cases – Pseudo-Cushing Syndrome by HPLC-UV
Case 1 Case 2
UFC(HPLC)
166135463
12681156180
UFC (LC-MS/MS)*
10 9
UFC(RIA)
35 n/a
Fserum 0.9 1.1Fsaliva < 0.4 –
1.1< 0.4– 3.2
*Using qualifier ion transition
*
©2012 Waters Corporation 33
Ion ratios and product ion confirmation

12
©2012 Waters Corporation 34
Acquire Qualitative & Quantification Data at the Same Time
Acquire qualitative (spectral) data & quantitative (MRM) data in a single injection
MS spectral data at the same time as MRM data– Detect compounds not defined as MRMs– Valuable aid to method development– See all of the back ground interferences while developing your
targeted MRM method– Tentatively identify compounds during routine quantitative analysis
Use MRM data to trigger the acquisition of product ion spectra– spectral data provides useful extra information about a suspect MRM
quantification result
©2012 Waters Corporation 35
©2012 Waters Corporation 36
CyclobenzaprineFW = 275.2
MRMs• Retention Time• Ion Ratio(s)(tracked and flaggedautomatically)
MS2 Scan
Product Ion SpectraForward Match ScoresReverse Match Scores
Peak @ 8.04 min
Spectrum of Peak @ 8.04 min
Multiple identification criteria improves confidence in results…

13
©2012 Waters Corporation 37
Now I understand –its so easy !
Carbon has a mass of 12 Hydrogen has a mass of 1 Oxygen has a mass of 16 Nitrogen has a mass of 14
Exact mass12.00001.007815.994914.0031
If such compounds can be mass measured with sufficient accuracy it is possible to determine elemental composition
A nominal mass instrument cannot distinguish these…requires “Hi-Res”
CO = 27.9949N2 = 28.0062C2H4 = 28.0312
The Basics of Exact Mass
©2012 Waters Corporation 38
ToF basics: What is ‘Time-of-Flight’ analysis?
ToF detectors– ToF analysers are VERY accurate clocks– Time taken to travel a specified path i.e. from A to B (flight tube) – The Time-of-Flight of a given ion depends directly upon on its mass-
to-charge ratio.– If the charge-state of an ion is known then the mass can be
determined from the time taken to complete the flight tube.
A
B
©2012 Waters Corporation 39
Benzoylecgonine (Precursor Ion)
Elemental Composition C16H19NO4
Carbon 16 x 12.00000 = 192.00000Hydrogen 19 x 1.007825 = 19.148675Nitrogen 1 x 14.003074 = 14.003074Oxygen 4 x 15.994915 = 63.97966
Exact mass [M+H]+ = m/z 290.1392
Both instruments areaccurately calibrated formass but resolution issignificantly different

14
Hair CocaineUPLC-TOF/MS
Sample Preparation20 mg washed hair, analyte specific deuterated IS pulverization with metal balls 4 min 1 hr extract at 60 oC in 1 mL methanol, microfilterdried and reconstituted in 100 µL starting mobile phaseInstrumentationUPLC: Waters Acquity UPLC HSS C18 150 x 2.1 mm, 1.8 μ, 50oC, 400 μL/min, 13-95% gradient 5.0mM NH4 formate pH3.0/acetonitrile 0.1% formate, 5 μL, 15 min run time Mass Spec: Waters Xevo G2 QTof, ESI+, cone 20V, source 120oC, capillary 1.5kV, cone N2 10 L/hr, desolvation 500oC, desolvation N2 800 L/hr, argon CE, high resolution 50-1000 m/z, lock mass mode (leucin enkephlin 20 μL/min, capillary 2 kV, CE 6eV), NaFormate cal.Ion PreparationMS Function 1 for precursor data with low collision energy 6 eVMSE Function 2 for fragment ion data with MSEcollision energy ramp (10-40 eV) QuantitationPrecursor ion analysis by isotope dilution technique
Calibration Curves 10 ng/mL = 500 pg/mg hair
42 Proprietary & Confidential
Orbitrap – Principle of Operation
z
φHyper-logarithmic potential distribution:
“ideal Kingdon trap”
r
Makarov A. Anal. Chem. 2000, 72, 1156-1162.
Characteristic frequencies:• Frequency of rotation ωφ
• Frequency of radial oscillations ωr
• Frequency of axial oscillations ωz
15
43 Proprietary & Confidential
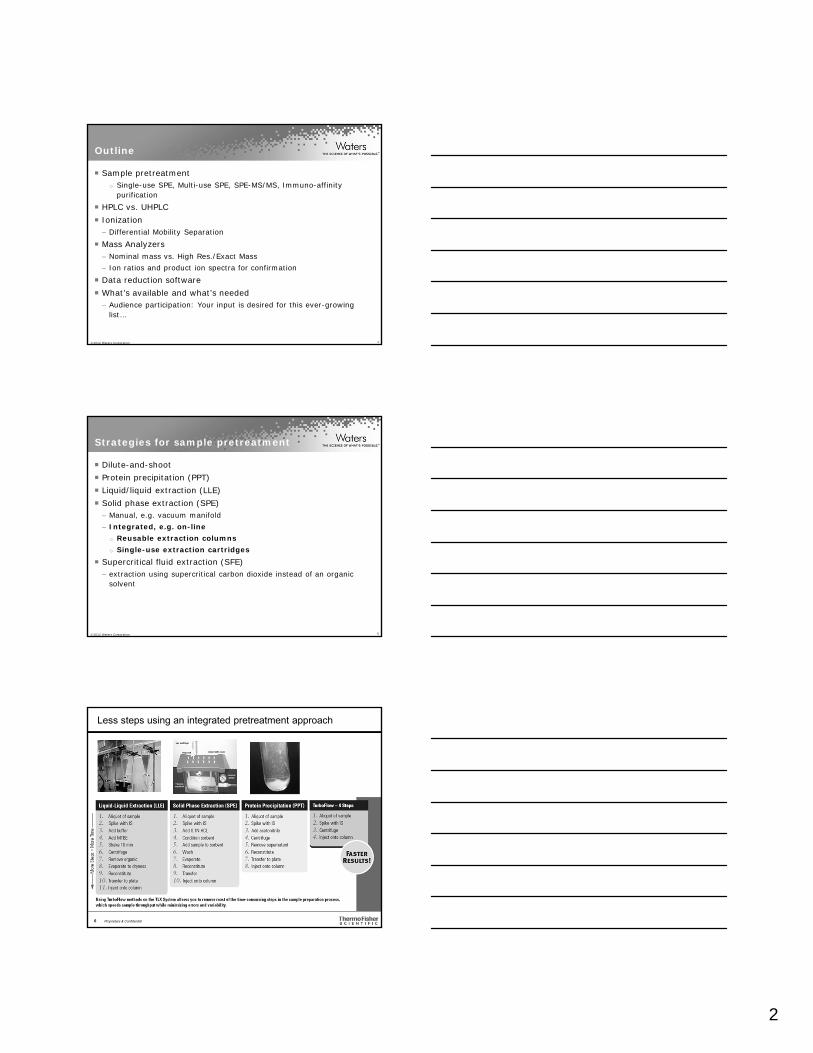
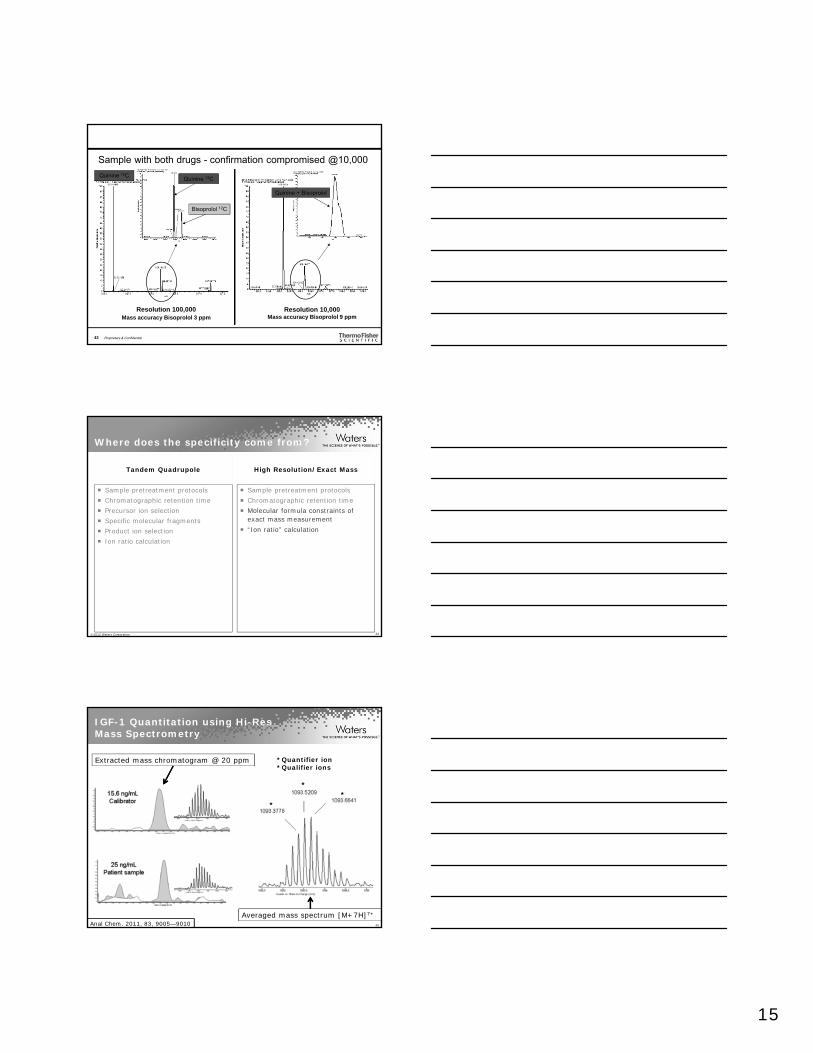
Benefit of resolution for co-eluting compound
Resolution 100,000Mass accuracy Bisoprolol 3 ppm
Resolution 10,000Mass accuracy Bisoprolol 9 ppm
Bisoprolol 12C
Quinine 13C
Quinine + BisoprololQuinine + Bisoprolol
Sample with both drugs - confirmation compromised @10,000
Quinine 12C
©2012 Waters Corporation 44
High Resolution/Exact MassTandem Quadrupole
Sample pretreatment protocols Chromatographic retention time Molecular formula constraints of
exact mass measurement “Ion ratio” calculation
Where does the specificity come from?
Sample pretreatment protocols Chromatographic retention time Precursor ion selection Specific molecular fragments Product ion selection Ion ratio calculation
©2012 Waters Corporation 45
IGF-1 Quantitation using Hi-Res Mass Spectrometry
**
*
*Quantifier ion*Qualifier ions
Extracted mass chromatogram @ 20 ppm
Averaged mass spectrum [M+7H]7+
Anal Chem. 2011, 83, 9005—9010

16
©2012 Waters Corporation 46
Things to look for in data reduction software.
Analyte confirmatory ion ratios (at least one ratio, > 1 desirable)
Concentrations above maximum reporting level (MRL) Signal-to-noise ratio Analyte or Internal Standard RT or RRT Analyte concentration below LOD or LOQ Standard Deviation of QCs too high r2 of calibration too low Internal Standard area Peak Quality (width, skewness, kurtosis)
©2012 Waters Corporation 47
What’s NeededWhat’s Available
Efficient sample pretreatment strategies
Integrated sample clean up / concentration
Reliable chromatography systems and columns
Sensitive, precise and reliable mass spectrometers
Data reduction software with limited “off the shelf” LIS integration
Some calibrators, controls, internal standards and pre-packaged reagents
©2012 Waters Corporation 48
Thank You – Questions?