Embed Size (px)
Citation preview
An Overview of High-Altitude Balloon Experiments at the Indian
Institute of Astrophysics
Margarita Safonova∗, Akshata Nayak†, A. G. Sreejith, Joice Mathew, Mayuresh Sarpotdar,S. Ambily, K. Nirmal, Sameer Talnikar, Shripathy Hadigal‡, Ajin Prakash and Jayant Murthy
Abstract
We have initiated the High-Altitude Ballooning pro-gramme at Indian Institute of Astrophysics, Banga-lore, in the year 2011 with the primary purpose ofdeveloping and flying low-cost scientific payloads ona balloon-borne platform. The main aim is the obser-vations of extended nearby objects (e.g. comets) andof diffuse sources (e.g. zodiacal light or airglow) withwide field of view (FOV) UV instruments from nearspace (20 to 30 km). A brief summary and the resultsof the tethered flights carried out at IIA CREST cam-pus are given in Ref. 1. Here we present an overviewof the nine free-flying balloon experiments conductedfrom March 2013 to November 2014. We describethe launch procedures, payloads, methods of track-ing and recovery. Since we fall in the light ballooncategory — payload weight is limited to less than 6kg — we use the 3-D printer to fabricate lightweightboxes and structures for our experiments. We dis-cuss the flight and scientific data obtained from dif-ferent launches and the development of the in-houselightweight sensors and controllers, as well as a fully-fledged 2-axis pointing and stabilization system, forthe flights.
Keywords: high-altitude balloons, scientific pay-loads, free-floating flights, upper atmosphere
∗For correspondence (E-mail: [email protected])†Akshata Nayak is a Ph.D. student at the Jain University,
Bangalore 562 112, India,‡Sameer Talnikar and Shripathy Hadigal at the time of writ-
ing were internship students at the Indian Institute of Astro-physics, Bangalore 560 034, India.
1 Introduction
Near space is the region of Earth’s atmosphere thatlies between 20 to 100 km above sea level, encompass-ing the stratosphere, mesosphere, and the lower ther-mosphere. There is a surge of interest in flying bal-loons to the edge of near space in recent years, largelyfor recreational and educational purposes due to themajor reduction in costs of all the involved compo-nents, from inexpensive latex balloons to easily avail-able lightweight, compact, and simple in operationmicro-electromechanical (MEM) devices. However,the same availability allows also to apply this to thescientific objectives, to do serious science at low cost.Though space observatories provide accurate obser-vations of remote or faint space sources, they are alsoprohibitively expensive and only affordable to largegovernmental agencies. Small telescopes/cameras on-board balloons or sounding rockets are attractive be-cause they are much cheaper and yet can yield sub-stantial scientific output; the first UV spectrum ofa quasar was obtained during a short rocket flight(Davidsen et al., 1977). We have initiated (Sree-jith et al., 2012) the High-Altitude Ballooning (HAB)programme at Indian Institute of Astrophysics (IIA),Bangalore, in the year 2011 with the primary purposeof developing and flying low-cost scientific payloadson a balloon-borne platform; an endeavor to enablecarrying out scientific space experiments and obser-vations at costs accessible to university departments.
Our science goals include studies of the phenomenaoccurring in the upper atmosphere in the ultraviolet(UV) range, of airglow and zodiacal light, and spec-troscopic UV observations of extended astronomical
1
objects such as, for example, comets, using the spec-trograph in the near-UV window from 200 to 400nm; the range that has been yet largely unexploredby the balloon (or the UV) community. This windowincludes the lines from several key players in atmo-spheric chemistry such as S02, O3, BrO, HCHO andallows to observe a strong OH signal (308 nm) in as-tronomical sources (also C2, CS, CO+
2 ). We are alsoplanning performing high-altitude astrobiological ex-periments, such as for example survival of microbesin upper atmosphere (David, 2013), or collection ofstratospheric samples to study the air/dust composi-tion, especially in view of the recent claims of detec-tion of extra-terrestrial cells in stratosphere (Narlikaret al., 2003). Despite the importance of this topicto astrobiology (stratospheric values of gas pressure,temperature, humidity and radiation are very simi-lar to the surface of Mars), stratospheric microbialdiversity/survival remains largely unexplored (Smithet al., 2010), probably due to significant difficultiesin the access and in ensuring the absence of ground–mid-atmospheric contaminations.Alongside our science objectives, we also intent on
developing our own experimental and scientific equip-ment for balloon-borne and eventual space flights. Akey requirement for HAB observations is the accurateand stable pointing platform, where the data can bestored for later retrieval or transmission. The chal-lenge is in doing this for an experiment where weightand power are strictly limited. We have designed andmanufactured a 2-axis stabilization system (Nirmalet al., 2015) to correct for payload random motions,where the crucial step is determination of the point-ing direction (Sreejith et al., 2014). For additionalaccuracy, we are developing a low-cost star tracker,where the attitude sensor is used for the initial coarsepointing (Sarpotdar et al., 2014). Development of theimage-intensified UV detector (Ambily et al., 2015)on telescopic system for spectroscopic (Sreejith et al.,2015) and imaging applications to fly onboard theballoon payload is also underway.Approvals from different airport and airforce agen-
cies are necessary to perform free-flying balloon ex-periments. These permissions have to be requestedat least 8 to 12 months before the beginning of theprogram. We have applied for these permissions in
2012, and have conducted our first free-flying balloonexperiment on March 3, 2013. In 2013–2014, we havecarried out a total of nine launches from CREST cam-pus of IIA, Hoskote region, Karnataka. There havebeen failures in recovery, working of the electronicsystems and even loose connections in wires duringflights. But we have learned from our experiencesand put together some successful flights. During thistime, we continued a parallel program of develop-ing the in-house low-cost scientific and technologicalequipment for our HAB programme. The followingsections give a detailed overview of these 9 launches.
2 Essentials for the balloonflights
2.1 Permissions necessary to carryout the launches
Since Bangalore is a hub of AirForce bases along withairports and flying training schools, we had to takeprior permissions from the Director General of CivilAviation (DGCA), Ministry of Defence (MoD), andAirports Authority of India (AAI), Delhi. In addi-tion, we require local permissions from HindustanAeronautics Limited (HAL), Bangalore InternationalAirport Limited (BIAL), Chennai airport as a south-ern region headquarters, Jakkur flying school, Yela-hanka AirForce Base, AirForce station at Chimneyhills, Bangalore. It is a regulation that we informthe abovementioned offices about the balloon launchtwo weeks in advance, specifying the payload details.Launches are only allowed after obtaining all the re-quired No-Objection Certificates (NOCs), and we cancarry out the flights only on a certain local non-flyingdays, currently on Sundays.
2.2 Balloons
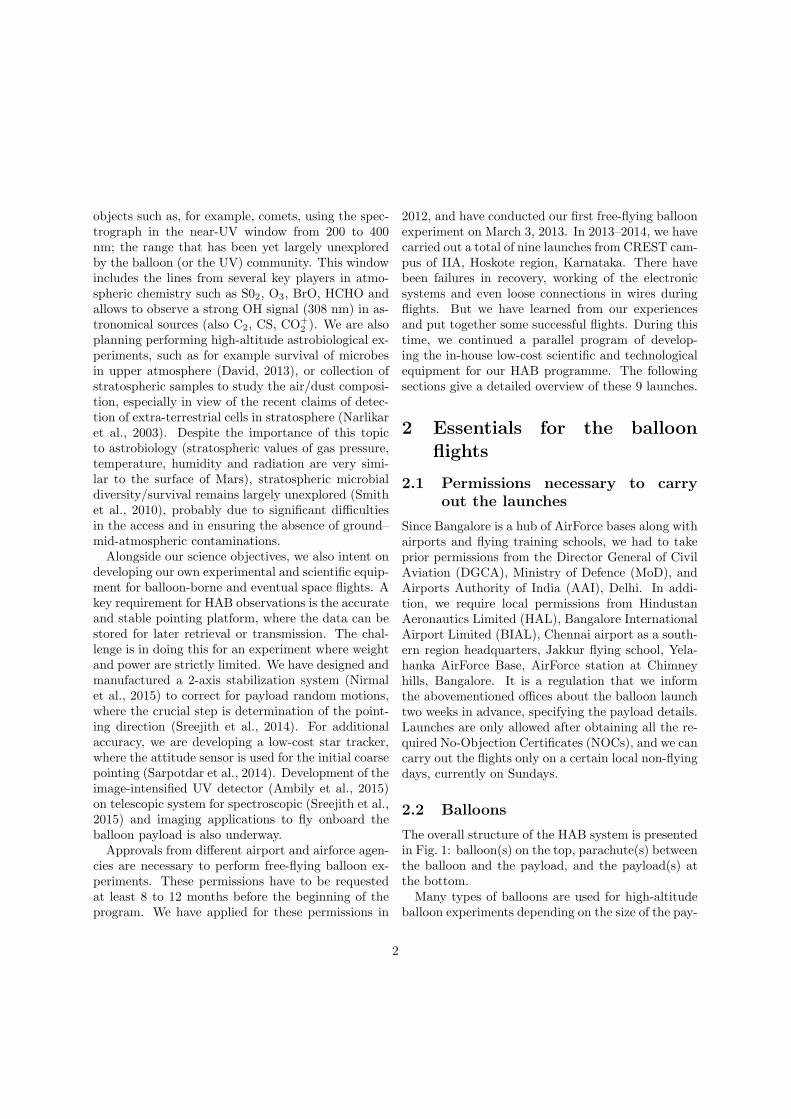
The overall structure of the HAB system is presentedin Fig. 1: balloon(s) on the top, parachute(s) betweenthe balloon and the payload, and the payload(s) atthe bottom.Many types of balloons are used for high-altitude
balloon experiments depending on the size of the pay-
2
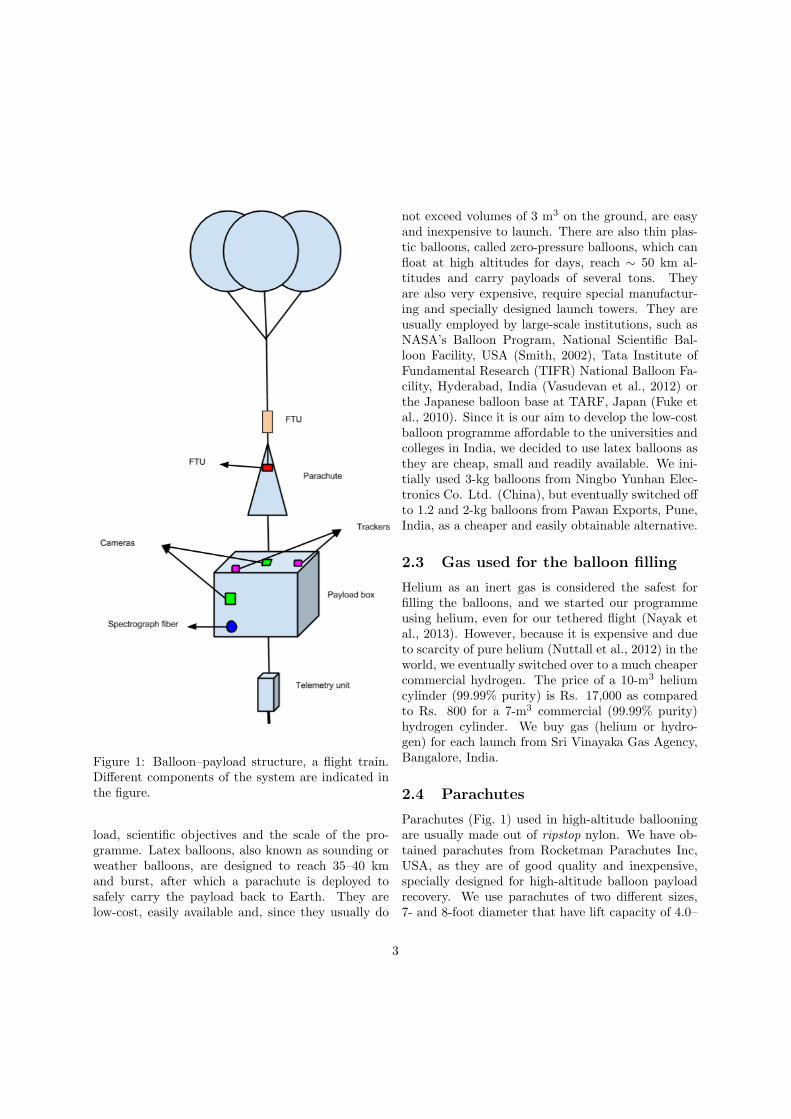
Figure 1: Balloon–payload structure, a flight train.Different components of the system are indicated inthe figure.
load, scientific objectives and the scale of the pro-gramme. Latex balloons, also known as sounding orweather balloons, are designed to reach 35–40 kmand burst, after which a parachute is deployed tosafely carry the payload back to Earth. They arelow-cost, easily available and, since they usually do
not exceed volumes of 3 m3 on the ground, are easyand inexpensive to launch. There are also thin plas-tic balloons, called zero-pressure balloons, which canfloat at high altitudes for days, reach ∼ 50 km al-titudes and carry payloads of several tons. Theyare also very expensive, require special manufactur-ing and specially designed launch towers. They areusually employed by large-scale institutions, such asNASA’s Balloon Program, National Scientific Bal-loon Facility, USA (Smith, 2002), Tata Institute ofFundamental Research (TIFR) National Balloon Fa-cility, Hyderabad, India (Vasudevan et al., 2012) orthe Japanese balloon base at TARF, Japan (Fuke etal., 2010). Since it is our aim to develop the low-costballoon programme affordable to the universities andcolleges in India, we decided to use latex balloons asthey are cheap, small and readily available. We ini-tially used 3-kg balloons from Ningbo Yunhan Elec-tronics Co. Ltd. (China), but eventually switched offto 1.2 and 2-kg balloons from Pawan Exports, Pune,India, as a cheaper and easily obtainable alternative.
2.3 Gas used for the balloon filling
Helium as an inert gas is considered the safest forfilling the balloons, and we started our programmeusing helium, even for our tethered flight (Nayak etal., 2013). However, because it is expensive and dueto scarcity of pure helium (Nuttall et al., 2012) in theworld, we eventually switched over to a much cheapercommercial hydrogen. The price of a 10-m3 heliumcylinder (99.99% purity) is Rs. 17,000 as comparedto Rs. 800 for a 7-m3 commercial (99.99% purity)hydrogen cylinder. We buy gas (helium or hydro-gen) for each launch from Sri Vinayaka Gas Agency,Bangalore, India.
2.4 Parachutes
Parachutes (Fig. 1) used in high-altitude ballooningare usually made out of ripstop nylon. We have ob-tained parachutes from Rocketman Parachutes Inc,USA, as they are of good quality and inexpensive,specially designed for high-altitude balloon payloadrecovery. We use parachutes of two different sizes,7- and 8-foot diameter that have lift capacity of 4.0–
3
4.9 kg and 5.4–6.8 kg, respectively. We also havesmall parachutes of 1-kg lift capacity from AeroconSystems Inc, USA. In some flights we connect theseparachutes serially.
2.5 Payload box
First Model The first payload model (Fig. 2,Left) was a rectangular structure made out of high-density Styrofoam with had dimensions of 20× 20×20 cm. The base was 2 inch thick, and each side 1inch thick. We wrapped the box in aluminum foilto provide the basic insulation, as well as the radarreflection. We, however, found that this shape gaverise to considerable spinning motion of the box.
Figure 2: Left: First model; Right: Second model.
Second Model The second stage of develop-ment was to overcome the disadvantages of the firststage. The shape was selected to be cubic (15×15×15cm) with wind-vane structure. The idea of havingsuch a design is to align the payload always in oneparticular direction i.e. along the wind direction tolimit the spinning of payload. This structure wasmade from lightweight plastic fibre and was open inthe bottom and top to allow movement of the airthrough the vanes (Fig. 2, Right). This payload struc-ture was much smaller and lighter than the first de-sign. The thickness of the base and the sides wasretained as in the previous model. However, the spin-ning motion was still substantial, and there was insuf-ficient insulation for the instruments inside the box.
Third Model The third and final model (Fig. 2,Right) was the one that has been used for actualflights. To provide the insulation we have used Kap-ton tape, which withstands a temperature down to−269◦C (Navick et al., 2004). The wind-vane struc-ture with the same dimensions, box material andthickness as in the second model was retained. How-ever, the top and bottom openings in the secondmodel were covered with Styrofoam. A suitable ringstructure was constructed to attach the payload tothe parachute; this ring structure also helped in re-ducing the spinning of the payload. This payloadwas covered with bright coloured tapes to be easilynoticeable during its recovery. We also pasted teammembers’ mobile numbers on the payload box in caseof it being found first by the public.
2.6 Flight Computer
For the initial flight, we used a BASIC STAMP 2microcontroller (MC) module-based flight computer.It was found insufficient to support the necessarysensors and computations and we later switched toa Single Board Computer (SBC). For this purpose,the Raspberry Pi (RPi) SBC that reads and con-trols the sensors, calculates the system’s attitude,and generates control commands, was developed in-house (Sreejith et al., 2014). It connects to a mi-croelectromechanical system (MEMS) 9-axis IMU(MPU-9150, inertial measurement unit, InvenSenseInc, USA, http://www.invensense.com) containingtwo chips: the MPU-6050, comprising a 3-axis gy-roscope, an accelerometer and a digital compass(Ak8975), and a Digital Motion Processor (DMP),which uses the proprietary InvenSense Digital motionfusionTM. This IMU is commonly used in a varietyof commercial applications including mobile phones,tablets and gaming platforms. The data stream fromthe MPU-9150 is fed into the I2C (Inter-IntegratedCircuit) port of the RPi. One of the great advan-tages of the RPi is the extensive library of open-source programs available for the platform. We usehere the open source code linux-mpu9150 (developedby the Pansenti software consultancy and develop-ment company, https://github.com/Pansenti/linux-mpu9150) to read the data from MPU-9150, com-
4

bine the magnetometer data with the data from twoother sensors, and calculate the attitude informationin terms of Euler angles.Celestial coordinates (RA and DEC) are calculated
using the position data (latitude and longitude of thepayload) obtained from the GPS sensor. We use a20-channel GPS receiver from iWave1 operating inthe L1 frequency band (1575.42 MHz), which givesaccuracy better than 10 meters on the ground and 20-30 meters in altitude. The entire system is poweredby a 5V lithium polymer battery (∼200 gms). Wehave written the C code to combine the Euler angleswith the GPS values and write the output in termsof RA and DEC to a file on a SD card. A photo ofthe sensor is shown in Fig. 3.
Figure 3: SBC with attitude sensor.
SBC interacts with different sensors and recordsdata (temperature, attitude etc) and images at reg-ular intervals throughout the flight on SD card. Italso keeps a record of housekeeping files to verify theperformance of the sensors onboard. The small size(85.6×56.5 mm) and low power consumption (5 V, 1A) of SBC makes it a suitable candidate for a flightcomputer.
2.7 Flight Termination Unit (FTU)
Balloons drift off if winds are high during the flight.To restrict the drift to another state or territory, we
1iWave Systems SiRF StarIII GSC3f GPS receiver, iWaveSystems, India, http://www.iwavesystems.com
have designed two independent FTUs for the bal-loon system. One system is based on a timer cir-cuit and placed below the parachute (Fig. 1) andthe other – Arduino-based system with a GPS – isplaced inside the main payload box. The FTU usesa thermal knife to cut the load line between the bal-loon and the parachute. We employ two types ofthe FTU systems. Details are described in the fileIn-HouseDevelopment.pdf available on our website:www.iiapballoongroup.wix.com/blue.
1. Timer-based FTUThis mechanism consists of a timer circuit whichis set for a duration of 2 to 3 hours dependingon the type of experiment. It is initialized justbefore we release the balloon. The timer systemis based on a tiny MC, which provides a trig-ger signal after the programmed time to heatup the nichrome wire wound across the load lineto melt it, severing it for the deployment of theparachute.
2. Geo-fencing based FTUThe geo-fencing system uses GPS to obtain lat-itude and longitude information. It sends anelectrical signal to trigger the relay circuit whichheats the nichrome wire to melt the load line, ifthe payload crosses the predefined latitude andlongitude.
2.8 Payload
Depending on the scientific and technical objectivesof every flight, the payloads differs. Some of theequipment is always present, such as camera, datasensors and tracking devices. Other equipment maybe a telescope, spectrograph, pointing and stabi-lization platform, special sensors such as a Geigercounter, or an astrobiological set-up.To capture the darkness of space, horizon and
travel path of the balloon, we decided to use a cameraonboard. Initially we used a Canon Ixus camera butfound it to be too heavy for our purposes (∼ 140 g,including batteries and memory card) and replaced itwith a tiny RPi camera (∼10 gms) programmed for aspecific exposure time. We eventually found it usefulto place two (or more) cameras onboard; one looking
5
up monitoring the balloons, and other(s) looking ei-ther horizontally sideways or down, depending on theflight objectives. Additional sensors that we usuallyinclude in the payload are the environmental sensors:temperature, pressure, humidity.
2.9 Flight Path Prediction
One–two days before the launch we calcu-late the balloon flight path using the Cam-bridge University Spaceflight Landing Predictor(http://predict.habhub.org/) together with our owncodes written in MATLAB and IDL. The onlinepredictor, as well as in-house developed codes, usedata from the NOAA GFS2 data and models forwind information. We calculate the atmosphericparameters from the standard model of atmosphere3,which is an atmospheric model of how the pres-sure, temperature, density etc. vary over a widerange of altitudes. It specifies a set of base values,variables and equations, from which atmosphericparameters at different height from mean sea levelcan be calculated. The balloon information to usein the simulations is provided by the manufacturer.All our codes with explanations and how-to-runinstructions are available on our website. Our launchsite (CREST campus, IIA) coordinates are 13.1131N, 77.8113 E, 960 m altitude.
3 Free-flying Balloon launches
3.1 Launch 1, (March 3, 2013)
This flight was our inception to the free-flying balloonexperiments. To keep it simple, we used a small cu-bical shaped box to house our payload (Fig. 2, Left).The goal for the first flight was to develop the pro-cedures for launching, tracking and recovering. Wewere also testing the electronic module and a GSM-based GPS tracker (SatGuide Tracker User Manual,SatNav Technologies, Hyderabad, India, 2012). It
2National Oceanic and AtmosphericAdministration Global Forecast System,http://www.nco.ncep.noaa.gov/pmb/products/gfs/.
3ISA,https://en.wikipedia.org/wiki/International Standard Atmosphere
was an early morning flight scheduled for 6:30 am.We have used 3.4 m3 of helium to fill the 1.2-kg bal-loon. The total weight of the payload was about 1kg, so we have used 1-kg lift capacity parachute fromKohli Enterprises, Delhi (a free-sample parachutegiven for this launch).
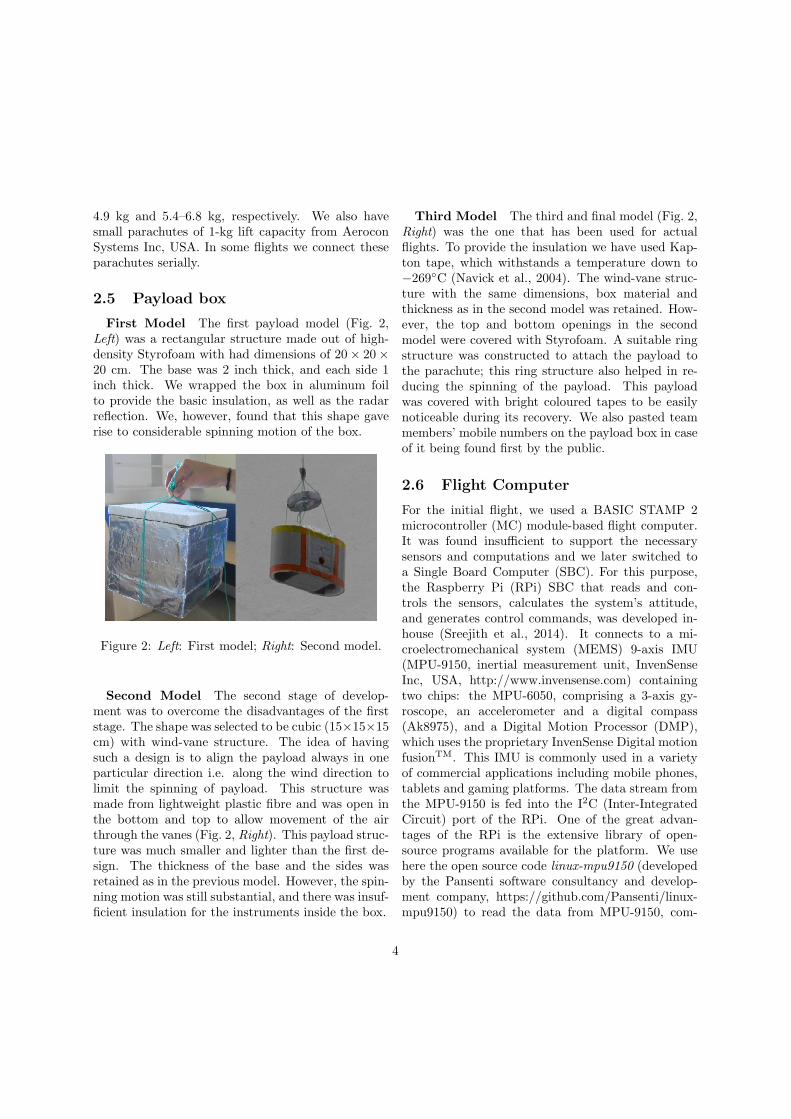
Predictions for the flight To enable safe recov-ery of the payload, we carried out predictions andfound the landing location to be near Malur, Kar-nataka (about 15 km from CREST campus). Fig. 4,plotted using Google Earth, shows the predicted pathas well as launch, burst and landing locations.
Figure 4: Prediction for Launch 1, March 3, 2013.
Payload Our first low-cost flight computer, BASICSTAMP 2 MC module of Parallax Inc (Fig. 5, Top),was developed in-house to measure atmospheric pa-rameters, such as pressure and temperature, alongwith latitude and longitude positions, using varioussensors. These parameters could be recorded ontoany USB device (e.g. pendrive). The bread-boardmodel of the MC was used for the flight. The latitudeand longitude positions could not be transmitted livebecause a radio license is required to carry out thelive transmission over a radio band. To track the bal-loon, we obtained a small GPS unit called Satguidetracker (Fig. 5, Bottom left), which worked on GSMsignals (Tata Docomo network). To capture images
6
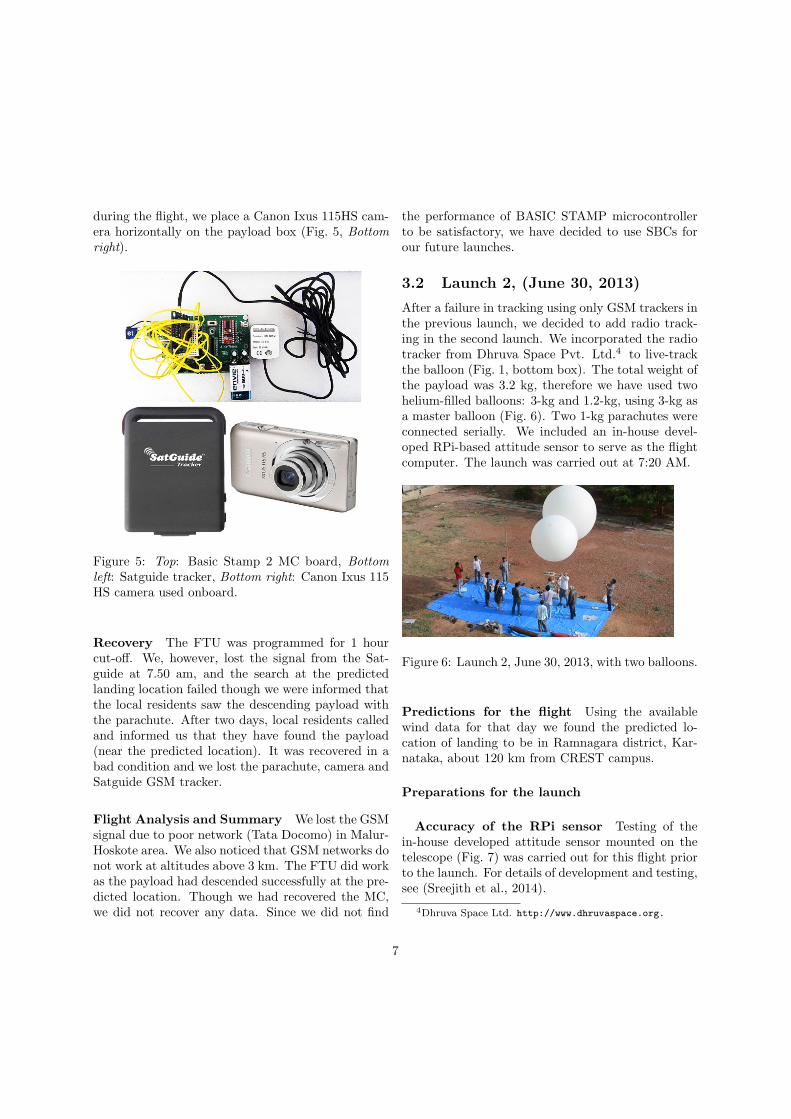
during the flight, we place a Canon Ixus 115HS cam-era horizontally on the payload box (Fig. 5, Bottomright).
Figure 5: Top: Basic Stamp 2 MC board, Bottomleft: Satguide tracker, Bottom right: Canon Ixus 115HS camera used onboard.
Recovery The FTU was programmed for 1 hourcut-off. We, however, lost the signal from the Sat-guide at 7.50 am, and the search at the predictedlanding location failed though we were informed thatthe local residents saw the descending payload withthe parachute. After two days, local residents calledand informed us that they have found the payload(near the predicted location). It was recovered in abad condition and we lost the parachute, camera andSatguide GSM tracker.
Flight Analysis and Summary We lost the GSMsignal due to poor network (Tata Docomo) in Malur-Hoskote area. We also noticed that GSM networks donot work at altitudes above 3 km. The FTU did workas the payload had descended successfully at the pre-dicted location. Though we had recovered the MC,we did not recover any data. Since we did not find
the performance of BASIC STAMP microcontrollerto be satisfactory, we have decided to use SBCs forour future launches.
3.2 Launch 2, (June 30, 2013)
After a failure in tracking using only GSM trackers inthe previous launch, we decided to add radio track-ing in the second launch. We incorporated the radiotracker from Dhruva Space Pvt. Ltd.4 to live-trackthe balloon (Fig. 1, bottom box). The total weight ofthe payload was 3.2 kg, therefore we have used twohelium-filled balloons: 3-kg and 1.2-kg, using 3-kg asa master balloon (Fig. 6). Two 1-kg parachutes wereconnected serially. We included an in-house devel-oped RPi-based attitude sensor to serve as the flightcomputer. The launch was carried out at 7:20 AM.
Figure 6: Launch 2, June 30, 2013, with two balloons.
Predictions for the flight Using the availablewind data for that day we found the predicted lo-cation of landing to be in Ramnagara district, Kar-nataka, about 120 km from CREST campus.
Preparations for the launch
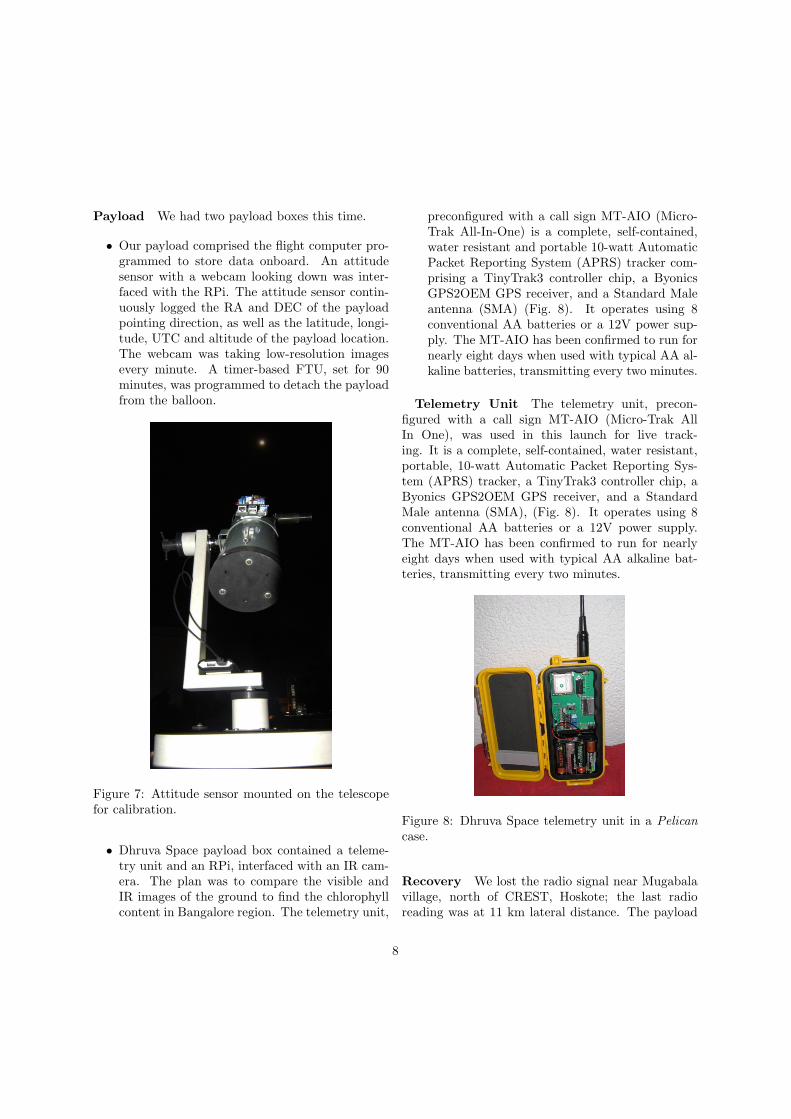
Accuracy of the RPi sensor Testing of thein-house developed attitude sensor mounted on thetelescope (Fig. 7) was carried out for this flight priorto the launch. For details of development and testing,see (Sreejith et al., 2014).
4Dhruva Space Ltd. http://www.dhruvaspace.org.
7
Payload We had two payload boxes this time.
• Our payload comprised the flight computer pro-grammed to store data onboard. An attitudesensor with a webcam looking down was inter-faced with the RPi. The attitude sensor contin-uously logged the RA and DEC of the payloadpointing direction, as well as the latitude, longi-tude, UTC and altitude of the payload location.The webcam was taking low-resolution imagesevery minute. A timer-based FTU, set for 90minutes, was programmed to detach the payloadfrom the balloon.
Figure 7: Attitude sensor mounted on the telescopefor calibration.
• Dhruva Space payload box contained a teleme-try unit and an RPi, interfaced with an IR cam-era. The plan was to compare the visible andIR images of the ground to find the chlorophyllcontent in Bangalore region. The telemetry unit,
preconfigured with a call sign MT-AIO (Micro-Trak All-In-One) is a complete, self-contained,water resistant and portable 10-watt AutomaticPacket Reporting System (APRS) tracker com-prising a TinyTrak3 controller chip, a ByonicsGPS2OEM GPS receiver, and a Standard Maleantenna (SMA) (Fig. 8). It operates using 8conventional AA batteries or a 12V power sup-ply. The MT-AIO has been confirmed to run fornearly eight days when used with typical AA al-kaline batteries, transmitting every two minutes.
Telemetry Unit The telemetry unit, precon-figured with a call sign MT-AIO (Micro-Trak AllIn One), was used in this launch for live track-ing. It is a complete, self-contained, water resistant,portable, 10-watt Automatic Packet Reporting Sys-tem (APRS) tracker, a TinyTrak3 controller chip, aByonics GPS2OEM GPS receiver, and a StandardMale antenna (SMA), (Fig. 8). It operates using 8conventional AA batteries or a 12V power supply.The MT-AIO has been confirmed to run for nearlyeight days when used with typical AA alkaline bat-teries, transmitting every two minutes.
Figure 8: Dhruva Space telemetry unit in a Pelicancase.
Recovery We lost the radio signal near Mugabalavillage, north of CREST, Hoskote; the last radioreading was at 11 km lateral distance. The payload
8

was recovered after two weeks near a small villagein Ramanagara district following a phone call fromlocal residents, near the predicted landing location.We recovered all the electronic components, exceptthe radio antenna, from the landing site.
Flight Analysis and Summary The objective ofthis flight was to test our attitude sensor and theradio communication link between the payload andground station provided by the Dhruva Space. Ra-dio signal was lost at 8:25 am, 1 hr after the launch,most probably due to the loss of the transmitting an-tenna. The last recorded altitude was 10 km (Fig. 9).However, the maximum altitude reached before thecut-off, as estimated from the ascent rate, was 22.3km.Our RPi failed 40 mins after the launch. The drop
in temperature might have caused the power supplybattery of the RPi to drain, probably because theelectronic module (EM) was not properly insulated.We, however, have used the available attitude sen-sor data to plot the azimuth and elevation of thepointing direction (Fig. 10). It can be seen that theazimuth and elevation were varying randomly. Weattribute these variations to the random nature ofwinds in the troposphere. Variation in the elevationwas smaller which indicates that the swinging mo-tion of the payload box was less pronounced. It ishere, in the lowest part of the troposphere, calledthe planetary boundary layer (PBL), that the atmo-sphere experiences maximum turbulence and strongwinds [Tong 2010].
Figure 9: Launch 2, June 30, 2013, GPS plot of theflight path.
Figure 10: Azimuth-Elevation variations recorded onLaunch 2, June 30, 2013. X-axis shows time of theflight in UT.
3.3 Launch 3, (September 3, 2013)
The September launch was a test flight in preparationto capture the images and UV spectra of the cometISON, which was to have a closest approach to theSun on November 28, 2013. The total weight of thepayload was 2.4 kg, therefore we used one helium-filled 3-kg balloon and two 1-kg parachutes connectedserially (Fig. 11). The launch was at 6.20 am and thepayload landed at 7.40 am.
Predictions for the flight The predicted landinglocation was 25 km from CREST campus in the southdirection, and the landing location was close to thepredicted (Fig. 12).
Preparation for the launch
Rope-ring mechanism In the previouslaunches, the payload was subjected to jerks duringthe release. To ensure smooth release of flight train,we decided to use a rope-ring mechanism. Thismechanism provided vertical suspension and stabil-ity of the payload at release. The rope connectedto two poles was passed through the ring. The
9
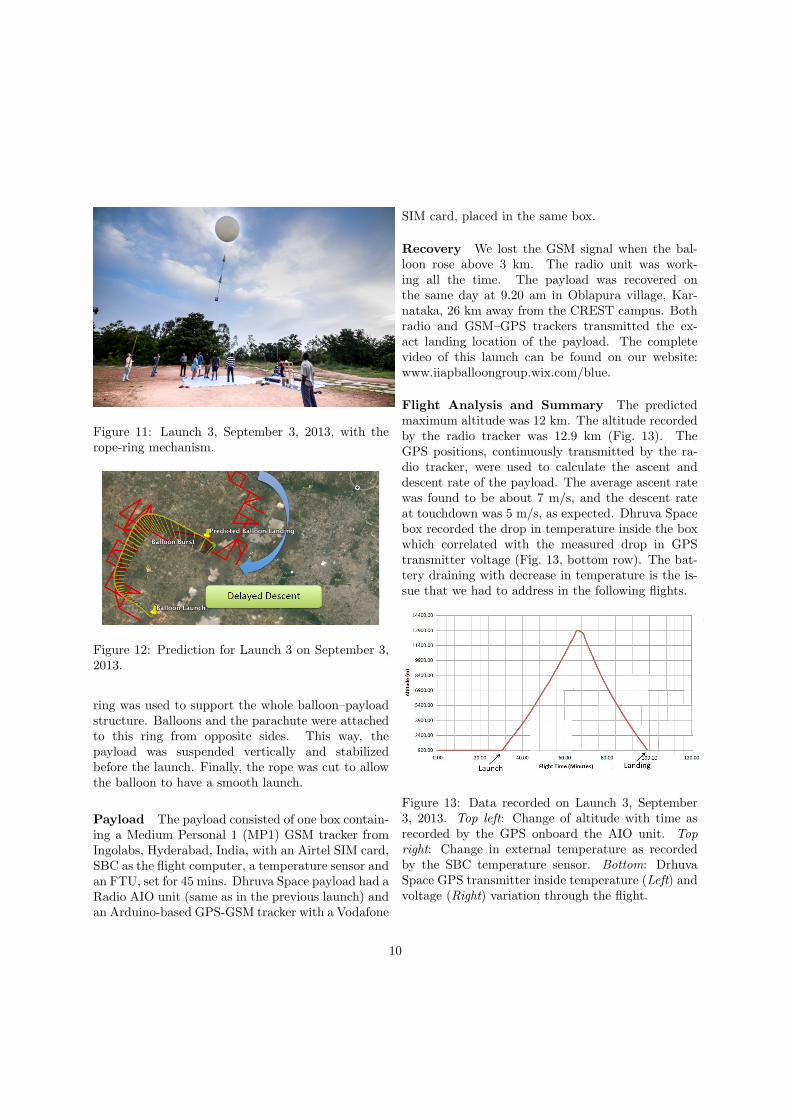
Figure 11: Launch 3, September 3, 2013, with therope-ring mechanism.
Figure 12: Prediction for Launch 3 on September 3,2013.
ring was used to support the whole balloon–payloadstructure. Balloons and the parachute were attachedto this ring from opposite sides. This way, thepayload was suspended vertically and stabilizedbefore the launch. Finally, the rope was cut to allowthe balloon to have a smooth launch.
Payload The payload consisted of one box contain-ing a Medium Personal 1 (MP1) GSM tracker fromIngolabs, Hyderabad, India, with an Airtel SIM card,SBC as the flight computer, a temperature sensor andan FTU, set for 45 mins. Dhruva Space payload had aRadio AIO unit (same as in the previous launch) andan Arduino-based GPS-GSM tracker with a Vodafone
SIM card, placed in the same box.
Recovery We lost the GSM signal when the bal-loon rose above 3 km. The radio unit was work-ing all the time. The payload was recovered onthe same day at 9.20 am in Oblapura village, Kar-nataka, 26 km away from the CREST campus. Bothradio and GSM–GPS trackers transmitted the ex-act landing location of the payload. The completevideo of this launch can be found on our website:www.iiapballoongroup.wix.com/blue.
Flight Analysis and Summary The predictedmaximum altitude was 12 km. The altitude recordedby the radio tracker was 12.9 km (Fig. 13). TheGPS positions, continuously transmitted by the ra-dio tracker, were used to calculate the ascent anddescent rate of the payload. The average ascent ratewas found to be about 7 m/s, and the descent rateat touchdown was 5 m/s, as expected. Dhruva Spacebox recorded the drop in temperature inside the boxwhich correlated with the measured drop in GPStransmitter voltage (Fig. 13, bottom row). The bat-tery draining with decrease in temperature is the is-sue that we had to address in the following flights.
Figure 13: Data recorded on Launch 3, September3, 2013. Top left: Change of altitude with time asrecorded by the GPS onboard the AIO unit. Topright: Change in external temperature as recordedby the SBC temperature sensor. Bottom: DrhuvaSpace GPS transmitter inside temperature (Left) andvoltage (Right) variation through the flight.
10
3.4 Launch 4, (October 13, 2013)
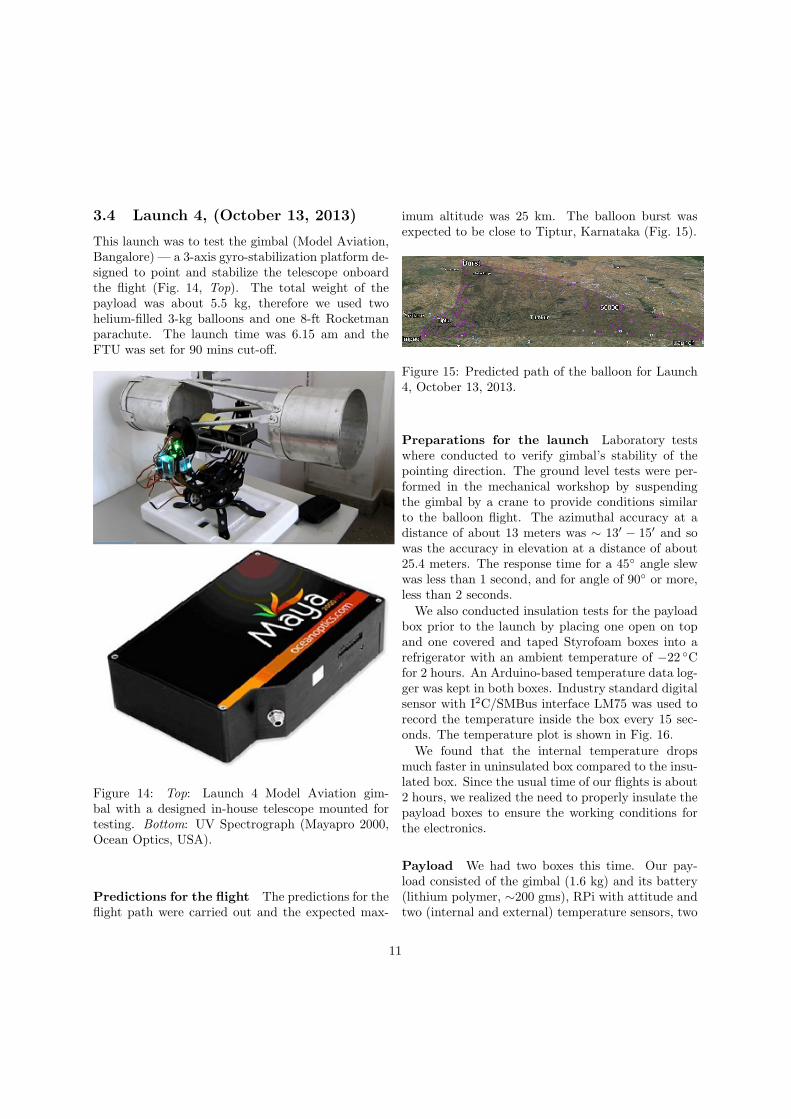
This launch was to test the gimbal (Model Aviation,Bangalore) — a 3-axis gyro-stabilization platform de-signed to point and stabilize the telescope onboardthe flight (Fig. 14, Top). The total weight of thepayload was about 5.5 kg, therefore we used twohelium-filled 3-kg balloons and one 8-ft Rocketmanparachute. The launch time was 6.15 am and theFTU was set for 90 mins cut-off.
Figure 14: Top: Launch 4 Model Aviation gim-bal with a designed in-house telescope mounted fortesting. Bottom: UV Spectrograph (Mayapro 2000,Ocean Optics, USA).
Predictions for the flight The predictions for theflight path were carried out and the expected max-
imum altitude was 25 km. The balloon burst wasexpected to be close to Tiptur, Karnataka (Fig. 15).
Figure 15: Predicted path of the balloon for Launch4, October 13, 2013.
Preparations for the launch Laboratory testswhere conducted to verify gimbal’s stability of thepointing direction. The ground level tests were per-formed in the mechanical workshop by suspendingthe gimbal by a crane to provide conditions similarto the balloon flight. The azimuthal accuracy at adistance of about 13 meters was ∼ 13� − 15� and sowas the accuracy in elevation at a distance of about25.4 meters. The response time for a 45◦ angle slewwas less than 1 second, and for angle of 90◦ or more,less than 2 seconds.We also conducted insulation tests for the payload
box prior to the launch by placing one open on topand one covered and taped Styrofoam boxes into arefrigerator with an ambient temperature of −22 ◦Cfor 2 hours. An Arduino-based temperature data log-ger was kept in both boxes. Industry standard digitalsensor with I2C/SMBus interface LM75 was used torecord the temperature inside the box every 15 sec-onds. The temperature plot is shown in Fig. 16.We found that the internal temperature drops
much faster in uninsulated box compared to the insu-lated box. Since the usual time of our flights is about2 hours, we realized the need to properly insulate thepayload boxes to ensure the working conditions forthe electronics.
Payload We had two boxes this time. Our pay-load consisted of the gimbal (1.6 kg) and its battery(lithium polymer, ∼200 gms), RPi with attitude andtwo (internal and external) temperature sensors, two
11
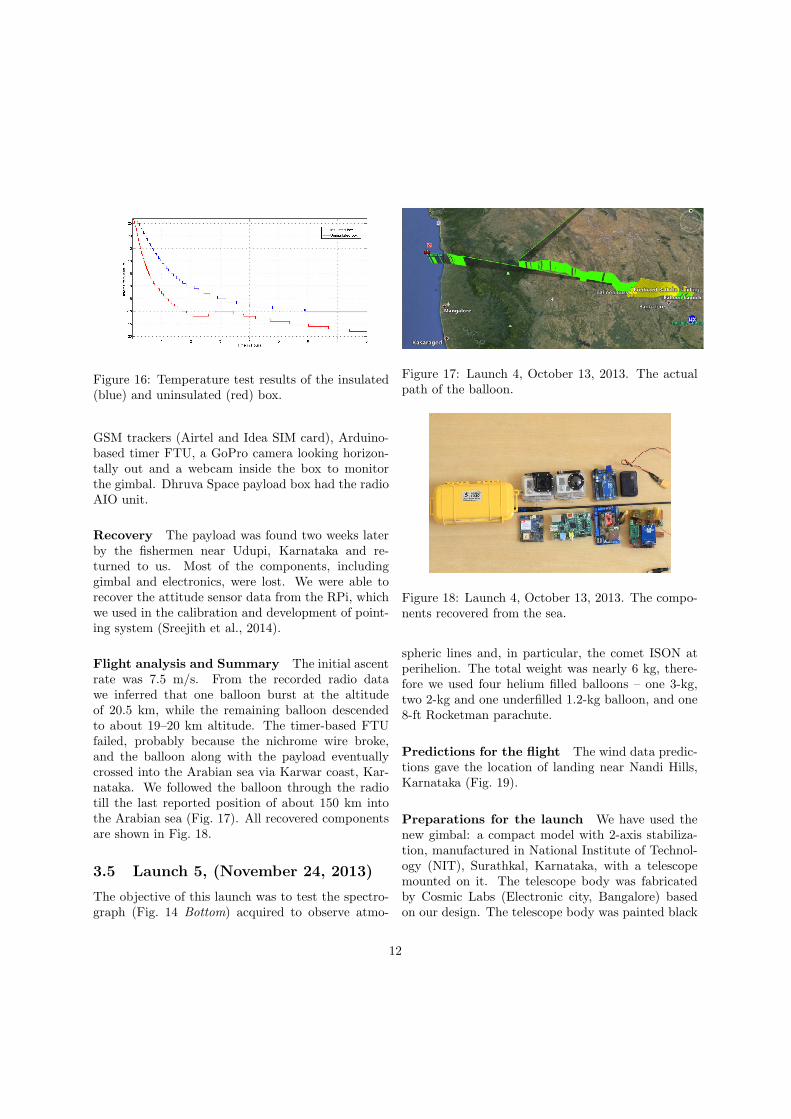
Figure 16: Temperature test results of the insulated(blue) and uninsulated (red) box.
GSM trackers (Airtel and Idea SIM card), Arduino-based timer FTU, a GoPro camera looking horizon-tally out and a webcam inside the box to monitorthe gimbal. Dhruva Space payload box had the radioAIO unit.
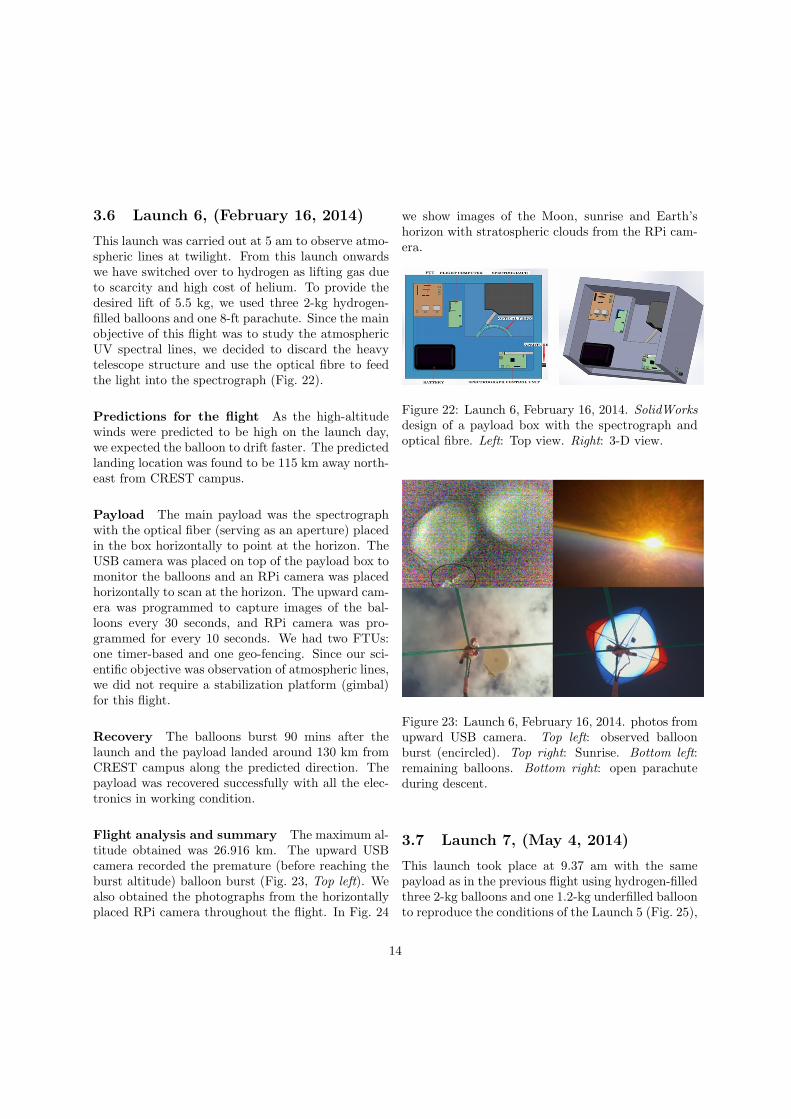
Recovery The payload was found two weeks laterby the fishermen near Udupi, Karnataka and re-turned to us. Most of the components, includinggimbal and electronics, were lost. We were able torecover the attitude sensor data from the RPi, whichwe used in the calibration and development of point-ing system (Sreejith et al., 2014).
Flight analysis and Summary The initial ascentrate was 7.5 m/s. From the recorded radio datawe inferred that one balloon burst at the altitudeof 20.5 km, while the remaining balloon descendedto about 19–20 km altitude. The timer-based FTUfailed, probably because the nichrome wire broke,and the balloon along with the payload eventuallycrossed into the Arabian sea via Karwar coast, Kar-nataka. We followed the balloon through the radiotill the last reported position of about 150 km intothe Arabian sea (Fig. 17). All recovered componentsare shown in Fig. 18.
3.5 Launch 5, (November 24, 2013)
The objective of this launch was to test the spectro-graph (Fig. 14 Bottom) acquired to observe atmo-
Figure 17: Launch 4, October 13, 2013. The actualpath of the balloon.
Figure 18: Launch 4, October 13, 2013. The compo-nents recovered from the sea.
spheric lines and, in particular, the comet ISON atperihelion. The total weight was nearly 6 kg, there-fore we used four helium filled balloons – one 3-kg,two 2-kg and one underfilled 1.2-kg balloon, and one8-ft Rocketman parachute.
Predictions for the flight The wind data predic-tions gave the location of landing near Nandi Hills,Karnataka (Fig. 19).
Preparations for the launch We have used thenew gimbal: a compact model with 2-axis stabiliza-tion, manufactured in National Institute of Technol-ogy (NIT), Surathkal, Karnataka, with a telescopemounted on it. The telescope body was fabricatedby Cosmic Labs (Electronic city, Bangalore) basedon our design. The telescope body was painted black
12
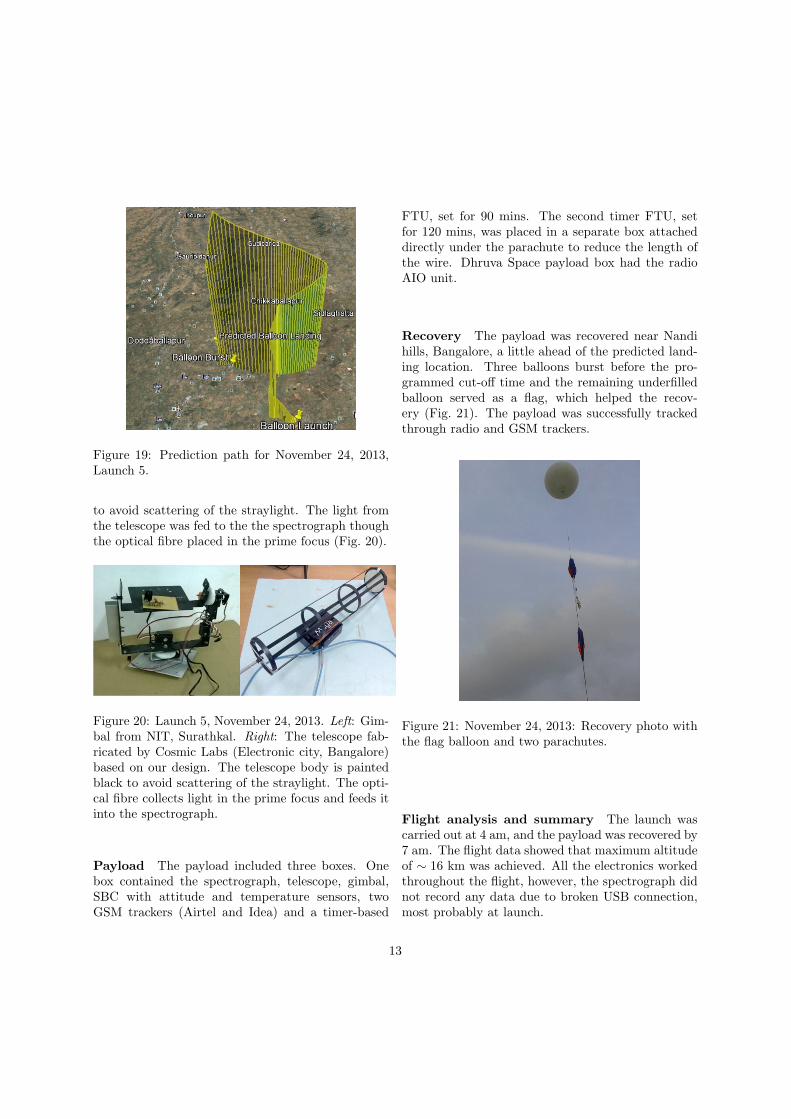
Figure 19: Prediction path for November 24, 2013,Launch 5.
to avoid scattering of the straylight. The light fromthe telescope was fed to the the spectrograph thoughthe optical fibre placed in the prime focus (Fig. 20).
Figure 20: Launch 5, November 24, 2013. Left: Gim-bal from NIT, Surathkal. Right: The telescope fab-ricated by Cosmic Labs (Electronic city, Bangalore)based on our design. The telescope body is paintedblack to avoid scattering of the straylight. The opti-cal fibre collects light in the prime focus and feeds itinto the spectrograph.
Payload The payload included three boxes. Onebox contained the spectrograph, telescope, gimbal,SBC with attitude and temperature sensors, twoGSM trackers (Airtel and Idea) and a timer-based
FTU, set for 90 mins. The second timer FTU, setfor 120 mins, was placed in a separate box attacheddirectly under the parachute to reduce the length ofthe wire. Dhruva Space payload box had the radioAIO unit.
Recovery The payload was recovered near Nandihills, Bangalore, a little ahead of the predicted land-ing location. Three balloons burst before the pro-grammed cut-off time and the remaining underfilledballoon served as a flag, which helped the recov-ery (Fig. 21). The payload was successfully trackedthrough radio and GSM trackers.
Figure 21: November 24, 2013: Recovery photo withthe flag balloon and two parachutes.
Flight analysis and summary The launch wascarried out at 4 am, and the payload was recovered by7 am. The flight data showed that maximum altitudeof ∼ 16 km was achieved. All the electronics workedthroughout the flight, however, the spectrograph didnot record any data due to broken USB connection,most probably at launch.
13
3.6 Launch 6, (February 16, 2014)
This launch was carried out at 5 am to observe atmo-spheric lines at twilight. From this launch onwardswe have switched over to hydrogen as lifting gas dueto scarcity and high cost of helium. To provide thedesired lift of 5.5 kg, we used three 2-kg hydrogen-filled balloons and one 8-ft parachute. Since the mainobjective of this flight was to study the atmosphericUV spectral lines, we decided to discard the heavytelescope structure and use the optical fibre to feedthe light into the spectrograph (Fig. 22).
Predictions for the flight As the high-altitudewinds were predicted to be high on the launch day,we expected the balloon to drift faster. The predictedlanding location was found to be 115 km away north-east from CREST campus.
Payload The main payload was the spectrographwith the optical fiber (serving as an aperture) placedin the box horizontally to point at the horizon. TheUSB camera was placed on top of the payload box tomonitor the balloons and an RPi camera was placedhorizontally to scan at the horizon. The upward cam-era was programmed to capture images of the bal-loons every 30 seconds, and RPi camera was pro-grammed for every 10 seconds. We had two FTUs:one timer-based and one geo-fencing. Since our sci-entific objective was observation of atmospheric lines,we did not require a stabilization platform (gimbal)for this flight.
Recovery The balloons burst 90 mins after thelaunch and the payload landed around 130 km fromCREST campus along the predicted direction. Thepayload was recovered successfully with all the elec-tronics in working condition.
Flight analysis and summary The maximum al-titude obtained was 26.916 km. The upward USBcamera recorded the premature (before reaching theburst altitude) balloon burst (Fig. 23, Top left). Wealso obtained the photographs from the horizontallyplaced RPi camera throughout the flight. In Fig. 24
we show images of the Moon, sunrise and Earth’shorizon with stratospheric clouds from the RPi cam-era.
Figure 22: Launch 6, February 16, 2014. SolidWorksdesign of a payload box with the spectrograph andoptical fibre. Left: Top view. Right: 3-D view.
Figure 23: Launch 6, February 16, 2014. photos fromupward USB camera. Top left: observed balloonburst (encircled). Top right: Sunrise. Bottom left:remaining balloons. Bottom right: open parachuteduring descent.
3.7 Launch 7, (May 4, 2014)
This launch took place at 9.37 am with the samepayload as in the previous flight using hydrogen-filledthree 2-kg balloons and one 1.2-kg underfilled balloonto reproduce the conditions of the Launch 5 (Fig. 25),
14
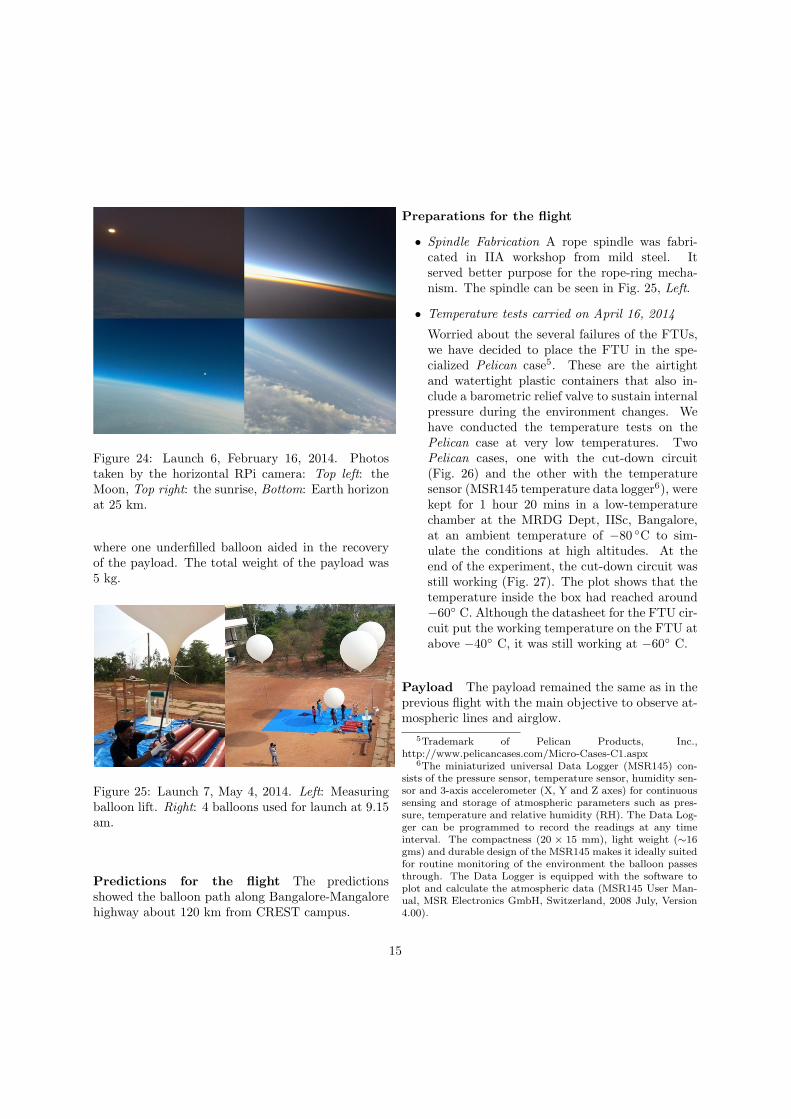
Figure 24: Launch 6, February 16, 2014. Photostaken by the horizontal RPi camera: Top left: theMoon, Top right: the sunrise, Bottom: Earth horizonat 25 km.
where one underfilled balloon aided in the recoveryof the payload. The total weight of the payload was5 kg.
Figure 25: Launch 7, May 4, 2014. Left: Measuringballoon lift. Right: 4 balloons used for launch at 9.15am.
Predictions for the flight The predictionsshowed the balloon path along Bangalore-Mangalorehighway about 120 km from CREST campus.
Preparations for the flight
• Spindle Fabrication A rope spindle was fabri-cated in IIA workshop from mild steel. Itserved better purpose for the rope-ring mecha-nism. The spindle can be seen in Fig. 25, Left.
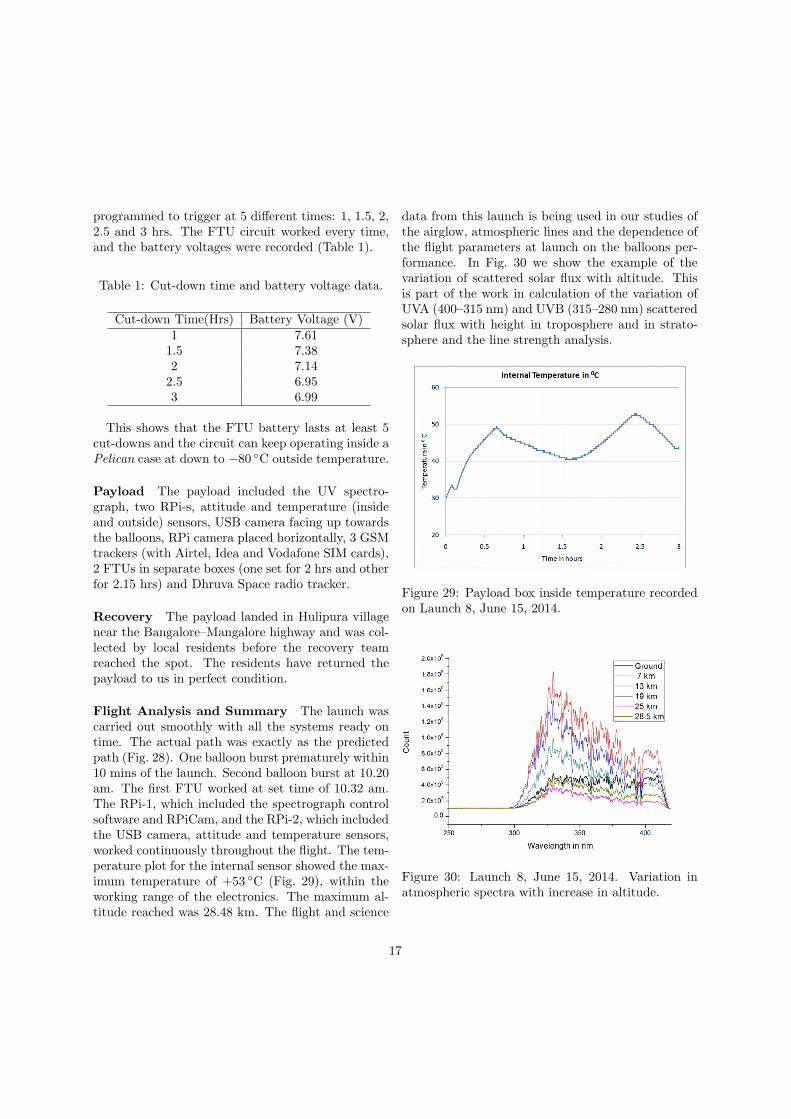
• Temperature tests carried on April 16, 2014Worried about the several failures of the FTUs,we have decided to place the FTU in the spe-cialized Pelican case5. These are the airtightand watertight plastic containers that also in-clude a barometric relief valve to sustain internalpressure during the environment changes. Wehave conducted the temperature tests on thePelican case at very low temperatures. TwoPelican cases, one with the cut-down circuit(Fig. 26) and the other with the temperaturesensor (MSR145 temperature data logger6), werekept for 1 hour 20 mins in a low-temperaturechamber at the MRDG Dept, IISc, Bangalore,at an ambient temperature of −80 ◦C to sim-ulate the conditions at high altitudes. At theend of the experiment, the cut-down circuit wasstill working (Fig. 27). The plot shows that thetemperature inside the box had reached around−60◦ C. Although the datasheet for the FTU cir-cuit put the working temperature on the FTU atabove −40◦ C, it was still working at −60◦ C.
Payload The payload remained the same as in theprevious flight with the main objective to observe at-mospheric lines and airglow.
5Trademark of Pelican Products, Inc.,http://www.pelicancases.com/Micro-Cases-C1.aspx
6The miniaturized universal Data Logger (MSR145) con-sists of the pressure sensor, temperature sensor, humidity sen-sor and 3-axis accelerometer (X, Y and Z axes) for continuoussensing and storage of atmospheric parameters such as pres-sure, temperature and relative humidity (RH). The Data Log-ger can be programmed to record the readings at any timeinterval. The compactness (20 × 15 mm), light weight (∼16gms) and durable design of the MSR145 makes it ideally suitedfor routine monitoring of the environment the balloon passesthrough. The Data Logger is equipped with the software toplot and calculate the atmospheric data (MSR145 User Man-ual, MSR Electronics GmbH, Switzerland, 2008 July, Version4.00).
15
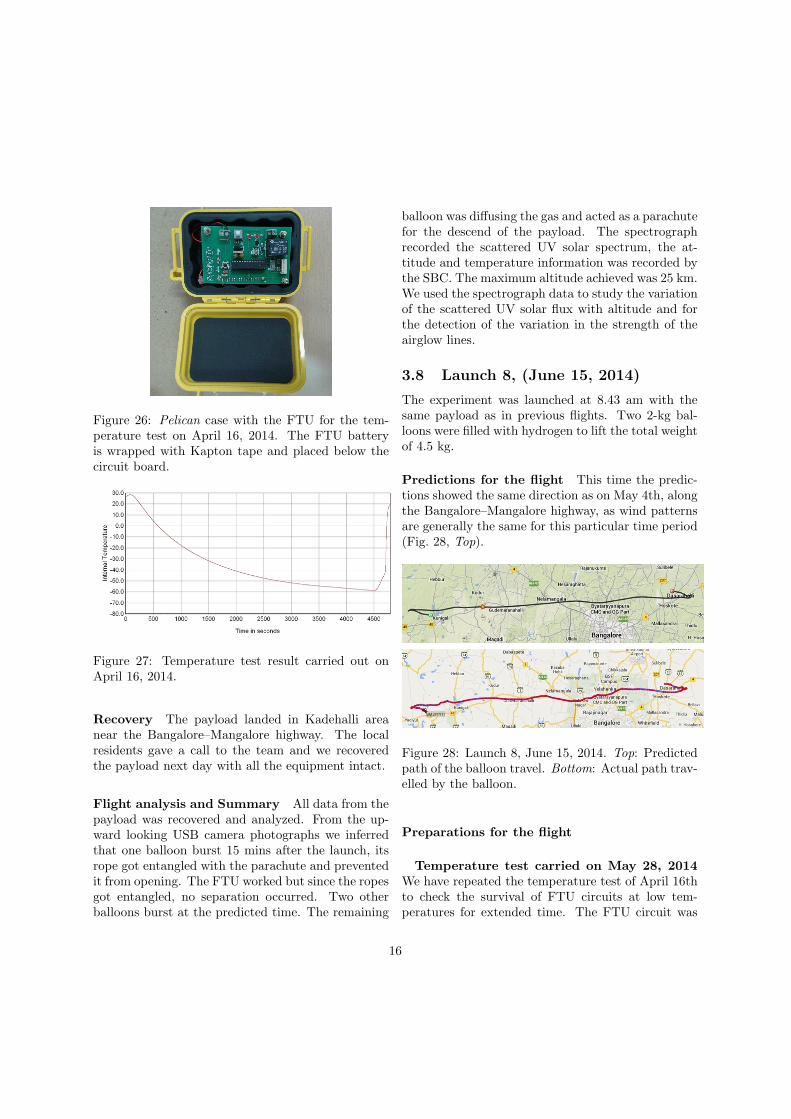
Figure 26: Pelican case with the FTU for the tem-perature test on April 16, 2014. The FTU batteryis wrapped with Kapton tape and placed below thecircuit board.
Figure 27: Temperature test result carried out onApril 16, 2014.
Recovery The payload landed in Kadehalli areanear the Bangalore–Mangalore highway. The localresidents gave a call to the team and we recoveredthe payload next day with all the equipment intact.
Flight analysis and Summary All data from thepayload was recovered and analyzed. From the up-ward looking USB camera photographs we inferredthat one balloon burst 15 mins after the launch, itsrope got entangled with the parachute and preventedit from opening. The FTU worked but since the ropesgot entangled, no separation occurred. Two otherballoons burst at the predicted time. The remaining
balloon was diffusing the gas and acted as a parachutefor the descend of the payload. The spectrographrecorded the scattered UV solar spectrum, the at-titude and temperature information was recorded bythe SBC. The maximum altitude achieved was 25 km.We used the spectrograph data to study the variationof the scattered UV solar flux with altitude and forthe detection of the variation in the strength of theairglow lines.
3.8 Launch 8, (June 15, 2014)
The experiment was launched at 8.43 am with thesame payload as in previous flights. Two 2-kg bal-loons were filled with hydrogen to lift the total weightof 4.5 kg.
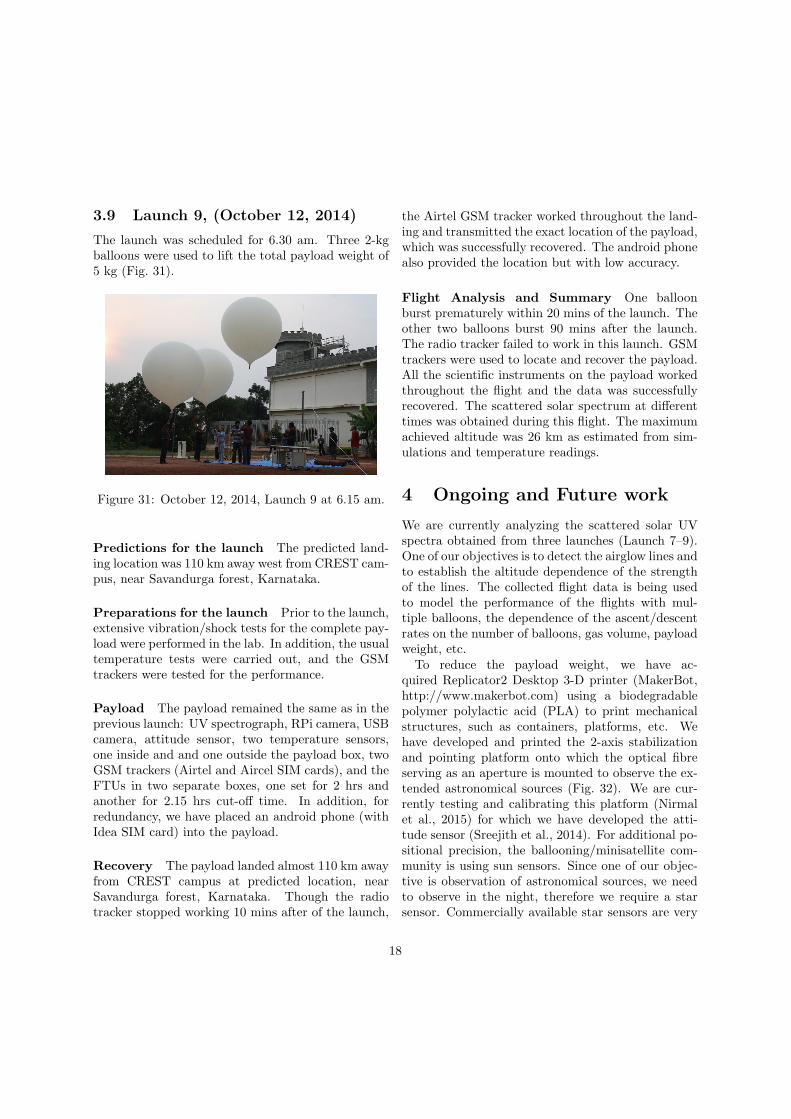
Predictions for the flight This time the predic-tions showed the same direction as on May 4th, alongthe Bangalore–Mangalore highway, as wind patternsare generally the same for this particular time period(Fig. 28, Top).
Figure 28: Launch 8, June 15, 2014. Top: Predictedpath of the balloon travel. Bottom: Actual path trav-elled by the balloon.
Preparations for the flight
Temperature test carried on May 28, 2014We have repeated the temperature test of April 16thto check the survival of FTU circuits at low tem-peratures for extended time. The FTU circuit was
16
programmed to trigger at 5 different times: 1, 1.5, 2,2.5 and 3 hrs. The FTU circuit worked every time,and the battery voltages were recorded (Table 1).
Table 1: Cut-down time and battery voltage data.
Cut-down Time(Hrs) Battery Voltage (V)1 7.611.5 7.382 7.142.5 6.953 6.99
This shows that the FTU battery lasts at least 5cut-downs and the circuit can keep operating inside aPelican case at down to −80 ◦C outside temperature.
Payload The payload included the UV spectro-graph, two RPi-s, attitude and temperature (insideand outside) sensors, USB camera facing up towardsthe balloons, RPi camera placed horizontally, 3 GSMtrackers (with Airtel, Idea and Vodafone SIM cards),2 FTUs in separate boxes (one set for 2 hrs and otherfor 2.15 hrs) and Dhruva Space radio tracker.
Recovery The payload landed in Hulipura villagenear the Bangalore–Mangalore highway and was col-lected by local residents before the recovery teamreached the spot. The residents have returned thepayload to us in perfect condition.
Flight Analysis and Summary The launch wascarried out smoothly with all the systems ready ontime. The actual path was exactly as the predictedpath (Fig. 28). One balloon burst prematurely within10 mins of the launch. Second balloon burst at 10.20am. The first FTU worked at set time of 10.32 am.The RPi-1, which included the spectrograph controlsoftware and RPiCam, and the RPi-2, which includedthe USB camera, attitude and temperature sensors,worked continuously throughout the flight. The tem-perature plot for the internal sensor showed the max-imum temperature of +53 ◦C (Fig. 29), within theworking range of the electronics. The maximum al-titude reached was 28.48 km. The flight and science
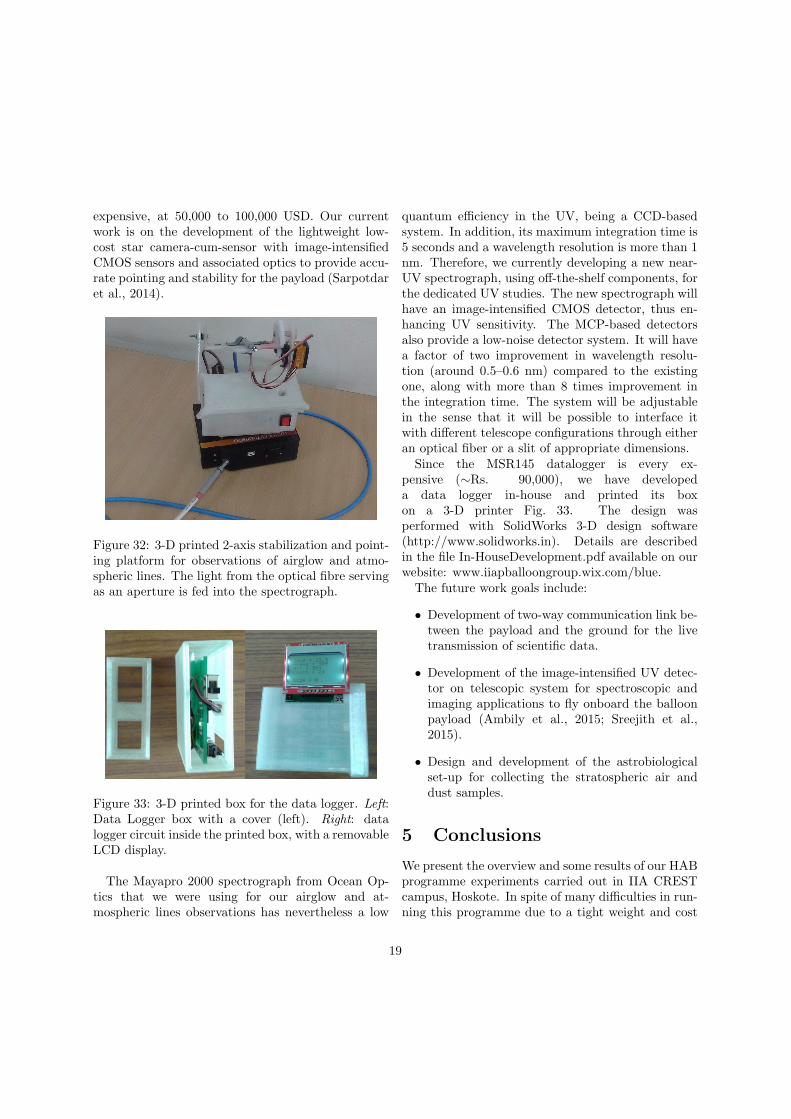
data from this launch is being used in our studies ofthe airglow, atmospheric lines and the dependence ofthe flight parameters at launch on the balloons per-formance. In Fig. 30 we show the example of thevariation of scattered solar flux with altitude. Thisis part of the work in calculation of the variation ofUVA (400–315 nm) and UVB (315–280 nm) scatteredsolar flux with height in troposphere and in strato-sphere and the line strength analysis.
Figure 29: Payload box inside temperature recordedon Launch 8, June 15, 2014.
Figure 30: Launch 8, June 15, 2014. Variation inatmospheric spectra with increase in altitude.
17
3.9 Launch 9, (October 12, 2014)
The launch was scheduled for 6.30 am. Three 2-kgballoons were used to lift the total payload weight of5 kg (Fig. 31).
Figure 31: October 12, 2014, Launch 9 at 6.15 am.
Predictions for the launch The predicted land-ing location was 110 km away west from CREST cam-pus, near Savandurga forest, Karnataka.
Preparations for the launch Prior to the launch,extensive vibration/shock tests for the complete pay-load were performed in the lab. In addition, the usualtemperature tests were carried out, and the GSMtrackers were tested for the performance.
Payload The payload remained the same as in theprevious launch: UV spectrograph, RPi camera, USBcamera, attitude sensor, two temperature sensors,one inside and and one outside the payload box, twoGSM trackers (Airtel and Aircel SIM cards), and theFTUs in two separate boxes, one set for 2 hrs andanother for 2.15 hrs cut-off time. In addition, forredundancy, we have placed an android phone (withIdea SIM card) into the payload.
Recovery The payload landed almost 110 km awayfrom CREST campus at predicted location, nearSavandurga forest, Karnataka. Though the radiotracker stopped working 10 mins after of the launch,
the Airtel GSM tracker worked throughout the land-ing and transmitted the exact location of the payload,which was successfully recovered. The android phonealso provided the location but with low accuracy.
Flight Analysis and Summary One balloonburst prematurely within 20 mins of the launch. Theother two balloons burst 90 mins after the launch.The radio tracker failed to work in this launch. GSMtrackers were used to locate and recover the payload.All the scientific instruments on the payload workedthroughout the flight and the data was successfullyrecovered. The scattered solar spectrum at differenttimes was obtained during this flight. The maximumachieved altitude was 26 km as estimated from sim-ulations and temperature readings.
4 Ongoing and Future work
We are currently analyzing the scattered solar UVspectra obtained from three launches (Launch 7–9).One of our objectives is to detect the airglow lines andto establish the altitude dependence of the strengthof the lines. The collected flight data is being usedto model the performance of the flights with mul-tiple balloons, the dependence of the ascent/descentrates on the number of balloons, gas volume, payloadweight, etc.To reduce the payload weight, we have ac-
quired Replicator2 Desktop 3-D printer (MakerBot,http://www.makerbot.com) using a biodegradablepolymer polylactic acid (PLA) to print mechanicalstructures, such as containers, platforms, etc. Wehave developed and printed the 2-axis stabilizationand pointing platform onto which the optical fibreserving as an aperture is mounted to observe the ex-tended astronomical sources (Fig. 32). We are cur-rently testing and calibrating this platform (Nirmalet al., 2015) for which we have developed the atti-tude sensor (Sreejith et al., 2014). For additional po-sitional precision, the ballooning/minisatellite com-munity is using sun sensors. Since one of our objec-tive is observation of astronomical sources, we needto observe in the night, therefore we require a starsensor. Commercially available star sensors are very
18
expensive, at 50,000 to 100,000 USD. Our currentwork is on the development of the lightweight low-cost star camera-cum-sensor with image-intensifiedCMOS sensors and associated optics to provide accu-rate pointing and stability for the payload (Sarpotdaret al., 2014).
Figure 32: 3-D printed 2-axis stabilization and point-ing platform for observations of airglow and atmo-spheric lines. The light from the optical fibre servingas an aperture is fed into the spectrograph.
Figure 33: 3-D printed box for the data logger. Left:Data Logger box with a cover (left). Right: datalogger circuit inside the printed box, with a removableLCD display.
The Mayapro 2000 spectrograph from Ocean Op-tics that we were using for our airglow and at-mospheric lines observations has nevertheless a low
quantum efficiency in the UV, being a CCD-basedsystem. In addition, its maximum integration time is5 seconds and a wavelength resolution is more than 1nm. Therefore, we currently developing a new near-UV spectrograph, using off-the-shelf components, forthe dedicated UV studies. The new spectrograph willhave an image-intensified CMOS detector, thus en-hancing UV sensitivity. The MCP-based detectorsalso provide a low-noise detector system. It will havea factor of two improvement in wavelength resolu-tion (around 0.5–0.6 nm) compared to the existingone, along with more than 8 times improvement inthe integration time. The system will be adjustablein the sense that it will be possible to interface itwith different telescope configurations through eitheran optical fiber or a slit of appropriate dimensions.Since the MSR145 datalogger is every ex-
pensive (∼Rs. 90,000), we have developeda data logger in-house and printed its boxon a 3-D printer Fig. 33. The design wasperformed with SolidWorks 3-D design software(http://www.solidworks.in). Details are describedin the file In-HouseDevelopment.pdf available on ourwebsite: www.iiapballoongroup.wix.com/blue.The future work goals include:
• Development of two-way communication link be-tween the payload and the ground for the livetransmission of scientific data.
• Development of the image-intensified UV detec-tor on telescopic system for spectroscopic andimaging applications to fly onboard the balloonpayload (Ambily et al., 2015; Sreejith et al.,2015).
• Design and development of the astrobiologicalset-up for collecting the stratospheric air anddust samples.
5 Conclusions
We present the overview and some results of our HABprogramme experiments carried out in IIA CRESTcampus, Hoskote. In spite of many difficulties in run-ning this programme due to a tight weight and cost
19
budget, we show that it is still possible to achievescientific results. The instruments used in these ex-periments usually give satisfactory results, and wecontinue our parallel programme of instrument devel-opment. We use the GPS trackers along with radioand generally follow the balloon path for payloads re-trievals. Our experience show that our predictions forthe balloon/payload path are generally correct andthe payloads are always found close to the predictedlocations.
Acknowledgments:
The authors are thankful to Air Force stations(Mekhri Circle, Yelahanka, Chimney Hills, Banga-lore), HAL, Chennai Airport Authorities and JakkurAerodrome for providing the necessary NOC to carryout our free-flying balloon experiments. Authorsthank Dr. Annapoorni Rangarajan and studentsof her laboratory, MRDG, IISc, for providing low-temperature chamber facilities for temperature testsand a UV-lamp for spectrograph calibration.
References
Nayak A., Sreejith A.G., Safonova M., Murthy J.,(2013) High-altitude ballooning programme at theIndian Institute of Astrophysics. Current Science,104: 708-713
Davidsen A.F., Hartig G.F., Fastie W.G. (1977) Ul-traviolet spectrum of quasi-stellar object 3C273.Nature 269: 203 cite
Sreejith A.G., Nayak A., Murthy J. (2012) Bal-loon Observations at the Indian Institute of Astro-physics. 39th COSPAR Scientific Assembly, Aug.2012, Mysore, India. TFS-C-057PSB.1-0043-12,COSPAR Abstract Book, p. 234
David J.S. (2013) Microbes in the Upper Atmosphereand Unique Opportunities for Astrobiology Re-search. Astrobiology. 13(10): 981-990
Narlikar J.V., Lloyd D., Wickramasinghe N.C., Har-ris M.J., Turner M.P., Al-Mufti S., Wallis M.K.,
Wainwright M., Rajaratnam P., Shivaji S., ReddyG.S.N., Ramadurai S., Hoyle F. (2003) A BalloonExperiment to detect Microorganisms in the OuterSpace. Astrophysics and Space Science, 285: 555-562
Smith D.J., Griffin D.W., Schuerger A.C. (2010)Stratospheric microbiology at 20 km over the Pa-cific Ocean. Aerobiologia 26: 35-46
Nirmal K., Sreejith A.G., Mathew J., Sarpotdar M.,Ambily S., Safonova M., Murthy J. (2015) Pointingsystem for the balloon borne telescope. The 33rdMeeting of the ASI, Feb. 2013, NCRA, Pune
Sreejith A.G., Mathew J., Sarpotdar M., Mohan R.,Nayak A., Safonova M., Murthy J. (2014) A Rasp-berry Pi-Based Attitude Sensor. Journal of Astro-nomical Instrumentation, 3, 1440006: 1-10
Tong W. (2010) Wind Power Generation and WindTurbine Design. Kollmorgen Corp. USA
Sarpotdar M., Murthy J. and Agarwal V.K. (2014)Development of a Miniature Star Sensor. XXXIIMeeting of the Astronomical Society of India,March 20-24, 2014, Mohali
Ambily S., Mayuresh S., Mathew J., Sreejith A.G.,Nirmal K., Safonova M. and Murthy J. (2015)Development of Detectors for Balloon and SpaceFlights. Proc. Golden Jubilee (XXXIX) Conferenceof the Optical Society of India, February 20-22,2015, Calcutta
Sreejith A.G., Safonova M. and Murthy J. (2015)Near ultraviolet spectrograph for balloon platform.Proc. SPIE 9654, International Conference on Op-tics and Photonics 2015, 96540D
Vasudevan R., Sreenivasan S., Suneel K.B. andKulkarni P.M. (2012) Report on the Activitiesof National Balloon Facility, Hyderabad. 39thCOSPAR Scientific Assembly, 39, 2061
Fuke H., Akita D., Iijima I., Izutsu N., Kato Y.,Kawada J., Matsuzaka Y., Mizuta E., Namiki M.,Nonaka N., Ohta S., Saito Y., Seo M., Takada A.,Tamura K., Toriumi M., Yamada K., Yamagami
20
T. and Yoshida T. (2010) A new balloon base inJapan. Advances in Space Research, 45: 490-497
Smith I.S. (2002) The NASA balloon program: anoverview. Advances in Space Research, 30: 1087-1094
Nuttall W.J., Clarke R.H. and Glowacki B.A. (2012)Resources: Stop squandering helium. Nature, 485,7400: 573575
Navick X.-F., Carty M., Chapellier M., Chardin G.,Goldbach C., Granelli R., Herve S., Karolak M.,Nollez G., Nizery F., Riccio C., Starzynski P. andVillar V. (2004) Fabrication of ultra-low radioac-tivity detector holders for Edelweiss-II. Nuclear In-struments and Methods, A 520: 189-192.
21