Embed Size (px)
Citation preview

Analyst
MINIREVIEW
Cite this: Analyst, 2020, 145, 6211
Received 4th May 2020,Accepted 24th July 2020
DOI: 10.1039/d0an00891e
rsc.li/analyst
An overview of therapeutic anticancer drugmonitoring based on surface enhanced(resonance) Raman spectroscopy (SE(R)RS)
Chunchun Li, Ziwei Ye, Yikai Xu * and Steven E. J. Bell *
Therapeutic drug monitoring (TDM) is important for many therapeutic regimens and has particular rele-
vance for anticancer drugs which often have serious effects and whose optimum dosage can vary signifi-
cantly between different patients. Many of the features of surface enhanced (resonance) Raman spec-
troscopy (SE(R)RS) suggest it should be very suitable for TDM of anticancer drugs and some initial studies
which explore the potential of SE(R)RS for TDM of anticancer drugs have been published. This review brings
this work together in an attempt to draw some general observations about key aspects of the approach,
including the nature of the substrate used, matrix interference effects and factors governing adsorption of
the target molecules onto the enhancing surface. There is now sufficient evidence to suggest that none of
these pose real difficulties in the context of TDM. However, some issues, particularly the need to carry out
multiplex measurements for TDM of combination therapies, have yet to be addressed.
Introduction
Many therapeutic anticancer drugs have serious side effects,causing damage to normal tissues and organs.1,2 This meansthat the treatment dosage needs to be optimized by balancingthe need to provide the highest efficacy against minimisingtoxicity.3,4 For many drugs, the dosage is easy to adjust
because there is a large difference between the effective doseand the levels giving toxicity. However, there are still a numberof anticancer drugs for which the optimal dosage is hard todefine due to their narrow therapeutic range. In addition, theresponse and toxicity of drugs in individual patients are quitedifferent from aqueous environment so the various parametersof those drugs, pharmacokinetics and pharmacodynamics forexample, are extremely valuable to study.5
Therapeutic drug monitoring (TDM) is a key method inclinical chemistry and clinical pharmacology, which aims ataccurately measuring the concentrations of medication in
Chunchun Li
Chunchun Li obtained her BSc in2017 from East China Universityof Science and Technology inApplied Chemistry. Currently,she is a PhD student in chemistryunder supervision of Prof. StevenE. J. Bell at Queen’s UniversityBelfast. Her research focuses onunderstanding molecular adsorp-tion and related phenomenon onnoble metal nanomaterial sur-faces via SE(R)RS for the con-struction of nanomaterials withtailored surface properties.
Ziwei Ye
Dr Ziwei Ye received his BSdegree in applied chemistry atEast China University of Scienceand Technology in China. Heproceeded to study in chemistryat Queen’s University Belfast andobtained his PhD degree in2019. He then continued topursue his research in materialschemistry and currently holds aposition as research assistant inProf. Steven E. J. Bell’s researchgroup at Queen’s UniversityBelfast. His current research
focuses on fabrication of multidimensional nanomaterials andtheir applications in photonics and photocatalysis.
School of Chemistry and Chemical Engineering, Queen’s University Belfast,
University Road, Belfast, BT7 1NN, UK. E-mail: [email protected], [email protected]
This journal is © The Royal Society of Chemistry 2020 Analyst, 2020, 145, 6211–6221 | 6211
Ope
n A
cces
s A
rtic
le. P
ublis
hed
on 0
4 A
ugus
t 202
0. D
ownl
oade
d on
4/1
/202
2 4:
14:1
5 PM
. T
his
artic
le is
lice
nsed
und
er a
Cre
ativ
e C
omm
ons
Attr
ibut
ion-
Non
Com
mer
cial
3.0
Unp
orte
d L
icen
ce.
View Article OnlineView Journal | View Issue

patient’s blood.6 It has been applied in clinical practice since1970s, primarily focusing on drugs with a narrow therapeuticwindow.7,8 Numerous factors will affect the appropriate thera-peutic drug level, including personal factors such as age,gender, weight, and genetic make-up, as well as environmentalfactors such as diet, smoking habits and treatment history.8,9
Moreover, in most cases patients are treated with more thanone anticancer drug simultaneously, so that TDM needs to becapable of carrying out multiplex measurements.10–14 Thismay be complex if there are significant drug–drug interaction.9
The most commonly applied platforms for TDM are immuno-assays of various types and separation techniques combinedwith mass spectrometry (MS). In immunoassay, the detectionof an analyte depends on the binding of the analyte with aspecific binding molecule such as an antibody.15,16 Eventhough immunoassay provides a well-established and easy-operated platform technology, obvious shortfalls such as inter-ference of the matrix, endogenous antibodies and drug metab-olites etc. can limit its application in TDM. In addition, thelow sensitivity of such a technique makes the detection of lowconcentration analytes difficult, while the need to have specificbinding molecules for each drug target limits thegenerality.6,17 Compared to immunoassay, liquid chromato-graphy (LC) combined with MS is a more robust platform andit has higher sensitivity for TDM. LC-MS avoids some of theinterference effects which are found in immunoassay and it isable to detect multiple components in a complex mixedsample after chromatographic separation.6,18 However, LC-MSis time-consuming, expensive and laboratory-based. Apartfrom immunoassays and LC-MS, various spectroscopicmethods have also been developed for TDM including NMR,Ultraviolet–visible (UV/vis), infrared (IR), fluorescence, X-rayphotoelectron (XPS) and surface plasmon resonance (SPR)spectroscopies.19 Despite having some advantages, all these
techniques have significant limitations associated with lowsensitivity or limited accessibility.
SERS is an obvious potential alternative to existing methodsfor TDM. Many of its characteristics are exactly those whichpractical TDM requires. Most notably, the high sensitivity ofSERS suggests that it will provide limits of detection andquantification that are in the range encountered in therapeuticapplications.20,21 Moreover, this sensitivity can be increased ifthe excitation wavelength is chosen to fall within a strongabsorption band of the target molecules, giving surface-enhanced resonance Raman spectroscopy (SERRS).22 Similarly,the ability of SE(R)RS to provide characteristic fingerprintspectra and to allow multiplex detection of several analytessimultaneously is a major advantage.23 Finally, these benefitscan be realized in relatively low cost hand-held systems thatare appropriate for bedside measurements. These consider-ations have led to several preliminary studies on monitoringanticancer drugs which have reported that it is possible todemonstrate some of these potential advantages in modelsystems which are similar to clinical applications. However, asis the case with many applications of SE(R)RS, a very widerange of drugs and experimental methods have been used inthese studies so the overall picture is not clear.
The most notable variables in TDM SE(R)RS are the natureof the enhancing substrate used, excitation wavelength (SERSversus SERRS), data analysis method (univariate versus multi-variate) and of course the chemical properties of the drug com-pounds studied, which is important since it determines whichdrugs will adsorb to the enhancing surface. The purpose of thereview is to bring together information on the first generationof SE(R)RS studies and to draw out some general conclusionsabout the progress so far, as well as highlighting the areaswhich need to be developed further if SE(R)RS is to becomeestablished as a viable approach for TDM.
Yikai Xu
Dr Yikai Xu is currently an inde-pendent Leverhulme EarlyCareer Fellow at Queen’sUniversity Belfast. He obtainedhis BSc degree in AppliedChemistry at East ChinaUniversity of Science andTechnology and completed hisPhD research under the supervi-sion of Prof. Steven E. J. Bell atQUB. Dr Xu is the recipient ofthe 2019 Kathleen LonsdaleRoyal Irish Academy Prize for themost outstanding PhD research
in chemical science in Ireland. His research interests are in thepreparation and applications of plasmonic nanomaterials, par-ticularly the preparation of hybrid materials containing plasmonicnanoparticle assemblies.
Steven Bell
Prof. Steven E. J. Bell receivedhis PhD from Queen’s UniversityBelfast and worked at theRutherford-Appleton Laboratoryand the University of York beforereturning to QUB where he is aProfessor of Physical Chemistryand Head of the School ofChemistry and ChemicalEngineering. His research centreson nanomaterials and Ramanspectroscopy. He has a particularinterest in the application ofRaman methods to real world
problems including medical and security applications and wasfounder/director of a successful company manufacturing Ramanspectrometers.
Minireview Analyst
6212 | Analyst, 2020, 145, 6211–6221 This journal is © The Royal Society of Chemistry 2020
Ope
n A
cces
s A
rtic
le. P
ublis
hed
on 0
4 A
ugus
t 202
0. D
ownl
oade
d on
4/1
/202
2 4:
14:1
5 PM
. T
his
artic
le is
lice
nsed
und
er a
Cre
ativ
e C
omm
ons
Attr
ibut
ion-
Non
Com
mer
cial
3.0
Unp
orte
d L
icen
ce.
View Article Online

Methods for SE(R)RS therapeuticanticancer drug monitoring
The structures of the anticancer drugs which have been inves-tigated by SE(R)RS in TDM-related studies are shown in Fig. 1,while Table 1 brings together some of the most importantaspects of each of the studies. The first general observationfrom Fig. 1 is that the structures of the molecules which havebeen investigated are extremely diverse. From Table 1 the firstnotable aspect of the previous work listed is that both aggre-gated colloids and solid substrates have been used in thesestudies. Although it is often not explicitly stated, the rationalefor using aggregated colloids in many of these studies isstraightforward, aggregated colloids are extremely easy toprepare and offer intense SE(R)RS enhancement, which insome cases allowed the detection down to single moleculelevels.24 As shown in Table 1, high signal enhancements havebeen achieved using even the most conventional types ofaggregated colloids, such as aggregated citrate reduced Ag/Aucolloids (CRSC/CRGC), which allowed anticancer drugs includ-ing methotrexate (2), mitoxantrone (5), 6-thioguanine (13) anddoxorubicin (14) to be detected down to micro-molarlevels.27–29,34,35,40–42 One common issue which arises in aggre-gated colloid systems is that colloid aggregation is a dynamicprocess. This means the plasmonic enhancement that aggre-gated colloids provide also changes over time, which canreduce the reproducibility of the SE(R)RS measurements. Apopular approach to improve the reproducibility of SE(R)RSdetection based on colloids is to use microfluidic systems. Forexample, Smith et al. have developed a flow cell system formitoxantrone (5) detection in serum, which is simple and ableto avoid interference from the biological matrix.35 In thiswork, a 632.8 nm excitation laser was selected to provide reso-nance enhancement and allow the SERRS signal of the drug tobe recorded. This allowed mitoxantrone to be detected at con-centrations as low as 0.04 nM. The same anticancer drug hasalso been successfully detected based on a microfluidic SERRS
device with a 532 nm excitation laser.34 Similarly, Xu et al.have designed a SERS-microfluidic chip which can generatecontrollable aqueous micro-droplets in oil and used it fordetection of 6-thioguanine (13) in human serum.40 Formingmicro-droplets creates a stable and isolated micro-environ-ment of colloid and drug, which increases the signal repeat-ability. A similar lab-on-a-chip SERS system has also been usedfor detection of methotrexate (2) in the therapeutic range(2.0–0.2 µM).29 Alternatively, it is possible to design novel col-loidal aggregates with long-term stability or colloidal nano-particles (NPs) with novel morphologies which make them SE(R)RS-active without the need for aggregation.45,46
In contrast to aggregated colloids, solid enhancing sub-strates often exhibit significantly higher stability, whichmeans that to facilitate the adsorption of weakly adsorbinganalytes they can be soaked for long periods of time in thesample solution or a droplet of analyte can be directlydropped onto the substrate and Raman probed. For example,SERS signals of the anticancer drugs paclitaxel (1) and cyclo-phosphamide (11) have both been successfully obtained usingthis approach while the SERS signal of doxorubicin (14) hasbeen observed in biological matrices using solid substrateswithin a flow-cell system.25,26,43 Alternatively, the analyte solu-tion can be deposited and then allowed to dry directly ontothe surface of the solid substrate to physically bring theanalyte into close proximity with the enhancing surface.Meneghetti et al. have used this method to quantitativelydetect doxorubicin (14), irinotecan (4) and SN-38 (9) on com-mercially available Klarite substrates while imatinib (8) spikedin plasma has also been measured with a limit of detection(LOD) of 0.43 μM.32,38
The approaches above can be extended by combining themwith chromatographic separation. Bonifacio et al. have devel-oped a TLC-SE(R)RS method for detecting the anti-neoplasticdrug, irinotecan (4) in serum samples.31 In this work, the SE(R)RS signal of irinotecan was acquired by directly applyingand then drying colloids on the relevant TLC spot. A pre-reso-nance effect was observed by using a 514 nm laser rather thana 785 nm laser. Moreover, Goodacre et al. have successfullydemonstrated SERS detection of methotrexate (2), an anti-neo-plastic drug, in urine samples, by coupling SERS with high-performance liquid chromatography (HPLC).27 By pre-separ-ating methotrexate from its metabolite, 7-hydroxy methotrex-ate, by HPLC and then using aggregated colloid, the SERSsignal of methotrexate was detected down to 2.21 µM using aportable Raman system.
Other less conventional approaches to anticancer drugdetection have also been explored. For example, rather thanusing standard Au or Ag NPs, Chen et al. have used compositeAg@ZnO NPs to detect docetaxel (10) in plasma by mixing theparticles with the analyte solution and then drying them ontoan aluminium support.39 In addition, an example of indirectSERS detection of erlotinib (15), which uses the loss of thesignal of a strongly scattering competitive molecule to signalthe presence of the drug, has been presented by Meneghettiet al.44Fig. 1 The structures of the anticancer drugs discussed in this review.
Analyst Minireview
This journal is © The Royal Society of Chemistry 2020 Analyst, 2020, 145, 6211–6221 | 6213
Ope
n A
cces
s A
rtic
le. P
ublis
hed
on 0
4 A
ugus
t 202
0. D
ownl
oade
d on
4/1
/202
2 4:
14:1
5 PM
. T
his
artic
le is
lice
nsed
und
er a
Cre
ativ
e C
omm
ons
Attr
ibut
ion-
Non
Com
mer
cial
3.0
Unp
orte
d L
icen
ce.
View Article Online

Tab
le1
Summaryofpublishedan
tica
nce
rdrugTDM
studieswhichemploye
dSE
(R)RSas
themaintech
nique.M
arke
dwith*arereportswhichco
ntainedanon-linear
quan
tifica
tionrange
Nam
eTa
rget
cancer
Method
Bio-
sample
LOD(linear
quan
tification
range)
Com
men
tsRef.
1Pa
clitaxel
Ovarian
,breastan
dnon
-smallc
elllun
gcancer
Graph
eneoxidesu
pported
L-cysteine-
functionalized
star-like
AuNPsolid
substrates;a
nalytedrop
let
Serum
15nM
(15nM–1
00nM)
NPs
surfacemod
ified
25
Microwave-treatedAu-po
lystyren
ebe
adssolidfilm
;analytedrop
let
Plasma
10nM
(10nM–1
00nM)
Multi-variate
analysis
26
2Methotrexate
Breastcancer,leuk
aemia,lun
gcancer,
lymph
oma,
andosteosarcoma
LC-SERScombined
system
;Au
aggregated
collo
idUrine
2.21
µM(n/a)
Portab
leRam
an,b
inaryan
alyte
detection(drugan
dmetab
olite)
27
Dryingan
alyteon
dip-coated
Ausolid
substrate
Serum
0.1µM
(0.1
μM–
20μM
)Multivariatean
alysis
28
MicrofluidicSE
RSsystem
;Ag
aggregated
collo
id—
0.17
µM(0.2
μM–
2μM
)—
29
35-Fluo
rouracil(active
metab
oliteof
cape
citabine)
Breastcancer,ga
striccanceran
dcolorectal
cancer
HR-CSA
S-SE
RSsystem
;Agag
gregated
collo
idSw
eat
2µg
mL−
1(2
µgmL–
20µg
mL−
1Thedrug
was
not
mixed
with
sweat
30
4Irinotecan
Colon
canceran
dsm
allc
elllun
gcancer
TLC
-SERSsystem
;Au/Agcollo
ids
depo
sitedon
TLC
spots
Serum
2.73
µM(n/a)
Differen
tcapp
ingag
ents
tested
;SE
RRS
31
Dryingdrug
drop
lets
onKlarite
Au
substrate
—60
–70ng(198
ng–
4032
ng)
Binarydrug
detection;
multivariatean
alysis
32
5Mitoxan
tron
eAcu
temyeloid
leuk
aemia,n
on-H
odgk
inlymph
oma,
breast
canceran
dprim
aryliver
cancer
Flow
cell;
electron
-beam
evap
orated
Auon
SiO2-polym
ersu
bstrate
—61
.03ngmL−
1
(0.061
µgmL−
1–
15.63µg
mL−
1)
Binarydrug
sde
tection
33
Microfluidicsystem
;Agag
gregated
collo
id—
500nM
(n/a)
SERRS
34
Flow
cellsystem
;Agag
gregated
collo
idPlasma
0.02
ngmL−
1(1
ng
mL−
1–43ngmL−
1)
SERRS
35
6Su
nitinib
Kidney
cancer,ga
strointestinal
stromal
tumou
rsan
dpa
ncreaticneu
roen
docrine
tumou
rs
Dryingan
alyteon
Klarite
Ausu
bstrate
—18
–26ng(88ng–18
72ng)
—32
76-Mercaptop
urine
Acu
telymph
ocytic
leuk
aemia
Microflud
idic
system
;usingAgNPs
asbio-prob
ein
cells
Living
cells
10nM
(10nM–1
0µM
)*
Binarydrug
detection;linear
quan
tification
range
not
specified
36
β-Cyclode
xtrinfunctionalised
Ag
aggregated
collo
id—
2.4nM
(4nM–20nM)
NPs
surfacemod
ified
37
8Im
atinib
Chronic
myeloid
leuk
aemia
Dryingan
alyteon
siliconnan
opillar
substratecoated
withAg
Plasma
0.43
µM(n/a)
Portab
leRam
ansp
ectrom
eter;
deproteinization;m
ultivariate
analysis
38
9SN
-38(activemetab
olite
ofCPT
-11)
Colorectalc
ancer
Dryingan
alyteon
Klarite
Ausu
bstrate
—20
–50ng(107
ng–
1092
ng)
Binarydrug
detection;
multivariatean
alysis
32
10Docetaxel
Breastcancer,non
-smallc
elllun
gcancer,
advancedstom
achcancer,headan
dneck
canceran
dmetastaticprostate
cancer
Ag@
ZnONPs
wereim
mersedin
analytesolution
andthen
themixture
was
driedon
toan
alum
inium
foil
wafer
Plasma
1µg
mL−
1(1
µgmL−
1–100
0µg
mL−
1)
Multivariatean
alysis
39
11Cycloph
osph
amide
Lymph
omas,leu
kaem
ia,m
yeloma,
lung
canceran
dbreast
cancer
GO-sup
ported
L-cysteine-
functionalized
star-like
Ausolid
substrates;a
nalytedrop
let
Serum
5nM
(5nM–100
nM)
NPs
surfacemod
ified;
anti-
foulingSA
M25
12Methim
azole
Hyp
erthyroidism
(can
cercomplication)
Microfluidicsystem
;usingAgNPs
asbio-prob
ein
cells
Living
cells
100nM
(100
nM–
10mM)*
Binarydrug
detection
36
136-Thiogu
anine
Acu
temyeloid
leuk
aemia
Droplet
basedmicrofluidicsystem
;Au
aggregated
collo
idSerum
0.66
µM(1
µM–
100µM
)*Dep
roteinization
40
Minireview Analyst
6214 | Analyst, 2020, 145, 6211–6221 This journal is © The Royal Society of Chemistry 2020
Ope
n A
cces
s A
rtic
le. P
ublis
hed
on 0
4 A
ugus
t 202
0. D
ownl
oade
d on
4/1
/202
2 4:
14:1
5 PM
. T
his
artic
le is
lice
nsed
und
er a
Cre
ativ
e C
omm
ons
Attr
ibut
ion-
Non
Com
mer
cial
3.0
Unp
orte
d L
icen
ce.
View Article Online

Finally, SE(R)RS can, of course, be used alongside othersynergistic techniques. For example, SERS has been used foridentification of 5-fluorouracil (3) (the effective metabolite ofcapecitabine) while the concentration of capecitabine itselfwas measured using high-resolution continuum sourceabsorption spectrometry which has high sensitivity for fluo-rine and low chlorine interference.30
Table 1 also shows the linear quantification ranges thathave been achieved for the various anticancer drugs whichhave been studied using SE(R)RS with different types of enhan-cing substrates and sampling techniques. Achieving high accu-racy and reproducibility in quantitative SE(R)RS analysis havebeen a longstanding challenge in SE(R)RS but in general, themajority of the methods discussed here demonstrated goodlinear quantification ranges of at least an order of magnitudewith acceptable levels of uncertainty. In some cases multi-variate methods have been used in analysis of the data and itseems likely that these will be used increasingly as SE(R)RS isapplied for routine TDM where the desired output is themeasured value of a concentration rather than a spectrum.However, in the current context, it is important to note thatthe clinically relevant concentration range varies widelybetween drugs and that only a small fraction of SE(R)RSstudies to date have compared the quantification range theyachieved for their target drug with the clinically relevant con-centration range.25,27,29,32,35,38
Apart from the selection of an appropriate substrate,another equally important and general issue in SE(R)RS TDMof anticancer drugs is that the samples are typically in bio-fluids, which contain high concentrations of bio-molecules,particularly proteins, that interfere with the measurements bybinding to the anticancer drugs and/or competing with theanticancer drugs for enhancing surface.47,48 For colloidal sub-strates the adsorption of protein contaminants also preventscolloid aggregation, which is often crucial for the formation ofplasmonic hot-spots for effective SE(R)RS analysis.48
In general, the effect of protein in SE(R)RS is reduced usingsample pre-treatment steps for deproteinization or by usingenhancing surfaces with anti-fouling properties. Sampledeproteinization typically involves treating the sample withalcohols, which separates the anticancer drugs from the pro-teins in solution and induces protein precipitation. Thismethod has been successfully applied to SE(R)RS detection ofirinotecan (4), 6-thioguanine (13), imatinib (8), erlotinib (15)and doxetaxel (10).31,38–40,44 It is also possible to remove pro-teins with adsorbent or filtering materials. For example, Whiteet al. have successfully detected flucytosine, an antifungalagent, in serum using a vertical flow membrane system withinkjet-printed SERS sensors.49 In this work, layers of filterpaper were utilized to filter out the protein and a portableRaman spectrometer used to obtain the SERS signals from theprinted Au NPs. Quantitative detection of flucytosine inundiluted serum was achieved with a LOD of 10 µg mL−1.Moreover, Markin et al. have presented a pre-separationmethod for urine samples which used silica gel chromato-graphy and allowed the detection of ceftriaxone, an antibiotic,T
able
1(Contd.)
Nam
eTa
rget
cancer
Method
Bio-
sample
LOD(linear
quan
tification
range)
Com
men
tsRef.
14Doxorub
icin
Breastcancer,blad
dercancer,Kap
osi’s
sarcom
a,lymph
oma,
andacute
lymph
ocytic
leuk
aemia
Agag
gregated
collo
idPlasma
—Multivariatean
alysis
41Agag
gregated
collo
idPlasma
100nM
(100
nM–750
nM)
Multivariatean
alysis
42
Functionalised
Aulithog
raph
icfilm
Plasma
50nM
(0.05µM
–2µM
)Mixed
SAMsmod
ifiedNPs
;binary
analytes
detection(drugan
dmetab
olites)
43
15Erlotinib
Non
-smallc
elllun
gcanceran
dpa
ncreatic
cancer
Laser-ab
latedAuNPcollo
id;indirect
compe
titorde
tection
Plasma
300nM
(300
nM–300
0nM)*
NPs
surfacemod
ified;
click
chem
istryinvolved
;usinginternal
reference
ascompe
titor
44
Analyst Minireview
This journal is © The Royal Society of Chemistry 2020 Analyst, 2020, 145, 6211–6221 | 6215
Ope
n A
cces
s A
rtic
le. P
ublis
hed
on 0
4 A
ugus
t 202
0. D
ownl
oade
d on
4/1
/202
2 4:
14:1
5 PM
. T
his
artic
le is
lice
nsed
und
er a
Cre
ativ
e C
omm
ons
Attr
ibut
ion-
Non
Com
mer
cial
3.0
Unp
orte
d L
icen
ce.
View Article Online
down to 0.4 µg mL−1.50 Although these examples both focusedon detection of non-anticancer drug molecules, the approachfor protein separation is likely to be readily applicable for SE(R)RS TDM of anticancer drugs.
To create antifouling surfaces, Yu et al. have used a hier-archical surface modification strategy which involved pre-forming a self-assembled monolayer (SAM) of zwitterionicpolymer brush on the surface of Au NPs before using them forSERS detection of doxorubicin (14).43 A similar approach wasapplied by De la Rosa et al. who used Au NPs functionalisedwith a zwitterionic amino acid L-cysteine SAM brush as theenhancing substrate, which allowed detection of paclitaxel (1)and cyclophosphamide (11) down to nano-molar level inserum.25
In general, a broad range of experimental methods havealready been demonstrated for SE(R)RS detection of anticancerdrugs. However, there is insufficient evidence to judge whichmethod is optimum, or even if there exists a single optimumsolution but the fact that so many methods are at least reason-ably successful suggests that the availability of an appropriateenhancing substrate or need to reduce protein interferencewill not be the major limitations in implementing SE(R)RS asa method for TDM.
The adsorption of anticancer drugs onAu/Ag surfaces
The previous sections showed that many anticancer drugs canbe detected by SE(R)RS. However, this in itself is not sufficientto demonstrate that SE(R)RS can be developed into a generallyviable method for TDM of anticancer drugs, since there is amuch larger number of anticancer drug molecules which havenot been studied by SE(R)RS. Therefore, in this section wediscuss whether the drugs which have been studied to date arerepresentative of the large number of potential target analytesor if they are actually a special subset of anticancer drugswhich are particularly favourable for SE(R)RS detection.
SE(R)RS analysis of anticancer drugs requires the analyte tobe in close proximity to the enhancing surface to experiencesufficient signal enhancement. In most cases, this requires thedrugs to be able to spontaneously adsorb onto the enhancingsurface, which depends on both the molecular structure of thedrug and the surface chemistry of the substrate material.51 Itis therefore extremely important to discuss the types of inter-actions between the anticancer drugs and Ag/Au metal sur-faces investigated so far, since this may serve as a generalguideline to predict other potential anticancer drug candidateswhich could be detected via SE(R)RS.
Ag/Au NPs typically carry a layer of chemically boundcapping agents on their surfaces. Therefore, to move into theenhancing electromagnetic field on the surface of the NPs theanalyte must either replace the capping agents or adsorb ontothem as a second layer, as illustrated in Fig. 2. To replace theinitial capping agents on the surface of the enhancing metalsthe anticancer drugs need to have functional groups which
adsorb strongly to the metal surface. The first moleculedetected by SERS was pyridine and it is now well establishedthat pyridine and various other types of nitrogen-containingheteroatomic functional groups have a strong affinity to Agand Au surfaces.52–54 Indeed, ca. 66% of anticancer drugswhich have been studied using SE(R)RS contain nitrogen-based hetero-aromatic rings. For example, Goodacre et al. havedemonstrated that methotrexate (2), a pyrimidyl anticancerdrug, can be detected using CRSC as enhancing substrate.27
Similarly, capecitabine (3), which also contains a pyrimidinegroup, has been found to spontaneously adsorb onto chloride-capped Ag NPs.30 Irinotecan (4), a pyridyl drug which is one ofthe most cytotoxic but effective drugs used for the treatment ofmetastatic colorectal cancer, could be quantitatively analyzedusing both citrate-capped Au NPs and chloride-capped Ag NPsvia SE(R)RS.31,32 Imatinib (8) which contains multiple nitro-gen-based hetero-aromatic functional groups has also beensuccessfully detected.38
Another hetero atom which is well-established to bestrongly adsorbing to Ag and Au surfaces is sulfur, with thiols/thioyls being the best-known.55,56 For example, 6-mercaptopur-ine (7), methimazole (12) and 6-thioguanine (13) has beendetected down to 2.4 nM, 100 nM and 0.66 µM,respectively.36,40 It is notable that 20% of the anticancer drugswhich have been studied by SE(R)RS contain sulfur while only0.2% of anticancer drugs are sulfur containing.57
Apart from nitrogen-based hetero-aromatic and sulfur-basedfunctional groups, amine functional groups are also commonlyfound in the group of anticancer drugs which have beenstudied by SE(R)RS. In fact, 13 of the 15 anticancer drugs whichhave been studied by SE(R)RS contain at least one amine group.These can be strongly binding, DFT calculations have shownthat the adsorption strengths of amine groups are highly depen-dent on the overall structure of the molecule and the protona-tion state of the amine groups.58 A study showed that in 2016,the percentage of anticancer drugs containing R3N, R2NH orRNH2 groups was 38.6%, 40% and 6.8%, respectively.59
Besides sulfur and nitrogen compounds, phosphorous com-pounds can also form chemical bonds with Au, Ag.60 Anexample that is relevant here is cyclophosphamide (11) which
Fig. 2 Schematic illustration of the two ways in which analytes mayadsorb onto enhancing metal surface: chemical adsorption and physicaladsorption.
Minireview Analyst
6216 | Analyst, 2020, 145, 6211–6221 This journal is © The Royal Society of Chemistry 2020
Ope
n A
cces
s A
rtic
le. P
ublis
hed
on 0
4 A
ugus
t 202
0. D
ownl
oade
d on
4/1
/202
2 4:
14:1
5 PM
. T
his
artic
le is
lice
nsed
und
er a
Cre
ativ
e C
omm
ons
Attr
ibut
ion-
Non
Com
mer
cial
3.0
Unp
orte
d L
icen
ce.
View Article Online

is a non-aromatic anticancer drug which contains both aminesand phosphoryl groups and could be detected down to 5 nMon graphene oxide supported L-cysteine-functionalized star-like Au NPs substrates, as demonstrated by Camacho-Villegasand De la Rosa.25
It is generally believed that polycyclic aromatic hydrocarbons(PAHs) do not possess strong affinity for Ag and Au nanosur-faces. However, we have recently shown that PAHs, such asnaphthalene and fluoranthene, can adsorb directly onto thesurface of CRGC by displacing citrate and chloride ions throughstrong π–metal interactions.61 Interestingly, the effect was onlyobserved for CRGC but not CRSC. This is significant because,as shown in Fig. 1, most anticancer drugs that have beenstudied by SE(R)RS contain at least one aromatic ring. In fact, ithas been reported that 74% of all known anticancer drugscontain at least one aromatic ring (including carbo-aromaticrings and hetero-aromatic rings) which could have importanteffects on the adsorption of aromatic anticancer drugs to Auand Ag substrates.57 The contribution of π–metal interactions tothe adsorption of aromatic anticancer drugs is not clear inmany cases since most of the aromatic drugs which have beenstudied by SE(R)RS also contain other surface binding func-tional groups. However, paclitaxel (1) and doxorubicin (14),both contain no well-defined conventional surface bindingfunctional groups and would therefore be expected to preferen-tially adsorb on Au surfaces which allow π–metal interactions.Consistent with this expectation, all the existing SERS studies ofpaclitaxel (1) were obtained by using Au NPs as SERS enhancingsubstrates. Huang et al. successfully detected paclitaxel on bareAu at even 15 nM drug concentration, while work published byDe la Rosa et al. showed detection on cysteine functionalisedAu substrates with a LOD as low as 10 nM.25,26 However, SERSstudies of doxorubicin (14) have been carried out on both Agand Au substrates, suggesting that other moieties such ashydroxyl groups may also contribute to binding.41–43
Overall, SE(R)RS has been demonstrated for anticancerdrugs containing several types of functional groups includinghetero/carbo-aromatic rings (present in >70% anticancerdrugs), various amine groups (present in >80% of anticancerdrugs), sulphur-containing group (much less common,present in 0.2% of anticancer drugs) and phosphorous groups.The high proportion of these groups in anticancer drugs indi-cates that the drugs which have been investigated so far are un-likely to be especially favourable cases. Instead it is likely thatmost anticancer drugs possess sufficient affinity to Au and/orAg surfaces to allow SE(R)RS detection.
Surface modification methods for SE(R)RS therapeutic anticancer drugmonitoring
Within the SE(R)RS literature there are numerous examples ofstudies in which surface modification is used to promote theadsorption of target analytes of various types onto the enhancing
surface, but the approach has been less widely adopted for anti-cancer drugs, presumably because their intrinsic tendency toadsorb to Ag and Au enhancing metals makes the need for themless pressing than for other weakly-adsorbing targets. However,surface-modification techniques may still be useful for improv-ing the performance of SE(R)RS in TDM of anticancer drugs.
For example, Tian et al. showed that using Ag NPs modifiedwith β-cyclodextrin as the enhancing substrate increased notonly the SERS signal intensity of 6-mercaptopurine (7) but alsothe speed of the analytical process and the linear quantifi-cation range of the drug, compared to as-prepared CRSC(Fig. 3).37 This signal improvement was attributed to the inser-tion of 6-mercaptopurine into the cavity of β-CD, which forcedthe drug molecules to stand vertically rather than lie flat onthe surface of the enhancing substrate.
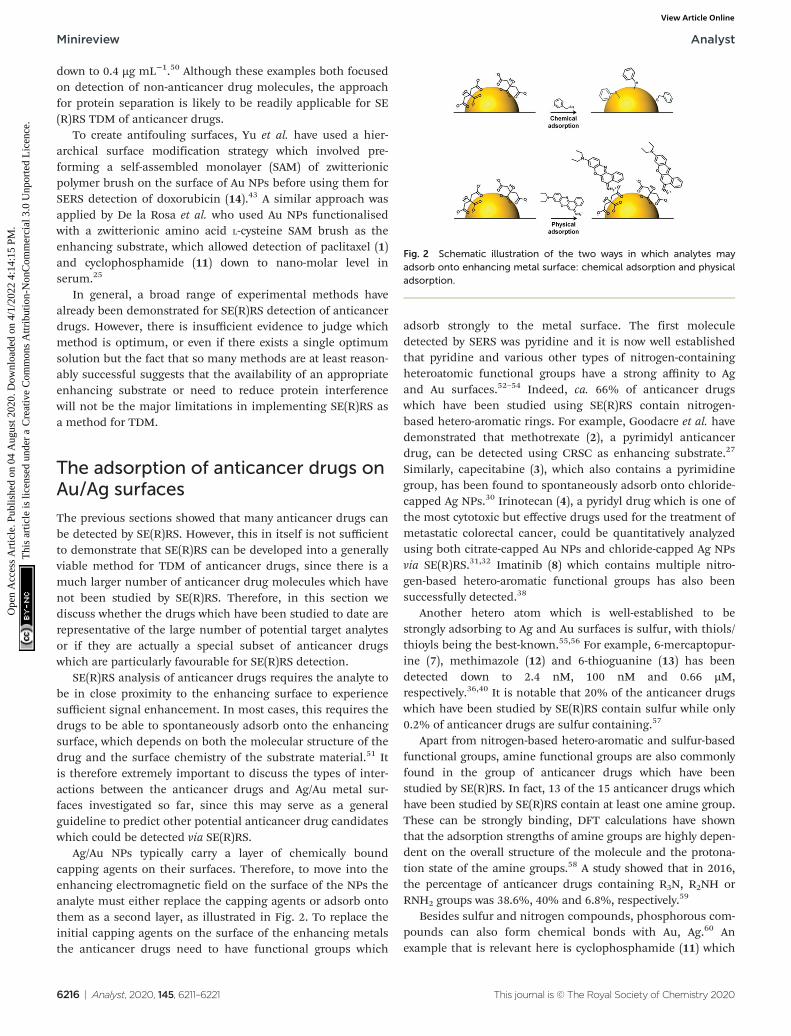
An alternative approach to using supramolecular hosts is tomodify the surfaces with SAMs of thiol-terminated modifierswhich are chosen to attract non-adsorbing analytes and/or torepel competing contaminants. As discussed in previous sec-tions, SAMs of zwitterionic polymers have been used as anti-fouling layers in SERS TDM of doxorubicin (14) in plasma(Fig. 4).43 In addition to the zwitterionic polymer antifoulinglayer the mixed SAMs also contained different types of thiolswhich acted as either chemically-binding ‘reporters’ or phys-ically attracting ‘attractors’ which allowed the detection of avariety of weakly/non adsorbing therapeutic drug molecules.
Besides organic modifiers, the surface of Ag and Au enhan-cing metals can also be modified with other inorganicmaterials to form hybrid materials to increase the SERSsignals of anticancer drugs. For example, graphene oxide (GO)supported Au NPs have been developed as SERS enhancingsubstrates for the detection of two anticancer drugs, paclitaxel(1) and cyclophosphamide (11).25 Using crystal violet as aprobe molecule, the authors showed that the SERS signal ofthe probe molecule at 10−6 M on the hybrid enhancing sub-strate was ca. 2× stronger than the probe molecule at 10−4 Mon pure Au enhancing colloids. In addition, the authors
Fig. 3 Schematic illustration of the sensing mechanism whenβ-CD-AgNPs are used as the SERS-active substrate to detect6-mercaptopurine.37
Analyst Minireview
This journal is © The Royal Society of Chemistry 2020 Analyst, 2020, 145, 6211–6221 | 6217
Ope
n A
cces
s A
rtic
le. P
ublis
hed
on 0
4 A
ugus
t 202
0. D
ownl
oade
d on
4/1
/202
2 4:
14:1
5 PM
. T
his
artic
le is
lice
nsed
und
er a
Cre
ativ
e C
omm
ons
Attr
ibut
ion-
Non
Com
mer
cial
3.0
Unp
orte
d L
icen
ce.
View Article Online
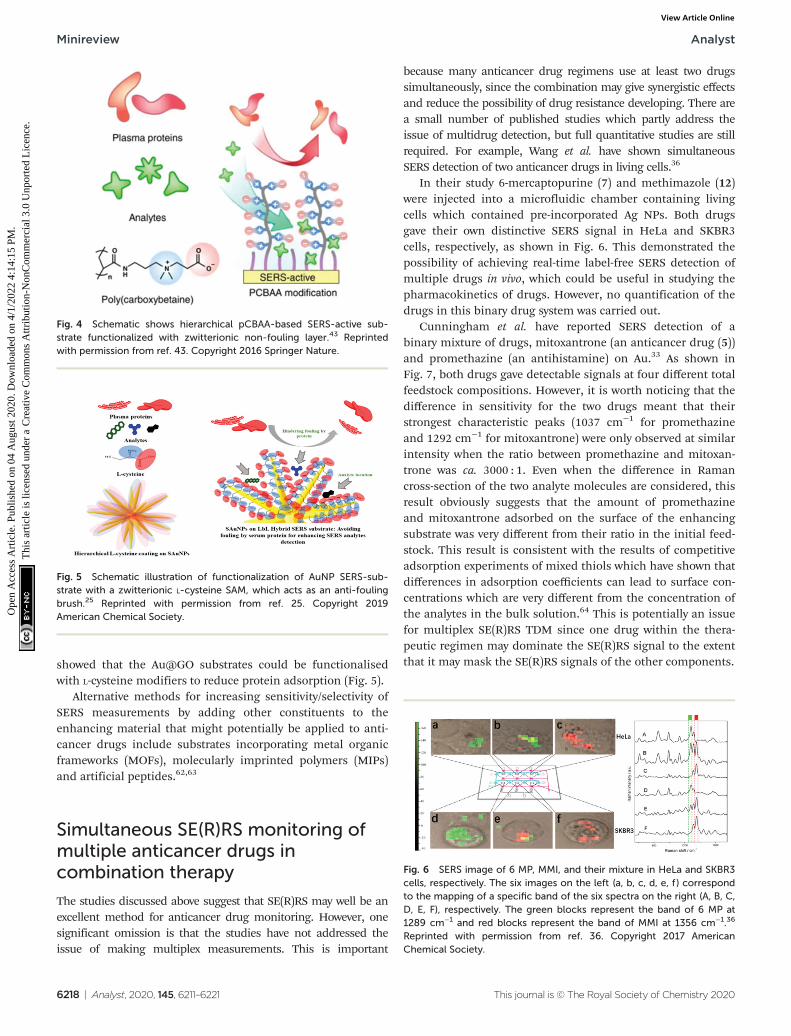
showed that the Au@GO substrates could be functionalisedwith L-cysteine modifiers to reduce protein adsorption (Fig. 5).
Alternative methods for increasing sensitivity/selectivity ofSERS measurements by adding other constituents to theenhancing material that might potentially be applied to anti-cancer drugs include substrates incorporating metal organicframeworks (MOFs), molecularly imprinted polymers (MIPs)and artificial peptides.62,63
Simultaneous SE(R)RS monitoring ofmultiple anticancer drugs incombination therapy
The studies discussed above suggest that SE(R)RS may well be anexcellent method for anticancer drug monitoring. However, onesignificant omission is that the studies have not addressed theissue of making multiplex measurements. This is important
because many anticancer drug regimens use at least two drugssimultaneously, since the combination may give synergistic effectsand reduce the possibility of drug resistance developing. There area small number of published studies which partly address theissue of multidrug detection, but full quantitative studies are stillrequired. For example, Wang et al. have shown simultaneousSERS detection of two anticancer drugs in living cells.36
In their study 6-mercaptopurine (7) and methimazole (12)were injected into a microfluidic chamber containing livingcells which contained pre-incorporated Ag NPs. Both drugsgave their own distinctive SERS signal in HeLa and SKBR3cells, respectively, as shown in Fig. 6. This demonstrated thepossibility of achieving real-time label-free SERS detection ofmultiple drugs in vivo, which could be useful in studying thepharmacokinetics of drugs. However, no quantification of thedrugs in this binary drug system was carried out.
Cunningham et al. have reported SERS detection of abinary mixture of drugs, mitoxantrone (an anticancer drug (5))and promethazine (an antihistamine) on Au.33 As shown inFig. 7, both drugs gave detectable signals at four different totalfeedstock compositions. However, it is worth noticing that thedifference in sensitivity for the two drugs meant that theirstrongest characteristic peaks (1037 cm−1 for promethazineand 1292 cm−1 for mitoxantrone) were only observed at similarintensity when the ratio between promethazine and mitoxan-trone was ca. 3000 : 1. Even when the difference in Ramancross-section of the two analyte molecules are considered, thisresult obviously suggests that the amount of promethazineand mitoxantrone adsorbed on the surface of the enhancingsubstrate was very different from their ratio in the initial feed-stock. This result is consistent with the results of competitiveadsorption experiments of mixed thiols which have shown thatdifferences in adsorption coefficients can lead to surface con-centrations which are very different from the concentration ofthe analytes in the bulk solution.64 This is potentially an issuefor multiplex SE(R)RS TDM since one drug within the thera-peutic regimen may dominate the SE(R)RS signal to the extentthat it may mask the SE(R)RS signals of the other components.
Fig. 5 Schematic illustration of functionalization of AuNP SERS-sub-strate with a zwitterionic L-cysteine SAM, which acts as an anti-foulingbrush.25 Reprinted with permission from ref. 25. Copyright 2019American Chemical Society.
Fig. 4 Schematic shows hierarchical pCBAA-based SERS-active sub-strate functionalized with zwitterionic non-fouling layer.43 Reprintedwith permission from ref. 43. Copyright 2016 Springer Nature.
Fig. 6 SERS image of 6 MP, MMI, and their mixture in HeLa and SKBR3cells, respectively. The six images on the left (a, b, c, d, e, f ) correspondto the mapping of a specific band of the six spectra on the right (A, B, C,D, E, F), respectively. The green blocks represent the band of 6 MP at1289 cm−1 and red blocks represent the band of MMI at 1356 cm−1.36
Reprinted with permission from ref. 36. Copyright 2017 AmericanChemical Society.
Minireview Analyst
6218 | Analyst, 2020, 145, 6211–6221 This journal is © The Royal Society of Chemistry 2020
Ope
n A
cces
s A
rtic
le. P
ublis
hed
on 0
4 A
ugus
t 202
0. D
ownl
oade
d on
4/1
/202
2 4:
14:1
5 PM
. T
his
artic
le is
lice
nsed
und
er a
Cre
ativ
e C
omm
ons
Attr
ibut
ion-
Non
Com
mer
cial
3.0
Unp
orte
d L
icen
ce.
View Article Online

Other studies have investigated binary systems of drugs andtheir metabolites, for example, mixtures of the drug irinotecan(4) and its metabolite, SN-38 (9), which is the active com-pound. In experiments where mixed samples were dried onto asolid Au substrate it was found that the spectra were verysimilar although multivariate analysis could be used to separ-ate them.32 In a second example, doxorubicin (14) and itsmetabolite, doxorubicinol were studied by SERS.43 When themolar ratio of the two components at fixed total concentration(2 µM) was altered, the resulting spectra showed a corres-ponding change in the relative intensities of bands character-istic of both species.
The studies above show that some of the issues which areassociated with multiplex SE(R)RS in general are likely to beencountered in TDM of combinatorial anticancer chemo-therapy. The most notable of these being the challenge indesigning systems where the sensitivity of the analysismatches the concentration ranges of all the compounds whichneed to be monitored. This could mean that for mixtureswhere the therapeutic range of each drug is very different thesensitivity of the enhancing material to the higher concen-tration drugs would need to be suppressed. Conversely, in mix-tures with similar therapeutic ranges, the challenge will be toensure that the sensitivity to each of the drugs is approxi-mately the same. It seems unlikely that these conditions willbe met by simple unmodified surfaces, except by coincidence,so there is a clear need for approaches which allow the sensi-tivity of the assay to the various target compounds to be con-trolled, possibly by surface modification. This requirementdoes add an extra level of difficulty in designing SE(R)RS TDMmethods for particular drug combinations and it may be the
reason that up to this point there have been no quantitativestudies of anticancer drug mixtures. However, the widespreaduse of combination therapies for different types of cancermean that it is a challenge that will need to be met.
Conclusions
The SER(R)S studies of anticancer drugs published to date havedemonstrated that limits of detection in the µM to nM rangecan be achieved for drugs with a very broad range of structuresusing a variety of enhancing substrates. As discussed above,this generality is associated with the structures of anticancerdrugs which, despite their diversity, typically have at least onefeature which helps to promote adsorption onto simple unmo-dified Au or Ag enhancing surfaces. Similarly, several methodsfor minimising the effects of interfering components withinbiofluid samples have been demonstrated, while more estab-lished protocols which are likely to be directly transferrable toSE(R)RS TDM of anticancer drugs are also available. Theseobservations, coupled with the potential to carry out rapidbedside SE(R)RS testing using compact instruments, meansthat SE(R)RS does have real advantages compared to the tech-niques traditionally used for TDM, such as LC-MS.
Apart from the normal issues that are associated with achiev-ing reliable SE(R)RS quantification and are now well recog-nised,65 an additional challenge which is particularly relevant forSE(R)RS TDM of anticancer drugs is to develop SE(R)RS assaysthat can quantitatively monitor two or more drug compoundssimultaneously. This is important because many therapeutic regi-mens in oncology involve the use of combinations of drugs. Inprinciple, multiplex sample detection should be possible sinceeach drug will give a characteristic finger print spectrum.23,66,67
However, successful multiplex detection will also require that thesignals of each component can be detected at the required con-centration range, which suggests that methods to control the sen-sitivity of each component will need to be developed. This willlikely require combined research efforts in material fabricationand surface-modification to create novel enhancing substrates. Insummary, there is now clear evidence that SE(R)RS has realadvantages over established TDM approaches and that singledrug analysis is already possible while multidrug monitoringremains an important challenge for the future.
Conflicts of interest
There are no conflicts to declare.
Notes and references
1 A. Remesh, Int. J. Basic Clin. Pharmacol., 2012, 1, 2.2 F. Kroschinsky, F. Stölzel, S. von Bonin, G. Beutel,
M. Kochanek, M. Kiehl and P. Schellongowski, Crit. Care,2017, 21, 89.
3 E. Chatelut, Invest. New Drugs, 2003, 21, 141.
Fig. 7 SERS spectra of promethazine and mitoxantrone mixtures, pro-methazine and mitoxantrone. Individual primary SERS intensity peaks forboth promethazine and mitoxantrone compounds can be identified at1037 and 1292 cm−1, respectively. Measurements were taken insequence from the top to bottom.33
Analyst Minireview
This journal is © The Royal Society of Chemistry 2020 Analyst, 2020, 145, 6211–6221 | 6219
Ope
n A
cces
s A
rtic
le. P
ublis
hed
on 0
4 A
ugus
t 202
0. D
ownl
oade
d on
4/1
/202
2 4:
14:1
5 PM
. T
his
artic
le is
lice
nsed
und
er a
Cre
ativ
e C
omm
ons
Attr
ibut
ion-
Non
Com
mer
cial
3.0
Unp
orte
d L
icen
ce.
View Article Online

4 G. Powis, Drug Metab. Rev., 1983, 14, 1145.5 D. Birkett, Aust. Prescr., 1997, 20, 9.6 A. Jaworska, S. Fornasaro, V. Sergo and A. Bonifacio,
Biosensors, 2016, 6, 47.7 C. Neef, D. Touw and L. Stolk, Pharm. Med., 2008, 22, 235.8 J. Kang and M. Lee, Korean J. Intern. Med., 2009, 24, 1.9 E. Jaquenoud Sirot, J. W. van der Velden, K. Rentsch,
C. Eap and P. Baumann, Drug Saf., 2006, 29, 735.10 N. Agrawal, J. Pallos, N. Slepko, B. Apostol, L. Bodai,
L. Chang, A. Chiang, L. Thompson and J. Marsh, Proc. Natl.Acad. Sci. U. S. A., 2005, 102, 3777.
11 N. Ashizawa, Y. Tsuji, K. Kawago, Y. Higashi, M. Tashiro,M. Nogami, R. Gejo, M. Narukawa, T. Kimura andY. Yamamoto, J. Infect. Chemother., 2016, 22, 331.
12 A. Vazquez, BMC Syst. Biol., 2013, 7, 31.13 C. Stigliano, J. Key, M. Ramirez, S. Aryal and P. Decuzzi,
Adv. Funct. Mater., 2015, 25, 3371.14 J. Zhang, Y. Liang, X. Lin, X. Zhu, L. Yan, S. Li, X. Yang,
G. Zhu, A. Rogach, P. Yu, P. Shi, L. Tu, C. Chang, X. Zhang,X. Chen, W. Zhang and C. Lee, ACS Nano, 2015, 9,9741.
15 M. Broto, R. McCabe, R. Galve and M. Marco, Analyst, 2017,142, 2404.
16 G. Hempel, Methods of therapeutic drug monitoring includingpharmacogenetics, 2nd edn, Elsevier, 2019.
17 M. Oellerich and A. Dasgupta, Personalized immunosuppres-sion in transplantation, 1st edn, Elsevier, 2016.
18 F. Sime, M. Roberts, J. Roberts and T. Robertson,J. Chromatogr. B: Anal. Technol. Biomed. Life Sci., 2014, 960,134.
19 J. Yi, K. Park, W. Kim, J. Rhee and W. Son, Arch. PharmacalRes., 2018, 41, 355.
20 S. Dick, M. Konrad, W. Lee, H. McCabe, J. McCracken,T. Rahman, A. Stewart, Y. Xu and S. Bell, Adv. Mater., 2016,28, 5705.
21 P. Stiles, J. Dieringer, N. Shah and R. Van Duyne, Annu.Rev. Anal. Chem., 2008, 1, 601.
22 T. Cotton, S. Schultz and R. Van Duyne, J. Am. Chem. Soc.,1982, 104, 6528.
23 J. Dougan and K. Faulds, Analyst, 2012, 137, 545.24 X. Qian and S. Nie, Chem. Soc. Rev., 2008, 37, 912.25 S. Panikar, G. Ramírez-García, S. Sidhik, T. Lopez-Luke,
C. Rodriguez-Gonzalez, I. Ciapara, P. Castillo, T. Camacho-Villegas and E. De la Rosa, Anal. Chem., 2018, 91, 2100.
26 C. Yuen, W. Zheng and Z. Huang, Biosens. Bioelectron.,2010, 26, 580.
27 A. Subaihi, D. Trivedi, K. Hollywood, J. Bluett, Y. Xu,H. Muhamadali, D. Ellis and R. Goodacre, Anal. Chem.,2017, 89, 6702.
28 S. Fornasaro, S. Marta, M. Rabusin, A. Bonifacio andV. Sergo, Faraday Discuss., 2016, 187, 485.
29 I. Hidi, A. Mühlig, M. Jahn, F. Liebold, D. Cialla, K. Weberand J. Popp, Anal. Methods, 2014, 6, 3943.
30 Y. Xing, H. Fuss, J. Lademann, M. Huang, H. Becker-Ross,S. Florek, A. Patzelt, M. Meinke, S. Jung and N. Esser,Spectrochim. Acta, Part B, 2018, 142, 91.
31 A. Vicario, V. Sergo, G. Toffoli and A. Bonifacio, ColloidsSurf., B, 2015, 127, 41.
32 L. Litti, V. Amendola, G. Toffoli and M. Meneghetti, Anal.Bioanal. Chem., 2016, 408, 2123.
33 H. Wu and B. Cunningham, Nanoscale, 2014, 6, 5162.34 K. Ackermann, T. Henkel and J. Popp, ChemPhysChem,
2007, 8, 2665.35 C. McLaughlin, D. MacMillan, C. McCardle and W. Smith,
Anal. Chem., 2002, 74, 3160.36 J. Fei, L. Wu, Y. Zhang, S. Zong, Z. Wang and Y. Cui, ACS
Sens., 2017, 2, 773.37 L. Yang, Y. Chen, H. Li, L. Luo, Y. Zhao, H. Zhang and
Y. Tian, Anal. Methods, 2015, 7, 6520.38 S. Fornasaro, A. Bonifacio, E. Marangon, M. Buzzo,
G. Toffoli, T. Rindzevicius, M. Schmidt and V. Sergo, Anal.Chem., 2018, 90, 12670.
39 J. Xu, T. Jiao, S. Arumugam, P. He, J. Zhu, H. Li andQ. Chen, Microchem. J., 2020, 155, 104373.
40 W. Zhang, Y. Wang, Y. Wang and Z. Xu, Sens. Actuators, B,2019, 283, 532.
41 C. Eliasson, A. Lorén, K. Murty, M. Josefson, M. Käll,J. Abrahamsson and K. Abrahamsson, Spectrochim. Acta,Part A, 2001, 57, 1907.
42 A. Lorén, C. Eliasson, M. Josefson, K. Murty, M. Käll,J. Abrahamsson and K. Abrahamsson, J. Raman Spectrosc.,2001, 32, 971.
43 F. Sun, H. Hung, A. Sinclair, P. Zhang, T. Bai, D. Galvan,P. Jain, B. Li, S. Jiang and Q. Yu, Nat. Commun., 2016, 7, 13437.
44 L. Litti, A. Ramundo, F. Biscaglia, G. Toffoli, M. Gobbo andM. Meneghetti, J. Colloid Interface Sci., 2019, 533, 621.
45 Z. Ye, C. Li, Q. Chen, Y. Xu and S. Bell, Angew. Chem., 2019,131, 19230.
46 L. Scarabelli, M. Coronado-Puchau, J. Giner-Casares,J. Langer and L. Liz-Marzán, ACS Nano, 2014, 8, 5833.
47 C. Tesseromatis and A. Alevizou, Eur. J. Drug Metab.Pharmacokinet., 2008, 33, 225.
48 S. Dominguez-Medina, J. Blankenburg, J. Olson, C. Landesand S. Link, ACS Sustainable Chem. Eng., 2013, 1, 833.
49 A. Berger, S. Restaino and I. White, Anal. Chim. Acta, 2017,949, 59.
50 N. Markina, I. Goryacheva and A. Markin, Anal. Bioanal.Chem., 2018, 410, 2221.
51 S. Ding, E. You, Z. Tian and M. Moskovits, Chem. Soc. Rev.,2017, 46, 4042.
52 M. Fleischmann, P. Hendra and A. McQuillan, Chem. Phys.Lett., 1974, 26, 163.
53 A. Kaczor, K. Malek and M. Baranska, J. Phys. Chem. C,2010, 114, 3909.
54 A. Tadjeddine, A. Rille, O. Pluchery, P. Hébert, W. Zhengand T. Marin, Nucl. Instrum. Methods Phys. Res., Sect. A,1999, 429, 481.
55 C. Vericat, M. Vela, G. Benitez, P. Carro and R. Salvarezza,Chem. Soc. Rev., 2010, 39, 1805.
56 W. Pan, C. Durning and N. Turro, Langmuir, 1996, 12, 4469.57 F. Mao, W. Ni, X. Xu, H. Wang, J. Wang, M. Ji and J. Li,
Molecules, 2016, 21, 75.
Minireview Analyst
6220 | Analyst, 2020, 145, 6211–6221 This journal is © The Royal Society of Chemistry 2020
Ope
n A
cces
s A
rtic
le. P
ublis
hed
on 0
4 A
ugus
t 202
0. D
ownl
oade
d on
4/1
/202
2 4:
14:1
5 PM
. T
his
artic
le is
lice
nsed
und
er a
Cre
ativ
e C
omm
ons
Attr
ibut
ion-
Non
Com
mer
cial
3.0
Unp
orte
d L
icen
ce.
View Article Online

58 R. Hoft, M. Ford, A. McDonagh and M. Cortie, J. Phys.Chem. C, 2007, 111, 13886.
59 H. Singh, R. Kumar, S. Singh, K. Chaudhary, A. Gautamand G. Raghava, BMC Cancer, 2016, 16, 77.
60 G. Niaura, A. Gaigalas and V. Vilker, J. Phys. Chem. B, 1997,101, 9250.
61 Z. Ye, C. Li, Y. Xu and S. Bell, Analyst, 2019, 144, 448.62 G. Phan-Quang, N. Yang, H. Lee, H. Sim, C. Koh, Y. Kao,
Z. Wong, E. Tan, Y. Miao, W. Fan, T. Liu, I. Phang andX. Ling, ACS Nano, 2019, 13, 12090.
63 S. Chen and Z. Zhang, Spectrochim. Acta, Part A, 2008, 70, 36.64 A. Stewart, S. Zheng, M. McCourt and S. Bell, ACS Nano,
2012, 6, 3718.65 S. Bell, G. Charronb, E. Cortésc, J. Kneipp, M. Chapelle,
J. Langerf, M. Procházkag, V. Tranh and S. Schlücker,Angew. Chem., 2020, 59, 5454.
66 S. Laing, K. Gracie and K. Faulds, Chem. Soc. Rev., 2015, 45,1901.
67 H. Kearns, R. Goodacre, L. Jamieson, D. Graham andK. Faulds, Anal. Chem., 2017, 89, 12666.
Analyst Minireview
This journal is © The Royal Society of Chemistry 2020 Analyst, 2020, 145, 6211–6221 | 6221
Ope
n A
cces
s A
rtic
le. P
ublis
hed
on 0
4 A
ugus
t 202
0. D
ownl
oade
d on
4/1
/202
2 4:
14:1
5 PM
. T
his
artic
le is
lice
nsed
und
er a
Cre
ativ
e C
omm
ons
Attr
ibut
ion-
Non
Com
mer
cial
3.0
Unp
orte
d L
icen
ce.
View Article Online