Embed Size (px)
Citation preview

RESEARCH Open Access
An unsupervised learning approach toidentify novel signatures of health anddisease from multimodal dataIlan Shomorony1,2†, Elizabeth T. Cirulli1†, Lei Huang1, Lori A. Napier1, Robyn R. Heister1, Michael Hicks1,Isaac V. Cohen1, Hung-Chun Yu1, Christine Leon Swisher1, Natalie M. Schenker-Ahmed1, Weizhong Li1,3,Karen E. Nelson1,3, Pamila Brar1,3, Andrew M. Kahn1,4, Timothy D. Spector5, C. Thomas Caskey1,6, J. Craig Venter1,3,David S. Karow1, Ewen F. Kirkness1,3 and Naisha Shah1,3*
Abstract
Background: Modern medicine is rapidly moving towards a data-driven paradigm based on comprehensivemultimodal health assessments. Integrated analysis of data from different modalities has the potential ofuncovering novel biomarkers and disease signatures.
Methods: We collected 1385 data features from diverse modalities, including metabolome, microbiome, genetics,and advanced imaging, from 1253 individuals and from a longitudinal validation cohort of 1083 individuals. Weutilized a combination of unsupervised machine learning methods to identify multimodal biomarker signatures ofhealth and disease risk.
Results: Our method identified a set of cardiometabolic biomarkers that goes beyond standard clinical biomarkers.Stratification of individuals based on the signatures of these biomarkers identified distinct subsets of individualswith similar health statuses. Subset membership was a better predictor for diabetes than established clinicalbiomarkers such as glucose, insulin resistance, and body mass index. The novel biomarkers in the diabetes signatureincluded 1-stearoyl-2-dihomo-linolenoyl-GPC and 1-(1-enyl-palmitoyl)-2-oleoyl-GPC. Another metabolite,cinnamoylglycine, was identified as a potential biomarker for both gut microbiome health and lean masspercentage. We identified potential early signatures for hypertension and a poor metabolic health outcome.Additionally, we found novel associations between a uremic toxin, p-cresol sulfate, and the abundance of themicrobiome genera Intestinimonas and an unclassified genus in the Erysipelotrichaceae family.
Conclusions: Our methodology and results demonstrate the potential of multimodal data integration, from theidentification of novel biomarker signatures to a data-driven stratification of individuals into disease subtypes andstages—an essential step towards personalized, preventative health risk assessment.
Keywords: Multimodal, Preventative medicine, Metabolomics, Cardiometabolic syndrome, Unsupervised machinelearning, Network analysis
© The Author(s). 2020 Open Access This article is distributed under the terms of the Creative Commons Attribution 4.0International License (http://creativecommons.org/licenses/by/4.0/), which permits unrestricted use, distribution, andreproduction in any medium, provided you give appropriate credit to the original author(s) and the source, provide a link tothe Creative Commons license, and indicate if changes were made. The Creative Commons Public Domain Dedication waiver(http://creativecommons.org/publicdomain/zero/1.0/) applies to the data made available in this article, unless otherwise stated.
* Correspondence: [email protected]†Ilan Shomorony and Elizabeth T. Cirulli contributed equally to this work.1Human Longevity, Inc., San Diego, CA 92121, USA3J. Craig Venter Institute, La Jolla, CA 92037, USAFull list of author information is available at the end of the article
Shomorony et al. Genome Medicine (2020) 12:7 https://doi.org/10.1186/s13073-019-0705-z

BackgroundDespite the enormous US healthcare spending of $3.3trillion in 2016 [1], one in three individuals aged 50–74years die prematurely from major age-related chronicdiseases [2–4]. Challenging the status quo of our reactivehealthcare, preventative medicine offers an alternativemeans to better health for lower cost [5]. One approachto move beyond traditional medicine to more predictive,preventive practices is via systems medicine. As definedby Hood and Flores [6], systems medicine is the applica-tion of systems biology to the challenges of humanhealth and disease. An interdisciplinary approach thatmeasures, integrates, analyzes, and interprets a variety ofclinical and non-clinical data is critical for a deeper un-derstanding of the mechanisms that determine healthand disease states. Significant computation and statisticalanalysis are essential to sift through large, diverse data-sets and search for patterns, whether related to specifiedbiological processes or to stratify complex diseases intodistinct subsets for health assessment.Recent studies have shown the utility of collecting and
analyzing diverse high-throughput data using unsupervisedcomputational methods for more comprehensive insightsinto biological systems. Argelaguet et al. [7] showed a needfor such integrated analysis by introducing a computationalframework of unsupervised integration of heterogeneousdata and showed its utility by identifying major drivers ofvariation in chronic lymphocytic leukemia. Price et al. [8] re-vealed communities of related analytes associated with dis-eases using unsupervised network analysis on a multimodaldataset.In our previous work [4], we introduced a platform of
deep quantitative multimodal phenotyping that seeks toprovide a comprehensive, predictive, preventative, and per-sonalized assessment of an individual’s health status. Theoffered multimodal assays include whole genome sequen-cing, advanced imaging, metagenomic sequencing, metabo-lome, and clinical labs. In addition, medical history andfamily history were also collected from the individuals. Thecollected data is used to screen individuals for precisionmedicine. This includes identification of clinically signifi-cant pathogenic variants and clinical summaries from ad-vanced imaging and other clinical testing [4]. This platformprovides critical data not only to identify previously undiag-nosed disease states but also to identify early disease bio-markers. Here, we present an analysis of the multimodaldatasets that were collected for 1253 self-assessed healthyadults and an independent validation dataset consisting of1083 adults with longitudinal data. To the best of ourknowledge, this is the largest cohort with such a wide rangeof data modalities analyzed to date.In this study, expanding on the unsupervised ap-
proaches described above, we perform a comprehensiveanalysis with the aims to not only find novel patterns in
disease risk but also to stratify individuals into healthstates using newly identified biomarker signatures. Weperformed a combination of machine learning analyses,including cross-modality associations, network analysisto identify modules and their key biomarkers, and strati-fication of individuals into distinct health risk groupsand their longitudinal outcomes. By doing so, we show-case a framework to assess an individual’s disease risk byidentifying signatures of health and disease through un-supervised learning on multimodal data.
MethodsData collection and data featuresFor the study, we collected data from 1253 self-assessedhealthy individuals in our clinical research facility. Weused several tools and techniques referred to as modal-ities to collect the data. The modalities included wholegenome sequencing (WGS), microbiome sequencing,global metabolome, insulin resistance (IR as defined byCobb et al. [9]) and impaired glucose intolerance (IGTas defined by Cobb et al. [10]), laboratory developedtests (Quantose™), whole body and brain magnetic res-onance imaging (MRI), dual-energy x-ray absorptiometry(DEXA), computed tomography (CT) scan, routine clin-ical laboratory tests, personal/family history of diseaseand medication, and vitals/anthropometric measure-ments. Data collection has been described in detail inour previous manuscript on the first 209 individuals en-rolled in a precision medicine study [4]. In addition tothe modalities described in the previous study, we havenow included CT scan and microbiome sequencing [11].Not all data was collected on all individuals. The num-ber of individuals and the number of features per modal-ity are summarized in Additional file 1: Table S1.We performed CT scans on individuals over the age of
35 years. Patients were scanned during a single breath-hold using a 64-slice GE Healthcare EVO Revolutionscanner (GE Healthcare, Milwaukee, Wisconsin). Gatedaxial scans with 2.5 mm slice thickness were performedusing a tube energy of 120 kVp and the tube current ad-justed for individuals’ body mass index. Images weresubsequently analyzed using an AW VolumeShare 7workstation (GE Healthcare, Milwaukee, Wisconsin),and regions of coronary calcification were manuallyidentified in order to compute Coronary Artery Calcium(CAC) Agatston scores [12]. We used Multi-EthnicStudy of Atherosclerosis (MESA) [13] reference CACvalues to calculate the percentile of calcification for eachindividual matched for age, sex, and ethnicity.For microbiome sequencing, we performed whole gen-
ome sequencing on stool samples to analyze the micro-bial communities [11]. For this modality, the featuresincluded species richness, species diversity, the fractionof human DNA, Proteobacteria, and the abundance of
Shomorony et al. Genome Medicine (2020) 12:7 Page 2 of 14

72 genera [11, 14]. Microbiome species richness was de-fined as the number of species present at a relativeabundance greater than 10−4. Microbiome species diver-sity was defined as the Shannon entropy of the taxonabundance vector [15].Whole genome sequencing data was used to compute
the following features: polygenic risk scores (PRS) [16] for51 diseases and traits, HLA type [17], 30 known short tan-dem repeats (STR) disease loci [18], and known rarepathogenic variants from ClinVar (set 1 and set 2 fromShah et al. [19]). We also computed ancestry using themethod described by Telenti et al. [20] from WGS data.
Data pre-processingTo satisfy the normality assumption of the statistical testsused in the analysis, we first performed data transform-ation on certain features (described below) and then ad-justed for covariates. This order of data pre-processinghas been shown to avoid introducing bias [21]. To addressthe non-Gaussian distributions of various features fromseveral modalities, we utilized a rank-based inverse normaltransformation [22]. We applied this transformation to allmicrobiome abundance data, as these features exhibitnon-Gaussian distributions. The transformation was alsoapplied to other features where more than 40% of thesamples had the same value. Several features were corre-lated with age, sex, and/or ancestry. To remove this cor-relation, we used multiple linear regression to identify thesignificantly associated (p < 0.01) covariates among age,sex, and the first four principal components representingthe ancestry. The feature values were corrected by regres-sing out the significantly associated covariates.
Network analysisWe used a combination of methods to build a cross-modality association network, identify densely connectedmodules within the association network, and then ex-tract the key biomarkers representing each module.More precisely, we first used Spearman’s correlation toidentify statistically correlated pairs of cross-modalityfeatures. Second, we used the Louvain community detec-tion method to identify distinct modules reflective ofbiologically functional subnetworks. Third, to identifythe key features within a densely connected module, weconstructed a sparse network (also known as Markovnetwork) using the Graphical Lasso method. Below, wedescribe these steps in more detail.We point out that technically one could apply the
Graphical Lasso method to the entire dataset in order toproduce a Markov network with all the features. How-ever, since within-modality associations tend to be stron-ger than cross-modality associations, features from eachmodality have a tendency to cluster together. A resultingnetwork using all features is shown in Additional file 1:
Figure S9. Additionally, the Graphical Lasso method re-quires a complete data matrix, which will lead to imput-ing values for the missing data for all features (vs. asmaller subset of features in our multistep approach).This can make the results less reliable. By first con-structing an association network based only on cross-modality associations (following the approach from Priceet al. [8]) and running a community detection algorithm,the resulting communities tend to be multimodal. Thus,we opted to use a combination of network methods toobtain more informative modules with multimodalfeatures.
Constructing multimodal correlation modulesWe performed Spearman’s correlation analysis and cal-culated p values for each cross-modality pair of features.The correlation was computed on individuals for whichboth features were present. The correlation was calcu-lated only if at least 30 individuals had data for the pairof features. We selected statistically significant associ-ation using the Benjamini-Hochberg [23] approach tolimit the false discovery rate to 5%.The significant associations were used to construct a
network where each feature is a node, and the associ-ation between two feature nodes is an edge. The weightof an edge is defined as −log(p), where p is the p valueof the corresponding Spearman correlation. Metabolomeand clinical lab measured several of the same or similarmetabolites. To avoid having the structure of the net-work mainly driven by strong associations between themetabolome and clinical lab features, we ignored thoseedges for the identification of the initial modules. Toidentify densely connected sets of nodes, i.e., “modules”in the network, we used the Louvain algorithm for com-munity detection [24]. The Louvain method is a widelyused tool for uncovering community structure fromlarge networks. It seeks to maximize the network modu-larity in a greedy fashion. Initially, each node is seen asits own community. Nodes are then iteratively merged,such that it maximizes the gain in modularity until themodularity can no longer be increased. The resulting“super-nodes” are the communities. For a true represen-tation of molecular features involved in multiple bio-logical functions, we allowed for nodes to belong tomultiple modules. More precisely, when a node assignedto a module had at least 20 more significant associationswith nodes from another module than it had with itsassigned module, then the node was placed in both themodules.The robustness of the resulting modules was assessed in
the following ways (additional details in Additional file 3:Supplementary Notes). The Louvain community detectionalgorithm was run 300 times with different seeds, which isused to order the nodes for community expansion. We
Shomorony et al. Genome Medicine (2020) 12:7 Page 3 of 14

examined the modularity score for each of the runs. Next,we built a consensus matrix [25] by calculating the num-ber of times the same pair of nodes are grouped togetherin a module, across the 300 runs. Additionally, we calcu-lated consistency score for both sets of key biomarkersidentified in the two modules, by counting the averagenumber of times a pair of features were grouped in thesame module.
Key biomarker selection and Markov network constructionWe performed a deeper analysis of the two largest modulesidentified using the community detection method. Firstly, alist of module-representative features was identified. Specif-ically, for each module, we ranked the nodes by their eigen-vector centrality score to identify the topmost centralfeatures. Secondly, a conditional independence network foreach of the selected modules was derived. Specifically, weused the central features to construct a sparse networkusing the Graphical Lasso method [26]. This method esti-mates the inverse covariance matrix of the selected featuresusing a lasso penalty to induce sparsity. The method doesnot allow for missing values in the data matrix and assumesa normally distributed data. Thus, the central features usedin this method were mean-imputed (only 10% of the matrixrequired imputation) and converted to Gaussian distribu-tions using the rank-based inverse normal transformationas described in the “Data pre-processing” section. In theresulting conditional independence network (also known asa “Markov network”), the absence of an edge between twofeatures implies that they are conditionally independentgiven the remaining features in the network. Additional in-formation on Markov network is provided in Add-itional file 3: Supplemental Notes.In the Markov network, features that had a connection
with at least one cross-modality feature were selected askey biomarkers for the downstream analysis. This pro-cedure of selecting key biomarkers ensures that the in-herently stronger associations within each modality donot overpower associations that are cross modal, thusavoiding biased representation. Unlike the cross-modality correlation network, in the Markov network,the edges between features from the same modality wereincluded. This allowed for identification of key bio-markers of the underlying biological mechanism regard-less of the modality origin.
Stratifying individuals with similar biomarker signaturesFor each selected module, we used the identified keybiomarkers to stratify the individuals. Each feature wasscaled to have zero mean and unit variance. The missingvalues were imputed using softImpute [27]. Then, weperformed hierarchical clustering on the individualsbased on complete linkage and a correlation distancemetric. We selected the lowest cutting point of the
hierarchical cluster tree such that the resulting clusterswould have at least 50 individuals. To access the cluster-ing, we computed for each individual the median dis-tance to each of the seven subsets and identified theclosest subset to each individual.
Statistical associations between clusters and other traitsWe compared the rates of disease diagnosis and medica-tion use across the seven cardiometabolic and the sevenmicrobiome richness subsets. Fisher’s exact test wasused (using a Monte Carlo simulated p value with 1E6replicates) to test for statistical significance after theBonferroni correction for multiple tests.We also compared the individuals in each subset to all
individuals not in that subset for each of the 1354 fea-tures using a logistic regression. There was thus a separ-ate analysis performed for subset 1 vs. everyone else,subset 2 vs. everyone else, etc. Significant associationswere those that survived the Bonferroni correction formultiple tests.
Validation cohortFor validation of our findings, we utilized 1083 individ-uals from a study cohort (referred to here as “TwinsUK”)of largely European ancestry female twins enrolled in theTwinsUK registry, a British national register of adulttwins [28]. The cohort included data from WGS, metab-olome, microbiome, DEXA, clinical blood laboratorytests, and personal history of disease and medication.The data from the modalities was collected from threelongitudinal visits over the course of a median of 13years. To capture a population with adequate samplesizes for the overlapping modalities used in the presentstudy, we restricted our analysis to data from visit 2 (re-ferred here as “baseline”) and visit 3 (referred here as“follow-up”). Microbiome samples were only collected atvisit 3. The median age at visit 2 was 51, range 41–79.To be included in the analysis, phenotyping measure-ments were required to be collected within 90 days ofthe metabolome draw for each visit, or within 6monthsfor microbiome. For the validation of metabolome andmicrobiome correlations, we used only one of the twinsto avoid bias from relatedness, totaling 538 individuals.For the cardiometabolic module analysis, we imputedliver fat, gamma-glutamyl transferase (GGT), IGT, IR,and glucose using regularized linear regression with L1penalty.
Data pre-processing and assignment for validation cohortThe data was pre-processed using the same correctionfor age, sex, and ancestry that was used for the main co-hort. Specifically, we used the regression coefficientslearned during the pre-processing of the study cohortdataset to correct the data in the validation cohort. The
Shomorony et al. Genome Medicine (2020) 12:7 Page 4 of 14

corrected data from the validation cohort was thenmapped to the individual subsets as follows. For eachsubset, the median for each of the key biomarkers withinthe subset was computed, giving rise to a “representativesignature” for that subset. For each individual in the val-idation cohort, correlation distances to each of the rep-resentative signatures were computed, and the individualwas assigned to the closest one. Note that correlationdistances were used since the hierarchical clustering ofthe study cohort was conducted using correlationdistance.
ResultsWe carried out multimodal tests on 1253 self-assessedhealthy adults (median age 53; 63% male; 71% Europeanancestry) using our genomic and deep phenotyping plat-form [4]. The modalities included whole genome sequen-cing, metabolome, microbiome, advanced imaging, andclinical tests. We derived 1385 features from the collecteddata (Additional file 1: Table S1; Additional file 3: Supple-mentary Notes). To extract patterns indicative of biologicalmechanisms, we applied machine learning methods to thisheterogeneous dataset. Specifically, we performed (1) cor-relation analysis to identify significant associations betweencross-modal features, (2) network analysis to identify
modules and their biomarker signatures representative ofthe underlying biological systems, and (3) cluster analysis tostratify individuals into distinct subsets using the identifiedsignatures that are consistent with different health status(Fig. 1; Additional file 3: Supplemental Notes). We furthercharacterized the subsets and examined disease risk usingindividuals’ personal history. We used an independent co-hort of 1083 females (TwinsUK) to validate our findingsand to assess associations with longitudinal disease diagno-sis data.
Multimodal correlations and network analysisWe calculated correlations for each cross-modality pairof normalized features and selected a list of 11,537 sta-tistically significant associations out of 427,415 totalcross-modality comparisons (FDR < 0.05; see the“Methods” section). The largest number of significantassociations (n = 5570) was observed between metabo-lome and clinical lab features. Of all the possible correla-tions between features from the two modalities, thesesignificant associations accounted for 5% (Fig. 2a). Thesecond largest number of significant associations was be-tween the metabolome and microbiome features (n =2031; 3%), followed by metabolome and body compos-ition features (n = 1858; 17%). We discuss some of these
Fig. 1 a In the study, we collected multimodal data (n = 1385 features) from 1253 individuals. b We analyzed the data by performing cross-modality associations between features after correcting for age, sex, and ancestry. c Using the associations, we performed community detectionanalysis and found modules of densely connected features. d To reduce the number of indirect associations and identify key biomarker features,we performed conditional independence network analysis (also referred to as a Markov network). e Using the identified key biomarkers, weclustered individuals into distinct groups with similar signatures that are consistent with different health statuses. We characterize the clusters andperform disease risk enrichment analysis
Shomorony et al. Genome Medicine (2020) 12:7 Page 5 of 14

associations below. Additionally, some of the importantfindings from metabolome and body composition havebeen discussed in Cirulli et al.The most significant associations, apart from those be-
tween metabolome and lab features, were expected cor-relations supporting well-established prior clinicalresearch (see Additional file 3: Supplementary Notes).Additionally, we observed novel associations betweenthe metabolite p-cresol sulfate (pCS) and the micro-biome genus Intestinimonas as well as an unclassifiedgenus in the Erysipelotrichaceae family (p = 2.92E−24and p = 2.98E−20, respectively; Fig. 2b). Other knownmicrobiome features associated with pCS were also ob-served [29–31]. This included associations with speciesdiversity (p = 6.54E−19) and several genera (Pseudoflavo-nifractor, Anaerotruncus, Subdoligranulum, and Rumini-clostridium) in the Ruminococcaceae family (p = 9.52E−32, p = 1.39E−23, p = 9.48E−19, and p = 3.26E−11, re-spectively). These associations were validated in the in-dependent TwinsUK cohort (see the “Methods” section;Additional file 1: Table S2).
The significant associations were used to construct a net-work with features as nodes and feature associations asedges. Using a community detection method, sets of highlyconnected features (referred to as modules) were then identi-fied (see the “Methods” section). Intuitively, the modulesshould group together features that are biologically related,indicative of biologically functional subnetworks. The resultwas numerous small modules and two modules that had farlarger numbers of features (n > 100 each). The largest was acardiometabolic module containing many markers associatedwith cardiac disease and metabolic syndrome, similar to amodule previously observed by Price et al. [8]. The secondlargest module was predominantly composed of microbiometaxa abundance and several metabolites that are known tobe biomarkers for gut microbiome diversity. We refer to thismodule as the microbiome richness module. The moduleswere tested for their robustness. The average modularityscore was 0.37 (Additional file 1: Figure S1), and theconsistency score was > 0.80 (Additional file 3: SupplementalNotes; Additional file 1: Figure S2). Next, we present furtherdetailed analysis on these two largest modules.
Fig. 2 The number of significant cross-modality correlations for each pair of modalities is shown (a). The percentages shown are the proportionof correlations that were significant out of all possible pairwise associations between the modality pair. b Associations between p-cresol sulfatemetabolite and (top) abundance of Intestinimonas genus, and (bottom) an abundance of unclassified genus in Erysipelotrichaceae family
Shomorony et al. Genome Medicine (2020) 12:7 Page 6 of 14

Cardiometabolic moduleThe largest module in the association network contained355 nodes from clinical labs, metabolome, quantose, CT,microbiome, vitals, genetics, MRI-body, and body com-position data modalities. The most central features in themodule were identified using an eigenvector centralityscore (see the “Methods” section). These features includedvisceral adipose tissue mass, BMI, liver fat percentage, leanmass percentile, glucose levels, blood pressure (BP), tri-glycerides levels, IR score, several lipid metabolites, andseveral microbiome genera, including butyrate-producingbacterial genera such as Pseudoflavonifractor, Butyrivibrio,Intestinimonas, and Faecalibacterium. Some of these fea-tures are known to be associated with obesity, heart dis-ease, and metabolic syndrome.
Network analysis for key biomarker selectionTo remove redundancy and transitive associations fromthe module, we created a Markov network containingonly the associations that were significant after condi-tioning on all other features (see Additional file 3:Supplemental Notes and the “Methods” section). Thisprocess thus captured a more meaningful network of in-teractions between the features of the module. Theresulting cardiometabolic network is shown in Fig. 3a. Inthe Markov network, features that had a connection with
at least one feature from a different modality were se-lected as key biomarkers for downstream analysis. Thisprocedure of selecting key biomarkers ensures that theinherently stronger associations within each modality donot overpower associations that are cross modal, thusavoiding biased representation. For example, the micro-biome genera Butyrivibrio and Pseudoflavonifractor arethe only microbiome features that are connected to fea-tures from other modalities (the lipid metabolite 1-(1-enyl-palmitoyl)-2-oleoyl-GPC (P-16:0/18:1) and serumtriglyceride) and are thus selected as key biomarkers(Fig. 3a). On the other hand, liver iron and gamma-tocopherol/beta-tocopherol are only associated featuresfrom their respective modalities and are hence not se-lected as key biomarkers. A total of 22 key cardiometa-bolic biomarkers were identified. An exception to thisrule was that we replaced diastolic BP with systolic BP.These two features were heavily correlated and essen-tially interchangeable, but based on an expert opinion,we chose the systolic BP as a better marker for cardio-metabolic conditions.These key biomarkers included established features for
cardiac and metabolic conditions (e.g., BMI, BP, glucoselevels, and HDL) and also novel biomarkers from metabo-lome and microbiome (Fig. 3a). High abundance of themicrobiome genera Butyrivibrio and Pseudoflavonifractor
Fig. 3 The cardiometabolic module. a We built a Markov network to identify the key biomarker features that represent the cardiometabolicmodule. This network highlights the most important associations after removing edges corresponding to indirect associations. We observed thatthe microbiome genera Butyrivibrio and Pseudoflavonifractor are the most relevant microbiome genera in the context of this module thatinterface with features from other modalities. b We clustered individuals using the key biomarkers. The heatmap shows z-statistics from logisticregression for an association between each cluster and each feature. The plot on the left shows the 22 key cardiometabolic biomarkers. The ploton the right shows associations that emerged from an analysis against the full set of 1385 features with p < 1 × 10⁻¹⁰ as well as 3-hydroxybutyrate (BHBA) and Apolipoprotein B because of their particular enrichment in clusters 3 and 6, respectively. Some correlated featureshave been collapsed, with the mean z-statistics displayed; the full set of features can be found in Additional file 1: Figure S1. All of thesesignificant associations showed consistent directions of effect in the TwinsUK cohort (Additional file 2: Table S3); however, the microbiomefeatures and 5 of the glycerophosphocholines were not measured in the TwinsUK cohort and thus could not be assessed for replication.Met, metabolome
Shomorony et al. Genome Medicine (2020) 12:7 Page 7 of 14

was well correlated with features that are generally consid-ered to be correlated with “good” cardiometabolic health(defined using traditional markers such as BMI, BP, andlipid levels). Several metabolites with unknown clinicalrelevance were correlated with signatures consisting ofclinical biomarkers indicative of good health, such as 1-(1-enyl-palmitoyl)-2-oleoyl-glycero-3-phosphocholine (GPC)and 1-eicosenoyl-GPC, and that of disease risk, such asglutamate, butyrylcarnitine, lactate, 1-stearoyl-2-dihomo-linolenoyl-GPC, and 1-palmitoleoyl-2-oleoyl-glycerol.
Stratification of individuals and characterizationTo assess the relationship between the health status ofindividuals and these 22 key biomarkers, we stratified in-dividuals using hierarchical clustering. This clusteringresulted in seven subsets of individuals, each with aunique biomarker signature (threshold of 1.65 correl-ation distance; Fig. 3b, Additional file 1: Figure S3). Themembership of the clusters was further examined bystudying its distance relative to other clusters (see the“Methods” section; Additional file 1: Figure S4). We ob-served that the majority of individuals were closest totheir own subset. Cluster analysis solves the practicalproblem of stratifying individuals to subgroups based onshared signatures of these biomarkers. While the indi-vidual profiles with unique signatures in general lie on acontinuum and the resulting subsets are not fully iso-lated from each other, this stratification procedure al-lows for further investigation such as disease prevalenceenrichment in these subsets of individuals.In order to improve the characterization and our under-
standing of these subsets, we compared each subset usingthe full set of 1385 features (Additional file 1: Figure S5).We identified 106 features beyond the 22 used to derive thecardiometabolic subsets that were significantly (p < 5.1E−06) enriched in at least one subset compared to the others(Fig. 3b, Additional file 1: Figure S5 and Additional file 2:Table S3). Of the 78 features that were also measured inour validation cohort (TwinsUK baseline), 97.8% of the as-sociations discovered between features and subsets hadconsistent directions of effect in our validation cohort, and77.8% were statistically significant (replication p < 3.9E−04;Additional file 2: Table S3).Based on the clinically interpretable biomarkers, such as
BMI, liver fat, and insulin resistance, associated with eachof the subsets (Additional file 3: Supplemental Notes), weconsider subsets 1–4 to be the ones with markers consist-ent with good health (subset 1 being the “healthiest”) and5–7 as the subsets with markers consistent with diseaserisk (subset 7 being the most “at-risk”).
Disease prevalence in cohort subsetsIn addition to associations with features, we also com-pared rates of previously diagnosed cardiometabolic
conditions between the subsets. We found significantdifferences between subsets in their rates of diabetes andhypertension diagnoses that were confirmed in the valid-ation cohort (Additional file 3: Supplemental Notes;Fig. 4; Additional file 1: Figure S6). Specifically, subset 7had significantly higher rates of diabetes, while subset 1had significantly lower rates of diabetes and hyperten-sion. Interestingly, subset membership was a better pre-dictor of diabetes diagnoses than were the traditionalclinical features used to determine diabetes status: glu-cose, IGT score, IR score, and BMI (Additional file 3:Supplemental Notes). The cardiometabolic key bio-markers that were the largest drivers of this associationbetween diabetes and subset 7 were the IR score, thepercent lean body mass, and the metabolites 1-stearoyl-2-dihomo-linolenoyl-GPC (18:0/20:3n3 or 6) and 1-(1-enyl-palmitoyl)-2-oleoyl-GPC (P-16:0/18:1).We additionally investigated enrichment of rare patho-
genic variants in any of the subsets and found only threeindividuals with such variants (Additional file 3: Supple-mental Notes).
Longitudinal disease outcomeOur validation cohort was followed for a median of 5.6(range 1.2–10.1) years, providing us with the opportunityto examine the longitudinal health trends in each subset.During this follow-up, we observed 2 new diagnoses ofdiabetes, 2 cardiovascular events (angina and myocardialinfarction), 7 strokes or transient ischemic attack (TIA),24 new cases of hypertension, and 37 new cases of hyper-cholesterolemia. We found a significant difference be-tween subsets in the number of new hypertension cases(Fisher’s exact p = 0.009). Specifically, those in subset 6were at higher risk for developing hypertension, and thisassociation remained significant after controlling for base-line BP, BMI, and age (logistic regression p = 0.002).We also examined subset membership at the follow-up
(Fig. 4). We found that subset membership was fairlystable longitudinally, with 51.1% of individuals staying inthe same subset at the follow-up visit. For each subset ex-cept subset 6, the most common outcome at the follow-up visit was to remain in the same subset. Subset 6 had avery different pattern, with 84.3% of its members transi-tioning to other subsets, of which 55.8% moved to subset7. As subset 7 is the one most consistent with poor healthin terms of obesity, hypertension, and diabetes, this pro-pensity of subset 6 individuals to transition into subset 7individuals overtime supports the idea of subset 6 mem-bership as an early precursor to a poor health outcome.Indeed, rates of hypertension were not significantlyenriched in subset 6 in the TwinsUK cohort at baselinebut were after follow-up. Our analysis therefore supportsthe classification of subset 6 individuals as being at-riskand prioritized for intervention before they progress to
Shomorony et al. Genome Medicine (2020) 12:7 Page 8 of 14

the disease state. However, this classification requires fur-ther assessment, especially as our analysis also showedthat individuals in subset 6 and 7 should be thought ofmore as part of a continuous distribution than as two di-chotomous groups (Additional file 1: Figure S3).
Microbiome richness moduleThe microbiome richness module in the association net-work contained 167 features, the majority of which werefrom the metabolome (n = 98) and microbiome (n = 49)modalities. Similar to the in-depth analysis for the cardio-metabolic module, we performed a network analysis toidentify key biomarkers of this module and stratified indi-viduals into subsets to assess their health status. Sincemicrobiome was only measured for the last visit in ourlongitudinal validation cohort, we were unable to performlongitudinal disease outcome analysis for this module.
Network analysis for key biomarker selectionWe construct a Markov network that identified the inter-face between the microbiome taxa and the metabolites inthis module (Fig. 5a). In particular, we observed that mostof the associations between the microbiome and the me-tabolome were mediated by species richness (i.e., thenumber of species present at a relative abundance greaterthan 10−4). Specifically, species richness is associated tothe mutually connected metabolites cinnamoylglycine,hippurate, and 3-phenylpropionate. This relationship is inagreement with a previous study [32] that showed cinna-moylglycine and hippuric acid were not found in germ-free mice, and that 3-phenylpropionic acid is a metabolicproduct of anaerobic bacteria. Furthermore, a recent study[29] identified hippurate and 3-phenylpropionate as meta-bolic markers for microbiome diversity, with hippurate be-ing the strongest of the three. These studies indicate that
Fig. 4 Disease enrichment and longitudinal outcomes of cardiometabolic clusters. a Bar plots showing the prevalence of disease at baseline(combined discovery and TwinsUK baseline cohorts; Additional file 1: Figure S2 shows them individually) and the incidence of disease (i.e., onlythe new cases of disease) after a median of 5.6 years of follow-up (TwinsUK cohort). For Fisher’s exact test comparison of the rate in each clustervs. the other clusters, *p < 0.05, **p < 0.005. b The rates at which individuals from each cluster transition into other clusters after a median of 5.6years of follow-up. The plot shows individuals per cluster (1 to 7) at baseline visit that transition to other clusters during the follow-up. TIA,transient ischemic attack
Shomorony et al. Genome Medicine (2020) 12:7 Page 9 of 14

cinnamoylglycine, hippurate, and 3-phenylpropionate areproduced by the microbiome. Our model shows a connec-tion between the levels of these metabolites, species rich-ness, and other markers of a healthy metabolome as wellas markers of good health, such as low levels of liver fatand visceral adipose tissue. Our findings suggest that spe-cies richness is more directly associated with these meta-bolic markers than species diversity. In addition,cinnamoylglycine may be a metabolic marker for gutmicrobiome health and the overall health.As in the case of the cardiometabolic module, we se-
lected our key biomarkers by excluding features thatwere only connected to their own modality in the Mar-kov network. This resulted in 24 key biomarkers.
Stratification of individuals and characterizationUsing the 24 key biomarkers, we stratified individuals into7 subsets (Fig. 5b). The lipid signature that characterizedthis module had the lowest levels in subset 1 and the high-est levels in subset 7, while the microbiome genera abun-dances and species diversity were the highest in subset 1and the lowest in 7. The exception was Bacteroides, whichshowed the opposite trend. Associations with the full setof 1345 features showed that subset 7 could be character-ized as having markers consistent with being the leasthealthy, with the highest levels of body fat, BMI, triglycer-ides, and total cholesterol and the lowest lean mass. Sub-set 1 had values at the opposite extreme for each of thesetraits and can be characterized as having markers consist-ent with the best health. In addition, the subsets werelargely distinguished by differences in various lipids andmicrobiome genera (Additional file 3: SupplementalNotes; Fig. 5b; Additional file 1: Figure S7).While the subsets could potentially reflect different
states of gut microbiome health, which may be
associated with overall cardiometabolic health, we foundno enrichment of cardiometabolic or other diseases inany of the subsets.
Comparing membership across the modulesWe proceeded to compare the membership of individ-uals in the subsets from the cardiometabolic and themicrobiome richness modules. There was significantly(p < 0.001) more overlap of individuals between subsets7 in the two modules and also between subsets 1 thanexpected by chance: 66% of those in the microbiomerichness subset 7 were in the cardiometabolic subset 7,and 45% of those in the microbiome richness subset 1were also in the cardiometabolic subset 1. In contrast,only 1% of those in microbiome richness subset 7 werein cardiovascular subset 1 (Additional file 1: Figure S8).
DiscussionWe analyzed 1385 multimodal features collected from1253 individuals using a combination of unsupervisedmachine learning and statistical approaches. We identi-fied novel associations and novel biomarker signaturesthat stratified individuals into distinct health states. Themain findings were replicated in an independent valid-ation cohort of 1083 females (TwinsUK). In addition, weshowed that such an approach can be used on longitu-dinal data to identify individuals who may be in the earlydisease transition state.Specifically, we performed association analysis of fea-
tures across modalities and found novel significant asso-ciations between p-cresol sulfate (pCS) and themicrobiome genera Intestinimonas and an unclassifiedgenus in the Erysipelotrichaceae family. pCS is a knownmicrobial metabolite and is considered to be an uremictoxin [31, 33–35]. It is produced by bacteria fermenting
Fig. 5 The microbiome richness module. a We built a Markov network to identify the key biomarker features that represent the microbiomerichness module. Most of the associations between the microbiome and the metabolome were mediated by species richness. b We clusteredindividuals using the key biomarkers. The heatmap shows z-statistics from logistic regression for an association between each cluster and eachfeature. The plot on the left shows the 24 key biomarkers representing the module. Met, metabolome
Shomorony et al. Genome Medicine (2020) 12:7 Page 10 of 14
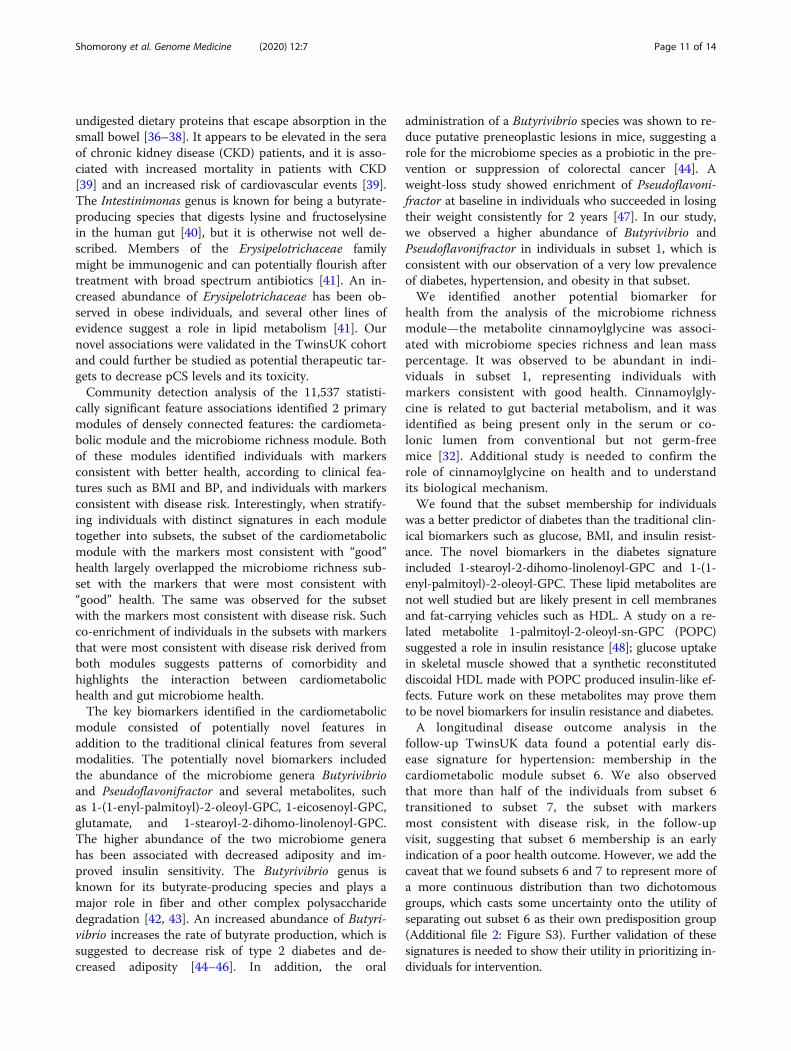
undigested dietary proteins that escape absorption in thesmall bowel [36–38]. It appears to be elevated in the seraof chronic kidney disease (CKD) patients, and it is asso-ciated with increased mortality in patients with CKD[39] and an increased risk of cardiovascular events [39].The Intestinimonas genus is known for being a butyrate-producing species that digests lysine and fructoselysinein the human gut [40], but it is otherwise not well de-scribed. Members of the Erysipelotrichaceae familymight be immunogenic and can potentially flourish aftertreatment with broad spectrum antibiotics [41]. An in-creased abundance of Erysipelotrichaceae has been ob-served in obese individuals, and several other lines ofevidence suggest a role in lipid metabolism [41]. Ournovel associations were validated in the TwinsUK cohortand could further be studied as potential therapeutic tar-gets to decrease pCS levels and its toxicity.Community detection analysis of the 11,537 statisti-
cally significant feature associations identified 2 primarymodules of densely connected features: the cardiometa-bolic module and the microbiome richness module. Bothof these modules identified individuals with markersconsistent with better health, according to clinical fea-tures such as BMI and BP, and individuals with markersconsistent with disease risk. Interestingly, when stratify-ing individuals with distinct signatures in each moduletogether into subsets, the subset of the cardiometabolicmodule with the markers most consistent with “good”health largely overlapped the microbiome richness sub-set with the markers that were most consistent with“good” health. The same was observed for the subsetwith the markers most consistent with disease risk. Suchco-enrichment of individuals in the subsets with markersthat were most consistent with disease risk derived fromboth modules suggests patterns of comorbidity andhighlights the interaction between cardiometabolichealth and gut microbiome health.The key biomarkers identified in the cardiometabolic
module consisted of potentially novel features inaddition to the traditional clinical features from severalmodalities. The potentially novel biomarkers includedthe abundance of the microbiome genera Butyrivibrioand Pseudoflavonifractor and several metabolites, suchas 1-(1-enyl-palmitoyl)-2-oleoyl-GPC, 1-eicosenoyl-GPC,glutamate, and 1-stearoyl-2-dihomo-linolenoyl-GPC.The higher abundance of the two microbiome generahas been associated with decreased adiposity and im-proved insulin sensitivity. The Butyrivibrio genus isknown for its butyrate-producing species and plays amajor role in fiber and other complex polysaccharidedegradation [42, 43]. An increased abundance of Butyri-vibrio increases the rate of butyrate production, which issuggested to decrease risk of type 2 diabetes and de-creased adiposity [44–46]. In addition, the oral
administration of a Butyrivibrio species was shown to re-duce putative preneoplastic lesions in mice, suggesting arole for the microbiome species as a probiotic in the pre-vention or suppression of colorectal cancer [44]. Aweight-loss study showed enrichment of Pseudoflavoni-fractor at baseline in individuals who succeeded in losingtheir weight consistently for 2 years [47]. In our study,we observed a higher abundance of Butyrivibrio andPseudoflavonifractor in individuals in subset 1, which isconsistent with our observation of a very low prevalenceof diabetes, hypertension, and obesity in that subset.We identified another potential biomarker for
health from the analysis of the microbiome richnessmodule—the metabolite cinnamoylglycine was associ-ated with microbiome species richness and lean masspercentage. It was observed to be abundant in indi-viduals in subset 1, representing individuals withmarkers consistent with good health. Cinnamoylgly-cine is related to gut bacterial metabolism, and it wasidentified as being present only in the serum or co-lonic lumen from conventional but not germ-freemice [32]. Additional study is needed to confirm therole of cinnamoylglycine on health and to understandits biological mechanism.We found that the subset membership for individuals
was a better predictor of diabetes than the traditional clin-ical biomarkers such as glucose, BMI, and insulin resist-ance. The novel biomarkers in the diabetes signatureincluded 1-stearoyl-2-dihomo-linolenoyl-GPC and 1-(1-enyl-palmitoyl)-2-oleoyl-GPC. These lipid metabolites arenot well studied but are likely present in cell membranesand fat-carrying vehicles such as HDL. A study on a re-lated metabolite 1-palmitoyl-2-oleoyl-sn-GPC (POPC)suggested a role in insulin resistance [48]; glucose uptakein skeletal muscle showed that a synthetic reconstituteddiscoidal HDL made with POPC produced insulin-like ef-fects. Future work on these metabolites may prove themto be novel biomarkers for insulin resistance and diabetes.A longitudinal disease outcome analysis in the
follow-up TwinsUK data found a potential early dis-ease signature for hypertension: membership in thecardiometabolic module subset 6. We also observedthat more than half of the individuals from subset 6transitioned to subset 7, the subset with markersmost consistent with disease risk, in the follow-upvisit, suggesting that subset 6 membership is an earlyindication of a poor health outcome. However, we add thecaveat that we found subsets 6 and 7 to represent more ofa more continuous distribution than two dichotomousgroups, which casts some uncertainty onto the utility ofseparating out subset 6 as their own predisposition group(Additional file 2: Figure S3). Further validation of thesesignatures is needed to show their utility in prioritizing in-dividuals for intervention.
Shomorony et al. Genome Medicine (2020) 12:7 Page 11 of 14

We did not observe a substantial number of significantfindings for the genetic features, which included poly-genic risk scores (PRS), HLA types, and known raredisease-causing variants (Additional file 2: Table S3;Additional file 3: Supplementary Notes). This result isnot unexpected given the relatively small sample sizeconsidered here compared to the large sample sizes re-quired for finding statistically significant association ingenetic studies. Additionally, the analyses focus on themain/strongest findings from unsupervised pattern de-tection, and an overwhelming signal from other func-tional measurements dampens signals from genetics.The types of associations with the largest effect sizeswould be for rare variants and diseases, for which anypopulation-based cohort like the one studied here wouldbe underpowered. Finally, the PRS derived using com-mon variants for certain traits could only explain a smallfraction of the variance; therefore, we are underpoweredto detect significant associations.In recent years, several organizations have begun gath-
ering cohorts with high throughput data from multiplemodalities. The collection of such datasets from largecohorts is a necessary step in systems medicine to gaincomprehensive insights into an individual’s health statusand to understand complex disease mechanisms. A sys-tematic and supervised approach to analyze an individ-ual’s genome and deep phenotype data, as shown in ourprevious publication [4], is important for precision medi-cine screening. However, it is also crucial to perform un-supervised multimodal data analyses, as described here,to sift through this wealth of information for novel find-ings of signatures of health and disease. These novel dis-coveries and the characterization of complexinteractions allow us to transition towards personalized,preventative health risk assessments.
ConclusionIn summary, the approach described in this study dem-onstrates the power of utilizing a combination of un-supervised machine learning methods on integratedmultimodal data to derive novel biomarker signaturesfor different health states. Additionally, we show applica-tion of this approach on longitudinal data to identifypotentialearly disease signatures that can stratify individ-uals for a personalized, preventative health riskassessment.
Supplementary informationSupplementary information accompanies this paper at https://doi.org/10.1186/s13073-019-0705-z.
Additional file 1: Figure S1. Modularity score. Figure S2. Consensusmatrix. Figure S3. Stratification of individuals. Figure S4. Subsetmembership. Figure S5. The cardiometabolic module. Figure S6.
Prevalence of disease diagnoses. Figure S7. The microbiome richnessmodule. Figure S8. Membership comparison. Figure S9. Network usingGraphical Lasso as an alternative method. Table S1. Features permodality. Table S2. Microbiome genera associated with p-cresol sulfate.
Additional file 2: Table S3. Features associated with cardiometabolicsubsets.
Additional file 3. Supplementary Notes.
Additional file 4. Multimodal correlation data.
Additional file 5. Median value of key biomarkers, sample subsetmembership and sample similarity score for the cardiometabolic moduleand the microbiome richness module.
AbbreviationsBMI: Body mass index; BP: Blood pressure; CAC: Coronary artery calcium;CKD: Chronic kidney disease; CT: Computed tomography; DEXA: Dual-energyx-ray absorptiometry; FDR: False discovery rate; GGT: Gamma-glutamyltransferase; GPC: Glycero-3-phosphocholine; HDL: High-density lipoprotein;HLA: Human leukocyte antigen type; IGT: Impaired glucose tolerance;IR: Insulin resistance; LDL: Low-density lipoprotein; MRI: Magnetic resonanceimaging; pCS: p-Cresol sulfate; PRS: Polygenic risk scores; STR: Short tandemrepeats; TIA: Transient ischemic attack; WGS: Whole genome sequencing
AcknowledgementsThe authors would like to acknowledge the individuals who participated inthe study, and the numerous Health Nucleus and Human Longevity Inc.employees who were involved in interacting with participants, generation ofraw data, and building the data infrastructure. We also thank the reviewersfor their time and comments.
Authors’ contributionsJCV and DSK conceived the study. IS, ETC, EFK, and NS designed theresearch. IS, ETC, LH, and NS conducted the analysis. ETC, LH, LAN, CH, CLS,NMS, WL, KEN, PB, and NS aided with the data collection. IS, ETC, LH, RRH,MH, IVC, HCY, AMK, CTC, EFK, and NS supported the interpretations. IS, ETC,and NS wrote the paper. TDS is responsible for the TwinUK study. All authorsread and approved the final manuscript.
FundingThe study was funded by Human Longevity, Inc.
Availability of data and materialsThe correlation data analyzed in this study is included in this publishedarticle as a supplementary file (Additional file 4). The median key biomarkervalues for each subset, subset membership, and sample similarity score forthe cardiometabolic module and the microbiome richness module areprovided in Additional file 5. The validation cohort is accessible throughmanaged access in accordance with TwinsUK data governance at http://twinsuk.ac.uk/resources-for-researchers/access-our-data/. We do not have theapproval in our IRB protocol to deposit the raw data from our participants,but additional sample-level data are available on reasonable request.
Ethics approval and consent to participateThe data on humans was collected and analyzed under the approvedresearch study by the Western Institutional Review Board (IRB trackingnumber: 20171934; study number: 1178405). Written informed consent wasobtained from all study participants. The research conformed to theprinciples of the Helsinki Declaration.
Consent for publicationNot applicable
Competing interestsIS, ETC, LH, LAN, RRH, MH, IVC, HCY, CLS, NMS, WL, KEN, PB, AMK, CTC, JCV,DSK, EFK, and NS are past or current employees or contractors of HumanLongevity, Inc. The remaining authors declare that they have no competinginterests.
Shomorony et al. Genome Medicine (2020) 12:7 Page 12 of 14
Author details1Human Longevity, Inc., San Diego, CA 92121, USA. 2Electrical and ComputerEngineering, University of Illinois at Urbana-Champaign, Urbana, IL 61820,USA. 3J. Craig Venter Institute, La Jolla, CA 92037, USA. 4Division ofCardiovascular Medicine, School of Medicine, University of California SanDiego, La Jolla, CA 92093, USA. 5Department of Twin Research and GeneticEpidemiology, King’s College London, London, UK. 6Molecular and HumanGenetics, Baylor College of Medicine, Houston, TX 77030, USA.
Received: 4 October 2019 Accepted: 12 December 2019
References1. Hartman M, Martin AB, Espinosa N, Catlin A, The National Health
Expenditure Acc. National health care spending in 2016: spending andenrollment growth slow after initial coverage expansions. Health Aff. 2018;37:150–60. https://doi.org/10.1377/hlthaff.2017.1299.
2. Mokdad AH, Ballestros K, Echko M, Glenn S, Olsen HE, Mullany E, et al. Thestate of US health, 1990-2016. JAMA. 2018;319:1444. https://doi.org/10.1001/jama.2018.0158.
3. Benziger CP, Roth GA, Moran AE. The global burden of disease study andthe preventable burden of NCD. Glob Heart. 2016;11:393–7. https://doi.org/10.1016/j.gheart.2016.10.024.
4. Perkins BA, Caskey CT, Brar P, Dec E, Karow DS, Kahn AM, et al. Precisionmedicine screening using whole-genome sequencing and advancedimaging to identify disease risk in adults. Proc Natl Acad Sci U S A. 2018;115:3686–91. https://doi.org/10.1073/pnas.1706096114.
5. Murray CJL, Frenk J. Ranking 37th — measuring the performance of the U.S.health care system. N Engl J Med. 2010;362:98–9. https://doi.org/10.1056/NEJMp0910064.
6. Hood L, Flores M. A personal view on systems medicine and theemergence of proactive P4 medicine: predictive, preventive, personalizedand participatory. New Biotechnol. 2012;29:613–24. https://doi.org/10.1016/j.nbt.2012.03.004.
7. Argelaguet R, Velten B, Arnol D, Dietrich S, Zenz T, Marioni JC, et al. Multi-omics factor analysis-a framework for unsupervised integration of multi-omics data sets. Mol Syst Biol. 2018;14:e8124. https://doi.org/10.15252/MSB.20178124.
8. Price ND, Magis AT, Earls JC, Glusman G, Levy R, Lausted C, et al. A wellnessstudy of 108 individuals using personal, dense, dynamic data clouds. NatBiotechnol. 2017;35:747–56. https://doi.org/10.1038/nbt.3870.
9. Cobb J, Gall W, Adam K-P, Nakhle P, Button E, Hathorn J, et al. A novelfasting blood test for insulin resistance and prediabetes. J Diabetes SciTechnol. 2013;7:100–10. https://doi.org/10.1177/193229681300700112.
10. Cobb J, Eckhart A, Perichon R, Wulff J, Mitchell M, Adam K-P, et al. A noveltest for IGT utilizing metabolite markers of glucose tolerance. J Diabetes SciTechnol. 2015;9:69–76. https://doi.org/10.1177/1932296814553622.
11. Anderson EL, Li W, Klitgord N, Highlander SK, Dayrit M, Seguritan V, et al. Arobust ambient temperature collection and stabilization strategy: enablingworldwide functional studies of the human microbiome. Sci Rep. 2016;6:31731. https://doi.org/10.1038/srep31731.
12. Agatston AS, Janowitz WR, Hildner FJ, Zusmer NR, Viamonte M, Detrano R.Quantification of coronary artery calcium using ultrafast computedtomography. J Am Coll Cardiol 1990;15:827–832. http://www.ncbi.nlm.nih.gov/pubmed/2407762. Accessed 13 Aug 2018.
13. McClelland RL, Chung H, Detrano R, Post W, Kronmal RA. Distribution ofcoronary artery calcium by race, gender, and age: results from the multi-ethnic study of atherosclerosis (MESA). Circulation. 2005;113:30–7. https://doi.org/10.1161/CIRCULATIONAHA.105.580696.
14. Loomba R, Seguritan V, Li W, Long T, Klitgord N, Bhatt A, et al. Gutmicrobiome-based metagenomic signature for non-invasive detection ofadvanced fibrosis in human nonalcoholic fatty liver disease. Cell Metab.2017;25:1054–62.e5. https://doi.org/10.1016/j.cmet.2017.04.001.
15. Magurran AE. Measuring biological diversity. Blackwell Pub; 2004.16. Torkamani A, Wineinger NE, Topol EJ. The personal and clinical utility of
polygenic risk scores. Nat Rev Genet. 2018. https://doi.org/10.1038/s41576-018-0018-x.
17. Xie C, Yeo ZX, Wong M, Piper J, Long T, Kirkness EF, et al. Fast and accurateHLA typing from short-read next-generation sequence data with xHLA. ProcNatl Acad Sci U S A. 2017;114:8059–64. https://doi.org/10.1073/pnas.1707945114.
18. Tang H, Kirkness EF, Lippert C, Biggs WH, Fabani M, Guzman E, et al.Profiling of short-tandem-repeat disease alleles in 12,632 human wholegenomes. Am J Hum Genet. 2017;101:700–15. https://doi.org/10.1016/j.ajhg.2017.09.013.
19. Shah N, Hou Y-CC YH-C, Sainger R, Caskey CT, Venter JC, et al. Identificationof misclassified ClinVar variants via disease population prevalence. Am JHum Genet. 2018;102(4):609–19.
20. Telenti A, Pierce LCT, Biggs WH, di Iulio J, Wong EHM, Fabani MM, et al.Deep sequencing of 10,000 human genomes. Proc Natl Acad Sci U S A.2016;113:11901–6. https://doi.org/10.1073/pnas.1613365113.
21. Pain O, Dudbridge F, Ronald A. Are your covariates under control? Hownormalization can re-introduce covariate effects. Eur J Hum Genet. 2018;26:1194–201. https://doi.org/10.1038/s41431-018-0159-6.
22. Beasley TM, Erickson S, Allison DB. Rank-based inverse normaltransformations are increasingly used, but are they merited? Behav Genet.2009;39:580–95. https://doi.org/10.1007/s10519-009-9281-0.
23. Benjamini Y, Hochberg Y. Controlling the false discovery rate: a practical andpowerful approach to multiple testing. J R Stat Soc Ser B. 1995;57:289–300.
24. Blondel VD, Guillaume J-L, Lambiotte R, Lefebvre E. Fast unfolding ofcommunities in large networks. J Stat Mech Theory Exp. 2008;2008:P10008.https://doi.org/10.1088/1742-5468/2008/10/P10008.
25. Monti S, Tamayo P, Mesirov J, Golub T. Consensus clustering: a resampling-based method for class discovery and visualization of gene expressionmicroarray data. Mach Learn. 2003;52(1/2):91–118. https://doi.org/10.1023/A:1023949509487.
26. Friedman J, Hastie T, Tibshirani R. Sparse inverse covariance estimation withthe graphical lasso. Biostatistics. 2008;9:432–41. https://doi.org/10.1093/biostatistics/kxm045.
27. Mazumder R, Hastie T, Tibshirani R. Spectral regularization algorithms forlearning large incomplete matrices. J Mach Learn Res. 2010;2287–322.http://www.jmlr.org/papers/v11/mazumder10a.html. Accessed 20 Aug 2018.
28. Moayyeri A, Hammond CJ, Hart DJ, Spector TD. The UK adult twin registry(TwinsUK resource). Twin Res Hum Genet. 2013;16:144–9. https://doi.org/10.1017/thg.2012.89.
29. Pallister T, Jackson MA, Martin TC, Zierer J, Jennings A, Mohney RP, et al.Hippurate as a metabolomic marker of gut microbiome diversity:modulation by diet and relationship to metabolic syndrome. Sci Rep. 2017;7:13670. https://doi.org/10.1038/s41598-017-13722-4.
30. Roager HM, Hansen LBS, Bahl MI, Frandsen HL, Carvalho V, Gøbel RJ, et al.Colonic transit time is related to bacterial metabolism and mucosalturnover in the gut. Nat Microbiol. 2016;1:16093. https://doi.org/10.1038/nmicrobiol.2016.93.
31. Gryp T, Vanholder R, Vaneechoutte M, Glorieux G. p-Cresyl Sulfate. Toxins(Basel). 2017;9. doi:https://doi.org/10.3390/toxins9020052.
32. Wikoff WR, Anfora AT, Liu J, Schultz PG, Lesley SA, Peters EC, et al.Metabolomics analysis reveals large effects of gut microflora on mammalianblood metabolites. Proc Natl Acad Sci. 2009;106:3698–703. https://doi.org/10.1073/pnas.0812874106.
33. Viaene L, Thijs L, Jin Y, Liu Y, Gu Y, Meijers B, et al. Heritability and clinicaldeterminants of serum indoxyl sulfate and p-cresyl sulfate, candidatebiomarkers of the human microbiome enterotype. PLoS One. 2014;9:e79682.https://doi.org/10.1371/journal.pone.0079682.
34. Wang C-P, Lu L-F, Yu T-H, Hung W-C, Chiu C-A, Chung F-M, et al. Serumlevels of total p-cresylsulphate are associated with angiographic coronaryatherosclerosis severity in stable angina patients with early stage of renalfailure. Atherosclerosis. 2010;211:579–83. https://doi.org/10.1016/j.atherosclerosis.2010.03.036.
35. Wu I-W, Hsu K-H, Lee C-C, Sun C-Y, Hsu H-J, Tsai C-J, et al. p-Cresyl sulphateand indoxyl sulphate predict progression of chronic kidney disease. NephrolDial Transplant. 2011;26:938–47. https://doi.org/10.1093/ndt/gfq580.
36. Russell WR, Duncan SH, Scobbie L, Duncan G, Cantlay L, Calder AG, et al.Major phenylpropanoid-derived metabolites in the human gut can arisefrom microbial fermentation of protein. Mol Nutr Food Res. 2013;57:523–35.https://doi.org/10.1002/mnfr.201200594.
37. Evenepoel P, Meijers BKI, Bammens BRM, Verbeke K. Uremic toxinsoriginating from colonic microbial metabolism. Kidney Int. 2009;76:S12–9.https://doi.org/10.1038/ki.2009.402.
38. Rossi M, Johnson DW, Xu H, Carrero JJ, Pascoe E, French C, et al. Dietaryprotein-fiber ratio associates with circulating levels of indoxyl sulfate and p-cresyl sulfate in chronic kidney disease patients. Nutr Metab Cardiovasc Dis.2015;25:860–5. https://doi.org/10.1016/j.numecd.2015.03.015.
Shomorony et al. Genome Medicine (2020) 12:7 Page 13 of 14

39. Lin C-J, Wu V, Wu P-C, Wu C-J. Meta-analysis of the associations of p-cresylsulfate (PCS) and indoxyl sulfate (IS) with cardiovascular events and all-causemortality in patients with chronic renal failure. PLoS One. 2015;10:e0132589.https://doi.org/10.1371/journal.pone.0132589.
40. Bui TPN, Ritari J, Boeren S, de Waard P, Plugge CM, de Vos WM. Productionof butyrate from lysine and the Amadori product fructoselysine by a humangut commensal. Nat Commun. 2015;6:10062. https://doi.org/10.1038/ncomms10062.
41. Kaakoush NO. Insights into the role of Erysipelotrichaceae in the humanhost. Front Cell Infect Microbiol. 2015;5:84. https://doi.org/10.3389/fcimb.2015.00084.
42. Rumney CJ, Duncan SH, Henderson C, Stewart CS. Isolation andcharacteristics of a wheatbran-degrading Butyrivibrio from human faeces.Lett Appl Microbiol 1995;20:232–236. http://www.ncbi.nlm.nih.gov/pubmed/7766117. Accessed 26 Sep 2018.
43. Kelly WJ, Leahy SC, Altermann E, Yeoman CJ, Dunne JC, Kong Z, et al. Theglycobiome of the rumen bacterium Butyrivibrio proteoclasticus B316(T)highlights adaptation to a polysaccharide-rich environment. PLoS One.2010;5:e11942. https://doi.org/10.1371/journal.pone.0011942.
44. Ohkawara S, Furuya H, Nagashima K, Asanuma N, Hino T. Oraladministration of Butyrivibrio fibrisolvens, a butyrate-producing bacterium,decreases the formation of aberrant crypt foci in the colon and rectum ofmice. J Nutr. 2005;135:2878–83. https://doi.org/10.1093/jn/135.12.2878.
45. Gao Z, Yin J, Zhang J, Ward RE, Martin RJ, Lefevre M, et al. Butyrateimproves insulin sensitivity and increases energy expenditure in mice.Diabetes. 2009;58:1509–17. https://doi.org/10.2337/db08-1637.
46. Henagan TM, Stefanska B, Fang Z, Navard AM, Ye J, Lenard NR, et al.Sodium butyrate epigenetically modulates high-fat diet-induced skeletalmuscle mitochondrial adaptation, obesity and insulin resistance throughnucleosome positioning. Br J Pharmacol. 2015;172:2782–98. https://doi.org/10.1111/bph.13058.
47. Louis S, Tappu R-M, Damms-Machado A, Huson DH, Bischoff SC.Characterization of the gut microbial community of obese patientsfollowing a weight-loss intervention using whole metagenome shotgunsequencing. PLoS One. 2016;11:e0149564. https://doi.org/10.1371/journal.pone.0149564.
48. Dalla-Riva J, Stenkula KG, Petrlova J, Lagerstedt JO. Discoidal HDL and apoA-I-derived peptides improve glucose uptake in skeletal muscle. J Lipid Res.2013;54:1275–82. https://doi.org/10.1194/jlr.M032904.
Publisher’s NoteSpringer Nature remains neutral with regard to jurisdictional claims inpublished maps and institutional affiliations.
Shomorony et al. Genome Medicine (2020) 12:7 Page 14 of 14