Embed Size (px)
Citation preview
1
[ APPLICATION NOTE ]
WATERS SOLUTIONSXevo® G2-XS QTof Mass Spectrometry
Atmospheric Pressure Gas Chromatography (APGC)
Progenesis® QI Data Analysis Software
UNIFI® Scientific Information System
KEYWORDSpersistent organic pollutants, POPs, dioxins, PCBs, PAHs, MSE, HRMS, APGC, universal source, MVA, exposomics
APPLICATION BENEFITS■■ Generation of accurate mass
measurements of low- and high-energy spectra allows targeted and untargeted data analysis in a single data set.
■■ “Soft” ionization using APGC results in preservation of the molecular ion. That combined with fragmentation after ionization produces comprehensive spectral details.
■■ Integrated MVA and elucidation tools aid in identification of markers of interest with automatic elemental composition, searching of online databases, and structural assignments.
INTRODUCTIONHuman exposure to environmental contaminants has been linked to various health problems. When analyzing known environmental contaminants of interest such as persistent organic pollutants (POPs) including dioxins, PCBs, and PAHs, targeted mass spectrometry methods are employed. Recently studies have been conducted using a metabolomic approach to determine differences of exposure between different populations. The term “exposomics” refers to studies that look at a wide array of contaminants in humans that may pose health risks.
In this study, pooled plasma samples from individuals living in various small isolated coastal communities were analyzed using an exposomics approach to determine whether differences exist between the communities with regard to families and concentrations of contaminants. Samples were analyzed using atmospheric pressure chemical ionization gas chromatography (APGC) coupled to high resolution mass spectrometry (HRMS), operated in data independent acquisition (DIA) mode, where precursor and fragment information were collected in a single run.
One of the major challenges of this type of study is interpreting the massive amounts of data generated. In order to facilitate data interpretation, Waters® Progenesis QI data analysis software was utilized. First, targeted analysis was performed against a defined contaminants database. Then, multi variant analysis (MVA) was carried out to determine any differences between the communities. Elucidation of unknown contaminants was also achieved using Progenesis QI Software, which involved searching online databases and matching structural information to the high energy data. Finally, confirmation of one of the findings was performed using a standard.
An Untargeted Exposure Study of Small Isolated Populations Using Atmospheric Gas Chromatography Coupled with High Resolution Mass Spectrometry Pierre Dumas,1 Lauren Mullin,2 Paul Goulding,3 and Adam Ladak2
1 Institut National De Santé Publique Du Québec, Quebec, QC, Canada; 2Waters Corporation, Milford, MA, USA3Waters Corporation, Newcastle Upon Tyne, UK
An Untargeted Exposure Study of Small Isolated Populations Using Atmospheric Gas Chromatography
[ APPLICATION NOTE ][ APPLICATION NOTE ]
2
EXPERIMENTAL
Sample preparation2 mL of plasma was taken and spiked with 13C internal standard and mixed with ethanol and saturated ammonium sulphate solution (for denaturation). The samples were then extracted with hexane. The extracts were evaporated and purified on a florisil column (1 g). POPs were eluted with 25% dichloromethane in hexane. Purified extracts can be concentrated up to 20 µL of hexane prior to GC-MS analysis. For this study, this protocol was suitable, since the goal was to study POPs and POP-like compounds and this protocol intends to extract and purify contaminants related to the chemical property of POP’s, such as non-polar lipophilic molecules.
GC conditionsGC system: A7890
Column: Rtx-5MS (Restek) 0.25 µm x 0.25 mm 0.25 µm
Injection mode: Splitless
Liner: Gooseneck splitless, deactivated (Restek)
Column pneumatics: Constant flow
Column flow: 2 mL/min
Injector temp.: 280 °C
GC oven temp. ramp:
Temp. Temp. ramp Hold time (°C) (°C/min) (min) 80 1.00 125 25 0.00 340 8 8.00
Total run time: 37.7 min
MS conditionsMS system: Xevo G2-XS QTof
Ionization mode: API+
Acquisition mode: MSE
Acquisition range: 50 to 1000 m/z
Collision energy (LE): 6 eV
Collision energy (HE): 30 to 75 eV
Scan time: 0.15 sec
Source temp.: 150 °C
Interface temp.: 310 °C
Corona current: 3.0 µA
Cone voltage: 30 V
Cone gas: 200 L/hr
Auxiliary gas: 250 L/hr
Make-up gas: 300 L/hr
Lock mass: Polysiloxane (281.0512 m/z)
Data management UNIFI Scientific Information System
Progenesis QI
[ APPLICATION NOTE ]
3An Untargeted Exposure Study of Small Isolated Populations Using Atmospheric Gas Chromatography
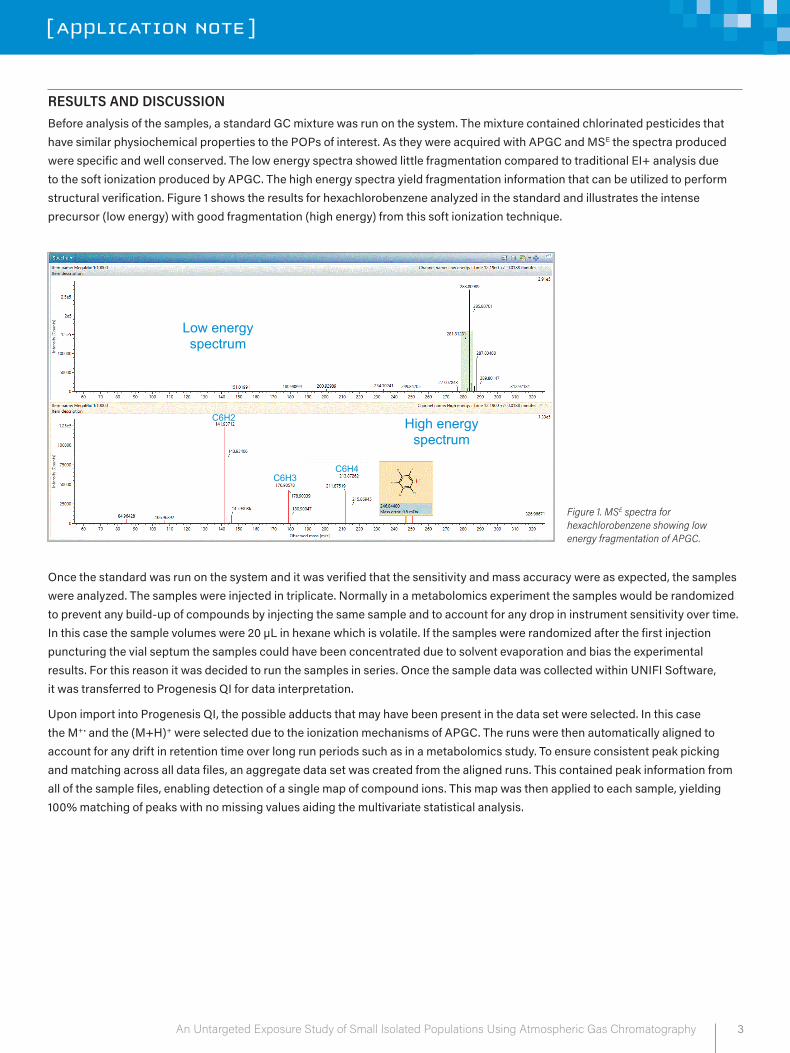
RESULTS AND DISCUSSIONBefore analysis of the samples, a standard GC mixture was run on the system. The mixture contained chlorinated pesticides that have similar physiochemical properties to the POPs of interest. As they were acquired with APGC and MSE the spectra produced were specific and well conserved. The low energy spectra showed little fragmentation compared to traditional EI+ analysis due to the soft ionization produced by APGC. The high energy spectra yield fragmentation information that can be utilized to perform structural verification. Figure 1 shows the results for hexachlorobenzene analyzed in the standard and illustrates the intense precursor (low energy) with good fragmentation (high energy) from this soft ionization technique.
Low energy spectrum
High energy spectrum
C6H4 C6H3
C6H2
Figure 1. MSE spectra for hexachlorobenzene showing low energy fragmentation of APGC.
Once the standard was run on the system and it was verified that the sensitivity and mass accuracy were as expected, the samples were analyzed. The samples were injected in triplicate. Normally in a metabolomics experiment the samples would be randomized to prevent any build-up of compounds by injecting the same sample and to account for any drop in instrument sensitivity over time. In this case the sample volumes were 20 µL in hexane which is volatile. If the samples were randomized after the first injection puncturing the vial septum the samples could have been concentrated due to solvent evaporation and bias the experimental results. For this reason it was decided to run the samples in series. Once the sample data was collected within UNIFI Software, it was transferred to Progenesis QI for data interpretation.
Upon import into Progenesis QI, the possible adducts that may have been present in the data set were selected. In this case the M+• and the (M+H)+ were selected due to the ionization mechanisms of APGC. The runs were then automatically aligned to account for any drift in retention time over long run periods such as in a metabolomics study. To ensure consistent peak picking and matching across all data files, an aggregate data set was created from the aligned runs. This contained peak information from all of the sample files, enabling detection of a single map of compound ions. This map was then applied to each sample, yielding 100% matching of peaks with no missing values aiding the multivariate statistical analysis.
[ APPLICATION NOTE ]
4An Untargeted Exposure Study of Small Isolated Populations Using Atmospheric Gas Chromatography
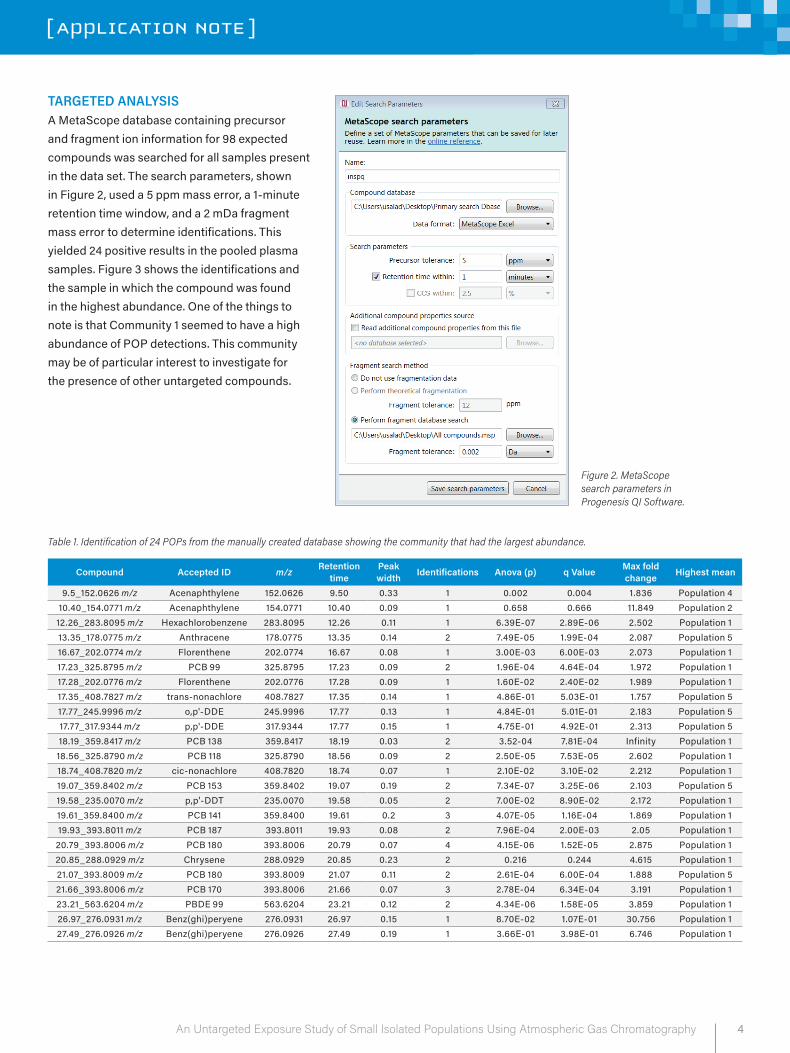
TARGETED ANALYSISA MetaScope database containing precursor and fragment ion information for 98 expected compounds was searched for all samples present in the data set. The search parameters, shown in Figure 2, used a 5 ppm mass error, a 1-minute retention time window, and a 2 mDa fragment mass error to determine identifications. This yielded 24 positive results in the pooled plasma samples. Figure 3 shows the identifications and the sample in which the compound was found in the highest abundance. One of the things to note is that Community 1 seemed to have a high abundance of POP detections. This community may be of particular interest to investigate for the presence of other untargeted compounds.
Figure 2. MetaScope search parameters in Progenesis QI Software.
Table 1. Identification of 24 POPs from the manually created database showing the community that had the largest abundance.
Compound Accepted ID m/z Retention time
Peak width Identifications Anova (p) q Value Max fold
change Highest mean
9.5_152.0626 m/z Acenaphthylene 152.0626 9.50 0.33 1 0.002 0.004 1.836 Population 410.40_154.0771 m/z Acenaphthylene 154.0771 10.40 0.09 1 0.658 0.666 11.849 Population 2
12.26_283.8095 m/z Hexachlorobenzene 283.8095 12.26 0.11 1 6.39E-07 2.89E-06 2.502 Population 113.35_178.0775 m/z Anthracene 178.0775 13.35 0.14 2 7.49E-05 1.99E-04 2.087 Population 516.67_202.0774 m/z Florenthene 202.0774 16.67 0.08 1 3.00E-03 6.00E-03 2.073 Population 117.23_325.8795 m/z PCB 99 325.8795 17.23 0.09 2 1.96E-04 4.64E-04 1.972 Population 117.28_202.0776 m/z Florenthene 202.0776 17.28 0.09 1 1.60E-02 2.40E-02 1.989 Population 117.35_408.7827 m/z trans-nonachlore 408.7827 17.35 0.14 1 4.86E-01 5.03E-01 1.757 Population 517.77_245.9996 m/z o,p'-DDE 245.9996 17.77 0.13 1 4.84E-01 5.01E-01 2.183 Population 517.77_317.9344 m/z p,p'-DDE 317.9344 17.77 0.15 1 4.75E-01 4.92E-01 2.313 Population 518.19_359.8417 m/z PCB 138 359.8417 18.19 0.03 2 3.52-04 7.81E-04 Infinity Population 118.56_325.8790 m/z PCB 118 325.8790 18.56 0.09 2 2.50E-05 7.53E-05 2.602 Population 118.74_408.7820 m/z cic-nonachlore 408.7820 18.74 0.07 1 2.10E-02 3.10E-02 2.212 Population 119.07_359.8402 m/z PCB 153 359.8402 19.07 0.19 2 7.34E-07 3.25E-06 2.103 Population 519.58_235.0070 m/z p,p'-DDT 235.0070 19.58 0.05 2 7.00E-02 8.90E-02 2.172 Population 119.61_359.8400 m/z PCB 141 359.8400 19.61 0.2 3 4.07E-05 1.16E-04 1.869 Population 119.93_393.8011 m/z PCB 187 393.8011 19.93 0.08 2 7.96E-04 2.00E-03 2.05 Population 120.79_393.8006 m/z PCB 180 393.8006 20.79 0.07 4 4.15E-06 1.52E-05 2.875 Population 120.85_288.0929 m/z Chrysene 288.0929 20.85 0.23 2 0.216 0.244 4.615 Population 121.07_393.8009 m/z PCB 180 393.8009 21.07 0.11 2 2.61E-04 6.00E-04 1.888 Population 521.66_393.8006 m/z PCB 170 393.8006 21.66 0.07 3 2.78E-04 6.34E-04 3.191 Population 123.21_563.6204 m/z PBDE 99 563.6204 23.21 0.12 2 4.34E-06 1.58E-05 3.859 Population 126.97_276.0931 m/z Benz(ghi)peryene 276.0931 26.97 0.15 1 8.70E-02 1.07E-01 30.756 Population 127.49_276.0926 m/z Benz(ghi)peryene 276.0926 27.49 0.19 1 3.66E-01 3.98E-01 6.746 Population 1
[ APPLICATION NOTE ]
5An Untargeted Exposure Study of Small Isolated Populations Using Atmospheric Gas Chromatography
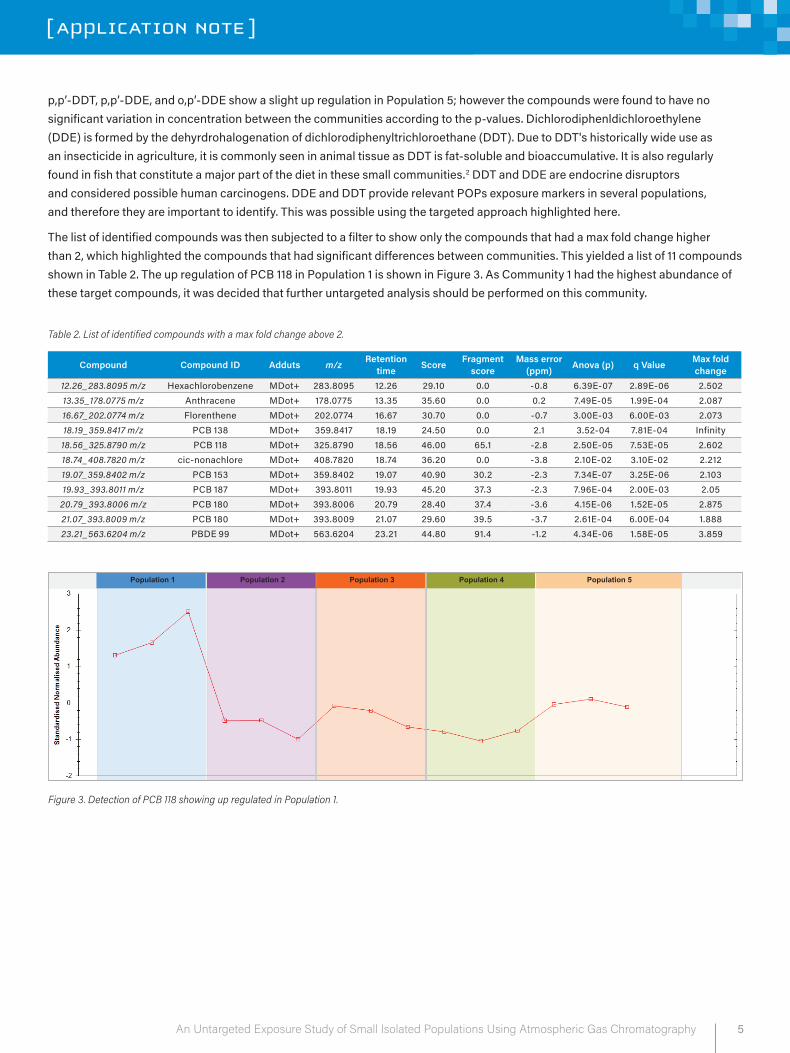
Population 1 Population 2 Population 3 Population 4 Population 5
Figure 3. Detection of PCB 118 showing up regulated in Population 1.
Table 2. List of identified compounds with a max fold change above 2.
p,p’-DDT, p,p’-DDE, and o,p’-DDE show a slight up regulation in Population 5; however the compounds were found to have no significant variation in concentration between the communities according to the p-values. Dichlorodiphenldichloroethylene (DDE) is formed by the dehyrdrohalogenation of dichlorodiphenyltrichloroethane (DDT). Due to DDT's historically wide use as an insecticide in agriculture, it is commonly seen in animal tissue as DDT is fat-soluble and bioaccumulative. It is also regularly found in fish that constitute a major part of the diet in these small communities.2 DDT and DDE are endocrine disruptors and considered possible human carcinogens. DDE and DDT provide relevant POPs exposure markers in several populations, and therefore they are important to identify. This was possible using the targeted approach highlighted here.
The list of identified compounds was then subjected to a filter to show only the compounds that had a max fold change higher than 2, which highlighted the compounds that had significant differences between communities. This yielded a list of 11 compounds shown in Table 2. The up regulation of PCB 118 in Population 1 is shown in Figure 3. As Community 1 had the highest abundance of these target compounds, it was decided that further untargeted analysis should be performed on this community.
Compound Compound ID Adduts m/z Retention time Score Fragment
score Mass error
(ppm) Anova (p) q Value Max fold change
12.26_283.8095 m/z Hexachlorobenzene MDot+ 283.8095 12.26 29.10 0.0 -0.8 6.39E-07 2.89E-06 2.50213.35_178.0775 m/z Anthracene MDot+ 178.0775 13.35 35.60 0.0 0.2 7.49E-05 1.99E-04 2.08716.67_202.0774 m/z Florenthene MDot+ 202.0774 16.67 30.70 0.0 -0.7 3.00E-03 6.00E-03 2.07318.19_359.8417 m/z PCB 138 MDot+ 359.8417 18.19 24.50 0.0 2.1 3.52-04 7.81E-04 Infinity 18.56_325.8790 m/z PCB 118 MDot+ 325.8790 18.56 46.00 65.1 -2.8 2.50E-05 7.53E-05 2.60218.74_408.7820 m/z cic-nonachlore MDot+ 408.7820 18.74 36.20 0.0 -3.8 2.10E-02 3.10E-02 2.21219.07_359.8402 m/z PCB 153 MDot+ 359.8402 19.07 40.90 30.2 -2.3 7.34E-07 3.25E-06 2.10319.93_393.8011 m/z PCB 187 MDot+ 393.8011 19.93 45.20 37.3 -2.3 7.96E-04 2.00E-03 2.05
20.79_393.8006 m/z PCB 180 MDot+ 393.8006 20.79 28.40 37.4 -3.6 4.15E-06 1.52E-05 2.87521.07_393.8009 m/z PCB 180 MDot+ 393.8009 21.07 29.60 39.5 -3.7 2.61E-04 6.00E-04 1.88823.21_563.6204 m/z PBDE 99 MDot+ 563.6204 23.21 44.80 91.4 -1.2 4.34E-06 1.58E-05 3.859
[ APPLICATION NOTE ]
6An Untargeted Exposure Study of Small Isolated Populations Using Atmospheric Gas Chromatography
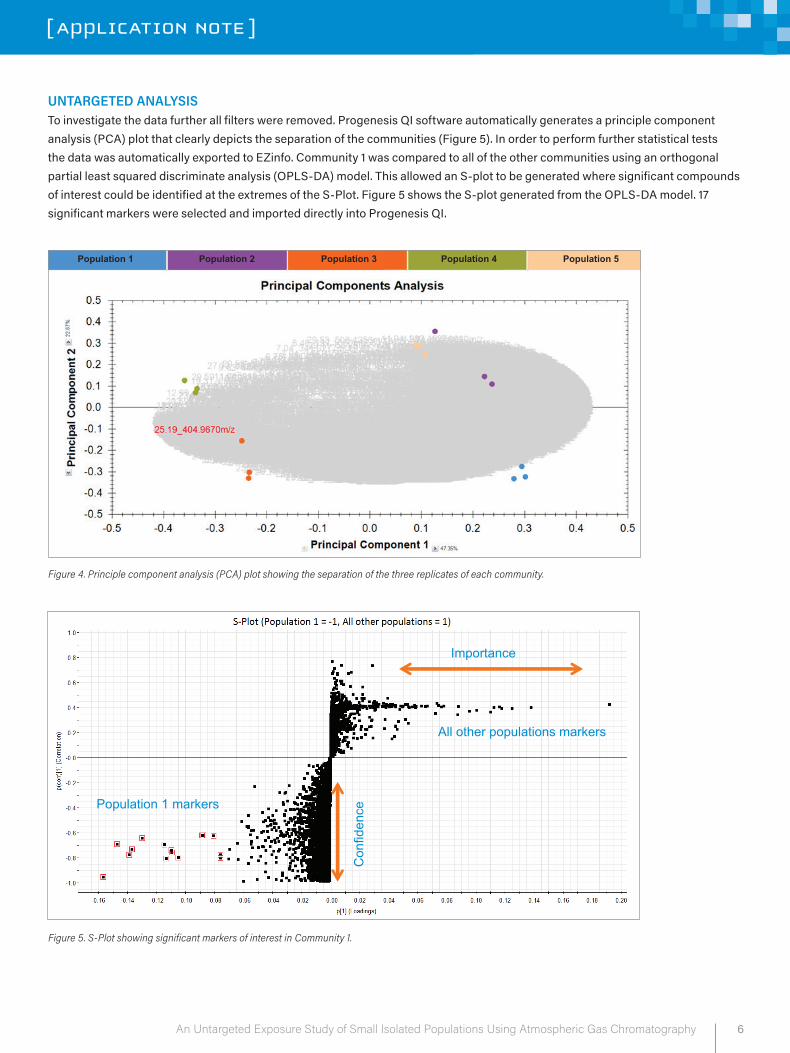
Figure 4. Principle component analysis (PCA) plot showing the separation of the three replicates of each community.
Figure 5. S-Plot showing significant markers of interest in Community 1.
Importance
Con
fiden
ce
All other populations markers
Population 1 markers
UNTARGETED ANALYSISTo investigate the data further all filters were removed. Progenesis QI software automatically generates a principle component analysis (PCA) plot that clearly depicts the separation of the communities (Figure 5). In order to perform further statistical tests the data was automatically exported to EZinfo. Community 1 was compared to all of the other communities using an orthogonal partial least squared discriminate analysis (OPLS-DA) model. This allowed an S-plot to be generated where significant compounds of interest could be identified at the extremes of the S-Plot. Figure 5 shows the S-plot generated from the OPLS-DA model. 17 significant markers were selected and imported directly into Progenesis QI.
Population 1 Population 2 Population 3 Population 4 Population 5
[ APPLICATION NOTE ]
7An Untargeted Exposure Study of Small Isolated Populations Using Atmospheric Gas Chromatography
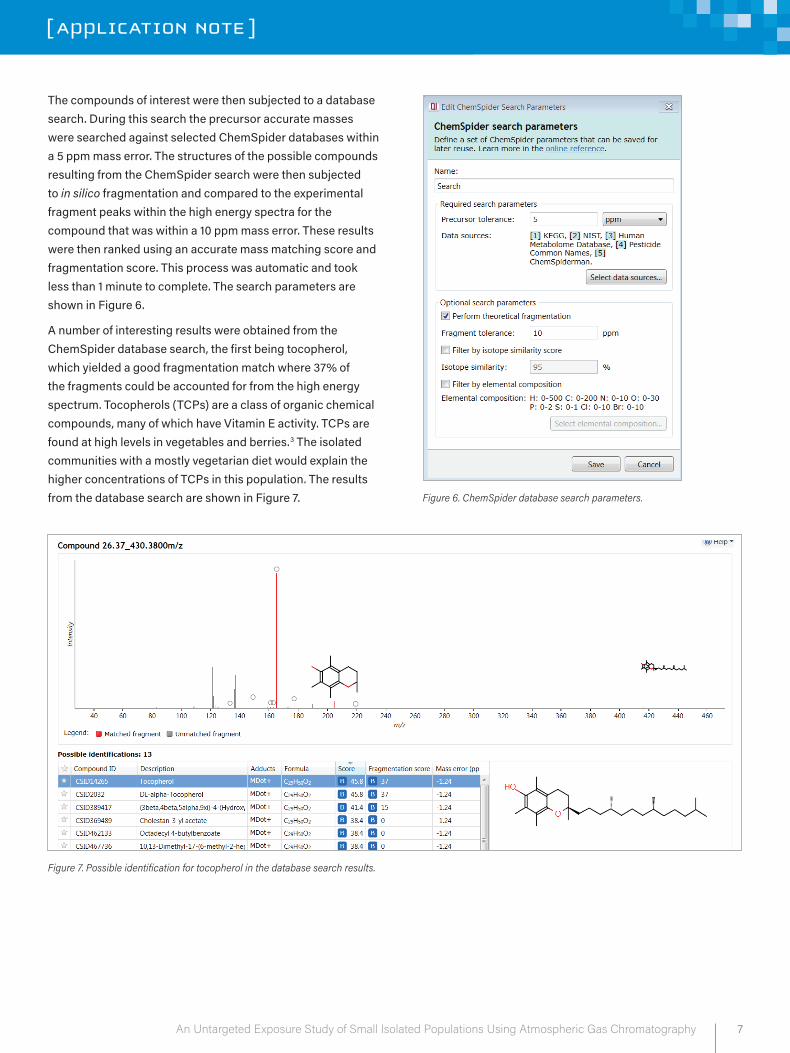
Figure 6. ChemSpider database search parameters.
Figure 7. Possible identification for tocopherol in the database search results.
The compounds of interest were then subjected to a database search. During this search the precursor accurate masses were searched against selected ChemSpider databases within a 5 ppm mass error. The structures of the possible compounds resulting from the ChemSpider search were then subjected to in silico fragmentation and compared to the experimental fragment peaks within the high energy spectra for the compound that was within a 10 ppm mass error. These results were then ranked using an accurate mass matching score and fragmentation score. This process was automatic and took less than 1 minute to complete. The search parameters are shown in Figure 6.
A number of interesting results were obtained from the ChemSpider database search, the first being tocopherol, which yielded a good fragmentation match where 37% of the fragments could be accounted for from the high energy spectrum. Tocopherols (TCPs) are a class of organic chemical compounds, many of which have Vitamin E activity. TCPs are found at high levels in vegetables and berries.3 The isolated communities with a mostly vegetarian diet would explain the higher concentrations of TCPs in this population. The results from the database search are shown in Figure 7.
[ APPLICATION NOTE ]
8An Untargeted Exposure Study of Small Isolated Populations Using Atmospheric Gas Chromatography
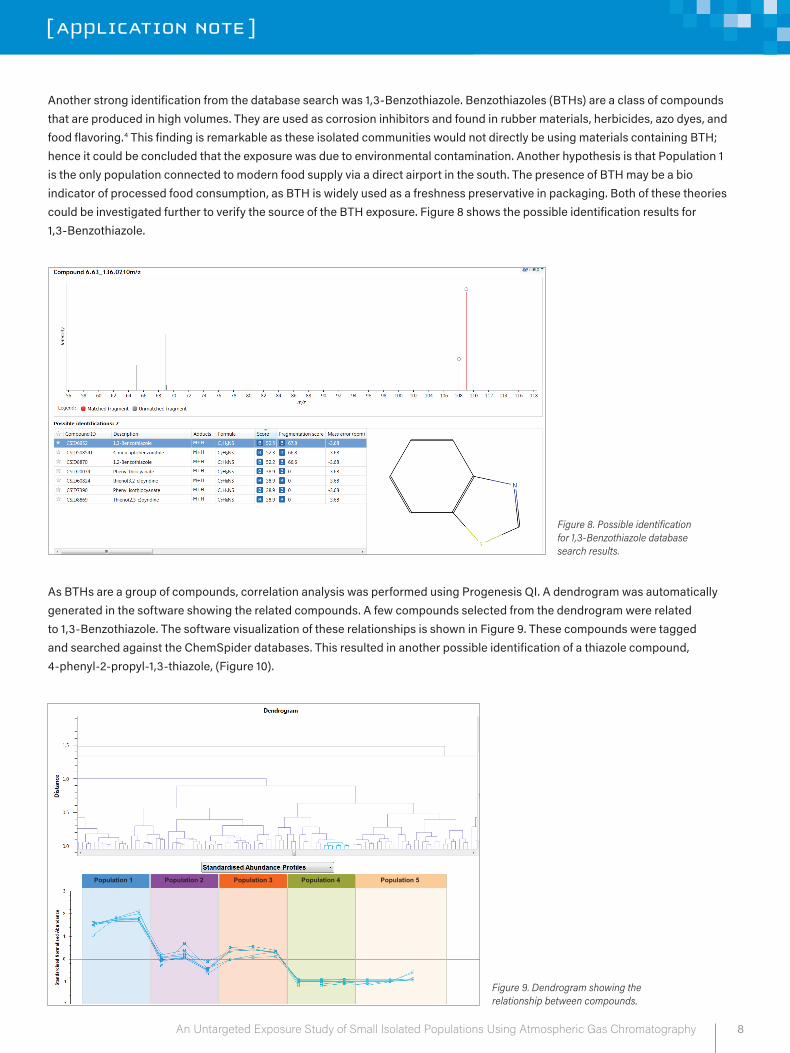
Figure 8. Possible identification for 1,3-Benzothiazole database search results.
Figure 9. Dendrogram showing the relationship between compounds.
Another strong identification from the database search was 1,3-Benzothiazole. Benzothiazoles (BTHs) are a class of compounds that are produced in high volumes. They are used as corrosion inhibitors and found in rubber materials, herbicides, azo dyes, and food flavoring.4 This finding is remarkable as these isolated communities would not directly be using materials containing BTH; hence it could be concluded that the exposure was due to environmental contamination. Another hypothesis is that Population 1 is the only population connected to modern food supply via a direct airport in the south. The presence of BTH may be a bio indicator of processed food consumption, as BTH is widely used as a freshness preservative in packaging. Both of these theories could be investigated further to verify the source of the BTH exposure. Figure 8 shows the possible identification results for 1,3-Benzothiazole.
As BTHs are a group of compounds, correlation analysis was performed using Progenesis QI. A dendrogram was automatically generated in the software showing the related compounds. A few compounds selected from the dendrogram were related to 1,3-Benzothiazole. The software visualization of these relationships is shown in Figure 9. These compounds were tagged and searched against the ChemSpider databases. This resulted in another possible identification of a thiazole compound, 4-phenyl-2-propyl-1,3-thiazole, (Figure 10).
Population 1 Population 2 Population 3 Population 4 Population 5
[ APPLICATION NOTE ]
9An Untargeted Exposure Study of Small Isolated Populations Using Atmospheric Gas Chromatography
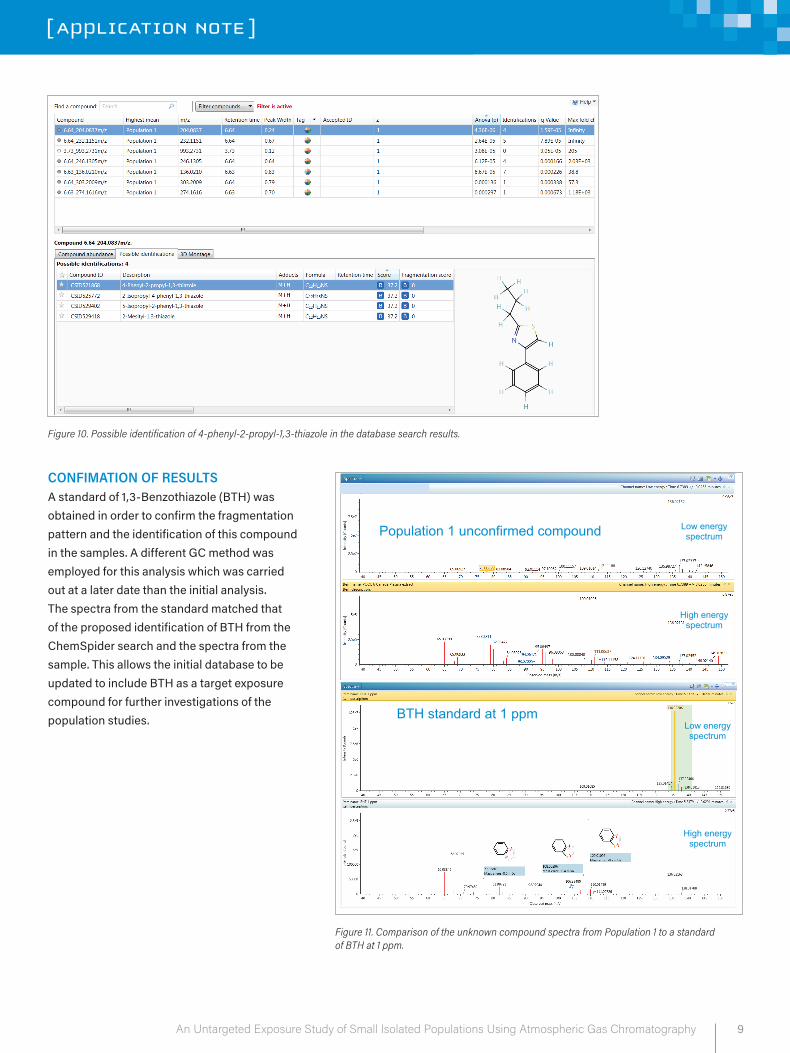
Figure 10. Possible identification of 4-phenyl-2-propyl-1,3-thiazole in the database search results.
Figure 11. Comparison of the unknown compound spectra from Population 1 to a standard of BTH at 1 ppm.
CONFIMATION OF RESULTSA standard of 1,3-Benzothiazole (BTH) was obtained in order to confirm the fragmentation pattern and the identification of this compound in the samples. A different GC method was employed for this analysis which was carried out at a later date than the initial analysis. The spectra from the standard matched that of the proposed identification of BTH from the ChemSpider search and the spectra from the sample. This allows the initial database to be updated to include BTH as a target exposure compound for further investigations of the population studies.
Population 1 unconfirmed compound
BTH standard at 1 ppm
Low energy spectrum
High energy spectrum
Low energy spectrum
High energy spectrum
Waters Corporation 34 Maple Street Milford, MA 01757 U.S.A. T: 1 508 478 2000 F: 1 508 872 1990 www.waters.com
[ APPLICATION NOTE ]
Waters, Progenesis, Xevo, UNIFI, and The Science of What's Possible are registered trademarks of Waters Corporation. All other trademarks are the property of their respective owners.
©2018 Waters Corporation. Produced in the U.S.A. January 2018 720006172EN AG-PDF
CONCLUSIONSExposure studies involve complex data and subtle comparisons within the data sets. By utilizing the soft ionization of APGC and acquiring accurate mass data on both precursor and fragment ions in one method, a complete data set can be produced. This combined with the processing power of Progenesis QI Software allows complex statistical analysis to be performed quickly and easily. Progenesis Q1 also allows the searching of thousands of online databases and user generated libraries. This combination of hardware and software permits a simplified approach to exposomics workflows.
References1. Atmospheric Pressure GC (APGC). Waters White
Paper, Part no. 720004771EN. August, 2013.
2. G E Burdick, E J Harris, H J Dean, T M Walker, J Skea, D Colby. The Accumulation of DDT in Lake Trout and the Effect on Reproduction. Transactions of the American Fisheries Society. 93:2, 1964.
3. Piironen et al. Tocopherols and Tocotrienols in Finnish Foods: Vegetables, Fruits, and Berries. J Agric Food Chem. 3086, 34 I: 742–746.
4. Asimakopoulos et al. Benzotriazoles and benzothiazoles in human urine from several countries: A perspective on occurrence, biotransformation and human exposure. Env Intl. Volume 59, September, 2013.