Embed Size (px)
Citation preview
An Updated Climatology of Tropical Cyclone Impacts on the Southwestern United States
KIMBERLY M. WOOD AND ELIZABETH A. RITCHIE
Department of Atmospheric Sciences, The University of Arizona, Tucson, Arizona
(Manuscript received 7 March 2013, in final form 7 August 2013)
ABSTRACT
A dataset of 167 eastern North Pacific tropical cyclones (TCs) is investigated for potential impacts in the
southwestern United States over the period 1989–2009 and evaluated in the context of a 30-yr climatology.
The statistically significant patterns from empirical orthogonal function (EOF) analysis demonstrate the
prevalence of amidlatitude trough pattern when TC-related rainfall occurs in the southwesternUnited States.
Conversely, the presence of a strong subtropical ridge tends to prevent such events from occurring and limits
TC-related rainfall toMexico. These statistically significant patterns correspondwell with previous work. The
El Ni~no–Southern Oscillation phenomenon is shown to have some effect on eastern North Pacific TC impacts
on the southwestern United States, as shifts in the general circulation can subsequently influence which re-
gions receive rainfall fromTCs or their remnants. The Pacific decadal oscillationmay have a greater influence
during the period of study as evidenced by EOF analysis of sea surface temperature anomalies.
1. Introduction
The eastern North Pacific is the densest region of
tropical cyclogenesis in time and space (Molinari et al.
2000). Most tropical cyclones (TCs) in this basin form
near the coast and are eventually steered westward by
a subtropical ridge extending from North America over
the eastern North Pacific for much of the season (Fig. 1),
where they generally dissipate over cooler sea surface
temperatures (SSTs). However, many of these systems
impact the coast before moving away from land, bring-
ing winds and heavy rain even as the center remains over
the ocean. When synoptic conditions are favorable,
eastern North Pacific TCs make landfall, and the large-
scale flow can bring these systems or their remnant mois-
ture far inland even though the TC itself has weakened
(e.g., Ritchie et al. 2011, hereafter R11).
Upon interaction with the complex topography of
Mexico and the southwestern United States, this advec-
ted moisture can result in locally heavy precipitation
during the summertime rainy season associated with the
North American monsoon (NAM; Adams and Comrie
1997; Higgins et al. 1997).Midlatitude trough interactions
(R11; Corbosiero et al. 2009) or the influence of a strong
subtropical ridge (R11; Wood and Ritchie 2012) are
generally responsible for eastern North Pacific TCs or
their remnants entering the southwestern United States.
However, it is difficult to predict the pattern and in-
tensity of rainfall that will result from a TC remnant, as
many factors impact the nature of the remnant’s in-
teraction with the midlatitude flow. Examples include
the strength of theTCwhen it interacts with amidlatitude
trough, the location of the TC with respect to the trough,
the strength and meridional extent of the trough, and the
strength of the subtropical ridge over southwesternNorth
America.
This study briefly examines a 30-yr climatology of the
large-scale flow in the eastern North Pacific over the
period 1981–2010 in order to establish climate-scale
context. It also builds on the climatology of TCs af-
fecting the southwesternUnited States described byR11
through the use of a single global reanalysis dataset and
a period of study expanded from1992–2005 to 1989–2009.
Over this 21-yr period, the number of tracked cases in-
creases from 43 to 167 TCs, producing a robust sample
for statistical analysis. Objective analysis is applied to
determine the statistically significant patterns that lead
to TC-related impacts on North America. Section 2
describes the data and methods used in the study, sec-
tion 3 provides a background climatology of the eastern
North Pacific hurricane season over 30 yr and NAM
Corresponding author address:Kimberly M.Wood, Department
of Atmospheric Sciences, The University of Arizona, P.O. Box
210081, Tucson, AZ 85721-0081.
E-mail: [email protected]
4322 MONTHLY WEATHER REV IEW VOLUME 141
DOI: 10.1175/MWR-D-13-00078.1
� 2013 American Meteorological Society

precipitation over 21 yr, section 4 evaluates large-scale
patterns associated with TC-related impacts and exam-
ines them in light of the seasonal climatology, section 5
discusses the rainfall patterns associated with these sys-
tems, and section 6 presents a summary and conclusions.
2. Data and methodology
a. Data
The global, 6-hourly, T255 (nominally 0.78) resolutionInterim European Centre for Medium-Range Weather
Forecasts (ECMWF) Re-Analysis (ERA-Interim; Dee
et al. 2011) is used to investigate atmospheric fields as-
sociated with eastern North Pacific TC remnants. The
ERA-Interim data are obtained from theResearchData
Archive (RDA) maintained by the Computational and
Information Systems Laboratory at the National Center
for Atmospheric Research (NCAR; http://rda.ucar.edu).
Monthly mean data derived from the ERA-Interim are
also obtained from the NCARRDA in order to examine
seasonal circulation patterns.
Daily, 0.258 global gridded SST data (Reynolds et al.
2007) for the period 1982–2010 are obtained from the
Earth System Research Laboratory (ESRL) Physical
Sciences Division hosted by the National Oceanic and
Atmospheric Administration (NOAA; http://www.esrl.
noaa.gov/psd/). Monthly, 28 SST data (Smith and
Reynolds 2004) for the period 1981–2010 are also ob-
tained from NOAA/ESRL. Climate Prediction Center
(CPC) unified U.S.–Mexico daily gridded precipitation
data at 18 spatial resolution are used to examine sea-
sonal precipitation totals and precipitation associated
with each TC remnant. Geostationary water vapor (WV)
imagery, obtained from theGlobal International Satellite
Cloud Climatology Project B1 Browse System (http://
www.ncdc.noaa.gov/gibbs/) at 3-h intervals, are used to
track each remnant.
All TCs that moved within 550 km of the Mexican or
Californian coastlines (Englehart and Douglas 2001) in
the National Hurricane Center best track (Davis et al.
1984) from 1989 to 2009 are examined to evaluate their
impacts on North America. In addition, all TCs during
this period that did not come within 550 km of the coast
but reached 258N are tracked in WV satellite imagery in
order to assess whether or not any remnantmoisture was
advected over land. This produced 167 cases over the 21-yr
period. Every TC in this database is tracked to determine
FIG. 1. ERA-Interim monthly average 500-hPa geopotential heights (m) over the period 1981–2010 for (a) June,
(b) July, (c) September, and (d) October. Note that the pattern in August (not shown) greatly resembles the pattern
in July.
DECEMBER 2013 WOOD AND R I TCH IE 4323

the time and location of the storm at which it interacted
with the large-scale flow. This point is commonly found
when the TC recurved (the direction of motion changed
from northwestward to northeastward) or otherwise
changed its direction of motion and is thus denoted the
‘‘turning point.’’ The 43 cases examined in R11 are in-
cluded in this database.
Following a similar methodology to R11, the moisture
associated with each case is tracked inWV imagery until
the clouds associated with the TC or TC remnant dissi-
pated or could no longer be distinguished from other
features. The resulting track is used to extract an associ-
ated swath of rainfall from the unified U.S.–Mexico CPC
precipitation dataset. Precipitation patterns are then ex-
plored using these swaths. As rainfall contributions from
three pairs of TCs could not be attributed to a single
system, this dataset comprises 164 swaths.
b. Statistical analysis
Patterns in the eastern North Pacific are explored using
empirical orthogonal function (EOF) analysis, a method
that objectively determines those patterns that explain
the maximum amount of variance in a two-dimensional
dataset (e.g., Hannachi et al. 2007). The full basin is
investigated for seasonal patterns, and storm-centered
fields spanning 408 latitude and 508 longitude are ex-
tracted from the ERA-Interim using the turning point for
each case in order to evaluate the large-scale flow asso-
ciated with each remnant that impacted North America.
To obtain the EOF patterns, singular value decom-
position (SVD; Bretherton et al. 1992; Hannachi et al.
2007) is applied to the anomalies of a given field, such
as 500-hPa geopotential height. In this study, the mean
500-hPa geopotential height field from the storm-
centered dataset is used to compute these anomalies.
The North test (North et al. 1982) is used to assess the
95% confidence error of the resulting EOF patterns. A
physical representation of the anomalies denoted by
each EOF pattern is obtained by regressing the nor-
malized principal components (PCs) onto the original
data. The normalized PCs can also be regressed onto
other fields, such as temperature and wind, to examine
their related patterns.
Unlike 500-hPa geopotential height patterns, standard
EOF analysis of precipitation fields tends to produce
highly localized, bull’s-eye-type features due to the het-
erogeneous nature of rainfall distributions in space. To
minimize these unphysical results, EOFs can be rotated;
that is, the orthogonality constraint is relaxed in order to
better represent fields with large spatial variability and
zero value regions (Hannachi et al. 2007). In the current
study, the varimax criterion (Kaiser 1958; Sherin 1966),
given by
V51
4�m
j51
" �k
i51
a4ij
!2
1
k
�k
i51
a2ij
!2#, (1)
is applied to the input matrixA in order to create rotated
EOFs (REOFs). In Eq. (1), V is the resultant rotated
matrix, A comprises the EOFs of the rainfall swath data
found by performing SVD, a refers to components of A,
and j and k refer to rows and columns of A, respectively.
Maximum covariance analysis (MCA; Bretherton
et al. 1992; Wallace et al. 1992) is also used in this study
to explore relationships between the storm-centered
500-hPa geopotential height patterns and the associated
rainfall swaths.MCAdecomposes the covariancematrix
between two datasets via SVD in order to objectively
find structures in each dataset that correspond with
structures in the other dataset. The resulting patterns
thus explain the maximum amount of covariance be-
tween the two sets of data. The 500-hPa geopotential
height fields at the turning point time are used in this
analysis in order to assess the impact of the interaction
on the subsequent rainfall pattern.
3. Seasonal climatology
a. Tropical cyclone activity
Figure 1 shows the dominance of the subtropical ridge
overMexico and the southern United States for much of
the hurricane season. As a result, most eastern North
Pacific TCs gain a strong westward component to their
motion, with over 80% of the 463 named systems from
1981 to 2010 never moving north of 258N (e.g., Fig. 2).
However, as summer transitions into autumn, this ridge
weakens and retreats southward (Figs. 1c,d), increasing
the chance for a TC to interact with the midlatitude
flow. The likelihood for recurvature is much greater in
September and October, as these two months account
for just 37% of all TC activity but 58% of all recurving
TCs in the 1981–2010 period.
The seasonal activity peak occurs inAugust, and nearly
70% of the TCs during the 1981–2010 period developed
during July, August, and September (Fig. 3). However,
there is considerable year-to-year variability in TC ac-
tivity, with one of the least active years on record, 2010,
developing no TCs during the month of July. The low
activity in 2010may have been related to a developing La
Ni~na event (Stewart and Cangialosi 2012).
Because of the influence of the El Ni~no–Southern Os-
cillation (ENSO; Trenberth 1997) on SSTs in the eastern
North Pacific, warm and cool events are chosen for com-
parison by setting a Ni~no-3 (58S–58N, 1508–908W) July–
September (JAS) threshold anomaly value of greater than
0.58C or less than 20.58C, respectively. This produced six
4324 MONTHLY WEATHER REV IEW VOLUME 141

El Ni~no events (1982, 1987, 1991, 1997, 2002, and 2009)
and seven La Ni~na events (1981, 1985, 1988, 1995, 1999,
2007, and 2010).
An average of 16.2 TCs ($34 kt; 17m s21) developed
per year during El Ni~no events compared with an av-
erage of 12.4 TCs during La Ni~na events. This is not
a statistically significant difference at the 95% signifi-
cance level. The 17 ENSO-neutral years averaged 16.4
TCs per year. This higher average compared with the La
Ni~na events is partially explained by a low-to-high ac-
tivity shift in 1982 followed by a shift back to lower ac-
tivity in 1999 (Zhao and Chu 2006). The low activity
periods thus include four of the seven La Ni~na events
from 1981 to 2010. In addition, it corroborates previous
work that found little difference in TC frequency between
ENSO and ENSO-neutral years (e.g., Whitney and
Hobgood 1997).
More TCs are able to track farther westward and
northward during El Ni~no years (Fig. 2b) versus LaNi~na
years (Fig. 2c). Note that more tracks are clustered near
the Mexican coastline during the La Ni~na hurricane
seasons (Fig. 2c). This distribution corresponds well with
previous work on ENSO and eastern North Pacific TC
tracks (e.g., Irwin and Davis 1999; Chu 2004; Camargo
et al. 2008). Monthly genesis frequency is shifted to
earlier in the season during La Ni~na years and slightly
later in the season during El Ni~no years (Fig. 3).
Anomalies in July–September 300–700-hPa geopoten-
tial thickness fields (not shown) support these differ-
ences. Greater thicknesses in the genesis region tend to
steer TCs farther westward during El Ni~no years, and
the midlatitude troughs that extend farther south have
a higher chance of eventually interacting with a TC.
Conversely, lower thicknesses in the genesis region and
a weakness in the ridge during La Ni~na years can lead to
more TCs approaching the Mexican coast. This cor-
roborates previous work by Gutzler et al. (2013) who
found that near-coastal cyclones occurred with greater
frequency during the early months (May–July) of La
Ni~na years. In addition, a weakness in the subtropical
ridge during the month of September can allow more
TCs to track northward (not shown), such as Hurricanes
Ismael (1995) and Henriette (2007).
FIG. 2. (a) All 463 TC tracks from 1981 to 2010. (b) Average El
Ni~no minus average 1981–2010 gridded tracks. (c) Average La
Ni~na minus average 1981–2010 gridded tracks.
FIG. 3. Percentage of annual genesis events by month for TCs
that reached wind speeds of 34 kt (17m s21) or greater over the
period 1981–2010. Black represents all years, dark gray represents
El Ni~no years, and light gray represents La Ni~na years.
DECEMBER 2013 WOOD AND R I TCH IE 4325

b. Precipitation in southwestern North America
The bulk of TC-related rainfall during the NAM
season (15 June–30 September) occurs along the west-
ern coast of Mexico, with secondary maxima in Arizona,
New Mexico, and Texas (not shown). However, these
states receive an average of 10% or less of their NAM
precipitation from TCs each year, while northwestern
Mexico and regions of California derive a much larger
portion from these systems (Fig. 4a). Though the aver-
age annual contribution is low, the amount of NAM
rainfall derived from TCmoisture can vary greatly from
year to year. For example, some parts of Arizona re-
ceived half of their monsoon precipitation from a series
of TCs in 1993 (Fig. 4b). Locally heavy rainfall enhanced
by orography is common with these events.
Tropical cyclones can also contribute moisture after
the official end of the NAM season. During the rela-
tively dry October period, these systems can produce
significant amounts of rainfall. In some years an in-
dividual TC remnant is the source of much, if not all, of
the measured precipitation for the entire month. One
such example is Hurricane Raymond in 1989 (Fig. 4c),
which contributed over 80% of October’s rainfall to
some parts of Mexico, Arizona, and New Mexico.
Conversely, the rainfall associated with Hurricane
Kenna in 2002 occurred in Texas and east-central
Mexico even though this was also an October event
(Fig. 4d).
Though there is some uncertainty because of the
limited number of years in each composite, the regions
impacted by TC-related rainfall appear to shift slightly
over the 1989–2009 period with respect to ENSO events
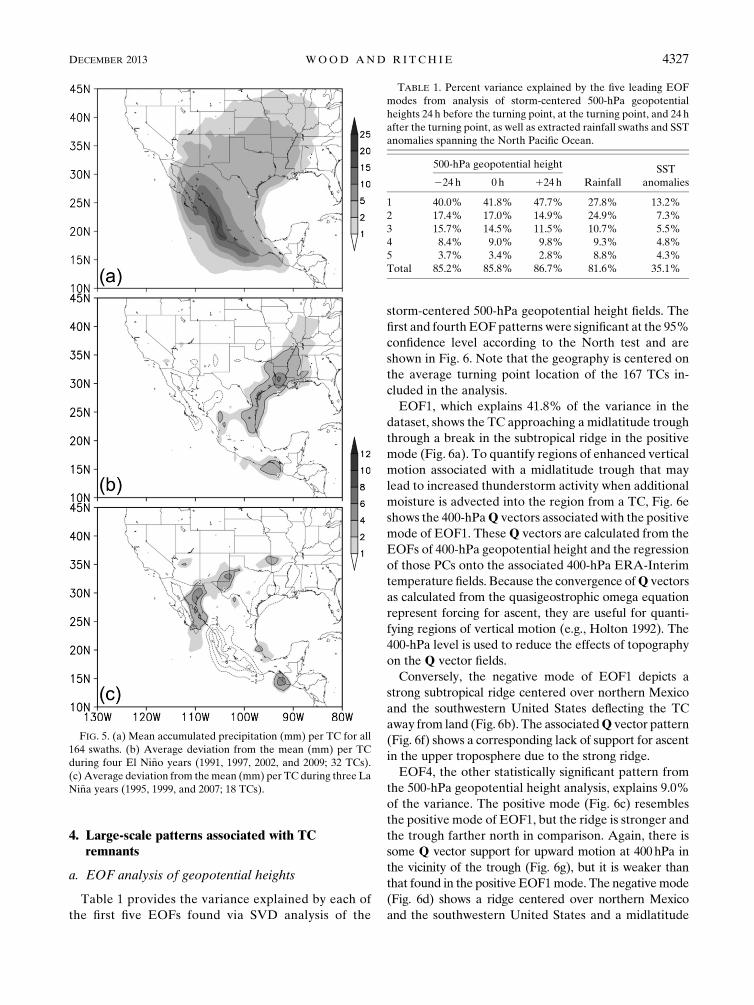
(Fig. 5). During El Ni~no years, the average TC produces
less precipitation in northern Mexico and the south-
western United States but more precipitation in eastern
Mexico and parts of the central and eastern United
States (Fig. 5b). In La Ni~na years, average rainfall in-
creases in northern Mexico and parts of the southwest-
ern United States but decreases along theMexican coast
south of Baja California (Fig. 5c). This precipitation
shift may be related to the average location and strength
of the subtropical high during warm and cool ENSOphases
(section 3a).
FIG. 4. Percentage of 15 Jun–30 Sep precipitation from TCs (a) over the period 1989–2009 and (b) only in 1993.
Percentage of October precipitation from TCs in (c) 1989 and (d) 2002.
4326 MONTHLY WEATHER REV IEW VOLUME 141
4. Large-scale patterns associated with TCremnants
a. EOF analysis of geopotential heights
Table 1 provides the variance explained by each of
the first five EOFs found via SVD analysis of the
storm-centered 500-hPa geopotential height fields. The
first and fourth EOFpatterns were significant at the 95%
confidence level according to the North test and are
shown in Fig. 6. Note that the geography is centered on
the average turning point location of the 167 TCs in-
cluded in the analysis.
EOF1, which explains 41.8% of the variance in the
dataset, shows the TC approaching a midlatitude trough
through a break in the subtropical ridge in the positive
mode (Fig. 6a). To quantify regions of enhanced vertical
motion associated with a midlatitude trough that may
lead to increased thunderstorm activity when additional
moisture is advected into the region from a TC, Fig. 6e
shows the 400-hPaQ vectors associated with the positive
mode of EOF1. TheseQ vectors are calculated from the
EOFs of 400-hPa geopotential height and the regression
of those PCs onto the associated 400-hPa ERA-Interim
temperature fields. Because the convergence ofQ vectors
as calculated from the quasigeostrophic omega equation
represent forcing for ascent, they are useful for quanti-
fying regions of vertical motion (e.g., Holton 1992). The
400-hPa level is used to reduce the effects of topography
on the Q vector fields.
Conversely, the negative mode of EOF1 depicts a
strong subtropical ridge centered over northern Mexico
and the southwestern United States deflecting the TC
away from land (Fig. 6b). The associatedQ vector pattern
(Fig. 6f) shows a corresponding lack of support for ascent
in the upper troposphere due to the strong ridge.
EOF4, the other statistically significant pattern from
the 500-hPa geopotential height analysis, explains 9.0%
of the variance. The positive mode (Fig. 6c) resembles
the positive mode of EOF1, but the ridge is stronger and
the trough farther north in comparison. Again, there is
some Q vector support for upward motion at 400hPa in
the vicinity of the trough (Fig. 6g), but it is weaker than
that found in the positive EOF1mode. The negativemode
(Fig. 6d) shows a ridge centered over northern Mexico
and the southwestern United States and a midlatitude
FIG. 5. (a) Mean accumulated precipitation (mm) per TC for all
164 swaths. (b) Average deviation from the mean (mm) per TC
during four El Ni~no years (1991, 1997, 2002, and 2009; 32 TCs).
(c) Average deviation from themean (mm) per TC during three La
Ni~na years (1995, 1999, and 2007; 18 TCs).
TABLE 1. Percent variance explained by the five leading EOF
modes from analysis of storm-centered 500-hPa geopotential
heights 24 h before the turning point, at the turning point, and 24 h
after the turning point, as well as extracted rainfall swaths and SST
anomalies spanning the North Pacific Ocean.
500-hPa geopotential height
Rainfall
SST
anomalies224 h 0 h 124 h
1 40.0% 41.8% 47.7% 27.8% 13.2%
2 17.4% 17.0% 14.9% 24.9% 7.3%
3 15.7% 14.5% 11.5% 10.7% 5.5%
4 8.4% 9.0% 9.8% 9.3% 4.8%
5 3.7% 3.4% 2.8% 8.8% 4.3%
Total 85.2% 85.8% 86.7% 81.6% 35.1%
DECEMBER 2013 WOOD AND R I TCH IE 4327

FIG. 6. 500-hPa geopotential height (m) for (a) EOF11, (b) EOF12, (c) EOF41, and (d)
EOF42. 400-hPa Q vectors (1 3 1025 Pam21 s21; barbs) and Q-vector convergence (1 310211 Pam22 s21; contours; divergence not shown for simplicity) computed by regression of the
geopotential height PCs for (e) EOF11, (f) EOF12, (g) EOF41, and (h) EOF42. Black dots in
each panel represent the location of the TC.
4328 MONTHLY WEATHER REV IEW VOLUME 141
trough approaching from the west. Upward motion oc-
curs ahead of this trough (Fig. 6h).
EOF analysis was also performed on storm-centered
geopotential height fields from 24h before the turning
point (165 TCs) and 24h after the turning point (161
TCs). The full 167 TC dataset is not represented in each
because the circulation had yet to develop 24h before the
turning point for two systems or had dissipated 24h after
the turning point for five systems. The leadingmode from
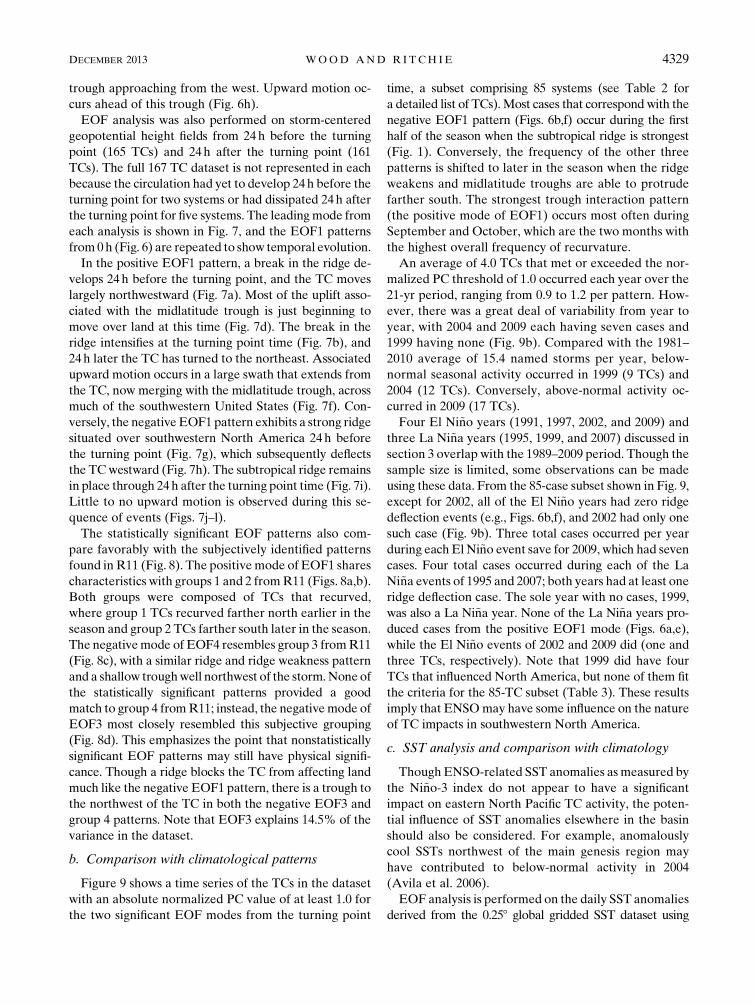
each analysis is shown in Fig. 7, and the EOF1 patterns
from0h (Fig. 6) are repeated to show temporal evolution.
In the positive EOF1 pattern, a break in the ridge de-
velops 24h before the turning point, and the TC moves
largely northwestward (Fig. 7a). Most of the uplift asso-
ciated with the midlatitude trough is just beginning to
move over land at this time (Fig. 7d). The break in the
ridge intensifies at the turning point time (Fig. 7b), and
24h later the TC has turned to the northeast. Associated
upward motion occurs in a large swath that extends from
the TC, now merging with the midlatitude trough, across
much of the southwestern United States (Fig. 7f). Con-
versely, the negative EOF1 pattern exhibits a strong ridge
situated over southwestern North America 24h before
the turning point (Fig. 7g), which subsequently deflects
the TCwestward (Fig. 7h). The subtropical ridge remains
in place through 24h after the turning point time (Fig. 7i).
Little to no upward motion is observed during this se-
quence of events (Figs. 7j–l).
The statistically significant EOF patterns also com-
pare favorably with the subjectively identified patterns
found in R11 (Fig. 8). The positivemode of EOF1 shares
characteristics with groups 1 and 2 fromR11 (Figs. 8a,b).
Both groups were composed of TCs that recurved,
where group 1 TCs recurved farther north earlier in the
season and group 2 TCs farther south later in the season.
The negativemode of EOF4 resembles group 3 fromR11
(Fig. 8c), with a similar ridge and ridge weakness pattern
and a shallow troughwell northwest of the storm.None of
the statistically significant patterns provided a good
match to group 4 fromR11; instead, the negativemode of
EOF3 most closely resembled this subjective grouping
(Fig. 8d). This emphasizes the point that nonstatistically
significant EOF patterns may still have physical signifi-
cance. Though a ridge blocks the TC from affecting land
much like the negative EOF1 pattern, there is a trough to
the northwest of the TC in both the negative EOF3 and
group 4 patterns. Note that EOF3 explains 14.5% of the
variance in the dataset.
b. Comparison with climatological patterns
Figure 9 shows a time series of the TCs in the dataset
with an absolute normalized PC value of at least 1.0 for
the two significant EOF modes from the turning point
time, a subset comprising 85 systems (see Table 2 for
a detailed list of TCs).Most cases that correspond with the
negative EOF1 pattern (Figs. 6b,f) occur during the first
half of the season when the subtropical ridge is strongest
(Fig. 1). Conversely, the frequency of the other three
patterns is shifted to later in the season when the ridge
weakens and midlatitude troughs are able to protrude
farther south. The strongest trough interaction pattern
(the positive mode of EOF1) occurs most often during
September and October, which are the two months with
the highest overall frequency of recurvature.
An average of 4.0 TCs that met or exceeded the nor-
malized PC threshold of 1.0 occurred each year over the
21-yr period, ranging from 0.9 to 1.2 per pattern. How-
ever, there was a great deal of variability from year to
year, with 2004 and 2009 each having seven cases and
1999 having none (Fig. 9b). Compared with the 1981–
2010 average of 15.4 named storms per year, below-
normal seasonal activity occurred in 1999 (9 TCs) and
2004 (12 TCs). Conversely, above-normal activity oc-
curred in 2009 (17 TCs).
Four El Ni~no years (1991, 1997, 2002, and 2009) and
three La Ni~na years (1995, 1999, and 2007) discussed in
section 3 overlap with the 1989–2009 period. Though the
sample size is limited, some observations can be made
using these data. From the 85-case subset shown in Fig. 9,
except for 2002, all of the El Ni~no years had zero ridge
deflection events (e.g., Figs. 6b,f), and 2002 had only one
such case (Fig. 9b). Three total cases occurred per year
during each El Ni~no event save for 2009, which had seven
cases. Four total cases occurred during each of the La
Ni~na events of 1995 and 2007; both years had at least one
ridge deflection case. The sole year with no cases, 1999,
was also a La Ni~na year. None of the La Ni~na years pro-
duced cases from the positive EOF1 mode (Figs. 6a,e),
while the El Ni~no events of 2002 and 2009 did (one and
three TCs, respectively). Note that 1999 did have four
TCs that influenced North America, but none of them fit
the criteria for the 85-TC subset (Table 3). These results
imply that ENSOmay have some influence on the nature
of TC impacts in southwestern North America.
c. SST analysis and comparison with climatology
Though ENSO-related SST anomalies asmeasured by
the Ni~no-3 index do not appear to have a significant
impact on eastern North Pacific TC activity, the poten-
tial influence of SST anomalies elsewhere in the basin
should also be considered. For example, anomalously
cool SSTs northwest of the main genesis region may
have contributed to below-normal activity in 2004
(Avila et al. 2006).
EOF analysis is performed on the daily SST anomalies
derived from the 0.258 global gridded SST dataset using
DECEMBER 2013 WOOD AND R I TCH IE 4329
subset fields that cover 108S–508N, 1208E–908W.Anomalies
are computed using the base period 1982–2011. The
analysis data are chosen based on the turning point day of
each of the 167 TCs. The first two EOFs are statistically
significant, and they explain 13.2% and 7.3% of the var-
iance in the dataset, respectively (Table 1).
Figure 10 shows the positive and negative modes of
these two EOFs. The positive mode of EOF1 (Fig. 10a)
FIG. 7. EOF11 (a)–(c) 500-hPa geopotential height (m) and (d)–(f) regressed 400-hPa Q vectors (1 3 1025 Pam21 s21; barbs) and
Q-vector convergence (13 10211 Pam22 s21; contours; divergence not shown for simplicity). EOF12 (g)–(i) 500-hPa geopotential height
(m) and ( j)–(l) regressed 400-hPa Q vectors and Q-vector convergence. At (left) 224, (middle) 0, and (right) 124 h. Black dots in each
panel represent the location of the TC.
4330 MONTHLY WEATHER REV IEW VOLUME 141

FIG. 8. 500-hPa geopotential height (m) EOF patterns (shaded) and composite fields (contours)
for (a) EOF11 and group 1, (b) EOF11 and group 2, (c) EOF42 and group 3, and (d) EOF32 and
group 4. The dots represent the location of the composite storm. Composite rainfall swaths (mm)
for (e) group 1, (f) group 2, (g) group 3, and (h) group 4. Group composites are from R11.
DECEMBER 2013 WOOD AND R I TCH IE 4331

is characterized by warm SST anomalies along much of
the equator and the western coast of North America,
though the waters off southern Mexico and Central
America are near normal. Cool anomalies cover much
of the northwestern Pacific above 308N, and the overall
pattern resembles that of the Pacific decadal oscillation
(PDO;Mantua et al. 1997). The negative mode of EOF1
(Fig. 10b) is characterized by near-normal conditions
across most of the eastern North Pacific, with one small
cool anomaly near Mexico, and extensive warm SST
anomalies in the western North Pacific, particularly
north of 308N. A distinct El Ni~no–like signature is ap-
parent along the equator in the positive mode of EOF2
(Fig. 10c). The negative mode of EOF2 depicts cool
anomalies confined to the eastern North Pacific genesis
region south and west of Mexico (Fig. 10d).
Further insight can be gained by examining the
subset with absolute normalized PC values of at least
1.0 (Table 4). All of the cases in 1997 and all but one case
in 2009 correspond with the positive mode of EOF2,
which were both strong El Ni~no years. The positivemode
ofEOF1also includes a number of cases from theElNi~no
years of 1991, 1997, and 2002. Conversely, the negative
modes of each EOF include many cases from La Ni~na
years. No El Ni~no cases correspond with the negative
EOF modes, and no La Ni~na cases correspond with the
positive EOF modes.
However, there are a number of included seasons,
notably the years with at least 10 cases (1989, 1990, 1992,
2000, and 2008), which are ENSO-neutral years. This
implies that ENSO may not exert the most significant
influence on the frequency of TCs affecting the south-
western United States. As briefly mentioned earlier, the
EOF1 patterns (Figs. 10a,b) do resemble the PDO, and
Table 4 presents a general shift from the positive EOF1
pattern in the 1990s to the negative EOF1 pattern in the
mid-2000s. Though there is some fluctuation in the in-
termediate years, 2005–08 dominate the number of cases
that correspond with the negative mode. However, the
1989–2009 period of this study does not cover a full os-
cillation of the PDO. Further work is necessary to ex-
amine the connection between TC impacts on North
America and decadal to multidecadal oscillations such
as the PDO, as links have been previously found be-
tween the PDO and the NAM (e.g., Castro et al. 2001).
5. Rainfall patterns associated with TC remnants
The first four REOFs computed for the 164 rainfall
swaths in the dataset are shown in Fig. 11. Though var-
iations exist between each REOF, there is a dominant
pattern of rainfall along the coast of Mexico with di-
verging amounts of rain along a southwest-to-northeast
FIG. 9. Data from the 85 TC subset of cases with absolute PC
values of at least 1.0. (a) Turning point occurrences by month for
each mode of the two statistically significant EOFs. Black repre-
sents EOF1 and gray represents EOF4. Positive modes are solid,
negative modes dashed. (b) Number of TCs in the dataset sepa-
rated by year: total cases (black), cases with a trough present (dark
gray), and cases with only a ridge present (EOF12; light gray).
TABLE 2. Individual TCs with absolute normalized PC values of
at least 1.0 for each statistically significant 500-hPa geopotential
height EOF mode. This table includes a total of 85 cases.
EOF11 EOF12 EOF41 EOF42
1989 Octave 1989 Barbara 1989 Raymond 1989 Priscilla
1992 Virgil 1989 Flossie 1990 Kenna 1990 Douglas
1992 Winifred 1989 Narda 1990 Rachel 1990 Lowell
1992 Zeke 1990 Boris 1991 Hilda 1990 Vance
1994 Rosa 1993 Irwin 1991 Nora 1991 Linda
1996 Fausto 1995 Gil 1992 Lester 1994 Ileana
2000 Norman 1996 Boris 1993 Calvin 1995 Henriette
2002 Kenna 1996 Douglas 1993 Lidia 1995 Juliette
2003 Kevin 1998 Blas 1995 Ismael 1997 Blanca
2004 Agatha 1998 Celia 1998 Madeline 1997 Nora
2004 Javier 1998 Frank 2000 Bud 1997 Rick
2004 Lester 2000 Hector 2002 Iselle 1998 Lester
2005 Otis 2000 Ileana 2004 Blas 2000 Miriam
2006 Miriam 2002 Genevieve 2004 Frank 2001 Adolph
2006 Norman 2003 Ignacio 2005 Hilary 2001 Manuel
2008 Norbert 2004 Georgette 2007 Ivo 2004 Howard
2008 Odile 2005 Calvin 2007 Kiko 2006 Paul
2009 Olaf 2005 Dora 2009 Blanca 2008 Douglas
2009 Patricia 2005 Eugene 2008 Julio
2009 Rick 2005 Irwin 2009 Andres
2006 Carlotta 2009 Ignacio
2006 Gilma 2009 Jimena
2006 Ileana
2007 Gil
2007 Henriette
4332 MONTHLY WEATHER REV IEW VOLUME 141

track extending into the United States. Only REOF1 is
statistically significant at the 95% confidence level, and
it explains less than 28% of the variability in the dataset.
Also, none of the patterns appear to correspond with the
presence of the ridge in the negative EOF1 mode (Fig.
6b).
In contrast to the composite rainfall swaths presented
in R11 (Figs. 8e–h), where group members were de-
termined in part by the nature of each case’s corre-
sponding rainfall pattern, the analyses of large-scale
circulation patterns and rainfall swaths in this study are
accomplished independently through objective statisti-
cal EOF and REOF analysis. The simplest way to make
a physical connection between a particular large-scale
pattern and a given rainfall swath is to examine the in-
dividual cases for correlations. An alternative, objec-
tive method is to use the MCA methodology described
in section 2 to evaluate the covariance between the
500-hPa geopotential height patterns and the rainfall
swaths. Though the geopotential height fields are taken
from a single time, unlike the multiple-day accumulated
rainfall swaths, this comparison can provide information
regarding the subsequent precipitation resulting from
a particular type of interaction between the TC and the
large-scale flow.
The first MCA pattern (Fig. 12) accounts for 79.4% of
the covariance between the 500-hPa geopotential height
patterns and the rainfall swaths. The positive mode of
the geopotential height field (Fig. 12a) features a weak-
ness in the subtropical ridge and a southward-protruding
midlatitude trough, much like the positive modes of
EOF1 and EOF4 from the geopotential height EOF
analysis (Figs. 6a,c). The corresponding rainfall pattern
(Fig. 12c) resembles the average rainfall swath computed
from all group 1 and 2 cases in R11 (not shown). Regions
of greater precipitation are associated with mountainous
terrain and with additional moisture advection from the
Gulf of Mexico east of the Rocky Mountains. The Q
vectors (not shown) depict support for upward motion in
the vicinity of the trough.
The geopotential height pattern given by the negative
mode of MCA1 (Fig. 12b) includes a subtropical ridge
centered over northernMexico and the southern United
States. Though it is weaker than the ridge found in the
TABLE 3. Breakdown of all 167 TCs in the 1989–2009 dataset by
year as well as the subset of 85 TCs listed in Table 2. Boldface text
denotes El Ni~no years and italicized text denotes La Ni~na years.
Total EOF11 EOF12 EOF41 EOF42
1989 12 1 3 1 1
1990 11 0 1 2 3
1991 8 0 0 2 11992 11 3 0 1 0
1993 7 0 1 2 0
1994 4 1 0 0 1
1995 7 0 1 1 2
1996 7 1 2 0 0
1997 8 0 0 0 3
1998 7 0 3 1 1
1999 4 0 0 0 0
2000 10 1 2 1 1
2001 7 0 0 0 2
2002 8 1 1 1 02003 8 1 1 0 0
2004 7 3 1 2 1
2005 7 1 4 1 0
2006 9 2 3 0 1
2007 7 0 2 2 0
2008 10 2 0 0 2
2009 8 3 0 1 3
All 167 20 25 18 22
FIG. 10. The two statistically significant patterns from the EOF
analysis of daily SST anomalies (8C): (a) EOF11, (b) EOF12,
(c) EOF21, and (d) EOF22.
DECEMBER 2013 WOOD AND R I TCH IE 4333

negative mode of EOF1 (Fig. 6b), the ridge in the MCA
pattern also extends far westward over the Pacific
Ocean. It does bear similarity to the group 4 pattern
(Fig. 8d) and thus to the negative mode of EOF3. The
corresponding precipitation pattern (Fig. 12d) restricts
most of the rainfall to the western coast of Mexico with
limited precipitation occurring in theUnited States. This
implies that most cases involving a strong subtropical
ridge primarily produce rain in Mexico, but that mois-
ture advection by the subtropical ridge can result in
precipitation in the southwestern United States.
6. Summary and conclusions
This paper presents an expanded 21-yr climatology of
eastern North Pacific TC impacts on the southwestern
United States. Confirming results found in the refereed
literature, ENSO events are not observed to have a sig-
nificant impact on the frequency of TC genesis in the
eastern North Pacific, though the subsequent tracks of
theTCs that do formmaybe altered by shifts in the general
circulation. La Ni~na tracks tend to cluster near the North
American coast, particularly earlier in the season, while El
Ni~no tracks often move farther westward and may turn
TABLE 4. Number of cases per year that correspond with nor-
malized PC values at or greater than 1.0 or at or less than21.0 for
the first twoEOFs from the SST anomaly analysis. Years not shown
had no cases that fit the criteria. Boldface text denotes El Ni~noyears and italicized text denotes La Ni~na years.
EOF11 EOF12 EOF21 EOF22
Year
No. of
cases Year
No. of
cases Year
No. of
cases Year
No. of
cases
1991 4 1998 5 1997 8 1989 5
1992 5 1999 4 2003 2 1992 10
1993 5 2000 5 2005 2 1993 6
1997 8 2001 3 2006 7 1995 2
2002 3 2005 1 2008 8 1999 4
2004 3 2007 4 2009 7 2000 2
2008 9 2007 1
FIG. 11. Rainfall swath patterns (mm) for (a) REOF1 (27.8%), (b) REOF2 (24.9%), (c) REOF3 (10.7%), and
(d) REOF4 (9.3%).
4334 MONTHLY WEATHER REV IEW VOLUME 141

northward farther from land. These track shifts may also
affect which regions are impacted by TC-related rainfall
during ENSO events.
The statistically significant geopotential height EOF
patterns highlight the importance of midlatitude trough
interactions on subsequent TC-related impacts in the
southwestern United States. These interactions are
more frequent later in the season when the subtropical
ridge weakens and troughs protrude southward. Con-
versely, cases that involve a strong subtropical ridge often
approach the Mexican coast without producing rainfall
in the United States. TCs are deflected by the ridge more
often earlier in the season when this feature is strongest.
TheQ vector fields are indicative of upward forcing in the
vicinity of the trough; upward motion is suppressed for
cases deflected by the ridge. The objectively deter-
mined EOF patterns also support the findings presented
in R11.
Trough interaction events appear to be somewhat
more frequent and ridge deflection events less frequent
during El Ni~no years. Conversely, ridge deflection events
occur with greater frequency and trough interaction
events with less frequency during La Ni~na years. The
statistically significant SST anomaly patterns related to
TC impacts highlight anENSO signal in the secondEOF
mode, but the PDOmay have a greater influence as shown
by the first EOFpattern of SST anomalies.A longer period
of study is necessary to properly examine the relationship
between TC-related impacts and the PDO.
REOF analysis of individual rainfall swaths do not
clearly distinguish between different patterns. Instead,
that analysis highlights an overall trend of rainfall along
the Mexican coast with lower accumulations in the
United States. The influence of a midlatitude trough or
the subtropical ridge on the subsequent rainfall pattern
is clearer in the MCA analysis results. More pre-
cipitation occurs in northern Mexico and the United
States when a trough is present. Ridge deflection cases
produce less precipitation in the same region, and rain-
fall that does occur north of Mexico during these events
FIG. 12. First MCA pattern of 500-hPa geopotential heights (m) for (a) the positive mode and (b) the negative
mode. The dots represent the location of the composite storm. FirstMCApattern of rainfall (mm) for (c) the positive
mode and (d) the negative mode.
DECEMBER 2013 WOOD AND R I TCH IE 4335

tends to be a result of moisture advection around the
periphery of the subtropical ridge.
Future work will investigate the variability of large-
scale patterns in the eastern North Pacific on interannual
and longer time scales in order to better characterize the
influence of longer period oscillations, particularly the
PDO, on eastern North Pacific TC impacts on North
America.
Acknowledgments. The research presented in this
manuscript is based on work done as part of the first au-
thor’s dissertation. The authors would like to acknowledge
Drs. Katherine Hirschboeck and Yolande Serra for their
constructive comments during the course of this research.
Insightful feedback from Dr. Ron McTaggart-Cowan and
two anonymous reviewers helped improve this manu-
script. This work was supported by a grant from the
National Science Foundation (Grant AGS-1132131).
REFERENCES
Adams, D. K., and A. C. Comrie, 1997: The North American
monsoon. Bull. Amer. Meteor. Soc., 78, 2197–2213.
Avila, L. A., R. J. Pasch, J. L. Beven, J. L. Franklin,M. B. Lawrence,
and S. R. Stewart, 2006: Eastern North Pacific hurricane season
of 2004. Mon. Wea. Rev., 134, 1026–1035.
Bretherton, C. S., C. Smith, and J. M. Wallace, 1992: An inter-
comparison of methods for finding coupled patterns in climate
data. J. Climate, 5, 541–560.
Camargo, S. J., A. W. Robertson, A. G. Barnston, and M. Ghil,
2008: Clustering of eastern North Pacific tropical cyclone
tracks: ENSO andMJO effects.Geochem. Geophys. Geosyst.,
9, Q06V05, doi:10.1029/2007GC001861.
Castro, C. L., T. B. McKee, and R. A. Pielke Sr., 2001: The re-
lationship of the North American monsoon to tropical and
North Pacific sea surface temperatures as revealed by obser-
vational analyses. J. Climate, 14, 4449–4473.
Chu, P.-S., 2004: ENSO and tropical cyclone activity. Hurri-
canes and Typhoons: Past, Present, and Future, R. J.
Murnane and K.-B. Liu, Eds., Columbia University Press,
297–332.
Corbosiero, K. L., M. J. Dickinson, and L. F. Bosart, 2009: The
contribution of eastern North Pacific tropical cyclones to the
rainfall climatology of the southwest United States.Mon.Wea.
Rev., 137, 2415–2435.
Davis, M. A. S., G. M. Brown, and P. Leftwich, 1984: A tropical
cyclone data tape for the eastern and central North Pacific
basins, 1949–1983: Contents, limitations, and uses. NOAA
Tech. Memo. NWS NHC-25, 17 pp.
Dee, D. P., and Coauthors, 2011: The ERA-Interim reanalysis:
Configuration and performance of the data assimilation sys-
tem. Quart. J. Roy. Meteor. Soc., 137, 553–597.
Englehart, P. J., andA. V.Douglas, 2001: The role of easternNorth
Pacific tropical storms in the rainfall climatology of western
Mexico. Int. J. Climatol., 21, 1357–1370.
Gutzler, D. S., K. M. Wood, E. A. Ritchie, A. V. Douglas, and
M. D. Lewis, 2013: Interannual variability of tropical cyclone
activity along the Pacific coast of North America. Atm�osfera,
26, 149–162.
Hannachi, A., I. Joliffe, and D. Stephenson, 2007: Empirical or-
thogonal functions and related techniques in atmospheric
science: A review. Int. J. Climatol., 27, 1119–1152.
Higgins, R. W., Y. Yao, and X. L. Wang, 1997: Influence of the
North American monsoon system on the U.S. summer precip-
itation regime. J. Climate, 10, 2600–2622.
Holton, J. R., 1992: Introduction to Dynamic Meteorology. Aca-
demic Press, 511 pp.
Irwin, R. P., III, andR. E. Davis, 1999: The relationship between the
Southern Oscillation index and tropical cyclone tracks in the
eastern North Pacific. Geophys. Res. Lett., 26 (15), 2251–2254.
Kaiser, H. F., 1958: The varimax criterion for analytic rotation in
factor analysis. Psychometrika, 23, 187–200.
Mantua,N. J., S.R.Hare,Y. Zhang, J.M.Wallace, andR.C. Francis,
1997: A Pacific interdecadal climate oscillation with impacts on
salmon production. Bull. Amer. Meteor. Soc., 78, 1069–1079.Molinari, J., D. Vollaro, S. Skubis, andM.Dickinson, 2000: Origins
and mechanisms of eastern Pacific tropical cyclogenesis: A
case study. Mon. Wea. Rev., 128, 125–139.North, G. R., T. L. Bell, R. F. Cahalan, and F. J. Moeng, 1982:
Sampling errors in the estimation of empirical orthogonal
functions. Mon. Wea. Rev., 110, 699–706.
Reynolds, R. W., T. M. Smith, C. Liu, D. B. Chelton, K. S. Casey,
and M. G. Schlax, 2007: Daily high-resolution blended anal-
yses for sea surface temperature. J. Climate, 20, 5473–5496.
Ritchie, E. A., K. M. Wood, D. S. Gutzler, and S. White, 2011: The
influence of eastern Pacific tropical cyclone remnants on the
southwestern United States. Mon. Wea. Rev., 139, 192–210.
Sherin, R. J., 1966: A matrix formulation of Kaiser’s varimax cri-
terion. Psychometrika, 31, 535–538.Smith, T. M., and R. W. Reynolds, 2004: Improved extended re-
construction of SST (1854–1997). J. Climate, 17, 2466–2477.
Stewart, S. R., and J. P. Cangialosi, 2012: Eastern North Pacific
hurricane season of 2010. Mon. Wea. Rev., 140, 2769–2781.Trenberth, K. E., 1997: The definition of El Ni~no. Bull. Amer.
Meteor. Soc., 78, 2771–2777.
Wallace, J. M., C. Smith, and C. S. Bretherton, 1992: Singular value
decomposition of wintertime sea surface temperature and
500-mb height anomalies. J. Climate, 5, 561–576.
Whitney, L. D., and J. S. Hobgood, 1997: The relationship between
sea surface temperatures and maximum intensities of tropical
cyclones in the eastern North Pacific Ocean. J. Climate, 10,2921–2930.
Wood, K. M., and E. A. Ritchie, 2012: The unusual behavior and
precipitation pattern associated with Tropical Storm Ignacio
(1997). Mon. Wea. Rev., 140, 3347–3360.
Zhao, X., and P.-S. Chu, 2006: Bayesian multiple changepoint
analysis of hurricane activity in the eastern North Pacific: A
Markov chain Monte Carlo approach. J. Climate, 19, 564–578.
4336 MONTHLY WEATHER REV IEW VOLUME 141