Embed Size (px)
Citation preview

4th International Conference on
Earthquake Geotechnical Engineering June 25-28, 2007 Paper No. 1534
ANALYSES FOR LIQUEFACTION-INDUCED GROUND FLOW
DURING THE 2005 FUKUOKAKENSEIHO-OKI EARTHQUAKE
Susumu YASUDA 1, and Masatada SHIMIZU
2
ABSTRACT
Liquefaction occurred at many sites along Hakata Bay during the 2005 Fukuokaken-seihooki
earthquake. In Fukuoka City, seismic zoning for liquefaction was conducted by the authors in 1988.
Then, at first, the authors compared the zoning map with the actual damage. As the results, liquefied
sites were fairly coincided with estimated zone in reclaimed lands, though they were slightly different
in a big sand spit named Uminonakamichi. In the sand spit, only a newly filled land was liquefied and
caused liquefaction-induced flow of sloping ground. The authors took a soil sample and conducted
cyclic torsional shear tests to demonstrate liquefaction and post-liquefaction behavior. Based on the
results, deformation of the sloping ground was analyzed. Analyzed deformation was similar as the
actual deformation
Keywords: liquefaction, seismic hazard, sandy soil, laboratory tests, analysis
INTRODUCTION
Seismicity around Fukuoka City is the lowest class in Japan. However, microzonation during
earthquakes was needed because Fukuoka City is the biggest and most important city in southern
Japan. Microzonation for liquefaction, strong shaking and slope failure was conducted based on
several analyses by the author in 1988 (Fukuoka City Waterworks Bureau, 1988, Yasuda and
Matsumura, 1991). Base acceleration for these analyses was assumed as 150 gals. According to the
results of the analyses, liquefaction was predicted in almost all of the artificially reclaimed lands.
In 2005, seventeen years later, a big earthquake with a magnitude of 7.0 occurred near Fukuoka City
and caused liquefaction at many sites. The maximum surface acceleration in the down town of
Fukuoka was 277 gals which was almost same as the acceleration of the microzoning map. The
authors conducted site investigations just after the earthquake and compared the actual liquefied sites
with the zoning map.
MICROZONATION FOR SOIL LIQUEFACTION
In microzoning for liquefaction, almost 1,200 sets of borehole data were collected, and soil cross
sections at the 13 areas were estimated. These sites were selected to cover the whole alluvial plain.
Based on the soil cross section, it was judged that sand layers in Fukuoka City are classified into the
following three layers:
1 Professor, Civil and Environmental Engineering, Tokyo Denki University, Japan,
Email: [email protected] 2 Civil and Environmental Engineering, Graduate School of Tokyo Denki University, Japan,
Email: [email protected]
(1) alluvial sand layer which exists in most of the alluvial plain,
(2) sand dune layer which exists along the natural coast, and
(3) artificially reclaimed sand layer.
Undisturbed samples of three sand layers were taken at the five sites and undrained cyclic triaxial
tests were conducted to measure the liquefaction strength. By comparing the cyclic triaxial test
results, the method of estimating liquefaction used in the specification for highway bridges (Japan
Road Association, 1980) was modified. Then, liquefiable layers were predicted at all soil cross
sections, by assuming a maximum surface acceleration of 200 Gals. It is necessary not only to predict
the liquefiable layer but also to predict the possibility of damage to structures due to liquefaction. The
possible damage was judged based on the relationship between the thickness of the liquefiable layer,
H2, and the thickness of the upper non-liquefiable layer, H1, proposed by Ishihara (1985).
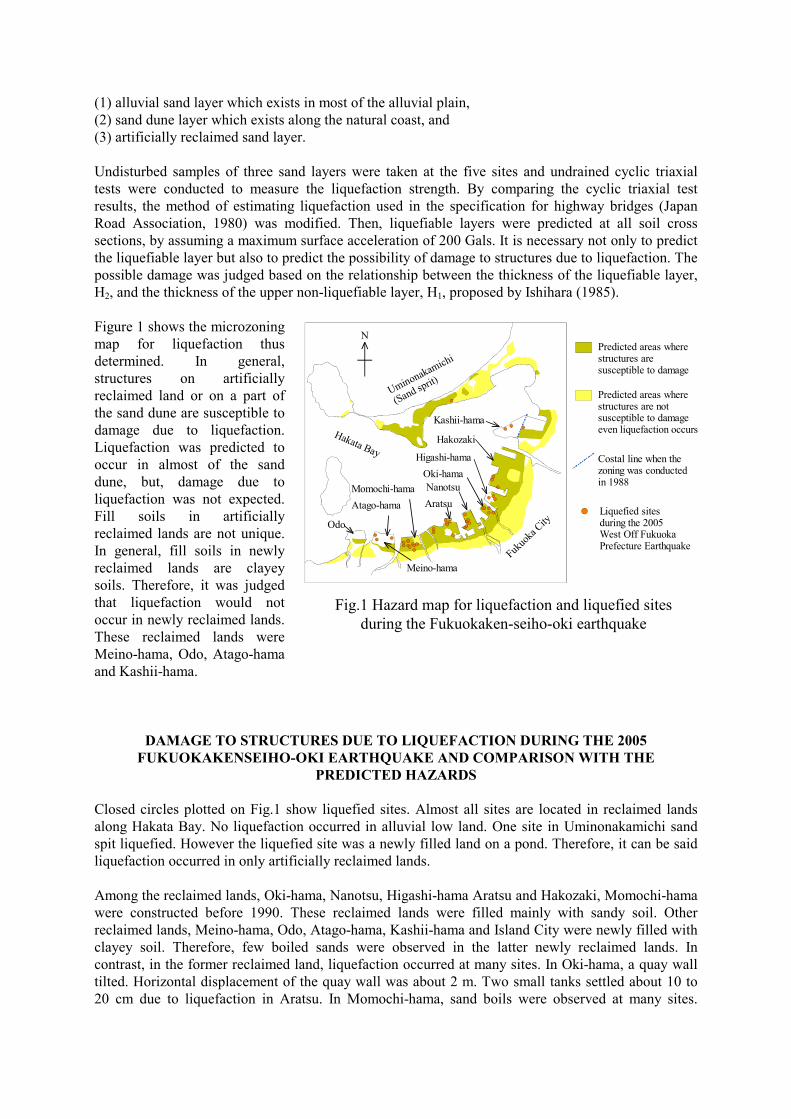
Figure 1 shows the microzoning
map for liquefaction thus
determined. In general,
structures on artificially
reclaimed land or on a part of
the sand dune are susceptible to
damage due to liquefaction.
Liquefaction was predicted to
occur in almost of the sand
dune, but, damage due to
liquefaction was not expected.
Fill soils in artificially
reclaimed lands are not unique.
In general, fill soils in newly
reclaimed lands are clayey
soils. Therefore, it was judged
that liquefaction would not
occur in newly reclaimed lands.
These reclaimed lands were
Meino-hama, Odo, Atago-hama
and Kashii-hama.
DAMAGE TO STRUCTURES DUE TO LIQUEFACTION DURING THE 2005
FUKUOKAKENSEIHO-OKI EARTHQUAKE AND COMPARISON WITH THE
PREDICTED HAZARDS
Closed circles plotted on Fig.1 show liquefied sites. Almost all sites are located in reclaimed lands
along Hakata Bay. No liquefaction occurred in alluvial low land. One site in Uminonakamichi sand
spit liquefied. However the liquefied site was a newly filled land on a pond. Therefore, it can be said
liquefaction occurred in only artificially reclaimed lands.
Among the reclaimed lands, Oki-hama, Nanotsu, Higashi-hama Aratsu and Hakozaki, Momochi-hama
were constructed before 1990. These reclaimed lands were filled mainly with sandy soil. Other
reclaimed lands, Meino-hama, Odo, Atago-hama, Kashii-hama and Island City were newly filled with
clayey soil. Therefore, few boiled sands were observed in the latter newly reclaimed lands. In
contrast, in the former reclaimed land, liquefaction occurred at many sites. In Oki-hama, a quay wall
tilted. Horizontal displacement of the quay wall was about 2 m. Two small tanks settled about 10 to
20 cm due to liquefaction in Aratsu. In Momochi-hama, sand boils were observed at many sites.
Fig.1 Hazard map for liquefaction and liquefied sites
during the Fukuokaken-seiho-oki earthquake
Costal line when thezoning was conductedin 1988
Predicted areas wherestructures aresusceptible to damage
Predicted areas wherestructures are notsusceptible to damageeven liquefaction occurs
Liquefied sitesduring the 2005West Off FukuokaPrefecture Earthquake
Uminonakamichi
(Sand sprit)
N
Hakata Bay
Fukuo
ka C
ity
Kashii-hama
Hakozaki
Higashi-hama
Oki-hama
Nanotsu
Aratsu
Momochi-hama
Atago-hama
Meino-hama
Odo
However, no damage to buildings and timber houses occurred and obvious ground subsidence did not
occur at the liquefied sites. Therefore, it is estimated that liquefied layer was thin.
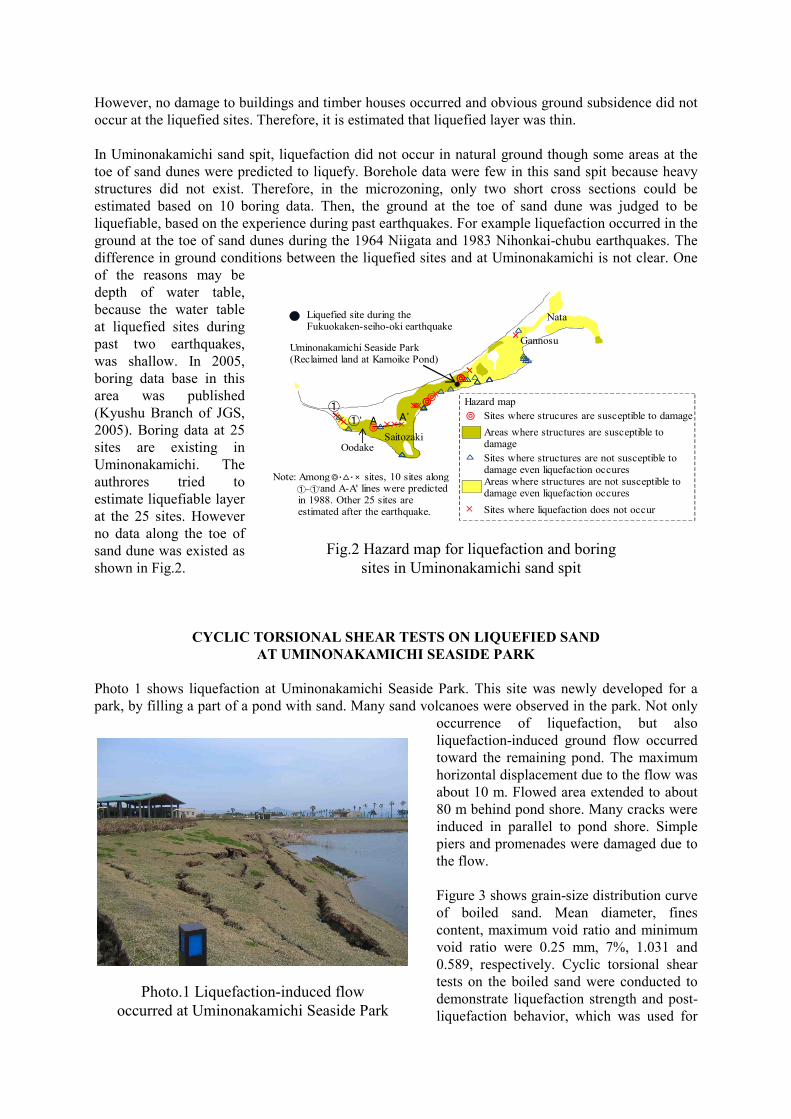
In Uminonakamichi sand spit, liquefaction did not occur in natural ground though some areas at the
toe of sand dunes were predicted to liquefy. Borehole data were few in this sand spit because heavy
structures did not exist. Therefore, in the microzoning, only two short cross sections could be
estimated based on 10 boring data. Then, the ground at the toe of sand dune was judged to be
liquefiable, based on the experience during past earthquakes. For example liquefaction occurred in the
ground at the toe of sand dunes during the 1964 Niigata and 1983 Nihonkai-chubu earthquakes. The
difference in ground conditions between the liquefied sites and at Uminonakamichi is not clear. One
of the reasons may be
depth of water table,
because the water table
at liquefied sites during
past two earthquakes,
was shallow. In 2005,
boring data base in this
area was published
(Kyushu Branch of JGS,
2005). Boring data at 25
sites are existing in
Uminonakamichi. The
authrores tried to
estimate liquefiable layer
at the 25 sites. However
no data along the toe of
sand dune was existed as
shown in Fig.2.
CYCLIC TORSIONAL SHEAR TESTS ON LIQUEFIED SAND
AT UMINONAKAMICHI SEASIDE PARK
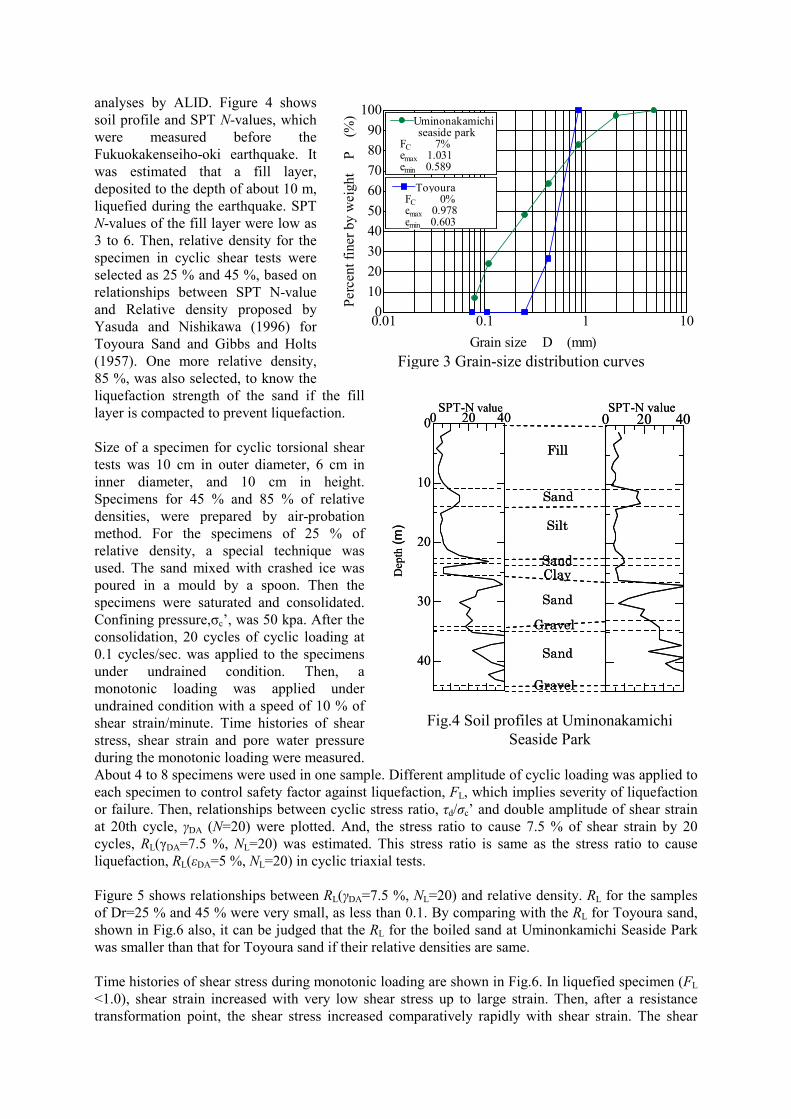
Photo 1 shows liquefaction at Uminonakamichi Seaside Park. This site was newly developed for a
park, by filling a part of a pond with sand. Many sand volcanoes were observed in the park. Not only
occurrence of liquefaction, but also
liquefaction-induced ground flow occurred
toward the remaining pond. The maximum
horizontal displacement due to the flow was
about 10 m. Flowed area extended to about
80 m behind pond shore. Many cracks were
induced in parallel to pond shore. Simple
piers and promenades were damaged due to
the flow.
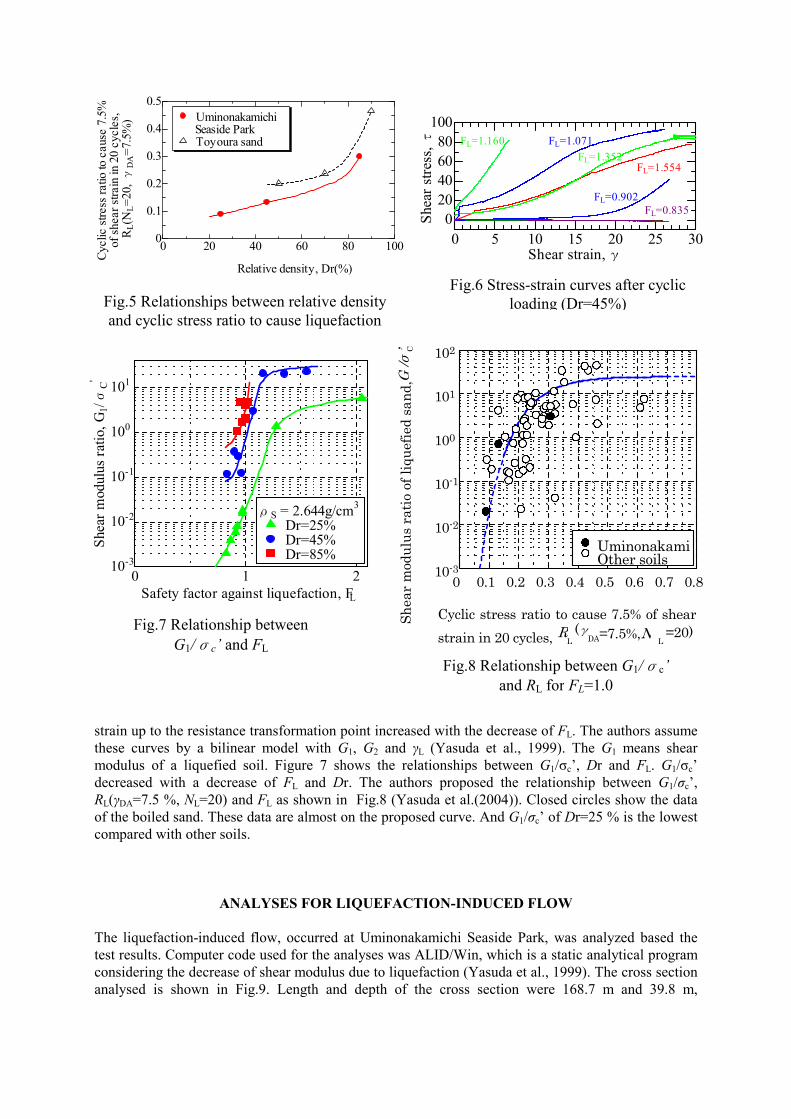
Figure 3 shows grain-size distribution curve
of boiled sand. Mean diameter, fines
content, maximum void ratio and minimum
void ratio were 0.25 mm, 7%, 1.031 and
0.589, respectively. Cyclic torsional shear
tests on the boiled sand were conducted to
demonstrate liquefaction strength and post-
liquefaction behavior, which was used for
Fig.2 Hazard map for liquefaction and boring
sites in Uminonakamichi sand spit
Areas where structures are susceptible to damage
Areas where structures are not susceptible to damage even liquefaction occures
A A'
Uminonakamichi Seaside Park(Reclaimed land at Kamoike Pond)
①①'
Hazard map
Sites where strucures are susceptible to damage
Sites where structures are not susceptible to damage even liquefaction occures
Sites where liquefaction does not occur
SaitozakiOodake
Gannosu
NataLiquefied site during the Fukuokaken-seiho-oki earthquake
Note: Among sites, 10 sites along and A-A' lines were predicted in 1988. Other 25 sites are estimated after the earthquake.
◎・△・×
①-①'
Photo.1 Liquefaction-induced flow
occurred at Uminonakamichi Seaside Park
analyses by ALID. Figure 4 shows
soil profile and SPT N-values, which
were measured before the
Fukuokakenseiho-oki earthquake. It
was estimated that a fill layer,
deposited to the depth of about 10 m,
liquefied during the earthquake. SPT
N-values of the fill layer were low as
3 to 6. Then, relative density for the
specimen in cyclic shear tests were
selected as 25 % and 45 %, based on
relationships between SPT N-value
and Relative density proposed by
Yasuda and Nishikawa (1996) for
Toyoura Sand and Gibbs and Holts
(1957). One more relative density,
85 %, was also selected, to know the
liquefaction strength of the sand if the fill
layer is compacted to prevent liquefaction.
Size of a specimen for cyclic torsional shear
tests was 10 cm in outer diameter, 6 cm in
inner diameter, and 10 cm in height.
Specimens for 45 % and 85 % of relative
densities, were prepared by air-probation
method. For the specimens of 25 % of
relative density, a special technique was
used. The sand mixed with crashed ice was
poured in a mould by a spoon. Then the
specimens were saturated and consolidated.
Confining pressure,σc’, was 50 kpa. After the
consolidation, 20 cycles of cyclic loading at
0.1 cycles/sec. was applied to the specimens
under undrained condition. Then, a
monotonic loading was applied under
undrained condition with a speed of 10 % of
shear strain/minute. Time histories of shear
stress, shear strain and pore water pressure
during the monotonic loading were measured.
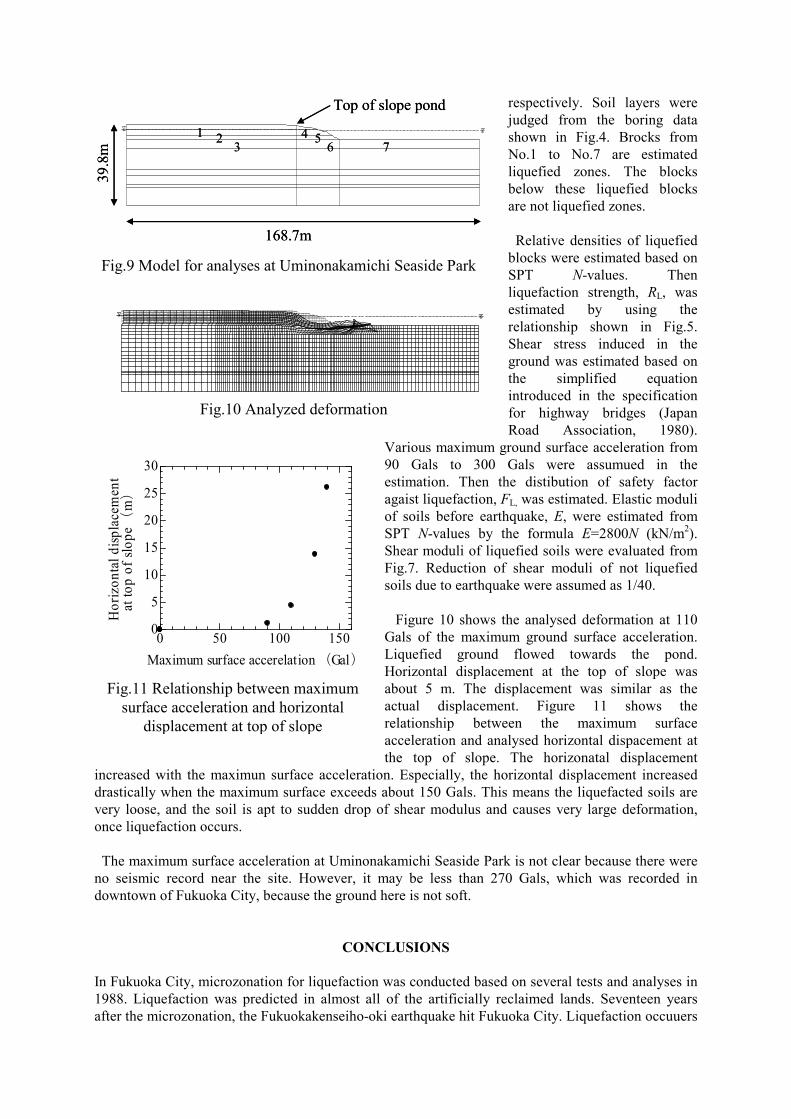
About 4 to 8 specimens were used in one sample. Different amplitude of cyclic loading was applied to
each specimen to control safety factor against liquefaction, FL, which implies severity of liquefaction
or failure. Then, relationships between cyclic stress ratio, τd/σc’ and double amplitude of shear strain
at 20th cycle, γDA (N=20) were plotted. And, the stress ratio to cause 7.5 % of shear strain by 20
cycles, RL(γDA=7.5 %, NL=20) was estimated. This stress ratio is same as the stress ratio to cause
liquefaction, RL(εDA=5 %, NL=20) in cyclic triaxial tests.
Figure 5 shows relationships between RL(γDA=7.5 %, NL=20) and relative density. RL for the samples
of Dr=25 % and 45 % were very small, as less than 0.1. By comparing with the RL for Toyoura sand,
shown in Fig.6 also, it can be judged that the RL for the boiled sand at Uminonkamichi Seaside Park
was smaller than that for Toyoura sand if their relative densities are same.
Time histories of shear stress during monotonic loading are shown in Fig.6. In liquefied specimen (FL
<1.0), shear strain increased with very low shear stress up to large strain. Then, after a resistance
transformation point, the shear stress increased comparatively rapidly with shear strain. The shear
Figure 3 Grain-size distribution curves
0.01 0.1 1 100
10
20
30
40
50
60
70
80
90
100
Grain size D (mm)P
erc
en
t fi
ner
by w
eig
ht
P
(%)
Toyoura FC 0% emax 0.978 emin 0.603
Uminonakamichi seaside park FC 7% emax 1.031 emin 0.589
Fig.4 Soil profiles at Uminonakamichi
Seaside Park
0 20 40N
0 20 400
10
20
30
40
N値 [
m]
Fill
Sand
Silt
SandClay
Sand
Gravel
Sand
Gravel
SPT-N valueD
epth(m)
SPT-N value0 20 40
N0 20 400
10
20
30
40
N値 [
m]
Fill
Sand
Silt
SandClay
Sand
Gravel
Sand
Gravel
SPT-N valueD
epth(m)
SPT-N value
strain up to the resistance transformation point increased with the decrease of FL. The authors assume
these curves by a bilinear model with G1, G2 and γL (Yasuda et al., 1999). The G1 means shear
modulus of a liquefied soil. Figure 7 shows the relationships between G1/σc’, Dr and FL. G1/σc’
decreased with a decrease of FL and Dr. The authors proposed the relationship between G1/σc’,
RL(γDA=7.5 %, NL=20) and FL as shown in Fig.8 (Yasuda et al.(2004)). Closed circles show the data
of the boiled sand. These data are almost on the proposed curve. And G1/σc’ of Dr=25 % is the lowest
compared with other soils.
ANALYSES FOR LIQUEFACTION-INDUCED FLOW
The liquefaction-induced flow, occurred at Uminonakamichi Seaside Park, was analyzed based the
test results. Computer code used for the analyses was ALID/Win, which is a static analytical program
considering the decrease of shear modulus due to liquefaction (Yasuda et al., 1999). The cross section
analysed is shown in Fig.9. Length and depth of the cross section were 168.7 m and 39.8 m,
0 20 40 60 80 1000
0.1
0.2
0.3
0.4
0.5
Uminonakamichi Seaside Park
Toyoura sand
Relative density, Dr(%)
Cyclic s
tress
ratio to c
ause
7.5
%
of
shear
stra
in in 2
0 c
ycle
s,
RL(N
L=
20, γ
DA
=7.5
%)
Fig.5 Relationships between relative density
and cyclic stress ratio to cause liquefaction
Fig.7 Relationship between
G1/σc’ and FL
0 5 10 15 20 25 30
0
20
40
60
80
100
FL=1.554FL=1.352
FL=1.160 FL=1.071
FL=0.902
FL=0.835
Shea
r st
ress
, τ
Shear strain, γ
Fig.6 Stress-strain curves after cyclic
loading (Dr=45%)
Fig.8 Relationship between G1/σc’
and RL for FL=1.0
0 1 210-3
10-2
10-1
100
101
Safety factor against liquefaction, FL
Shea
r m
odulu
s ra
tio,
G1/σ
C'
ρS = 2.644g/cm3
Dr=25%Dr=45%Dr=85%
0 0.1 0.2 0.3 0.4 0.5 0.6 0.7 0.810 -3
10 -2
10 -1
10 0
10 1
10 2
G
1
Shea
r m
odulu
s ra
tio
of liq
uef
ied s
and,
/σ ’ C
( Cyclic stress ratio to cause 7.5% of shear
strain in 20 cycles, R L γ
DA =7.5%,N L =20)
UminonakamiOther soils
respectively. Soil layers were
judged from the boring data
shown in Fig.4. Brocks from
No.1 to No.7 are estimated
liquefied zones. The blocks
below these liquefied blocks
are not liquefied zones.
Relative densities of liquefied
blocks were estimated based on
SPT N-values. Then
liquefaction strength, RL, was
estimated by using the
relationship shown in Fig.5.
Shear stress induced in the
ground was estimated based on
the simplified equation
introduced in the specification
for highway bridges (Japan
Road Association, 1980).
Various maximum ground surface acceleration from
90 Gals to 300 Gals were assumued in the
estimation. Then the distibution of safety factor
agaist liquefaction, FL, was estimated. Elastic moduli
of soils before earthquake, E, were estimated from
SPT N-values by the formula E=2800N (kN/m2).
Shear moduli of liquefied soils were evaluated from
Fig.7. Reduction of shear moduli of not liquefied
soils due to earthquake were assumed as 1/40.
Figure 10 shows the analysed deformation at 110
Gals of the maximum ground surface acceleration.
Liquefied ground flowed towards the pond.
Horizontal displacement at the top of slope was
about 5 m. The displacement was similar as the
actual displacement. Figure 11 shows the
relationship between the maximum surface
acceleration and analysed horizontal dispacement at
the top of slope. The horizonatal displacement
increased with the maximun surface acceleration. Especially, the horizontal displacement increased
drastically when the maximum surface exceeds about 150 Gals. This means the liquefacted soils are
very loose, and the soil is apt to sudden drop of shear modulus and causes very large deformation,
once liquefaction occurs.
The maximum surface acceleration at Uminonakamichi Seaside Park is not clear because there were
no seismic record near the site. However, it may be less than 270 Gals, which was recorded in
downtown of Fukuoka City, because the ground here is not soft.
CONCLUSIONS
In Fukuoka City, microzonation for liquefaction was conducted based on several tests and analyses in
1988. Liquefaction was predicted in almost all of the artificially reclaimed lands. Seventeen years
after the microzonation, the Fukuokakenseiho-oki earthquake hit Fukuoka City. Liquefaction occuuers
Fig.9 Model for analyses at Uminonakamichi Seaside Park
Fig.10 Analyzed deformation
1
168.7m
39
.8m
Top of slope pond
23
4 56 7
1
168.7m
39
.8m
Top of slope pond
23
4 56 7
Fig.11 Relationship between maximum
surface acceleration and horizontal
displacement at top of slope
0 50 100 1500
5
10
15
20
25
30
Ho
rizo
nta
l d
isp
lace
men
t at
to
p o
f sl
op
e (
m)
Maximum surface accerelation (Gal)
at many sites. Liquefied areas were fairly coincided with the predicted areas. However liquefaction
did not occure in natural groud behind sand dune in Umononakamichi sand spit, which had been
judged as liquefiable zone. One site, filled in a pond, in Uminonakamichi, liquefied and caused
ground flow toward a pond. Deformation of the ground was analyzed by a code named ALID/Win.
Actual deformation could be explained by the analyses.
ACKNOWLEDGEMENTS
Site investigation on the damage due the 2005 Fukuokaken seiho-oki earthquake was conducted with
Dr. Y. Tanoue, Mr. K. Yamagata and Mr.S. Itoh at Kiso-jiban Consultants Co., Ltd., and Pro. S. Goto
at Yamanashi University. The authors expressed their cordial appreciation to them.
REFERENCES
Fukuoka City Waterworks Bureau.: Evaluation on seismic behavior of water supply facilities and
grounds. (1988). (in Japanese)
Yasuda, S. and Matsumura, S.: Microzonation for liquefaction, slope failure and ground response
during earthquakes in Fukuoka City, Proc. of the 4th International Conference on Seismic
Zonation,(1991). (in Japanese)
Japan Road Association.: Specification for Highway Bridges. (1980). (in Japanese) Ishihara, K.: Stability of natural deposits during earthquakes, Proc. of the 11
th ICSMFE, Vol.1,
pp.321-376. (1985).
Kyushu Branch of JGS,: Ground Data Base. (2005). (in Japanese)
Yasuda, S. and Nishikawa, S.: Model test on the relationship between relative density (1996). (in
Japanese)
Gibbs, H. J. And Holtz W. G.: Research on Determinig the Density of Sand by Spoon Penetration
Test, Proc. 4th ICSMFE, Vol. I, pp.35-39. (1957).
Yasuda, S., Yoshida, N., Adachi, K., Kiku, H. and Gose, S.: A simplified analysis of liquefaction-
induced residual deformation, Proceedings of the 2nd International Conference on Earthquake
Geotechnical Engineering, pp.555-560. (1999).
Yasuda, S., Inagaki, M., Yamada, S. and Ishikawa, K.: Stress-strain curves of liquefied sands and
softened clays, Proceedings of the International Symposium on Engineering Practice and
Performance of Soft Deposits, pp.337-342. (2004).