Embed Size (px)
Citation preview
Bowen, H. J. & Jacka, M. E. (2013)
Liquefaction induced ground damage in the Canterbury earthquakes: predictions vs. reality Proc. 19
th NZGS Geotechnical Symposium. Ed. CY Chin, Queenstown
Liquefaction induced ground damage in the Canterbury earthquakes:
predictions vs. reality
H J Bowen & M E Jacka
Tonkin & Taylor Ltd, Christchurch, NZ
[email protected] (Corresponding author)
Keywords: liquefaction, Canterbury earthquakes, ground damage, crust thickness
ABSTRACT Predicting the severity of liquefaction induced ground damage is the key outcome from a
liquefaction assessment. Ishihara (1985) developed a simple and logical method to predict the
occurrence of sand boils, ground fissures and other features of liquefaction damage. This paper
examines the effectiveness of Ishihara’s method in predicting the liquefaction damage that
occurred in the recent Canterbury earthquakes.
The applicability of the method to complex multi-layered soil profiles encountered in
Canterbury is addressed, and a procedure for calculating an equivalent liquefied layer thickness
in such profiles is proposed. This procedure is applied to a large number of sites with CPT data
in Christchurch, combining simplified liquefaction analyses with detailed observations of
ground damage following three large earthquakes.
Ishihara’s method was generally successful in predicting the occurrence of liquefaction damage,
and is considered appropriate for simplified assessments of liquefaction hazard in layered
Canterbury soils. However, the Ishihara method may unconservatively predict no damage for
sites where thin liquefiable layers are present within the upper 3m of the soil profile;
observations from the Canterbury earthquakes indicate that significant damage may occur in
these cases. The data from Canterbury suggests that once liquefaction is triggered the
occurrence of liquefaction damage is primarily dependent on the proximity of the liquefied layer
to the ground surface, not the ground shaking intensity. Finally, it was observed that a crust
thickness greater than 3.5-4m was sufficient to prevent liquefaction induced damage, even with
significant thickness of liquefied soil below.
1 INTRODUCTION Ishihara (1985) observed that while liquefaction can cause severe damage to buildings, roads
and buried infrastructure, little damage occurs unless liquefaction results in some form of
ground surface manifestation such as sand boils, fissures or cracking. A simple method was then
developed to predict the occurrence of liquefaction induced ground damage. The method
considers:
1. The thickness of the non-liquefied crust layer (H1) – if a non-liquefied crust is too thin,
excess pore water pressures from the fluidised soil can easily ‘break through’.
2. The thickness of the underlying liquefied layer (H2) – the liquefied layer must have
sufficient thickness to enable significant excess pore water pressures to develop, in
order to allow significant ground deformation and soil deformation to occur.
3. The intensity of ground shaking – the more severe the earthquake the greater crust
thickness needed to prevent liquefaction damage.
Using these principles, a chart was developed using observations from the M7.7 Nihonkai
Chubu earthquake in 1983, where occurrences of damage and no damage were plotted. The H1
and H2 thicknesses were determined from liquefaction triggering analysis; Ishihara concluded
sandy soils with SPT N < 10 would have liquefied in this earthquake. Three boundary curves
were superimposed onto this data representing earthquakes with different peak ground
accelerations. This figure is reproduced in Figure 2(a). If a site plots above the boundary curve,
liquefaction induced ground damage is likely.
Bowen, H. J. & Jacka, M. E. (2013).
Liquefaction induced ground damage in the Canterbury earthquakes: predictions vs. reality
Youd and Garris (1995) undertook an evaluation of the Ishihara method using data from 15
different earthquakes ranging in magnitude from 5.3 to 8.0. Layer thicknesses were calculated
using the Seed and Idriss (1985) triggering method. They concluded that the Ishihara method
was reasonably successful in predicting the occurrence of liquefaction damage. However, the
method was not accurate for sites affected by lateral spreading. Following these observations, it
is now accepted in practice that lateral spreading ground damage arises from a different
mechanism, and that lateral spreading cracks can exacerbate the occurrence of sand boils as they
provide a path for liquefaction ejecta.
This study is essentially an application of the Ishihara method to sites affected by the
Canterbury earthquakes with two minor modifications:
1. A method is proposed to calculate an equivalent liquefied layer thickness, H2, for
interbedded layers of liquefiable and non-liquefiable soil.
2. The magnitude scaled peak ground acceleration (PGAM=7.5) is used as a ground shaking
intensity measure rather than the peak ground acceleration (PGA).
Both of these modifications are considered necessary to allow for correct interpretation of the
method in the Canterbury earthquakes. Interbedded soil profiles are common due to the alluvial
overbank deposits and all three major earthquakes had magnitudes less than M=7.5.
2 CRUST THICKNESS CALCULATION The proposed calculation procedure can be summarised as follows:
The crust thickness, H1, is identified as the depth to the shallowest soil layer where the
factor of safety against liquefaction (FOSliq) is less than one. FOSliq is evaluated using a
simplified liquefaction triggering calculation (Idriss and Boulanger, 2008).
The thicknesses of non-liquefied layers between liquefied layers are calculated.
If a non-liquefied layer is thicker than 1m, then it is considered thick enough to
effectively separate the liquefied layers above and below.
If the thickness of the non-liquefied layer is less than 1m, it is not considered effective
in separating the liquefied layers above and below.
Therefore the bottom of the H2 layer is the top of the shallowest non-liquefiable layer
that is thicker than 1m.
The automatic calculation procedure was applied to 46 locations in the Canterbury region. Table
1 summarises the input data used in the calculations.
Table 1: Inputs to crust thickness calculation
Parameter Description Reference
Geotechnical
investigation
data
Cone Penetration Test (CPT) data from Canterbury
Geotechnical Database (CGD), primarily from post-
earthquake CPTs undertaken by Earthquake Commission.
CPTs in areas affected by lateral spreading were excluded
from the data.
CERA (2013)
Ground
shaking
intensity
Peak ground acceleration (PGA) contours from CGD
interpolated from strong motion stations across region;
magnitude scaled using factors from Idriss and Boulanger
(2008)
Bradley et al.
(2012)
Idriss and
Boulanger (2008)
Groundwater
depth
Event specific groundwater contours from CGD created using
data from monitoring bores across the region and LiDAR
scans of ground elevation
GNS (2013)
Liquefaction
triggering
Simplified liquefaction triggering analysis using CPT data
(fines correction using Roberston and Wride (1998)) Idriss and
Boulanger (2008)
Bowen, H. J. & Jacka, M. E. (2013).
Liquefaction induced ground damage in the Canterbury earthquakes: predictions vs. reality
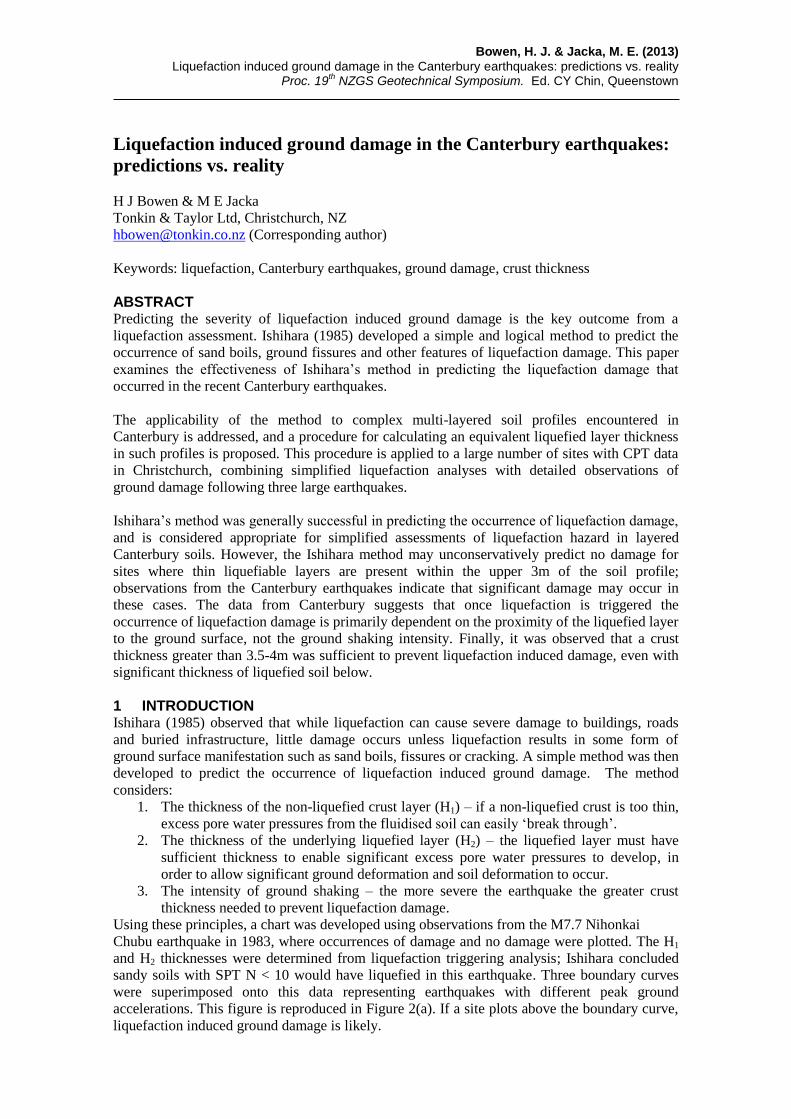
Figure 1: Example calculation of H1 and H2 in layered soil profile: (a) CPT results, (b)
Soil classification index, (c) Factor of safety against liquefaction, (d) Liquefaction
triggering and equivalent crust layer thickness schematic
The choice of 1m as a nominal thickness of non-liquefied soil to separate the effects of two
liquefied layers is somewhat arbitrary. Nonetheless inspection of the data indicates that this
limit seems to be effective when explaining the occurrence (or otherwise) of observed post-
earthquake liquefaction damage following the Canterbury Earthquakes.
To illustrate the application of the method, Figure 1 shows an example CPT from south-western
Christchurch. The soil stratigraphy consists of interbedded layers of loose sand and soft to firm
low plasticity silt. A liquefaction triggering analysis (using Idriss and Boulanger, 2008) predicts
that the sand layers will liquefy in a large earthquake (M=7.5 with PGA=0.35g) and that the silt
layers are non-liquefiable.
Figure 1(d) indicates the H1 and H2 values calculated using the automated procedure. The
liquefied layer thickness H2 is determined to be H2 = 3.1m.
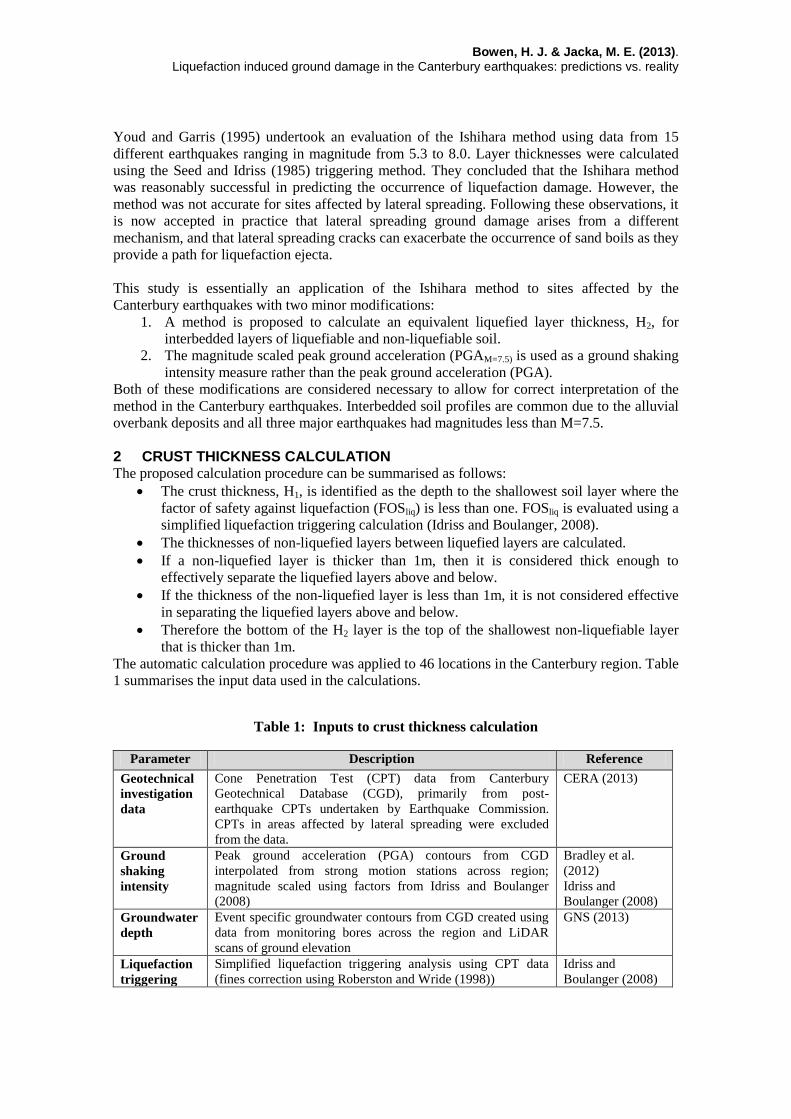
3 RESULTS FROM CANTERBURY EARTHQUAKES Figure 2 summarises the H1 and H2 values calculated at 46 sites around Christchurch for three
earthquake events; the Mw = 7.1 4 September 2010, Mw = 6.2 22 February 2011 and Mw = 5.9
and Mw = 6.0 13 June 2011 earthquakes. The locations were selected to ensure a wide range of
locations, geological conditions and experienced ground shaking intensity.
The data are divided into three bins based on the magnitude scaled peak ground acceleration
(PGAM=7.5) experienced at the site. Each bin corresponds to a boundary curve proposed by
Ishihara (1985) to enable a comparison.
(a) (b) (c) (d)
Bowen, H. J. & Jacka, M. E. (2013).
Liquefaction induced ground damage in the Canterbury earthquakes: predictions vs. reality
Figure 2: Ishihara crust thickness chart: (a) Boundary curves proposed by Ishihara in
1985, (b) to (d) Data from Canterbury earthquakes using the proposed simplified method
divided into three bins based on magnitude scaled peak ground acceleration with the
corresponding Ishihara boundary curve
4 DISCUSSION 4.1 Performance of method for Canterbury soils From inspection of Figure 2 it can be concluded that the proposed equivalent layer thickness is
able to provide a good characterisation of the layers critical to predicting the occurrence of
liquefaction. Figure 2(b) shows a number of ‘false positive’ results; this may be due to the
triggering calculation being slightly conservative, as is necessary for a simplified screening tool.
When assessing the performance of the method it is useful to re-examine the three aspects
identified by Ishihara that contribute to the occurrence of liquefaction damage:
0
1
2
3
4
5
6
7
8
9
10
0 1 2 3 4 5 6 7 8 9 10
Thic
knes
s o
f liq
uef
iab
le l
aye
r, H
2(m
)
Thickness of non-liquefiable crust, H1 (m)
0
1
2
3
4
5
6
7
8
9
10
0 1 2 3 4 5 6 7 8 9 10Th
ickn
ess
of
liqu
efia
ble
la
yer,
H2
(m)
Thickness of non-liquefiable crust, H1 (m)
No ground damageGround damage
0
1
2
3
4
5
6
7
8
9
10
0 1 2 3 4 5 6 7 8 9 10
Thic
knes
s o
f liq
uef
iab
le l
aye
r, H
2(m
)
Thickness of non-liquefiable crust, H1 (m)
No ground damageGround damage
0
1
2
3
4
5
6
7
8
9
10
0 1 2 3 4 5 6 7 8 9 10
Thic
knes
s o
f liq
uef
iab
le l
aye
r, H
2(m
)
Thickness of non-liquefiable crust, H1 (m)
No ground damageGround damage
PGA = 0.2g
PGA = 0.3g
PGA = 0.4 – 0.5g
Data from
PGAM=7.5 = 0.15 – 0.25g
Data from
PGAM=7.5 = 0.25 – 0.35g Data from
PGAM=7.5 = 0.35g +
(a)
(b)
(c)
(d) PGA = 0.3g
PGA = 0.4 – 0.5g
PGA = 0.2g
Bowen, H. J. & Jacka, M. E. (2013).
Liquefaction induced ground damage in the Canterbury earthquakes: predictions vs. reality
1. The thickness of the non-liquefied crust layer (H1) – if a non-liquefied crust is too thin,
excess pore water pressures from the fluidised soil can easily ‘break through’
The Canterbury data supports the idea that the non-liquefied crust layer is the most critical
parameter in determining the occurrence or otherwise of liquefaction induced ground damage.
2. The thickness of the underlying liquefied layer (H2) – the liquefied layer must have
sufficient thickness to enable significant excess pore water pressures to develop, in
order to allow significant ground deformation and soil deformation to occur.
The results suggest that H2 thickness is a less critical parameter in the occurrence of liquefaction
damage. It is possible that the build up of excess pore water pressure is not related to the
thickness of the liquefied layer. There have been many sites where a thin (0.5 – 1m) liquefiable
layer close to the surface has caused a large amount of damage; this suggests the location of the
liquefied layer is more important than its thickness.
3. The intensity of ground shaking – the more severe the earthquake the greater crust
thickness needed to prevent liquefaction damage
The data do not seem to support this conclusion; once the ground shaking intensity is great
enough to trigger liquefaction further increases in intensity do not seem to affect the occurrence
or otherwise of liquefaction damage on the ground surface. However it must be noted that there
are limited data for sites where large accelerations were experienced, and the earthquake
magnitudes are all in the moderate range (less than Mw = 7.5).
The three observations above are reinforced by analysis of Canterbury dataset using a separate
liquefaction vulnerability indicator, the Liquefaction Severity Number (LSN) (T&T, 2013). In
calculating LSN, a heavier weighting is given to shallow liquefiable layers than deep liquefiable
layers. Analysis of the LSN results across Canterbury indicates that: (1) greater damage is
predicted if the liquefiable layer is closer to the ground surface; (2) the thickness of the
liquefiable layer is not critical, especially for deeper soil layers; and (3) once liquefaction has
triggered in all susceptible soils, further damage is not predicted with increasing ground shaking
intensity.
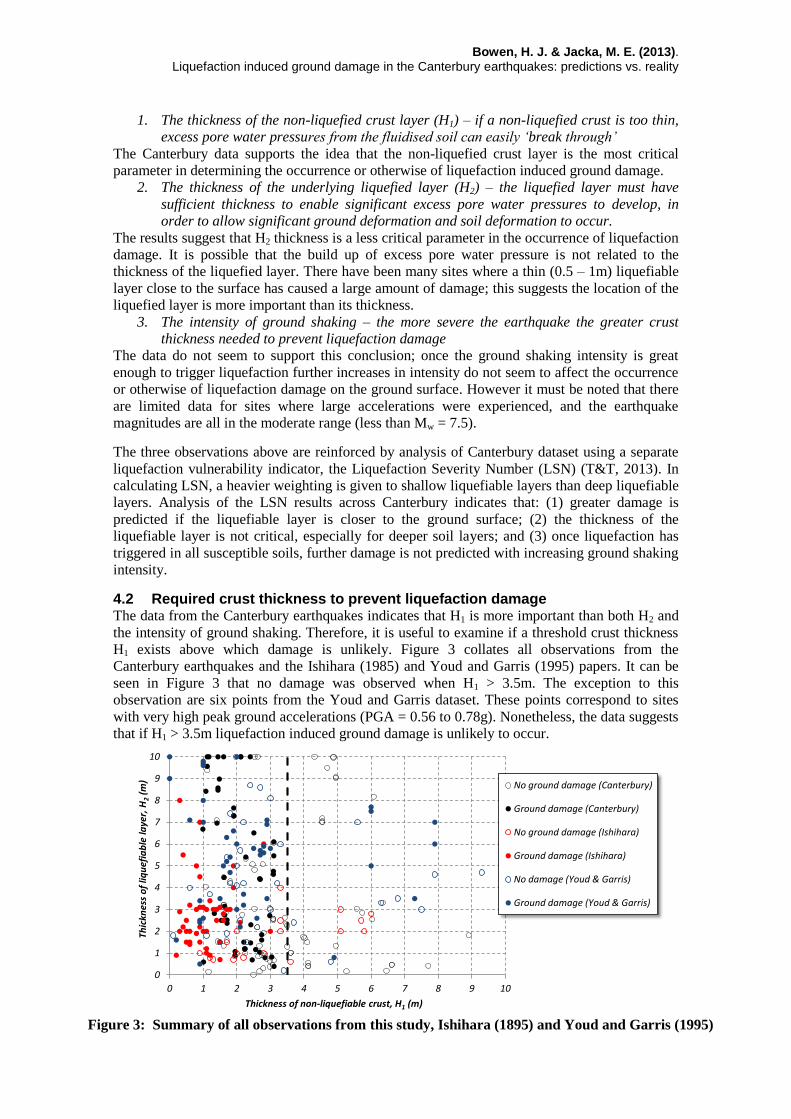
4.2 Required crust thickness to prevent liquefaction damage The data from the Canterbury earthquakes indicates that H1 is more important than both H2 and
the intensity of ground shaking. Therefore, it is useful to examine if a threshold crust thickness
H1 exists above which damage is unlikely. Figure 3 collates all observations from the
Canterbury earthquakes and the Ishihara (1985) and Youd and Garris (1995) papers. It can be
seen in Figure 3 that no damage was observed when H1 > 3.5m. The exception to this
observation are six points from the Youd and Garris dataset. These points correspond to sites
with very high peak ground accelerations (PGA = 0.56 to 0.78g). Nonetheless, the data suggests
that if H1 > 3.5m liquefaction induced ground damage is unlikely to occur.
Figure 3: Summary of all observations from this study, Ishihara (1895) and Youd and Garris (1995)
0
1
2
3
4
5
6
7
8
9
10
0 1 2 3 4 5 6 7 8 9 10
Thic
knes
s o
f liq
uef
iab
le la
yer,
H2
(m)
Thickness of non-liquefiable crust, H1 (m)
No ground damage (Canterbury)
Ground damage (Canterbury)
No ground damage (Ishihara)
Ground damage (Ishihara)
No damage (Youd & Garris)
Ground damage (Youd & Garris)
Bowen, H. J. & Jacka, M. E. (2013).
Liquefaction induced ground damage in the Canterbury earthquakes: predictions vs. reality
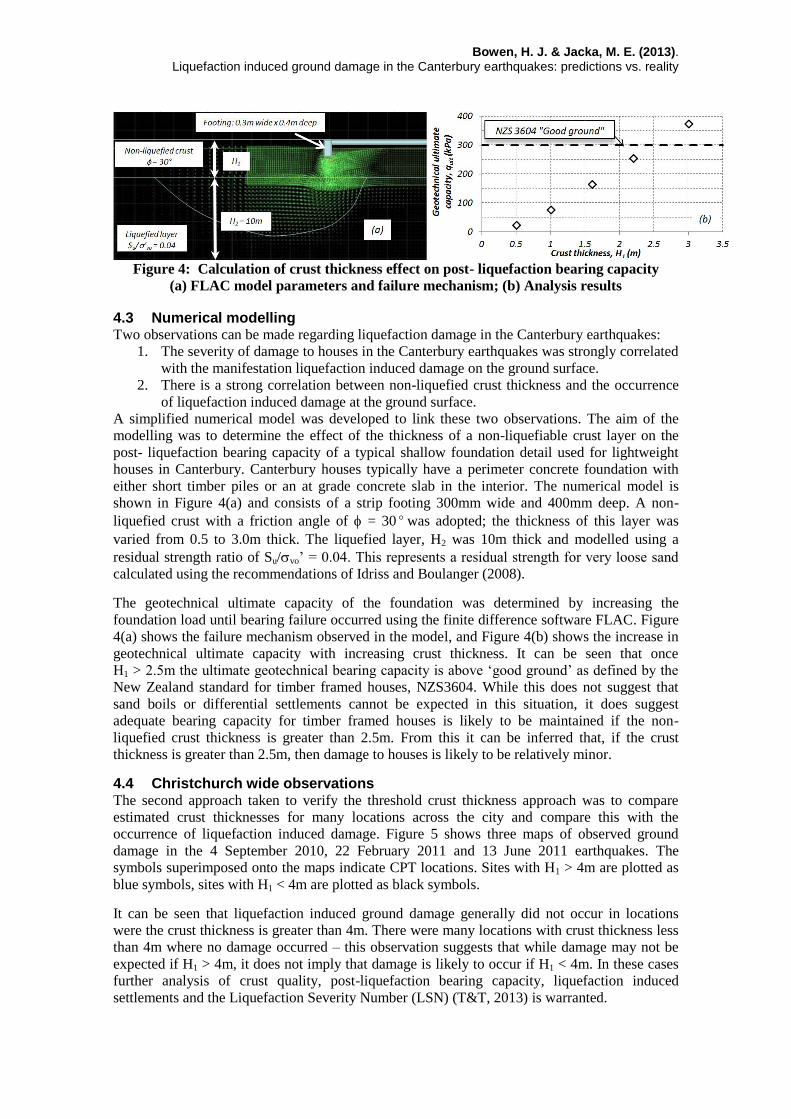
Figure 4: Calculation of crust thickness effect on post- liquefaction bearing capacity
(a) FLAC model parameters and failure mechanism; (b) Analysis results
4.3 Numerical modelling Two observations can be made regarding liquefaction damage in the Canterbury earthquakes:
1. The severity of damage to houses in the Canterbury earthquakes was strongly correlated
with the manifestation liquefaction induced damage on the ground surface.
2. There is a strong correlation between non-liquefied crust thickness and the occurrence
of liquefaction induced damage at the ground surface.
A simplified numerical model was developed to link these two observations. The aim of the
modelling was to determine the effect of the thickness of a non-liquefiable crust layer on the
post- liquefaction bearing capacity of a typical shallow foundation detail used for lightweight
houses in Canterbury. Canterbury houses typically have a perimeter concrete foundation with
either short timber piles or an at grade concrete slab in the interior. The numerical model is
shown in Figure 4(a) and consists of a strip footing 300mm wide and 400mm deep. A non-
liquefied crust with a friction angle of = 30° was adopted; the thickness of this layer was
varied from 0.5 to 3.0m thick. The liquefied layer, H2 was 10m thick and modelled using a
residual strength ratio of Su/vo’ = 0.04. This represents a residual strength for very loose sand
calculated using the recommendations of Idriss and Boulanger (2008).
The geotechnical ultimate capacity of the foundation was determined by increasing the
foundation load until bearing failure occurred using the finite difference software FLAC. Figure
4(a) shows the failure mechanism observed in the model, and Figure 4(b) shows the increase in
geotechnical ultimate capacity with increasing crust thickness. It can be seen that once
H1 > 2.5m the ultimate geotechnical bearing capacity is above ‘good ground’ as defined by the
New Zealand standard for timber framed houses, NZS3604. While this does not suggest that
sand boils or differential settlements cannot be expected in this situation, it does suggest
adequate bearing capacity for timber framed houses is likely to be maintained if the non-
liquefied crust thickness is greater than 2.5m. From this it can be inferred that, if the crust
thickness is greater than 2.5m, then damage to houses is likely to be relatively minor.
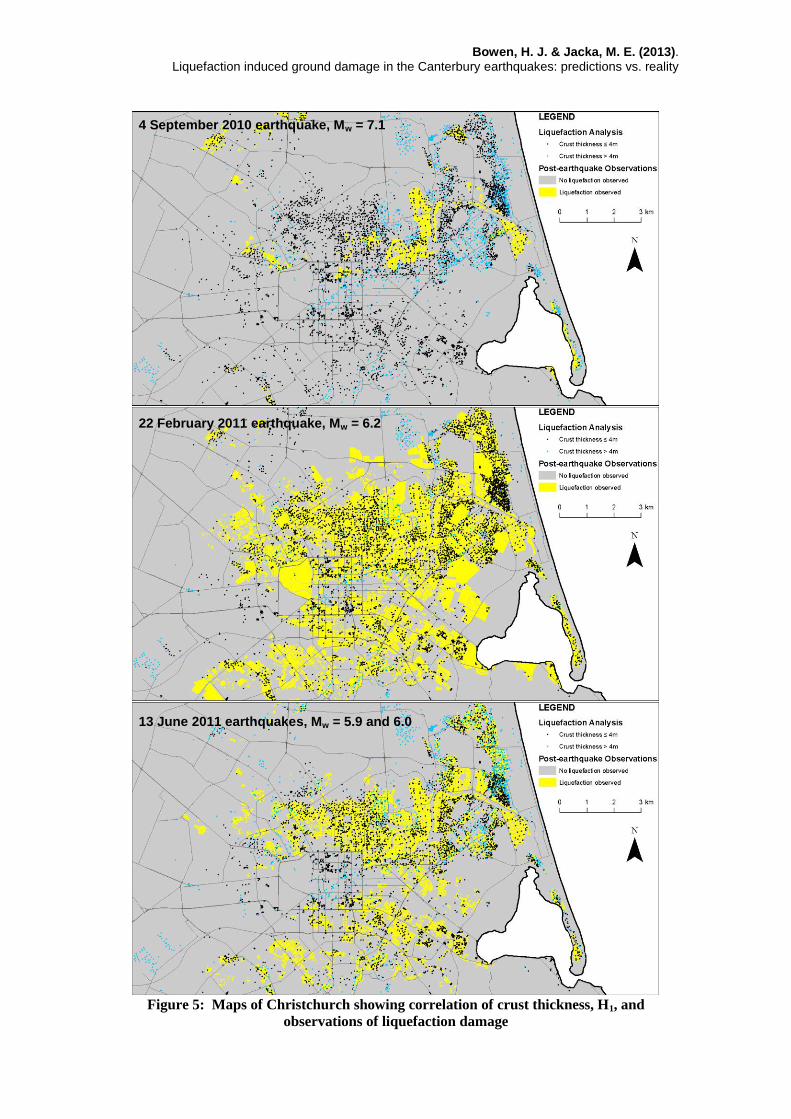
4.4 Christchurch wide observations The second approach taken to verify the threshold crust thickness approach was to compare
estimated crust thicknesses for many locations across the city and compare this with the
occurrence of liquefaction induced damage. Figure 5 shows three maps of observed ground
damage in the 4 September 2010, 22 February 2011 and 13 June 2011 earthquakes. The
symbols superimposed onto the maps indicate CPT locations. Sites with H1 > 4m are plotted as
blue symbols, sites with H1 < 4m are plotted as black symbols.
It can be seen that liquefaction induced ground damage generally did not occur in locations
were the crust thickness is greater than 4m. There were many locations with crust thickness less
than 4m where no damage occurred – this observation suggests that while damage may not be
expected if H1 > 4m, it does not imply that damage is likely to occur if H1 < 4m. In these cases
further analysis of crust quality, post-liquefaction bearing capacity, liquefaction induced
settlements and the Liquefaction Severity Number (LSN) (T&T, 2013) is warranted.
Bowen, H. J. & Jacka, M. E. (2013).
Liquefaction induced ground damage in the Canterbury earthquakes: predictions vs. reality
Figure 5: Maps of Christchurch showing correlation of crust thickness, H1, and
observations of liquefaction damage
4 September 2010 earthquake, Mw = 7.1
22 February 2011 earthquake, Mw = 6.2
13 June 2011 earthquakes, Mw = 5.9 and 6.0
Bowen, H. J. & Jacka, M. E. (2013).
Liquefaction induced ground damage in the Canterbury earthquakes: predictions vs. reality
5 CONCLUSIONS The performance of a widely used empirical method to evaluate the occurrence of liquefaction
induced ground damage was examined using observations from the Canterbury earthquakes.
Key conclusions include:
The Ishihara H1/H2 method provides a useful framework for predicting liquefaction
induced damage, especially given the uncertainties present in geotechnical earthquake
engineering.
Observations from the Canterbury earthquakes indicate that if H1 > 3.5 – 4.0m then
liquefaction damage is unlikely. Numerical analysis suggests that bearing capacity is
likely to be adequate for lightly loaded shallow foundations if H1 > 2.5m.
Liquefaction of relatively thin layers close to the ground surface caused a large amount
of damage at certain sites during the Canterbury earthquakes. This suggests the
occurrence of liquefaction damage is less sensitive to the thickness of the liquefiable
layer, H2. Consequently, Ishihara’s method may be unconservative for the case where
0.5 – 2m thick liquefiable soil layers are present within the upper 3m of soil.
Once liquefaction is triggered, observations from the Canterbury earthquakes indicate
that occurrence or otherwise of liquefaction induced damage is less sensitive to intensity
of ground shaking. Rather, the proximity of the liquefied layers to the ground surface is
the more important aspect.
ACKNOWLEDGEMENTS
This work would not have been possible without the data obtained by the NZ hazard monitoring
system, GeoNet and the extensive remote sensing and ground investigations of land and
dwelling damage, sponsored by the NZ Government through its agencies the Earthquake
Commission of NZ, and the Ministry of Civil Defence and Emergency Management.
REFERENCES Bradley, B.A. and Hughes, M. (2012) Conditional Peak Ground Accelerations in the
Canterbury Earthquakes for Liquefaction Assessment, April 2012.
Canterbury Earthquake Recovery Authority (2013) Canterbury Geotechnical Database.
Retrieved from https://canterburygeotechnicaldatabase.projectorbit.com on
10 May 2013.
GNS Science (2013) Median water table elevation in Christchurch and surrounding area after
the 4 September 2010 Darfield Earthquake, GNS 2013/01, March 2013
Idriss and Boulanger (2008). Soil liquefaction during earthquakes, Earthquake Engineering
Research Institute, Monograph MN0-12
Ishihara, K., (1985). Stability of natural deposits during earthquakes, Proceedings of the
Eleventh International Conference on Soil Mechanics and Foundation
Engineering, San Francisco, 12-16 August 1985
Tonkin and Taylor (2013) Liquefaction vulnerability study, Tonkin and Taylor Report
52020.0200/v1.0. February 2013.
Youd, T. L., and Garris, C. T. (1995) Liquefaction-induced ground-surface disruption, Journal
of Geotechnical Engineering, v. 121, n. 11, p. 805-809.