Embed Size (px)
Citation preview

Analyses of the Impact of Loss of Spray-Applied Fire Protection on the Fire Resistance of Steel Columns
James A. Milke, University of Maryland, USA
Noah L. Ryder, Combustion Science & Engineering, Inc., USA Steven D. Wolin, Code Consultants, Inc., USA
Abstract The loss of fire protection material is generally acknowledged to reduce the fire resistance of protected steel structural members, but the magnitude of the reduction is unknown. Two analyses are applied to assess the heat transfer to a steel column and investigate the proportional decrease in the fire resistance when relatively minor portions of spray-applied fire protection material are removed. One method is an elementary, lumped heat capacity analysis (LHC). The second method involves the application of a three-dimensional, finite element model. In both cases, the column is assumed to be subjected to the standard ASTM E119 fire resistance test. The predicted temperature distributions within the member over time are used in conjunction with the thermal endpoint criteria specified in ASTM E119. The LHC analysis of the temperature rise of the entire column shows the area of missing protection to be of little consequence in determining the average temperature of the entire column. The column temperatures calculated using the LHC approach are primarily dependent on the original fire resistance of the column for the small areas of missing protection examined. In contrast, the area of the missing protection and the size of the column are found to have an appreciable effect upon the thermal response of the column regardless of the protection thickness using the finite element analysis.
Introduction
ASTM E119 documents the standard test to assess the fire resistance of structural members in North America [1]. The temperature endpoint criteria for steel columns are: an average temperature of 538°C and 649 °C at a single point [1]. One method of protecting steel columns is through the use of an insulating, spray-applied fire protection material. Several such materials are identified as part of listed steel column assembly designs included in the Fire Resistance Directory [2].
The intent of this study is to compare the results from two separate analysis methods, one relatively simple and one relative complex, to provide an estimate of the impact of missing fire protection material on the temperature rise experienced by a steel column exposed to the conditions associated with the ASTM E119 standard test. One method, referred to as the LHC analysis, uses an algebraic equation that is reiterated to determine the temperature rise of the column [3]. The second analysis method uses a finite element model, FIRES-T3, to conduct the analysis [4].
Assessing the impact of the local temperature rise on the structural performance of the column is beyond the scope of this paper. However, such is needed to conduct a more comprehensive analysis of the impact of the missing protection, rather than applying the endpoint temperature criteria from ASTM E119.
1
Copyright © International Association for Fire Safety Science

Previous Work Tomecek and Milke provided a two-dimensional analysis of the impact of missing fire protection material on the temperature rise of steel columns using FIRES-T3 [4,5]. The limitation of using a two-dimensional model is that a section of protection material is removed along the entire length of the column instead of the more typical situation of having missing protection over only a finite length. In that analysis, only a 4% loss of fire protection material resulted in a 15% reduction in the time to reach the thermal endpoint criteria for a one-hour rated W10X49 column and a 40% reduction in the time for a two-hour rated W10X49 column. For the more massive W14X233 column, the reduction in fire resistance was not as severe, being only 15% with the loss of 4% of protection during a two-hour exposure.
A three-dimensional analysis provides a more accurate depiction of actual situations involving missing protection, where the missing protection is limited to a small section of the column. The three-dimensional analysis preserves the protection along the remainder of the length of the column, providing more protected mass to dissipate the heat transferred through the unprotected portion of the column.
Methodology The LHC method for a steel column is based on the following energy balance:
outins qqdtdTmc �� −= (1)
where m is the mass of the steel section, cs is the specific heat of the steel, T is the temperature of the steel, t is the time, q is the incident heat transfer to the column and
is the heat loss from the column. in�
outq�For a column with missing protection, the heat transfer to the column can be modeled by a resistance analogy using parallel resistors. One resistor addresses the heat transferred from the furnace environment to the unprotected portion of the steel column. The second resistor address the heat transferred to the column via conduction through the insulating layer of fire protection material. Expressions for the two resistors are:
( )AAR
rcf ααα +
== 11 (2)
kAhRins = (3)
where Rf is the resistor addressing the heat transfer from the fire exposure, α is the total heat transfer coefficient, αc is the convective heat transfer coefficient, αr is the radiative coefficient, A is the surface area, and h and ki are the thickness and conductivity of the fire protection material. The convective heat transfer coefficient is assumed to be 20 W/m2°C and the effective emissivity of the furnace exposure is assumed to be 0.7 [6]. Applying the parallel resistance analogy, the temperature rise experienced by the steel column in a time step, ∆t, is:
( ) ( )t
mcTT
hAkAT
s
sfs ∆
−��
���
� −+=∆ γα 1 (4)
2

where ∆Ts is the temperature rise in the steel, γ is the proportion of missing protection material, Tf and Ts are the fire and steel temperatures and ∆t is the time step.
In the second approach, the FIRES-T3 finite element model was used where the spatial variables are approximated by an element mesh and the time variable is discretized by a piecewise integration technique. A portion of the column mesh is shown in Fig. 1.
Fig. 1. Element mesh for Steel Column
The governing partial differential equation is:
tTcq
zTk
zyTk
yxTk
x p ∂∂ρ=+�
�
���
�
∂∂
∂∂+��
�
����
�
∂∂
∂∂+�
�
���
�
∂∂
∂∂
� (5)
where x, y, and z are spatial coordinates, t is time, T is temperature, ρ is density, cp is specific heat, k is thermal conductivity, and is internal heat generation. q�
In the three-dimensional analysis, the temperatures within the column are a function of both space and time. The material properties, density, specific heat, and thermal conductivity, are temperature dependent, thereby varying throughout the column assembly and as a function of time. Non-linearities due to varying material properties are considered using a discretized solution method.
Heat transfer properties are assigned to each of the elements, depending on the composition and location of the element. Convective and radiative heat transfer conditions to the column describe the environment of the ASTM E119 furnace. Convection is modeled as [4]:
( )nTCAq ∆= (6)
where q is the rate of heat transfer (W), C is the convection constant, A is the surface area of the element (m2), ∆T is the temperature difference between the element and the environment (°C) and n is the convection exponent. Radiation is modeled as [4]:
( 44ssffs TTFAq εεασ −= ) (7)
3

where q is the heat transfer rate (W), F is the view factor, A is the surface area of the element (m2), αs is the absorptivity of the surface, εs is the emissivity of the surface, εf is the effective emissivity of the furnace environment, Tf is the furnace temperature (K), and Ts is the surface temperature (K). The convective and radiative heat transfer properties used are provided in Table 1.
Table 1. Convective and Radiative Heat Transfer Properties
Property Value
Convection constant (W/m2Kn) 0.27 Convection exponent 1.25 Emissivity of furnace environment 0.8 Absorptivity and emissivity of surface 0.9 View Factor 1.0
The column assembly considered in this analysis consists of a steel column protected with a spray-applied fire protection material, such as that described in the listed design UL X738 [2]. The material properties used in the analysis are presented in Table 2. For the LHC method, the insulation and steel properties were evaluated corresponding to an average temperature expected over the duration of the exposure.
Table 2. Material Properties
Conductivity (W/m-°C) Specific Heat (kJ/kg-°C) Density(kg/m3)
Steel 20°C 51.9 0.448 7700 315°C 42.7 400 °C 0.602 590°C 34.8 0.719 1090°C 26.0 1650°C 0.719 Fire Protection Material 20°C 0.0598 1.09 240 205°C 0.0598 1.09 400°C 0.116 1.27 1090°C 0.289 1.46
An initial estimate of the necessary protection thickness was done based on the correlation developed by Lie and Stanzak resulting from a one-dimensional heat transfer analysis [7]. For the one protection material used in design X738, the correlation is:
4

( ) 61.0/179.0
4.25+
=DWRh (8)
where h is the protection thickness (mm), R is the fire resistance (hours), and W/D is the ratio of the weight per unit length of the steel column to the heated perimeter of the steel column kg/m2.
The thicknesses of fire protection material for the analysis are determined using Eq. (8) for the case of full protection to attain a one-hour and two-hour fire resistance rating. The baseline cases analyzed as part of this study are summarized in Table 3.
Table 3. Thickness of Protection in Baseline Column Designs
Column Shape 1 hour 2 hour W6X16 22.9 mm 45.7 mm W14X233 7.9 mm 15.7 mm
Milke [8] and Gandhi [9] analyzed the heat transfer in steel column assemblies protected with spray-applied materials subjected to the ASTM E-119 furnace test with FIRES-T3. Milke determined that the predicted time for the average steel temperature to reach 538°C was within 13% of that determined from conducting the test. Gandhi found the time for the steel to reach the endpoint temperatures was within approximately 6 percent of those determined from tests conducted at UL.
Results Results from the LHC for the W6X16 and W14X233 columns with 3.9 and 7.7 cm2 of missing protection are presented in Fig. 2 and 3. In Fig. 2 and 3, the temperature rise for a given fire resistance rating is nearly identical despite different areas of missing protection. As such, the area of missing protection has little effect on the average temperature of the column. The dominant factor affecting the average temperature rise of the steel column is the original fire resistance rating and the size of the column (the W6X16 column has a significantly greater temperature rise than the W14X233 column).
The extent of the temperature variation can be examined to better describe the effect the missing protection. If heat is rapidly dissipated from the surface providing a near-uniform temperature over the column cross-section, then the average temperature endpoint criterion is applicable. In this case a two-dimensional analysis of the problem is appropriate. Conversely, if the temperature in a localized area is appreciably greater than the remainder of the cross-section, then the single point temperature endpoint criterion at the flange surface is relevant and a three-dimensional analysis is needed.
5

W6X16Lumped Heat Capacitance Results
0
100
200
300
400
500
600
700
800
900
1000
0 0.25 0.5 0.75 1 1.25 1.5 1.75 2
Time (Hours)
Tem
pera
ture
(°C
)
1 hr. with 3.9 cm² missing1 hr. with 7.7 cm² missing2 hr. with 3.9 cm² missing2 hr. with 7.7 cm² missing
Fig. 2. W6X16 Column Temperature
W 14X233Lumped Heat Capacitance Results
0
100
200
300
400
500
600
700
800
900
1000
0 0.25 0.5 0.75 1 1.25 1.5 1.75 2
Time (Hours)
Tem
pera
ture
(°C
)
1 hr. with 3.9 cm² missing1 hr. with 7.7 cm² missing2 hr. with 3.9 cm² missing2 hr. with 7.7 cm² missing
Fig. 3. W14X233 Column Temperature
The protection is removed as a strip on the top of the flange, as depicted in Fig. 4. A rectangular exposed area is used in keeping with the nodal scheme for the analysis. The missing protection extends across the entire width of the flange.
6

Fig. 4. Diagram of Half of the Column
with Missing Protection on Flange Fig.5 Diagram of Half of Column with Missing Protection on Web
Fig. 5 illustrates the exposed section on the web of the column as a result of removal of a rectangular section of protection material. The length of the missing protection is along the entire height of the web except for a small part of the top and bottom where there is overlapping protection from the flange.
The temperature profile along the depth of the column, i.e. perpendicular to the flange in a direction toward the centroid of the column, is presented in Fig. 6 at the elevation of the missing protection for a W6X16 column with 2 hours of protection. 7.7 cm2 of protective material is removed from the flange. The profile is taken normal to the exposed surface.
A relatively uniform temperature profile over the column cross-section is indicated in Fig. 6, consistent with the results of Tomecek and Milke where the reduction in fire resistance of a partially protected column is dependent on the size of the column [5]. The dissipation of heat by the mass of steel in that cross-section is an important factor in maintaining the fire resistance of the column.
The temperature profile over the length of the column on the flange containing the missing protection is illustrated in Fig. 7. The entire length of the column is not represented because the temperature rise at the exposed section of the column is not significantly influenced by the temperature rise more than 20 cm from the exposure.
Given the relative uniformity in the temperature in the column, the average temperature criterion is applicable for assessing fire resistance. The temperature rise of the exposed flange is plotted in Fig. 7 along with the fully protected columns for a W6X16 column.
Even though only very small areas of protection are removed from the column, a significant reduction in the level of protection is indicated by the analysis. Consequently, the temperature reaches 538 °C in approximately 0.6 hours for the one-hour design with 7.7 cm2 of missing protection area.
7

W6X16 with 7.7 cm2 Missing Protection
0
100
200
300
400
500
600
700
800
900
0 1 2 3 4 5 6 7 8
Distance from Exposed Surface (cm)
Tem
pera
ture
(°C
) Start0.25 hr.0.50 hr.0.75 hr.1.0 hr.1.25 hr.1.50 hr.
Fig. 6. Temperature Profile Perpendicular to the Flange
W6X16 with 7.7 cm2 Missing Protection
0
100
200
300
400
500
600
700
800
900
0 1 2 3 4 5 6 7 8
Distance from Exposed Surface (cm)
Tem
pera
ture
(°C
) Start0.25 hr.0.50 hr.0.75 hr.1.0 hr.1.25 hr.1.50 hr.
Fig. 7. Temperature Profile Over the Column Length
The thickness of the protection material is negated when a partial loss of protection occurs. The temperature rise at the exposed surface becomes a function of the area of missing protection, seemingly without regard to the original fire resistance rating.
8

The temperature rise is plotted in Fig. 8 for missing protection on the web of the column.
W 6x16
0
100
200
300
400
500
600
700
800
900
0 0.25 0.5 0.75 1 1.25 1.5
Tim e (Hours)
Tem
pera
ture
(°C
)
2 hr. with 3.9 cm² m issing 2 hr. with 7.7 cm² m issing2 hr. Full Protection1 hr. with 3.9 cm² m issing1 hr. with 7.7 cm² m issing1 hr. Full Protection
Fig. 8. Temperature at Exposed Flange Surface
W6x16
0
100
200
300
400
500
600
700
800
900
0 0.25 0.5 0.75 1 1.25 1.5
Time (Hours)
Tem
pera
ture
(°C
)
2 hr. with 3.9 cm² missing2 hr. with 7.7 cm² missing2 hr. Full Protection1 hr. with 3.9 cm² missing 1 hr. with 7.7 cm² missing1 hr. Full Protection
Fig. 9. Temperature at Exposed Web Surface
9
The results obtained for the web exposure are similar to those for the flange exposure, because the identical thermal conditions exist at each surface. In practice, the location of the exposure may influence the time to reach thermal endpoint limits due to differing thermal conditions at different points on the surface of the column.
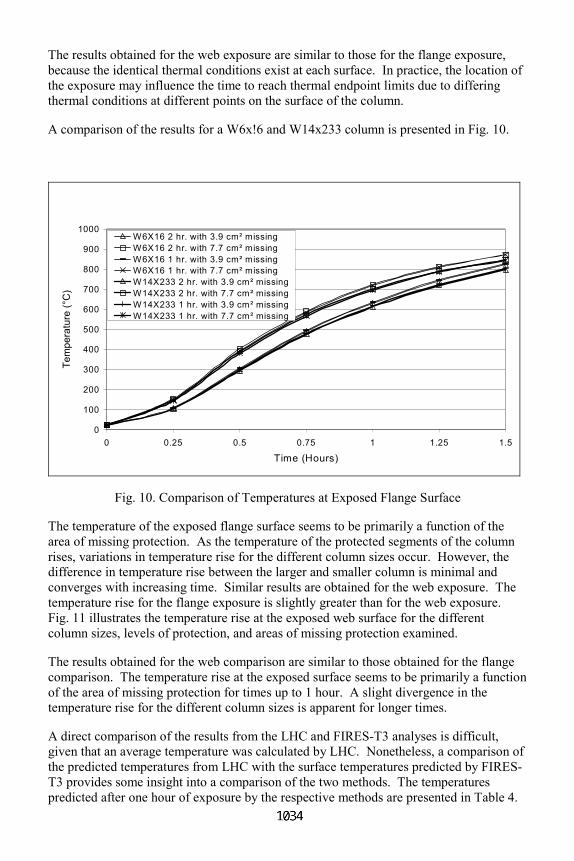
A comparison of the results for a W6x!6 and W14x233 column is presented in Fig. 10.
0
100
200
300
400
500
600
700
800
900
1000
0 0.25 0.5 0.75 1 1.25 1.5
Time (Hours)
Tem
pera
ture
(°C
)
W6X16 2 hr. with 3.9 cm² missingW6X16 2 hr. with 7.7 cm² missingW6X16 1 hr. with 3.9 cm² missingW6X16 1 hr. with 7.7 cm² missingW14X233 2 hr. with 3.9 cm² missingW14X233 2 hr. with 7.7 cm² missingW14X233 1 hr. with 3.9 cm² missingW14X233 1 hr. with 7.7 cm² missing
Fig. 10. Comparison of Temperatures at Exposed Flange Surface
The temperature of the exposed flange surface seems to be primarily a function of the area of missing protection. As the temperature of the protected segments of the column rises, variations in temperature rise for the different column sizes occur. However, the difference in temperature rise between the larger and smaller column is minimal and converges with increasing time. Similar results are obtained for the web exposure. The temperature rise for the flange exposure is slightly greater than for the web exposure. Fig. 11 illustrates the temperature rise at the exposed web surface for the different column sizes, levels of protection, and areas of missing protection examined.
The results obtained for the web comparison are similar to those obtained for the flange comparison. The temperature rise at the exposed surface seems to be primarily a function of the area of missing protection for times up to 1 hour. A slight divergence in the temperature rise for the different column sizes is apparent for longer times.
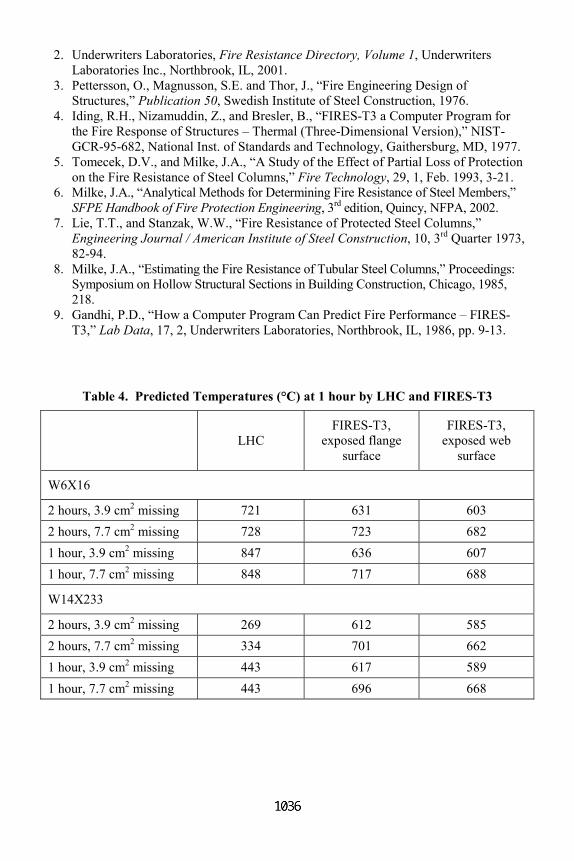
A direct comparison of the results from the LHC and FIRES-T3 analyses is difficult, given that an average temperature was calculated by LHC. Nonetheless, a comparison of the predicted temperatures from LHC with the surface temperatures predicted by FIRES-T3 provides some insight into a comparison of the two methods. The temperatures predicted after one hour of exposure by the respective methods are presented in Table 4.
10

The results from FIRES-T3 are presented for both locations of missing protection analyzed using FIRES-T3. The temperatures predicted by LHC either greatly exceed or are substantially less than those predicted by FIRES-T3, apparently the result of the mass of the steel section having an overly strong effect on the temperature rise of the section.
0
100
200
300
400
500
600
700
800
900
1000
0 0.25 0.5 0.75 1 1.25 1.5
Time (Hours)
Tem
pera
ture
(°C
)
W 6X16 2 hr. with 3.9 cm² missingW 6X16 2 hr. with 7.7 cm² missingW 6X16 1 hr. with 3.9 cm² missingW 6X16 1 hr. with 7.7 cm² missingW 14X233 2 hr. with 3.9 cm² m issing W 14X233 2 hr. with 7.7 cm² m issingW 14X233 1 hr. with 3.9 cm² m issingW 14X233 1 hr. with 7.7 cm² m issing
Fig. 11. Comparison of Temperature at Exposed Web Surface
Conclusion Analyses by two separate methods indicate that the fire resistance of a column protected is significantly diminished if only a small portion of the spray-applied fire resistant material is removed. The LHC method predicts a significantly greater temperature rise than the three-dimensional finite element analysis. For the LHC method, the size of the column and the thickness of protection are the principal factors affecting the temperature rise, with the actual exposed surface area having little impact. In contrast, in the finite element analysis the influential factors affecting the temperature rise of the steel column are the area of the missing protection and to a lesser extent the column size. However, the column size is relatively insignificant until late in the test in the finite element analysis. Given the ability of the finite element analysis to account for temperature variations in the steel column, this method of analysis would appear to be the more accurate approach.
References 1. American Society of Testing and Materials, ASTM E-119 00a, Standard Test
Method for Fire Tests of Building Construction and Materials, ASTM, Philadelphia, 2000.
11
12
2. Underwriters Laboratories, Fire Resistance Directory, Volume 1, Underwriters Laboratories Inc., Northbrook, IL, 2001.
3. Pettersson, O., Magnusson, S.E. and Thor, J., “Fire Engineering Design of Structures,” Publication 50, Swedish Institute of Steel Construction, 1976.
4. Iding, R.H., Nizamuddin, Z., and Bresler, B., “FIRES-T3 a Computer Program for the Fire Response of Structures – Thermal (Three-Dimensional Version),” NIST-GCR-95-682, National Inst. of Standards and Technology, Gaithersburg, MD, 1977.
5. Tomecek, D.V., and Milke, J.A., “A Study of the Effect of Partial Loss of Protection on the Fire Resistance of Steel Columns,” Fire Technology, 29, 1, Feb. 1993, 3-21.
6. Milke, J.A., “Analytical Methods for Determining Fire Resistance of Steel Members,” SFPE Handbook of Fire Protection Engineering, 3rd edition, Quincy, NFPA, 2002.
7. Lie, T.T., and Stanzak, W.W., “Fire Resistance of Protected Steel Columns,” Engineering Journal / American Institute of Steel Construction, 10, 3rd Quarter 1973, 82-94.
8. Milke, J.A., “Estimating the Fire Resistance of Tubular Steel Columns,” Proceedings: Symposium on Hollow Structural Sections in Building Construction, Chicago, 1985, 218.
9. Gandhi, P.D., “How a Computer Program Can Predict Fire Performance – FIRES-T3,” Lab Data, 17, 2, Underwriters Laboratories, Northbrook, IL, 1986, pp. 9-13.
Table 4. Predicted Temperatures (°C) at 1 hour by LHC and FIRES-T3
LHC
FIRES-T3, exposed flange
surface
FIRES-T3, exposed web
surface
W6X16
2 hours, 3.9 cm2 missing 721 631 603 2 hours, 7.7 cm2 missing 728 723 682 1 hour, 3.9 cm2 missing 847 636 607 1 hour, 7.7 cm2 missing 848 717 688
W14X233
2 hours, 3.9 cm2 missing 269 612 585 2 hours, 7.7 cm2 missing 334 701 662 1 hour, 3.9 cm2 missing 443 617 589 1 hour, 7.7 cm2 missing 443 696 668