Embed Size (px)
Citation preview

ANALYSING DEMAND FOR PRIMARY EDUCATION
A CASE STUDY OF MUSLIM SLUM DWELLERS OF CALCUTTA
Z a k i r H u s a i n
Department of Economics, Rabindra Bharati University56A, B.T. Road, Kolkata 700 050, India.
Email: [email protected]: (Res) 22 85 2261
Abstract
The low literacy level within the Muslim community is traditionally explained in terms of
conservative values characterising Muslim society. Based on a field survey of slum
dwellers in selected areas of Calcutta, we have questioned this explanation. It is argued
that economic factors and uncertainties in the labour market combine to create a different
perception of the cost-benefits of education. We have also examined other facets of
educational decisions: its cost and components, the choice of educational institutions and
the preferred medium of instruction, presence of any gender bias, and the relation between
drop-outs and child labour.
Word Count: 14,494wordsKey Words: Primary Education, Child labour, Panel Data, Muslim, Calcutta.
The study was funded by a research grant from Institute of Development Studies Kolkata.The author is grateful to Dr. Amiya Bagchi, the members of the Expert Committee andparticipants of the IDSK Workshops for their comments; and to Javed Khan, Ajoy Deb,Kamran Siddiqui, Tariq Ali, Kaushar Hossain, Anwar Ali, Jani Khan, members ofBeniapukur Young Star Club (particularly Abid Hussain), and Kaushik Bar and AnwaraKhatun (both of World Vision) for their assistance during the survey.

1
ANALYSING DEMAND FOR PRIMARY EDUCATION
A CASE STUDY OF MUSLIM SLUM DWELLERS OF CALCUTTA
1. Introduction
India’s performance on the educational sector has not been impressive in the post-
Independence era. Statistics indicate that India has lagged behind even countries like Sri
Lanka. Empirical studies indicate that the situation is even worse for Muslims (PROBE,
1989, Sengupta and Gazder, 1997). These studies are supported by NSS figures at the All-
India and State levels (NSS, 2001). As compared to 82.2% literacy level for India’s urban
population, the literacy rate within the Muslim community is only 66.6%. For West
Bengal the corresponding percentages are 81.1% and 69.8%, respectively. Literacy levels
can be expected to be even lower for low income Muslims.
This situation is especially piquant as less than 200 years ago, Muslims constituted a
politically, economically and culturally dominant section of India’s population. Yet,
within the intervening period, they have gradually fallen behind the rest of society. A low
level of education is both a cause and a manifestation of this backwardness, specially in
the low income Muslims. In such groups, lack of education and overall socio-economic
backwardness has combined to reduce their capability set; this has resulted in
vulnerability and a tendency towards anti-social and criminal activities. Hence a study of
the low incidence of education amongst Muslims is important in understanding the
reasons for backwardness of the Muslim society.
This paper seeks to examine the nature of educational decisions among low income
Muslims and identify the factors determining such decisions. The paper starts with a
2
survey of the alternative explanations of low educational attainment of Muslims. Section
3 describes the research methodology and survey areas. Since educational decisions are
dependent on the socio-economic context in which agents are embedded, the socio-
economic and cultural characteristics of the slums studied are described in detail. This is
followed by the survey results. The value placed on education and the reasons is
examined first; this is followed by enrolment rates. Expenditure patterns on education are
analysed next. In addition to the money costs, the opportunity costs of education - in the
form of foregone income from child labour or foregone utility of services from the child
at home – can be expected to be an important factor determining education-related
decisions. Section 6 discusses this aspect. This is followed by an econometric analysis to
analyse the relative importance of factors determining educational decisions. In the
concluding section, the findings are integrated to identify the causes of low educational
attainments amongst low income Muslims.
2. Competing Hypotheses of Low Educational Attainment of Muslims
Studies of inequalities in educational opportunity between different socio-economic
classes emerged as an important research issue in the 1950s (Harnqvist, 1978). Alternative
explanations were offered to explain socio-cultural differences in educational choices.
Such explanations has been categorised by Boudon (1978: 22-24) as follows:
[a] Different social classes have different value systems that influence their attitude
towards the benefits of education (Hyman, 1953).
[b] The social position theory was developed in reaction to the value theory.1 This theory
argues that members of different social classes have to travel different ‘social
distances’ to attain the same educational level. This explanation focuses on the
different costs and benefits of education faced by different social classes.

3
[c] In addition to the different cost-benefit ratio of education, the social backgrounds of
families generate different differences in cultural opportunities. Children of a
particular social class may have to learn values and skills inconsistent with their
family backgrounds. For instance, in their study of working class children in a North
England industrial city, Jackson & Marsden (1962) reports that the teaching of middle
class values in grammar schools created a conflict between the school and
neighbourhood.
These explanations suggest two alternative hypotheses to explain the educational
backwardness of Muslims.
The common explanation offered for the low educational attainment of Muslims is in
terms of the value system characterising Muslim society. The conservative attitude of
Muslim parents, prevalence of purdah and early marriage, reluctance to send daughters to
school (particularly to co-educational institutions, and if women teachers are absent), and
a preference for religious education leading to dependence on Madrasahs have been
identified as important factors in this context (Ansari, 1989; Jehangir, 1991; Ruhela,
1998; Salamatullah, 1994). In addition, the focus on educating daughters to become good
mothers and husbands, their segregation from boys after puberty, early marriage, costs of
dowry, and the realisation that benefits from education will accrue to the matrimonial
home creates a gender bias (Jehangir, 1991; Ruhela, 1998; Salamatullah, 1994). This
explanation is supported by case studies and statements like “My father, being an
orthodox Muslim, is against providing higher education to his girls. He considers
coeducation as an evil.” made by Muslim girls during interviews (Ruhela, 1998: 11).

4
As opposed to this view, it can also be argued that Muslim parents do realise the value of
education. However, the costs and benefits of education to a Muslim child are different
from other communities. For instance, a large proportion of the Muslim community
belongs to the low-income section. As a result, they may find it difficult to finance the
education of their children. In addition Muslims may work in insecure jobs with variable
income. The resulting uncertainties may result in a reluctance to make long term
investments in education. The opportunity costs of educating children in the form of
foregone returns from child labour or incomplete household choirs may also become
important in this context. Simultaneously, the expected perceived benefit from education
is low due to the tight conditions in the labour market. Further, Muslims perceive that the
labour market is biased against Muslims; this reduces the already low probability of
securing work.
The cost-benefit analysis may be affected by another process. Educational systems
contain a set of socio-cultural beliefs. These beliefs may be contradictory to the socio-
cultural environment and the realities of their daily life. For instance, the secular nature of
the educational system may conflict with the attempts of the family to provide religious
training to the children. This may create tensions and doubts regarding the worth of
education. This effect of this process is to increase the ‘social distance’ to be travelled by
a Muslim child.
The first hypothesis, therefore, is basically a demand side explanation that argues that low
income Muslims are not interested in education. In other words, it is the preference
pattern of Muslims themselves that is responsible for the low level of primary education
amongst Muslims. The alternative hypothesis suggests that Muslims recognise the need

5
for education, but constraints in the form of factors reducing the actual or perceived
returns to education may prevent the demand for education being translated into effective
demand. This study tries to identify which of these two hypotheses explains the low
educational attainment of Muslims.
3. Data Sources and Description of Survey Sites
This work is empirical in nature and relies on primary data. The primary data was
collected on the basis of a household survey of 107 slum dwellers from the Park Circus-
Topsia area, in Calcutta. Park Circus has been selected as the survey site as it is a
commercially developed area with good transport links to both educational institutions
and to places of work (creating an incentive for dropping out). The Topsia belt, on the
other hand, contains numerous leather and shoe factories; the proximity of a large labour
market can be expected to have a negative impact on the demand for education. Further,
there are slums of different income levels and cultural groups in these two regions.
The respondents have been drawn from five slum areas. Each of these areas has their
unique features. At this point, it should be noted that while there was considerable
economic and socio-cultural variations across slums, differences within slums were
negligible. This allowed us to draw relatively small samples within slums (consisting of
20-25 households per slum). The slums studied can be divided into three groups based on
the income profile of their inhabitants. The main demographic and economic
characteristics of these slums are given below.
INSERT TABLE 1 HERE

6
3.1. High Income Slums
Slum 1 is in the first category. This slum is located on Karaya Road, between the Scottish
Cemetery and A.J.C. Bose Road. The inhabitants are migrants from Bihar who have
settled in Calcutta for several generations. Their vernacular is Urdu. The inhabitants
mostly reside in one- (or two-) room bustees, having a common water source. The houses
are pukka, but have tiled roofs. The male members are occupied in the service sector that
has emerged in the adjacent Mullickbazar area. Most of them are motor mechanics, or
work in shops; a few are engaged in the formal sector.2 Thus the inhabitants are able to
earn a fairly high and stable income. The family size is small, so that per capita income
(Rs.789.90) and standard of living is higher than in other slums. These families display
similar traits to those working class families observed by Jackson & Marsden (1962) -
aggressiveness, competitiveness, pride in achievements, delight in extension of their
knowledge, and a desire to pick up a new polish for their manners and accent.3 This spirit
is manifested in their educational choices and can be sensed from the neatness of their
rooms, the attires of male members and children, and their polished speech. However,
such mobility does not mean that they are not religious minded. They are not
fundamentalist, but their attitude is conservative and they follow religious practices
seriously. Though only one such slum was surveyed, reports were received of similar
pockets existing in other areas also.
3.2. Medium Income Slums
Three medium income slums – in Gorachand Road (behind Lady Brabourne College),
Kasiabagan (to the south of Dilkhusa Street and west of Bright Street, besides the Muslim
Girls Hostel), and Dhapapara (in Golam Jilani Khan Road, Topsia) – were surveyed.

7
These slums are in sharp contrast to Slum 1. Houses – most of which have been
constructed without sanction from the KMC – are built side by side creating a grim
concrete jungle. Some houses are one-storied, with tiled roofs. They are built around a
common courtyard. There are also pukka houses of 5-6 stories. Though all houses have
electricity connections, there is no running water supply in these areas. Water is not
available in most houses of Kasiabagan and Gorachand Road, but have to be fetched from
KMC taps. In the past few months even this supply has stopped in Gorachand Road. The
only source of water is by KMC trucks that supply water twice a day. The situation is
better in Dhapapara where there is a common tap for each storey, or group of houses. The
residences are one or two roomed, extremely dirty and poorly lit and ventilated. The
family size is large, creating poor living conditions. The residents have migrated from
Bihar and Uttar Pradesh, via Kidderpore-Metia Bruz three-four generations ago. As a
result these people have absorbed the cultures of both West Bengal, and Bihar and Uttar
Pradesh. For instance, these people are bi-lingual, though residents of Slums 2 and 3 are
more conversant in Bengali, and residents of Slum 4 in Urdu.
In Gorachand Road, there are a large number of small units preparing shoes interspersed
within the locality. In addition, there are also some tailoring establishments in the locality.
Residents seek work in these units. Monthly income is Rs. 2931.82 – but, labour demand
is contracting in recent months, creating uncertainties. The residents of Kasiabagan work
in stable jobs in the informal sector. Wages are low, and have to be supplemented by
female members. However, child labour seems negligible. The survey was undertaken on
a Saturday. We observed relatively few children; these children were either playing or

8
returning from schools. Family size is smaller in this slum, compared to that in Slum 2; as
a result per capita income here is higher (Rs.607.95 compared to Rs.436.54 in Slum 2).
The proximity of tanneries and rubber shoe factories to Dhapapara means that the
economic conditions of the residents are closely linked to such units. These factories
provide formal employment to a large proportion of the residents. In addition, the
operation of the factories and tanneries generates demand for subsidiary services, like
petty transportation. This provides a steady though low flow of income (Rs. 2904.12). In
addition, as we shall see later on, there is a demand for female and child labour to cut the
rubber straps of slippers. This has an important effect on education related decisions. The
average family size is largest in this slum (7.12 adults and 3.19 children). Thus their per
capita income is even lower that of slum 5 (Rs.429.78, compared to Rs.434.51 in Slum 5);
their standard of living is, however, slightly better than that of Slum 5.
3.3. Low Income Slum
Slum 5 falls in the low and unstable income category. This is located on the northern bank
of the Canal parallel to the Park Circus Connector. The residents are first generation
migrants from rural areas in West Bengal (mainly the Sundarban area). Male members do
not have a fixed job or occupation. They earn their wages on a daily basis by working as a
daily worker, driver, or carrying loads – or what ever job they can get. Their monthly
income is about Rs.1790.04. Their residences are jhupris: temporary structures made of
bamboo and mud. This was the only slum without access to electricity. Nor do they have
water supply. Possession of assets was negligible. Only a few had cycles; none of them
had the portable black-and-white TV sets commonly found in all other slums. Parents lack
education and are culturally backward. Their dominant concern is to survive; this leads to

9
anti-social activities. The family structure is weak in this area. Adultery and desertion of
wives are common social problems. Alcoholism and drug addiction is also common in
this area, and generates petty crimes and even violence.
4. Demand for Primary Education
A common belief is that most Indian parents belonging to the low-income level are
disinterested in their child’s education. This belief is prevalent even with policy makers
and experts on education. It is manifested in statements like “illiterate and semi-literate
parents see no reason to send their children to school”, or “The vast majority of adult
illiterates belonging to the poor economic stratum are not convinced of it (that literacy is a
basic right of every education)”.4
4.1. Perceived Importance of Primary Education
Although empirical research has refuted this claim, it also reports a gender bias (PROBE,
1999). Most parents expressed a much stronger interest in their sons’ education rather
than their daughters’ (PROBE, 1999: 19-20). Muslim households face the additional
charge of being conservative and alienated from the mainstream. It is also believed that
Muslim parents are at most interested in educating their male children. This study
however found most Muslim parents expressing an interesting in educating their children
– irrespective of gender. Most of the respondents felt that education was important for
both boys and girls (94.12%). Only 4.07% felt that education was unimportant.5
The PROBE Report (PROBE, 1999: 20-21) also reports that the primary motivation for
educating their children is economic: it is anticipated that education will enable the
children to get a better employment opportunities. Contrary to such surveys (Bhatty,

10
1998; PROBE, 1999), better employment prospects do not appear to be the dominant
motivating factor amongst the survey group. Respondents felt that only a very high level
of education will improve job prospects significantly. The low level of education
generally attained by slum dwelling children is not expected to help them to secure jobs,
especially as respondents believe that there is a bias against Muslims in the job market
(both in the private and public sector). In contrast, respondents emphasised the utility of
basic education or literacy in their daily life. The ability to read and write helps them to
read and sign agreements, understand monetary contracts, perform simple calculations in
the market, keep household accounts, write letters, and undertake various similar activities
that are essential in their daily life. Improved marriage prospects is also an important
factor.
INSERT TABLE 2 HERE
There are some inter-slum variations in motivations. Though slum dwellers are not
motivated by the employment factor in educating their children in general, there are two
exceptions to this – the Karaya Road (Slum 1) and Kasiabagan (Slum 3) slums. The belief
that education is necessary in daily life motivates education decisions in all slums. In the
Topsia slum (Slum 4) improved marriage prospects appears an important incentive.
4.2. Education and Marriage Prospects
Literature points out that the effect of education on marriage prospects may be
particularly important with respect to the girl child (PROBE, 1999). Education can affect
marriage both ways. Education may improve the ability of the girl to get a ‘good’
husband; on the other hand, in communities where education is not widespread, it may
increase the costs of marriage as a larger dowry has to be paid, or a suitable groom may
not be easily available.
11
Respondents believed that education would improve their child’s marriage prospects – but
this is treated as a subsidiary benefit of education, and does not appear to one of the
dominant motives behind the decision to educate daughters or in the choice of school or
medium of instruction. Interviews indicated that it is at the secondary stage (Class V and
above) - where most of the dropouts occur – that considerations of marriage become
important. At this stage, lack of income forces parents to consider whether to continue
education or not. In such situations – in contrast to the gender bias reported in other
studies - they prefer to educate girls. This can be attributed to the differences in expected
returns from education. At the primary stage, therefore, there does not appear to be any
difference in the enrolment rates between boys and girls. Nor does there appear to be any
discrimination between sons and daughters with regard to choice of medium of
instruction, type of school, or expenditure on education (Husain, 2003).
Interestingly, respondents argue that education was more important for the girl child.
Given the nature of the job market – characterised by a high level of unemployment and a
perceived bias against Muslims – parents do not feel that education will enable the boy
child to get a good job. Expected returns to educating male children are low. On the other
hand, the expected benefits from educating daughters were high. Unlike in other
communities, it is easier to marry off an educated daughter. The reason is that in Muslim
societies marriages between low educated males and relatively highly educated females is
acceptable;6 furthermore, an educated bride is highly valued as she can educate her
children herself and will be able to keep accounts better. Thus the returns to educating
daughters are higher. It has been pointed out that these returns do not accrue to the
parents, but to the family into which the girl marries; this often acts as a disincentive to

12
educating daughters (PROBE, 1999). However, this approach considers only economic
returns. Muslim parents feel that it is their duty to marry their daughter into a ‘good’
family. Thus, they may not derive any economic benefit from educating their children, but
they get some psychological return from adhering to a social norm and enjoy increased
prestige from having a ‘good’ son-in-law.
In addition, parents felt that education would enable their daughters to be independent
after marriage. This would insure her in the case of desertion by her husband, which is a
not uncommon phenomenon amongst slum dwellers. In many cases, therefore, parents
argued that education was more important for girls.
4.3. Enrolment Rates
However, it is not enough to recognise the importance of education in daily life – is this
appreciation manifested in actual behaviour? The enrolment rate for the families surveyed
is 73.15.7 This is quite high.
However there is some variation in this ratio between slums (Figure 2). Slum 1 has the
highest enrolment ration; in fact only one case of a drop out was found. The enrolment
ratio is lowest for the jhupri area (Slum 5) – 61.97. Even this ratio is misleading as most
of the school going children is enrolled in NGO-run schools, and not in formal
educational institutions. Respondents also reported that the survival rate was low – very
few of the children graduated from the non-formal system to the formal educational
system In fact, only 9 out of the 39 school going children (23.08%) presently have access
to formal education facilities.
INSERT FIGURE 1 HERE

13
4.4. Demand for Education in Low and Fluctuating Income Slums
The disappointing spread of education in the low-income slum area (Slum 5) is not
surprising as educational demand and income is positively correlated. But there is some
difference in opinion regarding the mechanism through which income operates. Research
shows that explanations offered by parents may differ sharply from that offered by
teachers. A study of a low-income slum in Gandhinagar, New Delhi (Banerjee, 1997) is
relevant in this context.
Teachers typically tend to offer the following explanations for the low enrolment and high
dropouts:8
1. Members of such slums are generally first generation migrants. They retain strong
social, economic and kinship ties with their village of origin. This leads them to return
to their villages for long periods for festivals and family functions, and during times of
distress.
2. Mothers have to work for long hours. This leads to her absence from home for the
greater part of the day. In the absence of an extended family there is no one to care for
and support children. In the absence of monitoring of performance children play truant
from school or do not study.
3. Parents are forced by economic distress to move frequently from one slum to another.
This disrupts the educational career of their children.
4. Children have to work either in the labour market to supplement family income or at
home to complement or substitute for mother’s labour (in cooking, supervision of
siblings, fetching water, etc).9

14
The relevance of these explanations has also been examined in this study.
[1] Respondents had retained ties with their village of origin. This led them to move back
to their villages for long spells. This had a disruptive effect on the schooling of their
children in some cases. However, parents also tried to adjust these periods of
absenteeism with school holidays. In some cases respondents reported that the child
had been removed from urban schools and re-admitted to rural schools. This is an
optimal strategy on several counts.
(a) Literature on social security networks shows that relatively better off families may
take care of surplus children in poorer families (Scott, 1976). Respondents send their
children to villages to be taken care of by their relatives who earn a more stable
income.
(b) The main source of education in low-fluctuating income slums is NGOs. They
provide non-formal education for two years and try to get their students admitted to
Government-sponsored or KMC schools. However, the rate of admission to the formal
education system is quite low – especially in relation to their output. The students who
fail to get admitted to the formal education system are retained within the formal
education system by the organisations. Parents, however, may choose to send them to
rural areas where it may be easier to avail of formal educational facilities.
(c) Costs of formal education are lower in rural areas.
Several cases of such ‘dropouts’ where a parent was unable to continue the education
of their children and withdraws them from the urban schooling system – only to re-
admit them in rural schools – were reported by the jhupri-dwellers. Interestingly, such
children were classified as dropouts by parents.
[2] Women in such slums tend to leave early for work; however, they also return home
early – generally within 1 or 2 P.M. This allows them to supervise study at home

15
(Banerjee, 1997). In support of this proposition, it found that in 60.22 % of the
surveyed families the mother was the sole supervisor of the education of the
children.10 While Banerjee’s point is not invalid that some qualifications are perhaps
necessary.
(a) All the houses are one-roomed jhupris. As a result the activities of the parents may
prevent serious study. Alcoholism, drug-addiction and related disturbances may pose
constraints. Even harmless activities like listening to the radio may affect
concentration as it takes place within the same room.
(b) Children are imparted religious instructions in the late evening. This implies that
the only period in which the child can be monitored is not utilised on preparing for the
formal or non-formal education system.
(c) Many children have to supplement family income at home. This reduces time for
studies.
(d) Girls have to take additional household responsibilities during the pregnancy of
their mothers, leading to their dropouts. This is a serious problem in slums where
fecundity is high, so that conceptions are frequent and there are siblings too young to
be left alone.
(e) During the survey, even in the evening, about 25% of the houses were found to be
locked up, as both parents were absent. In these families even the mother works for
long hours.11 A study of the educational performance of children of such households is
interesting and likely to reveal a trend different from what was observed for the rest of
the slum. However, practical problems prevented us from interviewing these parents in
the late evening.
[3] Movement from one slum to another is constrained by the availability of contacts and
space in slums. As a result there does not appear to be changes in the population of

16
slums except for in-migration from rural areas. This explanation is thus not valid in
the slum studied.
[4] The extent to which child labour is a constraint is examined later on in details.
It was found that NGOs were running three schools in the area. These programmes relied
on providing highly subsidised non-formal education and incentives like free medical
check ups, medicine (in case of illness) and nutritious food to attract children.12 However,
these schools did not provide any alternative source of income to compensate for any loss
in income from child labour. The success of these schools, in spite of this, challenges the
proposition that the practice of child labour constrains the spread of education amongst
low-income slums.
4.5. Identity of Decision Maker
The nature of education-related decisions, specially the reported absence of gender bias,
depends on the identity of the decision maker. Research on decision-making in Muslim
families indicate that, despite the dominance of Muslim males, the domestic domain
belongs to the female, and the tasks she performs there are by right exclusive to her (Utas,
1983). Within this limited sphere she is accorded respect and enjoys considerable power,
stemming from the valuation placed on the role of mother and wife in Muslim
communities. In controlling this domain, the Muslim woman also controls its inhabitants
- including men. This control is manifested in her relation with her children and her
husband. This survey found that in 60% of the families, the mother took decisions, while
in 8% families both parents played a role. This occurred despite the fact that the mothers
was at most barely literate or had completed primary education.13

17
The reason lies in the basic rhythm of the life of Muslims. The mother is the organic
centre of household activities. She is the parent who is mostly present at home and able to
observe the children. Interestingly, it was observed that the enrolment rates of children are
slightly higher in families where the mother has the dominant role (0.88 compared to
0.80). This difference, however, is not statistically different.14
5. Expenditure on Education
The family income allocated on education by the slum dwellers is quite high – Rs. 412.69
per month. This constitutes 12% of income. Further, both the absolute level of
expenditure on education and its proportion to income tends to vary with income – it is
highest for Slum 1 and lowest for Slum 5.
5.1. Composition of Expenditure on Education
It can be seen that the main item of expenditure is tution fees. This indicates that slum
dwellers are either not accessing or being able to access subsidised education.
Expenditure on private coaching of children is also high – indicating the interest of
children in educating their children. Purchase of books and stationary also forms an
important component of the education budget.
INSERT TABLE 3 HERE
The survey results has been contrasted with all-India / West Bengal figures. Tution fees,
expenditure on books and stationary, and uniform costs are higher in the survey; this may
be caused by inflation. Expenditure on private tution is lower than figures for West
Bengal, though higher than all-India levels.
18
The most important difference that emerges from this comparison is the low transport
costs. The reason is that parents in all slums choose schools on the basis of their proximity
to their homes, so that children generally walk to their schools. Students of Class 3 to 5
can walk to school alone, or in groups – taking their younger siblings with them.
However, younger children (particularly those studying in Class 2 or below, and those
with siblings studying in other schools) have to be taken to or brought back from their
schools by their parents. This creates a time cost in the form of a sacrifice of leisure or
work hours. It has been seen that while children may be taken to school by both parents, it
is generally the mother who brings them back. The time spent on this activity has also
been estimated. Averaged over the 33 households who incur this cost, the time spent on
taking the child to school and bringing him/her back turns out to be 45 minutes per day.15
This cost has led to an interesting practice. Some relatively well-off families hire a person
(generally a female of the locality) to fetch their children. Such persons may earn as much
as Rs.200 per month for this job.
5.2. Slum-wise Variations in Expenditure
Differences in demographic and economic characteristics of the slums may generate
differences in the expenditure pattern. It can be seen that income levels and expenditure
on education are positively correlated.
INSERT TABLE 4 HERE
Expenditure on education is highest for the high-income slum (Slum 1). This is because
parents focus on the quality of education being provided by schools in this slum. The
Veblen effect operates – leading to a preference towards private English-medium schools.
This leads to high levels of expenditure on school fees, as well as on associated items like
uniform, and books and stationary. During surveys in other slums, guides reported similar

19
pockets. For instance, in the Topsia area, a small enclave of relatively high-income slum
dwellers with the same cultural characteristics of Slum 1, educate their children in the
nearby Goh Cheong Ling School.
In medium-income slums, parents are interested in minimising costs. This leads them to
prefer Government-aided schools. There does not appear to be any bias towards Urdu-
medium education; mainly Bengali medium schools are chosen. Consequently,
expenditure on school fees, uniform and books and stationary is low in these slums. Slum
3 is an exception. High- and middle- class households surround this slum; several middle-
income households live within the slums. This has possibly created a demonstration
effect, leading to a demand pattern inconsistent wit their income levels.
The economic features and hence pattern of demand for education is totally different in
the jhupris of Slum 5. Here, parents are unable to afford the expenses of formal education
system; they are forced to seek subsidised sources of education – in the NGO run schools
in the vicinity. Consequently, the proportion of income spent on education is very low.
6. Opportunity Costs of Education
Another important component of costs of education is the opportunity cost of education.
This consists of earnings from sending the child to work and using the child to perform
household work.
6.1. Literature on Child Labour
The ILO data from 1998 estimates that there are 0.25 billion child workers aged between
5-14 years, of whom half are full time workers. South Asia contains the largest number of
20
such children (54 million). This is commonly explained in terms of poverty and the
limited options open to children belonging to families at the edge of survival. A study of
child workers in the match and fireworks industries in South India noted that in the
absence of child labour, more than 50% of the households surveyed would loose a
substantial portion of their income.16 Researchers have pointed out the crucial importance
of children’s income in tiding over seasonal crises in families not engaged in secure or
regular jobs.17 It is also argued that children are sent to work at an early age to develop
skills,18 or cultivate networks with future employers. In areas where there is a high
incidence of adult unemployment, child labor may be a substitute for adult labor.19 On the
other hand child labor may be used in family enterprises releasing adult labor to seek
work in the labor market. Weiner (1991) argues that a large proportion of such children
join the work force at an early age, thereby, loosing any chance of receiving education.20
On the other hand there is an alternative school of thought that downplays the
contribution of children to household income (Swaminathan, 1998). Economic activities
of children are viewed as ‘default activities’ ( Bhatty, 1998) arising from inadequacy or
non-availability of schools, leaving children little options but to help at home or work.
This enables NGOs to send children to schools without providing any substitute economic
incentive (Sinha, 2000). This is supported by NSS data (NSS, 1997). Analysing the
reasons for non-attendance and dropouts NSS found that 21-30% of the children was not
interested in education, and 15-20% could not afford to bear the costs. Only 6-10% of the
children were working or engaged in household chores (3-4% girls and 1-2% boys) (NSS,
1997: 19).

21
Some writers have also challenged the view that the household faces a polarised choice
between sending the child to school or to work. In some cases, there may be an
intersection between the two activities. Children may work in order to free resources for
investment in their education.21 The combination of schooling and working may also be
viewed as a strategic choice to balance the benefits of a minimum education with the
benefits of learning skills or cultivating contacts in the job market.
6.2. Incidence of Dropouts and Opportunity Cost
In this survey dropouts and non-enrolment were estimated together. Out of 249 children,
69 are not currently enrolled; of these 41 are boys and 28 girls. Most of these are in slum
4. The slum wise variations in dropouts are given below.
INSERT TABLE 5 HERE
No distinction was made between ‘never enrolled children’ and ‘dropouts’ in this study.
However, most of these children had been enrolled at some point of time. Most of the
dropouts are due to the inability of parents in raising the necessary funds to educate their
children. There are three NGOs working in slum 5 providing free education to slum
children. But parents do not seem to be aware of this: they are ignorant of the admission
criterion and procedure. Poor results and disinterest of the student in studies was another
reason. Only 7 children left school because they had found work.
INSERT FIGURE 2 HERE
The child withdrawn from school is not immediately sent to the labour market. In most
cases of disinterested children, the child was withdrawn within a few months of
schooling. In other cases, the difficulty of finding work kept the child at home. In most
cases, therefore, there appears to be a time lag of as much as 2-3 years before the child

22
gets work. In some households it was found that the child was being trained without any
daily wages. This evidence supports the assertion that child labour is often a ‘default
activity’, and not due to high opportunity cost.
Children were employed in the factories or in motor repairing shops. In several cases,
particularly in the Dhapapara area, the child may be employed in cutting rubber straps at
home. This work fetches a wage of 50 paisa per two dozen for the plastic straps, and
seventy-eighty paisa per two dozen for the better quality straps. In Gorachand Road, on
the other hand, boys work in the household shoe units, and girls remain at home doing
needlework on jari sarees. Such income fetched Rs. 890.48 per month, about 43.04 % of
monthly income.
INSERT TABLE 6 HERE
The income earned by child workers – in absolute terms and as percentage of income – is
higher in the medium income slums with have greater access to more organised informal
units. However, the incidence of dropouts is lower in these slums. The reason is that work
like cutting rubber straps can be undertaken at home after school hours. This enables
children to combine schooling with income earning activities. This enables the family to
raise the necessary finances to educate their children. In three households (in Slum 4) it
was found that while economic circumstances forced the child to join factories where
working hours are rigid, the children tried to obtain education through private lessons
from neighbours.
6.3. Household Duties of Children
Another possible reason for the high opportunity cost of education is that children may
have to perform household duties. Among such chores are supervising siblings (especially
23
during child bearing by their mother), helping in cooking, washing clothes and utensils,
marketing, etc. In the absence of extended families, it may be not be possible for the
mother to perform all these tasks herself – especially if she has to work. In such cases
children have to supplement the labour provided by their mother in these tasks. This may
prevent them from joining school or attending school on a regular basis.
Field studies have questioned these propositions. Firstly, at the primary stage, children are
often too young to assume responsibilities of others – at most they assist adult members in
various chores. Secondly, household chores do not always conflict with school hours but
can be performed after school is over. As a result, children do help adult members in
household tasks, but do not spend much time in such activities.22 Bhatty (1998) cites a
study estimating that 20% of the boys and 26% of the girls did not go to school or do any
work; 60% of the boys and 43% of the girls did not perform any household chores.23
However, there appears to be a gender bias in this regard. As part of her training to
become the caregiver, girls frequently have to undertake more chores and work for longer
hours.24
This study did not find any major conflict between schooling and household chores. In
one case in Dhapapara slum, the chronic sickness of the mother led to the withdrawal of a
girl to assume household responsibilities. In several cases adolescent girls were found to
have been withdrawn from school to help her mother in household tasks. In these cases,
the parents were planning her marriage and this move can be interpreted as training her
for her new role in her matrimonial home. It also enabled the family to divert the funds
released from her schooling to other children.

24
During surveys, most of the children were observed to be engaged in leisure activities -
playing or reading or gossiping. Boys performed light tasks like buying groceries that
took them outside their homes; girls assumed more responsibilities, all of which was
centred round their house. They helped in cooking, washing clothes, and looking after
babies. However, such tasks were generally not routinely performed, but were undertaken
on holidays or after school hours and did not consume much time.
7. An Econometric Analysis
Finally, an econometric analysis of the demand for education has been attempted. The
total expenditure on education (ECOST), expenditure per child (PCEC) and the enrolment
ratio (ERATIO) has been successively regressed on the following independent variables
using the ordinary least square (OLS) method:
[a] Slums: We have seen that education related decisions vary across slums, though the
difference between slums 2, 3 and 4 are not marked. In the regression models dummy
variables have been used for Slums 1, 2, 4 and 5 – enabling us to test whether
behaviour in each of these slums is significantly different from that in Slum 3.
[b] Income: We would expect demand for education to increase with income. We have
used either family income (INCOME), or per capita (PCY).
[c] Opportunity Cost: The opportunity cost (OCOST) of education also affects demand
for education. The higher the opportunity cost of labour, the lower will be demand for
education.
[d] Number of school going children: The greater the number of school going children
(SGC) the higher would be the budget on education. On the other hand, the per capita
expenditure on education can be expected to fall with a higher number of school going
children. This variable is dropped in the equation for ERATIO.

25
[e] Gender bias: Empirical studies have stressed on the presence of a gender bias in
education-related decisions. Girls are generally not enrolled; expenditure on girls are
lower than for boys. So it would expect that demand for education would fall, the
higher is the ratio of girls to total children (SRATIO). The effect of this variable can
be expected to be significant for per capita education cost (PEC) and the enrolment
ratio (ERATIO).
7.1: Results of OLS Regression
The results of the three regressions are given below. The figures in parentheses are t-
ratios.
ECOST = 255.92 + 293.57 SLUM1 – 23.72 SLUM2 – 13.44 SLUM4 – 313.83 SLUM5 (3.022) (3.395) (-0.767) (-0.160) (-3.377)
+ 0.15 PCY – 0.160 OCOST – 51.32 SRATIO + 42.94 SGC (2.395) (-2.779) (-0.824) (1.991)
R2 = 0.530 adj. R2 = 0.490 F = 13.13 n=102 d.f. =93
PCEC = 150.98 + 178.04 SLUM1 – 97.25 SLUM2 – 71.00SLUM4 – 155.45 SLUM5 (2.193) (3.051) (-1.641) (-1.270) (-2.606)
+ 0.076 INCOME – 0.11 OCOST – 31.05 SRATIO – 44.93 SGC (4.545) (-2.938) (-0.746) (-3.091)
R2 = 0.63 adj. R2 = 0.60 F = 19.78 n=102 d.f. = 93
ERATIO = 0.93 + 0.02 SLUM1 – 0.07 SLUM2 – 0.03 SLUM4 – 0.23 SLUM5 (9.48) (0.253) (-0.844) (-0.359) (-2.665)
- 0.000006 INCOME – 0.00004 OCOST + 0.09 SRATIO (-0.269) (7.558) (1.513)
R2 = 0.48 adj. R2 = 0.44 F = 12.49 n=102 d.f. = 93

26
These results indicate that there are significant differences between Slums 1, 3 and 5.
Slums 2,3 and 4 are, however, similar, and the coefficients of SLUM2 and SLUM4 are
not significantly different from 0. Note that the t-ratio of SLUM1 is statistically
insignificant for ERATIO. This means that families try to enrol their children irrespective
of their background. In this context, it should also be noted that it is only for ERATIO that
Income is statistically insignificant – in all other cases, it is positively related to education
demand. Similarly, opportunity cost exercises a significant influence on education
demand. As expected, the sign is negative. However, this has to be interpreted cautiously
in view of our interpretation of child labour as a default activity. The regression model
does not identify the direction of causality between OCOST and education decisions –
only the presence of a statistically significant relationship between them. The ratio of girls
to total children, however, is not significant in any of the three cases. This can be
interpreted as an absence of any gender bias in education-related decisions. The
coefficient of the number of school going children (SGC) also has the anticipated sign.
7.2: Fixed Effect versus Random Effect Model
The discussion on education decisions indicates that there are significant inter-slum
differences. In the previous sub-section, these differences are conceptualised as follows:
yij = αi + βijX + εij
when i denotes the slums and j the observations for each slum. The regressors in X are
OCOST, Income (PCY), SGC and ERATIO, while the intercept is not included in the
matrix X. The individual affect is αi, which is assumed to be constant across individual
observations and specific to each slum. Recent research on panel data shows that this
model can be generalised using two basic frameworks. The fixed effects approach
assumes αI to be a group-specific constant term in the regression model. This model is

27
appropriate if the differences between slums can be viewed as parametric shifts of the
regression function. The random effects approach, on the other hand, assumes that αi is a
group specific disturbance term, similar to εij, except that for each group, there is only one
draw that enters the regression identically for each slum. The above model would then
have to be reformulated as:
yij = αi + βijX + u i + εij
The component ui characterises the slum i and is constant for all households j in the slum.
To test which model is applied we have to first consider the validity of the constant term
model using the Langrange Multiplier test; if this model is rejected, then the Hausman
Test is used to test the appropriateness of the fixed effects and random effects models.
The results of these tests have been reported in the Appendix. We briefly sum up the
implications of the results obtained in this section.
INSERT TABE 7 HERE
For all three dependent variables – ECOST, PCEC and ERATIO – the Langrange
Multiplier test statistic is very high indicating that the slum effects are statistically
significant. Hence the constant term classical regression model is inappropriate. The
Hausman test statistic indicates that the random effects model is appropriate. This implies
that the hypothesis that slum effects are uncorrelated with the other regressors in the
model cannot be rejected.
The economic interpretation of these tests is that there are significant inter-slum variations
in education related behaviour. However, these differences are random in nature and not
related to the independent variables like opportunity costs of education, income, etc. This

28
implies the possibility that socio-cultural differences across slums may have been
important forces creating differences in education related behaviour and underlines the
need to expand the survey to other slums and identify the precise socio-cultural factors
that are relevant in explaining the behaviour of households in each slum.
8. Conclusions
The starting point of this paper was the proposition - commonly put forward by
researchers and supported by case studies - that literacy level of Muslims, particularly in
low-income households, are low. This phenomenon is explained in terms of the values
prevalent within the Muslim community. As a result dropouts and non-enrolment is high
in Muslim households, there is an in-built resistance to educating daughters and the
Madarsah is the common vehicle of education. This survey, despite its tentative nature,
questions the validity of these propositions.
The view that Muslims reject the value of education is not supported in the survey
findings – respondents argued that education was important for both boys and girls. Thus,
the value theory cannot be accepted as an explanation of the low levels of education. The
motivations underlying choice of education provide an indication of the valid explanation.
Studies of factors motivating education demand in rural and urban India emphasise on the
economic returns from education. In this study, economic motivations do not appear to be
significant, implying that the perceived returns from education are different between
Muslims and non-Muslims. This can be expected to create a different pattern of education
demand within the Muslim community.

29
This study indicates that parents believe that ‘education’ is important as it helps an
individual in his daily life. It is needed by male members to undertake various
transactions and enter into different contracts. Knowledge of writing, reading and simple
arithmetic skills is necessary to undertake such activities without depending on others.
This creates a demand for literacy that can be satisfied by primary education. Education,
however, is a broader process and includes higher levels of learning. It is necessary for the
efficient performance of activities that are normally not undertaken by slum dwellers.
Since Muslims perceive a bias against themselves in the labour market, boys become
disinterested in further education. Their greater mobility is important in this context. The
absence of restrictions on their movement means that they have more alternatives to
remaining at school – watching movies, playing football, roaming about in the city. They
also seek work in the informal job market. Note again that they are not leaving school
because they have found work – rather, they seek work because they have left their
school. In such cases, the replacement of formal education at the secondary level by
vocational training courses may be a relevant option before policy makers. Such courses
will prepare the Muslim boys to be self-employed and may counter-act the economic
disincentives to seeking education.
In the case of girls, there is a different process at work. The role played by the mother in
supervising education of children has been emphasised in this study. A more educated
woman is more likely to perform this task efficiently. Simultaneously, in case of
desertion, education helps the mother to support her family. This leads parents to educate
girls. After adolescence is reached, restrictions are imposed on movements of the girl.
Ironically, this restriction may exercise a positive effect on her education. Unlike her
more mobile brother, the girl is restricted to her immediate neighbourhood and to her

30
nearby school. This increases her focus and may lead to higher levels of attainment for
girls.25 At the same time, there is a conflict between providing education and preparing
the girl for her future domestic role. However, this conflict manifests itself not at the
primary stage – but in the secondary stage. Eventually, it leads to the withdrawal of the
girl from schooling. In most cases, she is married off at the age of 16 years;26 in others,
she assumes greater responsibility at home to prepare for her future role. It is difficult to
suggest any suitable policy intervention to address this problem. Obviously, any
intervention must be at the social level – directed towards increasing the age of marriage
through legislation27 and through social movements, and in drawing Muslim women away
from the household domain into the external world.
Discussions with respondents and guides revealed there is another factor at work,
operating for both sexes that reduces the survival rate at the secondary level. Given the
low income of slum dwellers, the funds allotted to education are scarce. Although, this
budget increases with the number of school going children, the per capita expenditure
falls (see first two regression results).28 This implies that children compete between
themselves for scarce funds. Given the pessimistic attitude towards the relationship
between education and employment, it is only natural for Muslim parents to divert these
funds from a child who has already achieved the minimum education considered
necessary and reallocate it towards a younger child who has just started schooling.

31
REFERENCES
Ansari, IA (1988): ‘Muslim Educational Backwardness: New Educational Policy and
Programme’. In: I A Ansari ed., The Muslim Situation in India, Sterling Publishers, New
Delhi.
Banerji, R (1997): ‘Don’t Blame It On Poverty Alone’, Econ. & Political Weekly, XXXII
(32), 9 August; pp. 2053-2060.
Bhatty, K (1998): ‘Educational Deprivation in India: A Survey of Field Investigations’.
Econ. & Political Weekly. XXXIII (27, 28); 4 and 10 July: pp. 1731-1740, 1858-1869.
Boudon, R (1978): Education, Opportunity and Social Inequality. John Wiley & Sons,
London.
Breusch, TS and AR Pagan (1979): ‘A Simple Test for Heteroscadasticity and Random
Coefficient Variation’. Econometrica, 47, 1287-1294.
Chatterjee, N, N Bhattacharya and A Halder (1997): Socio-Economic Profile of
Households in Calcutta Metropolitan Area: 1996-97. Calcutta Metropolitan Development
Authority, Calcutta.
Harnqvist, K (1978): Individual demand for education. OECD, Paris.
Hyman, H H (1953): ‘The Value Systems of Different Classes’. In: R Bendix & S M
Lipsett ed., Class, Status and Power. The Free Press & Macmillan, New York: pp. 488-
499.
Jackson, B & D Marden (1962): Education and the Working Class: Some general themes
raised by a study of 88 working class children in a northern industrial city. Routledge &
Kegan Paul, London.
Jehangir, K N (1991): Muslim Women in Bengal: Socio-Economic and Political Status.
Minerva Publishers, Calcutta.

32
Karlekar, M (2000): Girl’s Access to Schooling: An Assessment. In R. Wazir ed. The
Gender Gap in Basic Education: NGOs as Change Agents. Sage, New Delhi: pp. 80-114.
National Sample Survey Organisation (1997): Economic Activities and School Attendance
at India. NSS 50th Round: July, 1995-June 1996; Report No. 412.
National Sample Survey Organisation (1998): Attending an Educational Institution: Its
Nature and Cost. NSS 52nd Round: July, 1995-June 1996; Report No. 439.
National Sample Survey Organisation (2001): Literacy and Levels of Education in India.
NSS 55th Round: July, 1999-June, 2000; Report No 473.
PROBE TEAM, with Centre for Development Economics (1999): Public Report on Basic
Education in India. Oxford University Press, New Delhi.
Ruhela, S.P. (1998): ‘Religion, Social Class and Educational Opportunity: Case Studies of
Eight Muslim Girls’. In: S.P. Ruhela ed., Empowerment of the Indian Muslim Women.
MD Publications, New Delhi; pp. 1-21.
Salamatullah (1994): Education of Muslims in Secular India. Centre for Research in Rural
and Industrial Development, Chandigarh.
Scott, J. (1976): The Moral Economy of the Peasant: Revellion and Subsistence in South-
east Asia. Yale University Press, New Haven, Conn.
Sengupta, S. & H. Gazder (1997): ‘Agrarian Politics and Rural Development in West
Bengal’, in Jean Dreze & A.K. Sen ed. India Development, Oxford University Press, New
Delhi.
Sinha, S. (2000): ‘Child labour and education’. In R. Wazir ed. The Gender Gap in Basic
Education: NGOs as Change Agents. Sage, New Delhi: pp. 150-174.
Subrahmanian, R. (2002): ‘Children’s Work and Schooling: A Review of the Debate’. In
V. Desai & R.B. Potter ed. The Companion to Development Studies. Arnold, London; pp.
400-405.

33
Sudarshan, R.M. (2000): ‘Educational Status of Girls and Women: The Emerging
Scenario’. In: Wazir, R. ed. The Gender Gap in Basic Education: NGOs as Change
Agents. Sage, New Delhi; pp. 38-79.
Swaminathan, M. (1998): ‘Economic growth and the persistence of child labor: evidence
from an Indian city’. World Development, 26 (8): pp. 1513-28.
Utas, B. (1983): Women in Islamic Studies: Social Attitudes & Historical Perspectives.
Curzon Press, London.
Weiner, M. (1991): The Child and the State in India: Child labor and Education Policy in
Comparative Perspective. Princeton University Press, Princeton.

ANNEXModel 1: ECOST as Dependent Variable +--------------------------------------------------+
| Estimates: Var[e] = .599120D+05 | | Var[u] = .152320D+06 | | Corr[v(i,t),v(i,s)] = .717705 |
| Reestimated using GLS coefficients: | | Estimates: Var[e] = .599135D+05 | | Var[u] = .181702D+06 | | Sum of Squares .961601D+07 | | R-squared .189593D+00 | +--------------------------------------------------++---------+--------------+----------------+--------+---------+----------+|Variable | Coefficient | Standard Error |b/St.Er.|P[|Z|>z] | Mean of X|+---------+--------------+----------------+--------+---------+----------+ PCY .1567260678 .64258383E-01 2.439 .0147 528.75637 OCOST -.1563243774 .55892388E-01 -2.797 .0052 183.33333 SGC 42.73898918 21.548302 1.983 .0473 1.8431373 SRATIO -50.95435639 62.219539 -.819 .4128 .43000000 Constant 243.1422531 187.39823 1.297 .1945
Model 2: PCEC as Dependent Variable +--------------------------------------------------+
| Estimates: Var[e] = .266113D+05 | | Var[u] = .298121D+05 | | Corr[v(i,t),v(i,s)] = .528364 |
| Reestimated using GLS coefficients: | | Estimates: Var[e] = .266230D+05 | | Var[u] = .623937D+05 | | Sum of Squares .379897D+07 | | R-squared .431702D+00 | +--------------------------------------------------++---------+--------------+----------------+--------+---------+----------+|Variable | Coefficient | Standard Error |b/St.Er.|P[|Z|>z] | Mean of X|+---------+--------------+----------------+--------+---------+----------+ INCOME .7957861273E-01 .16645178E-01 4.781 .0000 2865.9412 OCOST -.1105170259 .36962792E-01 -2.990 .0028 183.33333 SGC -46.28656952 14.494894 -3.193 .0014 1.8431373 SRATIO -29.64022729 41.544414 -.713 .4756 .43000000 Constant 114.5030350 96.169379 1.191 .2338
Model 3: ERATIO as Dependent Variable +--------------------------------------------------+
| Estimates: Var[e] = .539700D-01 | | Var[u] = .786502D-02 | | Corr[v(i,t),v(i,s)] = .127194 |
| Reestimated using GLS coefficients: | | Estimates: Var[e] = .540122D-01 | | Var[u] = .395001D-01 | | Sum of Squares .600700D+01 | | R-squared .403176D+00 | +--------------------------------------------------++---------+--------------+----------------+--------+---------+----------+|Variable | Coefficient | Standard Error |b/St.Er.|P[|Z|>z] | Mean of X|+---------+--------------+----------------+--------+---------+----------+ PCY -.8417221825E-04 .59431645E-04 -1.416 .1567 528.75637 OCOST -.4072967673E-03 .51314607E-04 -7.937 .0000 183.33333 SRATIO .8349352793E-01 .58282917E-01 1.433 .1520 .43000000 Constant .9041377646 .63301210E-01 14.283 .0000

TABLES AND FIGURES TO BE INSERTED INTO TEXT
Table 1: Demographic and Economic Features of Slums
Label Type Locality Sample
Size
Monthly
Income (Rs)
Family
Size
Children
1 High Income Karaya Road 20 3851.75 5.45 1.65
2 Gorachand Road 17 2931.82 7.12 2.71
3 Kasiabagan 15 3132.13 5.73 1.60
4
Medium / Low
and Stable
IncomeDhapapara 26 2904.12 10.31 3.19
5 Low, fluctuatingIncome
Topsia 24 1790.04 5.88 2.96
- All Slums 102 2936.33 7.11 2.52
Table 2: Distribution of Households by Motivations to Educate Children and Slums
Individual SlumsMotives for Educating Children All Slums
1 2 3 4 5
Better employment 35 17 4 9 5 0
Needed in daily life 65 13 13 8 19 12
Better marriage 21 5 3 1 10 2
Earn respect 14 2 4 5 3 0
Learn English 1 1 0 0 0 0
Others 5 0 0 2 1 2*
* Sending children to school enables them to get free food, medical check ups, and medicine.
Table 3: Composition of Monthly Expenditure on Education
NSS (1998) Survey FindingsMonthly School FeesIndia
(Rupees)West Bengal
(Rupees)Absolute(Rupees)
Relative(Percent)
Tuition Fees 76.25 70.92 84.05 35.17
Books & Stationery 20.58 41.42 45.40 19.00
Private tuition 48.42 115.58 66.45 27.81
Uniform Costs 25.75 21.50 33.18 13.88
1
Misc. Expenses 7.83 7.42 - -
Daily transport costs 68.42 53.92 9.89 4.14
Total Money Costs 247.25 310.75 238.98 100.00
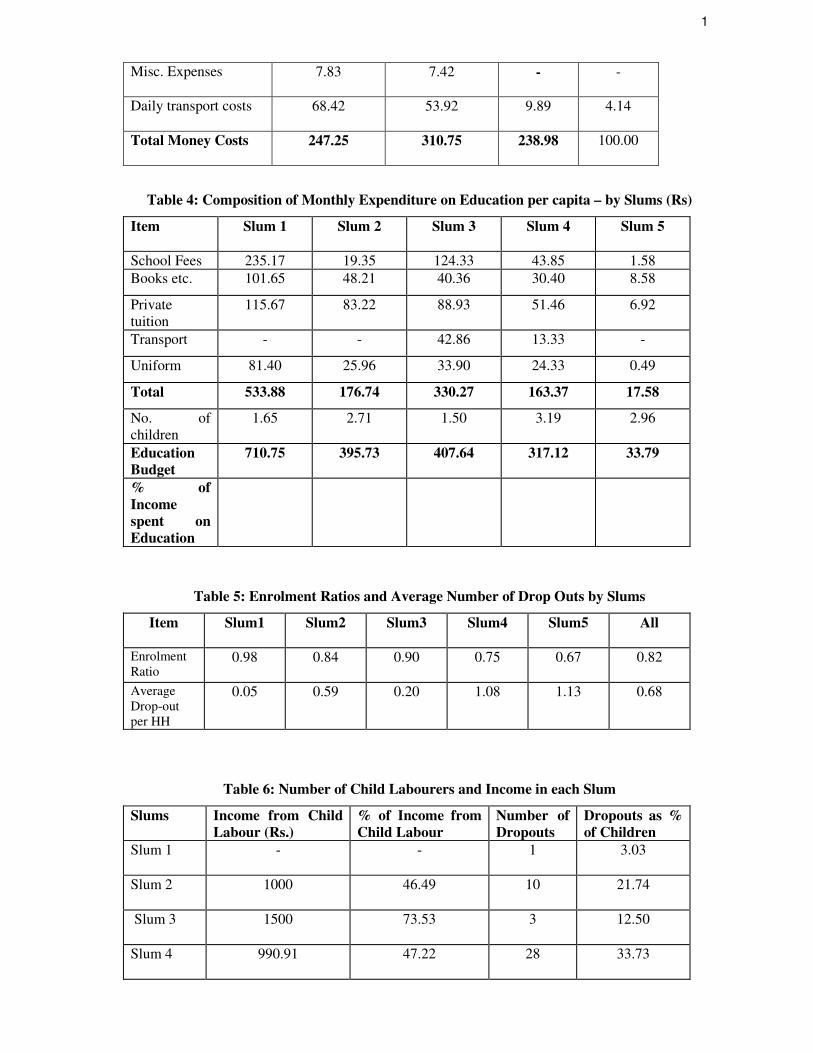
Table 4: Composition of Monthly Expenditure on Education per capita – by Slums (Rs)
Item Slum 1 Slum 2 Slum 3 Slum 4 Slum 5
School Fees 235.17 19.35 124.33 43.85 1.58Books etc. 101.65 48.21 40.36 30.40 8.58
Privatetuition
115.67 83.22 88.93 51.46 6.92
Transport - - 42.86 13.33 -
Uniform 81.40 25.96 33.90 24.33 0.49
Total 533.88 176.74 330.27 163.37 17.58
No. ofchildren
1.65 2.71 1.50 3.19 2.96
EducationBudget
710.75 395.73 407.64 317.12 33.79
% ofIncomespent onEducation
Table 5: Enrolment Ratios and Average Number of Drop Outs by Slums
Item Slum1 Slum2 Slum3 Slum4 Slum5 All
EnrolmentRatio
0.98 0.84 0.90 0.75 0.67 0.82
AverageDrop-outper HH
0.05 0.59 0.20 1.08 1.13 0.68
Table 6: Number of Child Labourers and Income in each Slum
Slums Income from ChildLabour (Rs.)
% of Income fromChild Labour
Number ofDropouts
Dropouts as %of Children
Slum 1 - - 1 3.03
Slum 2 1000 46.49 10 21.74
Slum 3 1500 73.53 3 12.50
Slum 4 990.91 47.22 28 33.73

2
Slum 5 614.29 31.15 27 38.03
All 890.48 44.05 69 26.85
Table 7: Values of Test Statistics for Langrange Multiplier and Hausman
Model LM Statistic Probability Hausman Statistic Probability
ECOST 130.70 0.000000 1.19 0.879891
PCEC 19.88 0.000008 2.08 0.720347
ERATIO 12.18 .000483 3.16 0.366993
Figure 1: Enrolment Ratios in Different Slums
Figure 2: Reasons for Non-Enrolment or Dropout - Percentage
10%
29%
61%
Employment
Poor Results orDisinterestFinancial Problemsof Family
0.0020.0040.0060.0080.00
100.00120.00
Slu
m1
Slu
m2
Slu
m3
Slu
m4
Slu
m5
Slums
Enr
olm
ent R
atio
(in
%)
Enrolment Ratio

3
END NOTES
1 Keller, S. & M. Zavalloni (1962) “ Classe sociale, ambition et réussite”. Sociolgie du
Travail, 4; pp. 1-14.
Ibid (1964) “Ambition and Social Class: A respecefication”. Social Forces, 43 ; pp. 38-70.
Cited: Boudon (1978).
2 One respondent worked for the Calcutta Tramways; several other inhabitants were
engaged in private offices or in schools.
3 Unfortunately, children of our respondents do not perform as well in the educational
arena as British working class children. This is because of high costs of education,
absence of infrastructural support and pessimism regarding possible job openings.
4 The Times of India, 15 August, 1997 and Indian Express, 15 August, 1997, respectively.
Cited in PROBE TEAM (1999), page 14.
5 Only 5.88% felt that daughters should not be educated.
6 So long as lack of education of the groom is compensated by other characteristics like
high income, secure job, etc.
7 The enrolment rate is defined as: 100*familyin children ofnumber Total
children going school ofNumber
8 While these explanations are from Banerjee (1997) teachers in the survey areas
expressed the same opinion.
9 Before the NGO schools started opertaion in the Topsia area, most of the children use to
work as child labourers in the nearby leather and shoe factories. They worked for as long
as 10-12 hours every day packing and carrying materials, etc. for daily wages of Rs.20-25.
Secondly, most of the mothers also worked – either to supplement family income, or, in
4
the case of desertion by her husband, as the main bread earner. In such cases, girls had to
perform many household tasks, like cooking, washing, looking after siblings, etc.
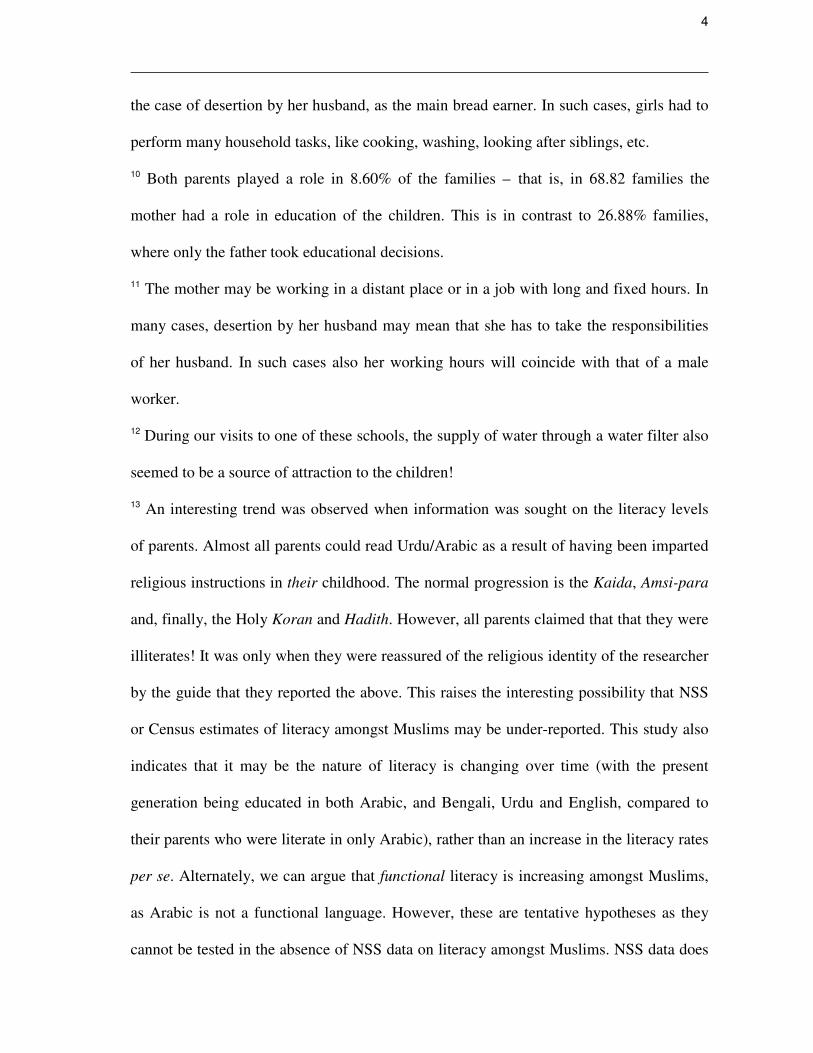
10 Both parents played a role in 8.60% of the families – that is, in 68.82 families the
mother had a role in education of the children. This is in contrast to 26.88% families,
where only the father took educational decisions.
11 The mother may be working in a distant place or in a job with long and fixed hours. In
many cases, desertion by her husband may mean that she has to take the responsibilities
of her husband. In such cases also her working hours will coincide with that of a male
worker.
12 During our visits to one of these schools, the supply of water through a water filter also
seemed to be a source of attraction to the children!
13 An interesting trend was observed when information was sought on the literacy levels
of parents. Almost all parents could read Urdu/Arabic as a result of having been imparted
religious instructions in their childhood. The normal progression is the Kaida, Amsi-para
and, finally, the Holy Koran and Hadith. However, all parents claimed that that they were
illiterates! It was only when they were reassured of the religious identity of the researcher
by the guide that they reported the above. This raises the interesting possibility that NSS
or Census estimates of literacy amongst Muslims may be under-reported. This study also
indicates that it may be the nature of literacy is changing over time (with the present
generation being educated in both Arabic, and Bengali, Urdu and English, compared to
their parents who were literate in only Arabic), rather than an increase in the literacy rates
per se. Alternately, we can argue that functional literacy is increasing amongst Muslims,
as Arabic is not a functional language. However, these are tentative hypotheses as they
cannot be tested in the absence of NSS data on literacy amongst Muslims. NSS data does

5
exist, but the figures are for Muslims across all income groups –not for Muslim slum
dwellers exclusively.
14 We have tested for difference using the Mann-Whitney U test and Kolmogurov-
Smirnov Z tests.
15 Assuming that a slum dweller works as a daily maidservant (thike) for Rs.300 per
month, the monetary equivalent of this time cost is about Rs. 100 per month.
16 Gupta, M. & K.Voll (1999) “Child Labour in India: An exemplary case study”, in K.
Voll ed. Against Child Labour: Indian and International Dimensions and Strategies.
Mosaic Books and Third Millennium Transparency, New Delhi. Cited: Subrahmaniam
(2002).
17 Grote, U., A. Basu & D. Weinhold (1998) “Child Labour and the International Policy
Debate: the education/child labour trade-off and the consequences of trade sanctions”,
ZEF Discussion Papers on Development Policy, Bonn. Cited: Subrahmaniam (2002).
18 Grote, U., A. Basu & D. Weinhold (1998) “Child Labour and the International Policy
Debate: the education/child labour trade-off and the consequences of trade sanctions”,
ZEF Discussion Papers on Development Policy, Bonn. Cited: Subrahmaniam (2002).
19 Gupta, M. & K.Voll (1999) “Child Labour in India: An exemplary case study”, in K.
Voll ed. Against Child Labour: Indian and International Dimensions and Strategies.
Mosaic Books and Third Millennium Transparency, New Delhi. Cited: Subrahmaniam
(2002).
20 Mehrotra (1995), on the other hand, argues that dropouts occur at an early stage before
the children are capable of joining the work force. Cited: Bhatty (1998).
Mehrotra, N. (1995) Why Poor Children Do Not attend Schools, Dept. of Education,
University of Chicago. Cited: Bhatty (1998).

6
21 Niewenhuys, O. (1994) Children’s Lifeworlds: Gender, welfare and Labour in the
Developing World. Routledge, London and New York. Cited: Subrahmaniam (2002).
22 Jeejbhoy, S. & S. Kulkarni (1998) Demand for Children and Reproductive Motivation:
Emperical observations from Rural Maharasthra. In: S.N. Singh et al ed., Population
Transition in India, BR Publishers, New Delhi. Cited in Bhatty (1998).
23 Dinesh, B.M. (1988) Economic Activities of Children: Dimensions, Causes and
Consequences. Dayal Publishers, New Delhi.
24 Bhatty (1998) cites an unspecified study by Bashir (1994) that found in urban Tamil
Nadu that girls work three times more than boys in urban areas. On an average, children
spent 1-2 hours in household work.
25 Our focus on primary education prevented us from studying this aspect. In a few cases
we did find higher levels of attainment by girls, particularly in slum 1. However, our data
is not systematic enough to arrive at any firm conclusion.
26 Early marriage has been identified by many researchers as the most important constraint
to female education (Karlekar, 2000; Sudarshan, 2000).
27 The current minimum age of marriage of Muslim girls is 14 years.
28 If we regress ECOST on SGC and SGC2, we get the following results:
ECOST = 139.42 + 195.69 SGC – 32.58 SGC2
(1.675) (2.790) (-2.559)
R2 = 0.05; adj. R2 = 0.05; F= 3.89; d.f. = 99; n = 102.
Figures in parentheses are t-ratios. The positive sign of SGC and the negative sign of
SGC2 imply that the curve is positively sloped, but concave from below - so that ECOST
will increase with SGC, but at a diminishing rate.


![Normalisation “A formal technique for analysing relations based on their primary key and functional dependencies.” [Codd]. Process – Analyse each relation](https://img.pdfslide.net/doc/110x75/56649d435503460f94a1eac5/normalisation-a-formal-technique-for-analysing-relations-based-on-their.jpg)