Embed Size (px)
Citation preview
Analysis of Breast Cancer Survival Data withmissing information on stage of disease and cause ofdeath
Rino Bellocco1, Nicola Orsini 2
1 Department of Medical Epidemiology and Biostatistics , KarolinskaInstitutet2 Institute of Environmental Medicine, Karolinska Institutet
Ith Italian Stata User Group Meeting , October 25, 2004; Rome
1
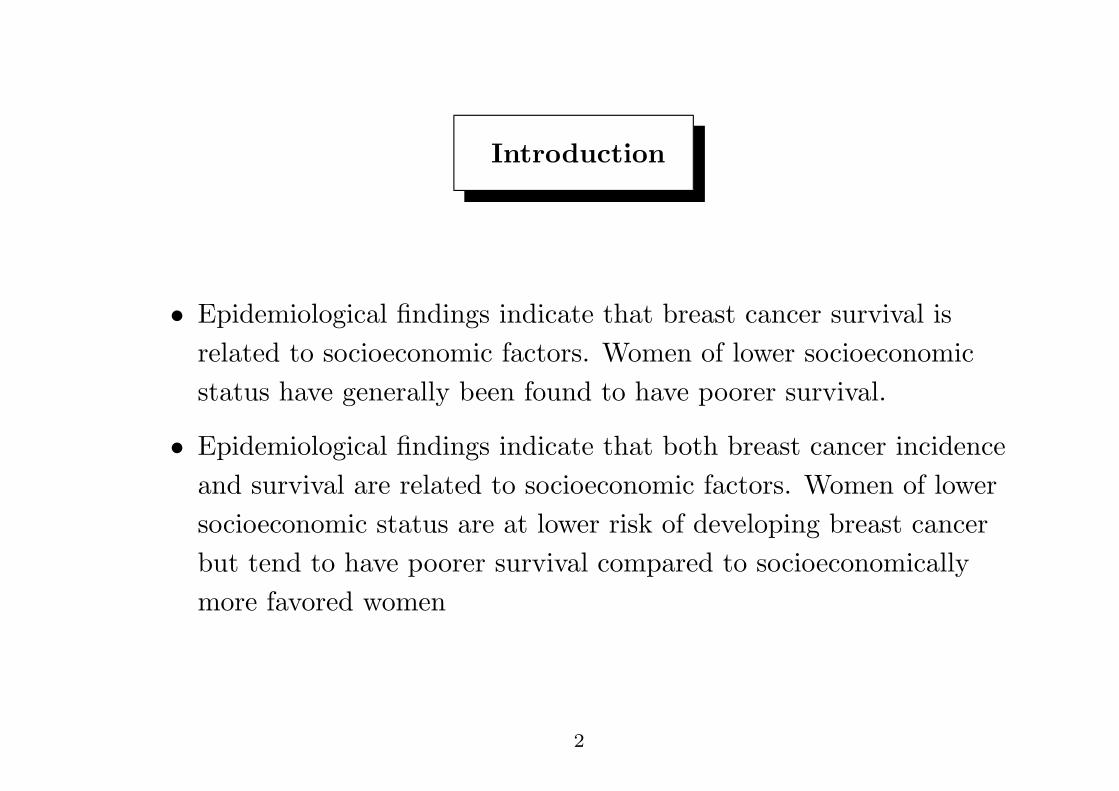
Introduction
• Epidemiological findings indicate that breast cancer survival isrelated to socioeconomic factors. Women of lower socioeconomicstatus have generally been found to have poorer survival.
• Epidemiological findings indicate that both breast cancer incidenceand survival are related to socioeconomic factors. Women of lowersocioeconomic status are at lower risk of developing breast cancerbut tend to have poorer survival compared to socioeconomicallymore favored women
2
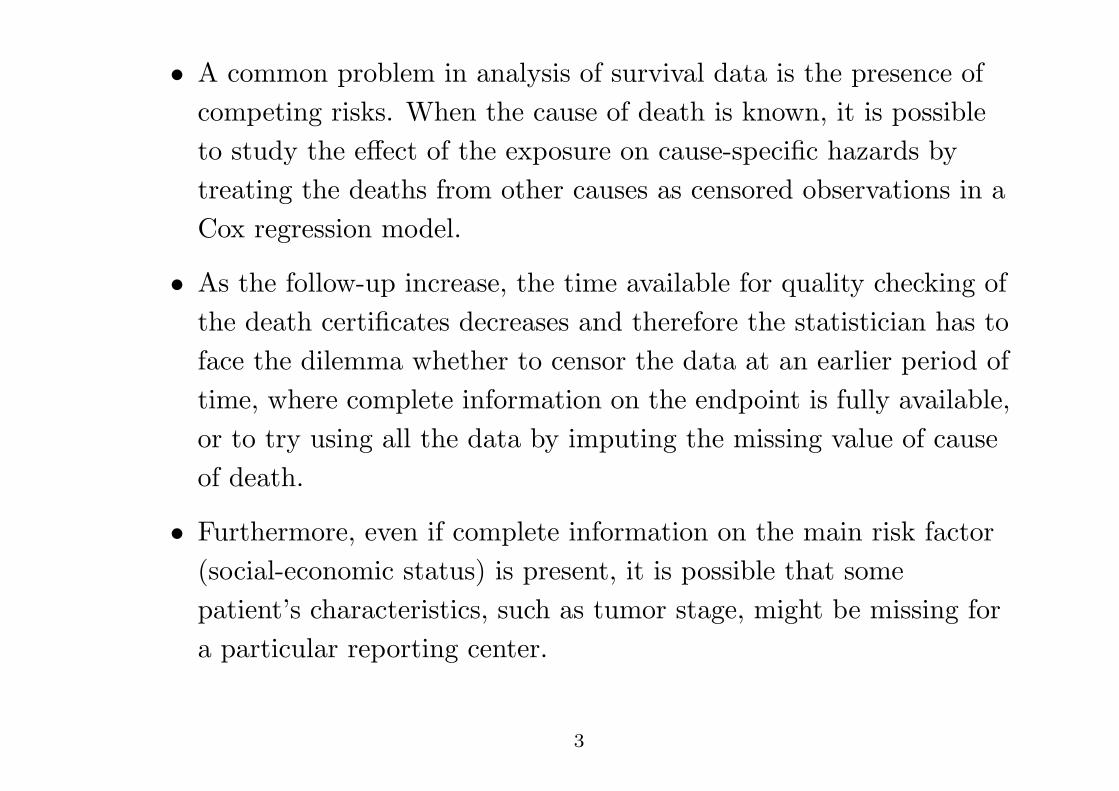
• A common problem in analysis of survival data is the presence ofcompeting risks. When the cause of death is known, it is possibleto study the effect of the exposure on cause-specific hazards bytreating the deaths from other causes as censored observations in aCox regression model.
• As the follow-up increase, the time available for quality checking ofthe death certificates decreases and therefore the statistician has toface the dilemma whether to censor the data at an earlier period oftime, where complete information on the endpoint is fully available,or to try using all the data by imputing the missing value of causeof death.
• Furthermore, even if complete information on the main risk factor(social-economic status) is present, it is possible that somepatient’s characteristics, such as tumor stage, might be missing fora particular reporting center.
3
Study Design: Cohort
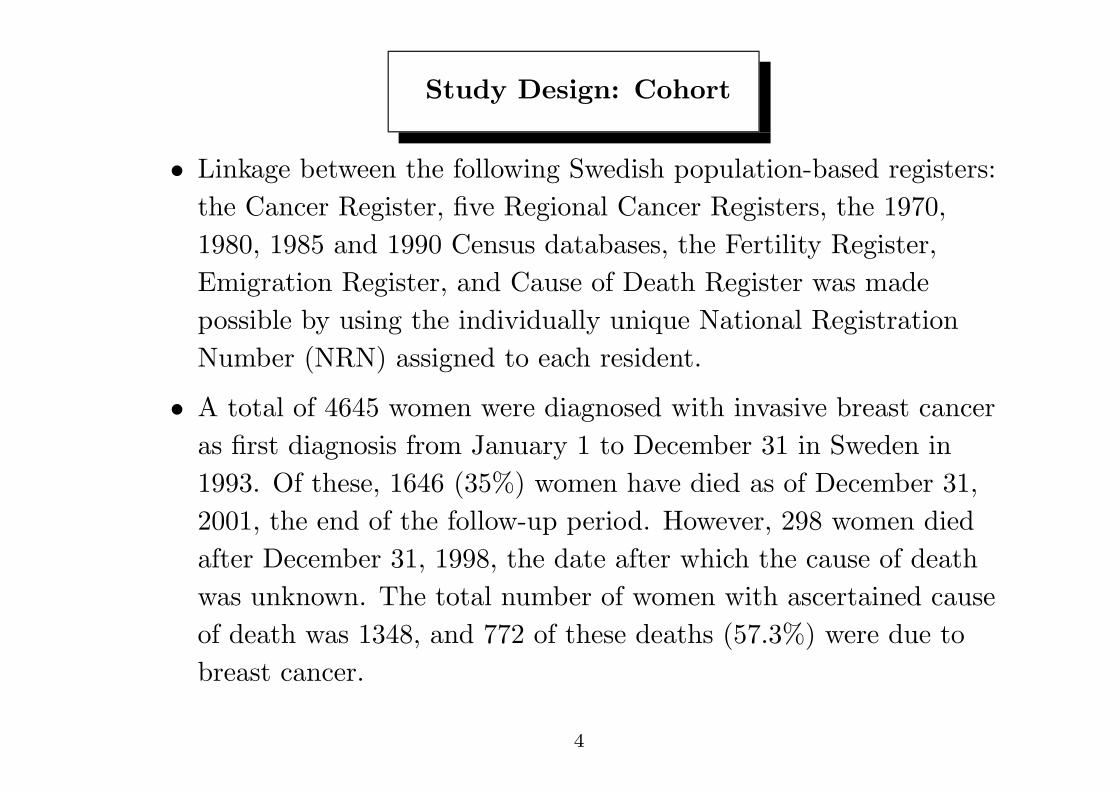
• Linkage between the following Swedish population-based registers:the Cancer Register, five Regional Cancer Registers, the 1970,1980, 1985 and 1990 Census databases, the Fertility Register,Emigration Register, and Cause of Death Register was madepossible by using the individually unique National RegistrationNumber (NRN) assigned to each resident.
• A total of 4645 women were diagnosed with invasive breast canceras first diagnosis from January 1 to December 31 in Sweden in1993. Of these, 1646 (35%) women have died as of December 31,2001, the end of the follow-up period. However, 298 women diedafter December 31, 1998, the date after which the cause of deathwas unknown. The total number of women with ascertained causeof death was 1348, and 772 of these deaths (57.3%) were due tobreast cancer.
4
Methods
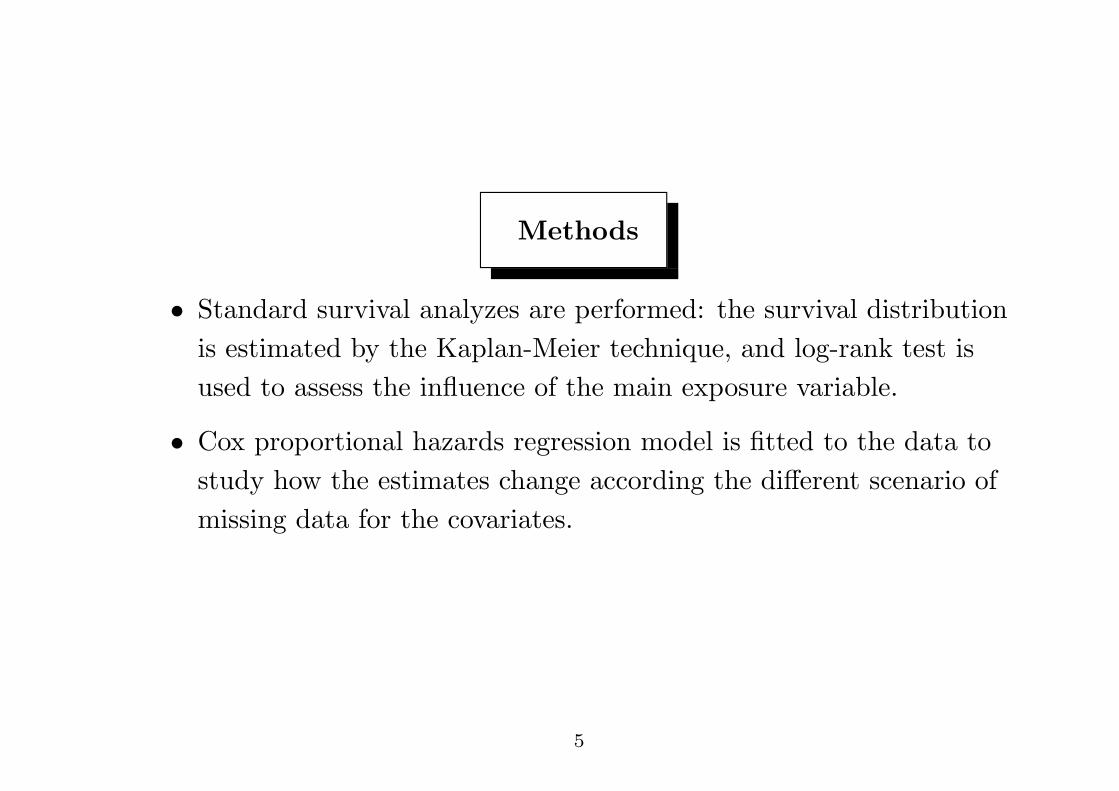
• Standard survival analyzes are performed: the survival distributionis estimated by the Kaplan-Meier technique, and log-rank test isused to assess the influence of the main exposure variable.
• Cox proportional hazards regression model is fitted to the data tostudy how the estimates change according the different scenario ofmissing data for the covariates.
5
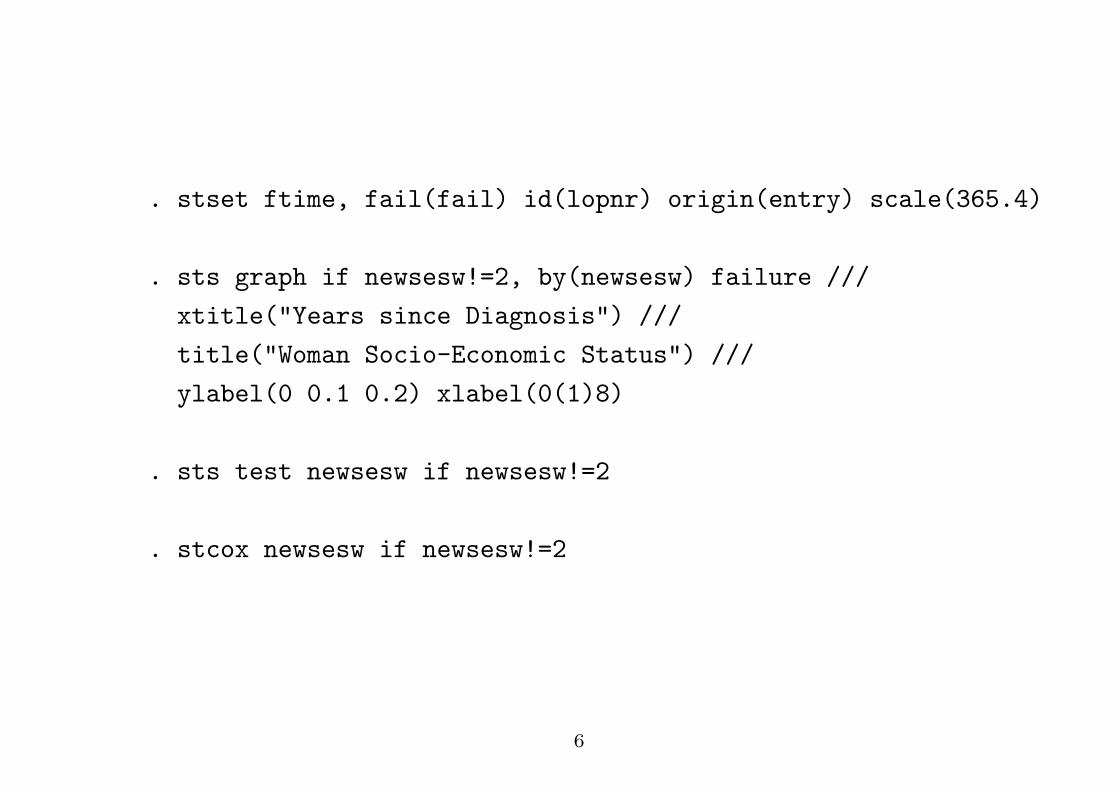
. stset ftime, fail(fail) id(lopnr) origin(entry) scale(365.4)
. sts graph if newsesw!=2, by(newsesw) failure ///
xtitle("Years since Diagnosis") ///
title("Woman Socio-Economic Status") ///
ylabel(0 0.1 0.2) xlabel(0(1)8)
. sts test newsesw if newsesw!=2
. stcox newsesw if newsesw!=2
6
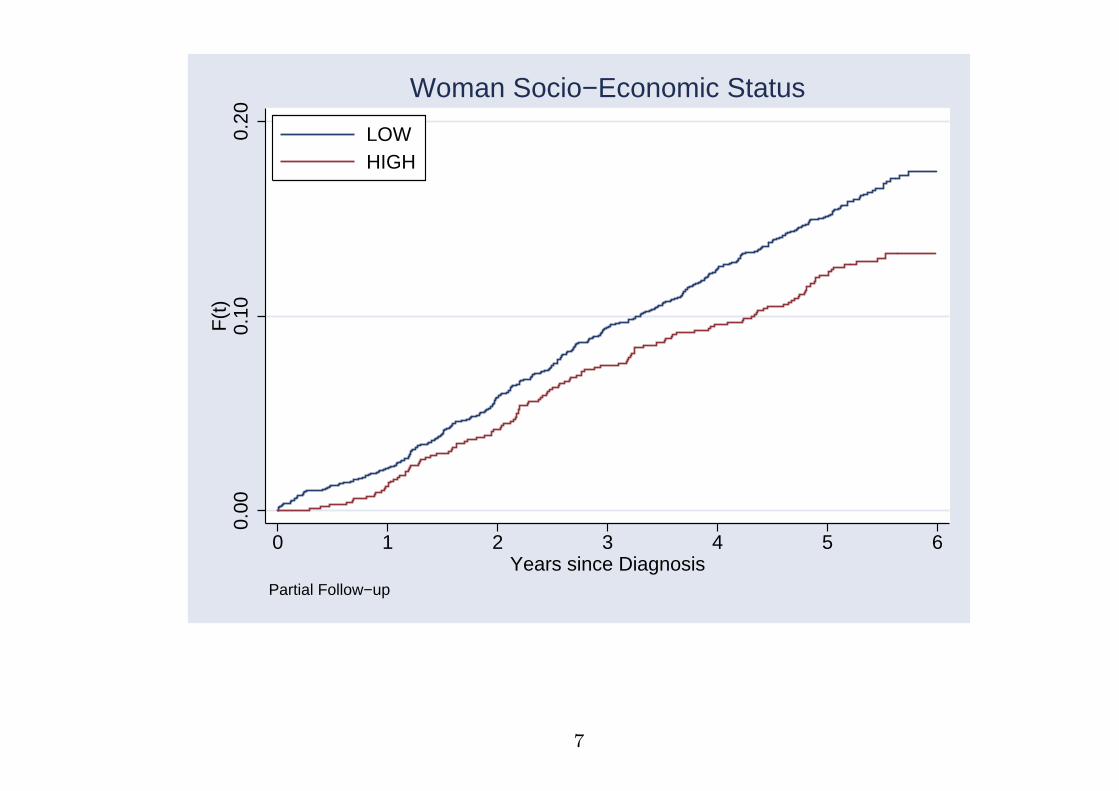
0.00
0.10
0.20
F(t
)
0 1 2 3 4 5 6Years since Diagnosis
LOWHIGH
Partial Follow−up
Woman Socio−Economic Status
7
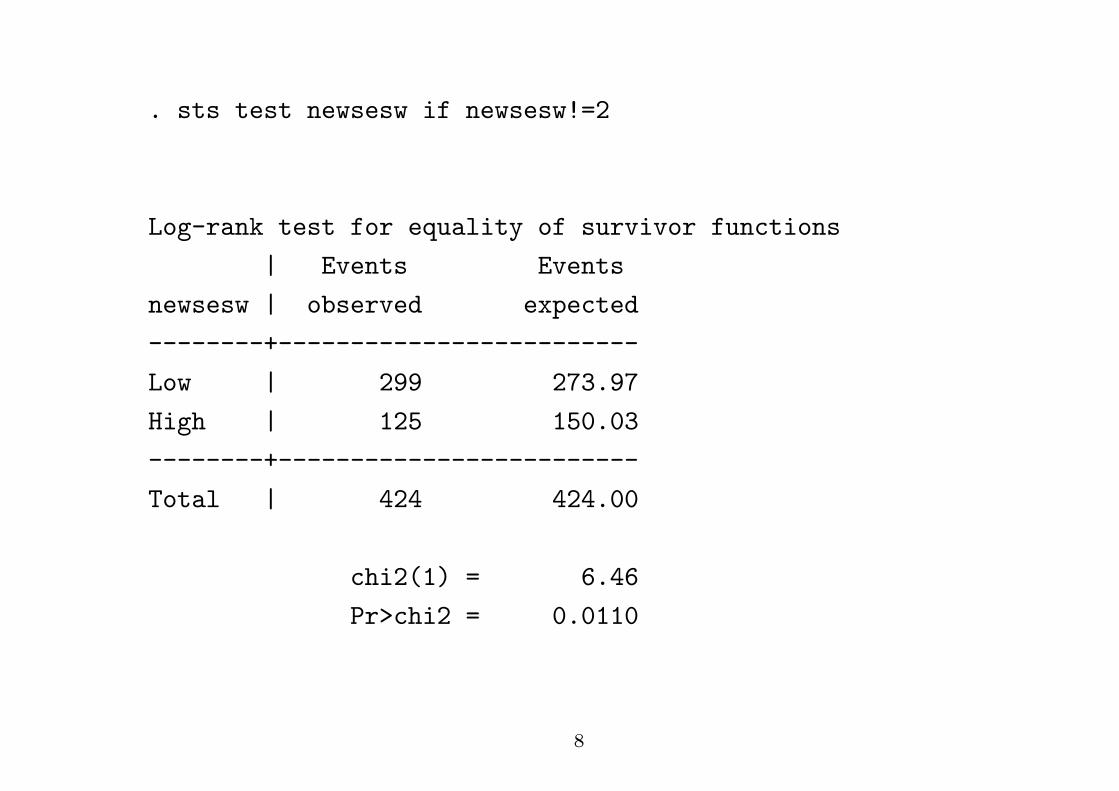
. sts test newsesw if newsesw!=2
Log-rank test for equality of survivor functions
| Events Events
newsesw | observed expected
--------+-------------------------
Low | 299 273.97
High | 125 150.03
--------+-------------------------
Total | 424 424.00
chi2(1) = 6.46
Pr>chi2 = 0.0110
8
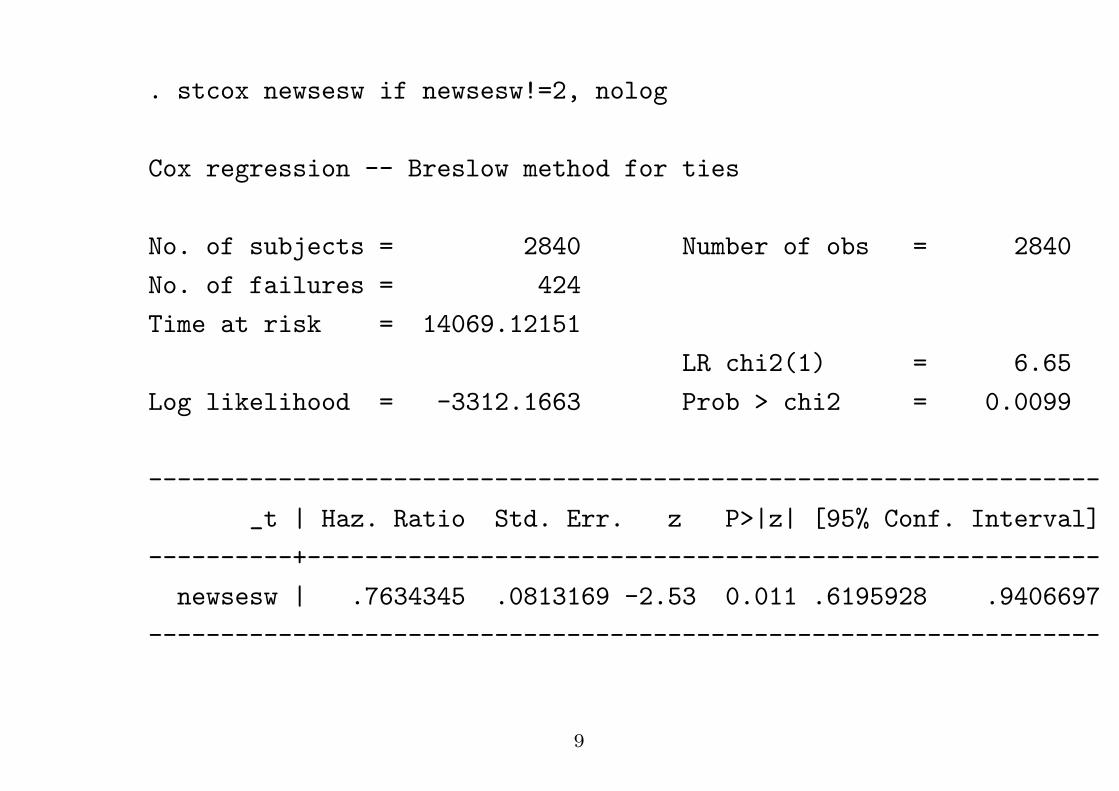
. stcox newsesw if newsesw!=2, nolog
Cox regression -- Breslow method for ties
No. of subjects = 2840 Number of obs = 2840
No. of failures = 424
Time at risk = 14069.12151
LR chi2(1) = 6.65
Log likelihood = -3312.1663 Prob > chi2 = 0.0099
------------------------------------------------------------------
_t | Haz. Ratio Std. Err. z P>|z| [95% Conf. Interval]
----------+-------------------------------------------------------
newsesw | .7634345 .0813169 -2.53 0.011 .6195928 .9406697
------------------------------------------------------------------
9
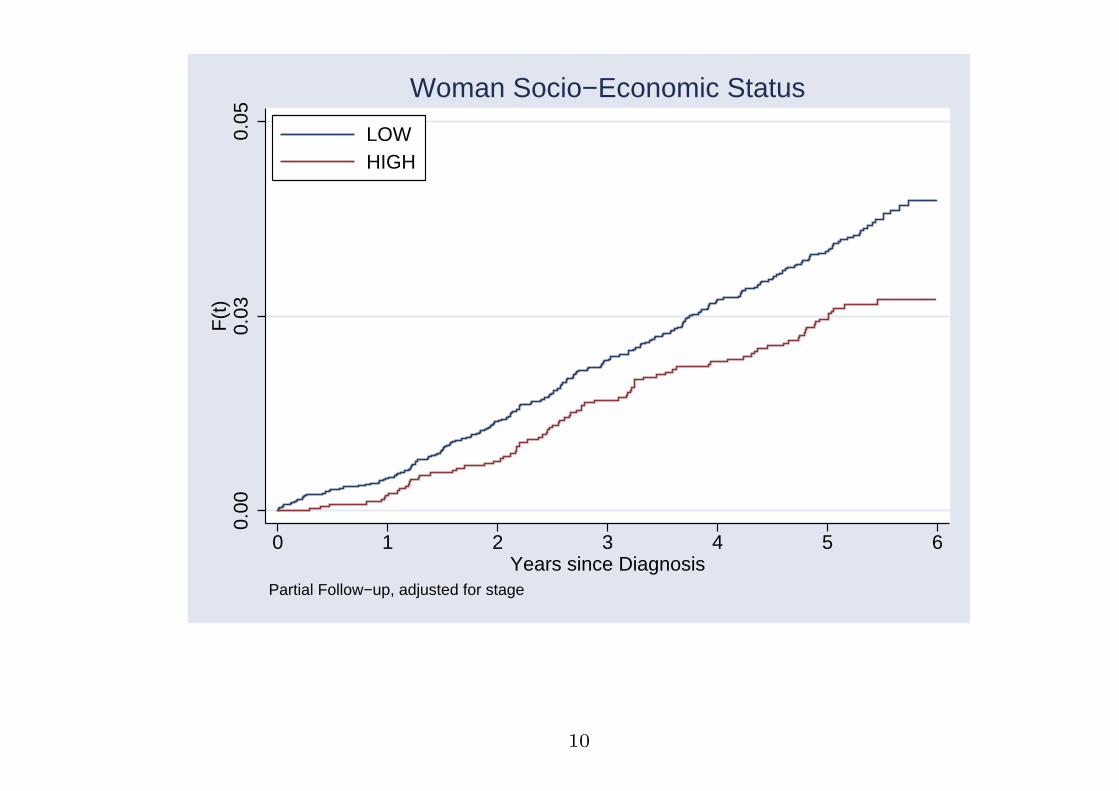
0.00
0.03
0.05
F(t
)
0 1 2 3 4 5 6Years since Diagnosis
LOWHIGH
Partial Follow−up, adjusted for stage
Woman Socio−Economic Status
10
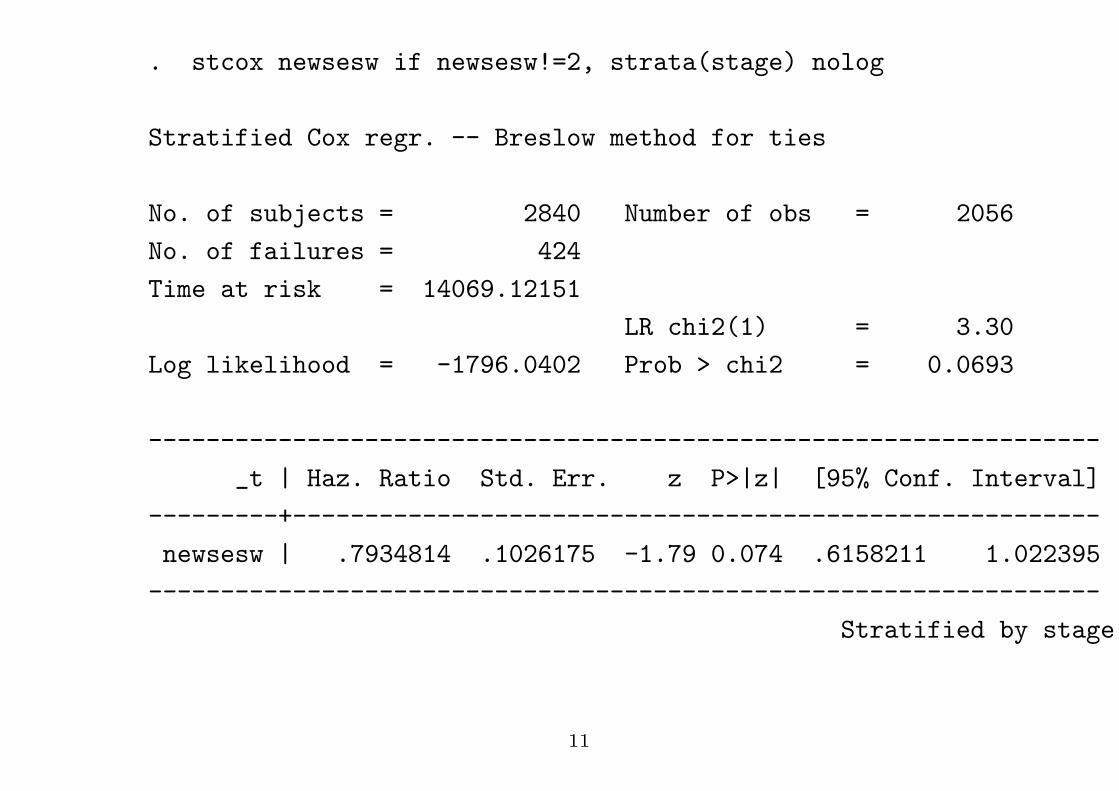
. stcox newsesw if newsesw!=2, strata(stage) nolog
Stratified Cox regr. -- Breslow method for ties
No. of subjects = 2840 Number of obs = 2056
No. of failures = 424
Time at risk = 14069.12151
LR chi2(1) = 3.30
Log likelihood = -1796.0402 Prob > chi2 = 0.0693
------------------------------------------------------------------
_t | Haz. Ratio Std. Err. z P>|z| [95% Conf. Interval]
---------+--------------------------------------------------------
newsesw | .7934814 .1026175 -1.79 0.074 .6158211 1.022395
------------------------------------------------------------------
Stratified by stage
11
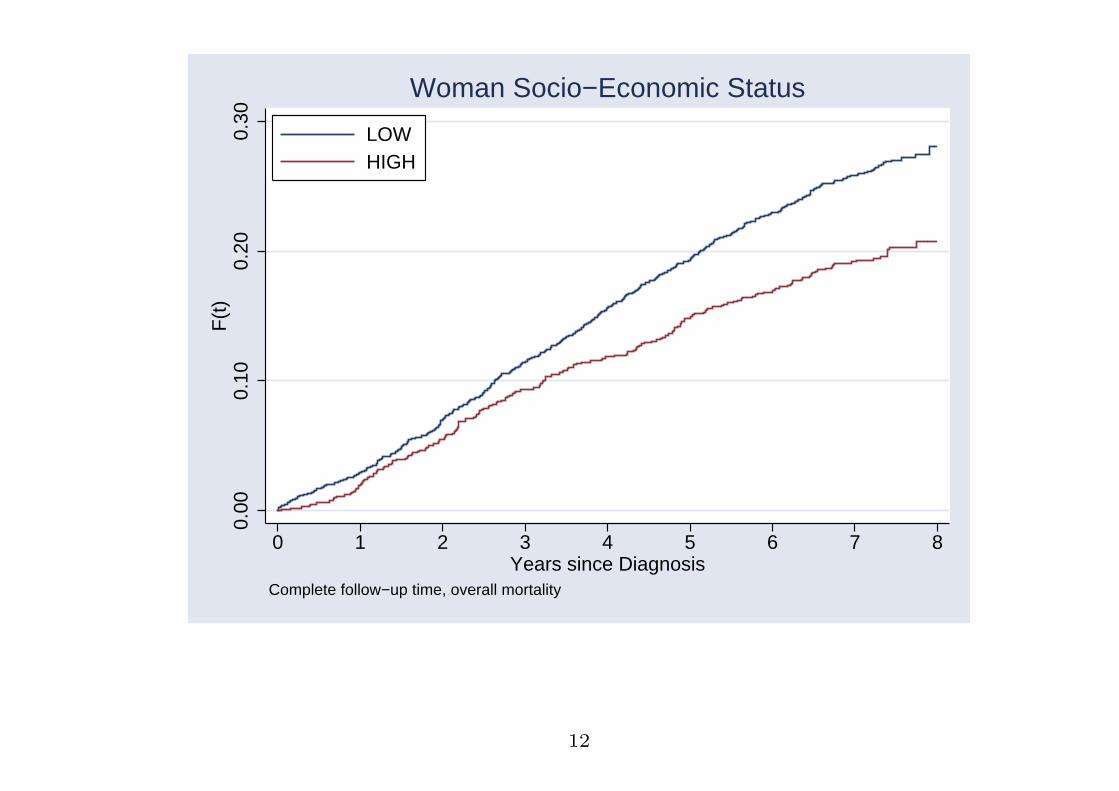
0.00
0.10
0.20
0.30
F(t
)
0 1 2 3 4 5 6 7 8Years since Diagnosis
LOWHIGH
Complete follow−up time, overall mortality
Woman Socio−Economic Status
12
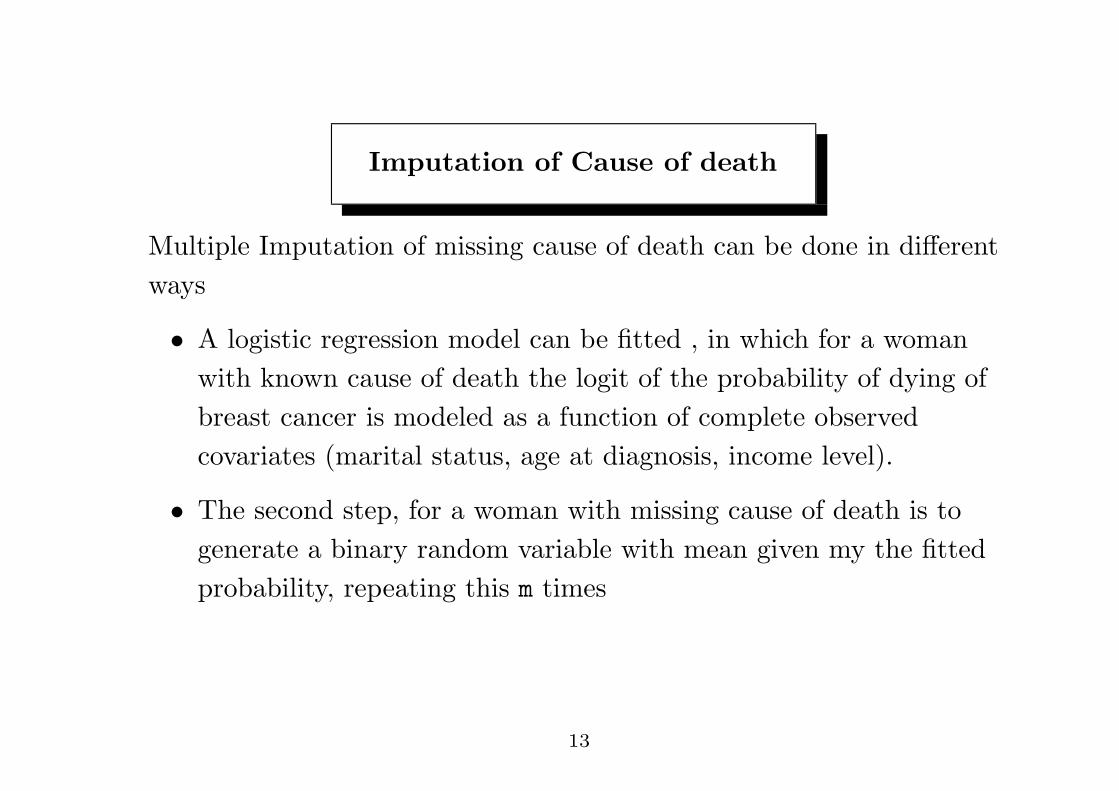
Imputation of Cause of death
Multiple Imputation of missing cause of death can be done in differentways
• A logistic regression model can be fitted , in which for a womanwith known cause of death the logit of the probability of dying ofbreast cancer is modeled as a function of complete observedcovariates (marital status, age at diagnosis, income level).
• The second step, for a woman with missing cause of death is togenerate a binary random variable with mean given my the fittedprobability, repeating this m times
13
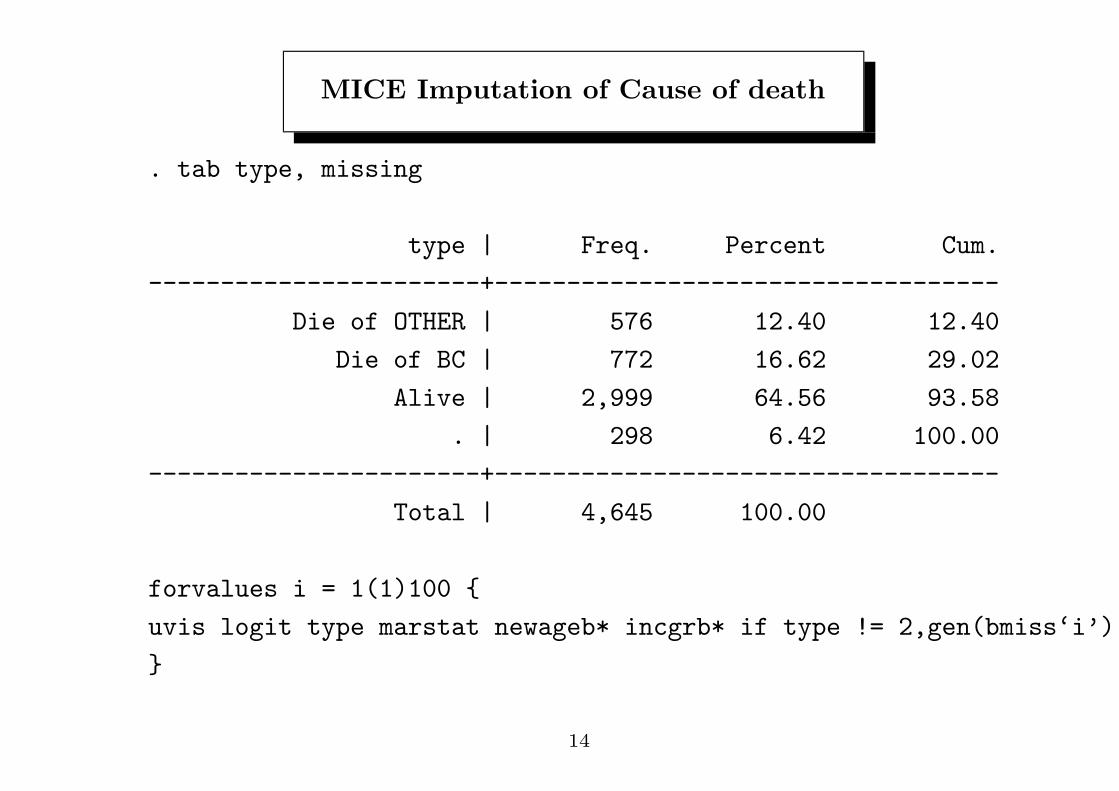
MICE Imputation of Cause of death
. tab type, missing
type | Freq. Percent Cum.
-----------------------+-----------------------------------
Die of OTHER | 576 12.40 12.40
Die of BC | 772 16.62 29.02
Alive | 2,999 64.56 93.58
. | 298 6.42 100.00
-----------------------+-----------------------------------
Total | 4,645 100.00
forvalues i = 1(1)100 {
uvis logit type marstat newageb* incgrb* if type != 2,gen(bmiss‘i’)
}
14

uvis imputes type from marstat, newage, incgr according to thefollowing algorithm (van Buuren et al. (1999) for further technicaldetails):
• Estimate the vector of coefficients (beta) by regressing thenonmissing values of type on marstat, newage, incgr. Predict thefitted values of the logit of the probability of type = 1 at thenonmissing observations of type.
• Draw at random a value (sigma∗) from the posterior distribution ofthe residual standard deviation.
• Draw at random a value (beta∗) from the posterior distribution ofbeta, allowing, through sigma∗, for uncertainty in beta.
15

• Use beta∗ to predict the fitted values of the logit of the probabilityof type = 1 at the missing observations of type.
• (Prediction matching) For each missing observation of type withprediction given by the step above, find the nonmissing observationof type whose prediction given by the step 1 on observed data isclosest to the fitted values. This closest nonmissing observation isused to impute the missing value of type.
16
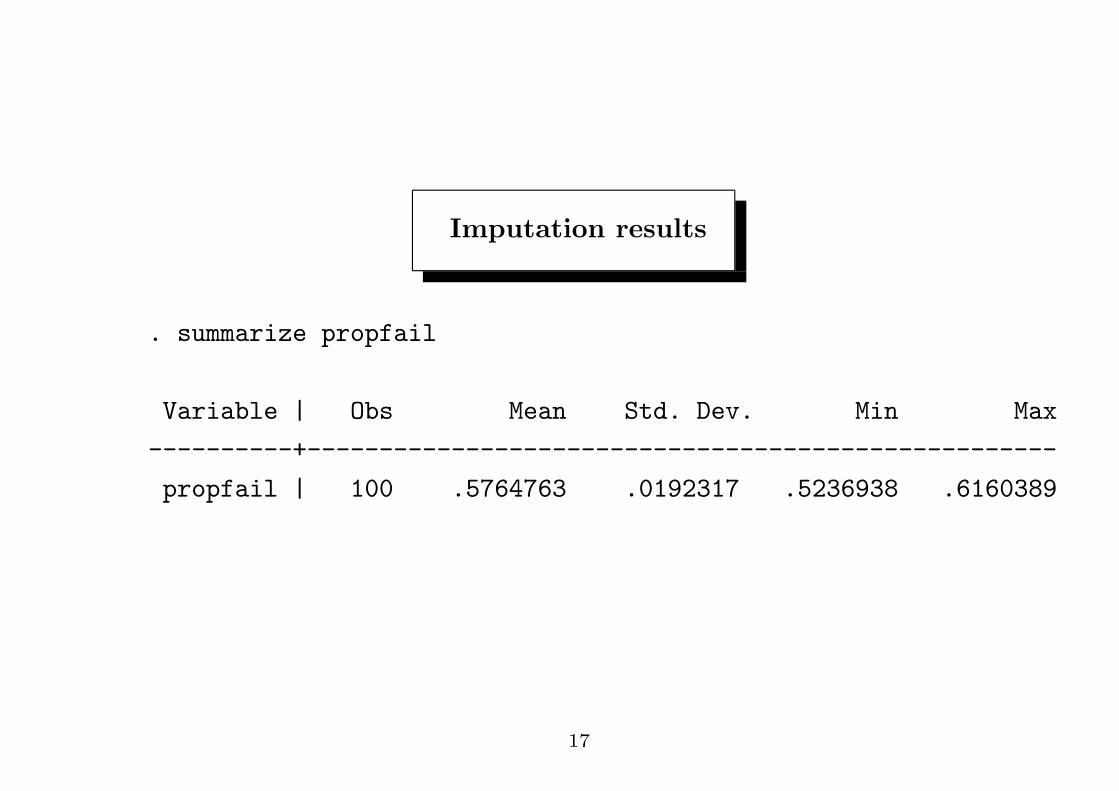
Imputation results
. summarize propfail
Variable | Obs Mean Std. Dev. Min Max
----------+----------------------------------------------------
propfail | 100 .5764763 .0192317 .5236938 .6160389
17
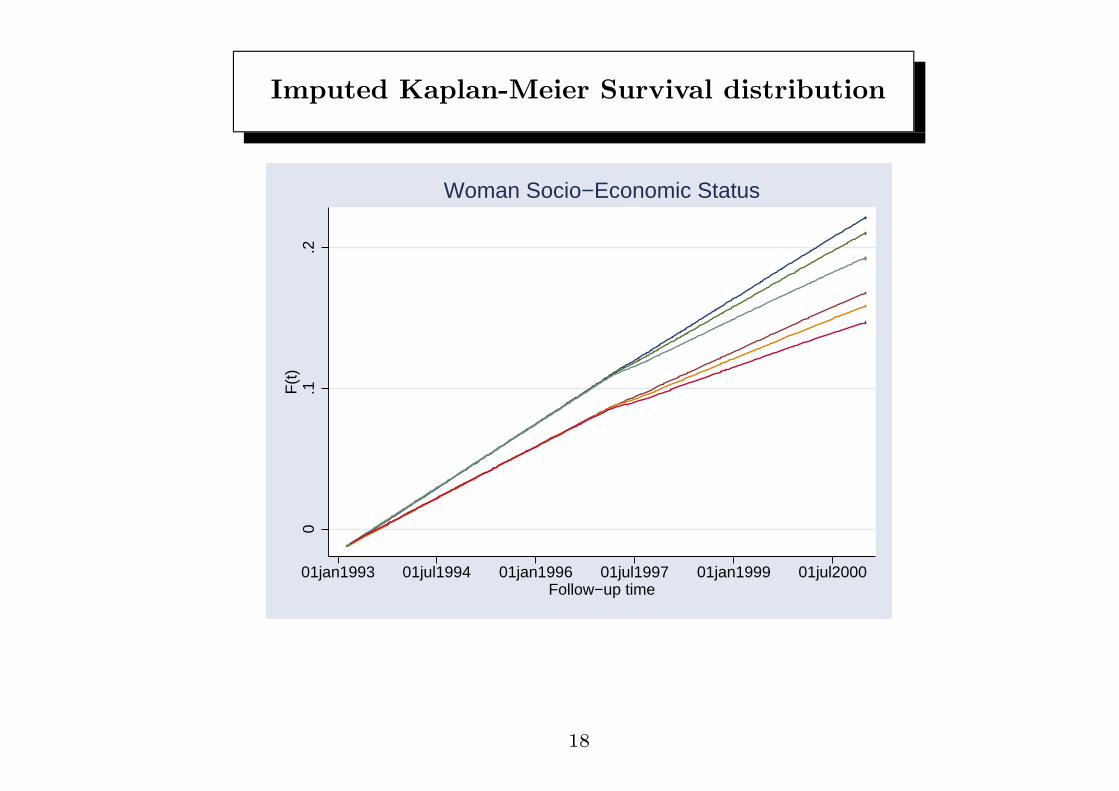
Imputed Kaplan-Meier Survival distribution
0.1
.2F
(t)
01jan1993 01jul1994 01jan1996 01jul1997 01jan1999 01jul2000Follow−up time
Woman Socio−Economic Status
18
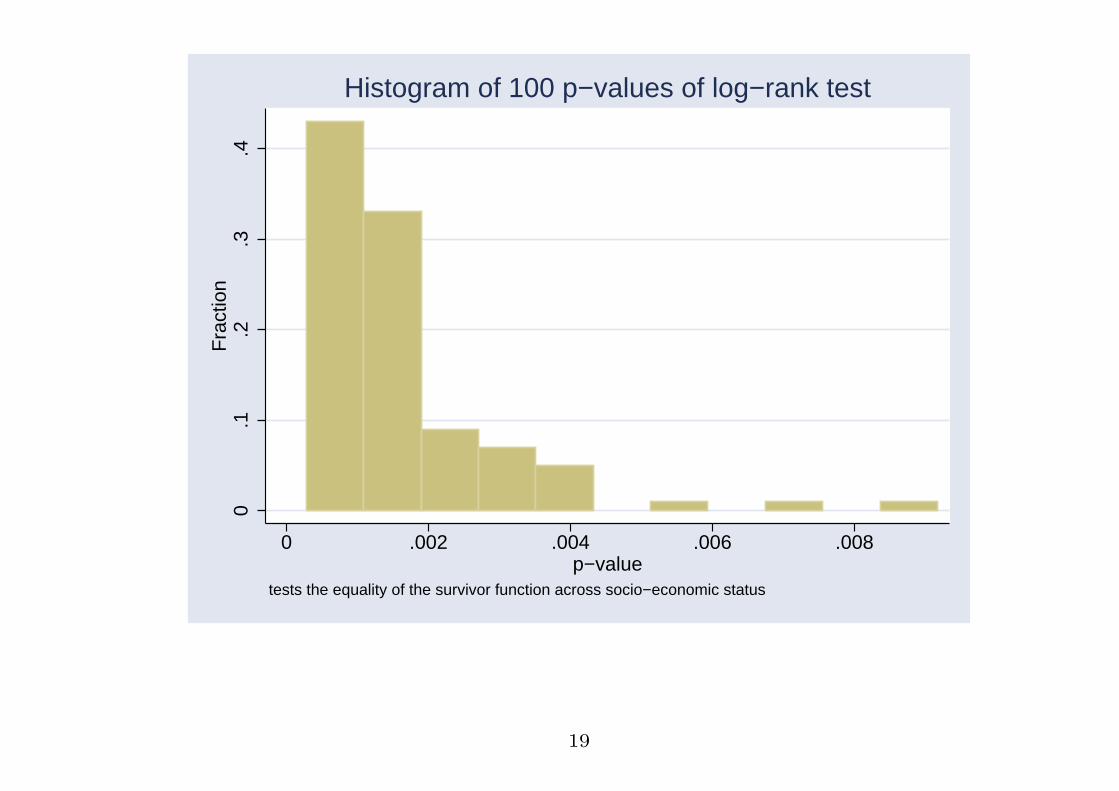
0.1
.2.3
.4F
ract
ion
0 .002 .004 .006 .008p−value
tests the equality of the survivor function across socio−economic status
Histogram of 100 p−values of log−rank test
19
Stage of disease imputation
• Next step will be to model missingness in stage of disease.
• Missingness only depends on data not reported by one of the regionof the cancer register.
• We will adjust the effect of social status by stage and age under theassumption that the stage distribution condition to social status issimilar to the one of the other reporting regions.
• Multiple imputation will be performed also in this case.
20
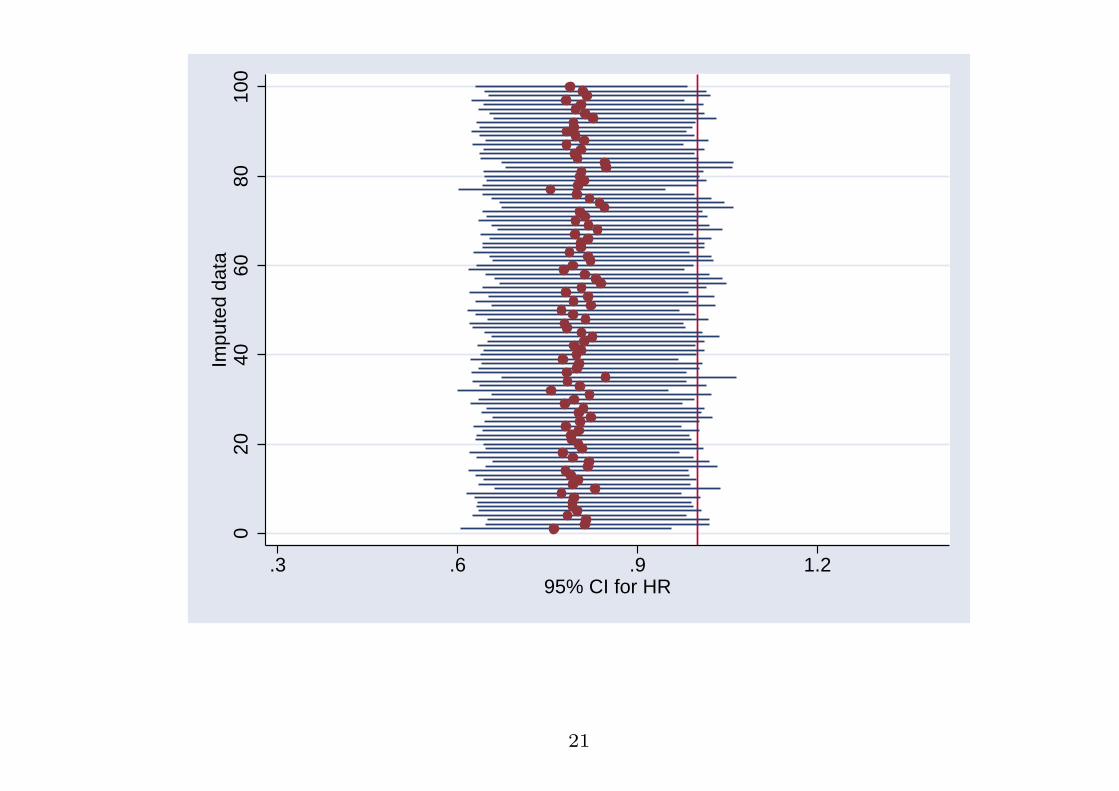
020
4060
8010
0Im
pute
d da
ta
.3 .6 .9 1.295% CI for HR
21
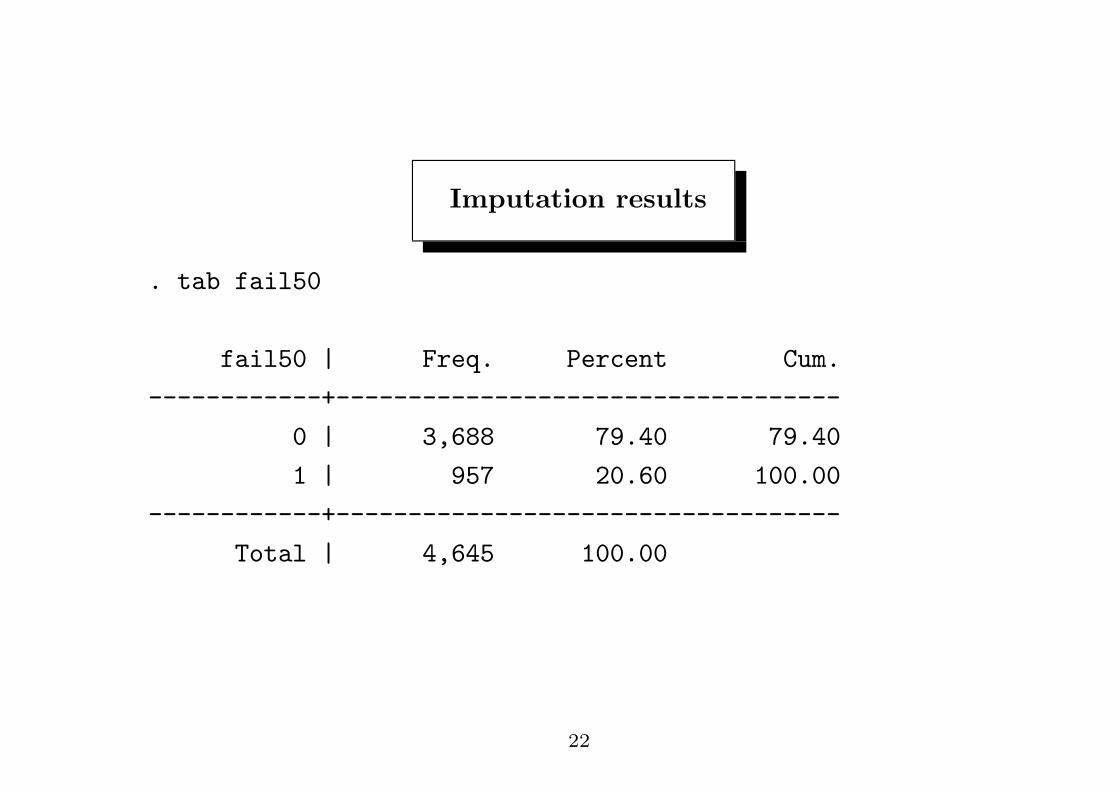
Imputation results
. tab fail50
fail50 | Freq. Percent Cum.
------------+-----------------------------------
0 | 3,688 79.40 79.40
1 | 957 20.60 100.00
------------+-----------------------------------
Total | 4,645 100.00
22
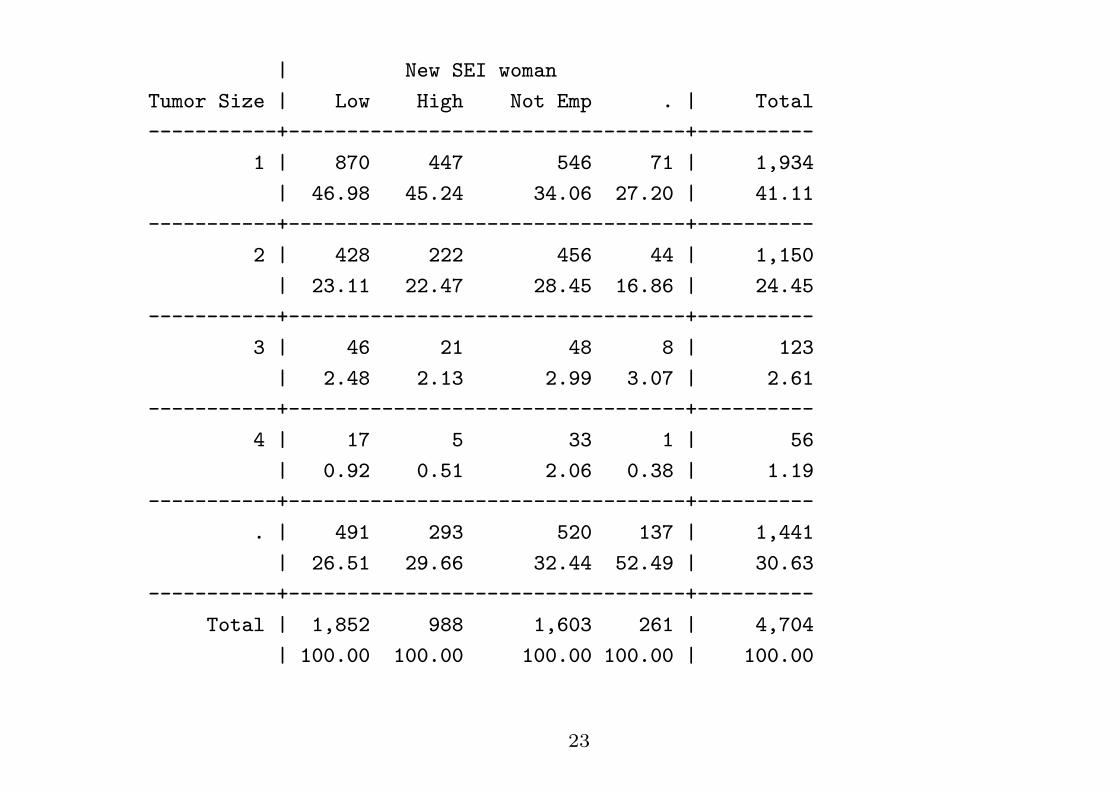
| New SEI woman
Tumor Size | Low High Not Emp . | Total
-----------+----------------------------------+----------
1 | 870 447 546 71 | 1,934
| 46.98 45.24 34.06 27.20 | 41.11
-----------+----------------------------------+----------
2 | 428 222 456 44 | 1,150
| 23.11 22.47 28.45 16.86 | 24.45
-----------+----------------------------------+----------
3 | 46 21 48 8 | 123
| 2.48 2.13 2.99 3.07 | 2.61
-----------+----------------------------------+----------
4 | 17 5 33 1 | 56
| 0.92 0.51 2.06 0.38 | 1.19
-----------+----------------------------------+----------
. | 491 293 520 137 | 1,441
| 26.51 29.66 32.44 52.49 | 30.63
-----------+----------------------------------+----------
Total | 1,852 988 1,603 261 | 4,704
| 100.00 100.00 100.00 100.00 | 100.00
23
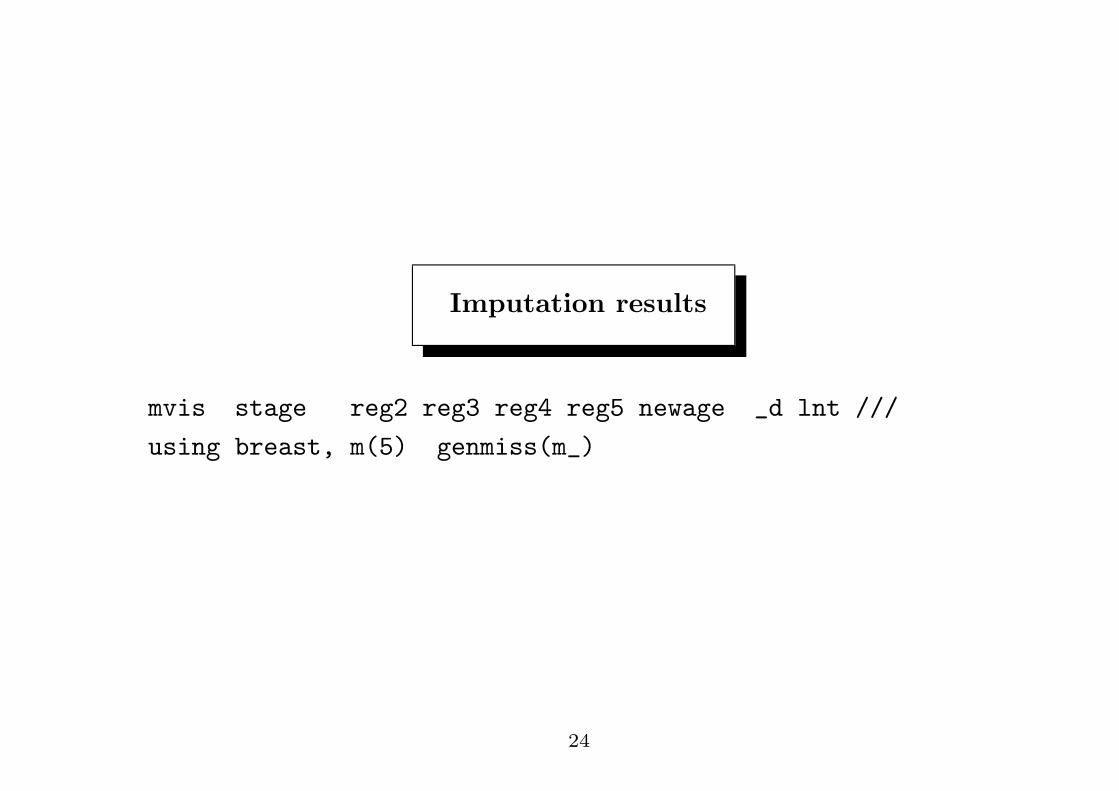
Imputation results
mvis stage reg2 reg3 reg4 reg5 newage _d lnt ///
using breast, m(5) genmiss(m_)
24
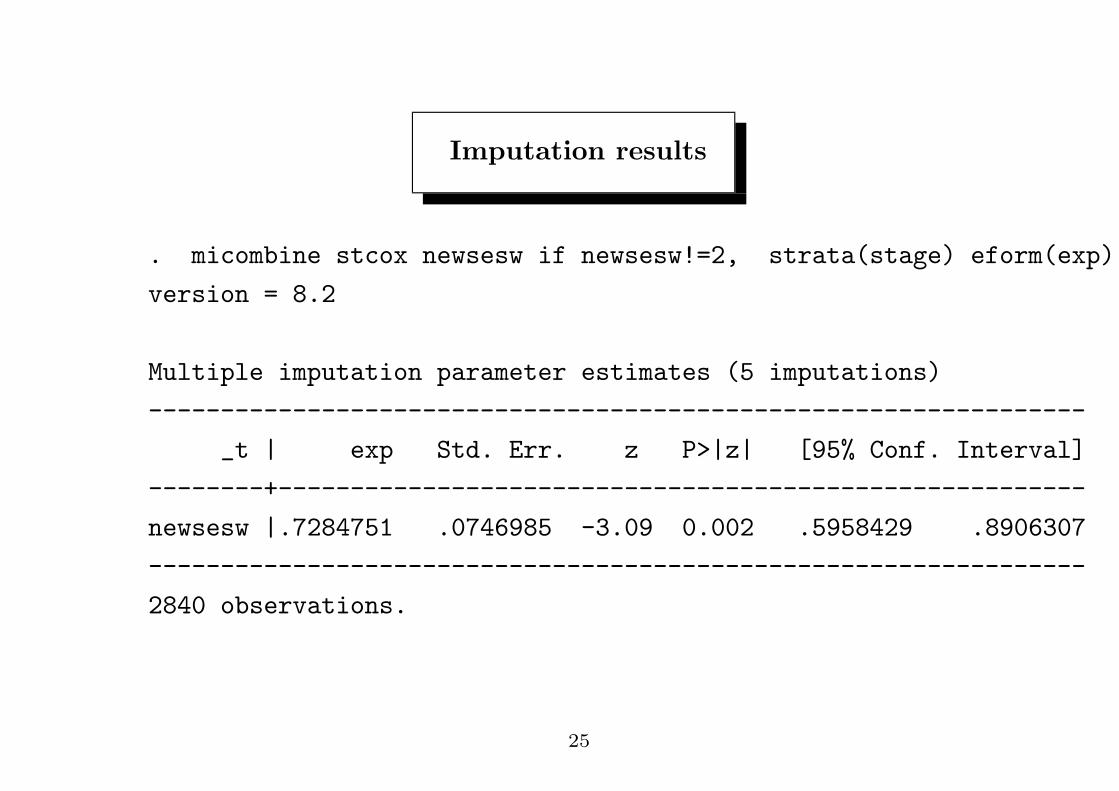
Imputation results
. micombine stcox newsesw if newsesw!=2, strata(stage) eform(exp)
version = 8.2
Multiple imputation parameter estimates (5 imputations)
-----------------------------------------------------------------
_t | exp Std. Err. z P>|z| [95% Conf. Interval]
--------+--------------------------------------------------------
newsesw |.7284751 .0746985 -3.09 0.002 .5958429 .8906307
-----------------------------------------------------------------
2840 observations.
25
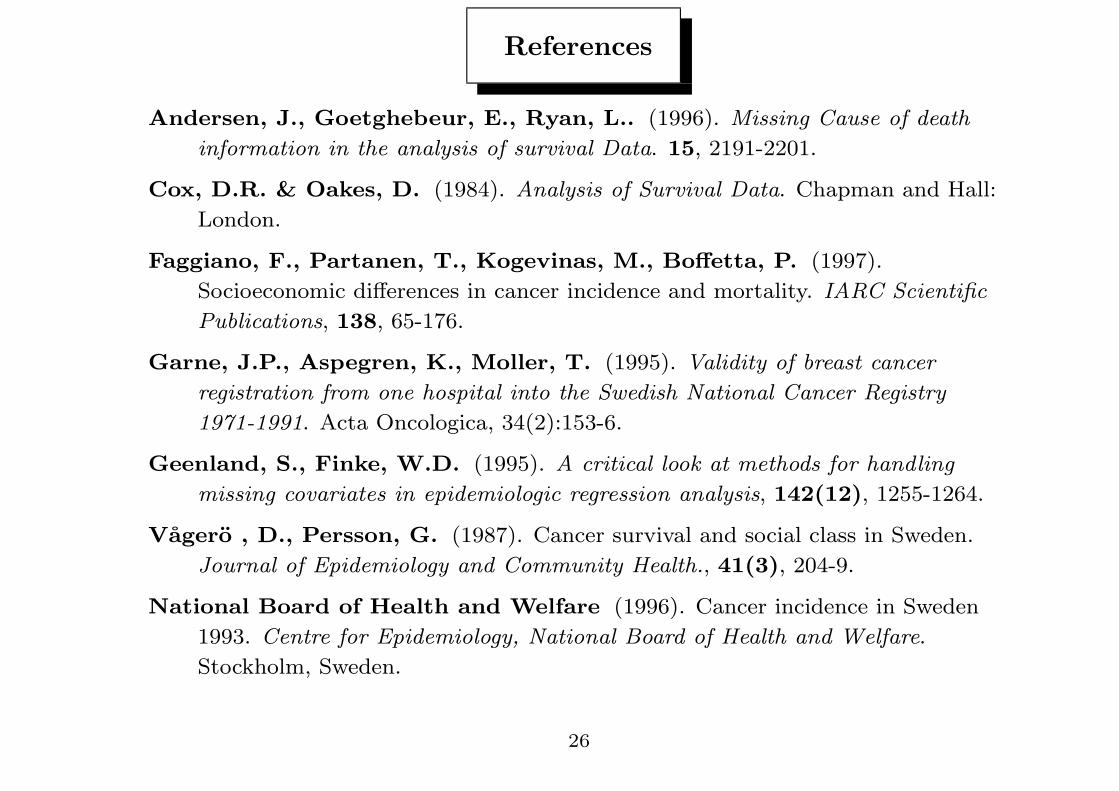
References
Andersen, J., Goetghebeur, E., Ryan, L.. (1996). Missing Cause of death
information in the analysis of survival Data. 15, 2191-2201.
Cox, D.R. & Oakes, D. (1984). Analysis of Survival Data. Chapman and Hall:
London.
Faggiano, F., Partanen, T., Kogevinas, M., Boffetta, P. (1997).
Socioeconomic differences in cancer incidence and mortality. IARC Scientific
Publications, 138, 65-176.
Garne, J.P., Aspegren, K., Moller, T. (1995). Validity of breast cancer
registration from one hospital into the Swedish National Cancer Registry
1971-1991. Acta Oncologica, 34(2):153-6.
Geenland, S., Finke, W.D. (1995). A critical look at methods for handling
missing covariates in epidemiologic regression analysis, 142(12), 1255-1264.
Vagero , D., Persson, G. (1987). Cancer survival and social class in Sweden.
Journal of Epidemiology and Community Health., 41(3), 204-9.
National Board of Health and Welfare (1996). Cancer incidence in Sweden
1993. Centre for Epidemiology, National Board of Health and Welfare.
Stockholm, Sweden.
26
van Buuren, S., Boshuizen, H.C., and Knook, D.L. (1999). Multiplicative
imputation of missing blood pressure covariates in survival analysis. Statistics
in Medicine. 18: 681-694.
27