Embed Size (px)
Citation preview

Tools for monitoring the coverage of integrated public
health interventions
Vaccination and deworming of soil-transmitted helminthiasis
MODULE 6
Analysis of data from surveys and nominal registries
May 2017

1
Table of contents
Tables and figures 3
Introduction 6
Unit 1. Analysis of data from surveys and nominal 7
registries 7
Step 1: Definition of the analysis plan 8
1.1. What is being analyzed? 8
1.1.1. Coverage 11
1.1.2. Immunization service quality 11
1.1.3. Factors related to coverage and quality 11
1.2. Which data sources will be used? 11
1.2.2. Surveys 12
1.2.3. Nominal registries 13
1.3. How will data quality be monitored? 16
1.3.1. Random error 16
1.3.2. Systematic error (bias) 16
1.3.3. Confounding factors 17
1.4. How should the data be analyzed? 17
1.4.1. Descriptive analysis 18
1.4.2. Multivariate analysis 18
1.4.3. Data modeling 18
Step 2: Verification of data quality 18
2.1. Missing data or registries 20
2.2. Validation of the range and data consistency 20
2.3. Verification of dates 21
2.4. Verification of the sequence of doses 23
Step 3: Data analysis 26
3.1. Sociodemographic variables 26
3.2. Coverage in doses administered 28
3.3. Coverage in valid doses 31
3.4. Dropout rate 38
3.5. Timeliness 41
3.5.1. Timeliness 41

2
3.5.2. Average age at vaccination 45
3.5.3. Median age and interquartile range of vaccination 46
3.5.4. Inverted Kaplan-Meier curve 47
3.6. Simultaneity 51
3.7. Series completed 58
Child with complete immunization 58
3.7.1. Number of visits needed to complete the vaccination schedule 60
Step 4: Additional analyses 64
4.1. Logistic regression 64
4.2. Cox proportional hazards model 65
4.3. Poisson regression 65
Annex 1. Weighted samples 66
Annex 2. Design effect 67
Annex 3. Intracluster correlation 68
Annex 4. Steps for creating inverted Kaplan-Meier curves using the R statistical program 69
Annex 5. Steps for analyzing vaccination coverage surveys using SAS statistical software 70
References 71

3
Tables and figures
Table 1. Childhood vaccination schedule, country A, 2011
Table 2. Administrative data coverage and survey results, country A, 2011
Table 3. Estimated vaccination coverage based on administrative data and vaccination registries, Curitiba, Brazil, 2002
Table 4. Detection of unacceptable dates: Vaccines administered prior to the child’s birthday
Table 5. Detection of unacceptable dates: Administration dates after the date of the survey
Table 6. Verification of the sequence of vaccine doses. Part 1
Table 7. Verification of the sequence of vaccine doses. Part 2
Table 8. Verification of the sequence of vaccine doses. Part 3
Table 9. Population surveyed, by sociodemographic variables, country A, 2013
Table 10. Number of children vaccinated, by sociodemographic variables, country A, 2013
Table 11. Number of children aged 12-23 months vaccinated within the first year of life, by data source, country A, 2013
Table 12. Numerators and denominators for calculating coverage, by data source
Table 13. Vaccination coverage and confidence intervals (95%) for vaccines in the basic series, country A, 2013
Table 14. Definition of valid doses for vaccines given during the first year of life
Table 15. Definition of valid vaccination booster doses in the vaccination series
Table 16. Definition of valid vaccination doses for school admission series
Table 17. Definition of valid vaccination for annual influenza vaccine
Table 18. Numerators and denominators for calculating coverage of valid doses, by data source
Table 19. Vaccine doses administered and valid doses, children aged 12-35 months, country A, 2011
Table 20. Vaccine doses administered and valid doses of rotavirus vaccine, children born in 2010, country A, 2011
Table 21. Vaccine doses administered and valid booster doses, children aged 18-35 months, country A, 2011
Table 22. Numerators and denominators to calculate the dropout rate between the first and third doses of pentavalent vaccine, by data source

4
Table 23. Numerators and denominators to calculate the dropout rate between the third dose of pentavalent vaccine and MMR vaccine, by data source
Table 24. Definition of valid doses according to the vaccination schedule, by recommended age of administration of the vaccine series for the first year of life
Table 25. Definition of valid doses according to the vaccination schedule, by recommended age of administration of the vaccine series in the second year of life
Table 26. Definition of valid doses according to the vaccination schedule, recommended age of administration of the school admission series
Table 27. Definition of valid doses of the influenza vaccine, by recommended age of administration
Table 28. Calculation of timely vaccination coverage
Table 29. Calculation of average age at vaccination
Table 30. Calculation of the median age at vaccination and the interquartile range
Table 31. Construction of the inverted Kaplan-Meier curve
Table 32. Calculation of simultaneous administration of vaccines recommended at the same age, Method 1
Table 33. Calculation of simultaneous administration of vaccines recommended at the same age. Method 2
Table 34. Calculation of simultaneous administration of all vaccines recommended at the same age, Option 1
Table 35. Calculation of simultaneous administration of all vaccines recommended at the same age. Option 2
Table 36. Calculation of children with complete immunization according to the national schedule
Table 37. Calculation of children with complete immunization by age, according to the national schedule
Table 38. Calculation of number of visits needed to update a child’s vaccination schedule
Figure 1. Relationship between variables and confounding factors
Figure 2. Percentage (%) of children aged 24-35 months who received MMR1 vaccine, by household income quintile, country A, 2013
Figure 3. Probability of having received the second dose of pentavalent vaccine, by birth cohort in the coverage survey, country A, 2011
Figure 4. Probability (CI 95%) of having received the second dose of pentavalent vaccine, by birth cohort in the coverage survey, country A, 2011

5
Figure 5. Probability (%) of having received all vaccines beginning at age 6 months, by birth cohort, country A, 2011

6
Introduction
After deciding to conduct a coverage survey, countries must follow a series of steps to ensure that results will be valid and precise. For information on ethical and methodological aspects of coverage surveys, please see Module 5.
The present module describes specific concepts and tools that are used to analyze data from vaccination surveys and nominal registries, including elements related to the data analysis plan and strategy, the steps for validating data quality, the application of a descriptive analysis and data modeling tools, and the correct interpretation of results.

7
Unit 1. Analysis of data from surveys and nominal registries
This unit reviews tools for different types of analysis of vaccination data from household survey databases and electronic nominal vaccination registries. The following diagram outlines the steps of these analyses, which will be described in detail below.
The process of analyzing data from immunization surveys and nominal registries begins by designing the protocol, defining the variables needed to create indicators, and establishing the steps necessary to collect, record, and manage data properly. The analysis’s success depends on high data quality, the proper application and correct interpretation of descriptive statistical tools, and the use of complex analytic methods, including multivariate analysis and data modeling.

8
Step 1: Definition of the analysis plan The first step of data analysis is defining the evaluation plan. Plans make it possible to obtain results that are consistent with the survey protocol’s objectives and the indicators used to monitor coverage of the immunization schedule. The evaluation team must define the variables, data, information sources, steps for monitoring data quality, and analysis tools.
1.1. What is being analyzed?
In establishing the data analysis plan, if a survey is used, the team should review the survey protocol, the variables and their categories in the questionnaire, the method for data collection, the analysis’s proposed objectives, and the study’s hypotheses. If a nominal registry will be evaluated, the team should review the definition of each variable that will be used.
The national immunization schedule is a good starting point for defining the analysis plan, as it is the basis for building indicators that demonstrate that program coverage goals for all target populations have been reached.
Table 1 outlines an example vaccination schedule that provides the basis for calculating coverage and quality indicators for the child immunization service in this module.

9
Table 1. Childhood vaccination schedule, country A, 2011
Age Vaccine Dose
Birth BCG (tuberculosis) 1st dose
2 months Polio
1st dose Pentavalent Rotavirus
4 months
Polio
2nd dose Pentavalent
Rotavirus
6 months Polio
3rd dose Pentavalent
12 months Measles, mumps, and rubella (MMR) 1st dose Yellow fever
18 months Polio
1st booster Diphtheria, pertussis, tetanus (DPT)
4 years
Polio 2nd booster
DPT
MMR 2nd dose
6-35 months Influenza Annual
Based on the available evidence, the PAHO Technical Advisory Group (TAG) and the WHO Strategic Advisory Group of Experts on Immunization (SAGE) have made a series of recommendations for vaccination schedules, including the number and order of doses in the series, in order to maximize vaccine effectiveness and minimize the period in which children are vulnerable to vaccine-preventable diseases (VPDs). More information can be obtained from a summary of WHO position papers on childhood vaccination at: http://www.who.int/immunization/policy/immunization_tables/en/. Accordingly, for example, an immunization series according to the child’s age might be: Age <1 year:
o Tuberculosis: BCG (Bacillus Calmette-Guérin)
o Hepatitis B: At birth
o Pentavalent (diphtheria, tetanus, pertussis, Haemophilus influenzae type b, and hepatitis B): First, second, and third doses
o Polio: First, second, and third doses of OPV

10
o Pneumococcal (conjugate): First, second, and third doses
o Rotavirus: First and second, or first, second, and third doses
Age 1-2 years:
o MMR (measles, mumps, and rubella) or double viral (measles and rubella): First and second doses
o Yellow fever
o Pneumococcal (conjugate): Booster
o DPT (diphtheria, tetanus, and pertussis): First booster
o Polio: First OPV booster
Age 4-6 years:
o DPT: Second booster
o Polio: Second OPV booster
o MMR or MR: Second dose
Starting at age 6 months, the influenza vaccine is recommended once a year for children aged <5 years. If the child is aged <9 years and receiving the vaccine for the first time, he or she should receive a second dose of the same vaccine a minimum of 28 days later.
PAHO/TAG has also issued a recommendation on the schedule of pneumococcal conjugate vaccine (PCV) for infants (Box 1) (1).
In analyzing the vaccination schedule, the team should know the year(s) of new vaccine introduction and details about any changes in the schedule. If new vaccines were introduced, or if the schedule was modified during the study period, this information should be incorporated into the analysis. Likewise, campaigns or national health days offered during the study period must be taken into account.
Box 1. Recommendations of the PAHO Technical Advisory Group on Pneumococcal vaccine, 2011
“Countries should consider three doses of the pneumococcal conjugate vaccine as the minimum for a vaccination schedule. The administration options can be 3 doses (primary series) without a booster or 2 doses (primary series) with a booster for children aged between 12 and 15 months, taking into account the epidemiological profile of the disease in each country. ...
“Countries should base the decision regarding the option of opting for a 3 dose schedule (primary series) without booster or a 2 dose schedule (primary series) with a booster for children aged between 12 and 15 months, mainly on the burden of the pneumococcal disease of the country and pneumonia mortality in children aged <2 years. If the country has a high burden of disease and a high mortality in children aged <7 months, the country should opt for the 3 dose schedule in the primary series; if the burden of disease and mortality is more important in children aged >7 months, the country could consider using the 2 dose schedule in the primary series with a booster.”

11
Coverage surveys also provide the opportunity to compile data from other programs on breastfeeding, oral rehydration, and deworming of soil-transmitted helminths,1 etc.
1.1.1. Coverage
Immunization programs aim to achieve sufficient coverage to reach the desired level of immunity among the population (herd immunity). Coverage indicators for survey or nominal registries are thus calculated based on the number of vaccine doses administered and an estimate of the valid vaccine doses administered.
To estimate coverage, the study team must calculate the main trend, average, median, and interquartile ranges. Based on the criteria below, the team should also determine if the minimum acceptable coverage was achieved:
If coverage is 95-100%, the coverage and immunological protection are adequate. If coverage is <95%, the immunization’s coverage goal was not was not reached.
1.1.2. Immunization service quality
To calculate indicators on immunization service quality, the study team can analyze timeliness of administration of each vaccine; completion of the basic series and boosters needed to achieve immunity; missed opportunities to administer vaccines that should have been given simultaneously; availability of the child’s health card or other proof of vaccination; and consistency among different data sources.
1.1.3. Factors related to coverage and quality
Surveys and electronic nominal immunization registries provide opportunities to analyze coverage and service quality indicators in terms of such factors as healthcare access, education, job type, age of the mother, household income, and other aspects of sociodemographic development. Questions on access to vaccination are useful for determining if barriers depend on the population (e.g., refusal to vaccinate, not knowing that vaccination was required, etc.) or problems in the delivery of services (e.g., hours of vaccination or shortages of biologicals).
1.2. Which data sources will be used?
1.2.1. Administrative data
Administrative data are calculated using the vaccine doses administered as the numerator and the estimated population of the target age group as the denominator. The denominator may be the population of a specific area or of the entire country. Administrative data are different than survey and registry data in that they do not contain information on individual children’s age at vaccination or the interval between doses. Administrative data do not have information on children’s ages at vaccination or the interval between doses. For this reason, as explained in Module 2, the data making up the numerator may have limitations:
1In these modules, deworming refers to the treatment of soil-transmitted helminths.
12
Underestimation due to incomplete data from the reporting units or failure to consider other sources of vaccination (e.g., private sector or nongovernmental organizations).
Overestimation due to excess data from the reporting units (e.g., because other target populations or age groups were included).
Inaccuracies in the denominator may be due to:
Displacement of populations between geographic areas.
Limitations in calculating population estimates from censuses.
Use of multiple data sources.
1.2.2. Surveys
The standard methodology developed by the WHO for assessing immunization coverage is based on a small numbers of individuals. Teams visits home and/or analyze immunization records and registries to calculate coverage. The surveys use a cluster sampling technique to allow extrapolation from a small sample of homes to the larger population. However, the data could only be used aggregate (2,3). While immunization coverage surveys primarily seek to estimate coverage for selected vaccines (for infants and/or women), it is also possible to simultaneously collect other information, which is usually not available through routine monitoring systems (4).
Using surveys, the team may compile vaccination data from:
Health cards or other vaccination certificates kept by the family. These sources also provide information on the card retention rate and distribution of health cards (5).
Health facility files, from which field teams can collect and record the vaccines administered and the dates of administration.
The memory of parents and guardians, although these are increasingly not accepted as a valid source of vaccination data. If verbal verification is used as a source of vaccination data, the team may record the vaccines administered but not the exact dates of immunization.
Survey data are weighted—i.e., a value is assigned to each individual’s data based on the child’s probability of selection in the survey. Weighting makes it possible to use the data to describe the entire population rather than only children in the survey.
In presenting coverage indicators based on survey data, the team should remember to include confidence intervals for the estimate. These intervals indicate the uncertainty of the point estimate due to the small number of children used to represent a larger universe. A confidence interval of 95% is customary, but other intervals, such as 90%, can be used.
When administrative or nominal registry data are used, the team does not need to weight the data or include confidence intervals, since the uncertainty of the data cannot be estimated as these sources cover the whole population. Weighting is used to calculate the point estimates and confidence intervals for the examples from country A in this guide. For further information, please see the Annexes.

13
Several types of surveys have been used to estimate vaccination coverage, most the notably demographic and health survey (DHS) and the multiple indicator cluster survey (MICS).
Demographic and health surveys can be downloaded for free from the Internet and are a good source of vaccination data (6). Generally, the surveys are done every five years in select countries with sample sizes of 5,000-30,000 households.
DHS data contain extensive information on population indicators, including vaccines administered to participants aged <5 years and other indications of the children’s nutritional and health status. In addition, the surveys have high participation rates (few unanswered questions) Given that the questionnaires only collect data on vaccines recorded on vaccination cards, if the health card retention rate is lower than the population sample being surveyed, inferences on immunization coverage or compliance with the schedule may be limited.
DHS data are representative of the country’s entire population as long as the corresponding weight is applied to each child in the survey. The studies also provide representative estimates for certain subgroups (e.g., rural or urban populations), called survey domains or study domains. But DHS data cannot be used to calculate measurements of geographic or politico-administrative units any smaller than those at the regional level, since regional units are their smallest domain.
DHS data are broken down into multiple files. Vaccination data around found in the file for children. There are two types of databases—hierarchical and rectangular. The database must be rectangular in order to use programs like SAS, STATA, or SPSS.
Information on coding variables for DHS datasets, with recommendations for analysis, can be found in the Recode Manual: http://dhsprogram.com/pubs/pdf/DHSG4/Recode6_DHS_22March2013_DHSG4.pdf (7-8). DHS 6 is the most recent version and provides information on surveys from 2008-2013 (9).
The multiple indicator cluster survey was developed in the mid-1990s to help countries produce internationally comparable statistics. The MICS has groups of indicators for health, education, child protection (including vaccination), and HIV/AIDS in children and women that are were used to monitor fulfillment of the Millennium Development Goals and are now used to monitor the Sustainable Development Goals.
In collaboration with other United Nations agencies, UNICEF has developed a tool, called DevInfo, to store MICS data. DevInfo is an easy-to-use suite of standardized electronic support software that provides a single integrated data entry point for the MDG indicators and disseminates information simply and efficiently. MICS results, including national reports and databases, are available at: http://www.unicef.org/statistics/index_24302.html.
1.2.3. Nominal registries
Ideally, electronic vaccination records should link each child to individual data on vaccines given and dates of administration. The denominator may come from the official record of live births or be derived from the registry itself by using the entire cohort who received the same vaccine (e.g., BCG administered or an infant registered with reasons for non-application, for example) at birth. Good nominal registries monitor real-time coverage and send reminders to children’s parents or guardians, and the registries may also be linked to other medical records.

14
If working well, nominal registries can improve data quality. But the registries are limited in the quality of variables on the vaccines administered to each child and in the entry of all of an individual child’s data over time. Gaps in registry data can lead to inaccurate inferences and affect the analysis’s validity. The immunization program must ensure, then, that the birth registry is complete and that all changes related to deaths, immigrations, and emigrations have been incorporated into the database.
Each nominal registry should have a single identification code (e.g., a national identification number) corresponding to the child’s full name and birthdate and data on the mother. These registries facilitate individualized monitoring, including of children with incomplete schedules, and therefore make it possible to obtain coverage data by cohort. They can also be used to aggregate data by geographic strata or management area and to analyze sociodemographic variables, including residence, mother’s educational level, and the site of vaccine administration (i.e., public or private facility).
Table 2 compares coverage estimates derived from surveys and administrative registries.

15
Table 3 refers to a 2011 study by Luhm et al. in which investigators used registry data to evaluate the immunization program in Curitiba, a city in southern Brazil (10). Researchers selected a random sample from the registries, supplementing it with information from a household survey when registry data were incomplete. They then compared results to administrative data. Luhm’s study showed that registries can improve data quality in a properly functioning system. The authors emphasize the importance of ensuring that registry data are complete before using them to analyze the immunization program.
Other recent studies have evaluated the completeness of registries and their concordance with other written documents. In 2014, in Belgium, Braeckman et. al found that the coverage calculated from the registry was lower than estimates obtained from health cards for each vaccine dose, and that physicians frequently recorded different dates than those shown in documents based on the cards (11).
Table 2. Administrative data coverage and survey results, country A, 2011
Vaccine
Administrative data Coverage per survey results
(CI 95%)
Doses administered
(n)
Coverage using target
population per census
projection (%)
BCG 113,048 76 93 (92-94)
Polio vaccine, 1st dose 113,986 77 95 (95-96)
Polio vaccine, 2nd dose 113,269 76 94 (93-95)
Polio vaccine, 3rd dose 112,222 75 91 (89-92)
Pentavalent, 1st dose 114,015 77 95 (94-96)
Pentavalent, 2nd dose 113,269 76 94 (93-95)
Pentavalent, 3rd dose 112,222 76 90 (89-91)
Rotavirus, 1st dose 109,299 74 88 (86-91)
Rotavirus, 2nd dose 106,349 72 83 (80-85)
MMR 113,494 77 88 (87-90)
Malaria 109,781 74 86 (84-87)

16
Table 3. Estimated vaccination coverage based on administrative data and vaccination registries, Curitiba, Brazil, 2002
Vaccine
Coverage
Administrative data (%)
Registry data (CI 95%)
BCG 98.6 99.9 (99.9-100.0)
DPT + Haemophilus influenzae type b (three doses) 94.3 96.7 (96.0-97.4)
Polio (three doses) 93.3 96.8 (96.1-97.5)
Hepatitis B (three doses) 93.1 97.3 (96.7-97.9)
Source: Luhm KR, et al., 2011
In each calculation, all children in the denominator should have the opportunity to be part of the numerator. To be included in the analysis, children in a survey or registry should be of the recommended age for the dose under evaluation. In country A, some children were not aged 18 months at the time of the survey and were ineligible for the MMR booster and oral polio vaccines. Although younger children had received the boosters, the analysis of these doses should be limited to children aged >18 months at the time of the survey. Another consideration for the analysis is that the vaccine studied must have been available to the children in the registry or participating in the survey. In survey data from country A, some children were ineligible for the rotavirus vaccine because it was not yet part of the routine schedule when these children were at the age recommended for its administration. That said, nearly half the children were born after introduction of the rotavirus vaccine and were eligible to receive it. All rotavirus vaccine analyses are thus limited to these children; likewise, all children in the numerator must be included in the denominator.
1.3. How will data quality be monitored?
1.3.1. Random error
A random error is not specific to a particular group—i.e., the same probability exists that any group might experience the error. Examples of random errors in registries are the dates of vaccine administration, since they are not associated with a particular interviewer (a systematic error) or a clinic with problems maintaining registries (also a systematic error). Random errors are taken into account in the 95% confidence intervals.
1.3.2. Systematic error (bias)
A systematic error, also called bias, is one that affects different groups differently. If, for example, interviews are conducted only on working days between 9:00 am and 5:00 pm, children with caregivers who work outside the home during this time will be less likely to be included. This is a problem because the characteristics of these children may differ from those whose caregivers remain at home or work at night.
17
Another systematic error would be limiting the analysis to vaccine doses recorded with dates on the children’s health cards. Since children without cards probably have less access to vaccination services, their delays are greater, and it would be misleading to only include children with cards when making inferences about those who do not have cards.
To reduce the possibility of bias in coverage surveys, evaluation teams should try to obtain complete and reliable vaccination data. While the card is the official record carried by the child’s family, when that document is not available, the team should try to obtain data from other sources, such as verbal verification or a review of health facility records.
In 2009, PAHO-TAG identified other sources of bias, including the phrasing of some questions in vaccination surveys, training given to interviewers, data collection processes, and the analysis of results (12). Additional information can be found in the 2009 PAHO-TAG report: http://www2.paho.org/hq/dmdocuments/2010/tag18_2009_Final%20Report_Eng.pdf.
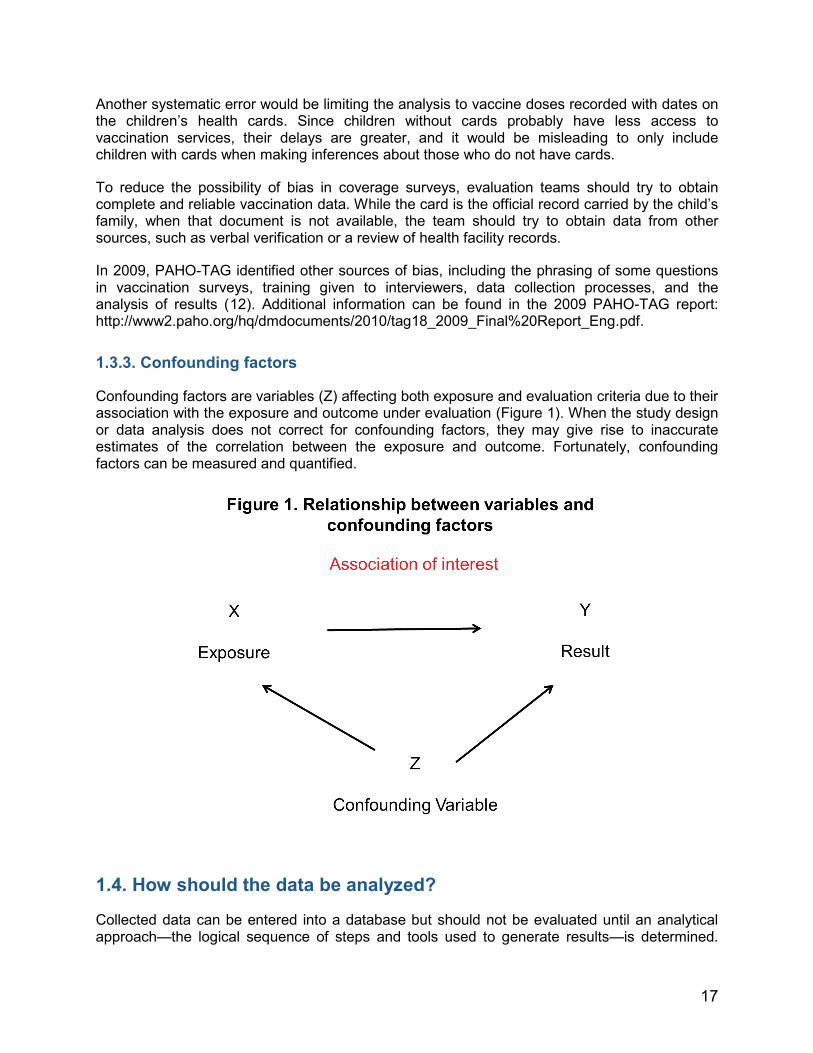
1.3.3. Confounding factors
Confounding factors are variables (Z) affecting both exposure and evaluation criteria due to their association with the exposure and outcome under evaluation (Figure 1). When the study design or data analysis does not correct for confounding factors, they may give rise to inaccurate estimates of the correlation between the exposure and outcome. Fortunately, confounding factors can be measured and quantified.
1.4. How should the data be analyzed?
Collected data can be entered into a database but should not be evaluated until an analytical approach—the logical sequence of steps and tools used to generate results—is determined.

18
Descriptive statistics and multivariate analysis are used to this end. Data modeling techniques are also used for more complex analyses.
1.4.1. Descriptive analysis
To establish the strategy for descriptive analysis, it is necessary to understand how the data were collected. In analyzing survey data, for example, the team must understand the sampling design to conduct the study taking into account the design and applying the necessary weights before selecting the most pertinent variables for preparing the frequency distributions and constructing the indicators. The process involves the following phases:
Identifying and describing the variables to be analyzed, keeping in mind the scope and limitations of the data and sample size (see Annex 1).
Estimating the standard error for each variable. Weighting results (see Annex 2). Taking into account the design effect (see Annex 3). Building output tables with crossed variables based on the study design, keeping in mind
the results needed to meet the survey’s objectives. Preparing frequency distributions for sociodemographic variables. Building indicators to assess the coverage and quality of the vaccination service by time,
place, and person. Calculating the central tendency of coverage indicators—average, median, and
interquartile ranges. Calculating the statistical significance of the frequency of variables in output tables
(using chi-squares test or Student’s t-distribution) to determine if results are due purely to chance.
1.4.2. Multivariate analysis
After completing the descriptive analysis, the team may undertake more complex analyses using data stratification techniques and multivariate modeling. A stratified analysis is useful to detect confounding factors and to determine the effect of more than one exposure or factor on the results. To this end, the team may calculate measures of association, such as relative risk and odds ratios, to determine the strength of association between an exposure and outcome.
1.4.3. Data modeling
This technique adjusts data using statistical equations and analytical models—e.g., logistic regression, which examines a binary dependent variable as it relates to different independent variables. Since statistical models are complex, computer programs are required. Different models are used to analyze survey data, such as logistical regression and the Cox proportional hazards model when working with life tables (mortality tables), among others.
Step 2: Verification of data quality

19
In analyzing surveys and applying automated systems to examine nominal vaccination registries, the team must verify the quality of data at each step of the process. Computer software programs should be able to check for discrepancies as data are entered, thereby making it possible to correct errors quickly.
During the analysis phase, the team can critically evaluate the data by using tools to verify the trajectory (statistical range), the data’s completeness and consistency, and the dates of vaccination and life events. To assist countries with these analyses, PAHO will soon publish the “Electronic Immunization Registry: Practical Considerations for Planning, Development, Implementation and Evaluation.”
The study team should document the data cleaning process and note any changes made. Information on the percentage of registries with unlikely dates may be useful for a published report, data collection in future surveys, and the documentation of practices in first-line health care facilities.
Several types of errors exist:
In the document where data are recorded (i.e., the health or vaccination card, health facility files, etc.) due to:
o Misreporting the time of service (e.g., incorrectly entering the date of vaccination).
o Inability to access the health or vaccination card in the health establishment. This may occur if vaccines were administered in multiple establishments and lead to incomplete files and monitoring problems.

20
o Combination vaccines or vaccines registered with the commercial names of the products—i.e., those containing several antigens, such as pentavalent or MMR vaccine. In this regard, vaccines should be recorded according to their individual components—e.g., the pentavalent vaccine should be listed as DPT plus H. influenzae type b and hepatitis B, all with the same administration date.
Indecipherable letters or numbers on the health card or in health facility files due to:
o Disorganized files.
o Illegible handwriting.
o Poor storage conditions.
o Deterioration of the cards.
Errors in the transfer of information when:
o Data in files are copied onto data collection forms.
o Data are entered into an electronic database.
2.1. Missing data or registries
To minimize data errors, the study team must confirm that the number of registries is correct and that no data are duplicated. The use of electronic records removes some sources of error by eliminating several steps in data input, improving communication among health facilities, and avoiding problems related to maintaining hardcopy files.
The importance of checking and completing the information depends on its effect on the analysis. This is particularly relevant for small studies, where missing information on key variables significantly alters results. Conversely, missing data on less important variables is more easily tolerated. Values should never be changed because they “don’t look right.”
2.2. Validation of the range and data consistency
In monitoring quality, the evaluating team must verify the data’s range and logic. The range shows, for each variable, when values are outside certain limits—i.e., when they are impossible and thus unacceptable (this process will be described in detail for dates and ages of vaccine administration). After detecting the error, the team must determine if it is possible to verify the information source and correct the mistake, and then if the information should be left as entered or removed because it was clearly an error.
The following quality indicators should be calculated as a number and percentage:
Households visited relative to the number of homes in the sampling frame.
People interviewed relative to the total in the sample.
Questionnaires completed (response rate).
Data omitted in questions on vaccination and “I don’t know” responses.
Confirmed vaccine doses on the health card (and of these, data on which there is a mark but not a date).
Vaccine doses verified in the vaccination registries of health centers.

21
Vaccines doses recorded based on verbal verification.
2.3. Verification of dates
Some procedures to correct dates of vaccine administration are described below.
Double data entry helps to minimize, though not entirely eliminate, errors in transferring information from hardcopy files to an electronic database system.
Some obvious data input errors (e.g., unlikely dates) can be changed during the correction phrase. If the original source document is available, this information can be compared to the registry or data collection form, or the child’s photograph on the card can be compared to the health facility records. The erroneous data may be then be corrected or deleted.
Following the steps in Tables 4-8, the evaluation team may correct other obvious data input errors by identifying unlikely dates or comparing the dates of vaccines that were scheduled to be given on the same day.
Unacceptable dates: vaccines administered prior to the child’s date of birth.
Table 4. Detection of unacceptable dates: Vaccines administered prior to the child’s date of birth
Steps Examples
1. Look for administration dates prior to each child’s birthday for each vaccine dose. Dates may be acceptable even if the dose is considered invalid.
Acceptable: Date of birth: 29 February 2012 1st pentavalent dose: 30 April 2012 Unacceptable: Date of birth: 29 February 2012 1st pentavalent dose: 30 April 2011
2. If possible, check the original source.
The error may have occurred during data capture or entry. As in the previous example, checking the original source may show that the year of administration was incorrectly recorded.
3. When step 2 is not feasible, compare administration dates to those of vaccines scheduled for simultaneous application.
1st pentavalent dose: 30 April 2011 Date of birth: 29 February 2012 1st polio dose: 30 April 2012 2nd pentavalent dose: 25 June 2012 2nd polio dose: 25 June 2012 In this example, the unlikely year is assumed to be due to a data entry error, given the administration dates of the 1st dose of polio vaccine and the 2nd doses of pentavalent and polio.

22
4 . When unacceptable dates detected in steps 2 or 3 cannot be corrected, eliminate the dates and doses with administration dates prior to the child’s birthday.
1st pentavalent dose: 30 April 2011 Date of birth: 29 February 2012 2nd pentavalent dose: 25 June 2012 2nd polio dose: 25 June 2012
If there are no data indicating a correct administration date, as in the previous example, the 1st pentavalent dose should be recoded as “not administered” but without an administration date.
5. Verify that all changes have been correctly made.
If the year of administration has changed, confirm that the date of the 1st pentavalent dose is now recoded as 30 April 2012.
Unacceptable dates: Administration dates after the date of the survey.
Table 5. Detection of unacceptable dates: Administration dates after the date of the survey
Steps Examples
1. Look for administration dates after the date of the survey for each child and vaccine dose. Dates may be acceptable even if the dose is considered invalid.
Acceptable: 2nd polio dose: 30 December 2010 Date of survey: 1 December 2012 Not acceptable: 2nd polio dose: 30 December 2012 Date of survey: 1 December 2012
2. If possible, check the original source.
The error may have occurred during data collection or entry. As in the previous example, checking the original source may show that the year of administration was incorrectly recorded.
3. When step 2 is not feasible, compare administration dates to those of vaccines scheduled for simultaneous application.
1st polio dose: 1 April 2010 2nd pentavalent dose: 30 December 2010 3rd polio dose: 15 February 2011 Date of the survey: 1 December 2012 2nd polio dose: 30 December 2012 In this example, the unlikely year is assumed to be due to a data entry error, given the administration dates of the 1st and 3rd doses of polio vaccine and the 2nd pentavalent dose.

23
4. When unacceptable dates detected in steps 2 or 3 cannot be corrected, eliminate the dates and doses with administration dates prior to the date of the survey.
1st dose of polio: 1 April 2010 Date of the survey: 1 December 2012 2nd dose of polio: 30 December 2012 2nd dose of pentavalent: 30 December 2012 3rd dose of polio: 15 February 2013 If there are no data indicating a correct administration date, as in the previous example, all vaccine doses with unacceptable dates should be recoded as “not administered” but without a date of administration.
5. Verify that all changes have been correctly made.
If the year of application has changed, confirm that the administration date of the 2nd dose of polio vaccine is now recoded as 15 December 2010.
2.4. Verification of the sequence of doses First: Ensure that multiple doses of the same vaccine do not have the same administration date.
Table 6. Verification of the sequence of vaccine doses. Part 1
Steps Examples
1. Look for matching administration dates for two or more doses of the same vaccine for each child and vaccine. Dates may be acceptable even if the dose is considered invalid.
Acceptable: 1st polio dose: 29 July 2009 2nd polio dose: 22 August 2009 3rd polio dose: 29 October 2009 Unacceptable: 1st polio dose: 29 July 2009 2nd polio dose: 29 July 2009 3rd polio dose: 29 October 2009
2. If possible, check the original source.
The error may have occurred during data collection or entry. As in the previous example, checking the original source may show that the date of administration was incorrectly recorded.

24
3. When step 2 is not feasible, compare administration dates against those of vaccines scheduled for simultaneous application.
1st polio dose: 29 July 2009 2nd polio dose: 29 July 2009 3rd polio dose: 29 October 2009 1st pentavalent dose: 22 August 2009 2nd pentavalent dose: 22 August 2009 3rd pentavalent dose: 29 October 2009 1st rotavirus dose: 29 July 2009 2nd rotavirus dose: 22 August 2009 In this example, the unlikely year is assumed to result from a data entry error and that the 1st doses of pentavalent and polio vaccine were administered on 29 July 2009 and that the second doses of these vaccines were administered on 22 August 2009.
4. When unacceptable dates detected in steps 2 or 3 cannot be corrected, eliminate the dates and doses with administration dates that cannot be validated.
1st polio dose: 29 July 2009 2nd polio dose: 29 July 2009 3rd polio dose: 22 August 2009
1st pentavalent dose: 29 July 2009 2nd pentavalent dose: 22 August 2009 3rd pentavalent dose: 29 October 2009
If there are no data indicating a correct administration date, as in the previous example, the 2nd polio dose should be recoded as 22 August (to match the 2nd pentavalent dose) and the 3rd polio dose should be recoded as “not administered.”
5. Verify that all changes have been correctly made.
If the year of application has changed, confirm that the administration date of the polio and pentavalent vaccines is now 29 July 2009 and that the date of the 2nd dose of these vaccines is 22 August 2009.
Second: Verify that the order and administration dates of all doses correspond to sequential doses of the same vaccine.
Table 7. Verification of the sequence of vaccine doses. Part 2
Steps Examples
1. Look for administration dates that are out of order for each child and vaccine. Dates may be acceptable even if the dose is considered invalid.
Acceptable: 1st pentavalent: 10 February 2012 2nd pentavalent: 22 February 2012 3rd pentavalent: 26 May 2012 Unacceptable: 1st pentavalent: 10 February 2012 2nd pentavalent: 26 May 2012 3rd pentavalent: 22 February 2012

25
2. If possible, check the original source.
The error may have occurred during data collection or entry. As in the previous example, checking the original source may show that the date of administration was incorrectly recorded.
3. When step 2 is not feasible, compare the administration dates to those of vaccines scheduled for simultaneous application.
1st pentavalent: 10 February 2012 2nd pentavalent: 26 May 2012 3rd pentavalent: 22 February 2012 1st polio: 10 February 2012 2nd polio: 22 February 2012 3rd polio: 26 May 2012 In this example, a data input entry liked occurred and the dates of the 2nd and 3rd doses of pentavalent vaccine were accidentally entered in reverse order.
4. Verify that all the changes have been made correctly.
If the year of application is changed, confirm that the 2nd pentavalent dose is now recoded as 22 February 2012 and the 3rd dose of pentavalent is 26 May 2012.
Third: Confirm that the previous doses were not missing when the last doses were administered.
Table 8. Verification of the sequence of vaccine doses. Part 3
Steps Examples
1. Look for any child who has not had the previous doses of a vaccine but who has received subsequent doses of the same vaccine.
Acceptable: 1st polio dose: 29 July 2009 2nd polio dose: 22 August 2009 3rd polio dose: 29 October 2009 Unacceptable: 1st polio dose: 29 July 2009 2nd polio dose: skipped 3rd polio dose: 29 October 2009
2. If possible, check the original source.
The error may have occurred during the data collection or entry. As in the previous example, checking the original source may reveal the date of administration was incorrectly recorded.
3. In this case, the doses scheduled for simultaneous administration cannot be compared.
1st polio dose: 29 July 2009 2nd polio dose: skipped 3rd polio dose: 29 October 2009 1st pentavalent dose: 29 July 2009 2nd pentavalent dose: 22 August 2009 3rd pentavalent dose: 29 October 2009 The fact that the 2nd pentavalent dose has been given does not mean that the 2nd dose of polio has been given.
26
4. Recode the original data so that the later doses take the place of the skipped doses, keeping the actual administration date, and recode the subsequent doses as “not administered” without administration dates.
Original data: 1st polio dose: 29 July 2009 2nd polio dose: skipped 3rd polio dose: 29 October 2009 Recoded version: 1st polio dose: 29 July 2009 2nd polio dose: 29 October 2009 3rd polio dose: not administered The 2nd dose of polio vaccine has been recoded to show the information from the 3rd dose, and the 3rd polio dose is recoded as “not administered” without an administration date.
5. Verify that all changes have been correctly made.
If these changes are made, confirm that the administration date of the 2nd dose of polio is now 29 October 2009 and that the date of the 3rd dose now shows as “not administered.”
Step 3: Data analysis Before calculating indicators and applying multivariate analysis or data modeling, the study team should generate output tables of key variables to characterize the study population and obtain frequency distributions of the data for use in constructing indicators. Methods for data analysis are reviewed below.
3.1. Sociodemographic variables

27
The first step in creating the reports is to characterize the study population using tables that show the absolute and relative distribution of study subjects by sex, age, place of residence, and other sociodemographic variables (Table 9).
Table 9. Population surveyed, by sociodemographic variables, country A, 2013
Variable Characteristic Number Percentage
Sex Male Female
Residence Urban Rural
Mother’s age1 (years)
<20 20-29 30-39 ≥40
Mother’s education
None Primary Secondary University
Wealth quintile2
1st quintile 2nd quintile 3rd quintile 4th quintile 5th quintile
Other 1Generally, in coverage surveys, only the mother's age is used because it will almost always be available. However, the team can modify the variable to mother or caregiver. 2The variable "wealth quintile" should be defined in each survey. In a registry, the quintile will not likely exist but an approximation can be used.
Coverage surveys and nominal registries make it possible to create indicators that not only estimate coverage by geographic area but also show differences in coverage by different sociodemographic variables (Table 10).
Table 10. Number of children vaccinated, by sociodemographic variables, country A, 2013
Variable
BCG
Pentavalent Polio
Other 1 2 3 1 2 3
Sex Male Female

28
Residence Urban Rural
Mother’s age
(years) <20 20-29 30-39 ≥40
Mother’s education
None Primary Secondary University
Wealth quintile 1st 2st 3rd 4th 5th
Other
3.2. Coverage in doses administered
Regardless of the type or source of data, the basic formula to calculate coverage is:
Before calculating and interpreting the coverage, the team must understand the quality of the data source on vaccines administered. To this end, the team must create tables showing the source of vaccination data—health card or verbal report. A sample table with some vaccines in the schedule is shown below (Table 11).
Table 11. Number of children aged 12-23 months vaccinated within the first year of life, by data source, country A, 2013
Vaccine Vaccinated at any age prior to the survey per: Vaccinated
before age 12 months Health card Verbal report Either
Basic coverage formula
Doses administered Target population

29
Tuberculosis (BCG) Polio
1st dose 2nd dose 3rd dose
DTP 1st dose 2nd dose 3rd dose
Hepatitis B 1st dose 2nd dose 3rd dose
All vaccines No vaccine Number of children aged 12-23 months Numerators and denominators Interpretation of coverage indicators depends on clearly established numerators and denominators to calculate data from different sources (Table 12).
Table 12. Numerators and denominators for calculating coverage, by data source
Variable Administrative data Survey Registry
Numerator Number of doses administered
Number of children in the survey who received vaccines
Number of children in the registry who received vaccines
Denominator
Target population (e.g., children aged <1 year, census population, projection, or birth records minus deaths)
Number of children in the survey
Number of children in the registry
Below is a sample coverage calculation using administrative and survey data from country A.

30
* Survey data must be weighted—i.e., a value should be assigned to each child’s data based on his or her probability
of selection. This makes it possible to characterize the entire population rather than only the children in the survey (Annex 2). For practical purposes, this example shows a gross coverage estimate (86.6%), assuming that all children had the same probability of selection. The MICS and DHS surveys already contained weighted variables. If only one child was selected from each household that had more than one eligible child, this weight must be taken into account.
.
Coverage results for the immunization schedule are displayed in tables and figures that should show the estimated coverage, the 95% confidence intervals, and other data, such as the size of the survey population (Table 13).
Table 13. Vaccination coverage and confidence intervals (95%) for vaccines in the basic schedule, country A, 2013
Vaccine n Coverage (%) Confidence interval
(95%)
Lower Upper
Tuberculosis (BCG) 1,430 97.9 97.2 98.6
Hepatitis B, 1st dose 1,430 98.0 97.3 98.7
Hepatitis B, 2nd dose 1,352 95.3 94.2 96.5
Hepatitis B, 3rd dose 1,213 88.7 86.9 90.5
Hib, 1 1,352 97.6 96.7 98.4
Hib, 2 1,283 97.0 96.1 98.0
Hib, 3 1,213 94.4 93.1 95.7
There are other ways to calculate coverage from a survey or registry:
Third dose of pentavalent vaccine Administrative data
112,222 3rd doses of pentavalent vaccine administered to children aged <1 year 148,630 children aged <1 year in the target population
= 75.5 %
Survey data*
2,874 children who received the 3rd dose of pentavalent vaccine 3,319 children aged ≥365 days in the survey
= 86.6 %

31
The denominator can be only the number of children born in a given year, while the numerator can be the children aged <12 months vaccinated in the same year. These figures are equivalent to the coverage of children aged <1 year in a given birth cohort.
The analysis can be limited to children with written records of vaccination, where the denominator is the number of children with documentation of any vaccine dose. However, results of this analysis are not representative of the entire population, as they exclude children without documentation.
As shown in Figure 2, the team must also stratify and present coverage of the immunization schedule according to socioeconomic variables and other demographic factors and show coverage estimates for each indicator with 95% confidence intervals.
3.3. Coverage in valid doses
No vaccine is 100% effective. The degree of immunity achieved depends on the vaccine being administered at the indicated age and per the recommended schedule. Thus, in addition to estimating coverage of the vaccines administered, the evaluation team should also determine if vaccine were given at the appropriate age and with the recommended intervals between doses (13).
Valid doses are those given when the child has reached the minimum age for a particular vaccine or has reached the minimum number of days following administration of the previous dose in the series. Invalid doses leave children vulnerable to VPDs. The analysis and formula below determine the proportion of valid doses administered for each vaccine, regardless of the data type.
32
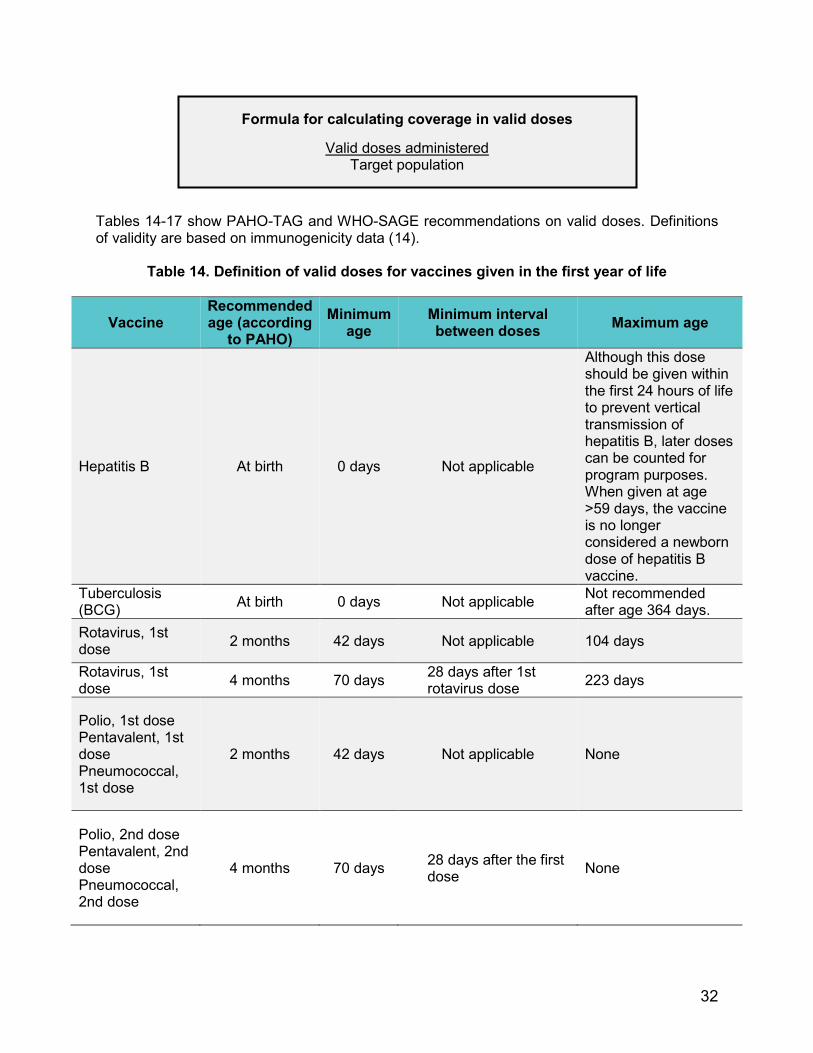
Tables 14-17 show PAHO-TAG and WHO-SAGE recommendations on valid doses. Definitions of validity are based on immunogenicity data (14).
Table 14. Definition of valid doses for vaccines given in the first year of life
Vaccine Recommended age (according
to PAHO) Minimum
age Minimum interval between doses Maximum age
Hepatitis B At birth 0 days Not applicable
Although this dose should be given within the first 24 hours of life to prevent vertical transmission of hepatitis B, later doses can be counted for program purposes. When given at age >59 days, the vaccine is no longer considered a newborn dose of hepatitis B vaccine.
Tuberculosis (BCG) At birth 0 days Not applicable Not recommended
after age 364 days. Rotavirus, 1st dose 2 months 42 days Not applicable 104 days
Rotavirus, 1st dose 4 months 70 days 28 days after 1st
rotavirus dose 223 days
Polio, 1st dose Pentavalent, 1st dose Pneumococcal, 1st dose
2 months 42 days Not applicable None
Polio, 2nd dose Pentavalent, 2nd dose Pneumococcal, 2nd dose
4 months 70 days 28 days after the first dose None
Formula for calculating coverage in valid doses
Valid doses administered Target population

33
Polio, 3rd dose, Pentavalent, 3rd dose, Pneumococcal, 3rd dose
6 months 98 days 28 days after the second dose None
Yellow fever 12 months 182 days
When yellow fever and MMR or measles and rubella vaccine are not given on the same date but within <28 days, the second dose is invalid.
None
MMR or MR, 1st dose 12 months 270 days None
Keep in mind the following points in calculating valid-dose vaccination coverage.
Minimum intervals required for validity
There are established minimum intervals between administration of two doses of the same vaccine. Additionally, if two live attenuated parenteral or nasal vaccines are given on different dates within an interval of <28 days, the second vaccine is invalid. However, when two attenuated parenteral or nasal vaccines are given on the same date, both vaccines are valid. Attenuated parenteral vaccines include the single antigen against measles, measles and rubella, MMR vaccine against measles, mumps, and rubella, yellow fever, and chickenpox vaccine. The nasal influenza vaccine is an attenuated vaccine given by the nasal route. The rule does not apply to attenuated vaccines given by the oral route, such as the oral polio and rotavirus vaccines. For more information, please see chapter 2 of the Pink Book (15): http:/www.cdc.gov/vaccines/pubs/pinkbook/downloads/genrec.pdf
Maximum age
Three vaccines have a recommended maximum age of administration:
Though the tuberculosis (BCG) vaccine can be given after 365 days of life, it is not recommended. Doses administered after age 1 year are not included in coverage estimates. See the PAHO-TAG report and the complete position paper (16): http://www.who.int/wer/2004/en/wer7904.pdf?ua=1.
Hepatitis B vaccine given more than 24 hours after birth provides very little protection against perinatal transmission of the disease. When the vaccine is given after age 59 days, it is no longer considered the birth dose. Doses given >60 days after birth are considered the first dose of hepatitis B vaccine in countries whose immunization schedules have three doses in addition to the birth dose for infants. See the full position paper (17): http://www.who.int/wer/2009/wer8440.pdf?ua=1.
Based on initial WHO recommendations in 2009, the upper age limits for administration of the rotavirus vaccine are 14 weeks and 6 days to initiate the series and 32 weeks to complete the series. In 2012, the SAGE recommended that countries consider giving this vaccine simultaneously with the first and second doses of the DPT vaccine at any age <24 months (18). Please see the position paper: http://www.who.int/wer/2013/wer8805.pdf?ua=1

34
In 2012, PAHO-TAG indicated that the rotavirus vaccine can be given up to age 1 year in areas with high morbidity and mortality from diarrheal disease but that countries should try to respect maximum age limits (19). These guidelines relate to 2009 recommendations and can be found here: http://www.paho.org/hq/index.php?option=com_content&view=article&id=1862&Itemid=1682&lang=en.
Vaccines containing the measles antigen
WHO-SAGE recommends giving the first dose of measles-containing vaccine (either the MMR or the measles and rubella vaccine) at age 9 months in areas where measles transmission is high and at age 12 months where transmission is low. An estimated 90% of infants receiving measles vaccine at age 8 or 9 months achieve seroconversion. For further information, please see the WHO position paper (20) on vaccines containing the measles antigen at: http://www.who.int/immunization/policy/position_papers/en/. Due to the variety of national recommendations on ages of administration in the Americas, and for the purposes of this guide, 9 months is an acceptable age for administering a measles-containing vaccine. However, countries may need to modify this indication to align it more closely with national recommendations.
Table 15. Definition of valid vaccination booster doses in the vaccination series
Vaccine Recommended age Minimum age Minimum interval
between doses Maximum age
Pneumococcal booster 12 months 365 days
56 days after previous dose of the same vaccine
None
Polio booster Refer to the national schedule
126 days 28 days after previous dose of the same vaccine
None
DPT booster 18 months 365 days 181 days after previous dose of a DPT vaccine
None
MMR or measles and rubella, 2nd dose
Refer to the national schedule
298 days
28 days after previous dose of a vaccine that contains the measles antigen
None
Table 16. Definition of valid vaccination doses for school admission series
35
Vaccine Recommended age Minimum age Minimum interval
between doses Maximum age
Polio, 2nd booster
Follow national schedule
At least 181 days after previous dose of same vaccine; may be 4 years in some countries
181 days after previous dose of the same vaccine
None
DPT, 2nd booster
Follow national schedule 446 days
181 days after previous dose of a DPT vaccine
None
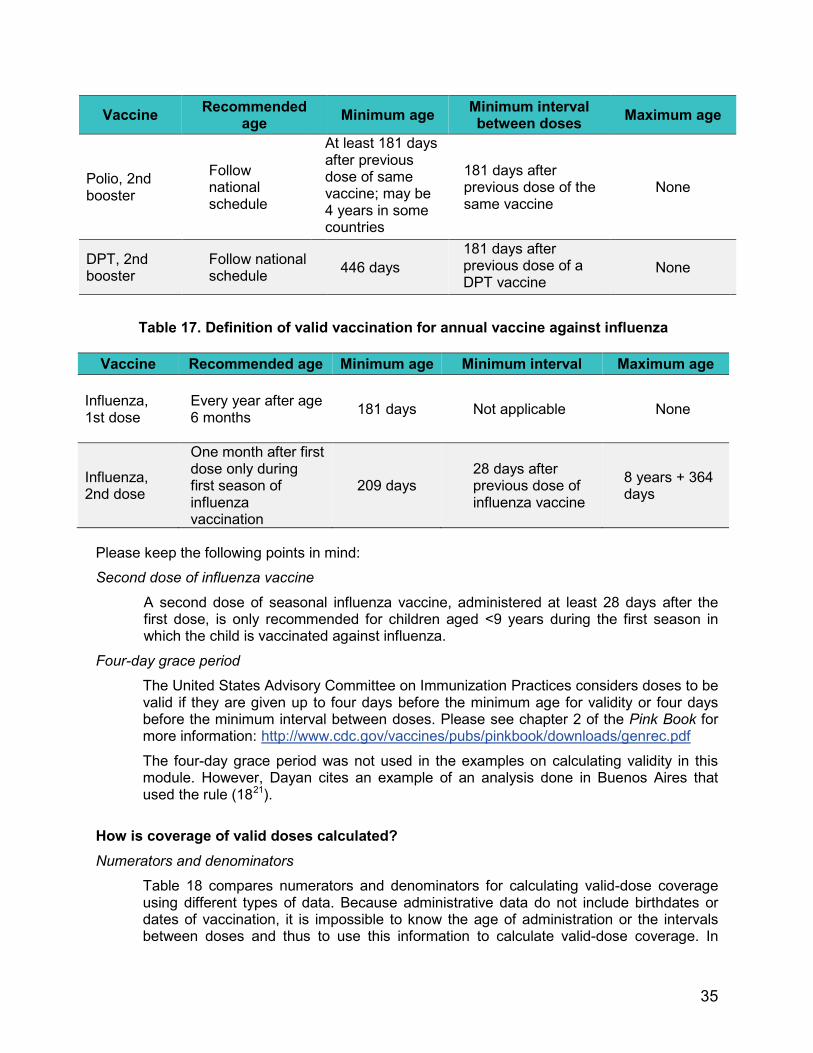
Table 17. Definition of valid vaccination for annual vaccine against influenza
Vaccine Recommended age Minimum age Minimum interval Maximum age
Influenza, 1st dose
Every year after age 6 months 181 days Not applicable None
Influenza, 2nd dose
One month after first dose only during first season of influenza vaccination
209 days 28 days after previous dose of influenza vaccine
8 years + 364 days
Please keep the following points in mind:
Second dose of influenza vaccine
A second dose of seasonal influenza vaccine, administered at least 28 days after the first dose, is only recommended for children aged <9 years during the first season in which the child is vaccinated against influenza.
Four-day grace period
The United States Advisory Committee on Immunization Practices considers doses to be valid if they are given up to four days before the minimum age for validity or four days before the minimum interval between doses. Please see chapter 2 of the Pink Book for more information: http://www.cdc.gov/vaccines/pubs/pinkbook/downloads/genrec.pdf
The four-day grace period was not used in the examples on calculating validity in this module. However, Dayan cites an example of an analysis done in Buenos Aires that used the rule (1821).
How is coverage of valid doses calculated? Numerators and denominators
Table 18 compares numerators and denominators for calculating valid-dose coverage using different types of data. Because administrative data do not include birthdates or dates of vaccination, it is impossible to know the age of administration or the intervals between doses and thus to use this information to calculate valid-dose coverage. In

36
contrast, surveys and nominal registry data provide information linked to individual children, making it possible to evaluate the validity of doses.
Table 18. Numerators and denominators for calculating coverage of valid doses, by data source
Variable Administrative data Survey Registries
Numerator Not applicable
Number of children in the target age group with a date that reflects a valid dose of the vaccine of interest
Number of children in the target age group with a valid dose of the vaccine of interest in the registry
Denominator Not applicable
Number of children in the target age group who participated in the survey
Number of children in the target age group in the registry
If a low percentage of children in the sample have data on dates of vaccination, the calculation of valid doses should be interpreted with caution.
Examples
The example below compares the coverage of all doses to the coverage of valid doses using survey data from country A.
* As explained, survey data must be weighted—i.e., a value should be assigned to the data for each child based on
the child’s probability of selection. This makes it possible to characterize the entire population rather than only
MMR vaccine
In country A, 53 children received invalid doses of MMR vaccine, either due to administration before age 270 days (9 months) or to administration 1-27 days after the yellow fever vaccine. Total MMR vaccine doses*
2,914 children who received a dose of MMR vaccine 3,319 children in the survey who met the age requirements
= 87.8 %
Valid doses of MMR vaccine*
2,861 children who received a valid dose of MMR vaccine 3,319 children in the survey who met the age requirements
= 86.2 %

37
children in the survey (Annex 2). For practical purposes, the example shows a gross calculation of coverage, assuming that all children had the same probability of selection (i.e., the percentage of the sample).
Tables 19-21 show sample coverage calculations with all the doses and invalid doses using survey data. Each table has a different number of children as the denominator, since these numbers represent the children in the survey scheduled to receive different vaccine doses.
Table 19. Vaccine doses administered and valid doses, children aged 12-35 months, country A, 2011
Vaccine Total no. of
children Total doses administered Valid doses administered
Invalid doses
n % (CI 95%) n % (CI 95%) n
BCG 3,319 3,079 92.8 (91.9-93.8) 3,079 92.8 (91.9-93.8) 0
Polio 1st dose 3, 319 3,163 95.3 (94.5-96.2) 3,130 94.3 (93.4-95.2) 33
Polio 2nd dose 3,319 3,133 94.4 (93.4-95.4) 3,076 92.7 (91.6-93.8) 57
Polio 3rd dose 3,319 3,004 90.5 (89.2-91.8) 2,962 89.2 (87.9-90.6) 42
Pentavalent, 1st dose 3,319 3,157 95.1 (94.3-96.0) 3,123 94.1 (93.2-95.0) 34 Pentavalent, 2nd dose 3,319 3,129 94.3 (93.3-95.2) 3,053 92.0 (90.9-93.1) 76 Pentavalent, 3rd dose 3,319 2,981 89.8 (88.5-91.1) 2,937 88.4 (87.1-89.8) 44 MMR 3 319 2,914 88.1 (86.6-89.6) 2,861 86.5 (85.1-88.0) 53 Yellow fever 3,319 2,834 85.8 (84.2-87.4) 2,775 84.1 (82.5-85.7) 59
Table 20. Vaccine doses administered and valid doses of rotavirus vaccine, children born in 2010, country A, 2011
Vaccine* Total no. of
children Total doses administered
Valid doses administered
Invalid doses
n % (CI 95%) n % (CI 95%) n Rotavirus, 1st dose 1,194 1,058 88.4 (86.4-90.5) 988 82.6 (80.0-85.2) 70
Rotavirus, 2nd dose 1,194 986 82.5 (79.8-85.1) 960 80.4 (77.7-83.1) 26
* In 2010, Country A introduced rotavirus vaccine. While the survey included children born in 2008-2010, this analysis only includes children born in 2010.
Table 21. Vaccine doses administered and valid booster doses, children aged 18-35 months, country A, 2011
Vaccine* Total no. of
children Total doses administered
Valid doses administered
Invalid doses
n % (CI 95%) n % (CI 95%) n

38
Polio booster 2,419 1,810 74.9 (72.6-77.2) 1,785 73.8 (71.5- 76.1) 25
DPT vaccine, booster 2,419 1,804 74.6 (72.3-76.9) 1,743 72.0 (69.7-
74.4) 61
* The DPT and oral polio vaccine boosters are recommended at age 18 months. The analysis only includes children aged 18-35 months at the time of the survey.
Programming implications
The purpose of the validity criterion is to maximize the efficacy and safety of each dose administered.
Vaccines should be administered at an age that gives children the best chance of developing an immune response and ensures that they are protected against VPDs.
Valid-dose coverage also provides information on how well vaccinators understand and follow guidelines.
3.4. Dropout rate
Method 1: To determine the dropout rate between the first and third doses of pentavalent vaccine, calculate the number of children who had access to the service when they received the 1st pentavalent dose but could not complete the series.
Regardless of the data type, the following formula is used to calculate the dropout rate between the first and third doses of pentavalent vaccine.
Numerators and denominators
Table 22 shows the numerators and denominators used to calculate the dropout rate between the first and third doses of pentavalent vaccine using three types of data.
Table 22. Numerators and denominators to calculate the dropout rate between the first and third doses of pentavalent vaccine, by data source
Variable Administrative data Surveys Registries
Numerator Subtract the number of 3rd pentavalent doses from the number of 1st
Number of children with a 1st pentavalent dose who did not receive the 3rd
Number of children with a 1st pentavalent dose who did not
Dropout rate between the 1st and 3rd doses of pentavalent vaccine
1st doses of pentavalent [minus] 3rd doses of pentavalent x 100 1st doses of pentavalent

39
pentavalent doses pentavalent dose by age 12 months
receive the 3rd dose by age 12 months
Denominator Number of 1st pentavalent doses administered
Number of children aged <12 months with a 1st pentavalent dose on record
Number of children aged <12 months with 1st pentavalent dose on record
Keep the following points in mind when comparing the dropout rate using administrative, survey, or registry data:
Administrative data are aggregated and thus do not allow for monitoring of individual children. Additionally, in using administrative data, the evaluation team should remember that it is impossible to compare the exact same group of children because the doses given to children aged <1 year are counted by calendar year; some children will therefore receive the first dose of pentavalent vaccine in one calendar year and the third dose in the next calendar year.
However, survey and registry data help to determine which children failed to return for follow-up vaccination visits. Information on their risk factors, such as rural or urban residence or socioeconomic status, may also be obtained.
Example
The example from country A shows the calculation of dropout rates between the first and third doses of pentavalent vaccine based on administrative and survey data, respectively.
Programming implications
Dropout rates show delays in completing both specific vaccine series and the vaccination schedule overall. In the case of DPT, dropout rates can show the percentage of children who received the first dose of the vaccine but did not receive the third dose. High dropout rates have many causes, including decreased demand for vaccines, problems with the immunization services, and barriers in accessing these services.
Dropout rates between the first and third doses of pentavalent vaccine
Administrative data:
114,015 1st doses of pentavalent vaccine in children aged <12 months [minus] 112,222 3rd doses of pentavalent vaccine in children aged <12 months 114,015 1st doses of pentavalent vaccine in children aged <12 months
= 1.6% Survey data:
176 children who received the 1st but not the 3rd dose of pentavalent before age 12 months
3,157 children who received the 1st dose of pentavalent before age 12 months = 5.6%

40
It is important to keep in mind that late doses may not appear in administrative estimates, since most vaccines can be administered after the indicated age (2).
Method 2: To determine the dropout rate between the third dose of pentavalent vaccine and the 1st dose of MMR or measles and rubella vaccine, compare the number of children who received the third dose of pentavalent vaccine at age 6 months but did not complete the vaccination series at age 12 months.
Basic formula
The formula below determines the dropout rate between the third dose of pentavalent vaccine and the first dose of triple or measles and rubella vaccine, regardless of the data type.
Numerators and denominators
Using three types of data, Table 23 shows the numerators and denominators needed to calculate the dropout rate between the third dose of pentavalent vaccine and the first dose of MMR or measles and rubella vaccines.
Table 23. Numerators and denominators to calculate the dropout rate between the third dose
of pentavalent vaccine and MMR vaccine, by data source
Variable Administrative data Surveys Registries
Numerator
Subtract the number of MMR doses administered to children aged <1 year in a year from the number of 3rd doses of DPT administered to children aged <1 year in the previous year
Number of children who received a 3rd pentavalent dose but did not receive the MMR vaccine by age 24 months
Number of children who received a 3rd pentavalent dose but did not receive the MMR vaccine by age 24 months
Denominator Number of 3rd pentavalent doses administered
Number of children with a 3rd pentavalent dose on record by age 24 months
Number of children with a 3rd pentavalent dose on record by age 24 months
Dropout rate between the third dose of pentavalent vaccine and the first dose of MMR vaccine
3rd pentavalent dose [minus] MMR dose 3rd pentavalent dose

41
The sample data from Country A below shows the dropout rates between the third dose of pentavalent vaccine and the first dose of MMR or measles and rubella vaccine, based on administrative and survey data, respectively.
The dropout rate may also be presented in figures (see Module 2, “Analysis of administrative coverage”).
Programming implications
The dropout indicator shows the percentage of children who had access to immunization services and received the third dose of DPT vaccine but were lost in follow-up before receiving a vaccine that contains the measles antigen. As noted, most vaccines can be applied when the child is older the recommended age, and these doses may not appear in administrative calculations.
3.5. Timeliness
3.5.1. Timeliness
Goal: To assess fulfillment of the recommended vaccination schedule.
In Tables 24-27, children’s ages are indicated at the time of vaccination by categories of timeliness or completion of the schedule but only for valid doses. Please see the previous section to determine valid doses.
In this guide, timeliness is defined as the period from when a child reaches the recommended age of vaccination for the dose of interest until one month (30 days) after that age. Several definitions of timeliness exist in the literature; most of these allow for a month after the recommend age for vaccination. Categories in the vaccination schedule correspond to fulfillment of the schedule with valid doses only (22).
Table 24. Definition of valid doses according to the vaccination schedule, by
recommended age of administration of the vaccine series for the first year of life
Dropout rates between the third dose of pentavalent vaccine and the first dose MMR vaccine
Administrative data 112,222 3rd doses of pentavalent administered in 2011 [minus]
109,925 doses de MMR administered in 2012 112,222 3rd doses of pentavalent vaccine
= 2.0 % Survey data
67 children who received the 3rd dose of pentavalent but not the MMR 2,981 children who received the 3rd dose of pentavalent vaccine
= 2.2 %

42
Vaccine Before the
recommended age
At the recommended
age
After the recommended
age Late
Hepatitis B Not applicable 0-1 day 2-28 days
29-59 days (doses given >59 days are counted as the first vaccine dose)
BCG Not applicable 0-30 days 31-364 days ≥365 days (not recommended)
Rotavirus, 1st dose 42-59 days 60 to 90 days 91-104 days >104 days
Rotavirus, 2nd dose 70-119 days 120-150 days 151-223 days >223 days
Polio,1st dose Pentavalent, 1st dose Pneumococcal, 1st dose
42-59 days 60-90 days 91-364 days
>1 year (365 days)
Polio, 2nd dose Pentavalent, 2nd dose Pneumococcal, 2nd dose
70-119 days 120-150 days 151-364 days
>1 year (365 days)
Polio, 3rd dose Pentavalent, 3rd dose Pneumococcal, 3rd dose
98-179 days 180-210 days 211-364 days >1 year (365 days)
Keep in mind the following points in evaluating vaccination timeliness:
Late start If a child starts the series after the age at which all the doses should have been administered, the team should consider a secondary analysis to evaluate completion of a rapid schedule based on the minimum valid intervals between doses.
Table 25. Definition of valid doses according to the vaccination schedule, by recommended age of administration of the vaccine series in the second year of life
Vaccine Before the
recommended age
At the recommended
age
After the recommended
age Late

43
MMR or measles and rubella, 1st dose
270-364 days 365-395 days 390-729 days >2 years (730 days)
Yellow fever 181-364 days 365-395 days 396-729 days >2 years (730 days)
Pneumococcal booster Not applicable 365-395 days 396-729 days >2 years (730 days)
DPT booster Not applicable 547-577 days 578-729 days >2 years (730 days)
Polio booster Not applicable 547-577 days 578-729 days >2 years (730 days)
Table 26. Definition of valid doses according to the vaccination schedule, by recommended age of administration of the school admission series
Vaccine Before the
recommended age
At the recommended
age
After the recommended
age Late
MMR or measles and rubella, 2nd dose
<28 days before the prior dose
Up to 30 days after the age
recommended in the national
schedule
>30 days after the age
recommended in the national
schedule
After the next birthday
Polio, 2nd booster <28 days before the prior dose
Up to 30 days after the age
recommended in the national
schedule
>30 days after the age
recommended in the national
schedule
After the next birthday
DPT, 2nd booster <28 days before the prior dose
Up to 30 days after the age
recommended in the national
schedule
>30 days after the age
recommended in the national
schedule
After the next birthday
Second dose of a Measles-containing vaccine PAHO-TAG recommends administering the second dose of the MMR or measles and rubella vaccine at age 18 months, along with the first booster of the DPT vaccine. Per this recommendation, the dose would be late because it would be given after the child’s second birthday (age 730 days) (23).

44
Table 27. Definition of valid doses of the influenza vaccine, by recommended age of administration
Vaccine Before the
recommended age
At the recommended
age
After the recommended
age Late
Influenza, 1st dose Age 6 months
(Depends on age during the flu season)
Influenza, 2nd dose (for children aged <9 years vaccinated for the first time)
<28 days after the 1st dose
28-57 days after the previous dose
58-181 days after the previous dose Age 9 years
Second dose of influenza vaccine A second dose of influenza vaccine is only recommended for children aged <9 years who were not vaccinated with doses of influenza vaccine in any previous season.
Using survey data from country A, Table 28 describes the steps for assessing the timeliness of doses.
Table 28. Calculation of timely vaccination coverage
Steps Example
1. Select the vaccine(s) of interest. DPT vaccine booster
2. Choose a group of children who meet the age criteria for the vaccine of interest.
Children aged 24-35 months
3. For the denominator, use the total number of children in the age group.
There were 1,621 children aged 24-35 months at the time of the survey
4. Calculate the age of vaccine administration.
Date of administration of the vaccine of interest [minus] the child’s date of birth
5. Count the children who do not have an administration date on record for the vaccine of interest.
318 children aged 24-35 months had no record showing that the DPT vaccine booster was administered.
6. Count the children who received invalid doses because they were given before the minimum age.
Invalid DPT booster are given < age 365 days. 25 children aged 24-35 months received a dose of DPT vaccine < age 365 days.

45
7. Count the children who received invalid doses because the doses were given before the end of the minimum interval after the previous dose.
Invalid doses of the DPT booster are those given <181 days after the last dose of pentavalent vaccine. 22 children aged 24-35 months received a dose of DPT vaccine <181 days after the 3rd dose of pentavalent vaccine.
8. Add up the total number of invalid doses.
The total number of children with invalid doses is 47 (25+22).
9. Count the children who received timely doses.
Timely doses are those given < age 365 days, allowing for the minimum interval, and 569 days. 605 children aged 24-35 months received a dose of DPT vaccine on time.
10. Count the children who received doses after the recommended period.
“Not timely” doses are those given at age 570-729 days. 500 children aged 24-35 months received a dose of DPT vaccine after the recommended period.
11. Count the children who received late doses.
Late doses are those given >730 days. 151 children aged 24-35 months received a dose of DPT vaccine after their second birthday.
12. Calculate the percentage of coverage for specific doses.
605 children who received a DPT booster in a timely manner (weighted)
1,621 children aged >24 months at the time of the survey (weighted)
= 37.3% (CI 95% = 34.2-40.5) of children who received a timely DPT booster within
30 days after the recommended age.
In addition to vaccines administered on a timely basis, the evaluation team may estimate the proportion of children vaccinated in a timely fashion. Please see Module 2 for more information on the analysis of administrative coverage and the graphs used to show percentages of timely vaccinations.
3.5.2. Average age at vaccination
Using example survey data from country A, Table 29 describes steps for assessing the average age of vaccine administration.
Table 29. Calculation of average age at vaccination
Steps Example
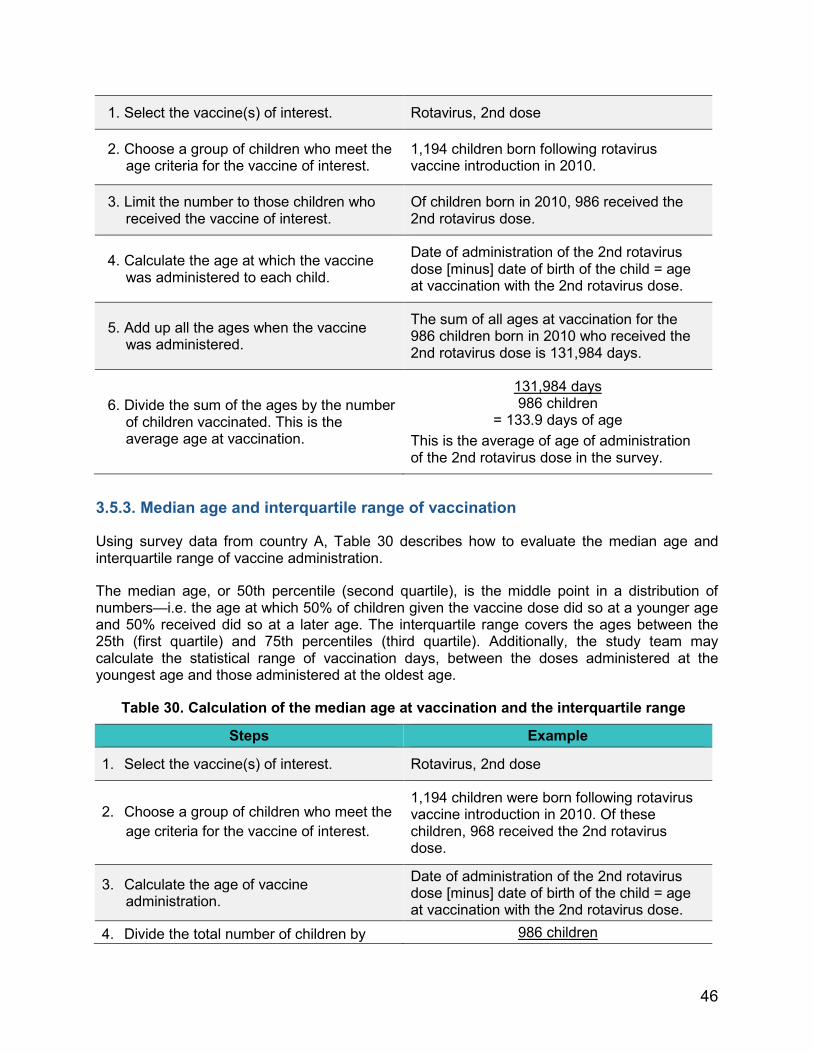
46
1. Select the vaccine(s) of interest. Rotavirus, 2nd dose
2. Choose a group of children who meet the age criteria for the vaccine of interest.
1,194 children born following rotavirus vaccine introduction in 2010.
3. Limit the number to those children who received the vaccine of interest.
Of children born in 2010, 986 received the 2nd rotavirus dose.
4. Calculate the age at which the vaccine was administered to each child.
Date of administration of the 2nd rotavirus dose [minus] date of birth of the child = age at vaccination with the 2nd rotavirus dose.
5. Add up all the ages when the vaccine was administered.
The sum of all ages at vaccination for the 986 children born in 2010 who received the 2nd rotavirus dose is 131,984 days.
6. Divide the sum of the ages by the number of children vaccinated. This is the average age at vaccination.
131,984 days 986 children
= 133.9 days of age This is the average of age of administration of the 2nd rotavirus dose in the survey.
3.5.3. Median age and interquartile range of vaccination
Using survey data from country A, Table 30 describes how to evaluate the median age and interquartile range of vaccine administration.
The median age, or 50th percentile (second quartile), is the middle point in a distribution of numbers—i.e. the age at which 50% of children given the vaccine dose did so at a younger age and 50% received did so at a later age. The interquartile range covers the ages between the 25th (first quartile) and 75th percentiles (third quartile). Additionally, the study team may calculate the statistical range of vaccination days, between the doses administered at the youngest age and those administered at the oldest age.
Table 30. Calculation of the median age at vaccination and the interquartile range
Steps Example
1. Select the vaccine(s) of interest. Rotavirus, 2nd dose
2. Choose a group of children who meet the age criteria for the vaccine of interest.
1,194 children were born following rotavirus vaccine introduction in 2010. Of these children, 968 received the 2nd rotavirus dose.
3. Calculate the age of vaccine administration.
Date of administration of the 2nd rotavirus dose [minus] date of birth of the child = age at vaccination with the 2nd rotavirus dose.
4. Divide the total number of children by 986 children

47
half. 2 = 493 children
5. List the ages in descending order. The lowest and highest ages of the 986 children were 50 and 495 days, respectively.*
6 . According to the list created in step 5, the age of the child calculated in step 4 represents the median age of vaccinated children in the survey.
The age at vaccine administration of child number 493 is 127 days. This is the median age.
7. Divide the total number of children by four.
986 children 4
= child number 246.5
8. The age at administration for the child identified in step 7 represents the lower limit of the interquartile range.
As this is not a whole number, the first quartile is delimited by the average ages of children number 246 and 247. This figure—122.5 days—is the cut-off for the first quartile.
9. Add up the number of children calculated in steps 4 and 7.
493 + 246.5 = child number 739.5
10. The age at administration for the child identified in step 9 represents the upper limit of the interquartile range.
As this is not a whole number, the third quartile is delimited by the average ages of children numbered 739 and 740. This figure—137 days—is the cut-off for the group’s third quartile.
11. Report the median age of administration and interquartile range. The range constitutes the upper and lower age limits in which most children received the vaccine of interest.
Median: age 127 days Interquartile range: age 122.5-137 days
Range: age 50-497 days
* Some doses are invalid but included in the analysis as an example. Notably, the average (133.9 days) and median ages (127 days) of vaccination with the second rotavirus dose are not the same. This is because outliers (e.g., vaccination at age 497 days) strongly affect averages. As a result, the evaluation team may wish to report all outcomes—average, median, interquartile range, and statistical ranges—at the same time.
3.5.4. Inverted Kaplan-Meier curve
The inverted Kaplan-Meier curve is a graphical representation of the proportion of vaccinated children by age (in months). Unvaccinated children are included in the appropriate group for vaccination, starting from birth and proceeding to their age at the time of data collection. In these graphs, each dose is assumed to be independent of all others, including doses in the same series.
Clark and Sanderson use DHS data to present an example of time-to-event analysis (24). Using survey data from country A, Table 31 describes the steps for creating the variables necessary to build an inverted Kaplan-Meier curve.

48
Table 31. Construction of the inverted Kaplan-Meier curve
Steps Example 1. Select the vaccine(s) of interest. Pentavalent vaccine, 2nd dose
2. Choose a group of children who meet the age criteria for the vaccine of interest.
All the children in the survey (all aged >12 months).
3. Create a variable for each vaccine that indicates if it was administered.
Child who received the 2nd pentavalent dose = 1; child who did not receive it = 0.
4. Create a variable for time elapsed up to the event for the vaccinated children.
If the child received the 2nd dose of pentavalent vaccine, the time elapsed up to the event corresponds to the age recommended for administration.
5. Create a variable for time elapsed up to the event for the unvaccinated children. Some children will have received some but not all doses.
If the child did not receive the 2nd pentavalent dose, the time elapsed up to the event is the age at the time of data collection. These children have been excluded, meaning that even though they did not receive the vaccine before the survey, they may receive it in the future.
6. Use a computer program to construct the inverted Kaplan-Meier curve at 1 [minus] the time elapsed up to the event and the corresponding confidence intervals.
Figure 3 below was created using R language.*

49
Options
Multiple doses of the same vaccine in a diagram. One vaccine by multiple birth cohorts, as seen in the example. One vaccine by subnational region.
The band showing the timeliness period for the vaccine under evaluation helps to visualize the data. In the next example from country A, the gray bands indicate the recommended ages of administration.
Kaplan-Meier diagrams allow for confidence intervals to be displayed (Figures 3-5). In all the figures, the ordinate axis represents the probability of vaccination rather than coverage.
Figure 3 does not include confidence intervals. The gray box indicates the recommended age of administration. This type of graph can be used in a presentation to a large group.
Figure 4 shows the same information as Figure 3, with the addition of 95% confidence intervals. Each box represents a different birth cohort, labeled from the top. The gray boxes indicate the recommended ages of administration. This type of figure could be used in a written report.

50
Figure 5 shows the probability of children aged >6 months having received vaccines in the schedule at the recommended ages. Cohorts of older children had lower pneumococcal vaccine coverages, since the vaccine had previously only been available in the private sector.
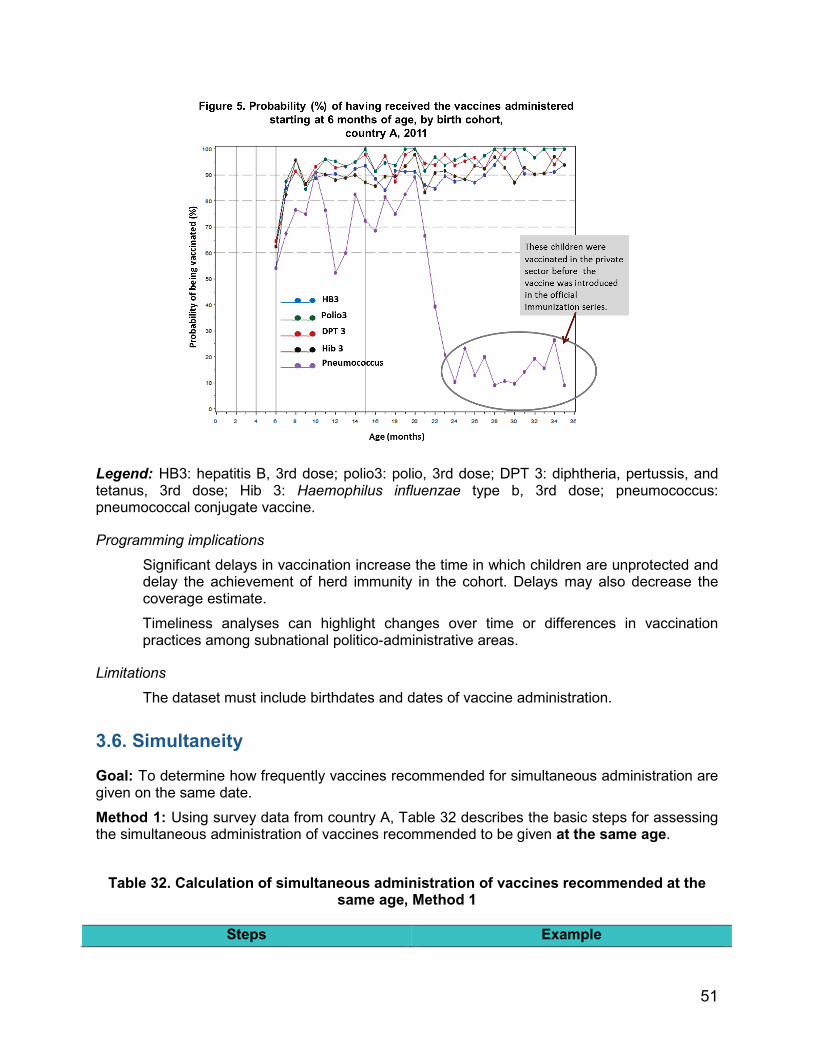
51
Legend: HB3: hepatitis B, 3rd dose; polio3: polio, 3rd dose; DPT 3: diphtheria, pertussis, and tetanus, 3rd dose; Hib 3: Haemophilus influenzae type b, 3rd dose; pneumococcus: pneumococcal conjugate vaccine.
Programming implications
Significant delays in vaccination increase the time in which children are unprotected and delay the achievement of herd immunity in the cohort. Delays may also decrease the coverage estimate.
Timeliness analyses can highlight changes over time or differences in vaccination practices among subnational politico-administrative areas.
Limitations
The dataset must include birthdates and dates of vaccine administration.
3.6. Simultaneity
Goal: To determine how frequently vaccines recommended for simultaneous administration are given on the same date.
Method 1: Using survey data from country A, Table 32 describes the basic steps for assessing the simultaneous administration of vaccines recommended to be given at the same age.
Table 32. Calculation of simultaneous administration of vaccines recommended at the same age, Method 1
Steps Example

52
1. Select two vaccines of interest with the same recommended age and administration date.
3rd doses of pentavalent and polio vaccines
2. Choose a group of children meeting the age criteria for the vaccine of interest Children aged 12-35 months.
3. Limit the group to children who received both vaccines. This number is the denominator.
2,973 children aged 12-35 months received the 3rd doses of pentavalent and polio vaccines.
4. Determine which children received both vaccines on the same date. This number is the numerator.
2,924 children aged 12-35 months received the 3rd doses of pentavalent and polio vaccines on the same date and 49 children received the 3rd pentavalent dose and polio vaccine on different dates.
5. Calculate the percentage of children who received the vaccines of interest at the same time.
2,924 children received the 3rd doses of pentavalent and polio vaccines on the same
date (weighted)2 2,973 children who received both doses,
(weighted) = 98.4% (CI 95%: 97.9-98.8)
Options for the denominator
In method 1, the evaluating team may consider including children who received only some of the vaccines, in addition to those receiving both vaccines. The remaining children can then be grouped by whether they received only one vaccine, both vaccines on the same date, or each vaccine on a different date.
Method 2: Using survey data from country A, Table 33 describes advanced steps for assessing simultaneous administration of vaccines recommended at the same age and at different ages.
2 Weighting is used in surveys to extrapolate from the sample population.

53
Table 33. Calculation of simultaneous administration of vaccines recommended at the same age, Method 2
Steps Example Children in each category (%)
1. Select a vaccine of interest. Rotavirus, 1st dose
2. Choose a group of children meeting the age criteria for the vaccine of interest. Children born in 2010.
3. Limit the group to children who received the vaccine of interest. This figure will be the denominator.
Of the children born in 2010, 1,058 received the 1st rotavirus dose.
4. Count the number of children who received the vaccine of interest on the same date as another vaccine scheduled at the same age.
1,008 children born in 2010 received the 1st rotavirus dose and the 1st pentavalent dose on the same date.
1,008 children who received the 1st rotavirus and pentavalent doses on the same date,
(weighted) 1,058 children born in 2010 who received the
1st rotavirus dose (weighted)
= 95.1% (CI 95%: 93.6-96.6)
5. Count the number of children who received the vaccine of interest on the same date as the next dose of the second vaccine in step 4.
15 children born in 2010 received the 1st rotavirus dose and the 2nd pentavalent dose on the same date.
15 children who received the 1st rotavirus and 2nd pentavalent doses on the same date
(weighted) 1,058 children born in 2010 who received the
1st rotavirus dose (weighted)
= 1.5% (CI 95%: 0.6-2.3)
6. Count the number of children who received the vaccine of interest on the same date as the next dose after the dose of the second vaccine in step 5.
No children born in 2010 received the 1st rotavirus and 3rd pentavalent doses on the same date.
0 children who received the 1st rotavirus and 3rd pentavalent doses on the same date,
(weighted) 1,058 children born in 2010 who received the
1st rotavirus dose (weighted) = 0.0%.
7. Count the number of children who
received the vaccine of interest on a 35 children born in 2010 received the 1st rotavirus dose on a different date than the 35 children who received the first rotavirus
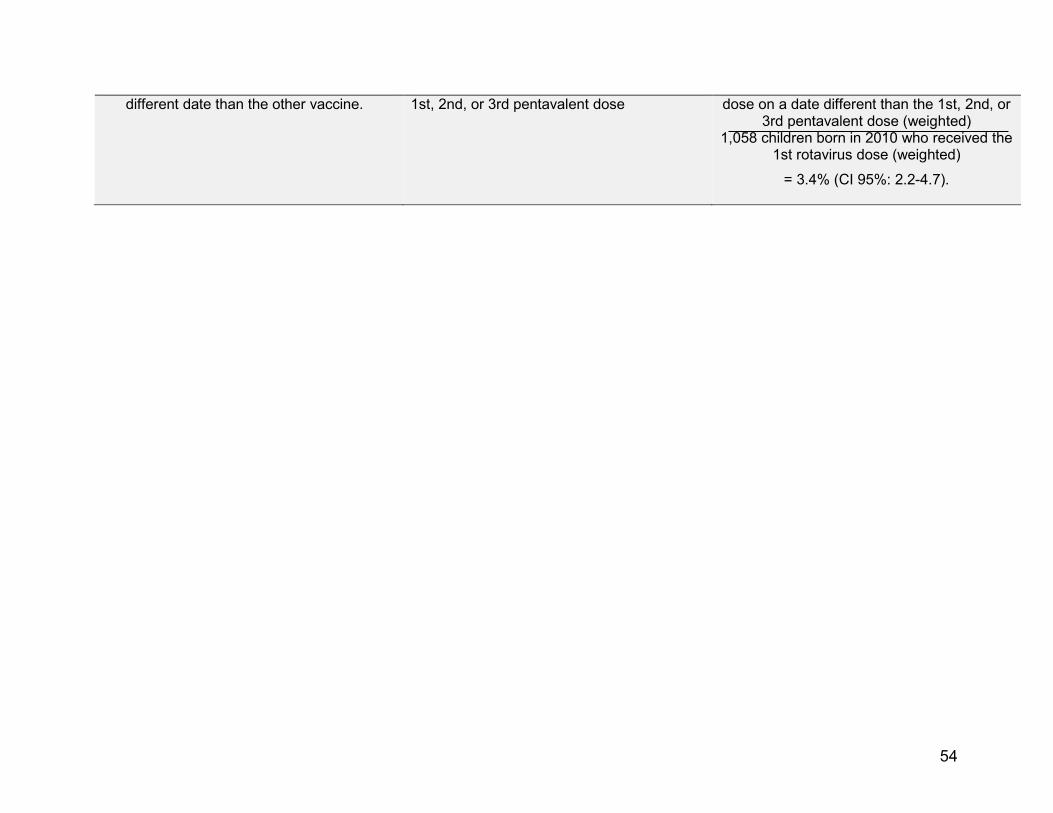
54
different date than the other vaccine. 1st, 2nd, or 3rd pentavalent dose dose on a date different than the 1st, 2nd, or 3rd pentavalent dose (weighted)
1,058 children born in 2010 who received the 1st rotavirus dose (weighted)
= 3.4% (CI 95%: 2.2-4.7).

55
Options for the denominator
In Method 2, all children may be included, even those who did not receive the vaccine being studied.
Programming implications
The analysis identifies opportunities to improve immunization services, so that all children receive all recommended vaccines at every visit.
The analysis highlights the flexibility and adaptability of vaccinators who manage to give all prescribed vaccines at each visit, even when the doses are not all scheduled for the same visit.
Results may identify vaccine shortages at the national or subnational levels or hesitance among vaccinators in providing two or more injections simultaneously (25). To learn more about how to reduce the pain from injections, please see: http://www.who.int/immunization/policy/position_papers/reducing_pain_vaccination/en/
The analysis of simultaneous administration of vaccines can also be presented in figures, such as those shown in Module 2.
Limitations
The dataset must include all dates of vaccine administration.
Goal: To determine if children receive all recommended vaccines during a immunization visit, and to evaluate how often the vaccines recommended for simultaneous administration are given on the same date.
Method 1: When the child is delayed in receiving the third pentavalent dose and the dose can be given at the same time as the MMR vaccine, do health workers take advantage of opportunities to administer these vaccines on the same date?
Using survey data from country A, Table 34 describes the steps for determining if health workers are taking advantage of opportunities to vaccinate children with delayed schedules.
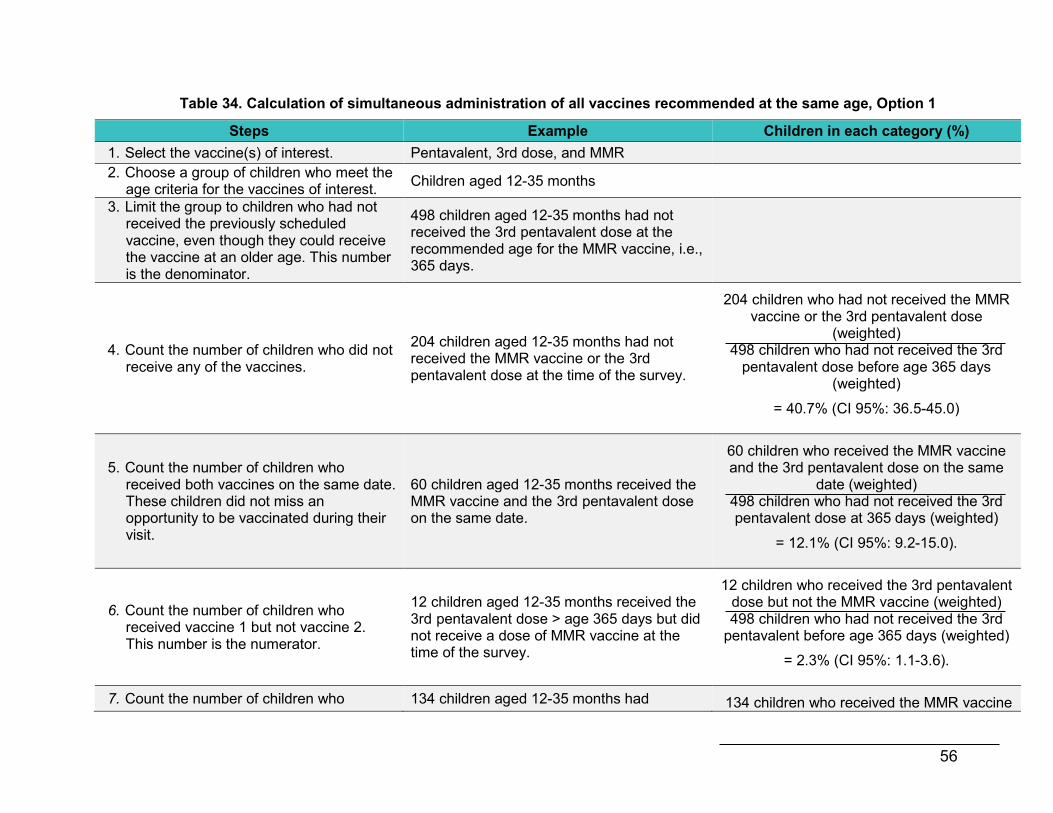
56
Table 34. Calculation of simultaneous administration of all vaccines recommended at the same age, Option 1
Steps Example Children in each category (%) 1. Select the vaccine(s) of interest. Pentavalent, 3rd dose, and MMR 2. Choose a group of children who meet the
age criteria for the vaccines of interest. Children aged 12-35 months
3. Limit the group to children who had not received the previously scheduled vaccine, even though they could receive the vaccine at an older age. This number is the denominator.
498 children aged 12-35 months had not received the 3rd pentavalent dose at the recommended age for the MMR vaccine, i.e., 365 days.
4. Count the number of children who did not receive any of the vaccines.
204 children aged 12-35 months had not received the MMR vaccine or the 3rd pentavalent dose at the time of the survey.
204 children who had not received the MMR vaccine or the 3rd pentavalent dose
(weighted) 498 children who had not received the 3rd
pentavalent dose before age 365 days (weighted)
= 40.7% (CI 95%: 36.5-45.0)
5. Count the number of children who received both vaccines on the same date. These children did not miss an opportunity to be vaccinated during their visit.
60 children aged 12-35 months received the MMR vaccine and the 3rd pentavalent dose on the same date.
60 children who received the MMR vaccine and the 3rd pentavalent dose on the same
date (weighted) 498 children who had not received the 3rd pentavalent dose at 365 days (weighted)
= 12.1% (CI 95%: 9.2-15.0).
6. Count the number of children who received vaccine 1 but not vaccine 2. This number is the numerator.
12 children aged 12-35 months received the 3rd pentavalent dose > age 365 days but did not receive a dose of MMR vaccine at the time of the survey.
12 children who received the 3rd pentavalent dose but not the MMR vaccine (weighted) 498 children who had not received the 3rd
pentavalent before age 365 days (weighted)
= 2.3% (CI 95%: 1.1-3.6).
7. Count the number of children who 134 children aged 12-35 months had 134 children who received the MMR vaccine

57
received vaccine 2 but not vaccine 1. These children may also be the numerator.
received a dose of MMR vaccine but had not received the 3rd pentavalent dose at the time of the survey.
but not the 3rd pentavalent dose (weighted) 498 children who had not received the 3rd
pentavalent before age 365 days (weighted)
= 26.6% (CI 95%: 22.6-30.5).
8. Count the number of children who received both vaccines but not on the same date. These children can also be a numerator.
88 children aged 12-35 months had received both doses of the MMR vaccine and also the 3rd pentavalent dose, but these vaccines were administered on different dates.
88 children who received the MMR vaccine and the 3d pentavalent dose on different
dates (weighted) 498 children who had not received the 3rd
pentavalent dose before age 365 days (weighted)
= 18.3% (CI 95%: 14.9-21.6).
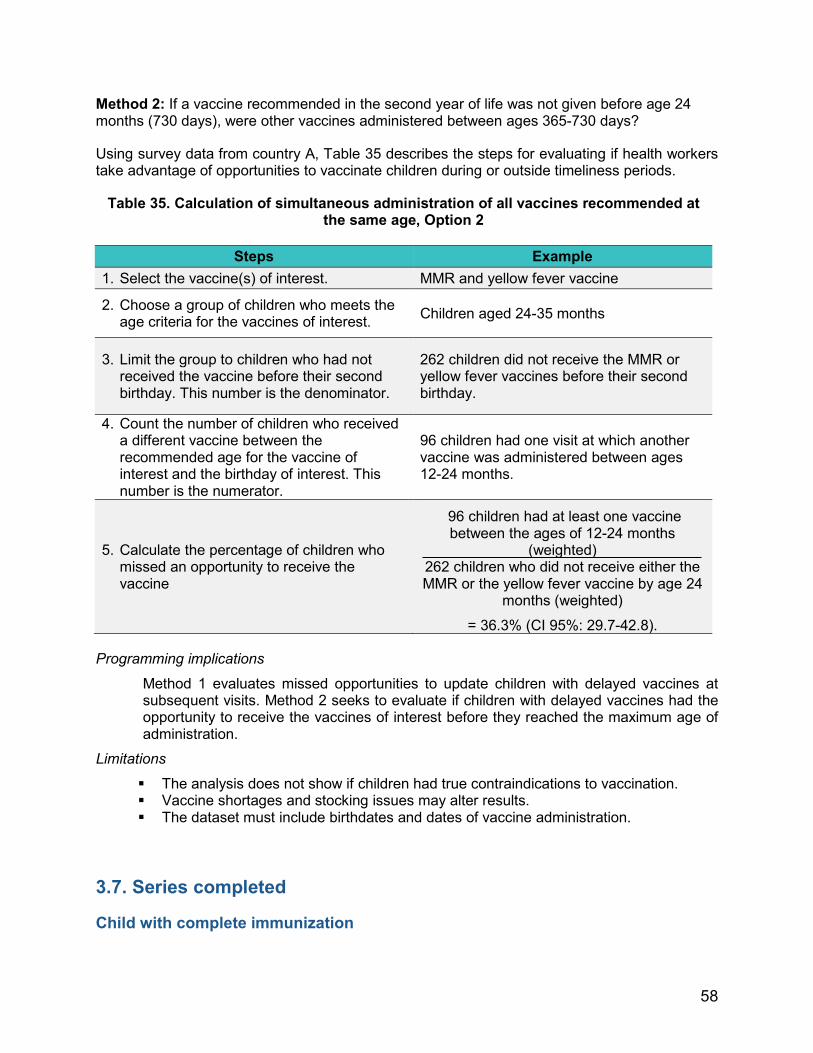
58
Method 2: If a vaccine recommended in the second year of life was not given before age 24 months (730 days), were other vaccines administered between ages 365-730 days?
Using survey data from country A, Table 35 describes the steps for evaluating if health workers take advantage of opportunities to vaccinate children during or outside timeliness periods.
Table 35. Calculation of simultaneous administration of all vaccines recommended at the same age, Option 2
Steps Example
1. Select the vaccine(s) of interest. MMR and yellow fever vaccine
2. Choose a group of children who meets the age criteria for the vaccines of interest. Children aged 24-35 months
3. Limit the group to children who had not received the vaccine before their second birthday. This number is the denominator.
262 children did not receive the MMR or yellow fever vaccines before their second birthday.
4. Count the number of children who received a different vaccine between the recommended age for the vaccine of interest and the birthday of interest. This number is the numerator.
96 children had one visit at which another vaccine was administered between ages 12-24 months.
5. Calculate the percentage of children who missed an opportunity to receive the vaccine
96 children had at least one vaccine between the ages of 12-24 months
(weighted) 262 children who did not receive either the MMR or the yellow fever vaccine by age 24
months (weighted)
= 36.3% (CI 95%: 29.7-42.8).
Programming implications
Method 1 evaluates missed opportunities to update children with delayed vaccines at subsequent visits. Method 2 seeks to evaluate if children with delayed vaccines had the opportunity to receive the vaccines of interest before they reached the maximum age of administration.
Limitations
The analysis does not show if children had true contraindications to vaccination. Vaccine shortages and stocking issues may alter results. The dataset must include birthdates and dates of vaccine administration.
3.7. Series completed
Child with complete immunization
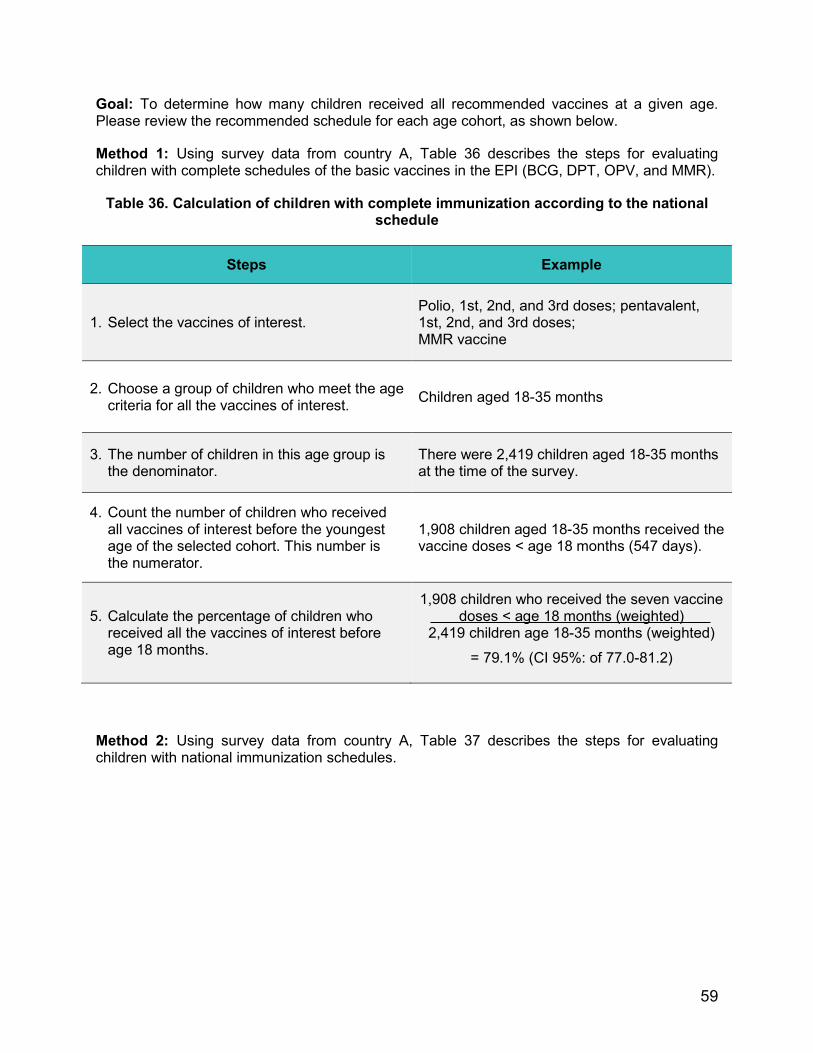
59
Goal: To determine how many children received all recommended vaccines at a given age. Please review the recommended schedule for each age cohort, as shown below.
Method 1: Using survey data from country A, Table 36 describes the steps for evaluating children with complete schedules of the basic vaccines in the EPI (BCG, DPT, OPV, and MMR).
Table 36. Calculation of children with complete immunization according to the national schedule
Steps Example
1. Select the vaccines of interest. Polio, 1st, 2nd, and 3rd doses; pentavalent, 1st, 2nd, and 3rd doses; MMR vaccine
2. Choose a group of children who meet the age criteria for all the vaccines of interest. Children aged 18-35 months
3. The number of children in this age group is the denominator.
There were 2,419 children aged 18-35 months at the time of the survey.
4. Count the number of children who received all vaccines of interest before the youngest age of the selected cohort. This number is the numerator.
1,908 children aged 18-35 months received the vaccine doses < age 18 months (547 days).
5. Calculate the percentage of children who received all the vaccines of interest before age 18 months.
1,908 children who received the seven vaccine doses < age 18 months (weighted)
2,419 children age 18-35 months (weighted)
= 79.1% (CI 95%: of 77.0-81.2)
Method 2: Using survey data from country A, Table 37 describes the steps for evaluating children with national immunization schedules.

60
Table 37. Calculation of children with complete immunization by age, according to the national schedule
Steps Example
1. Select the vaccines of interest. Polio 1st, 2nd, and 3rd doses + booster; pentavalent, 1st, 2nd, and 3rd doses; MMR; yellow fever; and DPT booster
2. Choose a group of children who meet the age criteria for all the vaccines of interest. Children aged 24-35 months
3. The number of children in this age group is the denominator.
There were 1,621 children aged 24-35 months at the time of the survey.
4. Count the number of children who received all vaccines of interest prior to the youngest age of the selected cohort. This number is the numerator.
1,041 children aged 24-35 months received the 10 vaccine doses before age 24 months (730 days).
5. Calculate the percentage of children who received all vaccines of interest before age 24 months.
1,041 children who received the 10 vaccines before age 24 months (weighted)
1,621 children 24-35 months (weighted)
= 64.5% (CI 95%: of 61.4-67.6).
Options for the numerator
The evaluation team may also do this analysis by restricting step 4 to only valid or timely doses. In the references, these analyses have been called complete vaccination when they only include valid doses and age-appropriate vaccination when they only include timely doses.
Programming implications
The analysis shows the proportion of children with complete immunization schedules at a given age.
Limitations
The dataset must include birthdates and dates of vaccine administration. The analysis does not show which children had true contraindications to vaccination.
3.7.1. Number of visits needed to complete the vaccination schedule
Goal: To determine the number of visits needed to complete the children’s schedule, by age cohort, remembering that multiple vaccines can be administered at the same visit and the minimum intervals between doses of each vaccine.
61
Using survey data from country A, Table 38 shows how to determine the number of visits necessary to update children with delayed immunization schedules.
Programming implications The analysis provides information on the number of visits needed to update the immunization schedules of all children.
Limitations
The analysis does not show which children had true contraindications to vaccination. Vaccine shortages and stocking issues may alter results of these analyses. The dataset must include birthdates and dates of vaccine administration.

62
Table 38. Calculation of number of visits needed to update a child’s vaccination schedule
Stage Example Children in each category (%)
1. Select the vaccines of interest. Polio: 1st, 2nd, and 3rd doses; Pentavalent, 1st, 2nd, and 3rd doses; MMR vaccine,1st dose
2. Choose a group of children who meet the age criteria for the vaccines of interest. Children aged 18-35 months
3. The total number of children in this age group is the denominator.
There were 2,419 children aged 18-35 months at the time of the survey.
4. Count the number of vaccines that each child must receive to be up to date by a given age.
Count all the missing vaccines not administered by age 18 months. Child A received 3 doses of polio, 3 doses
of pentavalent, and no doses of MMR vaccine. Child A is missing one vaccine. Child B received 3 doses of polio, 3 doses
of pentavalent, and 1 MMR dose. Child B it is not missing any vaccines. Child C received 2 doses of polio, 1 dose of
pentavalent, and 1 dose of MMR vaccine. Child C is missing 3 vaccines.
5. Count the number of children with complete immunization schedules for their ages. This figure is the numerator.
1,908 children received the seven vaccines before age 18 months.
1,908 children who received the seven vaccines before age 18 months (weighted)
2,419 children age 18-35 months (weighted)
= 79.1% (CI 95%: 77.0-81.2).
6. Count the number of children missing one or more vaccines, then subtract the number of children with complete immunization schedules from the total.
2,419 [minus] 1,908 = 511

63
This figure is the new denominator.
7. For each child, determine how many of the missing vaccines could be administered during the same visit. All vaccines that could be given at the same visit should be administered. Additional visits may be needed when the child is missing more than one vaccine in the same series.
Child A needs one visit to update his/her MMR vaccine.
Child B is already up to date. Child C needs two visits to get up to
date: one for the 3rd polio dose and 2nd pentavalent dose and another visit for the 3rd pentavalent dose.
8. Count the number of children who need one visit to be brought up to date. This figure is a numerator.
344 children need one visit to be brought up to date.
344 children who need one visit to be brought up to date (weighted) 511 children missing
at least one vaccine (weighted)
= 66.8% (CI 95%: 62.7-70.9)
9. Count the number of children who need two visits to be brought up to date. This number is also a numerator.
29 children need two visits to be brought up to date.
29 children who need two visits to be brought up to date (weighted)
511 children missing at least one vaccine (weighted)
= 5.8% (95% CI: 3.9-7.7)
10. Count the number of children who need three visits to be brought up to date. This number is also a numerator.
138 children need three visits to be brought up to date.
138 children who need three visits to be brought up to date (weighted)
511 children missing at least one vaccine (weighted)
= 27.4% (95% CI: 23.6-31.1)

64
In Annex 5, the codes for analyzing vaccination coverage surveys using SAS statistical software can be found. The Vaccination Coverage Quality Indicators (VCQI) code from the WHO is another option for the analysis of coverage surveys, which can be obtained by writing to [email protected].
Step 4: Additional analyses Coverage surveys generate various data that are important to analyze to optimize their use and to provide knowledge to the programs. Each analysis should start with the formulation of a research question. Answering this question requires the use of appropriate analytical tools. Examples of other research areas include trends, data quality, combined information sources, and analytical models. Some research tools are briefly described below.
Modeling techniques can be used to better understand the risk factors associated with late vaccination and non-vaccination. The literature shows that there are three types of models to study the timeliness of vaccination.
4.1. Logistic regression
Logistic regression models make it possible to study discontinuous dichotomous or qualitative variables, such as:

65
Vaccine administered or not administered.
Timely or late administration.
Simultaneous or not simultaneous vaccination.
4.2. Cox proportional hazards model
Criteria for assessing the time elapsed up to the event (Cox regression) include:
Application of a given individual dose.
Completion of the series.
4.3. Poisson regression
Poisson regression is used to calculate group data rates. When modeling techniques are applied to vaccination data, the strategy usually involves:
1. Selecting covariates to be modeled, depending on the study design and available data. Timeliness models in the literature include the following elements:
Factors related to the child or family (i.e., education of the mother, socioeconomic status).
Factors related to an individual professional or health facility (i.e., a public or private facility directed by a physician, nurse, or another type of vaccinator).
Factors related to the community (i.e., region, urban or rural residence, violence in the community).
2. Verifying assumptions for the type of model.
3. Evaluating interaction and confounding factors.
4. Verifying the final model’s goodness of fit.
When modeling is used to analyze vaccination, remember that the dates of a series of doses are not independent of the dates of previous doses in the same series—i.e., timeliness models must include dates of the previous doses, whether or not they were timely. To address this problem, investigators in previous studies have variables like administration of the entire series or time required to complete the series, in lieu of individual doses (26).
Though surveys provide valuable data for different analyses, teams must also consider the study’s sampling design, representativeness, and data quality in order to understand the evaluation’s scope and limitations and appropriately interpret the results.
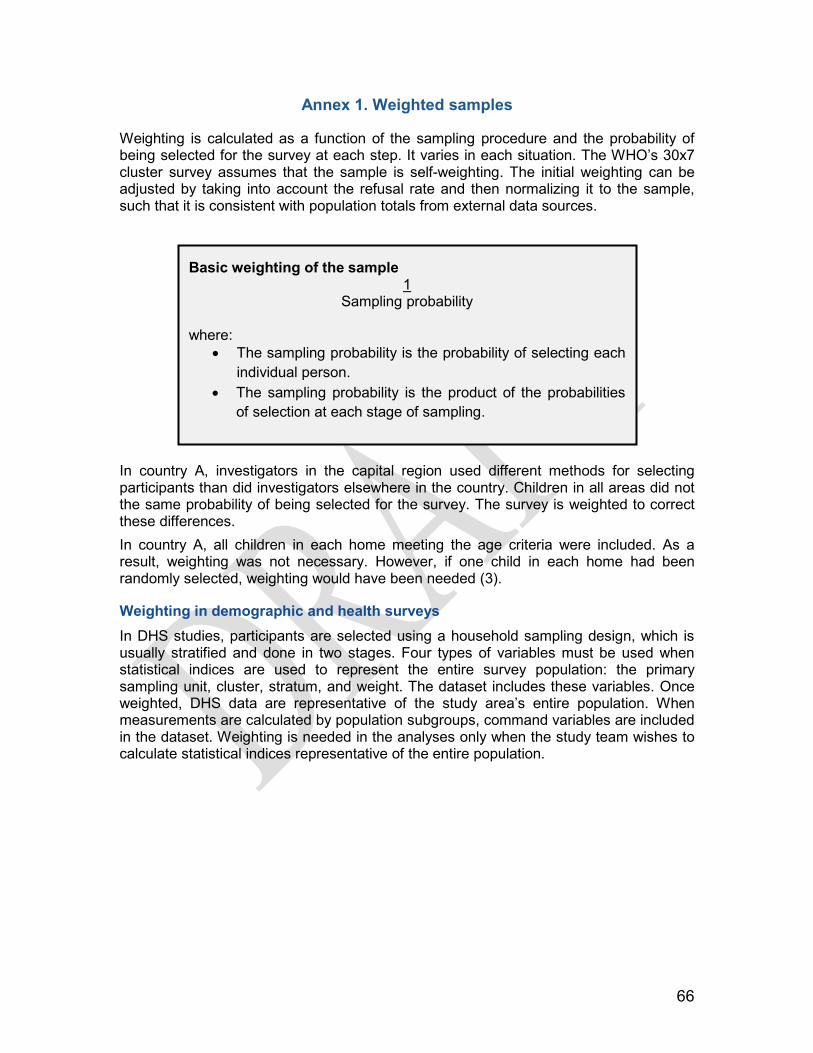
66
Annex 1. Weighted samples
Weighting is calculated as a function of the sampling procedure and the probability of being selected for the survey at each step. It varies in each situation. The WHO’s 30x7 cluster survey assumes that the sample is self-weighting. The initial weighting can be adjusted by taking into account the refusal rate and then normalizing it to the sample, such that it is consistent with population totals from external data sources.
In country A, investigators in the capital region used different methods for selecting participants than did investigators elsewhere in the country. Children in all areas did not the same probability of being selected for the survey. The survey is weighted to correct these differences. In country A, all children in each home meeting the age criteria were included. As a result, weighting was not necessary. However, if one child in each home had been randomly selected, weighting would have been needed (3).
Weighting in demographic and health surveys In DHS studies, participants are selected using a household sampling design, which is usually stratified and done in two stages. Four types of variables must be used when statistical indices are used to represent the entire survey population: the primary sampling unit, cluster, stratum, and weight. The dataset includes these variables. Once weighted, DHS data are representative of the study area’s entire population. When measurements are calculated by population subgroups, command variables are included in the dataset. Weighting is needed in the analyses only when the study team wishes to calculate statistical indices representative of the entire population.
Basic weighting of the sample 1
Sampling probability
where: • The sampling probability is the probability of selecting each
individual person. • The sampling probability is the product of the probabilities
of selection at each stage of sampling.
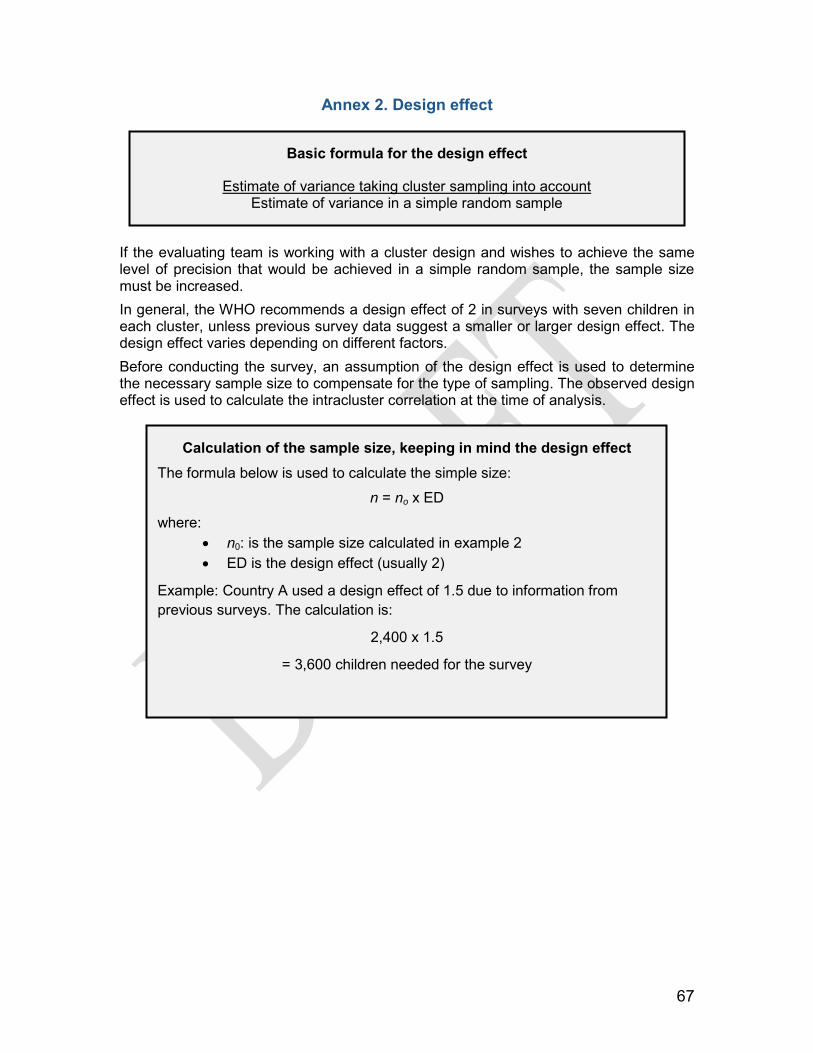
67
Annex 2. Design effect
If the evaluating team is working with a cluster design and wishes to achieve the same level of precision that would be achieved in a simple random sample, the sample size must be increased. In general, the WHO recommends a design effect of 2 in surveys with seven children in each cluster, unless previous survey data suggest a smaller or larger design effect. The design effect varies depending on different factors. Before conducting the survey, an assumption of the design effect is used to determine the necessary sample size to compensate for the type of sampling. The observed design effect is used to calculate the intracluster correlation at the time of analysis.
Basic formula for the design effect
Estimate of variance taking cluster sampling into account Estimate of variance in a simple random sample
Calculation of the sample size, keeping in mind the design effect The formula below is used to calculate the simple size:
n = no x ED
where: • n0: is the sample size calculated in example 2 • ED is the design effect (usually 2)
Example: Country A used a design effect of 1.5 due to information from previous surveys. The calculation is:
2,400 x 1.5
= 3,600 children needed for the survey

68
Annex 3. Intracluster correlation
Intracluster correlation, or intraclass correlation, is a statistical characteristic showing whether the measurements of interest tend to be more similar among participants in a given cluster. Higher correlations indicate greater similarity, and therefore less information will be obtained if more participants from the same cluster are selected. The result is a larger design effect. Intracluster correlation can be calculated based on survey data using the observed design effect and the average number of responses on each cluster (3).
Although cluster surveys usually were assumed to have a design effect of 2, intracluster correlation is useful in documenting the design needs and sample size of future surveys measuring the same factors. Of note, the correlation is a characteristic of the population and not of the study design.
In a 30x7 survey design, the intracluster correlation is expected to be nearly 0.167. Since this correlation is a characteristic of the population and is specific for the vaccine and dose being measured, there may be considerable variability in this value among countries, age groups, and vaccines.
Calculation of the Intracluster Correlation Formula for the intracluster correlation:
Design effect [minus] 1 Average responses per cluster [minus] 1
= Intracluster correlation
Example of intracluster correlation for the MMR vaccine:
1.7734 design effect for the MMR vaccine [minus] 1 average of 8.7 children per cluster
= 0.100

69
Annex 4. Steps for creating inverted Kaplan-Meier curves using the R statistical program
The steps for creating inverted Kaplan-Meier figures using R, a free statistical program that provides a wide range of tools for building analytical models and generating a variety of figures, are described below.
Words in bold correspond to the names of the variables or the location of files that are specific to the situation under evaluation. These words can be changed without affecting the code itself.
The symbol # indicates comments in the code. When this symbol appears, R understands that the text is not an instruction and the program is not affected.
To create Kaplan-Meier figures using subpopulations, sufficient data for each subpopulation is needed. An adequate amount of data is at least one child each from 13 different clusters in each subpopulation. For more information on limitations, please see: http:/www.cdc.gov/nchs/tutorials/NHANES/Surveydesign/VarianceEstimation/Info3. htm

70
Annex 5. Steps for analyzing vaccination coverage surveys using SAS statistical software
The steps for provide another option for analyzing vaccination coverage surveys using SAS statistical software.
References
1 Pan American Health Organization. Vaccinate your family. Protect your community. Meeting of the
Technical Advisory Group on Vaccine-Preventable Diseases (TAG), Buenos Aires, July 2011. Available from: http://www.paho.org/hq/index.php?option=com_docman&task=doc_download&gid=14164&Itemid=&lang=en
2 United States Agency for International Development. Immunization essentials: A practical field guide. Washington, DC: USAID; 2003. Available from: http://pdf.usaid.gov/pdf_docs/PNACU960.pdf.
3 World Health Organization. Vaccination Coverage Cluster Survey Refrence Manual. Available from: http://www.who.int/immunization/monitoring_surveillance/Vaccination_coverage_cluster_survey_with_annexes.pdf?ua=1 4 World Health Organization. Immunization coverage. Survey methods. Available from:
http://www.who.int/immunization/monitoring_surveillance/routine/coverage/en/index2.html 5 World Health Organization. Practical guide for the design, use and promotion of home-based records in
immunization programmes. Available at: http://www.who.int/immunization/documents/monitoring/who_ivb_15.05/en/
6 Cutts FT, Izurieta HS, Rhoda DA. Measuring Coverage in MNCH: Design, implementation, and interpretation challenges associated with tracking vaccination coverage using household surveys. PLoS Med. 2013;10(5):e1001404.
7 Rutstein, SO, Rojas G. Demographic and health surveys methodology: Guide to DHS statistics. Demographic and Health Surveys, ORC Macro; Sep 2006 [cited 2014 May 7]. Available from: http://dhsprogram.com/publications/publication-dhsg1-dhs-questionnaires-and-manuals.cfm
8 United States Agency for International Development. Demographic and health surveys methodology: sampling and household listing manual. Sep 2012. [cited 2014 May]. Available from: http://dhsprogram.com/pubs/pdf/DHSM4/DHS6_Sampling_Manual_ Sept2012_DHSM4.pdf
9 United States Agency for International Development. Demographic and health surveys methodology: Standard recode manual for DHS 6. V. 1.0 (2013 March 22). [cited 2014 May]. Available from: http://dhsprogram.com/pubs/pdf/DHSG4/Recode6_DHS_22March2013_DHSG4.pdf
10 Luhm KR, Cardoso MR, Waldman EA. Vaccination coverage among children under two years of age based on electronic immunization registry in southern Brazil. Rev Saude Publica. 2011;45(1):90-8. 11 Braeckman T, Lernout T, Top G, Paeps A, Roelants M, Hoppenbrouwers K, et al. Assessing vaccination coverage in infants, survey studies versus the Flemish Immunization Register: Achieving the best of both worlds. Vaccine. 2014;32(3):345-9. 12 Pan American Health Organization. Immunization: Prioritizing vulnerable populations. Meeting of the
Technical Advisory Group on Vaccine-Preventable Diseases (TAG), San José, Costa Rica; 2009 Aug. Available from: http://www2.paho.org/hq/dmdocuments/2010/tag18_2009_Final%20Report_Eng.pdf
13 Stokley S, Maurice E, MS, Smith PJ, Klevens M. Evaluation of invalid vaccine doses. Am J Prev Med. 2004;26(1):34-40.
14 World Health Organization. Recommendations for routine immunization - summary tables. http://www.who.int/immunization/policy/immunization_tables/en/ 15 Centers for Disease Control and Prevention. Epidemiology and prevention of vaccine-preventable
diseases. Atkinson W, Wolfe S, Hamborsky J, editors. 22.nd ed., Washington, DC: Public Health Foundation; 2012.
16 World Health Organization. BCG vaccine. Wkly Epidemiol Rec. 2004;79(4):27-38. Available from: http://www.who.int/wer/2004/en/wer7904.pdf?ua=1

17 World Health Organization. Hepatitis B vaccines. Wkly Epidemiol Rec. 2009;84(40): 405-19. Available
from: http://www.who.int/wer/2009/wer8440.pdf?ua=1 18 World Health Organization. Meeting of the Strategic Advisory Group of Experts on immunization, April
2012; conclusions and recommendations. Wkly Epidemiol Rec. 2012;87(21):201-16. 19 Pan American Health Organization. Paving the way for immunization. Meeting of the Technical
Advisory Group on Vaccine-Preventable Diseases (TAG), Washington, DC: OPS; Oct, 2012. Available from: http://www.who.int/immunization/sage/meetings/2012/november/9_FINAL_ TAG_Meeting_2012_report.pdf
20 World Health Organization. Measles vaccines: WHO position paper. Wkly Epidemiol Rec. 2009;84(35):349-60. Available from: http://www.who.int/wer/2009/wer8435.pdf?ua=1
21 Dayan GH, Shaw KM, Baughman AL, Orellana LC, Forlenza R, Ellis A, et al. Assessment of delay in age-appropriate vaccination using survival analysis. Am J Epidemiol. 2006;163(6):561-70. 22 Luman ET, McCauley MM, Stokley S, Chu SY, Pickering LK. Timeliness of childhood im m
Pediatrics. 2002;110:935-9. 23 Pan American Health Organization. Final report of the XXI Technical Advisory Group (TAG) Meeting on Vaccine-preventable Diseases of the Pan American Health Organization, held in Quito, Ecuador, 3-5 July 2013. Available at: http://www.paho.org/hq/index.php?option=com_content&view=article&id=1862%3Atechnical-advisory-group-vaccine-preventable-diseases&catid=1549%3Ainformation-products&Itemid=39430&lang=en 24 Clark A, Sanderson C. Timing of children's vaccinations in 45 low-income and middle-income countries: An analysis of survey data. Lancet. 2009;373(9674):1543-9. 25 World Health Organization. Reducing pain at time of vaccination position paper. Available at: http://www.who.int/immunization/policy/position_papers/reducing_pain_vaccination/en/ 26 Cutts FT, Izurieta HS, Rhoda DA (2013) Measuring Coverage in MNCH: Design, Implementation, and Interpretation Challenges Associated with Tracking Vaccination Coverage Using Household Surveys. PLoS Med 10(5): e1001404.