Embed Size (px)
Citation preview
National Waste Processing Conference Proceedings ASME 1994
ANALYSIS OF DATA OBTAINED FROM AN HISTORIC ASH RESIDUE
LEACHING INVESTIGATION
FLOYD HASSELRIIS Consulting Engineer
Forest Hills, New York
ABSTRACT
The leaching characteristics of metals in ash residues from combustion of municipal waste are important factors in determining how the residues can be disposed of or beneficially used. The leachability of regulated metals is affected by waste composition, its combustion history, and handling methods. Samples of mixed flyash and bottom ash were analyzed in accordance with the extraction procedure (EP) toxicity test at a waste-to-energy facility in 1982 and found to exhibit highly variable concentrations of lead and cadmium. This variability was found to be caused by flyash deposits, containing high concentrations of these volatile metals, which were periodically released during boiler cleaning. Analysis of extracts from flyash samples taken from six boiler and ESP hoppers showed substantial differences in metals concentrations from each hopper. Particle size analysis of flyash from each hopper revealed a relationship between the amount of extractable heavy metals and fine particulate. Leaching tests of flyash revealed the relationship between extracted lead and cadmium and the pH of the leachate, and the sensitivity of lead to low and high pH values. Analysis of samples taken from borings of the on-site ash residue storage pile showed that EP extractable metals concentrations were reduced far below regulatory levels after several years of exposure to natural rain. Graphical representations of data are shown to be useful tools for interpretation of data. Statistical analysis is used to evaluate the variability of lead and cadmium in extracts, and to determine the 90% upper confidence limit (VCL) in accordance with EPA procedures. The cyclical cleaning of the boiler created difficulties in obtaining representative samples and accurate
107
estimates of EP toxicity results. The time at which samples were collected during a shift greatly influenced the results of sampling.
BACKGROUND
The social acceptability of waste-to-energy technology depends upon the public perception of not only the environmental and health risk resulting from stack emissions, but also of the characteristics of the ash residues which represent about 25% (dry weight) of municipal waste. Environmentalists, devoted to the principle that there should be as little waste as possible, have achieved an important objective in obtaining governmental and public support of the hierarchy that waste should be eliminated or reduced in manufacturing processes, reduced in products, at the source, recycled to useful products, and burned or landfilled only as a last resort. In pursuit of this objective, activists developed public opposition to incineration, which was associated in the public mind with black smoke and general pollution. The development of waste-to-energy power plants having efficient combustion and emission control systems eliminated this basis for opposition. However, activists expressed concern that WTE systems would absorb so much waste that efforts to promote recycling would be frustrated, and shifted their focus to the ash residues of WTE facilities. Law suits have been brought against facilities in New York and Chicago, claiming that the ash residues were toxic, should be classified as hazardous wastes and should be sent to hazardous waste landfills.
Flyash and bottom residues from the combustion of coal have been processed and used as fill, in road construc-
tion and in cement block manufacture ever since coal was used as a fuel. In Europe where landfill space is at a premium and especially where aggregate materials are scarce or precious, ash residues from coal-fired power and heating plants, as well as from MSW combustion are commonly used. Beneficial use of MSW residues has been encouraged, provided that strict regulations and rules were followed, requiring residue analysis, and limiting the conditions of application. (Hjelmar)
In the US, many states are progressing in the development and implementation of procedures for environmentally sound use of ash residues in road construction and other purposes. (Kosson, Chesner)
Impact of the Resource Recovery and Conservation Act
At the time the Resource Conservation and Recovery Act (RCRA) was passed, many efforts were under way to use municipal waste and ash residues as a resource which should be conserved. The Federal Highway Department sponsored demonstrations of the use of MSW ash residues in highway construction. The focus was on total recovery of resources from MSW: energy was the largest component, and ferrous and other metals were second. A facility in Dade County, FL employing wet processing claimed to achieve 95% recovery by extracting energy and power from all combustibles, reclaiming all metals, including coins, and using bottom ash as aggregate: flyash was sent to the local cement plant.
Many plans to beneficially use ash residues were set aside after the US EPA published new rules in 1980, and SW -846, test methods for evaluating solid waste. Results of sporadic testing of ash from various WTE facilities showed that many ash samples failed the Extraction Procedure (EP) test for lead. These limited data were used as the basis for claiming that this "toxic ash" was an environmental hazard, more so than MSW itself, and that WTE facilities should not be built or allowed to operate unless the ash was sent to costly hazardous waste landfills. To counter this perception, a major study was implemented to determine the composition of actual leachates from MSW landfills and dedicated ashfills: the findings were that the leachates contained high concentrations of soluble salts, similar to brackish water, but insignificant amounts of the toxic metals. (Cundari, Roffman)
The need for a thorough understanding of the characteristics of ash residues from MSW combustion led to the establishment of the International Ash Working Group, which has produced a monumental set of documents based on extensive research carried out primarily in the US, Canada and Europe.(IA WG) In the meantime, ash residues are being deposited in secure ashfills.
108
FINE IIAeNrnc M£TA� ")' �
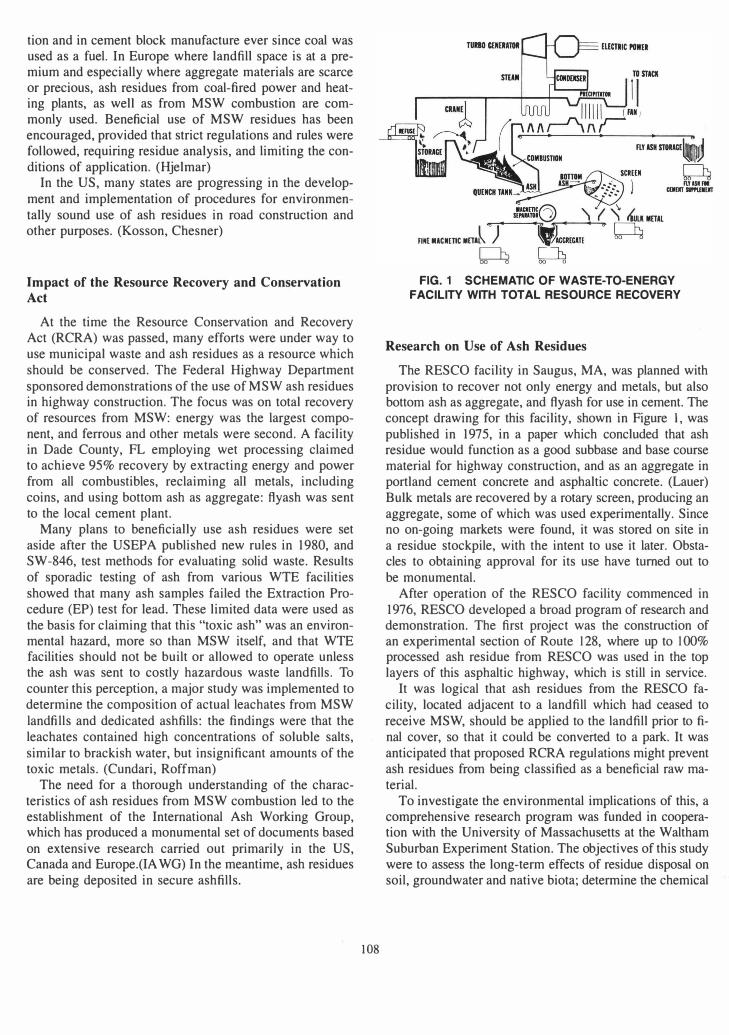
FIG. 1 SCHEMATIC OF WASTE-TO-ENERGY
FACILITY WITH TOTAL RESOURCE RECOVERY
Research on Use of Ash Residues
The RESCO facility in Saugus, MA, was planned with provision to recover not only energy and metals, but also bottom ash as aggregate, and flyash for use in cement. The concept drawing for this facility, shown in Figure I, was published in 1975, in a paper which concluded that ash residue would function as a good subbase and base course material for highway construction, and as an aggregate in portland cement concrete and asphaltic concrete. (Lauer) Bulk metals are recovered by a rotary screen, producing an aggregate, some of which was used experimentally. Since no on-going markets were found, it was stored on site in a residue stockpile, with the intent to use it later. Obstacles to obtaining approval for its use have turned out to be monumental.
After operation of the RESCO facility commenced in 1976, RESCO developed a broad program of research and demonstration. The first project was the construction of an experimental section of Route 128, where up to 100% processed ash residue from RES CO was used in the top layers of this asphaltic highway, which is still in service.
It was logical that ash residues from the RESCO facility, located adjacent to a landfill which had ceased to receive MSW, should be applied to the landfill prior to final cover, so that it could be converted to a park. It was anticipated that proposed RCRA regulations might prevent ash residues from being classified as a beneficial raw material.
To investigate the environmental implications of this, a comprehensive research program was funded in cooperation with the University of Massachusetts at the Waltham Suburban Experiment Station. The objectives of this study were to assess the long-term effects of residue disposal on soil, groundwater and native biota; determine the chemical
characteristics of leachates from both flyash and residue alone and over native soils; determine the relative contribution of flyash and bottom ash to the overall chemistry of residue; and make recommendations as to the proper disposition of flyash and/or residue, based on available data. The studies investigated the application of ash residues as a soil enhancer and landfill cover. Both laboratory leaching columns and full-scale land areas were part of this research program. The leaching columns produced data on the characteristics of leachate using different ash and soil combinations. Plant behavior and metals uptake was studied along with analysis of soils and groundwater at the agricultural and wetland demonstration plots. The environmental impact of a stockpile of ash residues was also studied. (Feder & Mica)
Research was carried out at the Saugus facility to determine the leaching characteristics of ash residues. The possibilities of washing out the metals were explored: it was found that the major soluble component, salt, was readily removed, as well as cadmium, lead and other metals. This approach has been demonstrated by others. (Has- . selriis, 1991) Chemical treatment of ash to reduce the solubility of lead and cadmium was explored: this research led to the development of the phosphoric acid treatment technology, first demonstrated at the Claremont, NH facility, culminating in the patented Wes-Pfix process. (Forrester, 1993) (Eighmy) (Holland)
Further research and demonstration has taken into account the characteristics of mixed ash residues and flyash from facilities employing acid gas controls. The cementitious qualities of ash residues have beneficial properties in regard to management of ash in landfills, and in the production of concrete blocks. (Donnelly) (Goodwin) (Roethel)
RCRA and the Extraction Procedure Toxicity Test
While these activities were taking place, the USEPA was developing methods of classifying waste materials, as a screening procedure, to identify their characteristics, including leaching potentials of toxic metals. (USEP A, 1980) The Massachusetts Department of Air Quality Engineering asked the operators of the Saugus WTE facility to collect and analyze samples of the ash residues which were being deposited in the ash storage pile located adjacent to the facility on land adjacent to a salt marsh.
The EP Toxicity test was developed to simulate the leaching a waste would undergo if disposed of in an improperly designed sanitary landfill. At Oak Ridge National Laboratory, leachate collected from vats containing MSW was used to determine the leaching characteristics of MSW ash collected from various sites. (Francis, 1984, 1987) The MSW leachate seldom exhibited a pH as low as 5.0; however, this threshold was selected as a conservative
109
level to be used as a basis for screening of substances to determine the potential for leaching of heavy metals such as lead and cadmium. The selection of this pH level, and the procedure which was developed, were unfortunate, as it turned out: this test has not been found to simulate behavior of ash residues in landfills nor in beneficial uses, yet it was perceived by the public on the basis of this test that ash residues actually are hazardous to human health and the environment. (Roffman)
RESCO proceeded to collect ash samples and send them out to various laboratories to have them analyzed in accordance with the Extraction Procedure Toxicity Test (EP test). The test results showed a wide range in lead and cadmium in the leaching extracts. Different laboratories did not produce the same results from duplicate samples. It was suspected that there were serious problems inherent in the EP procedures. Further investigations proved that this was indeed so. Ultimately these problems resulted in revisions in the procedures and development of the Toxicity Characteristic Leaching Procedure (TCLP). This procedure has not been found to simulate the environmental behavior of MSW ash residues, at least on a short-term basis. (USEPA, 1989) The highly variable results from analyzing samples of Saugus ash residues might be attributed to the procedures used to obtain representative samples of the residue, to extract the leachate in the laboratory, or to analyze the leachate. RESCO decided to carry out comprehensive research on methods of sampling and characterizing ash residues from the facility.
The Waltham Center which was doing the research on environmental impacts of ash application to soils, under the direction of Drs. Feder and Mica, was equipped with a soil analysis laboratory which performed analyses for the general public at a small cost per sample. Parallel analysis indicated that the Waltham laboratory obtained essentially the same results as commercial certified laboratories, but offered the possibility of carrying out extensive research on ash residues involving collecting and analysis of hundreds of samples at relatively modest cost.
Development of Ash Sampling Program
Statistical analysis is needed in order to interpret data, and to estimate the true average or mean of a given property, to determine whether it meets the required standard. The USEPA test method for evaluating solid waste (SW-846) emphasizes the importance of collecting representative samples which will exhibit average properties of the whole waste stream. (USEP A, 1989) It states that enough samples must be collected over a period of time sufficient to represent the variability of the wastes. Sampling accuracy (the closeness of a sample value to its true value) and sampling precision (the closeness of repeated
sample values) are "issues of overriding importance in any scientific assessment of sampling practices."
"The primary objectives of a sampling plan for a solid waste are to collect samples that will allow sufficiently accurate and precise measurements of the chemical properties of the waste." For purposes of evaluating solid wastes, the probability level (confidence interval) of 80% has been selected by EPA. For each chemical contaminant of concern, a confidence interval (CI) is described within which the true mean (I-') probably occurs, if the sample is representative, which is expected of about 80 out of 100 samples. The upper limit of the 80% CI is the upper confidence limit, or UCL, which is then compared with the appropriate regulatory threshold. The UCL for practical purposes represents a 90% chance that the true mean is less than this upper limit.
Sampling accuracy is usually obtained by some form of random sampling, in which every unit in the population has a theoretically equal chance of being sampled and measured. Sampling precision is achieved by taking an appropriate number of samples from the population. The validity of a CI for the true mean is based on the assumption that individual concentrations of the contaminant exhibit a normal distribution. In a normally distributed population, the mean (x), would be expected to be greater than the variance (s2
), or the square of the standard deviation (s) of the sample. Samples of ash residues, as we shall see below, are found to be log-normally distributed, and the standard deviation, s, is usually close to the mean.
It is important when establishing and maintaining a sampling program, to decide where to collect the samples, how they should be collected, what their weight should be, how frequently and exactly when they must be taken, and how many laboratory analyses are needed. ASTM standard procedures can be used to determine the system variance, random variance, and the variance of division and analysis. This information is used to determine the number and weight of samples required to attain an acceptable precision in the estimate of the mean of the property in question. (Hasselriis, 1985)
The ash residues from MSW combustion may be exempt from RCRA. However, it is prudent, if not necessary, to carry out EP (now TCLP) leaching analysis of the ash samples, especially if it is intended to use the residues beneficially.
Practically speaking, for ash residues, EPA requires that the calculated 90% upper confidence limit (UCL) of a property must be less than the regulatory threshold (RT) for the pollutants of concern. For MSW ash residues, the RTs for EP extracts for the most critical metals, lead and cadmium, are 5 mgll and 1 mg/I, respectively. The upper confidence limit is determined by the following equation:
ueL = x + to.20(s/n 1\ 0.5)
110
where
x = arithmetic mean s = standard deviation
to.02 = student t for n - 1 samples, and n = the number of samples.
The student to.20, obtained from tables, applies to an 80% confidence interval, so that the UCL represents 90% of the samples. If the samples do not have a normal distribution, the standard deviation must be obtained from transformed data. Ash residue data are found to be lognormally distributed, hence the logarithms of the data are used to obtain the standard deviation, and this value transformed back to obtain s. Failing to transform the data may underestimate the UCL.
The number of samples which must be collected and analyzed in order to demonstrate compliance with the EP standards can be determined by the following equation:
n = [to.20 * [sf /[Af
where [A] = Regulatory Threshold -x = RT - x The closer x is to the RT, the larger the number of sam
ples which will be needed. This number can be estimated from preliminary data and refined after more data are available. As a minimum, six to eight samples are needed.
ASH RESIDUE TESTING PROGRAM
A sampling program was initiated at the Saugus facility, to characterize the mixed bottom ashlflyash as discharged from
· the facility. The first step was to evaluate the ash
residues over a one-week period. Samples of the ash residues leaving the quench tank were collected every four hours to accumulate daily composites, which were reduced by coning and quartering according to ASTM procedures, to obtain duplicate laboratory samples. Daily samples were obtained on six consecutive days, to represent a week of
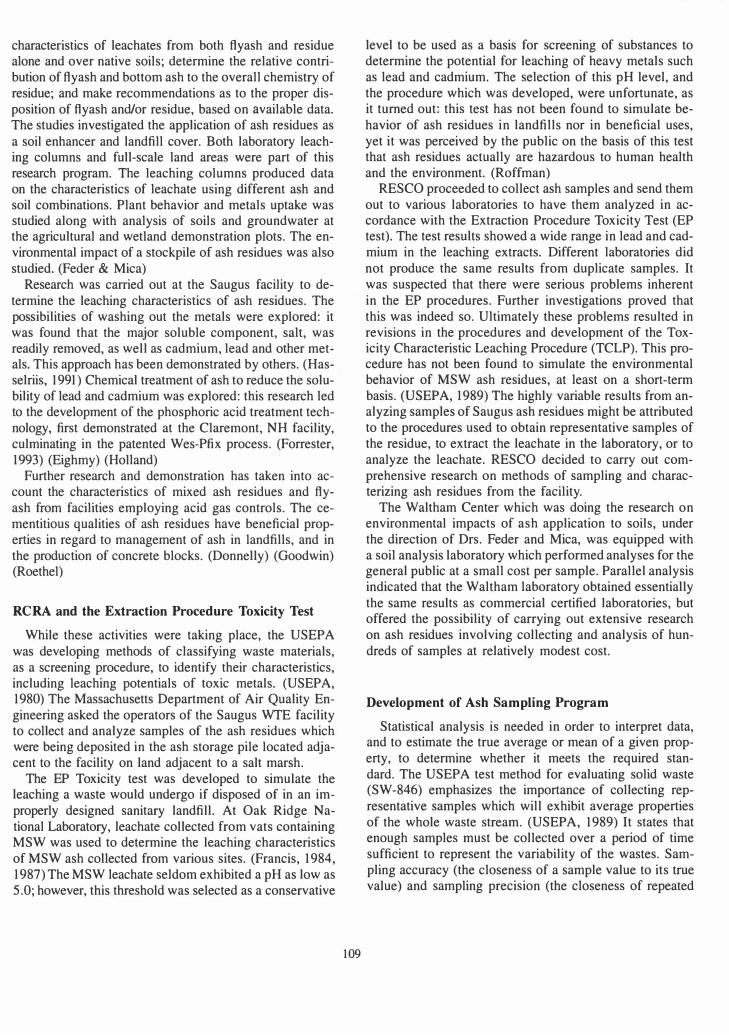
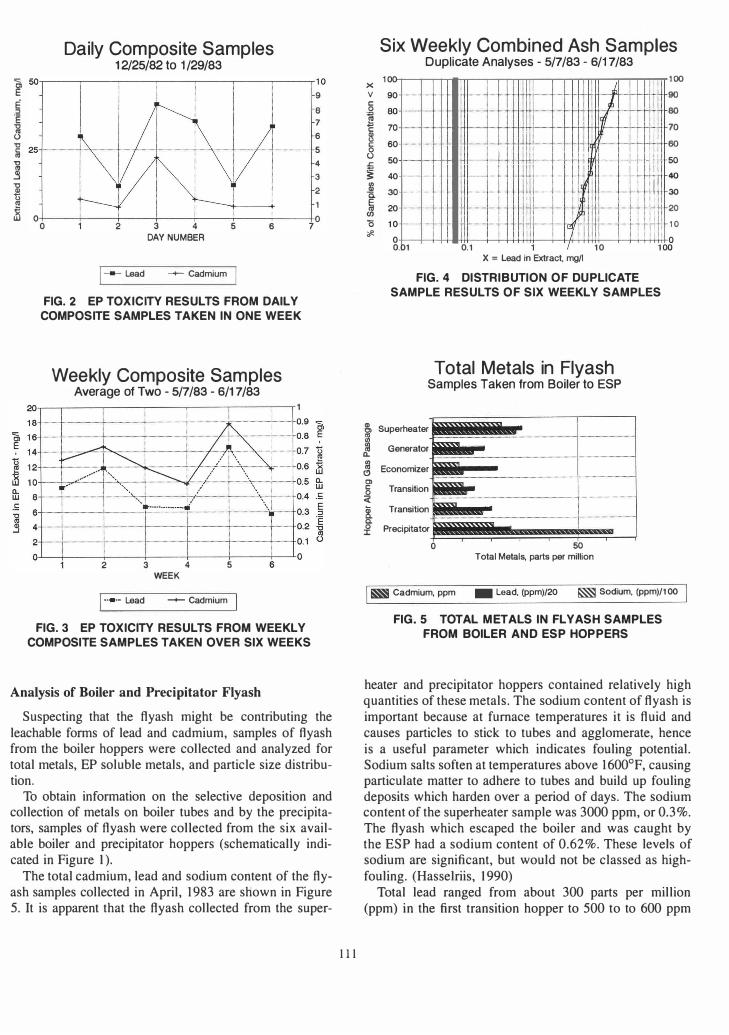
. operation. The concentrations of lead and cadmium in the extracts obtained in accordance with the EP procedure are shown in Figure 2. The extracts of all of the samples exceeded the regulatory limit of 5 mg/I for lead, and occasionally passed the I mgll limit for cadmium.
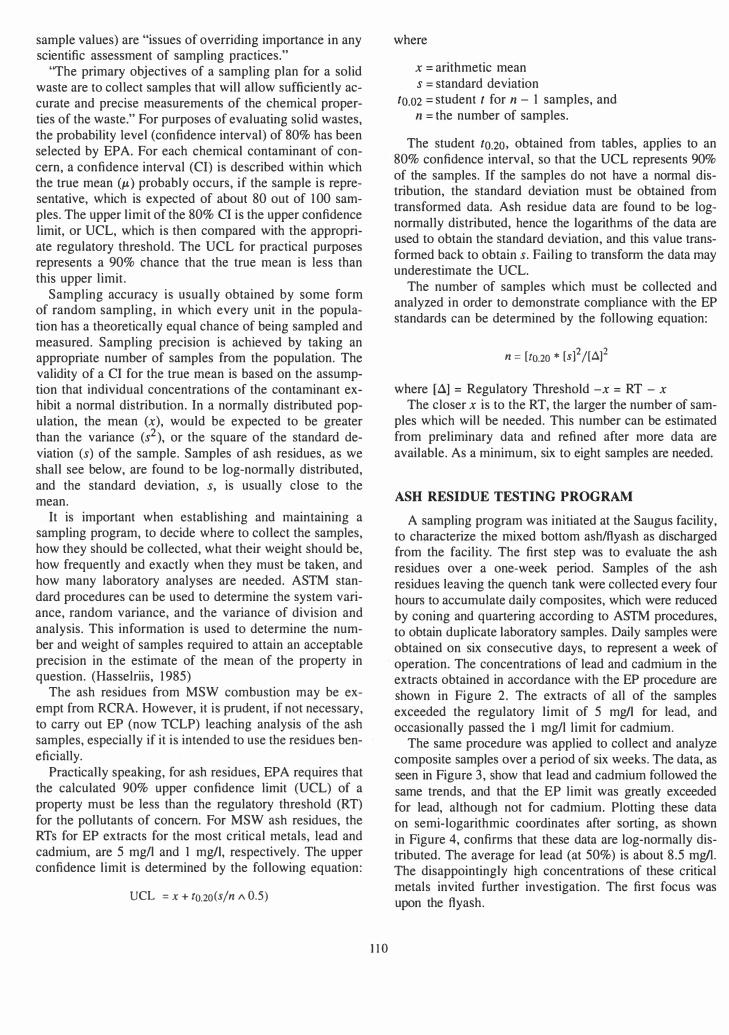
The same procedure was applied to collect and analyze composite samples over a period of six weeks. The data, as seen in Figure 3, show that lead and cadmium followed the same trends, and that the EP limit was greatly exceeded for lead, although not for cadmium. Plotting these data on semi-logarithmic coordinates after sorting, as shown in Figure 4, confirms that these data are log-normally distributed. The average for lead (at 50%) is about 8.5 mg/1. The disappointingly high concentrations of these critical metals invited further investigation. The first focus was upon the flyash.
Daily Composite Samples 1 2/25/82 to 1/29/83
� w,----,----,----,----,----,----,----, 10 � 9 g 6 � 7 J 6 � ----- ------- 5
] ; j 0 � o 2 3 4 5 6 7
DAY NUMBER
1--- Lead --- Cadmium
FIG. 2 EP TOXICITY RESULTS FROM DAILY
COMPOSITE SAMPLES TAKEN IN ONE WEEK
Weekly Composite Samples Average of Two - 5/7/83 - 6/1 7/83
2 3 4 WEEK
5
I··.··· Lead -+- Cadmium 1 6
FIG. 3 EP TOXICITY RESULTS FROM WEEKLY
COMPOSITE SAMPLES TAKEN OVER SIX WEEKS
Analysis of Boiler and Precipitator Flyash
Suspecting that the flyash might be contributing the leachable forms of lead and cadmium, samples of flyash from the boiler hoppers were collected and analyzed for total metals, EP soluble metals, and particle size distribution.
To obtain information on the selective deposition and collection of metals on boiler tubes and by the precipitators, samples of flyash were collected from the six available boiler and precipitator hoppers (schematically indicated in Figure 1).
The total cadmium, lead and sodium content of the flyash samples collected in April, 1983 are shown in Figure 5. It is apparent that the flyash collected from the super-
III
X v c: 0 � � � c: 8 :5 � !ll
c. � (/) '0 *-
Six Weekly Combined Ash Samples Duplicate Analyses - 5/7/83 - 6/17/83
100 90 -60 .H ..... ___
70 r-' 60 --50 -.-40 _."-_ .. -30 --_ ..
20 _.-
10 ._
--
0 0.Q1
----- .. ---_ . - _ . .
--_. -.H._ ..
-
--
.•. ��= ••...• �=- ··j �==·ll!· . � . . ___ � .
_ . . __ _ _ - ..... 1 - ----- -- .. �_. . W . . . --- - -1+ - . .. -l- f· -----.lUI 40 . . ..- -It -- . . -- J- - .. .. --- -- - - JJ 30
===�t . . . �--= 1-+ =I��-�r:� ��
0.1 'I 10 108 x = Lead in Extract, mg/I
FIG. 4 DISTRIBUTION OF DUPLICATE
SAMPLE RESULTS OF SIX WEEKLY SAMPLES
Total Metals in Flyash Samples Taken from Boiler to ESP
2l, Superheater J Generator
� Economizer C>
� � ---
� § Transition < � Transition � c. :£ PreCipitator
o W Total Metals, parts per million
� Cadmium, ppm _ Lead, (ppm)/20 � Sodium, (ppm)/l00
FIG.5 TOTAL METALS IN FLYASH SAMPLES
FROM BOILER AND ESP HOPPERS
heater and precipitator hoppers contained relatively high quantities of these metals. The sodium content of flyash is important because at furnace temperatures it is fluid and causes particles to stick to tubes and agglomerate, hence is a useful parameter which indicates fouling potential. Sodium salts soften at temperatures above 1600°F, causing particulate matter to adhere to tubes and build up fouling deposits which harden over a period of days, The sodium content of the superheater sample was 3000 ppm, or 0.3%. The flyash which escaped the boiler and was caught by the ESP had a sodium content of 0.62%. These levels of sodium are significant, but would not be classed as highfouling. (Hasselriis, 1990)
Total lead ranged from about 300 parts per million (ppm) in the first transition hopper to 500 to to 600 ppm
CD g> (J) lQ
a..
lQ <.'J OJ c: 0 -
« �
CD a. a. 0
:I:
EP Soluble Metals in Flyash Samples Taken from Boiler to ESP
Superheater
Generator
Economizer
Transition
Transition
Precipitator
Metals in Extract, mg/I
Cadmium, mg/l Lead, mg/l
FIG.6 EP SOLUBLE METALS IN FLYASH SAMPLES FROM BOILER AND ESP HOPPERS
in the ESP and superheater hopper samples, and total cadmium ranged from 10 to 60 ppm. What matters more than the total metal content is the quantity of metals which are leachable by the EP test.
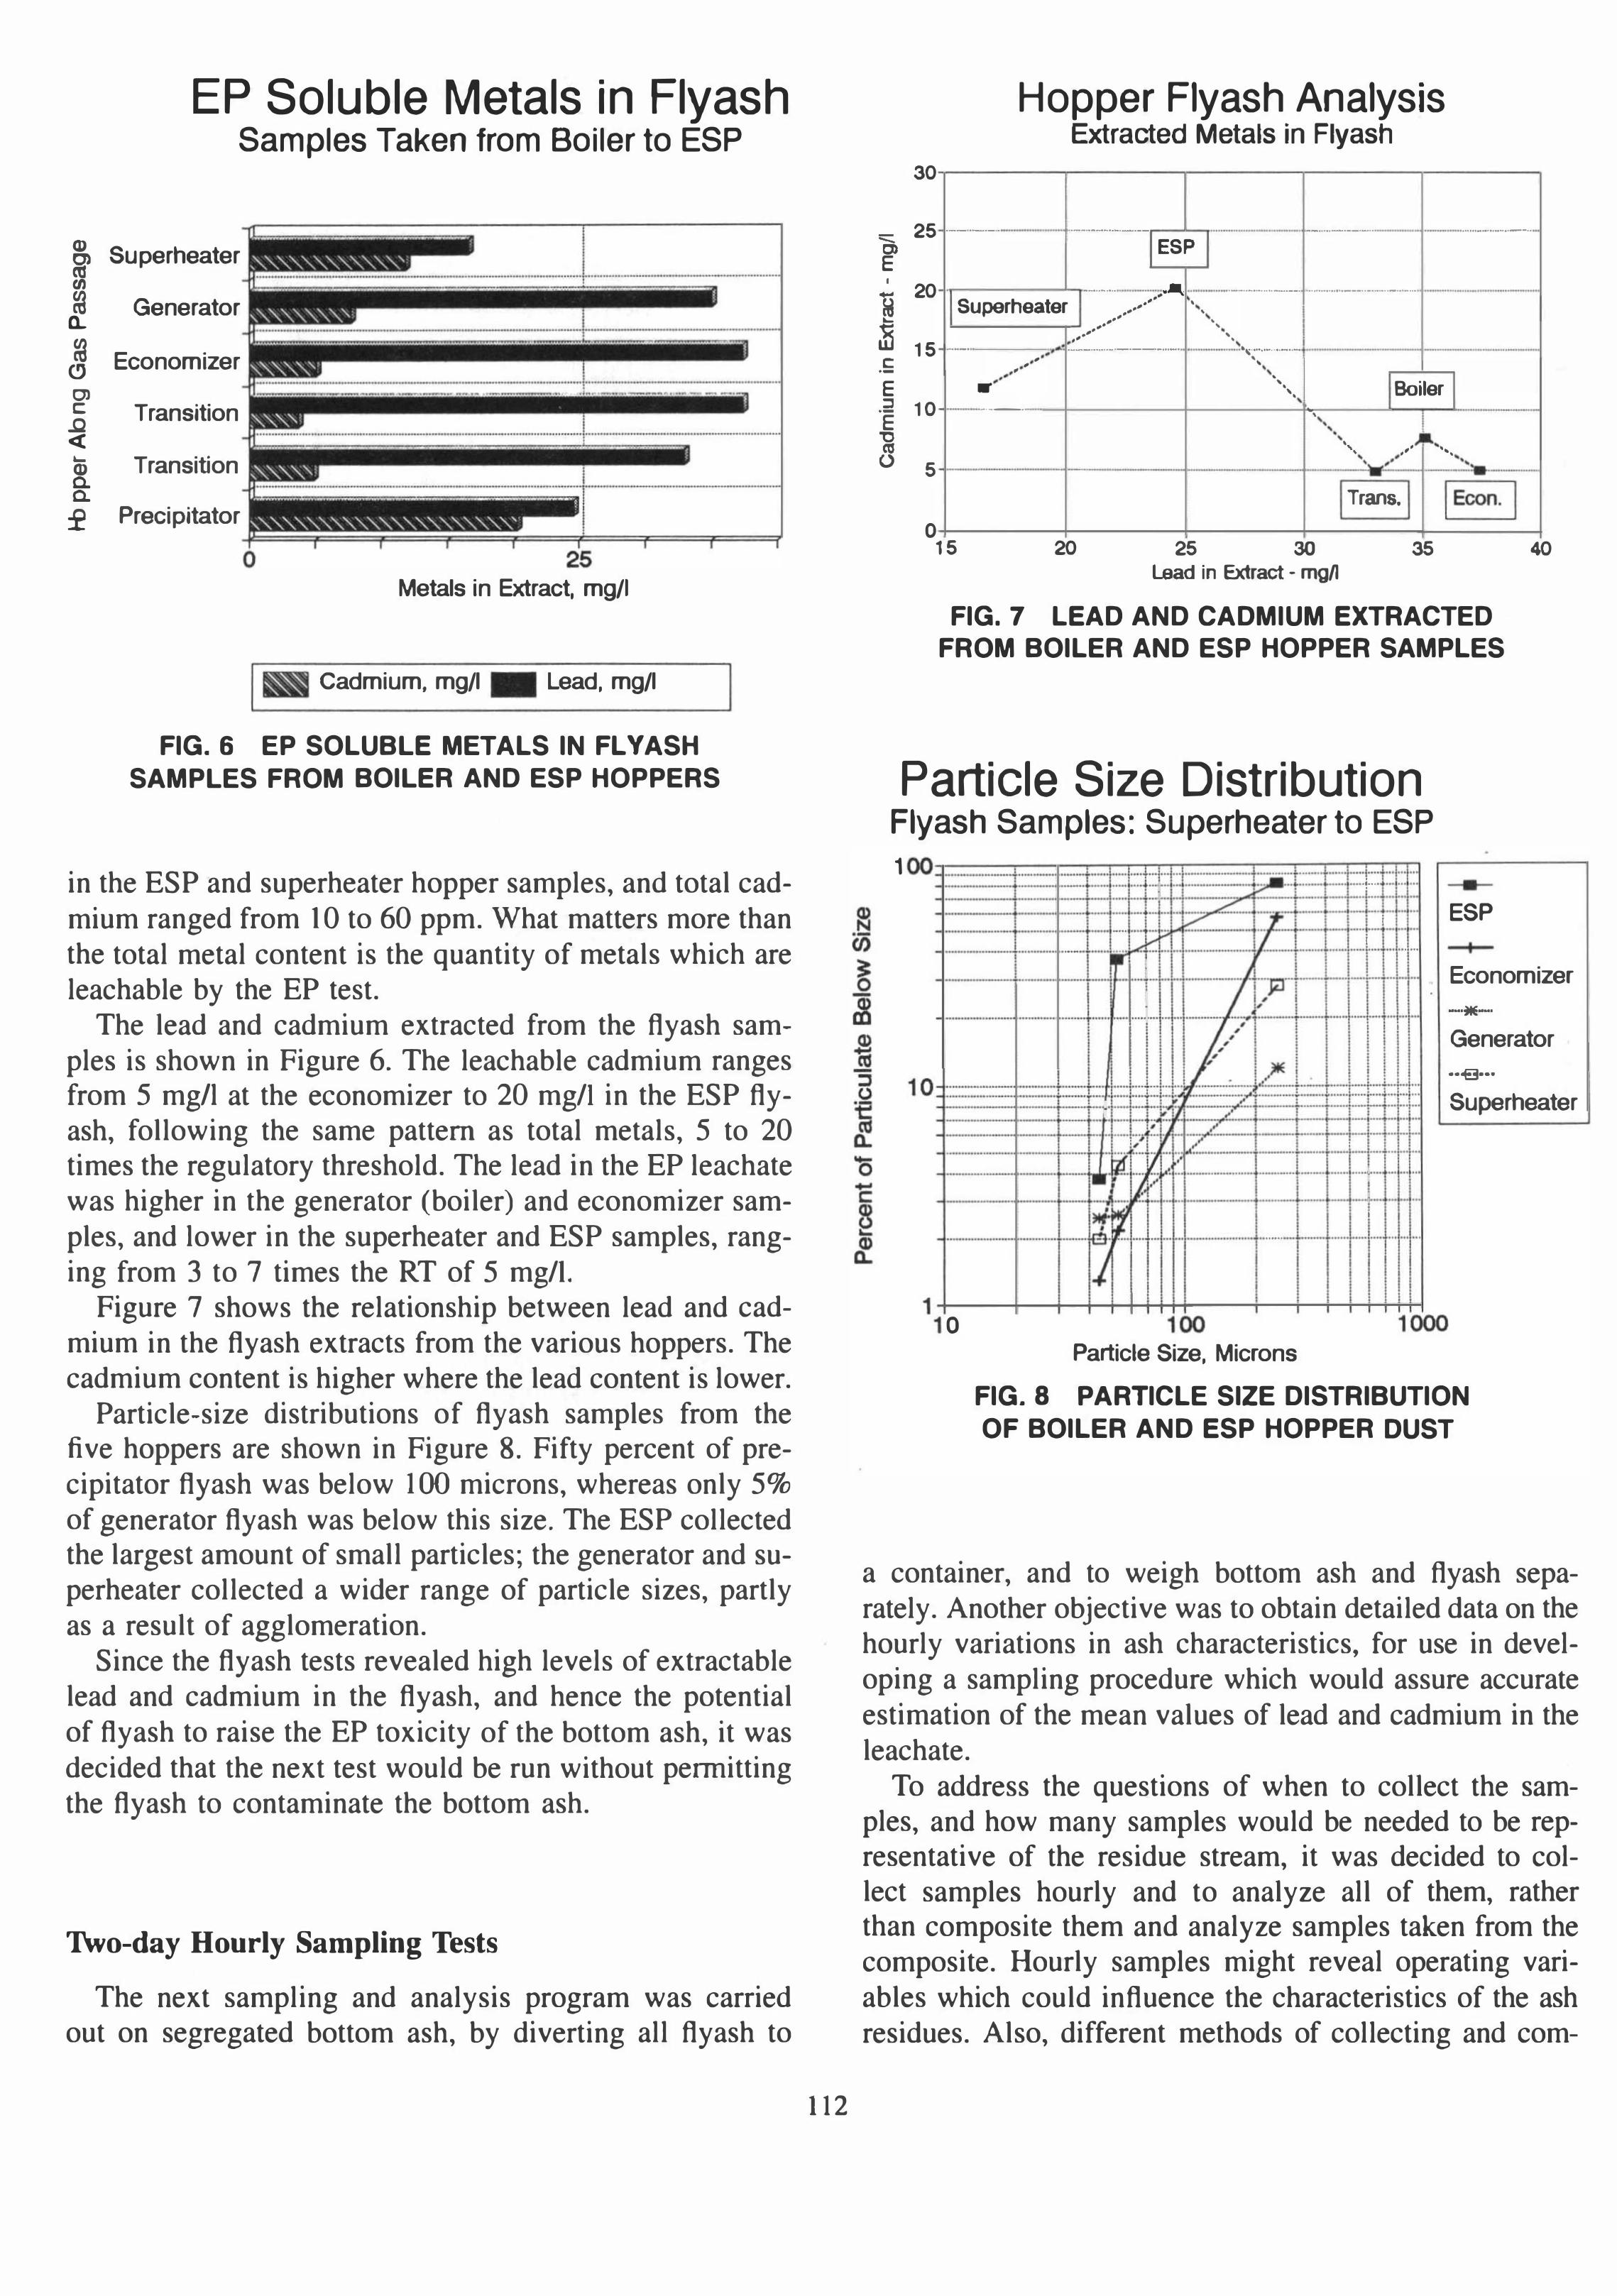
The lead and cadmium extracted from the flyash samples is shown in Figure 6. The leachable cadmium ranges from 5 mgll at the economizer to 20 mg/I in the ESP flyash, following the same pattern as total metals, 5 to 20 times the regulatory threshold. The lead in the EP leachate was higher in the generator (boiler) and economizer samples, and lower in the superheater and ESP samples, ranging from 3 to 7 times the RT of 5 mg/I.
Figure 7 shows the relationship between lead and cadmium in the flyash extracts from the various hoppers. The cadmium content is higher where the lead content is lower.
Particle-size distributions of flyash samples from the five hoppers are shown in Figure 8. Fifty percent of precipitator flyash was below 100 microns, whereas only 5% of generator flyash was below this size. The ESP collected the largest amount of small particles; the generator and superheater collected a wider range of particle sizes, partly as a result of agglomeration.
Since the flyash tests revealed high levels of extractable lead and cadmium in the flyash, and hence the potential of flyash to raise the EP toxicity of the bottom ash, it was decided that the next test would be run without pelluitting the flyash to contaminate the bottom ash.
Two-day Hourly Sampling Tests
The next sampling and analysis program was carried out on segregated bottom ash, by diverting all flyash to
112
"" C> E
,
t5 �
:il <:
.-
E " . -
E '0 '" ()
Hopper Flyash Analysis Extracted Metals in Flyash
30
25 --- - ._----- -----_. --'-- ._-_ .. _ .. _-
20
15
10
5
ESP
--- .'" .'
.. ------- ...•. _-_. __ . __ . . _ .. _- . _-
Superheater .' "" j .' .'
.' .'
·" ""
.,,:_._.H. __ M '_
.' .'
.. � .'
--_. ___ H ___ ._. - -"
" , " "
" .
...
,.
" •
-_ . 'I .. ,
" ,
--
" "" , " 'W
I
Boiler
,
1 .-, ,. ' .. .
" "
I Trans. I I Econ. I o
15 20 25 30 35 Lead in Extract .. mg/l
FIG. 7 LEAD AND CADMIUM EXTRACTED FROM BOILER AND ESP HOPPER SAMPLES
40
Particle Size Distribution Flyash Samples: Superheater to ESP 1 00 . .
.
.
. ..
.
..
1" ..
.
1 0
, . .. .
. .
.. ... ... . ..
,
..
... . ...
.... ..
. .. ..
.
... . .
... .
· .
· . . ...
... .
..
.. .....
.. .
.. .
,
..
. ,
.
.." .
....
. ...
....
oft
·
·
.. .
I
·
.
..
,
=��I ...
I�
,
i
" ,
I
i
,
. ," .
. .
..
..
..
..
... " 'jjj. . . .. .
v- . 1' II . . ..
.
..
..
.
.
..
.
..
ioo
I{�J<J .
.J. . .
(/ I.,,)IE. .
. . ..
. . .
... .
.
... .
.
. . ..
..
...
.. .
.....
..
.. ....
•
,
,
I
Particle Size, Microns
. . . ... . . ..
.
...
.
....
.
,
,
..
. . ..
I I ,
.. ...
... .
, ..
.. .
j." + .. .. .
I ..
I ...
...
i ,
. ...
!
I ,
,
.. .
...
.
..
.
.
. ...
..
•
ESP
I
Economizer .
-*-
Generator
.. e--..
Superheater
00
FIG.8 PARTICLE SIZE DISTRIBUTION OF BOILER AND ESP HOPPER DUST
a container, and to weigh bottom ash and flyash separately. Another objective was to obtain detailed data on the hourly variations in ash characteristics, for use in developing a sampling procedure which would assure accurate estimation of the mean values of lead and cadmium in the leachate.
To address the questions of when to collect the samples, and how many samples would be needed to be representative of the residue stream, it was decided to collect samples hourly and to analyze all of them, rather than composite them and analyze samples taken from the composite. Hourly samples might reveal operating variables which could influence the characteristics of the ash residues. Also, different methods of collecting and com-
'a, E .. u � ;B .!: " '" Q) ...J
0.1
0.Q1
EP TOXICITY TEST DATA Hourly Segregated Bottom Ash - June
-4,,-rrr-rrl-S ,..,..,.,-rrr1-hS -rrr""';""-2l-r4 ,-,-,-..-.-ri3 2-rrr,-,-,-r+40:rrrrTT"'c:l:-4S 0.001
H OUR S
1- Lead -+- Cadmium
FIG. 9 VARIATIONS IN LEAD AND
CADMIUM IN EXTRACTS FROM JUNE TEST
positing samples could be simulated by using this detailed data.
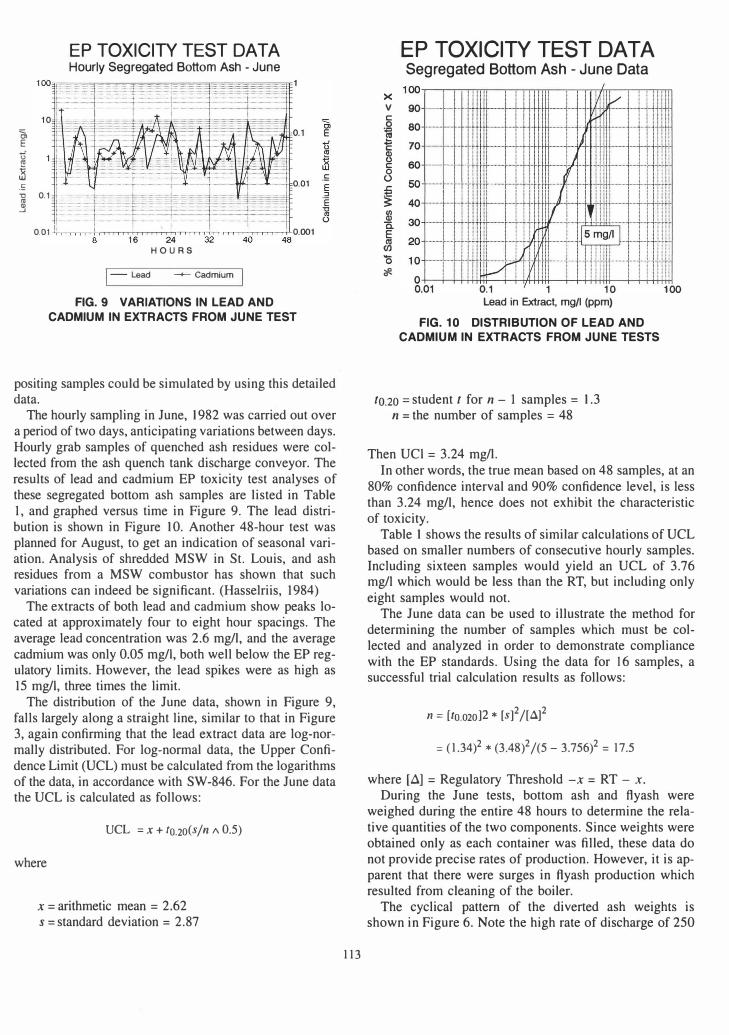
The hourly sampling in June, 1982 was carried out over a period of two days, anticipating variations between days. Hourly grab samples of quenched ash residues were collected from the ash quench tank discharge conveyor. The results of lead and cadmium EP toxicity test analyses of these segregated bottom ash samples are listed in Table 1, and graphed versus time in Figure 9. The lead distribution is shown in Figure 10. Another 48-hour test was planned for August, to get an indication of seasonal variation. Analysis of shredded MSW in St. Louis, and ash residues from a MSW combustor has shown that such variations can indeed be significant. (Hasselriis, 1984)
The extracts of both lead and cadmium show peaks located at approximately four to eight hour spacings. The average lead concentration was 2.6 mg/l, and the average cadmium was only 0.05 mg/I, both well below the EP regulatory limits. However, the lead spikes were as high as 15 mg/I, three times the limit.
The distribution of the June data, shown in Figure 9, falls largely along a straight line, similar to that in Figure 3, again confirming that the lead extract data are log-normally distributed. For log-normal data, the Upper Confidence Limit (UCL) must be calculated from the logarithms of the data, in accordance with SW-846. For the June data the UCL is calculated as follows:
ueL = x + to.20(s/n /\ 0.5)
where
x = arithmetic mean = 2.62 s = standard deviation = 2.87
1 13
EP TOXICITY TEST DATA Segregated Bottom Ash - June Data
x v 90 _.. ._ . .. .. . c: o
., � Q) o c: 8 � (/) Q) a. E � '0 *-
80 .............. . 70 _._. _ ....... .
60 . ... _ .. . _ . .... .. . . .
0.1 1 10 100 Lead in Extract, mg/I (ppm)
FIG. 1 0 DISTRIBUTION OF LEAD AND
CADMIUM IN EXTRACTS FROM JUNE TESTS
to.20 = student t for n - I samples = 1.3 n = the number of samples = 48
Then UCI = 3.24 mg/l. In other words, the true mean based on 48 samples, at an
80% confidence interval and 90% confidence level, is less than 3.24 mg/l, hence does not exhibit the characteristic of toxicity.
Table 1 shows the results of similar calculations of UCL based on smaller numbers of consecutive hourly samples. Including sixteen samples would yield an UCL of 3.76 mg/l which would be less than the RT, but including only eight samples would not.
The June data can be used to illustrate the method for determining the number of samples which must be collected and analyzed in order to demonstrate compliance with the EP standards. Using the data for 16 samples, a successful trial calculation results as follows:
n = [to.020]2 * [s]2 /[d]
2
= ( 1.34)2 * (3.48)2/(5 - 3.756)2 = 17.5
where [.::l] = Regulatory Threshold -x = RT - x. During the June tests, bottom ash and flyash were
weighed during the entire 48 hours to determine the relative quantities of the two components. Since weights were obtained only as each container was filled, these data do not provide precise rates of production. However, it is apparent that there were surges in flyash production which resulted from cleaning of the boiler.
The cyclical pattern of the diverted ash weights is shown in Figure 6. Note the high rate of discharge of 250
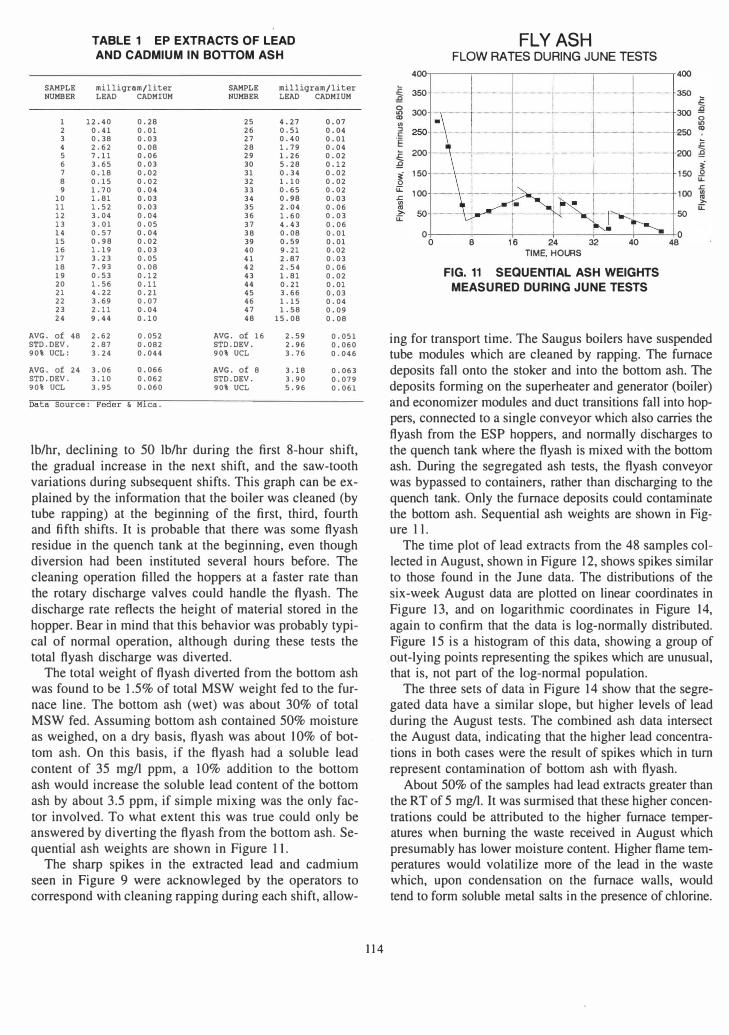
TABLE 1 EP EXTRACTS OF LEAD
AND CADMIUM IN BOTTOM ASH
SAMPLE milligram/liter SAMPLE milligram/liter NUMBER LEAD CADMIUM NUMBER LEAD CADMIUM
1 12.40 0.28 25 4.27 0.07 2 0.41 0.01 26 0.51 0.04 3 0.38 0.03 27 0.40 0.01 4 2.62 0.08 28 1. 79 0.04 5 7.11 0.06 29 1. 26 0.02 6 3.65 0.03 30 5.28 0.12 7 0.18 0.02 31 0.34 0.02 8 0.15 0.02 32 1.10 0.02 9 1. 70 0.04 33 0.65 0.02
10 1.81 0.03 34 0.98 0.03 11 1.52 0.03 35 2.04 0.06 12 3.04 0.04 36 1. 60 0.03 13 3.01 0.05 37 4.43 0.06 14 0.57 0.04 38 0.08 0.01 15 0.98 0.02 39 0.59 0.01 16 1.19 0.03 40 9.21 0.02 17 3.23 0.05 41 2.87 0.03 18 7.93 0.08 42 2.54 0.06 19 0.53 0.12 43 1.81 0.02 20 1. 56 0.11 44 0.21 0.01 21 4.22 0.21 45 3.66 0.03 22 3.69 0.07 46 1.15 0.04 23 2.11 0.04 47 1. 58 0.09 24 9.44 0.10 48 15.08 0.08
AVG. of 48 2.62 0.052 AVG. of 16 2.59 0.051 STO.OEV. 2.87 0.082 STO.OEV. 2.96 0.060 90% VCL: 3.24 0.044 90% VCL 3.76 0.046
AVG. of 24 3.06 0.066 AVG. of 8 3.18 0.063 STO.OEV. 3.10 0.062 STO.OEV. 3.90 0.079 90% VCL 3.95 0.060 90% VCL 5.96 0.061
Data Source: Feder & M1ca.
lb/hr, declining to 50 lblhr during the first 8-hour shift, the gradual increase in the next shift, and the saw-tooth variations during subsequent shifts. This graph can be explained by the information that the boiler was cleaned (by tube rapping) at the beginning of the first, third, fourth and fifth shifts. It is probable that there was some flyash residue in the quench tank at the beginning, even though diversion had been instituted several hours before. The cleaning operation filled the hoppers at a faster rate than the rotary discharge valves could handle the flyash. The discharge rate reflects the height of material stored in the hopper. Bear in mind that this behavior was probably typical of normal operation, although during these tests the total flyash discharge was diverted.
The total weight of flyash diverted from the bottom ash was found to be 1.5% of total MSW weight fed to the furnace line. The bottom ash (wet) was about 30% of total MSW fed. Assuming bottom ash contained 50% moisture as weighed, on a dry basis, flyash was about 10% of bottom ash. On this basis, if the flyash had a soluble lead content of 35 mg/l ppm, a 10% addition to the bottom ash would increase the soluble lead content of the bottom ash by about 3.5 ppm, if simple mixing was the only factor involved. To what extent this was true could only be answered by diverting the flyash from the bottom ash. Sequential ash weights are shown in Figure 1 1.
The sharp spikes in the extracted lead and cadmium seen in Figure 9 were acknowleged by the operators to correspond with cleaning rapping during each shift, allow-
114
400 .c 350 � 0 300 '" co <II ::J c 'E .c 200 a � 1 50 0
u:: 1 00 � '" os >-u:: 0
M.M,
FLY ASH FLOW RATES DURING JUNE TESTS
I 400
.M ... ·_· .... -.-.. -.-+--.--.�=-=f=¥=� � I --1----- . . --l----�---- 1 50 �
I-.. -t- ---... -----i -Ai:--,------T----+---- 1 00 �
-_____ 1� ____ .. ____ 1 --�--I----t ·--1------ 50 � +-----�--_+----�----�!--· --�--�O 0 8 1 6 24
TIME, HOURS 32 40
FIG. 11 SEQUENTIAL ASH WEIGHTS
MEASURED DURING JUNE TESTS
48
ing for transport time. The Saugus boilers have suspended tube modules which are cleaned by rapping. The furnace deposits fall onto the stoker and into the bottom ash. The deposits forming on the superheater and generator (boiler) and economizer modules and duct transitions fall into hoppers, connected to a single conveyor which also carries the flyash from the ESP hoppers, and normally discharges to the quench tank where the flyash is mixed with the bottom ash. During the segregated ash tests, the flyash conveyor was bypassed to containers, rather than discharging to the quench tank. Only the furnace deposits could contaminate the bottom ash. Sequential ash weights are shown in Figure l l.
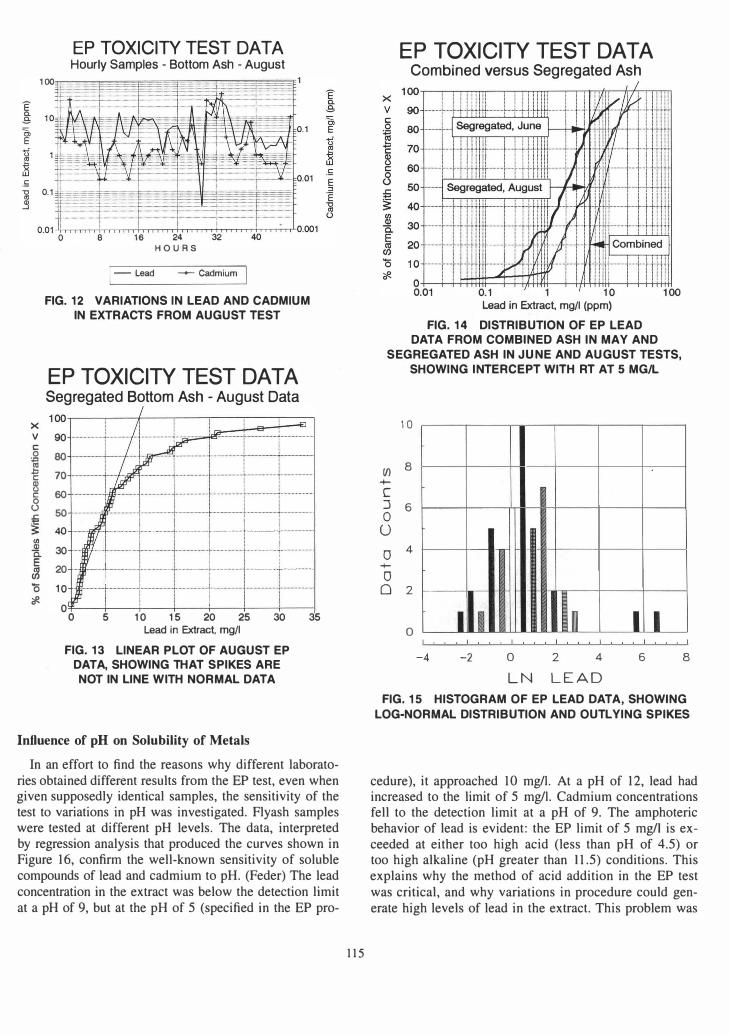
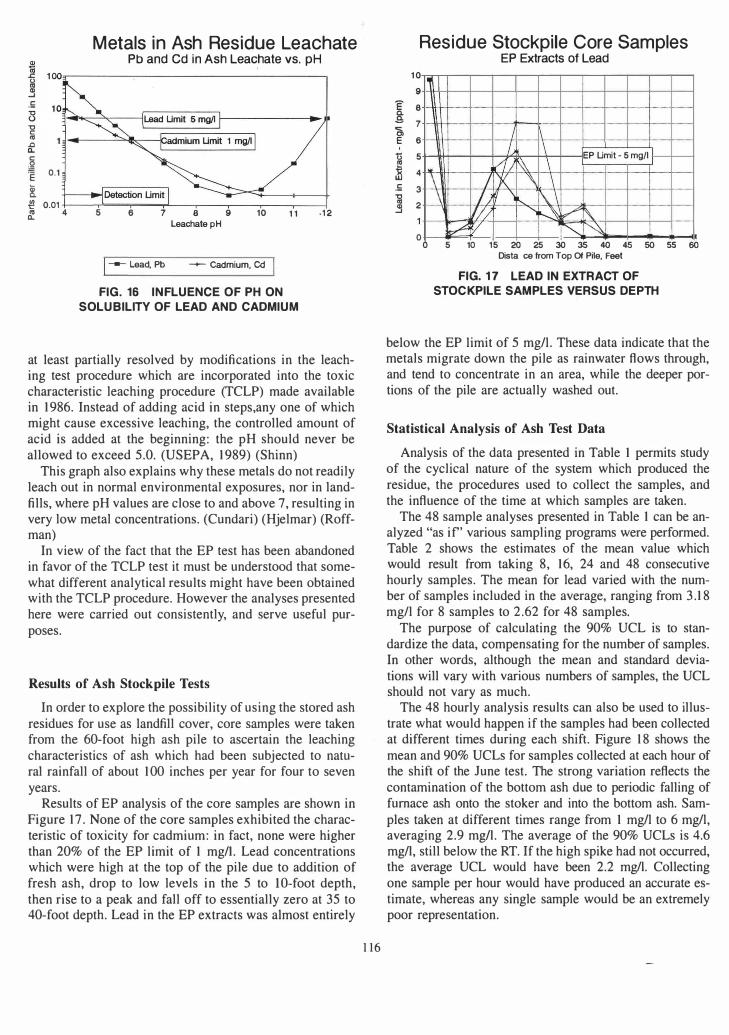
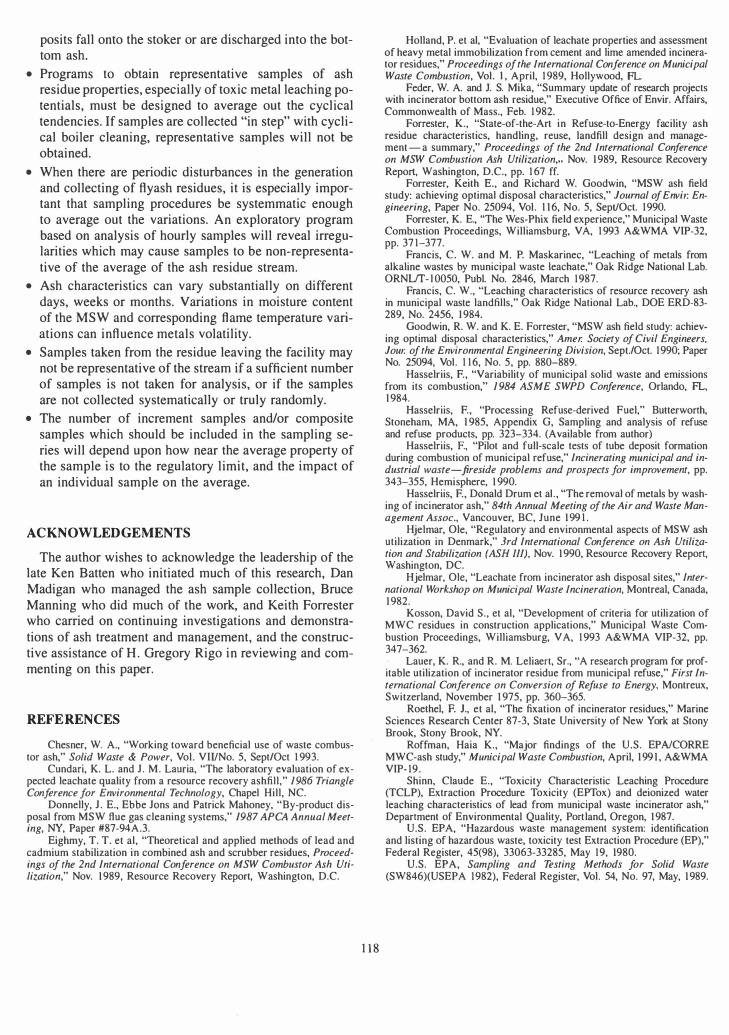
The time plot of lead extracts from the 48 samples collected in August, shown in Figure 12, shows spikes similar to those found in the June data. The distributions of the six-week August data are plotted on linear coordinates in Figure 13, and on logarithmic coordinates in Figure 14, again to confirm that the data is log-normally distributed. Figure 15 is a histogram of this data, showing a group of out-lying points representing the spikes which are unusual, that is, not part of the log-normal population.
The three sets of data in Figure 14 show that the segregated data have a similar slope, but higher levels of lead during the August tests. The combined ash data intersect the August data, indicating that the higher lead concentrations in both cases were the result of spikes which in tum represent contamination of bottom ash with flyash.
About 50% of the samples had lead extracts greater than the RT of 5 mg/l. It was surmised that these higher concentrations could be attributed to the higher furnace temperatures when burning the waste received in August which presumably has lower moisture content. Higher flame temperatures would volatilize more of the lead in the waste which, upon condensation on the furnace walls, would tend to form soluble metal salts in the presence of chlorine.
><
EP TOXICITY TEST DATA Hourly Samples - Bottom Ash - August 100 �-=--== 1
6 16 24 32 HO URS
1- Lead -+- Cadmium
40
FIG.12 VARIATIONS IN LEAD AND CADMIUM
IN EXTRACTS FROM AUGUST TEST
EP TOXICITY TEST DATA Segregated Bottom Ash - August Data 100.--.--�-.---,--,--,--,
v 90 c:
] � ��- ---�:��[t:I�--.I::
I I I I � 40 t - - - - - - ---- - f - -- --1----- 1 gj 30 ··- - - - - .1 _ __ I
I 20 -·- 1---- -- - - ---- . - --- 1--- - - . ___ J -- -
; '� - --I t - --f-- ---o 5 10 15 20 25 30 35
Lead in Extract, mgtl FIG.13 LINEAR PLOT OF AUGUST EP
DATA, SHOWING THAT SPIKES ARE
NOT IN LINE WITH NORMAL DATA
Influence of pH on Solubility of Metals
In an effort to find the reasons why different laboratories obtained different results from the EP test, even when given supposedly identical samples, the sensitivity of the test to variations in pH was investigated. Flyash samples were tested at different pH levels. The data, interpreted by regression analysis that produced the curves shown in Figure 16, confirm the well-known sensitivity of soluble compounds of lead and cadmium to pH. (Feder) The lead concentration in the extract was below the detection limit at a pH of 9, but at the pH of 5 (specified in the EP pro-
1 15
EP TOXICITY TEST DATA Combined versus Segregated Ash
0.1 1 10 Lead in Extract, mgtl (ppm)
FIG. 14 DISTRIBUTION OF EP LEAD
DATA FROM COMBINED ASH IN MAY AND
SEGREGATED ASH IN JUNE AND AUGUST TESTS,
SHOWING INTERCEPT WITH RT AT 5 MG/L
10
Vl 8 +-C :J 6 o
U o 4
+-o
o 2
o
-
-
I I � I I I , , I , , I I , , ! , , , I , I • I
-4 -2 o
LN 2 4
LEAD 6 8
FIG.15 HISTOGRAM OF EP LEAD DATA, SHOWING
LOG-NORMAL DISTRIBUTION AND OUTLYING SPIKES
cedure), it approached 10 mg/\. At a pH of 12, lead had increased to the limit of 5 mg/\. Cadmium concentrations fell to the detection limit at a pH of 9. The amphoteric behavior of lead is evident: the EP limit of 5 mg/I is exceeded at either too high acid (less than pH of 4.5) or too high alkaline (pH greater than 11.5) conditions. This explains why the method of acid addition in the EP test was critical, and why variations in procedure could generate high levels of lead in the extract. This problem was
i Metals in Ash Residue Leachate
Pb and Cd in Ash Leachate vs. pH
� 1001,---------------------------------. � .5 10,����������----------. :J- Lead Umit 5 mg/l '0 C '" .0 n. c � 'E 0.1 ! �--���t�ctti�·o�nUUm�i�t {!! 0.01 +---...... -....,..-==;=L--,------,----,....---.,.------l � 4 5 6 7 8 9
Leachate pH 10
1-- Lead, Pb -+- Cadmium, Cd
1 1 .12
FIG. 16 INFLUENCE OF PH ON
SOLUBILITY OF LEAD AND CADMIUM
at least partially resolved by modifications in the leaching test procedure which are incorporated into the toxic characteristic leaching procedure (TCLP) made available in 1986. Instead of adding acid in steps,any one of which might cause excessive leaching, the controlled amount of acid is added at the beginning: the pH should never be allowed to exceed 5.0. (VSEPA, 1989) (Shinn)
This graph also explains why these metals do not readily leach out in normal environmental exposures, nor in landfills, where pH values are close to and above 7, resulting in very low metal concentrations. (Cundari) (Hjelmar) (Roffman)
In view of the fact that the EP test has been abandoned in favor of the TCLP test it must be understood that somewhat different analytical results might have been obtained with the TCLP procedure. However the analyses presented here were carried out consistently, and serve useful purposes.
Results of Ash Stockpile Tests
In order to explore the possibility of using the stored ash residues for use as landfill cover, core samples were taken from the 60-foot high ash pile to ascertain the leaching characteristics of ash which had been subjected to natural rainfall of about 100 inches per year for four to seven years.
Results of EP analysis of the core samples are shown in Figure 17. None of the core samples exhibited the characteristic of toxicity for cadmium: in fact, none were higher than 20% of the EP limit of 1 mg/1. Lead concentrations which were high at the top of the pile due to addition of fresh ash, drop to low levels in the 5 to to-foot depth, then rise to a peak and fall off to essentially zero at 35 to 40-foot depth. Lead in the EP extracts was almost entirely
1 16
Residue Stockpile Core Samples EP Extracts of Lead 10
9 E 8 � �
7 E 6
� 5 Ji 4
.5 3 '0 .3 2 o
I' -1---.. . --- --I--- - --_ . .. ._.- ._-
I. 1\ EP Umit - 5 mg/l 'v1J f.\ \ \ 7 i'K , \ \ /) VJ \
�� 1/// V 1\ � V t � � ._--, , , o 5 10 15 20 25 30 35 40 45 50 55 60 Distance from Top Of Pile, Feet
FIG. 1 7 LEAD IN EXTRACT OF
STOCKPILE SAMPLES VERSUS DEPTH
below the EP limit of 5 mgll. These data indicate that the metals migrate down the pile as rainwater flows through, and tend to concentrate in an area, while the deeper portions of the pile are actually washed out.
Statistical Analysis of Ash Test Data
Analysis of the data presented in Table 1 permits study of the cyclical nature of the system which produced the residue, the procedures used to collect the samples, and the influence of the time at which samples are taken.
The 48 sample analyses presented in Table 1 can be analyzed "as if" various sampling programs were performed. Table 2 shows the estimates of the mean value which would result from taking 8, 16, 24 and 48 consecutive hourly samples. The mean for lead varied with the number of samples included in the average, ranging from 3.18 mg/l for 8 samples to 2.62 for 48 samples.
The purpose of calculating the 90% VCL is to standardize the data, compensating for the number of samples. In other words, although the mean and standard deviations will vary with various numbers of samples, the VCL should not vary as much.
The 48 hourly analysis results can also be used to illustrate what would happen if the samples had been collected at different times during each shift. Figure 18 shows the mean and 90% VCLs for samples collected at each hour of the shift of the June test. The strong variation reflects the contamination of the bottom ash due to periodic falling of furnace ash onto the stoker and into the bottom ash. Samples taken at different times range from 1 mgll to 6 mg/l, averaging 2.9 mgll. The average of the 90% VCLs is 4.6 mgll, still below the RT. If the high spike had not occurred, the average VCL would have been 2.2 mg/I. Collecting one sample per hour would have produced an accurate estimate, whereas any single sample would be an extremely poor representation.
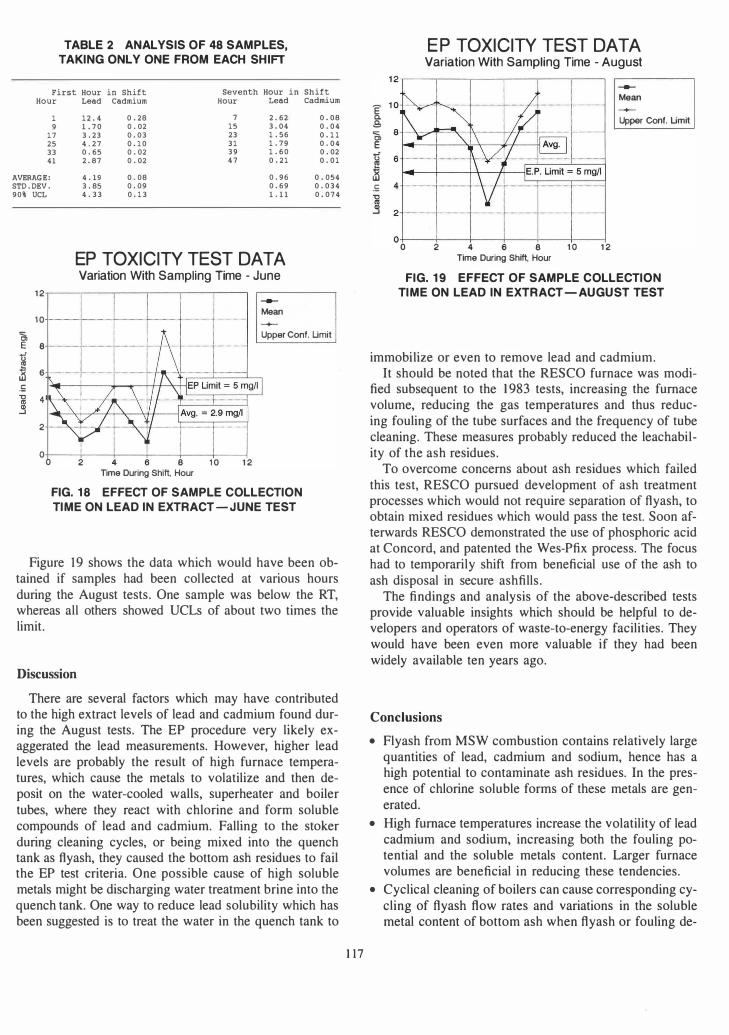
TABLE 2 ANALYSIS OF 48 SAMPLES,
TAKING ONLY ONE FROM EACH SHIFT
First Hour in Shift Hour Lead cadmium
1 9
17 25 33 41
12.4 1. 70 3.23 4 . 27 0.65 2.87
0.28 0.02 0.03 0.10 0.02 0.02
Seventh Hour in Shift Hour Lead Cadmium
7 15 23 31 39 47
2.62 3.04 1. 56 1. 79 1.60 0.21
0.08 0.04 0.11 0.04 0.02 0.01
AVERAGE: 4.19 3.85 4.33
0.08 0.09 0.13
0.96 0.69 1.11
0.054 0.034 0.074
STD.DEV. 90% UCL
1 2
10 '§, E 8 13 � 6 -.5 11 .3
2
0 0
EP TOXICITY TEST DATA Variation With Sampling Time - June
2 4 6 8 TIme During Shift, Hour
1 0 1 2
-Mean --+-Upper Cont. Umit
FIG. 1 8 EFFECT OF SAMPLE COLLECTION
TIME ON LEAD IN EXTRACT - JUNE TEST
Figure 19 shows the data which would have been obtained if samples had been collected at various hours during the August tests. One sample was below the RT, whereas all others showed UCLs of about two times the limit.
Discussion
There are several factors which may have contributed to the high extract levels of lead and cadmium found during the August tests. The EP procedure very likely exaggerated the lead measurements. However, higher lead levels are probably the result of high furnace temperatures, which cause the metals to volatilize and then deposit on the water-cooled walls, superheater and boiler tubes, where they react with chlorine and form soluble compounds of lead and cadmium. Falling to the stoker during cleaning cycles, or being mixed into the quench tank as flyash, they caused the bottom ash residues to fail the EP test criteria. One possible cause of high soluble metals might be discharging water treatment brine into the quench tank. One way to reduce lead solubility which has been suggested is to treat the water in the quench tank to
1 17
'[ .e, '§, E
EP TOXICITY TEST DATA Variation With Sampling Time - August
1 2 .----,--�----,_--,_--_,--_. ,---------, -Mean
Upper Cont. Umit
! .5 4-1----+----+---\--++ �==t====t====j
o+---�--_+----�--_t_--_+--� o 2 4 6 8 1 0 1 2 Time During Shift, Hour
FIG. 1 9 EFFECT OF SAMPLE COLLECTION
TIME ON LEAD IN EXTRACT - AUGUST TEST
immobilize or even to remove lead and cadmium. It should be noted that the RESCO furnace was modi
fied subsequent to the 1983 tests, increasing the furnace volume, reducing the gas temperatures and thus reducing fouling of the tube surfaces and the frequency of tube cleaning. These measures probably reduced the leachability of the ash residues.
To overcome concerns about ash residues which failed this test, RESCO pursued development of ash treatment processes which would not require separation of flyash, to obtain mixed residues which would pass the test. Soon afterwards RESCO demonstrated the use of phosphoric acid at Concord, and patented the Wes-Pfix process. The focus had to temporarily shift from beneficial use of the ash to ash disposal in secure ashfills.
The findings and analysis of the above-described tests provide valuable insights which should be helpful to developers and operators of waste-to-energy facilities. They would have been even more valuable if they had been widely available ten years ago.
Conclusions
• Flyash from MSW combustion contains relatively large quantities of lead, cadmium and sodium, hence has a high potential to contaminate ash residues. In the presence of chlorine soluble forms of these metals are generated.
• High furnace temperatures increase the volatility of lead cadmium and sodium, increasing both the fouling potential and the soluble metals content. Larger furnace volumes are beneficial in reducing these tendencies.
• Cyclical cleaning of boilers can cause corresponding cycling of flyash flow rates and variations in the soluble metal content of bottom ash when flyash or fouling de-
posits fall onto the stoker or are discharged into the bottom ash.
• Programs to obtain representative samples of ash residue properties, especially of toxic metal leaching potentials, must be designed to average out the cyclical tendencies. If samples are collected "in step" with cyclical boiler cleaning, representative samples will not be obtained.
• When there are periodic disturbances in the generation and collecting of flyash residues, it is especially important that sampling procedures be systemmatic enough to average out the variations. An exploratory program based on analysis of hourly samples will reveal irregularities which may cause samples to be non-representative of the average of the ash residue stream.
• Ash characteristics can vary substantially on different days, weeks or months. Variations in moisture content of the MSW and corresponding flame temperature variations can influence metals volatility.
• Samples taken from the residue leaving the facility may not be representative of the stream if a sufficient number of samples is not taken for analysis, or if the samples are not collected systematically or truly randomly.
• The number of increment samples and/or composite samples which should be included in the sampling series will depend upon how near the average property of the sample is to the regulatory limit, and the impact of an individual sample on the average.
ACKNOWLEDGEMENT S
The author wishes to acknowledge the leadership of the late Ken Batten who initiated much of this research, Dan Madigan who managed the ash sample collection, Bruce Manning who did much of the work, and Keith Forrester who carried on continuing investigations and demonstrations of ash treatment and management, and the constructive assistance of H. Gregory Rigo in reviewing and commenting on this paper.
REFERENCES
Chesner, W. A., "Working toward beneficial use of waste combustor ash," Solid Waste & Power, Vol. VIIINo. 5, Sept/Oct 1 993.
Cundari, K. L. and 1 . M. Lauria, "The laboratory evaluation of expected leachate quality from a resource recovery ashfill," 1986 Triangle Conference for Environmental Technology, Chapel Hill, NC.
Donnelly, 1 . E., Ebbe 10ns and Patrick Mahoney, "By-product disposal from MSW flue gas cleaning systems," 1987 APCA Annual Meeting, NY, Paper #87-94A.3.
Eighmy, T. T. et ai, "Theoretical and applied methods of lead and cadmium stabilization in combined ash and scrubber residues, Proceedings of the 2nd International Conference on MSW Combustor Ash Utilization," Nov. 1 989, Resource Recovery Report, Washington, D.C.
1 18
Holland, P. et ai, "Evaluation of leachate properties and assessment of heavy metal immobilization from cement and lime amended incinerator residues," Proceedings of the International Conference on Municipal Waste Combustion, Vol. I , April, 1 989, Hollywood, FL.
Feder, W. A. and 1. S. Mika, "Summary update of research projects with incinerator bottom ash residue," Executive Office of Envir. Affairs, Commonwealth of Mass., Feb. 1 982.
Forrester, K., "State-of-the-Art in Refuse-to-Energy facility ash residue characteristics, handling, reuse, landfill design and management - a summary," Proceedings of the 2nd International Conference on MSW Combustion Ash Utilization," Nov. 1 989, Resource Recovery Report, Washington, D.C., pp. 1 67 ff.
Forrester, Keith E., and Richard W. Goodwin, "MSW ash field study: achieving optimal disposal characteristics," Journal of En vir. Engineering, Paper No. 25094, Vol . 1 1 6, No. 5, Sept/Oct. 1 990.
Forrester, K. E., ''The Wes-Phix field experience," Municipal Waste Combustion Proceedings, Williamsburg, VA, 1 993 A&WMA VIP-32, pp. 37 1-377.
Francis, C. W. and M. P. Maskarinec, "Leaching of metals from alkaline wastes by municipal waste leachate," Oak Ridge National Lab. ORNUf- l OO50, Publ. No. 2846, March 1 987.
Francis, C. W., "Leaching characteristics of resource recovery ash in municipal waste landfills," Oak Ridge National Lab., DOE ERD-83-289, No. 2456, 1 984.
Goodwin, R. W. and K. E. Forrester, "MSW ash field study: achieving optimal disposal characteristics," Amer. Society of Civil Engineers, Jour. of the Environmental Engineering Division, Sept.lOct. 1 990; Paper No. 25094, Vol. 1 1 6, No. 5, pp. 880-889.
Hasselriis, F., "Variability of municipal solid waste and emissions from its combustion," 1 984 ASME SWPD Conference, Orlando, FL, 1 984.
Hasselriis, F., "Processing Refuse-derived Fuel," Butterworth, Stoneham, MA, 1 985, Appendix G, Sampling and analysis of refuse and refuse products, pp. 323-334. (Available from author)
Hasselriis, F., "Pilot and full-scale tests of tube deposit formation during combustion of municipal refuse," Incinerating municipal and industrial waste -fireside problems and prospects for improvement, pp. 343-355, Hemisphere, 1 990.
Hasselriis, F., Donald Drum et aI . , ''The removal of metals by washing of incinerator ash," 84th Annual Meeting of the Air and Waste Management Assoc., Vancouver, BC, lune 1 99 1 .
Hjelmar, Ole, "Regulatory and environmental aspects of MSW ash utilization in Denmark," 3rd International Conference on Ash Utilization and Stabilization (ASH lll), Nov. 1 990, Resource Recovery Report, Washington, DC.
Hjelmar, Ole, "Leachate from incinerator ash disposal sites," International Workshop on Municipal Waste Incineration, Montreal, Canada, 1 982.
Kosson, David S., et ai, "Development of criteria for utilization of MWC residues in construction applications," Municipal Waste Combustion Proceedings, Williamsburg, V A, 1 993 A&WMA VIP-32, pp. 347-362.
Lauer, K. R., and R. M. Leliaert, Sr., "A research program for profitable utilization of incinerator residue from municipal refuse," First International Conference on Conversion of Refuse to Energy. Montreux, Switzerland, November 1 975, pp. 360-365.
Roethel, F. 1., et ai, "The fixation of incinerator residues," Marine Sciences Research Center 87-3, State University of New York at Stony Brook, Stony Brook, NY.
Roffman, Haia K., "Major findings of the U.S. EPNCORRE MWC-ash study," Municipal Waste Combustion, April, 1 99 1 , A&WMA VIP- 19.
Shinn, Claude E., "Toxicity Characteristic Leaching Procedure (TCLP), Extraction Procedure Toxicity (EPTox) and deionized water leaching characteristics of lead from municipal waste incinerator ash," Department of Environmental Quality, Portland, Oregon, 1 987.
U.S. EPA, "Hazardous waste management system: identification and listing of hazardous waste, toxicity test Extraction Procedure (EP)," Federal Register, 45(98), 33063-33285, May 1 9, 1980.
U.S. EPA, Sampling and Testing Methods for Solid Waste (SW846)(USEPA 1 982), Federal Register, Vol. 54, No. 97, May, 1 989.