Embed Size (px)
Citation preview

Volume 1, Issue 5, August 2020 E-ISSN : 2715-4203, P-ISSN : 2715-419X
Available Online: https://dinastipub.org/DIJDBM Page 747
ANALYSIS OF EFFECT PRICE AND QUALITY ON BRAND IMAGE AND ITS
IMPLICATION ON PURCHASE DECISION MODENA GAS COOKTOP (CASE
STUDY ON GRAND GALAXY CITY RESIDENCE BEKASI)
Muhammad Thariq Nahra Putra,1 Adi Nurmahdi2 1)PT. Modena Indonesia. 2)Magister Manajemen, Universitas Mercu Buana, Jakarta, Indonesia.
ARTICLE INFORMATION
Received: 22nd July 2020
Revised: 5th August 2020
Issued: 22nd August 2020
Corresponding author: First
Author
E-mail:
DOI:10.31933/DIJDBM
Abstract: This study aims to determine the effect of
price and quality on brand image and its implications
for purchasing decisions on Modena gas cooktops. This
study also examines the indirect effect of price and
quality on brand image with purchasing decisions as an
intervening variable. The study was conducted in the
grand galaxy city residence in Bekasi. The sample in
this study is consumers or at least know about Modena
products with a purposive sampling method. The
number of respondents who participated in this study
were 100 respondents. Data collection was done
through a questionnaire with a Likert scale of 1-5. The
method of analysis uses path analysis using SPSS
version 24.0. the results showed that price has a positive
and significant effect on brand image, quality has a
positive and significant effect on brand image, brand
image has a positive and significant influence on
purchasing decisions for Modena gas cooktop. Price
has a positive and significant influence on purchasing
decisions, quality has a positive and significant
influence on purchasing decisions. Price and quality
simultaneously have a positive and significant
influence on brand image. Price and quality of brand
image simultaneously have a positive and significant
influence on purchasing decision
Keywords: Price, Quality, Brand Image, Purchasing
Decision, Gas Cooktop.
INTRODUCTION
Competition in the primary field of household goods, especially gas cooktops, causing
employers should have the best strategy and appropriate to consider conditions in which the
company. Modern society nowadays prefer a gas stove for cooking after setby the government

Volume 1, Issue 5, August 2020 E-ISSN : 2715-4203, P-ISSN : 2715-419X
Available Online: https://dinastipub.org/DIJDBM Page 748
to shift usage to the oil burner gas stove in 2007, assuming that the LPG is more economical
than kerosene.
There are several examples of cooktops, including kerosene, electric cooktop, or gas
cooktop. One of cooktop that currently many users are gas stoves. PT. Modena Indonesia is
one of companies engaged in the field of household product needs by carrying Modena name
as a trademark. Modena is one of many brands of gas cooktop that is sold freely in the
Indonesian market.
Figure 1. Sales Volume Gas Cooktop MODENA
Based on data from Figure 1 sales volume of Modena gas cooktops tends to fluctuate
each month, but the quantity sold increases per each year. It is suspected that the possibility of
prospective Modena customers turning or switching to other products. Modena since its
establishment was first committed to providing household equipment, especially gas cooktops,
by targeting the market and target consumers with middle and upper income. Therefore, to find
out factors influence up and down sales volume gas stove, the researchers used historical data
from the preliminary survey with the aim of wanting to find out variables caused the up and
down of sales of gas cooktops PT. Modena Indonesia. Researchers conducted a pre-survey
related to these preferences. This pre-survey was carried out in the Grand Galaxy City Housing
area of Bekasi City and involved 30 respondents; each respondent was asked to choose what
factors influenced them in the purchase decision of a product.
Figure 2. Factors Influencing Purhasing Decisions
0
2000
4000
6000
8000
JAN FEB MAR APR MEI JUN JUL AUG SEP OKT NOV DES
Sales Volume Gas Cooktop MODENA
2016 2017 2018
0%
20%
40%
60%
80%
100%
0
5
10
15
20
25
30
Price Quality ProductDesign
BrandImage
Promotion BrandAmbassador
Factors Influence Purchase Decision
Total Correspondent Persentase %

Volume 1, Issue 5, August 2020 E-ISSN : 2715-4203, P-ISSN : 2715-419X
Available Online: https://dinastipub.org/DIJDBM Page 749
From pre-survey results as shown in figure 2 shows that there are 3 main factors that
are thought to influence consumer purchasing decisions on Modena gas cooktop products,
Price (83%), Quality (70%), Brand Image (67%). The data shows that consumers' assessment
and purchasing decisions on gas cooktop products are believed to be influenced by these three
factors, which could be a factor in the up and down in sales and market share of gas cooktop,
especially in Bekasi City. Based on this background, the authors are interested in conducting
research with the title "Analysis the Effect of Price and Quality on Brand Image and
Implications on Purchase Decision of Modena Gas Cooktop" (Case Study on Consumers of
Grand Galaxy City Residence in Bekasi).
LITERATUR REVIEW
Price. Price definition according to Hawkins and Mothersbough (2013), "price is the
amount of money one must pay to obtain the right to use the product," or means price is the
amount of money that must be paid to get the right to use a product. Initially, price history was
determined through negotiations between buyers and sellers. "Bargaining" is still common in
some areas. According to Kotler & Armstrong (2013), the company's decision in determining
prices is influenced by two main factors, namely the company's internal factors and external
environmental factors. These factors are: Internal Company Factors, consisting of four factors,
namely: (1) Marketing Objectives. (2) Marketing Mix Strategy. (3) Costs. (4) Organizational
Considerations. External Environmental Factors, consisting of three factors, namely: (1) The
market and demand. (2) Competition. (3) Other external factors such as economic conditions
and government intervention.
Quality. According to Tjiptono & Chandra (2011), the concept of quality is considered
as a measure of perfection of a product or service consisting of design quality and conformance
quality. Product quality is a specific function of a product or service, conformity quality is a
measure of how much the level of conformity between a product or service with quality
requirements or specifications that have been set previously. The definition of product quality
according to Kotler & Armstrong (2013) is "the ability of a product to perform functions,
includes the product's overall durability, reliability, precision, ease of operation and repair, and
other valued attributes" which means the ability of a product to demonstrate functions, it
includes overall durability, reliability, accuracy, ease of operation and repairs as well as other
product attributes.
Brand Image. Hasan (2013) argues that a brand is interpreted as a combination of a
name, sign, symbol or design to identify goods and services from a business or business group
that is developed into a trademark and distinguishes itself from competitors, creates influence
and produces value for the company. Many also refer to as design, color, motion, or a
combination of other product attributes that give identity and differentiation to competitors'
products. Brand image is a perception of a brand that is in the memory of consumers. Thus, the
brand image does not exist in the features, technology or in the product itself, but something
brought about by the advertisements, promotions or users of the product itself. Brand image is
often used as extrinsic cues when consumers evaluate a product before deciding on a purchase
intention (Wang and Tsai, 2014).
Buying decision. according to Setiadi (2010), the essence of consumer decision making
(consumer decision making) is an integration process that combines knowledge to evaluate two
or more alternative behaviors and choose one of them, whereas (Kotler, 2012), purchasing
decisions are actions of consumers to want buy or not against the product. According to Kotler
and Keller (2007), the purchase decision making process consists of 5 (five) stages of the
process (1) Problem Recognition. (2) Information Search. (3) Alternative Evaluation. (4)

Volume 1, Issue 5, August 2020 E-ISSN : 2715-4203, P-ISSN : 2715-419X
Available Online: https://dinastipub.org/DIJDBM Page 750
Purchase Decision. (5) Post Purchase Behavior. Marketers must monitor post-purchase
satisfaction, post-purchase actions and use of post-purchase products.
FRAMEWORK AND HYPOTHESIS
Figure 3. Framework
Hypothesis is a temporary answer to the formulation of a research problem. Based on
the model of thinking above, a hypothesis can be made as follows:
H1 : Price, quality partially influences brand image.
H2 : Quality partially influences brand image.
H3 : Price, quality simultaneously influences brand image.
H4 : Price partially influences purchasing decisions.
H5 : Quality partially influences purchasing decisions.
H6 : Brand image partially influences purchasing decisions.
H7 : Price, quality, brand image simultaneously influences purchasing decisions.
RESEARCH METHODS
The study was conducted in grand galaxy city residence bekasi using purposive sampling
method. The number of respondents who participated in the study were 100 respondents with
criteria for gender, age, education level, occupation and income. Data collection was carried
out through a questionnaire with a Likert scale of 1-5. The research variables used are as
follows: (1) The independent variables are Price (X1) and Quality (X2), (2) The dependent
variable is Brand Image (Y) and Purchase Decision (Z).
Analyst method uses a path analysis approach using SPSS version 24.0. Some of the tests
carried out are (1) Test of research instruments, namely validity and reliability tests, (2)
Classical Assumptions Test includes Normality, Multicollinearity and Heteroscedathicity
Tests, (3) Hypothesis Tests include T Test (Partial Influence), F Test (Influence
simultaneously), Determinant Coefficient Analysis (R2) and Correlation Test between
dimensions and Path Analysis.
RESULTS AND DISCUSSION
Based on the results of the research analysis, validity test of all item questions regarding the
research variables as many as 32 questions is valid because it shows the results of r count

Volume 1, Issue 5, August 2020 E-ISSN : 2715-4203, P-ISSN : 2715-419X
Available Online: https://dinastipub.org/DIJDBM Page 751
greater than r tables. While the reliability test is known that all instruments in the study are
reliable or can be trusted because it has a Cronbach's Alpha value ranging from above 0.6.
Table 1. Validity Test Result
Based on table 1 the validity test on the variable items price, quality, brand image, and
purchasing decisions of respondent’s n = 100 and the significance level of 5% with formula df
= n-2, the r table value obtained 0.196. it can be concluded that the variable is valid, because r
calculate value is greater than rtable so that the questionnaire can be used as a research
instrument.
Table 2. Reliability Test Result
Varible and Indicator r Calculate r Table F. Value Status
Price (X1)
Indicator 1 0.595 0.196 0.000 Valid
Indicator 2 0.771 0.196 0.000 Valid
Indicator 3 0.619 0.196 0.000 Valid
Indicator 4 0.388 0.196 0.000 Valid
Indicator 5 0.659 0.196 0.000 Valid
Indicator 6 0.518 0.196 0.000 Valid
Indicator 7 0.658 0.196 0.000 Valid
Indicator 8 0.698 0.196 0.000 Valid
Quality (X2)
Indicator 1 0.808 0.196 0.000 Valid
Indicator 2 0.825 0.196 0.000 Valid
Indicator 3 0.763 0.196 0.000 Valid
Indicator 4 0.816 0.196 0.000 Valid
Indicator 5 0.749 0.196 0.000 Valid
Indicator 6 0.724 0.196 0.000 Valid
Indicator 7 0.741 0.196 0.000 Valid
Indicator 8 0.720 0.196 0.000 Valid
Brand Image (Y)
Indicator 1 0.766 0.196 0.000 Valid
Indicator 2 0.732 0.196 0.000 Valid
Indicator 3 0.762 0.196 0.000 Valid
Indicator 4 0.851 0.196 0.000 Valid
Indicator 5 0.664 0.196 0.000 Valid
Indicator 6 0.778 0.196 0.000 Valid
Indicator 7 0.658 0.196 0.000 Valid
Indicator 8 0.629 0.196 0.000 Valid
Purchase Decision (Z)
Indicator 1 0.710 0.196 0.000 Valid
Indicator 2 0.535 0.196 0.000 Valid
Indicator 3 0.649 0.196 0.000 Valid
Indicator 4 0.660 0.196 0.000 Valid
Indicator 5 0.727 0.196 0.000 Valid
Indicator 6 0.610 0.196 0.000 Valid
Indicator 7 0.674 0.196 0.000 Valid
Indicator 8 0.634 0.196 0.000 Valid
Volume 1, Issue 5, August 2020 E-ISSN : 2715-4203, P-ISSN : 2715-419X
Available Online: https://dinastipub.org/DIJDBM Page 752
Variable Cronbach’s Alpha N of items Cronbach’s
Alpha Standard Result
Price (X1) 0.755 8 0.6 Reliable
Quality (X2) 0.899 8 0.6 Reliable
Brand Image (Y) 0.874 8 0.6 Reliable
Purchase Decision (Z) 0.796 8 0.6 Reliable
Normality test can be seen with Kolmogorov-Smirnov test
on Tests of Normality table. If the data is normally distributed, value is significant
in Kolmogorov-Smirnov column> 0.05. If the Sig. <0.05 then the data
said to be not normally distributed. following normality test results are listed in table 3 and
table 4
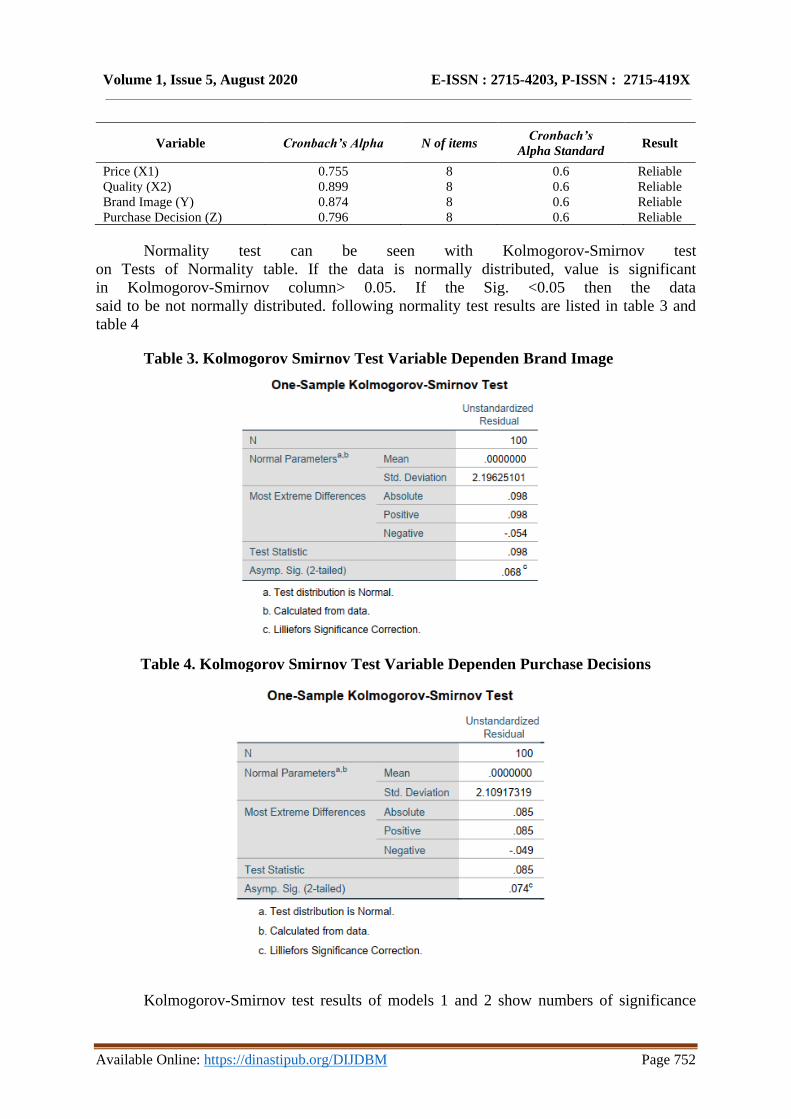
Table 3. Kolmogorov Smirnov Test Variable Dependen Brand Image
Table 4. Kolmogorov Smirnov Test Variable Dependen Purchase Decisions
Kolmogorov-Smirnov test results of models 1 and 2 show numbers of significance

Volume 1, Issue 5, August 2020 E-ISSN : 2715-4203, P-ISSN : 2715-419X
Available Online: https://dinastipub.org/DIJDBM Page 753
greater than 0.05 (> 5%). This shows that regression model is normally distributed, so it can
be further analyzed. Multicollinearity test aims to test whether in model
regression found a correlation between independent variables. Regression model
well its houldn't happen between free variables. In this research multikolinearitas symptoms
views of the value of tolerance and Variance Inflation
Factor (VIF). Multicollinearity test results can be seen in Table 5 below:
Table 5. Multicollinearity Test
Heteroscedasticity Test performed using the Scatter Plot as shown in Figure 4 and
Figure 5:
Figure 4. Scatterplot Heteroscedasticity Test Model 1

Volume 1, Issue 5, August 2020 E-ISSN : 2715-4203, P-ISSN : 2715-419X
Available Online: https://dinastipub.org/DIJDBM Page 754
Figure 5. Scatterplot Heteroscedasticity Test Model 2
Based on Figures 4 and 5 heteroscedasticity test results show that the points spread above
the number 0 (zero) and below the number 0 (zero). It can be concluded that the data in
regression path of model 1 and model 2 do not experience heteroscedasticity problems, or the
data has homocedasticity.
First Structure Model. This first structural equation is done through linear regression
analysis which only considers the value of standardized coefficients.
Table 6. t Test Path Model 1 Coefficients
Model 1 Standardized Coefficients t Sig
X1 0.190 2.373 0.02
X2 0.669 8.334 0.00
R2 0.653
F 91.253 0.000
a: Dependent Variable Brand Image (Y)
Based on Table 6 above, it can be concluded that the magnitude of the value of sig. <from
0.05 so that the independent variable significantly influences the dependent variable. The
independent variables used are Price (X1), Quality (X2) and the dependent variable brand
image (Y). regression equation can be determined as follows:
Y1=0.190X1+0.669X2+0.347
1. Based on table 6, the coefficient results can be interpreted as follows:
Effect of Price on Brand Image. The results of the analysis are the significant price effect
on Brand Image, where the magnitude of influence seen from the value of Standardized
Coefficient (beta) that is equal to 0.190 or 19%.
2. Effect of Quality on Brand Image. Quality affects the Satisfaction of Brand Image, where
the magnitude of influence can be seen from the Standardized Coefficient (beta) which is
equal to 0.669 or 67%.
Then in the F test, the value of R Square (R2) in the table is 0.653 where the number is
used to see the effect of Price and Quality simultaneously on brand image that is 65.3%. While
the remaining 34.7% is influenced by other variables outside this model. Based on the F test
results in this study obtained a sig of 0,000 <0.05, then the decision is H0 rejected and H1
accepted, meaning that the independent variables consisting of Price and Quality
simultaneously affect the Brand Image. The magnitude of influence is 65.3% and the
magnitude of influence outside other variables outside the regression is 34.7%.
Second Structure Model. This second structural equation is done through linear
regression analysis which only considers the standardized coefficients.

Available Online: https://dinastipub.org/DIJDBM Page 755
Table 7. t Test Path Model 2 Coefficients
Model 2 Standardized Coefficients t Sig
X1 0.186 2.130 0.03
X2 0.393 3.530 0.00
Y 0.286 2.660 0.00
R2 0.615
F 51.067 0.000
b: Dependent Variable Purchase Decisions (Z)
Berdasarkan Tabel 7 menunjukan besaran nilai koefisien setiap variabel independent
yang digunakan, yaitu Harga, Kualitas dan Citra Merek. Dengan demikian persamaan
regresinya dapat ditetapkan sebagai berikut:
Z= 0,186X1+0,393X2+0,286Y
Based on these equations, it can be analyzed the effect of price, quality and brand image of
each individual on purchase decision as follows:
1. Effect of Price on Purchasing Decisions. To see the effect of price on purchase decision,
in this case the correspondence that already have or will purchase gas stoves planted with
significance level of 0.05 with 100 respondents, the figures obtained t table of 1.9840. so
that the tcount is obtained at 2.130> t table 1.9840, so H0 is rejected and H1 is accepted.
2. Effect of Quality on Purchasing Decisions. Quality influence on Purchasing Decisions
with a significant level of 0.05 with the number of 100 respondents, the t table 1.9840 is
obtained, t count is 3,530> t table 1.9840, so H0 is rejected and H1 is accepted.
3. Effect of Brand Image on Purchasing Decisions. Influence of Brand Image on Purchase
Decision by the significant level of 0.05 by the number of respondents 100, it can be seen
from the figure ttable 1.9840, obtained t calculate equal to 2,660> t table 1.9840, so that H0
rejected and H1 accepted.
the F test, the value of R Square (R2) on the test results amounted to 51.067 where F is
the figure used to see the effect of price, quality and brand image simultaneously to the purchase
decision. This means that Price, Quality and Brand Image have a simultaneous effect of 51.06%
on the Purchasing Decision. While the remaining 48.94% is influenced by other variables
outside this model.
Based on the results of F in this study obtained a sig value of 0,000 <0.05, and f
arithmetic> F table (51.067> 1.39) then the decision is H0 rejected and H1 accepted, meaning
that the independent variables consisting of Price, Quality and Brand Image simultaneously
influence Purchasing Decisions. the magnitude of the effect is 51.06% and the magnitude
outside the other variables outside the regression is 48.94%.
The following are the results of the calculation of influence on the path analysis models
1 and 2 as shown in table 8.
Table 8. Direct, Indirect and Total Influence
Path
Model Hipothesis Variable Influence
Influence
Remain TOTAL Direct
Indirect
throught Y
1 H1 X1 → Y 0.190 0.190
H2 X2 → Y 0.669 0.669
H3 X1, X2 → Y 0.653 0.347 1
2 H4 X1 → Z 0.186 0.054 0.24
H5 X2 → Z 0.393 0.191 0.584
H6 Y → Z 0.286

Available Online: https://dinastipub.org/DIJDBM Page 756
H7 X1, X2, Y → Z 0.615 0.385 1
Table 8 can be seen that the influence of Price, Quality, partially and directly on Brand
Image is positive and significant with a value of 0.190, 0.669. Variable quality has the greatest
value among other variables. Next variable price and quality simultaneously also affects the
image of the brand with a value of 0.653. Furthermore, it is known that there is a significant
influence between Price and quality on purchasing decisions directly, it shows that the effect
of Price, Quality, Brand Image individually influences Purchasing Decisions. The influence of
price and quality directly and positively and significantly influences the purchase decision with
a total of 0.186 and 0.393.
Based on the results of the study note that the relationship of the influence of Price,
Quality indirectly on Purchase Decisions through Brand Image has a large enough value that
is 0.054 and 0.191. Then the variable Price, Quality and Brand Image simultaneously have a
positive and significant influence on Purchasing Decisions with a value of 0.615. Figure 6
Illustrates empirical causal value between model 1 and model 2.
Figure 6. Empirical Causal path Model 1 dan Model 2
Correlation. To find out the level of strength of the relationship between each variable,
a correlation test between variables is performed as seen in table 9.
Table 9. Correlation Coefficient Between Variables
Correlations
Price Quality Brand
Image
Purchase
Decisions
Price Pearson
Correlation 1 .666** .636** .630**
Sig. (2-tailed) .000 .000 .000
N 100 100 100 100
Quality Pearson
Correlation .666** 1 .795** .744**
Sig. (2-tailed) .000 .000 .000
N 100 100 100 100
Brand
Image
Pearson
Correlation .636** .795** 1 .717**
Sig. (2-tailed) .000 .000 .000

Available Online: https://dinastipub.org/DIJDBM Page 757
N 100 100 100 100
Purchase
Decisions
Pearson
Correlation .630** .744** .717** 1
Sig. (2-tailed) .000 .000 .000
N 100 100 100 100 ** Correlation is siginicant at the 0.01 level (2-tailed)
Based on Table 9, it can be interpreted that there is a correlation between price (X1)
and Quality (X2) of 0666, the correlation of price (X1) and Brand (Y) equal to 0.636, the
correlation Quality (X2) and Brand (Y) of 0795, Price correlation (X1) and Purchase Decision
(Z) 0.630, correlation Quality (X2) and Purchase Decision (Z) of 0744, correlation Brand (Y)
and Purchase Decision (Z) of 0.717. The correlation between above-mentioned variables are
significant and in line because the numbers significance of each of these relations of 0000 or
less than 0.05 and is marked with two stars.Correlation between dimensions. To find out which
dimensions with a strong enough effect, a matrix is made that connects all dimensions between
the independent variables, in this study, the data displayed are not as a whole (Full data can be
seen in the appendix), shown in Table 10 as follows.
Table 10. Matriks Analysis Colleration Between Variable
Variable Dimention
Brand Image Purchase Decisions
Memorable Meaningful Personal
Factors
Psychological
Factors
Y1 Y2 Y3 Y4 Z5 Z6 Z7 Z8
Price
Affordable Price X1.1 0,21 0,216 0,403 0,425 0,315 0,149 0,288 0,305
X1.2 0,379 0,285 0,443 0,49 0,335 0,269 0,343 0,364
Suitability price with
quality
X1.3 0,316 0,226 0,335 0,249 0,185 0,177 0,303 0,359
X1.4 0,126 0,229 0,305 0,215 0,202 0,144 0.1 0.004
Suitability price with
benefits
X1.5 0.071 0,134 0,198 0,188 0,235 0,143 0,442 0,44
X1.6 0,147 0,416 0,221 0,249 0.084 0,145 0,265 0,38
Suitability price with
ability
X1.7 0,295 0,183 0,233 0,302 0,29 0,237 0,416 0,442
X1.8 0,412 0,442 0,434 0,528 0,375 0,255 0,479 0,485
Quality
Performance X2.1 0,375 0,373 0,401 0,448 0,443 0,418 0,586 0,576
X2.2 0,482 0,493 0,584 0,542 0,418 0,236 0,48 0,493
keandalan X2.3 0,375 0,396 0,372 0,384 0,378 0,225 0,513 0,512
X2.4 0,426 0,475 0,528 0,588 0,498 0,295 0,489 0,462
Specification X2.5 0,298 0,396 0,546 0,493 0,384 0,14 0,518 0,543
X2.6 0,17 0,421 0,439 0,301 0,251 0,063 0,578 0,567
aesthetics X2.7 0,36 0,44 0,408 0,433 0,512 0,208 0,356 0,301
X2.8 0,346 0,418 0,448 0,454 0,489 0,218 0,331 0,303
Brand
Image
Memorable Y1 0,391 0,348 0,358 0,353
Y2 0,313 0,166 0,37 0,345
Meaningful Y3 0,421 0,327 0,304 0,398
Y4 0,411 0,3 0,486 0,481
Purchase
Decisions
Personal Factors Z5 0,391 0,313 0,421 0,411
Z6 0,348 0,166 0,327 0,3
Psychological Factors Z7 0,358 0,37 0,304 0,486

Available Online: https://dinastipub.org/DIJDBM Page 758
Z8 0,353 0,345 0,398 0,481
Table 10 explains that the test results with the highest correlation between the variable
price (price Conformity dimension with ability) to variable of brand image (dimensions
meaningful) has a value of 0.528. Meanwhile, the variable price (price suitability dimension
with ability) to purchasing decision (dimensions of psychological factors) happened a strong
correlation of 0.485. Furthermore, variable quality (reliability dimension) to brand image
(dimensions meaningful) happened a strong correlation of 0.588. In addition, variable quality
(dimensions of performance) on purchase decisions (dimensions of psychological factors) there
is also a strong correlation of 0.586. means that the product has performed well and according
to expectations when time usage. Based on the results of the study using path analysis, two
sub-structures are obtained by discussing the results of the study as follows:
Path Analysis Model I
The first analysis shows that Price (X1) has a positive and significant effect directly on
brand image (Y). this is in line with the results of previous studies conducted by Amron (2018),
Panji Umar Wicaksono (2017) where prices partially have a significant effect on Brand Image.
meaning that if the price of a product offered is in accordance with the ability of consumers,
then the brand image of a product will be formed because it represents the desires of consumers.
The second analysis shows that Quality (X2) has a positive and significant effect on
Brand Image (Y). This is in line with the results of previous research conducted by Andrianto,
Hendra Noky dan Idris (2013) where product quality has a positive and significant effect on
Brand Image. This means that product reliability is in line with consumer expectations, so
consumers will always remember the brand that has provided reliability and satisfaction.
The third analysis shows that the variable Price (X1) and Quality (X2) together
(simultaneously) has a positive and significant effect on Brand Image (Y). This is consistent
with results of research conducted by Asep Septeri and Panji Umar Wicaksono (2018) who
stated that Price and Quality had a positive and significant effect on Brand Image. In model 1
sub-structure, Quality is the most influential variable on Brand Image, followed by Price, so
that in order to increase sales in the future, Modena must be able to maintain its product image
in the form of a product that is modern, easy to operate, attractive colors and pay attention to
product quality.
Path Analysis Model II
In the sub-structure of model 2, the fourth analysis can be seen that the variable price
(X1) significantly influences the purchase decision (Z). this is in line with research conducted
by Jackson R.S Weenas (2013) that consumers want competitive prices in terms of ability,
whether the price offered is in accordance with the needs and capabilities provided by the
product or not.
The fifth analysis shows that Quality (X2) has a significant effect on Purchasing
Decisions (Z). this is in line with research conducted by Hadi Brata, Baruna; Shilvana Husani
dan Hapzi Ali (2017) that consumers want to experience functional benefits when buying a
product.
The sixth analysis shows that Brand Image (Y) is proven to have positive results and has
a significant effect on Purchasing Decisions (Z). this is in line with research conducted by
Aprianto Ronal (2016) that when in the social environment we are able to remember a brand
quite well, eating will influence consumer purchasing decisions on a product because the
surrounding environment recommends a brand that they remember to others.
The results of the seventh analysis showed that the price variable (X1), Quality (X2) and

Available Online: https://dinastipub.org/DIJDBM Page 759
Brand Image (Y) together (simultaneously) had a positive and significant effect on Purchasing
Decisions (Z). this is in line with research conducted by Amrulloh, Artika Romal dan Sasi
Agustin (2016) that simultaneously price, product quality and brand image have a significant
effect on purchasing decisions. Price suitability, perceived quality of the product, and a good
brand image in the surrounding environment can change consumer purchasing decisions.
Based on the results of study show that Brand Image as an intervening variable (pathway)
in path analysis is proven to have an impact on Purchasing Decisions as a result of influence
of independent variable Price and Quality which can be interpreted that Brand Image can
increase if Price and Quality are able to represent consumer desires, so that implications
towards the Purchase Decision. From these 2 variables, in the path analysis model 2, one
independent variable that has a significant effect is Quality (X2) so as to influence consumer
purchasing decisions, the most appropriate way is to improve the quality of products offered
so that they are in line with consumer expectations.
CONCLUSION AND SUGGESTION
Conclusion
Based on the results of research and discussion Analysis Effect of Price and Quality and
It’s Implication on Purchase Decision Modena Gas Cooktop, several conclusions can be drawn,
namely:
1. The results of the study found that price has a significant influence on brand image. This
shows that consumers before deciding to buy a Modena gas cooktop compare and interpret
in advance the price offered whether it is in accordance with the capabilities, benefits,
reliability and quality.
2. It is proven that product quality variable has a significant influence on brand image of gas
cooktoop. This shows that consumers want a product of highest quality. If quality of a
product is good, then brand image will increase along with customer satisfaction with
product quality.
3. It is proven that the brand image variable has a significant influence on the decision to
purchase a gas cooktop. Consumers still assess brand image as a factor in buying a gas
cooktop product. If brand image is good in the market, consumers will consider the
purchase decision.
4. Proven that price has a significant effect on purchasing decisions. This indicates that price
set by Modena, expensive or cheap can affect the purchase decision.
5. It is proven that quality has a significant effect on purchasing decisions. This indicates that
quality is considered by consumers in purchasing gas cooktop products.
6. Price and quality variables simultaneously proved to have a significant effect on brand
image. This condition is a logical consequence of a product offered and sold to consumers.
7. Variable price, quality and brand image simultaneously have a significant influence on
purchasing decisions. This condition is a logical consequence of the accumulation of
influence of price, product quality, brand image on purchasing decisions. The results
showed that Modena's efforts in setting prices, guarding and offering highest quality
products and creating a good brand image were able to influence consumer purchasing
decisions for gas cooktop products.
Suggestion
Based on the results of research, analysis and discussion and conclusions that have been
described, the researcher recommends the following points.
1. The results of study indicate that price influences the brand image especially on the
suitability of prices with quality and benefits, where the results of respondents' assessment
of Modena products as a whole are quite good but need to be developed and improved

Available Online: https://dinastipub.org/DIJDBM Page 760
regarding price offered. There needs to be a review and analysis every month related to
price of Modena gas cooktops products with other competitors.
2. In order for product quality to be maintained properly, response to customer complaints
about the product must be improved by improving the quality of customer service so that
quickly resolved, and there is product improvement to prevent repeated complaints from
consumers. In this way, brand image will be maintained well in the eyes of consumers.
3. Modena must be able to maintain ibrand image as number 1 trademark in Indonesia for
cooking category by improving verbal and visual communication in marketing its
products.
4. So that companies can conduct comparative studies on competitors in the market each
month regarding prices offered to consumers. Price is frontline in consumer purchasing
decision factors.
5. So companies can produce gas cooktop products in terms of performance and
specifications can influence consumer purchasing decisions.
6. So companies can determine a clear market segmentation by making a grouping or making
a second brand related to the price and quality of a product because so far Modena is a
brand of gas cooktop with middle and upper market segmentation.
7. To overall positive results of this study it is recommended that companies can always
monitor and see the economic conditions of the purchasing power of consumers. then be
able to consistently maintain quality of its products and after service services so that brand
image formed so far will be well preserved and always be a determining factor in
purchasing decisions
REFERENCE Amron, Amron. 2018. “The Influence of Brand Image, Brand Trust, Product Quality and Price on The
Customer’s Buying Decision of MPV Cars”. European Scientific Journal, Vol. 14 No. 13.
Arslan, Muhammad. 2014. “Impact of Brand Image and Service Quality on Consumer Purchase
Intention”. Research on Humanities and Social Scienses, Vol. 4, No. 22.
Andrianto, Hendra Noky dan Idris. 2013. “Pengaruh Kualitas Produk, Citra Merek, Harga, dan Promosi
terhadap Keputusan Pembelian Mobil Jenis MPV Merek Toyota Kijang Innova di Semarang.”
Diponegoro Journal of Management. Vol 2, No 3, Hal 1-10.
Ali, Hapzi, Evi Narulita, Adi Nurmahdi. 2018. “The Influence of Service Quality, Brand Image and
Promotion on Purchase Decision at MCU Eka Hospital.” Suadi journal of Business and
Management Studies. Vol. 3 Issue. 1
Amrulloh, Artika Romal dan Sasi Agustin. 2016. “Pengaruh Kualitas Produk, Harga, dan Citra Merek
terhadap keputusan Pembelian Honda Beat.” Jurnal Ilmu dan Riset Manajemen, Vol. 5, No 7.
Aprianto Ronal. 2016. “Pengaruh Brand Image Dan Word Of Mouth Communication Terhadap
Keputusan Pembelian Kompor Gas Rinnai Pada Konsumen Kelurahan Cereme Taba Kota Lubuk
Linggau.” Jurnal Ilmiah Orasi Bisnis, Vol. 16. No 2.
Bian, Xuemei and Luiz Moutinho. 2011. The Role of Brand Image, Product Involvementand knowledge
in Explaining Consumer Purchase Behavior of Counterfeits. European Journal of Marketing.
Volume 45 (1). Hal 191-216.
Carunia Mulya Firdausy, Rani Idawati. 2017. “Effects of Service Quality, Price and Promotion on
Customers purchase Decision of Traveloka Online Airline Tickets in Jakarta”. International
Journal of Management Science and Business Administration. Vol. 3, Issue 2, January 2017,
Pages 42-49.
Fiani. Margaretha dan Edwin Japarianto. 2012. “Analisis Pengaruh Food Quality dan Brand Image
Terhadap Keputusan Pembelian Roti Kecik Toko Roti Ganeps di Kota Solo.” Jurnal Manajemen
Pemasaran Vol.1 No 1.
Ghozali, Imam. 2011. “Aplikasi Analisis Multivariate dengan Program SPSS”. Semarang: Badan
Penerbit Universitas Diponegoro.
Gurleen, Kanwal and Pooja Bhandari. 2014. “Customer Satisfaction and Factors Influencing The

Available Online: https://dinastipub.org/DIJDBM Page 761
Purchase Decision of Notebook Computers in Punjab.” Journal Research in Marketing, Vol. 2,
No.3 pp 205-211.
Hadi Brata, Baruna: Shilvana Husani dan Hapzi Ali, 2017. “The Influence of Quality Product, Price,
Promotion and Location to Product Purchase Decision on Nitchi at PT. Jaya Swarasa Agung in
Central Java”. Saudi Journal of Business and Management Studies. Vol. II, No.2, hal 433-445.
Istanita, Sukma. Et al. 2016. Pengaruh Green Marketing terhadap Citra Merek dan Keputusan
Pembelian (Survei pada Produk Ramah Lingkungan Lampu Philips LEG di Perum Kepajen
Permai 1. Rw 4, Desa Talangagung, Kec. Kapajen, Malang, Jawa Timur)”. Jurnal administrasi
Bisnis (JAB) Vol. 32 No. Maret 2016.
Jackson R.S Weenas. 2013. “Kualitas Produk, Harga, Promosi dan Kualitas Pelayanan Pengaruhnya
terhadap Keputusan Pembelian Spring Bed Comforta”. Jurnal Emba. Vo.11 No. 4. Desember
2013.
Kotler, Philip dan Gary Armstrong. 2013. Prinsip-Prinsip Pemasaran. Terjemahan Bob Sabran.
Kotler, Philip dan Kevin Lane Keller. 2012. Manajemen Pemasaran. Edisi 14. Erlangga. Jakarta.
Mehmood, Waqas and Owais Shafiq. 2015. “Impact of Customer Satisfaction, Service Quality, Brand
Image on Purchase Intention”. Jurnal of Marketing and Consumer Research, Vol. 15.
Monintja, Reimond Yohanes et al. 2013. “Analisis Merek, Promosi dan Harga pengaruhnya terhadap
Keputusan Pembelian Gelael Swalayan Manado. Jurnal EMBA. Vol. 3 No. 4.
Schiffman, Leon G. and Leslie L. Kanuk. 2000. Consumer Behavior. Fith Edition Prentice-Hall Inc.
New Jersey.
Uddin, Reaz, Nusrat Zahan Lopa dan Oheduzzaman. 2014. “Factors Affecting Customers’ Buting
Decisions of Mobile Phone: A Study on Khulna City, Bangladesh”. International Journal of
Managing Value and Supply Chains (IJMVSC) june 2014, Vol. 5, No. 2, PP 21-28.
Wicaksono, Usmar Panji. 2017. “Analisis pengaruh Kualitas Produk, Persepsi Harga, Promosi
Terhadap Citra Merek dan Minat Beli Serta Dampaknya pada Keputusan Pembelian Kartu
Perdana XL Axiata di Semarang”. Diponegoro Journal of Management. Vol.6 No. 2. Tahun 2017
Hal 1-11.