Embed Size (px)
Citation preview
energyequipsys/ Vol 3/No2/Dec 2015/ 125-136
Energy Equipment and Systems
http://energyequipsys.ut.ac.ir www.energyeuquipsys.com
Analysis of effective factors on transient ground potential rise in gas insulated substations
Authors
Zahra Moravej a*
Maziar Babaei
a
Sajad Bagheri a
a Faculty of Electrical & Computer
Engineering, Semnan University, Semnan, Iran
ABSTRACT
This study presents the manner in which transient modeling concepts, which are fully analyzed in the referred standards, are implemented, for the purpose of evaluating the Transient Ground Potential Rise (TGPR). This is a phenomenon of 10–100kV voltages with up to 10µs duration on the grounded enclosure of Gas Insulated Substations (GIS), which may cause concern for personnel safety and problems for protection and control circuits in substations. This article summarizes the results of the investigation for influential factors on TGPR, such as, different contingency conditions and grounding system models. This article focuses on the TGPR study of "Siah-bishe" 400kV gas insulated substation. The study was carried out by modeling all pieces of equipment in the ElectroMagnetic Transients Program (EMTP)-RV, with careful consideration of different modeling guidelines and instructions described in the available standards.
Article history:
Received : 5 October 2015 Accepted : 28 October 2015
Keywords: EMTP-RV, Gas Insulated Substations, Transient Enclosure Voltage, Transient Ground Potential Rise
(TGPR), Very Fast Transient (VFT).
1. Introduction
Gas Insulated Substations (GIS) have been widely used in power systems because of their beneficial features. They have disadvantages that cause serious concerns. The major concern is that gas insulated substations are origins of transient over voltages with 1.5 to 2.5 per unit (PU) magnitude and with a frequency spectrum from 100 kHz to 50 MHz, therefore, they are known as “Very Fast Transient Overvoltage” (VFTO) [1, 2]. Very fast transient overvoltage is generated during the disconnector (DS) operation in gas-insulated switchgear (GIS). Very fast transient overvoltage is generated when the DS switches the short no-load busbar in the gas insulated switchgear (GIS). Very fast transient overvoltage may threaten the safety operation of GIS and its connected *Corresponding author: Zahra Moravej Address: Faculty of Electrical & Computer Engineering, Semnan University, Semnan, Iran E-mail address: [email protected]
equipment. As the rated voltage of GIS increases, the difference between the maximum of VFTO and its lightning impulse withstand voltage (LIWV) gradually decreases. Hence, VFTO becomes the main dielectric stress to GIS optimization and insulation coordination for the ultra high-vacuum (UHV) systems [3-7].
The Very Fast transient phenomena are generally generated in two ways: Either the voltage at some point in a GIS collapses as a result of dielectric failure to ground or the voltage across a disconnector switch or circuit breaker, but it is mainly caused by the operation of a disconnector switch [8]. The collapse of voltage across the contacts of switching equipment occurs in 3–5 ns and this is sufficiently fast to stimulate resonance within the GIS up to about 50 MHz [9]. On account of the relatively slow speed of the moving contact, a large number of pre- or re-strikes can occur during a disconnector’s operation and these transients can cause stress on all devices [2].

126 Zahra Moravej et al./energyequipsys / Vol 3/No2/Dec 2015
The VFT in GIS can be divided into internal and external modes [2]. In the SF6-Air terminal, because of change in surge impedance, a portion of internal VFT reflects back to GIS and a portion of the transients reaches the overhead transmission line and another portion propagates to the GIS enclosure. Very fast transients (VFTs) are generated during switching operations of circuit breakers (CBs) and disconnectors (DSs) within the GIS. These transients have a very short rise time, in the range of 4–100 ns, and are normally followed by oscillations having frequencies in the range of 100 kHz to 50 MHz [10, 11].
The Transient Ground Potential Rise (TGPR), also known as Transient Enclosure Voltage (TEV) is a short duration transient that appears on the external surface of the GIS enclosure because of the voltage collapse during disconnector switch operation or rarely because of ground faults. Few publications have been presented on detailed modeling and analysis of over voltages that have appeared on the GIS enclosure caused by voltage failure in GIS substations. This study concentrates on the manner of application of transient modeling concepts, fully analyzed in the referred standards, for the purpose of investigating the TGPR in the “Siah-Bisheh” GIS substation. This substation is a switching substation of a pump storage power plant situated in a mountainous region in the north of Iran and because of the geographical constraints of the substation site location and the special arrangement of gas-insulated bus ducts and components, the necessity of the TGPR study in this case is very significant. This article first explains the origin of these overvoltages, following which the method for the exact modeling of TGPR in a 400 kV GIS substation has been presented. Finally in this article, the effective factors on wave shape and magnitude of the TGPR are investigated.
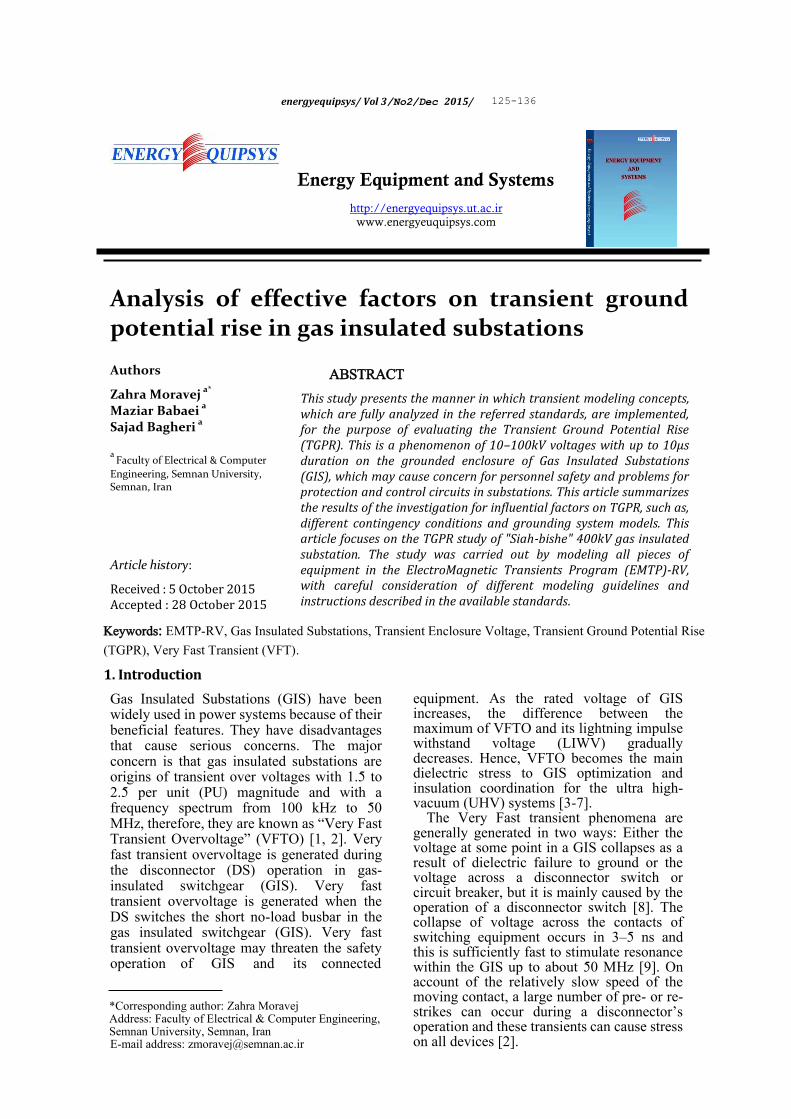
2.Origin of TGPR in GIS substations When internal transients encounter enclosure discontinuities such as bushings, a portion of the transients coupled to the GIS enclosure are called “Transient Ground Potential Rise” (TGPR). The TGPR duration time is about few microseconds. Its magnitude varies along the GIS enclosure and it can be in the limit of 0.1 to 0.3 PU of the system voltage [12]. As is shown in Fig.1, when an internal wave propagates to the gas-to-air bushing, a portion of the transient is coupled onto the overhead transmission line, and a portion is coupled onto the GIS enclosure-to-ground transmission line. The wave that propagates along the enclosure-to-ground transmission line is the TEV [13].
At the SF6-Air termination, as illustrated in Fig.2, because of change in surge impedance, the termination can be defined as the junction of three transmission lines: (1) Coaxial GIS busduct, (2) overhead transmission line, (3) GIS enclosure to the ground [13].
3.Modeling guideline and simulation For modeling, the busbar and enclosure-to-earth voltages and the in-between voltages would be determined by the propagation of two surges: The busbar-to-enclosure surge and enclosure-to-earth surge [14]. For this and all other transmission lines two models were made: The busbar-to-enclosure line and the enclosure-to-earth line. These lines were modeled as a two-phase Constant Parameter (CP) line. Modal surge impedances and modal propagation velocities of this two-phase line were equal to surge impedances and propagation velocities of two single- phase lines, that is a single modal surge impedance and propagation velocity was equal to the surge impedance and the propagation velocity for a single pipe
Fig. 1. Generation of TGPR along GIS
Zahra Moravej et al./energyequipsys / Vol 3/No2/Dec 2015 127
(a)
(b)
(c)
Fig. 2. Transition of VFT from GIS to Air (a) SF6-Air Bushing (b) Schematic diagram (c) Equivalent circuit
conductor. The second modal surge impedance and propagation velocity were equal to the surge impedance and propagation velocity for a line modeled in a pipe above the earth. As the modal analysis calculated voltage surges in each mode for a single mode, independent of the other, it could be concluded that modal voltage surges spread independently of one another [2, 14].
On account of the origin and the traveling nature of VFT, modeling of GIS components makes use of electrical equivalent circuits composed of lumped elements and distributed parameter lines [2]. The calculation of internal transients may be performed using distributed parameter models for which only an internal mode (conductor-enclosure) is taken into account, moreover, it is assumed that the external enclosure is perfectly grounded. If TEV is a concern, then a second mode
(enclosure-ground) has to be considered. The modeling of the GIS for computation of TEV must include the effects of the enclosure, the representation of ground straps, and the grounding grid [15].
As the whole system is a three-phase symmetrical system, a single-phase circuit can be used to simulate it. The study was carried out by modeling all pieces of equipment in the EMTP‐RV Version 2.2 according to the instructions described in IEC 60071‐4 [16].
For introduction of the studied substation, it is worth mentioning that “Siah-bishe” 400kV GIS substation is situated in a mountainous region of Iran. The geographical feature of the site location, 2500 m above sea level, became the major concern with regard to the design of the insulation withstand levels for the equipment, because of low air density.
128 Zahra Moravej et al./energyequipsys / Vol 3/No2/Dec 2015
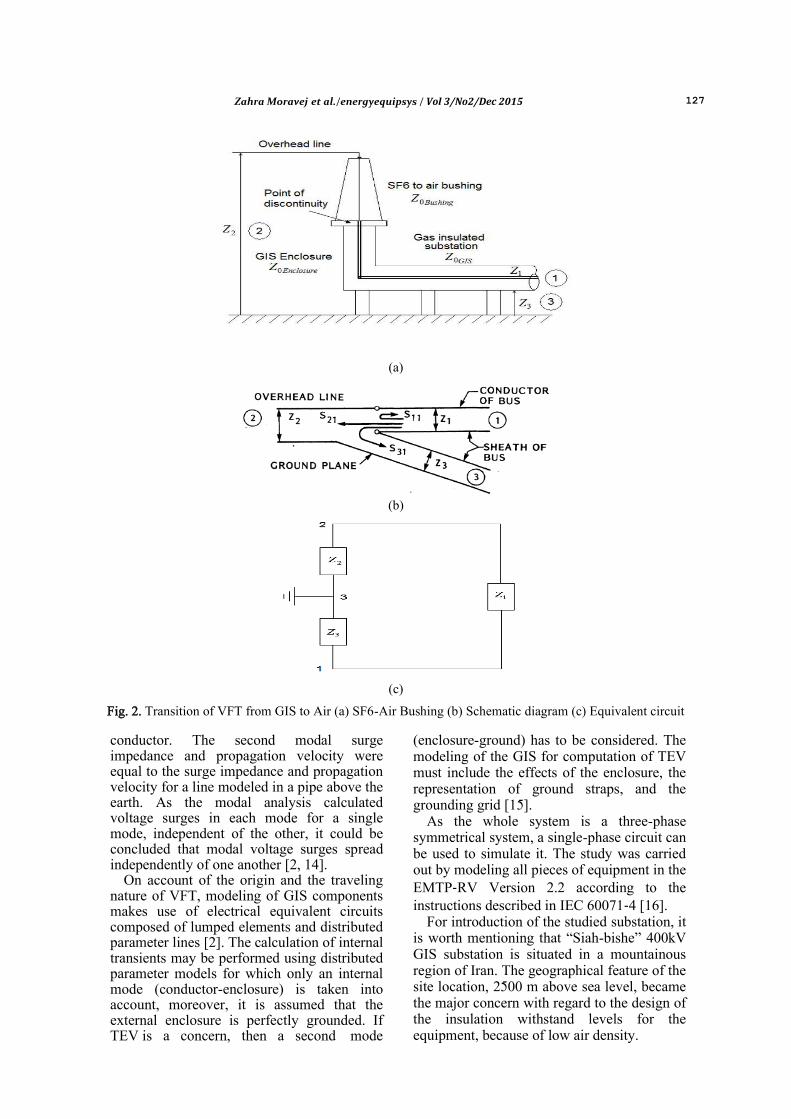
According to Fig.3, the project included the establishment of four 400 kV incoming lines, as 400 kV cables, with a length of about 300 m from a power plant unit of 250 MVA transformers and three out of four 400 kV outgoing lines all in a “double busbar with bypass DS” arrangement.
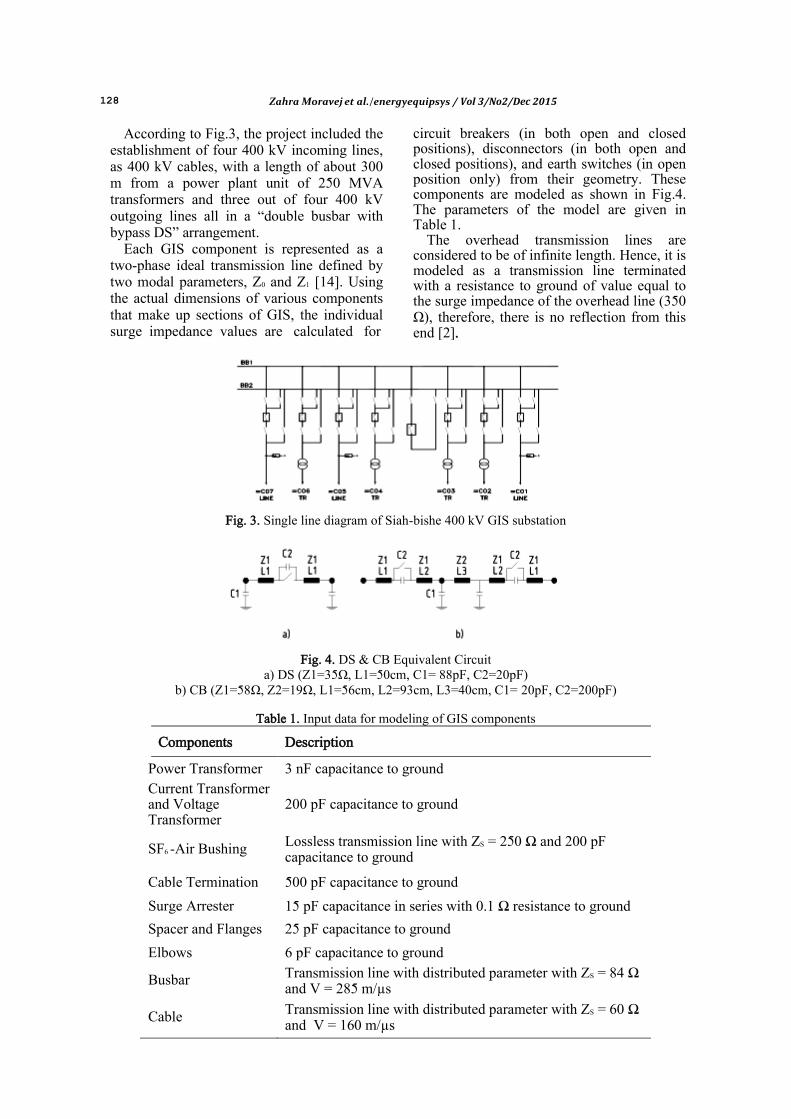
Each GIS component is represented as a two-phase ideal transmission line defined by two modal parameters, Z0 and Z1 [14]. Using the actual dimensions of various components that make up sections of GIS, the individual surge impedance values are calculated for
circuit breakers (in both open and closed positions), disconnectors (in both open and closed positions), and earth switches (in open position only) from their geometry. These components are modeled as shown in Fig.4. The parameters of the model are given in Table 1.
The overhead transmission lines are considered to be of infinite length. Hence, it is modeled as a transmission line terminated with a resistance to ground of value equal to the surge impedance of the overhead line (350 Ω), therefore, there is no reflection from this end [2].
Fig. 3. Single line diagram of Siah-bishe 400 kV GIS substation
Fig. 4. DS & CB Equivalent Circuit
a) DS (Z1=35Ω, L1=50cm, C1= 88pF, C2=20pF) b) CB (Z1=58Ω, Z2=19Ω, L1=56cm, L2=93cm, L3=40cm, C1= 20pF, C2=200pF)
Table 1. Input data for modeling of GIS components
Components Description
Power Transformer 3 nF capacitance to ground
Current Transformer and Voltage Transformer
200 pF capacitance to ground
SF6 -Air Bushing Lossless transmission line with ZS = 250 Ω and 200 pF capacitance to ground
Cable Termination 500 pF capacitance to ground
Surge Arrester 15 pF capacitance in series with 0.1 Ω resistance to ground
Spacer and Flanges 25 pF capacitance to ground
Elbows 6 pF capacitance to ground
Busbar Transmission line with distributed parameter with ZS = 84 Ω and V = 285 m/μs
Cable Transmission line with distributed parameter with ZS = 60 Ω and V = 160 m/μs

Zahra Moravej et al./energyequipsys / Vol 3/No2/Dec 2015 129
This equivalent network can be analyzed
using lossless transmission line models to determine reflected and transmitted waves. The surge impedance of the enclosure-to-ground transmission line (Z3) is derived from [12, 15]:
3
260ln
hZ
r
(1)
where r is the Riser conductor radius and h is the Average height of the conductor.
During the closing operation of the GIS disconnector switch, the voltage breakdown takes about 5 ns. Therefore, the ramp model voltage across the operating disconnector starts at 5 ns. The spark is modeled as an exponentially decaying resistance and a small resistance in the series, to take care of the residual spark resistance. The mathematical equation for the above is given by [17, 18].
R = RS + RO
(2)
T = 1 ns (time constant leading to the spark duration specific for the breakdown in SF6)
3.1. Ground Strap The first discontinuity through the propagation path is generally a ground strap. For the TEV rise times, most of the ground straps are too long and inductive for effective grounding. Riser conductors may have a significant effect on the magnitude and wave shape of the TEV. First, the ground lead may be seen as a vertical transmission line whose surge impedance varies with height; when the transient reaches the ground strap, a reflected wave is originated that reduces the magnitude of the transmitted wave, with the reduction factor expressed by [13]:
K =
(3)
where Zg is the surge impedance of the ground
strap, as Zg is usually much larger than Z3. The attenuation produced by the ground strap will usually be small. Second, when the portion of the wave that propagates down the ground strap meets the low impedance of the ground grid, a reflected wave is produced that propagates back to the enclosure, where it will tend to reduce the original wave [13, 15]. A constant inductor model may be adequate for
straps with travel time less than the surge rise time, while a non-uniform impedance model may be necessary for very long straps.
3.2. Grounding Mesh A grounding conductor is modeled as the series-parallel equivalent circuit shown in Fig.5 representing the frequency-dependent behavior of the grounding grid, based on the equations described in [19]:
Fig. 5. Equivalent circuit of ground conductor at
high frequencies
R =
(ln
√ -1)
(4)
L =
(ln
√ -1)
(5)
C =
√
(6)
where l is the conductor length, a is the radius of the conductor= 7.9 mm (For 150 mm2 copper conductor), d is the burial depth = 0.5 m, ρ is the soil resistivity= 825 Ω.m, μ0 is the vacuum permittivity= 4π × 10-7 H/m, and ε is the soil permittivity= 8.85×10⁻¹¹ F/m. Thus, for conductor unit length: R= 555 Ω, L= 0.42 µH, C= 0.13 nF. Figure 6 shows the Grounding mesh in the considered case study simulated in EMTP-RV.
Fig. 6. Model of grid conductor unit length in
EMTP-RV 4.Results and Discussion In this section, different configurations are chosen with regard to different service conditions of substation feeders. As high

130 Zahra Moravej et al./energyequipsys / Vol 3/No2/Dec 2015
frequency currents are restricted to the surface of conductors by the skin effect, VFT currents in the GIS are restricted to the internal surface of the GIS until a discontinuity in the enclosure is encountered. Thus, TEV does not emerge onto the external enclosure surface at the point of the initial disturbance. Transients couple onto the exterior surface of the enclosure at physical discontinuities, such as air terminations. Therefore, the voltages are read from the simulated circuit in these discontinuities such as SF6/Air bushing, Cable termination, and CB.
As shown in Table 2, we have considered
the contingency conditions that the transformer feeder and line feeder are in operation mode. The purpose of this section is to calculate the peak magnitude of the TGPR resulting from the disconnector operation in GIS substations. In all the conditions, all circuit breakers and disconnector switches in a feeder are in open or close condition. In Table 3 the voltages at bushings and circuit breakers in line feeders, as also the voltage at cable sealing end (CSE) and bushings in in transformer feeders in this scenario have been calculated. Figure 7 shows the TGPR wave shape in configuration 3 at the bushing.
Table 2. Analyzed contingency conditions for DS operation (×: Closed switch, O: Open switch, : Operating switch)
Arrangem
ent
=C
07 (Line)
=C
06 (T
rans.)
=C
05 (Line)
=C
04 (T
rans.)
(Coupler)
=C
03 (T
rans.)
=C
02 (T
rans.)
=C
01 (Line)
Config.1 O O O O O O ×
Config.2 O O × O O O O
Config.3 O O O O × O ×
Config.4 O O × O × O O
Config.5 O O O O O O ×
Config.6 O O × O O O O
Config.7 O O O O × O ×
Config.8 O O O O × O O
Config.9 × × × × ×
× ×
Config.10 O O O O O O O
Config.11 × × × × × × ×
Fig.7. TGPR wave shapes at bushing.

Zahra Moravej et al./energyequipsys / Vol 3/No2/Dec 2015 131
5.Analysis of effective factors Considering two transmission lines with distinct surge impedances Z1 and Z2 (Fig. 8), when a voltage surge approaches the junction
of two lines, a portion is transmitted and another portion of the surge is reflected. The reflected and transmitted voltages can be expressed by (as shown in Table 3) [20]:
Fig. 8. Diagram of traveling waves theory
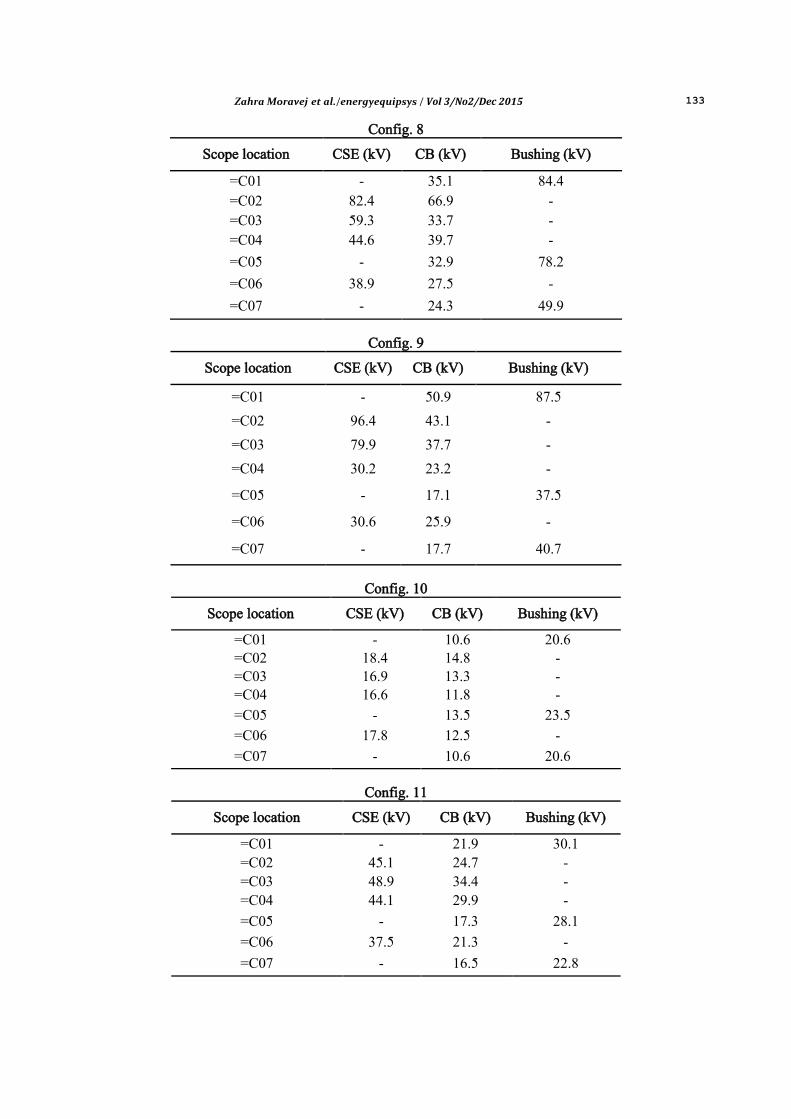
Table 3. Results of different configurations
Config. 1
Bushing (kV) CB (kV) CSE (kV) Scope location
78.7 64.7 - =C01 - 47.3 99.3 =C02 - 35.9 82.6 =C03 - 22.4 60.2 =C04
40.3 19.0 - =C05 - 28.3 75.4 =C06
52..2 24.9 - =C07
Config. 2
Bushing (kV) CB (kV) CSE (kV) Scope location
74.9 58.0 - =C01 38.7 44.9 =C02 43.6 43.0 =C03 23.5 28.4 =C04
51.9 39.8 =C05 19.4 23.8 =C06
35.1 22.8 =C07
Config. 3
Bushing (kV) CB (kV) CSE (kV) Scope location
103.2 64.2 - =C01 - 49.7 100.7 =C02 - 33.8 82.2 =C03 - 26.3 57.5 =C04
76.6 20.3 - =C05 - 22.0 65.8 =C06
94.9 23.5 - =C07

132 Zahra Moravej et al./energyequipsys / Vol 3/No2/Dec 2015
Config. 4
Bushing (kV) CB (kV) CSE (kV) Scope location
76.8 63.4 - =C01 - 37.9 44.5 =C02 - 36.3 56.2 =C03 - 29.4 41.6 =C04
51.7 22.6 - =C05 - 18.9 35.7 =C06
49.3 23.8 - =C07
Config. 5
Bushing (kV) CB (kV) CSE (kV) Scope location
67.9 48.6 - =C01 - 61.5 74.2 =C02 - 33.6 42.2 =C03 - 26.9 30.1 =C04
40.7 20.5 - =C05
- 24.2 41.3 =C06
46.3 21.3 - =C07
Config. 6
Bushing (kV) CB (kV) CSE (kV) Scope location
93.9 40.4 - =C01 - 60.4 78.2 =C02 - 37.1 44.7 =C03 - 31.9 37.3 =C04
82.3 32.9 - =C05
- 20.3 26.6 =C06
62.5 28.6 - =C07
Config. 7
Bushing (kV) CB (kV) CSE (kV) Scope location
83.1 46.5 - =C01 - 65.1 75.9 =C02 - 35.5 52.8 =C03 - 28.8 40.1 =C04
54.5 22.4 - =C05
- 23.8 31.7 =C06
64.3 21.9 - =C07
Zahra Moravej et al./energyequipsys / Vol 3/No2/Dec 2015 133
Config. 8
Bushing (kV) CB (kV) CSE (kV) Scope location
84.4 35.1 - =C01
- 66.9 82.4 =C02
- 33.7 59.3 =C03
- 39.7 44.6 =C04
78.2 32.9 - =C05
- 27.5 38.9 =C06
49.9 24.3 - =C07
Config. 9
Bushing (kV) CB (kV) CSE (kV) Scope location
87.5 50.9 - =C01
- 43.1 96.4 =C02
- 37.7 79.9 =C03
- 23.2 30.2 =C04
37.5 17.1 - =C05
- 25.9 30.6 =C06
40.7 17.7 - =C07
Config. 10
Bushing (kV) CB (kV) CSE (kV) Scope location
20.6 10.6 - =C01 - 14.8 18.4 =C02 - 13.3 16.9 =C03 - 11.8 16.6 =C04
23.5 13.5 - =C05
- 12.5 17.8 =C06
20.6 10.6 - =C07
Config. 11
Bushing (kV) CB (kV) CSE (kV) Scope location
30.1 21.9 - =C01 - 24.7 45.1 =C02 - 34.4 48.9 =C03 - 29.9 44.1 =C04
28.1 17.3 - =C05
- 21.3 37.5 =C06
22.8 16.5 - =C07

134 Zahra Moravej et al./energyequipsys / Vol 3/No2/Dec 2015
r rV K V (7)
d dV K V (8)
Kr and Kd are Reflection and Refraction Coefficients, respectively, and they can be determined by:
1 2
1 2r
Z ZK
Z Z
(9)
2 2
1 2d
Z
Z ZK
(10)
Based on Eq.7 and 8, the traveling waves have been reflected and refracted at each point such that the surge impedance of the two lines have changed.
5.1. Effect of ground strap length As mentioned previously, a transmission line with a constant parameter has been used for ground strap modeling. Its parameters are determined based on the conductor characteristics. In this section the effect of ground strap length on the TGPR magnitude has been examined. Table 4 shows the effect of ground strap length on the TGPR magnitude. It can be observed that the ground strap length has a great effect on TGPR magnitude. With increase in the ground strap
length the TGPR magnitude increases. In the Siah-Bishe substation, the grounding mesh is situated above the GIS hall, so there are many discontinuities and also many choices to route the ground strap through to the grounding mesh. By choosing the ground strap path to be as short as possible, we can mitigate the TGPR effectively.
5.2. Effect of Ground Strap Average Radius
The surge impedance of the ground strap is expressed by the function of average height and radius of the ground strap. In this study the radius of the ground strap has been chosen as 10.1 mm.
During transition of the voltage surge between the ground strap and the grounding system, because of decrease in the surge impedance of the ground strap, Kr decreases and Kd increases. This means that the number of waves passing through the grounding system increases, and therefore, the functionality of the grounding system will be improved.
For the purpose of investigating the effect of the ground strap radius on TGPR magnitude, Table 5 shows the TGPR peak magnitude at different locations with a change in ground strap radius. Simulation results show that replacing the ground strap with a radius of 10.1 mm by a strap of 25 mm radius attenuates the TGPR at the circuit breaker in feeder C05 from 19.21 kV to 14.3 kV.
Table 4. TGPR peak magnitude with different strap lengths
4 2.5 1.5 1 Ground Strap
Length(m)
44.15 40.52 35.58 29.23 Vbush1(kV)
32.28 27.18 25.27 20.11 VCB1(kV)
45.99 32.54 30.33 24.32 VBush5(kV)
25.65 22.83 20.74 18.54 VCB5(kV)
30.03 28.58 26.51 23. 36 VCB6(kV)
64.59 56.57 40.03 36.89 VCSE6(kV)

Zahra Moravej et al./energyequipsys / Vol 3/No2/Dec 2015 135
Table 5. TGPR peak magnitude with different strap radii
Ground Strap Radius (mm) 9 10.1 11 13 25
VBush1(kV) 33.5 33.1 32.6 31.4 31.1
VCB2(kV) 25.1 23.9 22.5 21.7 20.2
VCSE4(kV) 47.8 47.5 47.4 47.1 44.1
VCB4(kV) 30.0 29.2 28.8 27.6 26.9
VBush5(kV) 25.5 24.8 24.7 24.3 24.2
VCB5(kV) 19.2 18.4 17.5 16.6 14.3
VBush7(kV) 30.4 29.3 29.0 28.6 27.1
VCB7(kV) 17.7 16.8 15.5 14.2 13.3
Table 6. Results of TGPR peak magnitude with different soil resistivity
Grounding Soil Resistivity(Ω.m)
400 700 825 1000 1500
VBush1 (kV) 33.4 33.38 33.13 32.88 32.16
VCB2 (kV) 23.95 23.04 22.68 21.94 19.23
VCSE4 (kV) 48.03 47.58 47.49 47.11 45.42
VCB4 (kV) 29.65 28.26 27.16 27.06 25.85
VBush5 (kV) 25.84 24.67 23.4 22.04 20.5
VCB5 (kV) 19.31 18.59 18.35 18.05 17.32
VBush7 (kV) 31.01 29.7 29.28 28.8 27.78
VCB7(kV) 16.4 16.73 14.11 13.98 12.27
6.Conclusion In this article, analysis of the rise in induced ground potential, in a grounded enclosure, as the external effect of VFT of a 400 kV GIS switching substation, in a pump storage power plant, was conducted using EMTP-RV, based on equivalent circuits for GIS components, such as a disconnector switch, circuit breaker, busbars, current and voltage transformers, and also a grounding mesh and straps. The analysis of high frequency transients in the GIS enclosure in this case study was unique because of the geographic constraints of the substation site location. The various conditions for DS operation were simulated
and the analysis results were summarized as follows: Ground potential rise on enclosure is high
and can be in the order of 100 KV. Because of the inherent high frequency
content of the transients, the skin effect forces the transients to emerge only in discontinuities of the propagation path, that is, in changes of surge impedances.
The largest of the TGPR magnitudes occurs at the cable termination or at SF6-Air bushings.
The ground strap length has a remarkable effect on the TGPR magnitude. The peak magnitude of the TGPR increases with increasing the length of the ground straps.

136 Zahra Moravej et al./energyequipsys / Vol 3/No2/Dec 2015
Increase in the radius of the ground straps attenuates the magnitude of the TGPR.
Earth resistivity attenuates the propagating transients. As earth resistivity is significantly dependent on soil resistivity, increasing the soil resistivity results in decreasing the TGPR magnitude.
References [1] Hamza H.A., Gawad N.A., Investigation
of over voltages in gas insulated substation (G.I.S.) caused by a lightning stroke, Energy Conv. Management, 35 (12), (1994) 1107-1116.
[2] Povh D., Schmitt H., Valcker O., Wutzmann R., Modeling and analysis guidelines for very fast transients, IEEE Trans. Power Del, 11(4), (1996) 2028-2035.
[3] Chen W., Li Z., Liu W et al. Experiment and Simulation Research on VFTO in UHV GIS, 21, rue d’ Artois, F-75008 PARIS, CIGRE (2014).
[4] JIANG J., MA G., LI Ch et al. Measurement And Analysis Of VFTO In a 750kV Substation, Power and Energy Engineering Conference (APPEEC), March (2010).
[5] Hu R., Cui X., Chen W et al., Simulation of Very Fast Transient Overvoltage on UHV 1000Kv GIS Test Circuit, Electromagnetic Field Problems and Applications (ICEF), (2012) 1-4.
[6] Shu Y., Chen W., Li Z et al., Experimental Research on Very-Fast Transient Overvoltage in 1100-kV Gas-Insulated Switchgear, IEEE Transactions on Power Del, 28 (1), (2013) 458 - 466.
[7] Yinbiao S., Bin H., Ji-Ming L et al., Influence of the Switching Speed of the Disconnector on Very Fast Transient Overvoltage, IEEE Trans on Power Del, 28 (4), (2013) 2080-2084.
[8] IEEE Guide for Gas-Insulated Substations, Std C37.122.1, (1993).
[9] IEC 60071-1, “Insulation Coordination-Part 1: Definitions, Principles and Rules,” eight editions, (2006).
[10] Chen L., Jinliang H., Jun H et al., Switching Transient of 1000-kV UHV System Considering Detailed Substation Structure, IEEE Trans. Power Del, 27 (1), (2012) 112–122.
[11] Tavakoli A., Gholami A., Nouri H et al.,
Comparison between Suppressing Approaches of Very Fast Transients in Gas-Insulated Substations (GIS), IEEE Trans. Power Del, 28 (1), (2013) 303–310.
[12] Grigsby L.L, Power Systems, Electric Power Engineering: Handbook. Third edition, (2006).
[13] Fujimoto N., Dick E.P., Boggs S.A et al, Transient ground potential rise in gas-insulated substations experimental studies, IEEE Trans. Power Apparatus. Syst., 101 (10), (1982) 3603-3609.
[14] Jonjic S., Baus Z., Barukcic M., Induced Over voltages on the SF6 Substation Enclosure Caused by Switching, Int. Journal of Elect. Computer Eng. Syst. (IJECES), 2 (2), (2011) 55-65.
[15] Chowdhuri P., De la Rosa P., Lambert S.R et al, Power System Transients: Electrical Engineering Handbook, (2000).
[16] IEC 60071-4, Part 4: Computational Guide to Insulation Coordination and Modeling of Electrical Networks, (2004).
[17] Kumar V., Thomas J.M., Naidu M.S., Influence of switching conditions on the VFTO magnitudes in a GIS, IEEE Trans. Power Del, 16 (4), (2001) 539–544.
[18] Tavakoli A., Gholami A., Alamuti M.M., Suppression of very fast transients in gas-insulated substation via terminal and capacitance components feasibility study, European Trans. Elect. Power, 22 (7), (2012) 976–988.
[19] Velasco M.J., Power System Transients Parameter Determination, CRC Press, Taylor & Francis Group, (2010).
[20] Shenkman A.L., Transient Analysis of Electric Power Circuits Handbook, Published by Springer, (2005).