Embed Size (px)
Citation preview

Analysis of evacuation performance of early stage ship designs using a Markov Decision Process modelRS Joustra
SDPO18038m
Analysis of evacuation performanceof early stage ship designs using aMarkov-Decision-Process model
by
RS Joustraperformed at
Bureau Veritas Marine Nederland BV
in partial fulfillment of the requirements for the degree of
Master of Science
at the Delft University of Technologyto be defended on Thursday September 20 2018 at 1415 AM
Thesis number SDPO18038mStudent number 4405803Project duration January 11 2018 ndash September 20 2018Thesis committee Prof dr ir JJ Hopman TU Delft
Dr AA Kana TU DelftDr Ir I Akkerman TU DelftIr N Daniels Bureau Veritas Marine Nederland BV
An electronic version of this thesis is available at httprepositorytudelftnl
Summary
This thesis research is conducted on behalf of the Delft University of Technology and Bureau Veritas Rotterdam BV and the goal is to improve ship evacuation by analyzing this aspect early on in the design process First this summary will provide a background on the difficulties involved with the ship evacuation process Next an explanation is given why this thesis proposes a different model And lastly how this model is validated is elaborated upon
A ship evacuation is a highly complex process and it is one of the most important aspects concerning the safety of crew and passengers on-board This process is affected by various factors largely by the general arrangement The layout of a ship varies throughout the design period but the most design freedom occurs during the early stage [1] An estimated 90 of the decisions which have major im-pact on final design have been made in this stage [2] As a result this stage holds the most potential to improve the ship evacuation performance This stage is characterized by a lack of detailed layout information available which results in reduced accuracy in evacuation prediction As of 1st of July 2020 all passenger ships with more than 36 passengers have to perform an evacuation analysis based on guidelines created by the International Maritime Organization (IMO) [3] The guidelines describe two methods a simplified method for the early design stage and an advanced method for the detailed or final design stage The simplified method translates the ship design to a hydraulic network which in turn results in various method limitations The goal of an evacuation analysis is among other things to provide the designer with information about possible congestion points identify areas of counter- and cross flows prove that the escape arrangements are sufficiently flexible and prove that the evacuation time does not exceed a threshold
Evacuation models capable of performing an evacuation analysis tend to have four general compo-nents that define the various aspects influencing the process The four components are configuration environmental procedural and behavior component [4] Including evacuee behavior in an evacuation model tends to be difficult due to the complexity [5] and lack of research available [6] Evacuation mod-els can be categorized using various descriptors [7ndash11] however resolution tends to dominate High resolution models are called macroscopic models whereas low resolution models are called microscopic models Microscopic models simulate each individual evacuee as an agent with certain attributes such as walking speed and destination Most early stage evacuation analysis are macroscopic models and simulate the population as a whole A different macroscopic approach is proposed by Kana and Singer [12] which uses probability theory to incorporate the stochastic nature of an evacuation process This method consists of a Markov-Decision-Process (MDP) to calculate the most probable evacuation routes Policies are determined for each small geometric area called a state in the layout These policies affect evacuation routes The evacuation process can then be simulated by using the MDP policies and an initial population distribution The initial population distributions are defined by the Fire Safety Systems Code [13] Design variations can be compared based on the calculated optimal routes the time it takes for the process to converge and how the population is distributed among the exits A lack of literature is noticed that investigates the relationship between early stage ship design and the ship evacuation performance Two different studies were found which can be used to validate the MDP methodology
The first validation study determines which exit configuration is most optimal from an egress per-spective Kurdi et al [14] defined four different layouts for two population sizes Having exits on all sides was determined to be the most efficient layout The MDP model consisted of the same setup as the validation study [14] The MDP method is able to identify the same exit configuration as most efficient based on the population distributed among the exits and simulation convergence times The second validation study evaluates two different frigate layouts with varying passageway configuration [13 15] One layout has a single passageway throughout the ship The other layout has a parallel pas-sageway configuration Casarosa [15] used a microscopic model to calculate a range of performance metrics for 7 different scenarios
iii
iv 0 Summary
All evacuees were modeled as singular agents with different behavior and objectives 3 out of 7 scenarios were emergency scenarios where only 1 scenario corresponds with the MDP assumptions Discrepancy between models is considered as a result of limited and confidential layout information used by Casarosa [15] The MDP method was able to differentiate between the two layout config-urations and can identify critical areas in the layout However due to the assumptions it cannot be determined to what extend the method inputs were similar Nevertheless both validation studies showed the potential of using a Markov-Decision-Process based method to evaluate early stage ship designs on evacuation performance
Preface
The drive to continue studying after finishing my bachelor at the NHL University of Applied sciencesled to my enrollment at the Delft University of Technology The motivation behind this next step wasto further improve myself and take on more complex problems This thesis is my final achievement atthe TU Delft and I am eager to embark on new challenges I could not have achieved this without thehelp and support of many
First I want to thank Austin Kana who supervised my progress Austin first pitched the idea behind thisthesis in his dissertation I am grateful for his trust in continuing his idea and take it a step further Inaddition his enthusiasm for the topic and involvement throughout the months was much appreciatedAlso I thank Hans Hopman for sharing his experience in ship design and being critical on my workHis comments and suggestions guided me towards my goal
Next I wish to thank Nick Daniels who with his extensive experience and knowledge of regulationswas always available to give feedback and new insights The regulatory framework is not easy to com-prehend in such a short period even after having worked at Bureau Veritas myself for almost threeyears His guidance greatly reduced my struggle to get a clear picture of all relevant rules LikewiseI would thank all colleagues at Bureau Veritas with special thanks to Krasimira Charchieva and FrankKersbergen Both spend time making sure I found what I was looking for and that I understood itcorrectly This was greatly appreciated
Last but not least I would like to thank my family for always supporting my decision to continuestudying even if it took a bit longer than expected Help was always there when I needed it andconfidence in my ability to finish this thesis In addition I want to express gratitude towards myfriends who always stood ready for support showed interest in my work and made sure I was stillgetting enough fun
RS JoustraDelft September 2018
v
Contents
Summary iii
List of Figures ix
List of Tables xi
1 Introduction 111 Background 112 Research objective 213 Method proposal 2
2 Literature study 521 Regulation 5
211 Safety Of Life At Sea SOLAS 5212 Alternative Design Approach 8213 Code of Safety for Special Purpose Ships 2008 8214 Remarks 9
22 Evacuation 10221 Building industry 10222 Offshore Installations 11223 Marine industry 12
23 Design 14231 Early stage layout 14232 Layout and safety 16
24 Modeling 17241 Building evacuation models 18242 Marine evacuation models 19
25 Problem summary and method proposal 19
3 Research method 2131 Markov-Chain 2132 Markov Decision Process 2233 Solution Markov Chain 2334 Marine aspect of the MDP 24
341 Determining the initial distribution of an early ship layout 24342 Translating layout to model 24343 Influence of scale on model complexity 25344 Choice of horizon 26
35 Performance metrics 27351 Utility distribution 27352 Exit convergence behavior 27353 Maximum occurring probability 28
4 Validation study 1 influence of exit configuration 2941 Goal 2942 Paper summary 2943 MDP Results 30
431 Exit usage 30432 Utility distribution 31
44 Conclusion 32
vii
viii Contents
5 Validation study 2 influence of passageway configuration 3551 Goal 3552 Paper summary 3553 Model aspects 37
531 Layout 38532 Choice of actions 39533 Amount of decks and exit type 39534 Choice in discount factor and state rewards 40535 Initial distribution 40536 Designated emergency stations 42
54 MDP results 42541 Exit convergence results 44542 Utility histogram 46543 Maximum probability occurring during simulation 46
55 Additional damage case 4856 Conclusion and Discrepancy 51
6 Discussion 53
7 Conclusion 57
8 Future work 59
A Appendix 63A1 Validation study 2 Exit results 63A2 Maximum probability plots for the additional damage case 64A3 Value iteration code 65A4 Animation 66
Bibliography 67
List of Figures
11 Graphical representation of a Markov-Chain with two states 3
21 Performance standard according to IMO [16] 722 IMO framework - passenger ship safety Adopted from [11] 1023 EER process as defined by Health and Safety Executive [17] 1224 Marine evacuation process copied from [11 Ch2 p 54] 1225 General design characteristics from Cooper et al [1] 1526 Two naval vessel layouts copied from Casarosa [15] 1627 Model decisions from Gershenfeld [18] 17
31 Influence of action probability variation on direction uncertainty of evacuee The figureillustrates what the probability of ending up in a certain state is if the policy would be tomove in a straight line The red line indicates the policy direction With an uncertaintyof 07 the probability decreases each time step with 07 for the agent to remain headingin the most optimal direction 24
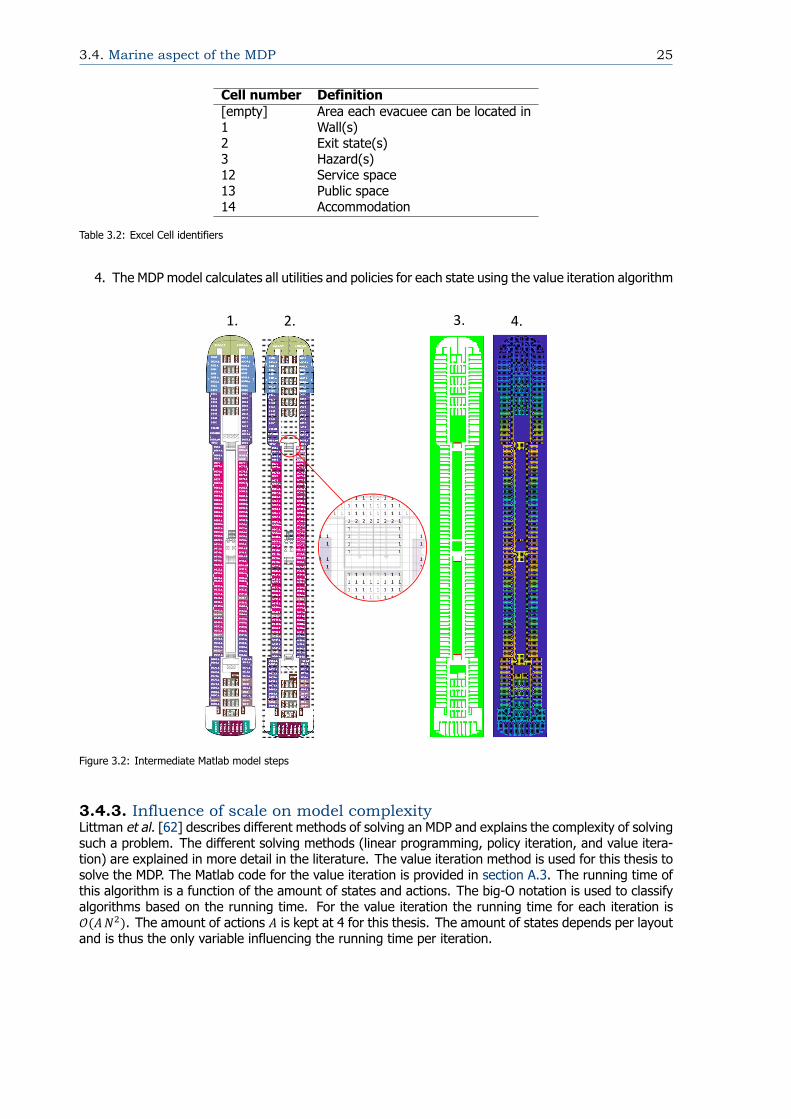
32 Intermediate Matlab model steps 2533 Example how the horizon choice determines whether or not all evacuees were able to
reach an exit Such a plot also can show which areas are difficult to reach The colorintensity denotes the utility values of each cell 26
34 Four different utility distribution extremes The number below each graph indicates theorder of performance 27
35 Example of the exit convergence plot 2836 Example plot with the top figure indicating the layout and the figure below plotting the
maximum occurring probabilities for each state 28
41 Four different layouts created by Kurdi et al [14] the red box denotes an exit Fourwalls are randomly placed throughout the grid for each layout Note The layouts arenot symmetrical 29
42 Exit convergence results for each layout for N=50 3143 Exit convergence results for each layout for N=100 3144 Exit convergence results for each layout for an evenly distributed population across the
grid 3145 Percentage of crowds at exit for each method and all layouts table results 3246 Histogram of the calculated utilities for each layout 32
51 Example layout drawn in Rhinoceros with the passageway figure covered on top 3852 Policy and utility plot for no1 BL for two grids with different resolutions 3853 Exit convergence behavior for no1 BL for 1119898 (left) and 06119898 (right) 3954 Example with an arbitrary layout where the compartment exit location choice influences
results 3955 Histogram for layout no1 bl with three different discount factors (1 095 and 09) and
three different state rewards (-005 -004 and -003) 4056 Assumed compartment type Blue denote service spaces orange denote public spaces
and green denote accommodation spaces 4257 Project EGO layouts translated in MDP program gray indicates walls white are states
red is an exit state Exits are number from aft to forward in ascending order 4258 Snapshot of the value iteration algorithm for layout No1 baseline after 20 iterations
showing the area which has found a solution and which area has not Red indicates thedividing line between the two areas 43
ix
x List of Figures
59 Policy and utility plot for no1 BL for two grids with different resolution 43510 Policy and utility plot for no1 BL for two grids with different resolution 43511 Exit percentage with distribution based on FSS - case 1 44512 Exit percentage with distribution based on FSS - case 2 45513 Utility frequency plot 46514 Maximum probability occurring for each state is plotted per layout the congestion thresh-
old is 007 47515 Maximum probability occurring for each state is plotted per layout the congestion thresh-
old is 007 47516 Maximum probability occurring for each state is plotted in a single layout The congestion
threshold is 003 48517 Maximum probability occurring for each state is plotted per layout the congestion thresh-
old is 007 48518 Exit percentage results when exit 1 is removed for deck No2 49519 Layout areas that indicate which part of the population will evacuate to the nearest exit
Two lines are added indicating the dividing line 50 of the population is located left ofthis line 50
520 Comparison of percentage of population reaching an exit state for both decks and addi-tional damage case 50
81 Example why removing edges will represent a layout better than wall states Gray nodesare wall nodes removing edge between state 1 and 2 will represent a wall 59
82 Arbitrary layout example changing transition matrix 6083 Exit results for the regular and dynamic changing MC 61
A1 Maximum probability plot for the night case of deck No2 64A2 Maximum probability plot for the day case of deck No2 64
List of Tables
31 Overview of FSS regulation regarding the distribution of persons for case 1 (night) andcase 2 (day) 24
32 Excel Cell identifiers 25
41 Order from lowest standard deviation (1) to highest deviation (4) Indicating whichdesign distributes pedestrians most evenly amongst the exits 33
3342 Comparison of the evacuation time
51 Scenario scores for emergency scenarios copied from Casarosa [15] chapter 4 - Table447 36
52 List of performance metrics used for calculating HPM All metrics that the MDP-model iscurrently not capable of calculating are greyed out 37
53 Number states for each layout type 4154 Ratio of compartment type with total amount of states 4155 Amount of moves per layout per case 4556 Congestion threshold parameters 4757 Summary of results for the damage case 49
A1 Exit convergence results for case 1 In brackets the conversion to amount of crew 63A2 Exit convergence results for case 2 In brackets the conversion to amount of crew 63A3 Comparison between standard deviation of final population distribution over exits and
95 mark In brackets the normalized values which are summed to compare overall score 63
xi
1Introduction
11 BackgroundIn 2016 there were 2611 maritime shipping incidents In EU states or vessels sailing under one of theEU state flags 976 persons were injured and 115 fatalities occurred due to shipping incidents [19]During the last 10 years the number of casualties in maritime shipping incidents declined there is noroom for complacency [20] Casualties andor loss of life can occur when passengers cannot get ontime to the life vessels or when passengers are unable to leave the vessel in time the first place Muchresearch is spent on improving maritime shipping safety starting from the titanic incident resultingin the creation of Safety Of Life At Sea (SOLAS) in 1914 The mission of the International MaritimeOrganization (IMO) is to promote safe secure environmentally sound efficient and sustainable ship-ping through cooperation One of the challenges involved is the evacuation of crew and passengers onvessels during an emergency Such an emergency follows after certain events occurring on a vesselThe events leading up to an evacuation could be for example due to a fire or flooding [21]
The evacuation progress depends on a multitude of factors including but not limited to the numberof passengers population demographics type of hazard training of crew protocols or the layout ofthe vessel Ship arrangement design heavily influences evacuation of passenger and crew during anemergency From all possible locations in a ship the evacuation routes should be known Howeverpassengers often are not familiar with the layout of the ship resulting in difficulty to egress Widthof stairways and hallways influence the flow rate possible through the ship There should be enoughinformation available to guide passengers towards safety by means of for example evacuation signsor emergency lighting [22]
Evacuation is one of the most important aspects concerning the safety of those on board [23] Anevacuation analysis gives insight in how individuals move throughout the vessel during an emergencyand can be used to for example evaluate potential congestion points In may 2016 the IMO approvedrevised guidelines making evacuation analysis mandatory both for ro-ro passenger vessels as well asother passenger ships constructed on or after the first of January 2020 MSC1Circ1533 also rec-ommends that the guidelines are used in early design process This to enable designers to identifycongestion points or critical areas [24] The regulation changes also give rise to a demand in moreinsight in egress modeling
Improving evacuation time is beneficial from a safety perspective but can also be beneficial from a fi-nancial perspective The vessel layout is defined in early stages of ship design and is mostly fixed afterthat Changes in design layout in late-stage is difficult to implement Hence to assess the ship layoutfrom an egress perspective in early stage ship design could prove beneficial in evacuation performancewhen the ship is operational
An evacuation analysis can either be a simplified analysis based on formulas provided by IMO or anadvanced analysis where the movement of each person is considered [25] The latter could be a
1
2 1 Introduction
multi-agent simulation or velocity based personal movement models Examples of software for build-ing emergency evacuation simulations are for example flow based cellular automata agent-basedand activity based [26] Examples of software capable of simulation egress are EVACNET4 WAYOUTPathFinder and EGRESS 2002
Due to the size and complexity of new vessels modeling evacuation patterns in early stage becomesharder Multi-agent simulations andor velocity based personnel movements models are both compu-tational expensive aswell as require a detailed layout of the vessel The focus for this thesis will be onthe combination of early stage ship design and egress possibilities within this domain Kana and Singer[12] Kana and Droste [27] proposed an Markov-Decision-Process (MDP) to model evacuation and thestudies showed potential for the MDP ability to simulate evacuation This thesis will expand upon saidresearch
12 Research objectiveThe main objective of this thesis will be to research if and how Ship-Centric Markov Decision Process(SC-MDP) could be used for an early stage design model used for egress modeling The main question
How does a ship design alter when it is egress based driven and could a Ship-Centric Markov DecisionProcess provide a tool for such a method in the early design stage
To answer the above question several sub questions should be also answered
1 For which types of vessels does egress influence the design and how do other industries simulateegress
2 What information is necessary for an egress model as input and what information should themodel provide the designer
3 How does general arrangement design influence egress
4 Is an SC-MDP a viable method for modeling egress in general and which aspects of egress is itable to capture
13 Method proposalThe SC-MDP is utilizes a Markov Decision Processes which is an extension of Markov chains A Markovchain describes how a process changes through time in case future and past events are independentMeaning that any decision made in its current state does not depend on past decisions A Markov chainconsists of states in which a system can be in The transition matrix gives the probability to leap fromstate to state The probability to be located in a state at a certain epoch is given by the state vector 119904
An example of a transition probability graph is given in the Figure 11 This graphically show twostates the system can be in and the respective probabilities to change from one state to another or tostay (119901 ) in the same state A Markov decision process gives a sequence of Markov chains for eachdecision made in this case for each state change As described in Artificial Intelligence a modernapproach[28] a Markov decision process is a sequential decision problem for a fully observable (theagent always knows where it is) stochastic environment with a Markovian transition model (decisionfor the next state does not depend on previous states) and additive rewards
A Markov-Decision-Process consists of decisions and expected utilities For egress modeling rewardswill influence how a person will move through the ship avoiding a fire for example The rewardsfunction as an incentive for agents to evacuate Next a state represent a small area the actions rep-resent the movement of an individual or the population in this case the rewards could simulate thepain individuals or a population suffers during the evacuation and the transition matrix represents theprobability of moving from state to state choosing certain actions
13 Method proposal 3
Figure 11 Graphical representation of a Markov-Chain with two states
The method will be validated using two validation studies The first study determines the ability foran MDP to differentiate between different designs where the exits are placed at different locations Arecently published article by Kurdi et al [14] investigated this problem By comparing outcomes andconclusions the MDP model can be validated The second study is done by Casaroza [15] which amongother things investigated the influence of passageway configuration on evacuation performance Sim-ilarly a different design aspect is varied to study the influence on personnel movement The secondvalidation study will determine if the MDP is also able to identify critical areas and give the ship designerinformation needed to further optimize and improve the safety of the design
2Literature study
21 RegulationAn evacuation analysis is a method which gives the designer insight regarding the evacuation per-formance of a design For certain ships such an analysis can be mandatory depending under whichflag it sails The international Maritime Organization (IMO) created the Safety Of Life At Sea (SOLAS)convention which stipulates regulations including the assessment of the evacuation performance If acountry has signed this treaty all ships sailing under their flag has to fulfill SOLAS requirements IMOamends the convention on a regular basis and as such the industry has to adapt to new regulationsThe regulations are a starting point to get a better understanding for which ships an evacuation analysisis mandatory why this is mandatory and what the main objective or goals are for these analysis Manyof the evacuation simulation tools are developed with the changes in requirements and the introductionof Circ 909 being a stimuli [9 29ndash32] Therefore this section will describe the regulation regardingevacuation criteria
SOLAS and Fire Safety Systems (FSS) are conventions regulating means of escape for the ships of inter-est These conventions are all setup through IMO Classification societies may have added regulationsof their own to provide additional service for the industry The IMO will be used as the main sourceregarding a mandatory evacuation analysis Different regulatory bodies have their own regulationswhich quickly makes the domain arduous to map Therefore classification societies flag states portauthorities and the such are left out of the scope
The IMO regulations has been used as a basis to determine for which ships an evacuation analysisis mandatory The SOLAS convention was adopted in 1914 in response of the titanic disaster Fourversions followed after the 1914 version these came into force in 1929 1948 1960 and 1974 [33]From then on multiple amendments have been made A distinction is made between amendments andcirculars If a flag state ratifies SOLAS then all amendments are also ratified and should be incorporatedinto law of the flag state Circulars however provide guidelines and additional information and are notmandatory Flag states can choose to ratify certain circulars and make them mandatory for all shipssailing under this flag
211 Safety Of Life At Sea SOLASRegulations tend to be reformed after major disasters After the Herald of the Free Enterprise disaster(1984) and the Estonia disaster (1994) IMO made evacuation analysis mandatory for ro-ro passen-ger ships [34] Both disasters resulted in a great loss of life This evacuation analysis regulation wasimplemented after the 1995 conference of Safety Of Life At Sea rsquo95 expanding regulation 28 to include
5
6 2 Literature study
3 Requirements applicable to ro-ro passenger ships constructed on or after 1 July 1999For ro-ro passenger ships constructed on or after 1 July 1999 escape routes shall be evaluatedby an evacuation analysis early in the design process The analysis shall be used to identify andeliminate as far as practicable congestion which may develop during an abandonment
After consolidated 2014 version as of now there have been 8 amendments which have a date of en-try ranging from 172014 to 112020 These are amendments 365(93) 366(93) 380(94) 386(94)392(95) 395(95) 404(96) and 409(97) The amendments containing regulation changes regardingevacuation is 404(96) Therefore SOLAS consolidated edition 2014 and MSC404(96) are used to cate-gorize the requirements from an evacuation analysis perspective Anything not resulting in a mandatoryevacuation analysis is left out of the scope Only ro-ro passenger ships are required to perform thisanalysis for the consolidated 2014 SOLAS version whereas for regular passenger ships a reference is toa circular This circular is MSC1Circ1533 which contains guidelines on how to perform an evacuationanalysis conform IMO standards MSC404(96) stipulates that other passenger ships constructed on orafter 1 January 2020 should also perform an evacuation analysis Researching which countries ratifiedthe circular has not been done since as of 2020 all passengers ships carrying more than 36 passengershave to perform an evacuation analysis
Regulation 13 - Means of escapeRegulation 13 contains the mandatory evacuation analysis A reference is made to MSC1Circ1533 atthe title of paragraph sect327 Amendment MSC404(96) changed regulation 13 where the mandatoryevacuation analysis was previously defined under paragraph sect74 it is now be defined as given belowThe in bold accentuated sentence parts give an indication of some of the desired objectives of theanalysis
3271 Escape routes shall be evaluated by an evacuation analysis early in the designprocess This analysis shall apply to1 ro-ro passenger ships constructed on or after 1 July 1999 and2 other passenger ships constructed on or after 1 January 2020 carrying more than 36 passen-gers
3272 The analysis shall be used to identify and eliminate as far as practicable congestionwhich may develop during an abandonment due to normal movement of passengers and crewalong escape routes including the possibility that crew may need to move along theseroutes in a direction opposite to the movement of passengers In addition the analysisshall be used to demonstrate that escape arrangements are sufficiently flexible to providefor the possibility that certain escape routes assembly stations embarkation stations or survivalcraft may not be available as a result of a casualty
Safe return to portSOLAS II-221 Safe return to port states that certain ships should be able to return to port after ahazardous event Passenger ships constructed on or after 1 July 2010 having a length of 120 m ormore or having three or more main vertical zones should be able to return to port under its ownpropulsion after a casualty threshold is exceeded This casualty threshold is defined in a context of afire and further described in SOLAS II-2 213 Next to this a list of 14 items are given stipulating systemsthat shall remain operational and hence not be affected by a fire Apart from these systems a safearea should also be incorporated in the design which ensures that the health of crew and passengersare remained Such an area should contain sanitation water food and more basic services [3]
MSC1Circ1533MSC1Circ1533 contains the revised guidelines on evacuation analysis for new and existing passengerships In may 2016 the Maritime Safety Committee approved the guidelines as a guide for making evac-uation analysis The SOLAS regulation are changed to make evacuation analysis mandatory both forro-ro passenger and other passenger ships constructed after 1 January 2020 The guidelines providedtwo different methods The first described method is a simplified analysis and the second method as
21 Regulation 7
a more advanced analysis The aim of the analysis is to compare the performance of the ship withbenchmark scenarios instead of simulating actual evacuation At this moment there is still a lack ofactual verification data and therefore the guidelines are mostly based on data coming from the civilbuilding industry [24] The guidelines suggest for the evacuation analysis on existing passenger shipsto focus on identifying critical areas
Response (R) Travel (T)
125 (R+T)
Embarkation and Launch (E+L)
E + L
3
(max 30 min)
Calculated evacuation duration
Maximum allowable evacuation duration (n)ro-ro passenger ships n= 60 min other than ro-ro passenger ships n = 80 min
Mustering phase
Abandonment phase
Figure 21 Performance standard according to IMO [16]
The performance standard of IMO regarding allowable evacuation durationrsquos are given in Figure 21The mustering phase consist of a response duration (R) and a travel duration (T) After this embarka-tion and launch follows for which the duration is denoted as (E+L) The evacuation durationrsquos specifiedby IMO is based on an analysis of fire risk [16] These durations combined will give an indication ofthe evacuation duration However there can still be a difference between estimated evacuation timesand actual estimation times due to for example inadequate evacuation planning [35]
A minimum of four scenarios should be considered combining primary and secondary cases with dayand night scenarios The primary cases are in accordance with chapter 13 of the FSS code and thecalculation shall be done for each main vertical zone The secondary case will focus on the zones gen-erating the longest assembly duration Additional cases are also presented where the option is givento consider the open deck as an additional public space (case 5) or to analyze the travel duration fromassembly station to the entry point of LSA (case 6) Case 6 should be taken into account if separateembarkation and assembly stations are employed The arrangements should be modified if the totalevacuation duration see Figure 21 does not comply with the allowed duration in order to make thedesign comply Additional information for each method is given below
The simplified method is explain in Annex 2 of MSC1Circ1533 a short method explanation will begiven here The routes corridors and stairways are modelled as a hydraulic network The pipes arecorridors and stairways whereas the doors are modelled as valves There are 5 specific assumptionsgiven First all passengers simultaneously start evacuating Second walking speed depends only onthe density of people and the flow always moves in the direction of the escape route also there is noovertaking Thirdly persons move unhindered Fourthly counter flow is not modelled and is taken intoaccount with a counter flow correction factor Fifthly additional simplifications are taken into accountusing a correction factor and a safety factor For the simplified method the congestion criteria is 35persons per m or greater and difference between inlet and outlet flows is 15 persons per secondFor the advanced method the congestion criteria is 4 persons per m
The guidelines on how to perform an evacuation analysis refer to the Fire Safety Systems (FSS) codeto determine the initial distribution Below the regulation part regarding distribution of persons asdescribed in chapter 13 Arrangement of means of escape [13] Case 2 is taken from resolutionMSC410(97) which will go into force on 1 January 2020 similar with amendment MSC404(96)
8 2 Literature study
21222 Distribution of persons
bull Case 1Passengers in cabins with maximum berthing capacity fully occupied members of the crewin cabins occupied to 23 of maximum berthing capacity and service spaces occupied by13 of the crew
bull Case 2Passengers in public spaces occupied to 34 of maximum capacity 13 of the crew dis-tributed in public spaces service spaces occupied by 13 of the crew and crew accommo-dation occupied by 13 of the crew
212 Alternative Design ApproachAn alternative design approach can be performed if the design does not meet IMO criteria The alter-native design report should provide proof that the design meets the fire safety objectives and reachesan equivalent level of safety This approach is described in SOLAS chapter II-IConstruction - Structurestability Installations II-2 Construction - Fire protection fire detection and fire extinction and IIILife-saving appliances and arrangements Means of escape is governed in chapter II-2 and thus thealternative design approach is elaborated upon in this section
The approach stipulates that documents should be provided which described which part of the designis not meeting the criteria This design part can be for example an area of a space in the ship Nextto this the expected hazard and hazard properties should be defined These describe in detail thepossible ignition sources fire growth potential smoke and toxic generation and potential spreadingFor this system and hazard a required level of safety is defined which is of an equal degree of safety asthe rules The approach requires more time than the prescriptive based approach however the ben-efits could be having more options cost effective design and improved knowledge of loss potential [36]
A reference is given in II-2 for additional information to MSCCirc1002 which give guidelines on al-ternative design and arrangement for fire safety [3] [36] For carrying out an alternative design thedesign team should appoint a coordinator communicate regularly with the Administration determinesafety margins conduct a preliminary analysis in qualitative terms conduct a quantitative analysis anddocument each part
Fire hazards should be defined in detail considering at least pre-fire situation ignition sources initialfuels secondary fuels extension potential target locations critical factors and relevant statistical dataThe fire hazards are grouped in three incident classes namely localized major or catastrophic Whichconsist either of a fire limited to a specific area a fire limited to the ship boundaries or a fire affectingalso the surrounding ships or communities Risk can never be completely eliminated and designersperforming the risk assessment should keep this in mind [36] One aspect of the analysis is to defineperformance criteria The evacuation time can be amongst the criteria which need to be assessed
213 Code of Safety for Special Purpose Ships 2008The Code (SPS) provides international standards for special purpose ships The definition of a specialpurpose ship is that it is a mechanically self-propelled ship which by reason of its function carries onboard more than 12 special personnel Below are some rules taken out given an example when a spe-cial purpose ship is treated as a passenger ship An special purpose ship is not considered a passengership in general because of the assumptions stated in the preamble 4
Special personnel are able bodied with enough knowledge of the layout of the ship and havereceived some training in safety procedures and the handling of equipment that they need notbe treated as passengers
21 Regulation 9
Chapter 6 references to SOLAS II-2 which contains the evacuation analysis regulation In SPS chapter6 it states that
Chapter 6 - Fire Protection
bull 61 For ships carrying more than 240 persons on board the re uirements ofchapter II-2 of SOLAS for passenger ships carrying more than 36 passengersshould be applied
bull 62 For ships carrying more than 60 (but not more than 240) persons on board the require-ments of chapter II-2 of SOLAS for passenger ships carrying not more than 36 passengersshould be applied
bull 63 For ships carrying not more than 60 persons on board the requirements of chapter II-2of SOLAS for cargo ships should be applied
Before amendment MSC404(96) the SPS regulation referred to SOLAS II-2 where SPS ships shouldbe seen as passenger ships An evacuation analysis was only mandatory for ro-ro ships and such ananalysis is not mentioned in the part for passenger ships The change in regulations also makes itmandatory for Special Purpose Ships with more than 240 persons on board to perform an evacuationanalysis This is also stated in IMO [37] under sect14102 rdquoevacuation analysis to be mandatory forspecial-purpose ships carrying more than 240 persons on boardrdquo
214 RemarksFrom IMO requirements the criteria to perform an evacuation analysis is if either the ship is catego-rized as a passenger ship with more than 36 passengers if it is a ro-ro passenger ship or if the ship isa special purpose ship with more than 240 persons on board The International Code for Fire SafetySystems (FSS) has been reviewed but no evacuation simulation is described in this convention Chapter13 Arrangements of means of escape describes the required widths of stairways and hallways Thelongest evacuation time from two cases (day and night) is used The maximum capacity of a space iscalculated by being either equal to the number of seats or similar arrangements or by assigning 2 mof floor space to each occupant
The IMO framework regarding the development of the process from hazard detection is depicted inFigure 22 Some flag state disagreed about taking trim and heel into account [38] Which was eitherdue to lack of statistical evidence on the influence on evacuation or that the loss of stability would onlylinearly affect the evacuation times The focus of an analysis should be rdquoidentify congestion pointsandor critical areas and to provide recommendations as to where these points and critical areas arelocated on boardrdquo [39] In other words only take things you know into account otherwise you risk ofdeviating from the analysis goal
Possible modeling requirements taken from regulations are to be able to
bull Analyze egress in early design stagebull Identify congestion pointsbull Demonstrate escape arrangements to be sufficiently flexiblebull Identify areas of countercross flow
If the design does not meet IMO criteria than an alternative design approach is an option Designersshould provide sufficient proof that the design meets the level of safety and objectives required by IMOand FSS
10 2 Literature study
Casualty detected
Casualty within threshold criteria
Prepare to abandon
ship
Abandon ship into
survival craft
Recovery from survival
craft
Resc
ue to
a p
lace
of s
afet
y
100 ship survivability (indefinitely)
100 ship survivability for a specified period of time
Flooding Fire
Time to remain habitable
(3 hours)
Abandon ship
(30 min)
Time to recover
(5 days)
Ship functions Systems available after a casualty
Yes Yes
No
Return to Port
Figure 22 IMO framework - passenger ship safety Adopted from [11]
22 EvacuationTo evacuate is to move people from a dangerous place to somewhere safe1 Different industries posedifferent environments and hazards and therefore have their own dangerous places and safe areasEach type of hazard creates its own challenges which are different for each industry Proper evacua-tion management is thus a basic requirement in safety concepts [40] In the event of an emergencyeveryone present should be able to move safely from a hazardous location to one of relative safetyThis should also be the primary aim of an egress system where the concept of relative safety is animportant one [41] Relative safety in the sense that it is in-feasible to design a perfect egress systemwhich prevents everyone from being injured or killed [41]
This section will focus on different evacuation aspects in the building industry fixed offshore instal-lations and maritime evacuations In section 21 it became apparent that almost all the data andparameters in the guidelines on the evacuation of ships are based on data derived from the civil build-ing experience [16] Kobes et al [42] also confirmed similarities between ship evacuations and buildingevacuations The most noticeable differences being the ships motions which come into play
Fixed offshore platform evacuation shares similar challenges to ship evacuations since both operatein the same environment The offshore industry deals with a high risk environment Precautions canlimit the chance that an emergency event will occur however the consequences remain enormousFrom the literature it became apparent that offshore industry focuses mainly on risk assessments andhence that is described in further detail The building industry has a variety of different building typeswhich is why different egress strategies are developed for different situations for example one mightconsider the difference in difficulty between evacuating a hospital or a skyscraper
221 Building industryThe ability to successfully evacuate in a dangerous situation in depends on the architectural layout andbuilding components [42] The characteristics of the layout and occupant demographics influencesthe egress strategy An egress strategy is a plan that takes certainties into account when addressinguncertainties in order to attempt to achieve a desired outcome [41] In the building industry egressstrategies are for example protect-in-place relocate to a safe place phased evacuation or simulta-neous evacuation This section will describe some of the egress strategies used in the building industry
Protect-in-place strategies allow for occupants to remain where they are during an emergency Thisstrategy is applied to structures where occupants have a limited ability to move It was developed after
1merriam webster
22 Evacuation 11
terrorists placed a car bomb outside a building and then sounded the fire alarm Relocation to a safearea is a strategy where occupants are relocated within the building to a safe area In some cases it ismore effective to relocate a group within the building rather than to evacuate the entire building Thesetwo strategies could be employed by hospitals or institutional facilities Phased evacuation means firstrelocating occupants who are in immediate danger and letting other occupants who must for the timebeing remain in place For high buildings this strategy is often applied This strategy does not considermultiple simultaneous events instead it assumes that occupants outside the dangerous area are notaffected Simultaneous evacuation would allow all occupants to leave the facility at the same timeduring an event Some of these strategies could also be beneficial in the maritime sector Large cruiseships have diverse passenger demographics and hence care should taken with the evacuation strategy
Next to these strategies designers should also take into account people with disabilities and they shouldincorporate the movement limitations in the egress strategy In Europe 1 in 7 people report havingdifficulty with basic activity [43] A basic activity can be lifting standing walking bending seeinghearing concentrating or remembering Design strategies that take this group into account fall intothree categories Either defend-in-place allowing for evacuation through safe means (for exampleelevators) or implementing procedures to assist this group during emergencies
An egress strategy can be developed from a prescriptive approach or from a performance based ap-proach A prescriptive approach uses a developed code and checks if the performance meets the codecriteria Due to the diversity of buildings and the occupant population one universally accepted maxi-mum evacuation time would not be logical Therefore performance-based approaches were developedto assess hazards and to determine the maximum time available for occupants to evacuate This anal-ysis is more specific to a certain building design Such an approach generally consists of 7 interrelatedsteps
1 Identify project information2 Identify goals and objectives3 Develop performance criteria4 Identify scenarios and select design scenarios and design loads5 Develop candidate design options6 Evaluate candidate design options and select a final design7 Develop final design documentation
A performance-based approach can involve time-based egress calculations this method is the onemost commonly used It involves developing a hazard and estimating the available time assessing theresponse time of occupants to begin egressing and comparing these two times to determine whetherthe occupants can be safely evacuated A key factor in this calculation is to determine when the envi-ronment becomes untenable ie when it becomes incapable of supporting life Therefore untenableconditions need to be defined These conditions are for example thermal exposure inhalation of toxicproducts and visibility limitations
222 Offshore InstallationsEvacuation escape and rescue (EER) plays a vital role in protecting the lives of personnel in the eventof a hazard on a fixed offshore installation platform Most of the casualties in several offshore accidentsoccurred during the EER process[5] The objective of the evacuation system is to leave the installationwithout directly accessing the sea whereas escaping is the process of leaving the installation whenthe evacuation system has failed [11] The general stages of an offshore evacuation are described inMethodology for Hazard Identification on EER Assessments by Health and (HSE) [12] and they can beseen in Figure 23
Espen et al [5] describe the influence that risk influencing factors (RIFs) have on EER operationsHere an RIF is defined as rdquoan aspect (eventcondition) of a system or activity that affects the risklevel of this system or activityrdquo The authors accomplished this by reviewing the Deepwater HorizonEER operations during the disaster of 20th April 2010 and using research obtained from the buildingindustry since these industries share similarities regarding fire hazards Including the human behaviorin modeling EER processes for offshore installations tends to be difficult due to the lack of research
12 2 Literature study
Alarm Access Muster Egress Evacuate Escape Rescue
Detect Choose Access route
Register at muster point
Choose egress route Via bridge By sea Approach
survivors
Interpret Move along access route
Communicate with OIM
Move along egress route by helicopter Directly into
sea Help survivors
Act Receive instructions By sea
1 2 3 4 5 6 7
1
2
3
1
2
1
2
3
1
2
1
2
3
1
2
1
2
or
or
or
Figure 23 EER process as defined by Health and Safety Executive [17]
data available [5]
Hazards on offshore installations can mainly be divided into three categories physical hazards com-mand and control hazards and behavioral hazards These are due to equipment and physical condi-tions poor procedures protocols and communication and hazards attributed to human factors [44]
Human and organizational factors are composed of human factors which is a range of human char-acteristics that influence behavior and organizational factors which are characterized by the tasks ofpersonnel training protocols and the like The influence of design is itemized under the installationRIFs These factors are for example layout materials the size of the installation the distance to themuster area the complexity of escape routes equipment passed and the protection of the musterarea Hazard RIFs depend on the type of hazard and the characteristics affiliated with it as well as theinfluence of the hazard on human perception The hazard can create an untenable environment
223 Marine industryA maritime evacuation starts when the alarm has been sounded and continues until the last personis safe The evacuation process is very complex [11] and it is difficult to evacuate occupants from anenclosure [4] Figure 24 shows the overall process including activities performed by crew Rescueoperations are not included in the process depicted in Figure 24 and this only shows the ship-relatedevacuation activities and the lifeboats-related activitiesThe above figure gives the overall marine evacuation process However from a passenger point of
Manning ofembarkation
station
Preparationof lifeboat forembarkation
(by pax)Embarkation
Launching ofSurvival
Craft
Embarkationcompleted
Decision toAssembly
Boat castsoff
Waiting forRescue
AssemblyPassengers
Assemblycompleted
casualty
Ship Lifeboats
Figure 24 Marine evacuation process copied from [11 Ch2 p 54]
view this process can be divided into two distinct stages the mustering stages and the abandonmentstage [4] The mustering stage consists of mustering all passengers at the designated areas on boardFrom there the passengers can enter the lifeboats that is defined as the abandonment stage Glenand Galea [4] describe the evacuation process as the following enumeration of events this list sharesa similar structure to that described in Figure 23
22 Evacuation 13
Mustering phase Abandonment phase1 Reacting to the alarm 1 Moving as a group to an abbandoment station2 Deciding where to go 2 Deploying life saving appliances3 Retrieving life jackets 3 Abandoning the ship4 Getting to the muster stations
Rescue follows after the mustering and abandonment phase The entire process is also influenced bythe behavior of the passengers on board It is very complicated to predict human behavior duringan evacuation [6] Currently such human behavior is modelled through variation in human attributessuch as walking speed gender or age Nevalainen et al [6] consider human behavior by studying thecognitive process of a person to try to understand the decision-making process
Reacting to the alarm during the mustering phase depends on the day part IMO stipulates this to be 5minutes during the day and 10 minutes during the night [24] Evacuation delays due to reaction timecan be attributed to alarm recognition assessment of relevance threat recognition need for informa-tion and orientation and commitment to other tasks Three types of behavior can be observed afterevacuees hear an alarm Either the evacuee waits for further instructions or for other people to actsearches for additional information to assess the situation or he starts to evacuate immediately [45]Human behavior has not been considered in this research due to the complexity of the matter
Most emergencies on board ships can be classified in six groups [46] These emergencies occur in thecasualty block in Figure 24 More specific emergencies can then be specified under one of the thesemain categories The literature found on evacuation mainly starts with fire being the initial hazardousevent The six categories are
1 Fire2 Damage to the ship3 Pollution4 Unlawful acts threatening the safety of the ship and the security of its passengers and crew5 Personnel accidents6 Cargo-related accidents7 Emergency assistance given to other ships
The evacuability of a ship is defined as the evacuation performance capability [11] Evacuability includesfactors that influence evacuation performance The term is a function of a set of initial conditionsand evacuation dynamics These initial conditions depend on the environment the distribution ofpassengers and the awareness time The evacuation dynamics describe the speed of movementof passengers which is again a function of gender age mobility impairment ship motions and theoverall well-being of the evacuees Factors influencing the evacuability are listed below with the initialconditions and evacuation dynamics in the main categories and the respective sub-factors influencingthese main components listed below
bull Environment (env)ndash Geometryndash Topologyndash Semanticsndash Scenario
bull Distribution (d)ndash Location of people
bull Crewndash Controlling spacesndash Searchingndash Reducing Los Paxndash Re-routing
bull Awareness Time (r)
ndash Initial Reaction Timendash In-situ Reaction Time
bull Speed (s)
ndash Genderndash Agendash mobility Impairmentndash Ship motionsndash Well-Being
14 2 Literature study
Evacuability is a function of the variables as given in the function [11]
119864 = 119891 (119890119899119907 119889 119903(119905) 119904 [119890119907119886119888119901119897119886119899 119888119903119890119908119891119906119899119888119905119894119900119899119886119897119894119905119910119898119900119887119894119897119894119905119910119894119898119901119886119894119903119898119890119899119905119894119899119889119890119909] 119905) (21)
Not all of the above points are available in early ship design This design stage does hold the greatestpotential for improving safety [11] Personnel movement on board a ship is strongly related to layoutdesign or more specifically to the physical arrangement of the ship Issues related to personnelmovement are addressed after ship layout has been finalized and thus this issue can be investigatedwithin the finalized design constraints This results in an inefficient solution to the personnel movements[47]
23 Design231 Early stage layoutThe ship design process can be subdivided in distinct stages Droste et al [48] identifies three majorstages early stage ship design contract design and detail design Only the first stage evaluatesdifferent designs whereas the latter two stages focus on a single design The duration of each stagevaries with ship type and ship complexity Not all ship design follows the same process [49] and there-fore only a general description of the early stage characteristics will be given The latter two detailstages are out of the scope The choice to focus on the early ship design stage is due to the designfreedom This stage is characterized by a still fluent ship design where decisions have major impact onthe ship process and final result [2] An estimated 90 of the decisions which have major impact onfinal design have been made in this stage Later in the project decisions cause design lock-in Designlock-in implies that design aspects are fixed and unchangeable
The early stage can be again subdivided in different sub-stages Andrews [50] identifies three distinctsub-stages for warships which are concept exploration concept studies and concept design van Oerset al [51] describes two distinct sub-stages used by The Netherlands Defence Material Organisation(DMO) which consists of an A-phase (concept exploration) and B-phase (concept definition) Both ap-proaches are used for the design of complex naval warships and are an example how different instancesdefine different design process stages Both approaches start with exploring the solution space consid-ering initial requirements then identify design options to further investigate impact of design choiceson ship function And lastly ensure that sufficient design information is gathered to justify proceedingto the contract stage The process where requirements are evaluated throughout the early stage andare updated according to new gained information is termed Requirement Elucidation by Andrews [49]A critical aspects of the previous three stages is to keep evaluating the functionality of the requirementsand whether or not they should be adjusted
It should be noted that previous described ship design process is also affected by the ship type andlevel of novelty [49] There can be considerable difference between the design process of a specificinnovative ship design and large serie transportation vessels [2] An evacuation analysis has to be per-formed for both highly complex ships such as large cruise ships and special purpose vessels (havingmore than 240 special personnel on-board) and smaller less complex ships such as smaller ferriesIt is considered impractical to perform a review of all design-models -tools and -methods applied tothe various ships described Nevertheless the early design stage for all vessels coincides with themost design freedom and hence design decisions made during this stage affects the final evacuationperformance or evacuability It is therefore of interest to further capture early stage ship design aspects
The relation between design freedom and the different project stages is depicted in the Figure 25The total cost and knowledge of the problem increase while design freedom decreases Choices inphysical layout are made during the early design stage and physical layout relates closely to egressperformance The physical layout aspects which influence egress performance are elaborated in thissection
The layout of a vessel is a function of the ship type and purpose The type and purpose of a shipdetermines the amount location and function of the spaces Ship design varies per ship type and
23 Design 15
RequirementsDefinition
ConceptualDesign
PreliminaryDesign
Detail Design + Manufacturing
100
0
Design Freedom Cost Committed
Knowledge
Figure 25 General design characteristics from Cooper et al [1]
hence categorizing can help understand design impediments [49] For passenger ships the compart-ment type or function can be either that the compartment is used for passenger purposes or crewpurposes Passenger purpose compartments are for example cabins theaters discos casinos andaccommodation Crew purpose compartments are machinery spaces galleys bridge crew cabins andthe such Passenger ships are configuration-driven ships where the layout configuration dominates thevessel performance [48] The layout of special purpose vessel vessels composes of cabins variety ofwork stations depending on ship function workshops recreational spaces and more The geometricaland topological features of the compartments affects the initial population distribution The compart-ment type can also have influence on the response time of evacuees [23] for example the crew couldhave a delay due to safe work termination protocols whereas passengers in cabins do not
As previous described designers should decide the compartment configuration based on requirementsand the ships function The general arrangement design of a passenger cruise or ferry ship startswith the choice in location of public spaces and cabins [52] As such decisions made regarding thespace locations affect various design characteristics such as weight distribution population distributionevacuation performance access and so on This concept is termed rdquostylerdquo by Brown and Andrews [53]and can be defined as
rdquothe combination of whole ship performance metrics and local system metrics groupinginformation form different domains to enable the inclusion of ill-defined knowledgerdquo [52]
Thus style captures overall design characteristics and properties examples of style are configuration robustness operability sustainability survivability and so on Improving survivability has influence on a range of design aspects such as number of bulkheads layout configuration defense systems and more [52] One suggested style is evacuability defining this as a style has not been encountered in literature read Improving the evacuability of a ship will affect a range of different design features such as compartment geometry and topology Casarosa [15] does include personnel movement as a design style which is similar to evacuability except also considering normal operations instead of only focusing on an emergency scenario Two studies which focus on the influence of a design configuration on evacuation performance are highlighted below
The fire safety engineering group at the University of Greenwich in collaboration with University College London conducted project EGO in the 2005-2007 period [54] This project explored the interface between design issues and crew numbers functions and movement issues This was achieved by connecting the design software PARAMARINE-SURFCON with maritimeEXODUS The two designs are given in Figure 26 and were compared using a human metric indicator The analysis was made on a naval combatant with 262 crew A difference in performance was shown between the two designs The designs were evaluated using a Human Performance Metric (HPM) In this case the HPM was calculated using a range of evaluation criteria The evaluation criteria contained both evacuation scenario criteria and normal operation scenario criteria Their study concluded that one single centralized passageway performed better than two parallel passageways
16 2 Literature study
Figure 26 Two naval vessel layouts copied from Casarosa [15]
Choosing the location for exits also influenced evacuation performance Passengers have to decide which exit to use when they can choose between multiple exits Generally they tend to choose a familiar exit or follow other people [14] An imbalance in exit options can cause overcrowding or congestion Kurdi et al [14] examined the influence of exit placement on evacuation in a congested environment Four different arrangements were created exits on one side exits on adjacent sides exits on opposite sides and exits on all sides The outcomes were then compared to evaluate each setup in terms of evacuation performance The authors used a 17x20 square grid where occupants could move in four directions Each grid had a size equal to one square meter each agent could only occupy one grid node and the speed of agents was 1 ms An evacuation strategy was devised using both simulated annealing and Depth-first search to calculate evacuation times Using the depth-first approach it was concluded that placing exits on adjacent sides of beneficial for evacuation performance This approach more closely coincided with pedestrian evacuation in dangerous situations Both Kurdi et al [14] and Casarosa [15] will be used for validating the MDP model
232 Layout and safetyAhola et al [55] identified five safety perception themes ie how passengers perceive safety The themes are life-saving appliances communication emotions other people and architecture The avail-ability of life-saving appliances for example life-vests lifebuoys and the such contribute to a significant part of perceived the safety on board Clear communication from competent-looking officers and other people creates an environment in which the passengers feel safe Lastly the influence of architecture or the environment is primarily perceived through the interaction between passenger and environ-ment This theme coincides mostly with the scope of the literature research and as such is described in more detail
The passenger environment theme is subdivided in architecture and decoration cluster The former is described as the openness of the spaces transparency of the layout and the vertical spaces Passen-gers tend to feel more safe in large open spaces such as the main lobby than smaller spaces such as corridors Which is contradictory with the actual safety of these spaces Large spaces tend to be less safe than smaller narrow spaces This is due to the fact that hazards spread more easily in large areas Staircases and elevators had a large impact on the perceived safety due to these being thought of as impractical Passengers thought the width of staircases to be too narrow causing congestion Designers need to recognize critical properties of the layout and improve these to increase natural navigation in emergency situations [55]
24 Modeling 17
The width and brightness of corridors have influence on the path passenger take during an emergencysituation Passengers prefer to choose a wider corridor over a narrow corridor Similarly they choosea brighter corridor over a darker one The brightness is a more dominant factor in route choice thanwidth when combined [56] Due to design restrictions of the width of corridors Ahola and Mugge [57]researched the influence of vertical height of corridors on perceived safety
These two influences width and brightness of corridors are researched without taking a ship heel intoaccount As one can imagine inclined corridors also influence movement speed and the decision mak-ing process of passengers A summary of research on the influence of deck inclination on movementspeed of passengers is given by Meyer-Koumlnig [31] Not all angles of inclination have been tested duringsafety of participants No significant change in evacuation duration is calculated up to 15 degrees ofinclination [31] Critical deck slopes range between 14 and 39 degrees [58]
24 ModelingThis section describes different computer software used for modeling evacuation on ships First threegeneral descriptors are given which apply to simulation and models in general Since most literaturefound on ship evacuation model uses a more specific categorization criteria these will follow Thepurpose of being able to describe a model from different perspectives will help to get a better under-standing of all models [7]
The three descriptors given by Sokolowski and Banks [7] are scale fidelity and resolution Scale is thesize of the modeled event with respect to space and time Resolution is the level of detail of the spacefor example amount of grid nodes with respect to the size Resolution tends to decrease when scaleincreases due to computer limitations Fidelity describes how closely the model resembles reality Amodel with a high fidelity will resemble reality more closely compared to a model with a low fidelity
Certain decision has to be made when developing a model[18] Some of these decision descriptions aregiven in Figure 27 It should be noted that these decisions descriptions are not necessarily absoluteie either fully microscopic or fully macroscopic model Figure 27 gives an overview of properties ofmodels explained in this chapter Some of the model decisions in Figure 27 return in literature onevacuation modeling The main descriptors in marine evacuation literature are microscopic or macro-scopic models Microscopic models then either utilize a discrete method or continuous method to modelagent movement Evacuation models are often characterized based on the resolution A model with a
deterministic
continuous
general
macroscopic
analytical
first principle models
quantitative
stochastic
discrete
specific
microscopic
numerical
model estimation
qualitative
Figure 27 Model decisions from Gershenfeld [18]
low resolution is called a macroscopic model if the model has high resolution it is called a microscopicmodel In order to model each individual in a microscopic model one has to define the environmentas small discrete geometric elements [11] A mesoscopic model would have sub-models with differentresolutions Mesoscopic models are a combination of microscopic modeling at low level and macro-scopic modeling at high level At the low the level the interaction between agent and environment isdefined whereas at high level the planning of routing is determined [11 32]
18 2 Literature study
In many of the literature on ship evacuation models the fidelity scale and resolution criteria are notmentioned and the models are grouped according to the termmicroscopic mesoscopic and macroscopicmodels [11] Guedes Soares et al [11] and Łozowicka and Czyz [10] both define these three cate-gories Boulougouris and Papanikolaou [9] in addition describe regression-based models route-choicemodels and queuing models Kostas et al [8] categorizes crowd motion models on three approachesbased on a fluid model based on cellular automata model or based on a particle approach
Macroscopic modeling composes of a graph network where arcs represent distances between pointsThis method models the ship layout as a hydraulic network where corridors represent pipes doorsrepresent valves and compartments represent tanks [10] Gas-kinetic models use a gas analogy anddescribe how the flow density and velocity change over time [9] Microscopic modeling takes eachoccupant into account and models the movement of all occupants [10] Microscopic models are thensubdivided in social force models and cellular automata models The difference is that cellular automatamodels are discrete models whereas social force models are continuous The social force model con-sists of a set of definitions how people interact between each other or more specifically define forcesto describe the attraction repulsion or acceleration of the agents These forces define the social fieldsurrounding an agent which mimics a personrsquos internal motivation to react to another person
Three other type of models are described by Boulougouris and Papanikolaou [9] regression modelsqueuing models and route-choice models Regression models predict occupant flow using relationsbetween flow variables Route-choice models use utility maximization to describe occupant movementbetween nodes Queuing models use a markov-chain to describe occupant movement between nodes
241 Building evacuation modelsGwynne et al [59] analyze 16 computer simulation models used in the built environment to modelevacuation At the time being 6 were still under development A distinction can be made by the fun-damental approach used by the models The models can be distinguished by their approach and levelof sophistication Three fundamentally different approaches are identified namely an optimizationapproach a simulation approach and a risk assessment approach Optimization models (2 out of 16models) assume that occupants will evacuate in the most efficient manner possible They do not takenon-evacuation activities into account Simulating models (12 out of 16 models) do take individualbehaviour and movement into account and they try to realistically model the agentrsquos movements Thelast group the risk assessment models (2 out of 16 models) first identify hazards and attempt toquantify the risk By repeating the calculations one can statistically assess the variations in the risk
The models are also distinguishable from the point of view of how they translate the design into a gridnetwork The nodes either represent a small area (fine grid) or a compartment or corridor (coursegrid) It is the choice of grid density that determines whether the model is able to capture individualsor only groups Similarly the models can either define the population from an individual perspectiveor from a global perspective The former allows the designer to assign attributes to each individualThese attributes then influence the decision-making process and therefore also the movement Theglobal perspective defines a population without considering each individual and limits its capability tocapture effects which influence individual occupants
The decision-making process of each individual or group is governed by choice in the behavioural sys-tem Five different systems are identified which define the behaviour of the occupants One can haveno behavioural rule system a functional analogy behavioural system an implicated behavioural systema rule-based behavioural system or an artificial intelligence-based behavioural system These differentsystems determine the individual andor population responses throughout a simulation They further-more determine the interaction between people-people people-structure and people-environmentThis interaction occurs on three different levels psychological sociological and physiological It is aresponse based on the attributes of the individual on the interaction between individuals or the re-sponse is based between an individual and his environment All in all the modeling of human behaviouris complex and to date no model has been able to precisely capture the human behaviour
25 Problem summary and method proposal 19
242 Marine evacuation modelsEach model has four general components which need to be defined [4] These are configuration en-vironmental procedural and behavior aspects Configuration is the translation from layout to modeland within this category the layout is defined Environmental aspects contain all hazards and how theydevelop Procedural aspects cover personnel procedures and define the knowledge of the passengerswith respect to the layout of the ship Behavior aspects defines how passengers react to stimuli Themodels described in this section use different methods to adress these four aspects An example ofevacuation models used in the marine industry are maritimeExodus EVI ODIGO EVDOMON NMRIevacuation simulator IMEX en AENEAS A short description of maritimeEXODUS NMRI evacuation sim-ulator EVI and ODIGO are given below
Glen and Galea [4] describes challenges in evacuation modeling and expands on an already developedevacuation model EXODUS to be also suited for ship evacuation analysis The new model maritime-EXODUS is developed by the University of Greenwich maritimeExodus is a multi-agent based modelwhich consists of five sub-models governing different aspects of the evacuation These are a passen-ger movement behavior toxicity and hazard sub-models The motion of each occupant is determinedby a set of rules of which many are stochastic based This results in a slightly different outcome eachtime the simulation is run [29] maritimeEXODUS is a microscopic model where the layout is discretizedinto a two-dimensional grid
The National Maritime Research Institute (NMRI) evacuation simulator composes of three sub modelsa space model evacuees model and disaster model The space model defines configuration aspectsand is a microscopic model The evacuees model defines the procedure and behavior aspects and doesthis using a social force model to define the interaction between agents The environment aspects aredefined in the disaster model of the NMRI evacuation simulator and can influence the walking speedbased on the outcome of a computational fluid dynamic (CFD) code [60]
The evacuation model EVI is a multi-agent mesoscopic model It uses a social force model at micro-scopic level to define interactions between agents and the wayfinding process is modelled at macro-scopic level The wayfinding is done through a graph representation of the ship layout from whichedges of the graph can be influenced to represent a hazard spreading The agents can be categorizedwithin different groups such as passengers or crew these groups can then been assigned objectiveto influence the movement patterns The objectives are evacuate return to cabin go to a specificlocation search cabins and assign an alternative route The hazard spreading information for exampleis initially not given to the passengers and instead the crew is given the objective to re-route [32]
Boulougouris and Papanikolaou [9] explain the workings of the EVDEMON model which is a multi-agentbased cellular automata model The layout is divided into cells of approximately 40x40cm Each cellcan either be occupied or not and passengers can then move in 8 directions The speed is determinedby limiting the amount of cells an agent can move each time step The way-finding method is basedon A algorithm instead of a shortest path method
Kana and Singer [12] and Kana and Droste [27] proposed an evacuation analysis tool using a ship-centric Markov decision process framework The method makes use of eigenvalue and eigenvectorspectral analysis to assess policy variations First the bellman equation is solved using value iterationto generate series of policies The authors then create a new transition matrix by selecting the optimalpolicy for each epoch By performing spectral analysis on the resulting matrix a better understandingis gained of the dynamics of the modelled system This thesis expands on these two research papers
25 Problem summary and method proposalRecent IMO regulatory changes result in more vessels having to perform an evacuation analysis In ad-dition to ro-ro passenger ships all passenger ships with more than 36 passengers and special purposeships with more than 240 special personnel need to analyze evacuation There is a notable differencebetween passengers and special personnel The latter are occupants presumed to have enough knowl-edge of the ship layout and safety procedures Either population affects the evacuation process which
20 2 Literature study
is of importance to the safety of those on-board Therefore it is of interest to a designer to evaluatethe ship layout from an evacuation perspective Early ship design holds the most design freedom andchanges in layout are more easily implemented during this stage This stage also coincides with ageneral layout and detailed information is not yet available For these reasons a method which is ableto evaluate the design from an evacuation perspective using limited information is neededSimulation can help capture essential features of real-life applications which evolve over time and arehighly complex To simulate is defined in Jensen and Bard [61] as
rdquoto duplicate the dynamic behavior of some aspect of a system by substituting the propertiesof another system for the critical properties of the system being studiedrdquo
There is always some degree of uncertainty involved in real-world systems [7] A ship evacuation issimilarly governed by uncertainties which result in different outcomes each evacuation This is the rea-son why a deterministic multi-agent approach has to be run hundreds of times to ensure all possibleoutcomes have been calculated Each evacuee has to make decisions in order to get to safety whichare uncertain in nature The combination of a stochastic system sequential decision-making and lowinformation availability is the reason to evaluate if a Markov-Decision-Process model has potential tobe used as an evacuation analysis tool
A Markov-Decision-Process is used for a variety of purposes and in a variety of fields It is used forqueuing systems search engines manufacturing models customer classification models inventorymodels and more All of these uses share some common attributes The processes are stochasticand a sequence of decision have to be made The model can help understand how the system beingstudied behaves Kana and Singer [12] and Kana and Droste [27] showed promise in using an MDPfor egress modeling This idea can be extending in creating a tool to help justify design decision andimprove the safety on board ships
3Research method
The method which will be used to assess the design is a Markov Decision Process (MDP) and a MarkovChain (MC) In order to do this the design has to be translated into something which can be used asinput for the MDP The layout has to be discretized into grid nodes which represents small areas Allthese nodes are connected with each other indicating how someone can move between them Forthe following chapters the assumption is made that a person can only move in an up down rightor left direction This configuration is also used by Kana and Singer [12] A grid node can at most beconnected with four adjacent nodes as a consequence of the directional freedom A wall grid node isconnected to no other node and therefore cannot be rsquoenteredrsquo
A Markov decision process is an extension of a Markov chain Both of these methods involve a systemsthat transition between states For example a person can be located in a certain area grid node orstate For this thesis the states are similar to the grid nodes described in the previous paragraph Thearea is not taken into account in both an MDP as MC model In other words the size of a grid node isnot represented by a size in state Therefore it is up to the designer to choose an appropriate size ofthe grid node A second important concept in the two stochastic models are state vectors These vec-tors represent how the system is distributed among the states Or for an evacuation how passengersare distributed among those states The state vector indicates the probability of the system to be in acertain state For example a probability of 02 for state 119894 would mean there is a 20 probability thatthe system is located in state 119894 For this thesis it would mean that 20 of the population is located instate 119894 The method is probabilistic since no actual agents are simulated but probabilities
A third important concept is transition probabilities associated with actions For each state the prob-ability of moving to an adjacent state after choosing a certain action (up down left or right) shouldbe defined The choice in probability highly affects the calculated results Let the transition probabilityof successfully executing the most optimal action be 08 The most optimal action is given by thepolicies This means that if the most optimal action up is chosen in state 119894 the probability of movingto the above state is 8 Or 80 of the population in state 119894 follow the most optimal route Duringan evacuation not everyone follows the most optimal path towards an exit Unclear instructions orpanic can cause people to egress in a non efficient way These transition probabilities represent thisnon-efficient behavior The following section describes the two methods in more detail
31 Markov-ChainA Markov-Chain can describe how a stochastic system with different states changes Such a chainconsists of states and probabilities to move from one state to another This thesis only considersMarkov-Chain with a finite amount of states The set of all states is called a state space At eachepoch or time step the system changes stochasticallyThe variables indicating the probability to movefrom state 119904 to 119904 are defined in the transition matrix 119872 (Equation 31)
21
22 3 Research method
119872 = [119898 119898 ⋯119898 119898 ⋯⋮ ⋮ ⋱
] (31)
For this example the probability is given by element 119898 The size of this matrix is therefore 119899x119899 Eachrow represents the current state and the each column represents the next state The state vector 119904indicates the probability of being located in a certain state and is given by Equation 32 The initial statevector is denoted as 119904 Each row in 119872 sums up to one which is an Markov-Chain property Similarlythe sum of all elements in the state vector 119904 sums up to one The probability of being located in the next(time) step 119904 is then calculated by multiplying the transition matrix with the state vector (Equation 33)
119904 = [119904 119904 ⋯ 119904 ] (32)
119904 = 119904 119872 (33)
32 Markov Decision ProcessA Markov decision process is a Markov chain including actions and (discounted) rewards Actions 119860(119904)can be chosen at each state These actions result in gained rewards (119877(119904)) The transition matrix isdenoted as 119875(119904 |119904 119886) and contains the probability of ending up in a certain next state 119904 after choosingan action 119886 from a current state 119904 A short description of an MDP is given by [28] which states
A Markov decision process is a sequential decision problem for a fully observable stochasticenvironment with a Markovian transition model and additivediscounted rewards It consistsof a set of actions 119860(119904) states 119904 with an initial state 119904 a transition model 119875(119904 |119904 119886) and areward function 119877(119904)
A sequential decision problem is a problem where the utility depends on a sequence of decisions Utilityis a measure of preference over a sequence of decisions Fully observable states that an agent alwaysknows where it is And Markovian means that the probability of reaching the next state only dependson the current state No previous sequence of visited states will change the probability of moving tothe next state
A solution to the above problem is called a policy A policy is denoted with 120587 where 120587(119904) denotesthe action recommended by policy 120587 for state 119904 The optimal policy is denoted with 120587lowast which is apolicy which yields the highest utility The objective is therefore to find a policy which if followedyields the highest utility for a sequence of decisionsactions A policy indicates the optimal action anevacuee should take to reach an exit Policies are based on distance to nearest exit discount factorstate rewards exit reward
To calculate the utility of a sequence one can look at the preceding states This can be done by additiverewards where the utility of a sequence equals the sum of all the rewards of the sequence states Adiscount factor 120574 can be used when less value is placed on rewards received in the future The utilityof a sequence becomes a discounted version of the additive rewards when adding a discount factor 120574
bull Additive rewards
119880 ([119904 119904 119904 ]) = 119877(119904 ) + 119877(119904 ) + 119877(119904 ) + (34)
bull Discounted rewards
119880 ([119904 119904 119904 ]) = 119877(119904 ) + 120574119877(119904 ) + 120574 119877(119904 ) + (35)
The discount factor is a number between 0 and 1 and it determines how much value is placed onrewards gained in the future A discount of 1 reduces the discounted rewards function (Equation 35)to an additive reward function (Equation 34) People tend to prefer rewards immediately over futurerewards For the model this means that immediate safety is preferred over future safety Thus a dis-counted rewards function is used
33 Solution Markov Chain 23
The set of decisions 120587 and the utilities of a state 119904 are given by Equation 36 and Equation 37 from[28] The bellman equation states that the utility of a state is the reward of the current state plus theexpected discounted utility of the next state The assumption is that the optimal action will be chosenThe choice of policy is the argument of the maximum expected utility
119880(119904) = 119877(119904) + 120574 maxisin ( )
sum119875(119904 |119904 119886) 119880(119904 ) (36)
120587(119904) = argmaxsum119875(119904 |119904 119886) 119880(119904 ) (37)
The bellman equation can be solved with a value iteration algorithm or policy iteration algorithm Fornow only the value iteration algorithm will be discussed The value iteration initializes by setting theutilities of all states to zero (119880(119904) = 0) Then the bellman equation is used to find the expected utilityfor each action An intermediate step is done to create a quality matrix which calculates the utility perstate per action Lastly the action yielding the maximum utility is chosen for each state From thesesteps a new utility vector containing the maximum utilities for each state is created This new utilityfunction will be used for the next iteration replacing the previous utility vector This is iterated untilthe new utility vector barely differs from the previous utility vector The difference between currentand previous utility can be calculated and a threshold defined to end the loop [28]
33 Solution Markov ChainThe optimal policies indicate what an agent should do in each state in case the objective is to maximizeutility The rewards gained at an exit and lost at each state can be thought of as a level of safety Haz-ards have a large negative reward and reduce the safety of occupants Occupants are safe when an exitis reached hence exit states contain a positive reward value All other states contain a negative reward
The MDP solution consisting policies indicating which action to choose for each state can be used tocreate a Markov Chain Using the Markov Chain an simulation can be run indicating how the populationevacuates The same probabilities as used by the MDP are used by the Markov Chain which denotethe probability of moving in a certain direction If in state 119904 the optimal policy is to move towards theadjacent state 119904 then the Markov Chain matrix has an element value of for example 119898 = 8 Thismeans that an agent in for example state 119904 will move with a probability of 8 towards state 119904 Adifferent interpretation would be if 100 of the population is located in 119904 then after one epoch 80will have moved towards state 119904 This last interpretation is used in this thesis
The action certainty value represents to what extend policies are followed This is demonstrated witha simple 1111990911 grid where all policies point in the same direction An agent has been placed in themiddle state of one side of the room (15) The agent follows the optimal policies which point to theother side of the room Figure 31 show the probability of an agent being in a state after some timeOnly the probabilities of a single row is plotted and the row which is plotted increases with each timeIn other words at 119905 = 1 row 1 is plotted and at 119905 = 119899 row 119899 is plotted The higher the action probabilitythe more likely an agent follows the optimal policies
24 3 Research method
1110987
Time and state row
6
Action certainty of 07
05
02
11 410
04
9
State
8 3
Pro
babi
lity
7
06
6 25
08
4 3 1
1
2 1
1110987
Time and state row
6
Action certainty of 08
05
02
11 410
04
9
State
8 3
Pro
babi
lity
06
7 6 25
08
4 3 1
1
2 1
1110987
Time and state row
6
Action certainty of 09
05
02
11 410
04
9
State
8 3
Pro
babi
lity
7
06
6 25
08
4 3 1
1
2 1
Figure 31 Influence of action probability variation on direction uncertainty of evacuee The figure illustrates what the probabilityof ending up in a certain state is if the policy would be to move in a straight line The red line indicates the policy directionWith an uncertainty of 07 the probability decreases each time step with 07 for the agent to remain heading in the most optimaldirection
34 Marine aspect of the MDP341 Determining the initial distribution of an early ship layoutThe FSS code can be used as a starting point to determine the initial distribution of passengers through-out the layout To incorporate the regulation into the initial distribution an estimate of the amountof passengers or crew is needed per deck or a passenger-crew ratio is required The latter would besufficient because the MDP uses a probability distribution instead of a deterministic distribution of thepopulation Table 31 gives an overview of crew and passenger distribution as stipulated by FSS [13]
Case 1 Case 2Space type Passenger Crew Passenger CrewPublic spaces 0 0 34 13Accomodation 1 23 14 13Service spaces 0 13 0 13
Table 31 Overview of FSS regulation regarding the distribution of persons for case 1 (night) and case 2 (day)
342 Translating layout to modelThis section briefly explains how a layout is translated to a grid suitable for Matlab An arbitrary layoutis used for this section and the next subsection 343 The layout does not need to contain detailedinformation because the model is used during early stage ship design The layout used for the nextexample is the Pride of America Layout found on the website of the Norwegian Cruise Line1 The MDPprocess starting with a simple layout and ending with the optimal policies is visualized in Figure 32A short description for each step is given below
1 A layout containing compartment locations and type walls and stairs is used This layout ispreferred to be an early stage layout However for this thesis a final layout is used because ofthe difficulty in obtaining an early stage ship layout
2 A figure of the layout is loaded in Excel An identifier is used for each cell within figure bor-ders These identifier determine the state properties The identifiers and definitions are given inTable 32
3 Matlab imports the Excel file and uses predefined numbers to identify each cell location and typeAn additional Excel file is used for defining each compartment type This is used to create theintial state vector
1httpswwwnclcomfrencruise-shippride-of-americadeck-plans
34 Marine aspect of the MDP 25
Cell number Definition[empty] Area each evacuee can be located in1 Wall(s)2 Exit state(s)3 Hazard(s)12 Service space13 Public space14 Accommodation
Table 32 Excel Cell identifiers
4 The MDP model calculates all utilities and policies for each state using the value iteration algorithm
1 2 3 4
Figure 32 Intermediate Matlab model steps
343 Influence of scale on model complexityLittman et al [62] describes different methods of solving an MDP and explains the complexity of solvingsuch a problem The different solving methods (linear programming policy iteration and value itera-tion) are explained in more detail in the literature The value iteration method is used for this thesis tosolve the MDP The Matlab code for the value iteration is provided in section A3 The running time ofthis algorithm is a function of the amount of states and actions The big-O notation is used to classifyalgorithms based on the running time For the value iteration the running time for each iteration is119978(119860119873 ) The amount of actions 119860 is kept at 4 for this thesis The amount of states depends per layoutand is thus the only variable influencing the running time per iteration
26 3 Research method
The running time and amount of iterations determine how long it takes to find the optimal policiesA way of stopping the algorithm is by applying a stopping rule This stopping rule determines eachiteration the residual between previous and current iteration If this residual gets below a certainthreshold the iteration stops However for the thesis it was noticed that in order to compare utilitiesbetween different layouts the amount of iteration should be the same Therefore a maximum amountof epochs was chosen which ensured that the optimal policies were found which is heavily influencedby the distance between the exit and the state furthest away
For the following section the same layout is used as given in Figure 32 which was thought sufficientlylarge to verify an MDP capability to model a deck of a ship The deck consisted of 6275 statesexcluding walls since these nodes would not be used Matlab was used for the following calculationsImporting the deck and translating the Excel file to an array takes 4 seconds The value iteration witha maximum amount of iterations of 200 epochs takes 193 seconds The value iteration running timeis proportional to the maximum amount of iterations Regarding the memory usage only 29 GB ofmemory was used of the 73 GB memory available It was concluded that for this thesis the MDP modelwill be not computational intensive2
344 Choice of horizonThe amount of decisions an evacuee is given to reach an exit is also governed by the maximum amountof epochs the value iteration gets to calculate the amount of policies If there is no fixed epoch limitor the value iteration is run until convergence then the horizon is infinite If only a limited amount ofepochs is chosen limiting the value iterations ability to calculate the optimal policy then the horizon isfinite Therefore the choice whether there is a finite or infinite horizon can influence the solution Forthis thesis all simulations were performed with a infinite horizon It does not matter how far you arelocated from an exit eventually you will be able to reach one
The algorithm was stopped when it was observed that the calculated optimal policies were not changinganymore If this was not the case then some areas could not have sensed an exit and were thereforeunable to determine which policy was best Figure 33a gives an example with a finite horizon Thesolution did not converge because of the amount of iterations was limited In addition the bordersof areas which are solved are highlighted These borders indicate the dividing line between policiesleading to an exit and policies which do not Figure 33b shows an example where the solution isconverged An infinite horizon is assumed because passengers tend to know where exits are locatedThis is due to evacuation drills on-board ships evacuation plans and general knowledge of a vesselAn infinite horizon means the iteration algorithm will stop when an optimal policy is found for eachstate A finite horizon can be used to identify isolated areas
-05
0
05
1
(a) Example of solution with finite horizon in this case 20epochs
-1
-05
0
05
1
(b) Example of solution with infinite horizon
Figure 33 Example how the horizon choice determines whether or not all evacuees were able to reach an exit Such a plot alsocan show which areas are difficult to reach The color intensity denotes the utility values of each cell
2Calculations were performed on a laptop with Intel i5-3210M CPU and 8192 MB RAM
35 Performance metrics 27
35 Performance metricsThe following sections will further elaborate upon chosen metrics to evaluate the design These metricswill be used to evaluate a design in validation studies in chapter 4 and chapter 5 The utilities andpolicies are a product of the MDP model The utilities will be assessed based on the distribution andthe policies are used for the Markov Chain simulation From this simulation the time it takes for thepopulation to reach an exit can be found In addition how the population is distributed among theexits can be calculated Finding the maximum occurring probability for each state can indicate whichareas are more likely to congest Below the utility distribution exit usage and maximum probabilityoccurring plots are further clarified
351 Utility distributionThe final utility distribution is used to determine the optimal policies At each state the optimal policywill indicate which action to take to maximize utility The utilities are a function of the reward in thecurrent state and a discounted expected utility in the adjacent state as given by the Bellman equation(Equation 36) The rewards are the same for each state and are negative to create an incentive foran evacuee to move towards an exit where a larger positive reward is given The utility distributioncan give insight in the effectiveness of a design in order to compare different layout configurationsThe mean 120583 is used to asses how well exits are distributed throughout the ship A high mean indicatesthat on average each state is close to an exit The standard deviation 120596 is used as an indication howmany states are close to an exit
119891119903119890
119902119906
119890119899
119888119910
119891119903119890
119902119906
119890119899
119888119910119891
119903119890119902
119906119890
119899119888119910
119891119903119890
119902119906
119890119899
119888119910
119880119905119894119897119894119905119910 119880119905119894119897119894119905119910
119880119905119894119897119894119905119910119880119905119894119897119894119905119910
1 2
3 4
uarr 120583 rarrlarr 120590
darr 120583 rarrlarr 120590
uarr 120583 larrrarr 120590
darr 120583 larrrarr 120590
Figure 34 Four different utility distribution extremes The number below each graph indicates the order of performance
Whether a small or a large standard deviation is preferred depends on the mean value 120583 If the meanis high then a small standard deviation means that many states are located near an exit If the mean islow then a small standard deviation means that many states are far away from an exit The differentcombinations are given by Figure 34 The numbers indicate the order of preference It should benoted that the initial distribution also affects how well exits are placed Including the initial populationdistribution in the utility distribution plot would place more value on crowded areas close to an exitThis idea is further explained in chapter 8 but is left out of the scope of this thesis
352 Exit convergence behaviorFrom the simulation the final population distribution among the exits is given Plotting the state vectorelements representing the exit nodes for each iteration gives a plot as given in Figure 35 Each of thethree lines represents an exit The steepness of this curve indicates how quickly evacuees enter anexit node The difference between the exits converged probability indicate whether the population isequally spread over all exits All exits consist of a single state and hence share the same geometricproperties The figure can provide the naval architect with information regarding which exits are mostcritical
28 3 Research method
119875119903119900
119887119886
119887119894119897
119894119905119910
119872119900119907119890119904
1
2
3
95 119898119886119903119896
Figure 35 Example of the exit convergence plot
Figure 35 indicates that exit 1 is most used and exit 3 least used The sum of the converged values ofall exist equals 1 or 100 A 95 mark is given for the exit convergence plot to get a variable whichcan be used to compare different layouts This mark indicates when almost all of the population hasreached an exit It could be that the last 5 represents the part of the population performing a searchand rescue or a part of the crew performing a final sweep
353 Maximum occurring probabilityConcatenation of the state vectors for each epoch creates the Markov-Chain simulation matrix as givenEquation 38 Each row represents an epoch each column represents a state From this matrix themaximum occurring probability for each state can be found This maximum value indicates the mostbusy or congested moment during the simulation These values are found by taking the maximumvalue of each column in Equation 38 Plotting the maximum values can indicate where possible con-gestion occurs An example of such a plot is given in Figure 36 This figure shows the top view of adeck of a frigate The top figure shows the layout where gray nodes indicate walls white nodes arestates and red nodes are the exit states From this figure it can be seen that in this particular casecongestion will most likely occur aft of the two exits The color bar indicates the percentage of thepopulation located in a state
119872 = (
119904 hellip 119904119890119901119900119888ℎ ∶ 1 119904 hellip 119904119890119901119900119888ℎ ∶ 2 ⋮ ⋱ ⋮119890119901119900119888ℎ ∶ 119905 0 hellip 119886
) (38)
0
001
002
003
004
005
006
007
Figure 36 Example plot with the top figure indicating the layout and the figure below plotting the maximum occurring proba-bilities for each state
4Validation study 1 influence of exit
configuration
41 GoalIt can be of interest to a designer to vary certain design aspects and analyze the impact the variationshave on the design performance A measurement for performance could be as also used in SOLAS theevacuation time Thus the influence of certain design decisions on evacuation time can be of interestto a designer There is limited literature describing the relationship between the location of the exitsand evacuation performance [14]
The previous chapter explained the MDP framework and how this can be used to simulate egress Thischapter will compare the MDP with a study done by Kurdi et al [14] The author evaluates for a simplesquare layout different exit configurations on evacuation performance The goal is to validate the MDPmethodology by comparing conclusion drawn on a simple layout with authors conclusions
42 Paper summaryKurdi et al [14] analyzed the influence of exit location configuration on evacuation time and how thepopulation is distributed among the exits This was done using both a Depth-First-Search (DFS) as aSimulated Annealing (SA) method The four layouts which were used are given in Figure 41 Eachlayout consists of a 17x20 grid and is divided in four quadrants The width and height of each gridnode is 1 meter similar to the width of an exit Two different population sizes were used one with50 pedestrians (N=50) and one with 100 pedestrians (N=100) Each individual had four actions tochoose from similar to the MDP framework The simulations were run 100 times where each time thepopulation was randomly distributed throughout the layout For each simulation four wall grid nodeswere randomly placed throughout the layout This was done to describes how pedestrians have tomake a decision regarding an exit including obstacles in their way
1 2 3 4 1 2
3
4
3
4
1
2
1 2
3 4
(a) One side (b) Adjacent sides (c) Opposite sides (d) All sides
Figure 41 Four different layouts created by Kurdi et al [14] the red box denotes an exit Four walls are randomly placedthroughout the grid for each layout Note The layouts are not symmetrical
29
30 4 Validation study 1 influence of exit configuration
The metrics used to evaluate each setup are the calculated evacuation time and percentage of crowdsat the exits The evacuation time is calculated using the amount of evacuees using exit 119894 (119899 ) thewidth of the exit 119894 (119870 ) and the speed of each pedestrian 119869 given by Equation 41 The percentage ofcrows at exits is calculated with Equation 42 using the amount of evacuees from exit 119894 and the totalnumber of pedestrians 119873 Results show that the DFS method is able to model evacuation behaviormore realistic than the SA method Next having exits on adjacent sides of the room performed forboth 119873 = 50 and 119873 = 100 worst Locating the exits on all sides resulted in the best performance
119899119870 + 119869 (41)
119899 100119873 (42)
43 MDP ResultsIn order to assess each layout a Markov-Chain was created using the MDP policies (section 33) Theinitial distribution as described in the paper is used as the initial state vector As described earlierauthors had to run 100 simulations with different population sizes in order to get realistic results Thisis not necessary for the MDP model due to the ability to distribute an arbitrary large population evenlyamong the layout This can be achieved by allocated to each state a population size equal to 1 dividedby the state space size The state space size equals 119899 = 17lowast20minus4 = 336 Therefore this case assumeseach state has a probability of being occupied by a pedestrian by one divided by total amount of statesThe discount factor which is kept constant for all calculations done in this chapter is 09 This valueinfluences the histogram which is used to assess exit location efficiency Changing the discount factorwould not affect conclusions drawn from the histogram No variable discount factor was used becausethe objective is to the proposed methodology with existing research The stationary MDP solution wasused for to construct the Markov-Chain
Let the desired direction probability be defined as a way of incorporating uncertainty in the behaviorof an agent This value influences if all agents move most optimally towards an exit or how muchthey deviate This value is used to construct the MDP transition matrix 119875(119904 |119904 119886) It determines theprobability of moving in the desired direction see section 33 for a more detailed explanation
431 Exit usageResults are given in Figure 42 Figure 43 and Figure 44 Which are in similar order regarding the119873 = 50 119873 = 100 and 119873 = 336 cases These plots indicate how the population is distributed amongthe exits If the lines are more close to each other the exits are more evenly used In Figure 44bexit 1 is most used In other words this design would place a higher toll on exit 1 To indicate whenthe majority of the population has reached an exit a 95 threshold mark has been added for eachplot The layout with exits on all sides converges the fastest for each population size Indicating thatthis design the most evenly and effectively placed exits
An overview of the results is given in Figure 45 A short description of the results is given for eachpopulation size and method The SA method has the least deviation between final exit population dis-tributions This method distributes the evacuees most evenly over each exit Kurdi et al [14] concludethat in real evacuations the population rarely is distributed evenly among the exits and that thereforethe DFS method can simulate pedestrian movement more realistic Regarding the 119873 = 50 case thedifference between the MDP and other methods for this population size is the largest It should benoted that the exits are not placed evenly across the sides of the layout There are 3 nodes betweenthe wall and exit 1 4 nodes between exit 1 and exit 2 4 nodes between exit 2 and exit 3 3 nodesbetween exit 3 and exit 4 and 2 nodes between exit 4 and the wall The amount of nodes betweenwall-exit1 exit1-exit2 exit2-exit3 exit3-exit4 exit4-wall for 119873 = 50 is 4-3-2-4-3 whereas for 119873 = 100it is 3-4-4-3-2 Also regarding the layout with exits on adjacent sides for a population of 119873 = 50 theamount of nodes between the wall and exit 1 is 4 Whereas for the population 119873 = 100 it is 6There are similar deviations between the 119873 = 50 and 119873 = 100 cases for layout with adjacent sidesand also for the layout with exits on all sides Thus no concise conclusion can be drawn between the
43 MDP Results 31
0 10 20 30 40 50
Moves
0
005
01
015
02
025
03
035
04
Pro
babi
lity
(a) Exits on one side
95 in 24 moves
0 10 20 30 40 50
Moves
0
005
01
015
02
025
03
035
04
Pro
babi
lity
(b) Exits on adjacent sides
95 in 23 moves
exit 1 exit 2 exit 3 exit 4 95 mark
0 10 20 30 40 50
Moves
0
005
01
015
02
025
03
035
04
Pro
babi
lity
(c) Exits on opposite sides
95 in 17 moves
0 10 20 30 40 50
Moves
0
005
01
015
02
025
03
035
04
Pro
babi
lity
(d) Exits on all side
95 in 14 moves
Figure 42 Exit convergence results for each layout for N=50
0 10 20 30 40 50
Moves
0
005
01
015
02
025
03
035
04
045
Pro
babi
lity
(a) Exits on one side
95 in 24 moves
Exit 1 Exit 2 Exit 3 Exit 4 95 mark
0 10 20 30 40 50
Moves
0
005
01
015
02
025
03
035
04
045
Pro
babi
lity
(b) Exits on adjacent sides
95 in 24 moves
0 10 20 30 40 50
Moves
0
005
01
015
02
025
03
035
04
045
Pro
babi
lity
(c) Exits on opposite sides
95 in 17 moves
0 10 20 30 40 50
Moves
0
005
01
015
02
025
03
035
04
045
Pro
babi
lity
(d) Exits on all side
95 in 15 moves
Figure 43 Exit convergence results for each layout for N=100
0 10 20 30 40 50
Moves
0
005
01
015
02
025
03
035
04
Pro
babi
lity
(a) Exits on one side
95 in 24 moves
0 10 20 30 40 50
Moves
0
005
01
015
02
025
03
035
04
Pro
babi
lity
(b) Exits on adjacent sides
95 in 22 moves
Exit 1 Exit 2 Exit 3 Exit 4 95 mark
0 10 20 30 40 50
Moves
0
005
01
015
02
025
03
035
04
Pro
babi
lity
(c) Exits on opposite sides
95 in 16 moves
0 10 20 30 40 50
Moves
0
005
01
015
02
025
03
035
04
Pro
babi
lity
(d) Exits on all sides
95 in 14 moves
Figure 44 Exit convergence results for each layout for an evenly distributed population across the grid
119873 = 50 and 119873 = 100 cases since layouts were not similar However there can be still something saidbetween the different layout types in other words which layout performed best
432 Utility distributionThe layout are also evaluated by analyzing the MDP utility distribution in addition to the exit analysisdone above The distributions are plotted in a histogram in Figure 46 including the mean and standarddeviation per layout The utility for each state is a function of the distance to an exit the state rewardsand the discount factor The rewards and the discount factor are kept the constant Therefore theutility will be a function of distance between the state and the nearest exit The exits for the layoutwith exits on all sides is most evenly spread out over the design A high mean utility value is preferredindicating the average state is in the vicinity of an exit
32 4 Validation study 1 influence of exit configuration
N=50
Exit 1 Exit 2 Exit 3 Exit4 Exit 1 Exit 2 Exit 3 Exit4 Exit 1 Exit 2 Exit 3 Exit4 Exit 1 Exit 2 Exit 3 Exit4SA 243 244 252 260 247 255 241 256 243 257 247 254 245 252 253 249
DFS 301 224 212 243 386 160 120 335 268 236 250 245 246 240 257 257
MDP 259 175 201 366 391 153 165 292 370 259 144 227 242 288 203 267
N=100
Exit 1 Exit 2 Exit 3 Exit4 Exit 1 Exit 2 Exit 3 Exit4 Exit 1 Exit 2 Exit 3 Exit4 Exit 1 Exit 2 Exit 3 Exit4SA 255 250 259 248 248 225 244 252 250 250 246 253 255 251 247 247
DFS 302 230 230 248 419 154 116 311 276 253 222 250 249 258 254 239
MDP 306 292 190 213 462 119 158 262 190 241 231 339 231 269 268 232
N=332
Exit 1 Exit 2 Exit 3 Exit4 Exit 1 Exit 2 Exit 3 Exit4 Exit 1 Exit 2 Exit 3 Exit4 Exit 1 Exit 2 Exit 3 Exit4MDP 285 207 204 304 392 192 136 280 292 237 214 258 252 235 232 281
Opposite All
One Adjacent Opposite All
One Adjacent Opposite All
One Adjacent
Figure 45 Percentage of crowds at exit for each method and all layouts table results
Exits on one side
-1 -05 0 05 1
Utility
0
20
40
60
80
Fre
quen
cy
Exits on adjacent sides
-1 -05 0 05 1
Utility
0
20
40
60
80
Fre
quen
cy
Exit on opposite sides
-1 -05 0 05 1
Utility
0
20
40
60
80
Fre
quen
cy
Exits on all sides
-1 -05 0 05 1
Utility
0
20
40
60
80
Fre
quen
cy
mean 02600 03313
mean 00616 03826
mean 03474 02460
mean 03882 02044
Figure 46 Histogram of the calculated utilities for each layout
44 ConclusionThe DFS method will be used for the comparison since authors stated that pedestrians tend to adopt aDFS approach when choosing exits It is therefore assumed that the DFS approach yields the highestfidelity Having exits on all sides results in the smallest standard deviation of exit loads for bothpopulation sizes The standard deviation and the mean of the utility distribution is used to evaluatehow evenly the exits are distributed as explained in section 35 The layouts ranked from best to worstperformance based on utility distribution is exits on all sides opposite sides adjacent sides one sideThe population distribution among the exits for both 119873 = 50 and 119873 = 100 are given in Table 41 andare ranked from smallest standard deviation to largest standard deviation
The DFS 119873 = 50 and 119873 = 100 rank layouts in similar order the same order is concluded from the119873 = 336 MDP case Only for the MDP 119873 = 50 and 119873 = 100 cases is the order slightly different Thisis due to the MDP only simulating 1 out of the 100 population distributions which was based on theexample layout given in by [14] The population was not evenly distributed throughout the layout forthe example layout given by the author The top left quadrant contains twice as many pedestrians as
44 Conclusion 33
N=50 N=100 N=336Rank of smallest 120590 DFS MDP DFS MDP MDP
1 All All All All All2 Opposite One Opposite One Opposite3 One Opposite One Opposite One4 Adjacent Adjacent Adjacent Adjacent Adjacent
Table 41 Order from lowest standard deviation (1) to highest deviation (4) Indicating which design distributes pedestriansmost evenly amongst the exits
the bottom left quadrant for the layout with exists on opposite sides Resulting in the majority of thepopulation egress to exit 1
Having exits on all sides always ranked best having exits on adjacent sides always ranked worst Sincethe MDP is an probabilistic method which does not need to model each agentpedestrian individuallythe 119873 = 336 would give a similar solution as the 100 simulations done by Kurdi et al [14] The119873 = 336 case concludes the same as the DFS cases In other words a designer would come to thesame conclusion (using the percentage of crowds at exits) which layout configuration performed bestusing either method
The evacuation time could not be calculated using the MDP method Only the amount of epochs afterwhich the solution is converged A 95 threshold is added to Figure 42 Figure 43 and Figure 44 Atthe moment the epochs cannot be thought of as a time unit because there is no population size perstate threshold defined This means that in essence a large portion of pedestrians could be located inone state which is unrealistic Therefore no evacuation time is calculated for the MDP case Howeverlisting the layouts in order of evacuation time for the DFS method and in order of epochs in MDP cansay something which layouts evacuate the fastest This conclusion can be seen in Table 42 and bothDFS 119873 = 50 and 119873 = 100 arrive at the same conclusion The MDP method identifies similar best andsecond-best layouts only the third and fourth performing layouts are in a different order
DFS (N=50) DFS (N=100) MDP (N=336)1 all all all2 opposite opposite opposite3 one one adjacent4 adjacent adjacent one
Table 42 Comparison of the evacuation time
The percentage of crowds at exit are slightly different between MDP and DFS however the conclusionare the same The MDP method was not able to calculate similar evacuation times as the comparisonstudy However the identified best and second-best layouts based on convergence speed coincidedwith those identified by Kurdi et al [14] In conclusion the MDP-model was able to assess a simplelayout with different exit configurations on evacuation performance Also the model can distinguishlayouts based on how quickly the simulation converges and how well population is distributed amongthe exits
5Validation study 2 influence of
passageway configuration
51 GoalFour objectives are defined for the second validation study will focus on validating the MDP-model withfindings from project EGO [15 54]
1 To recreate the early stage designs used by project EGO and identify discrepancy between themodels
2 To compare identified critical areas of the MDP-model with project EGO
3 To compare conclusions drawn from MDP-model with project EGO
4 To conclude the MDP-model capacity to differentiate between two designs from evacuation per-spective
First a summary is given of project EGO and which metrics the authors used to measure how wella design performed Secondly a sensitivity study is done to conclude which input parameters arejustified for the MDP-model Thirdly the MDP-model results are presented And finally conclusionsand discrepancies are elaborated upon
52 Paper summaryProject EGO aims to understand the relationship between ship design and crew movement identifyKPIrsquos to assess this relationship link evacuation software with design software and demonstrate themodel capability The first goal of project EGO coincides partly with the main question of the thesiswhich is how a design affects egress performance and therefore project EGO is deemed suitable tovalidate the MDP-model Project EGO is performed by the fire safety engineering group in collaborationbetween the university of Greenwich University College London Directorate of Sea systems and theUnited Kingdomrsquos Ministry of defense
The design used for the analysis is a frigate type-22 with a complement of 262 The vessels has 8decks and a overall length of approximately 146 meter a maximum upper deck beam of 1475 meterand a draft of 475 meter Two different frigate designs are compared with each other and are given inFigure 51 Only two of the eight decks were different between the two frigate designs Three differentresolutions were used for the comparison study a low- medium- and high-resolution layout Thesedifferent resolutions reflect different stages in ship design where different layout information is avail-able The low-resolution model represents an early stage layout and for example lacks the locationof furniture in the cabins
35
36 5 Validation study 2 influence of passageway configuration
The paper makes use of a two different software models and evaluates different designs for differentscenarios on a range of performance metrics The software used is PARAMARINE ndash SURFCON for shipdesign and maritimeEXODUS for evacuation modeling An explanation how the latter model works isgiven in subsection 242 In short the model takes each evacuee individually into account whereeach individual has properties that influence its behavior The software is also capable of assigningindividual agents different goals for example search for survivors
Each simulation is done for different scenarios which reflect vessel operations Seven different evalua-tion scenarios were defined both for normal operations (4) as emergency scenarios (3) The scenariosperformance was measured using a Human Performance Metric (HPM) Only the emergency scenariosare evaluated for this study due to the other scenarios being out of the scope of the thesis Theemergency scenarios are
bull ES1 Crew moves from normal day location to emergency station
bull ES2 Crew moves from emergency station to muster station
bull ES3 Crew moves from action station to muster station
For each scenario a weighted HPM was calculated This metric is the sum of the normalized perfor-mance metric multiplied by a weight factor 18 performance metrics were defined which are dividedin 2 congestion criteria (C1 and C2) 5 general criteria (G1 to G5) and 11 geometric criteria (M1 to M3M5 M8 M13 to M18) and are listed in Table 52 All criteria greyed out are considered not calculableby the MDP-model as of yet Some criteria are also not viable for early ship design since not all designcharacteristics are known For example the location of the watertight doors can still be unknown to thedesigner thus the amount of times an evacuee has to open a watertight door is deemed incalculableduring early stage
Only the results of the early stage calculations are given The medium- and detailed-layouts are out ofthe scope of this thesis The results of the low-resolution model are given in Table 51
Evaluation scenarioScenarioweight BL VR1
Difference betweenbaseline and variant 1
ES Normal day cruising A 1 3875 4355 -124ES Normal day cruising B 1 4619 4561 13ES Action stations evacuation 1 4593 4080 112
Overall performance of design 3703 3730
Table 51 Scenario scores for emergency scenarios copied from Casarosa [15] chapter 4 - Table 447
The NOP-scenarios are excluded from the table the overall design performance is based on the above three scenarios Results are given in Table 51 and show that the variant 1 (V1) design performed slightly better than the baseline (BL) design ES involves movement of crew from their normal day cruising locations towards the emergency stations The baseline model outperformed variant 1 by 124 for C but 112 worse for C Only for the normal day cursing B do both layouts perform almost equally
Variant 1 model outperforms the baseline model if the normal operation scenarios are also considered This is because the variant 1 design performed better on the normal operation scenarios Casarosa [15] was able to identify congestion locations and by adding an additional ladder the congestion could improved The baseline model improved significantly after this improvement was realized However these improvements were only applied to the high-resolution model and not for the low-resolution model
1The metric Time to reach final state is assumed to the equivalent of the MDP model metric amount of epochs until convergence
53 Model aspects 37
HPM performancemetrics Definition
Congestioncriteria
C1the number of locations in which the population density exceeds 4 pm2for more than 10 of the overall scenario time
C2the maximum time that the population density exceeded the regulatorymaximum of 4 pm2 for 10 of the simulation time
GeneralcriteriaG1 average time required to complete all operationsG2 average time spent in transitionG3 time to reach final state1
G4 average time spent in congestionG5 average distance travelledGeometriccriteriaM1 the number of WTD used during the scenarioM2 the number of hatches used during the scenarioM3 the number of ladders used during the scenarioM5 the number of doors used during the scenarioM8 the number of times the FG moved between decks
M13average number of components used per member of the FGduring the scenario
M14 most times a wt door was operatedM15 most times a hatch was operatedM16 average number of doors used per personM17 average number of wt doors per personM18 average number of hatches used
Table 52 List of performance metrics used for calculating HPM All metrics that the MDP-model is currently not capable ofcalculating are greyed out
53 Model aspectsFirst all different aspects are discussed which affect the results for example there was some dis-crepancy between input of both methods Similarly comparing a detailed microscopic method witha macroscopic model also decreases model resemblance These differences are highlighted and theexpected influence on results are discussed Six design aspects will be elaborated upon and its effectson the results are discussed
1 Layout2 Choice in amount of actions3 Amount of decks and exit type4 Choice in discount factor and state rewards5 Initial distribution6 Designated emergency stations
The layout aspects consider problems resulting from translating a continuous design to a discretizedgrid Resolution is lost in this process The aim is to minimize the difference between the MDP layoutand project EGO layout Since the grid size impacts model resolution the size should be reasonableFor each grid an agent can either go in 4-directions or 8-directions maritimeEXODUS gives agents8-directions of freedom while the MDP-model only 4 hence this contrast can have implications in con-clusions drawn maritimeEXODUS also enables agents to move between decks whereas this is not yetimplemented in the MDP-model Both models implement a nearest exit strategy
38 5 Validation study 2 influence of passageway configuration
531 LayoutFour different layouts were given by [54] which are used for this validation study The discretizationof the layout to a graph network used by the MDP method is discussed in this section Deck number1 for the baseline design is modelled with a grid size of approximately 1119898 and one with 06119898 Thepolicy and utility distribution is plotted and shown in Figure 52 A discount factor of 095 is used andaction certainty probability of 09 These values are kept constant for all following calculations A highdiscount factor means more value is given to rewards received in the future A high action certaintyprobability means evacuees follow the most optimal policies with a high probability It is assumed thatcrew on a frigate will most likely traverse the optimal path to an exit
Figure 51 Example layout drawn in Rhinoceros with the passageway figure covered on top
Utility and policy plot for epoch for = 095
-1
0
1
(a) Grid size of approximatelyUtility and policy plot for epoch for = 095
-1
0
1
(b) Grid size of approximately
Figure 52 Policy and utility plot for no1 BL for two grids with different resolutions
The color intensity in above figures is a function of the amount of nodes until an exit is reached theaction probability and the discount value The exit states have a utility of 1 and have the lightest colorDark regions are furthest away from an exit Adjacent grid nodes where policies result in different exitsindicate a dividing line between two areas Each area will rsquomost likelyrsquo end up at a different exit Thesedividing lines influence exit convergence behavior
The exit convergence behavior for all layouts is plotted in Figure 53 and indicate the percentage orprobability of the population that has reached an exit state node Also a 95 mark has been added in-dicating when the majority of the population has reached an exit For the 1119898 -grid this mark is reachedafter 24 time-steps whereas for the 06119898 -grid it reaches this mark after 40 time-steps which is 67slower However the difference is inversely proportional to the grid size The convergence rate isrelative to the grid size the same for the both grids
The difference in exit for the same exits is caused by the difference in dividing line locations Ascan be seen in Figure 52 not all of these locations are similar An example where the location of thedividing line can affect the exit behavior is given in Figure 54 If the green line is a doorway all agents
53 Model aspects 39
0 10 20 30 40 50 60 70
Steps
0
005
01
015
02
025
03
Pro
babi
lity
Exit convergence rate for solution Markov Chain
95 reached an exit
0 10 20 30 40 50 60 70
Steps
0
005
01
015
02
025
03
Pro
babi
lity
Exit convergence rate for solution Markov Chain
95 reached an exit
Exit 1 Exit 2 Exit 3 Exit 4 Exit 5 95 mark
Figure 53 Exit convergence behavior for no1 BL for (left) and (right)
in the compartment will egress to the right If the red line is a doorway all agents will egress to the leftThese situations are more likely to occur with lower resolution models Therefore some compartmentsend up in a different exit for 06119898 in Figure 52 With a higher resolution grid this sensitivity can bereduced and thus a resolution of approximately 06119898 is used for the validation study
Figure 54 Example with an arbitrary layout where the compartment exit location choice influences results
532 Choice of actionsThe software used by project EGO for evacuation analysis is maritimeEXODUS The agents are able to move in 8 different directions in maritimeEXODUS and 4 directions in the MDP model This difference could cause a difference in results It is assumed that more directional freedom does not necessarily change a persons egress behavior Only a quicker convergence is expected since diagonal movements are more efficient unless this is accounted for If unaccounted for the agent will cover 41 more distance when choosing the diagonal action compared to a non-diagonal action This has to be com-pensated in the software to even out with transverse and longitudinal action directions The added value of 8-directional freedom did not outweigh the increase in accuracy of results The goal is to differentiate between designs and identify critical areas It is assumed that the difference in results will remain the same whether 4 or 8 directional freedom is used
533 Amount of decks and exit typemaritimeEXODUS is capable of linking each deck with adjacent decks The frigate consists of 8 decks and the two different designs only vary for two decks Casarosa [15] modelled all decks and defined for all exits the specific exit type Each type determines the speed and amount of passengers able to transit the nodes [15] Staircase or ladder types used by maritimeEXODUS and SURFCON are given in the list below
bull Internal and external stairs
ndash Connects deckndash Connects with outside
40 5 Validation study 2 influence of passageway configuration
bull Vertical ladders
ndash Horizontal hatch with vertical ladderndash Emergency exit with vertical ladder
Vertical ladders consists of 3 elements 1 ladder transit node and 2 free space nodes Stairs aredefined by a series of nodes between the two decks Based on the height between the decks and thestep height the software program automatically calculates the number of steps and therefore statesfor each stairway The MDP-model has no decks connected with each other and models each deckindividually It is assumed that the emergency stations are located above deck No1 and No2 Nextwhen agents will move straight towards the emergency stations and thus do not leave exit nodes atdeck No1 and No2 Based on this assumptions it was not deemed necessary to connect the decksAnalyzing each deck individually is assumed sufficient However it is noted that crew using a certainexit on the deck below will affect how quickly crew can escape on the deck above Due to crowdingwithin the staircase No flow restrictions are incorporated in the MDP-model
534 Choice in discount factor and state rewardsThe input of the MDP-model has influence on the results and therefore on the conclusions drawnfrom this validation study This section will describe why a certain discount factor and state rewardis chosen In order to do this a utility histogram is plotted for layout No1 BL to show the influencethe state rewards and discount factor have on the utility distribution The utility distribution is used todetermine all policies Figure 55 indicates that higher state rewards will shift the peak to the rightincrease the frequency of the peak and lowers the standard deviation
Discount = 1 reward = -005
-1 -05 0 05 1Utility
0
100
200
300
Fre
quen
cy
Discount = 1 reward = -004
-1 -05 0 05 1Utility
0
100
200
300
Fre
quen
cy
Discount = 1 reward = -003
-1 -05 0 05 1Utility
0
100
200
300
Fre
quen
cy
Discount = 095 reward = -005
-1 -05 0 05 1Utility
0
100
200
300
Fre
quen
cy
Discount = 095 reward = -004
-1 -05 0 05 1Utility
0
100
200
300
Fre
quen
cy
Discount = 095 reward = -003
-1 -05 0 05 1Utility
0
100
200
300
Fre
quen
cy
Discount = 09 reward = -005
-1 -05 0 05 1Utility
0
200
400
Fre
quen
cy
Discount = 09 reward = -004
-1 -05 0 05 1Utility
0
200
400
Fre
quen
cy
Discount = 09 reward = -003
-1 -05 0 05 1Utility
0
200
400
Fre
quen
cy
003 052
023 042
042 031
-015 036
-015 040
008 032
-002 026
-017 030
-009 028
Figure 55 Histogram for layout no1 bl with three different discount factors (1 095 and 09) and three different state rewards(-005 -004 and -003)
A discount factor of 095 and state rewards of -004 is used for further computations The high discountfactor is due to crew having knowledge of the layout of the vessel These values result in a histogramwhere the layout differences are captured in variations of the histogram parameters
535 Initial distributionThe emergency scenarios are based on the Naval Ship Code which are rules published by the NATOas Allied Naval Engineering Publication 77 Chapter VII ndash Escape Evacuation and Rescue describesthe rules necessary to meet the goals of said chapter These goals are described by regulation 0 andensure that the design shall
53 Model aspects 41
11 provide effective escape for all embarked persons from all manned spaces to a place of safetyin the event of foreseeable accidents and emergencies at least until the threat has receded12 provide an effective means of evacuation from the ship 13 provide an effective means ofrecovering persons from the sea
Regulation 3 of chapter VII of the Naval Ship Code stipulates the evacuation analysis and demonstra-tion rules Alternative to these rules the naval administration may accept the use regulation from avalidated classification society international conventions or a suitable validated alternative approachThe international convention approach is described in section 21 the alternative approach describedin subsection 212
The analysis described in the Naval Ship Code is similar to the analysis described by IMO in Circ1533only with few exceptions These exceptions are described in VII ndash regulation 3 ndash paragraph sect 8 Theexceptions are regarding the evacuation target times range of watertight integrity conditions and aminimum of 6 scenarios is to be considered The initial distribution of persons should be represen-tative for the vesselrsquos operations The initial distribution of crew is not given by the validation studyand whether a distribution based on different operations is used or based on the FSS is unknownHowever it is stated that the scenarios do not accurately model actual naval operations Therefore adistributed crew in compliance with FSS code is used and is assumed to be sufficiently representable
Since no compartment information is given and therefore the function of each compartment is un-known a best guess is made based on location and size The assumed function for each compartmentfor each deck is given in Figure 56 The compartment type will be used to create an initial distributionTable 31 is used for ratio of crew for each space type
A minimum of four scenarios should be considered regarding the distribution of persons on board asstipulated by Circ1533 [24] see subsection 211 Since it is unclear whether the vertical zones aredefined in early stage only two cases are simulated For the night case (case 1) 23th of the crew islocated in accommodation spaces and 13th of the crew is located in the service spaces For the daycase (case 2) 13th the crew is evenly distributed among the public spaces the accommodation spacesand the service spaces The initial distribution table with the assumed compartment types and amountof states belonging to each type is given in Table 53 The percentage of a certain compartment typecompared to total states is given in Table 54 The final layout used with all compartment allocated toa specific type is graphically plotted in Figure 56
Compartment type LayoutNo1 BL No1 V1 No2 BL No2 V1
Wall 1674 1532 2640 2416Corridors 423 628 587 884Exits 5 5 6 6Service spaces 334 299 823 790Public spaces 323 303 281 257Accomodation 130 122 118 102
Table 53 Number states for each layout type
Compartment type Compartment type states total statesNo1 BL No1 V1 No2 BL No2 V2
Service space 42 42 67 69Public space 41 41 23 22Accomodation 17 17 10 9
Table 54 Ratio of compartment type with total amount of states
42 5 Validation study 2 influence of passageway configuration
Layout No1 Baseline
Layout No1 Variant 1
Layout No2 Baseline
Layout No2 Variant 1
Figure 56 Assumed compartment type Blue denote service spaces orange denote public spaces and green denote accom-modation spaces
536 Designated emergency stationsThe emergency scenarios each have their own initial distribution and final destinations for each crewmember However this information is not given An assumptions is made that each crew membermoves in an upward direction towards the deck above him Emergency stations should be located nearembarkation stations [63] which are assumed to be located above the decks given in Figure 51
54 MDP resultsPrevious section described the influences of the model aspects on the outcome and conclusions Theconclusion from previous section will serve to justify input for the MDP-model for the validation studyThe action certainty is 09 the discount factor is 095 the state rewards -004 and the exit reward 1This reflects a crew following optimal evacuation policies with high accuracy and valuing future safetyover immediate safety No hazards are modelled and therefore all states have the same negativereward The layout used is given in Figure 57 below The compartment types are given in Figure 56
Layout No1 Baseline
Layout No1 Variant 1
Layout No2 Baseline
Layout No2 Variant 1
Figure 57 Project EGO layouts translated in MDP program gray indicates walls white are states red is an exit state Exits arenumber from aft to forward in ascending order
The amount of epochs used for solving the Bellman equation see Equation 36 is 100 This valueensures all states in the layout are reached by the value iteration algorithm This also ensures that ifa random state is chosen and the policies are follow an exit is found If less epochs are chosen thenstates which are a distance equal to amount of epochs away from exits are not reachable or agents donot have enough time to move towards an exit This is shown in Figure 58 below
It also becomes apparent which region is furthest away from the exits or is most isolated An anima-tion plot of the value iteration gives insight which areas are difficult to reach after how many epochseach state is reached and after how many epochs the solutions remains the same The solution tendsto not change much after all states are reached some policies keep alternating between two actionshowever these will not change the final solution The isolated regions in combination with the initialdistribution influence the convergence behavior for all the exits
54 MDP results 43
Utility and policy plot for epoch = 20
-05
0
05
1
Figure 58 Snapshot of the value iteration algorithm for layout No1 baseline after 20 iterations showing the area which hasfound a solution and which area has not Red indicates the dividing line between the two areas
The final utility and policy plot for all decks are given in Figure 59 and Figure 510 All exit states arebright yellow and the states furthest away dark blue Therefore dark regions indicate remote areas ofthe layout and occupants located there take longest to reach an exit From these figure it can also beseen which compartments egress to which exits by following the policies
No1 BL
-1
-05
0
05
1
(a) Utility and policy plot for No1 BLNo1 V1
-1
-05
0
05
1
(b) Utility and policy plot for No1 V1
Figure 59 Policy and utility plot for no1 BL for two grids with different resolution
No2 BL
-1
-05
0
05
1
(a) Utility and policy plot for No2 BLNo2 V1
-1
-05
0
05
1
(b) Utility and policy plot for No2 V1
Figure 510 Policy and utility plot for no1 BL for two grids with different resolution
44 5 Validation study 2 influence of passageway configuration
541 Exit convergence resultsThe exit convergence behavior for case 1 (day) and case 2 (night) have been plotted in Figure 511and Figure 512 The final convergence values for both figures are given in Appendix A Table A1 andTable A2 A 95 mark has been added to indicate after how many epochs the majority of evacueeshave reached an exit This mark is also used as a performance metric to compare the designs Bothdesign variants show similar convergence results for deck No1 night case Exit behavior for exit 1 and2 is also in accordance with Figure 58 where it can be seen that crew located furthest away egressto these exits Therefore these exits converge slowest First a comparison between layouts for eachdeck is given after that a comparison between the day and night cases is give
Deck No1 outperformed deck No2 for both layouts as well as the cases This is due to deck No1 beingsmaller in size and better placed exits and therefore evacuees have to on average traverse less dis-tance towards exits There is a difference of 20 (or 7 moves) between the baseline decks and 63(or 26 moves) between the variant 1 decks In addition the population evacuating deck No1 is dis-tributed more evenly amongst the exits indicating that the exits of deck No1 is better distributed thandeck No2 regardless of passageway configuration Whether this difference in population distributionamongst the exits is beneficial depends on the staircase capacity The exit usage should relate to thestaircase capacity however for this study the exits capacity or staircase capacity is assumed to beunknown
0 10 20 30 40 50 60
Moves
0
01
02
03
04
Pro
babi
lity
Case 1 Exit convergence rate - No1 bl
95 reached an exit after 36 moves
0 10 20 30 40 50 60
Moves
0
01
02
03
04P
roba
bilit
yCase 1 Exit convergence rate - No1 v1
95 reached an exit after 41 moves
Exit1 Exit2 Exit3 Exit4 Exit5 95 mark
0 20 40 60 80
Moves
0
01
02
03
04
05
06
07
08
Pro
babi
lity
Case 1 Exit convergence rate - No2 bl
95 reached an exit after 43 moves
0 20 40 60 80
Moves
0
01
02
03
04
05
06
07
08
Pro
babi
lity
Case 1 Exit convergence rate - No2 v1
95 reached an exit after 67 moves
Exit1 Exit2 Exit3 Exit4 Exit5 Exit6 95 mark
Figure 511 Exit percentage with distribution based on FSS - case 1
The bottleneck exits or slowest converging exits for case 1 are exits 1 and 2 For case 2 exit 1 isconverging the slowest for all layouts This indicates that isolated areas are near exits 1 and 2 whichis at the aft of the vessel The wavy exit 1 curve at deck No2 for the variant 1 layout is caused bydifferent regions of the layout reaching an exit at different intervals Each compartment has its owncumulative probability and the larger the room the larger the impact all evacuees have on exit conver-gence behavior when they reach an exit The steepness is determined by the rate of crew reachingan exit A more steep curve indicates a higher amount of population percentage per epoch that arriveat an exit A steep curve could indicate possible congestion at that exit In reality the steepness islimited since there exists a maximum amount of persons per time unit that can enter an exit
54 MDP results 45
0 10 20 30 40 50 60
Moves
0
01
02
03
04
Popu
latio
n pe
rcen
tage
Case 2 Exit convergence rate - No1 bl
95 reached an exit after 36 moves
0 10 20 30 40 50 60
Moves
0
01
02
03
04
Popu
latio
n pe
rcen
tage
Case 2 Exit convergence rate - No1 v1
95 reached an exit after 41 moves
Exit1 Exit2 Exit3 Exit4 Exit5 95 mark
0 20 40 60 80
Moves
0
01
02
03
04
05
06
Popu
latio
n pe
rcen
tage
Case 2 Exit convergence rate - No2 bl
95 reached an exit after 43 moves
0 20 40 60 80
Moves
0
01
02
03
04
05
06
Popu
latio
n pe
rcen
tage
Case 2 Exit convergence rate - No2 v1
95 reached an exit after 67 moves
Exit1 Exit2 Exit3 Exit4 Exit5 Exit6 95 mark
Figure 512 Exit percentage with distribution based on FSS - case 2
The least used exits coincide with the isolated exits from the initial distribution point of view The population is most dispersed during the day case where 13th of the crew is located in each space type This results in a more evenly distributed population among the exits as can be seen from the re-sults A comparison between the standard deviations of the final exit distribution is given in Appendix A Table A3 The same approach as Casarosa [15] has been used to normalize the results and sum them to get an overall score However due to the limited amount of performance metrics it is uncertain how usable this metric is If layout configurations are compared on exit distribution then the variant 1 layout outperforms the baseline model for case 1 deck No1 and case 2 deck No2 The baseline layout outperforms variant 1 regarding convergence speed for deck No1 (5 epoch difference) and significantly outperforms for deck No2 (24 epoch difference) There is no difference in convergence speed between day and night cases There is a difference between exit usage which is expected since population is distributed differently
95 mark reached after movesLayout case 1 case 2No1 BL 36 36No1 V1 41 41No2 BL 43 43No2 V1 67 67
Table 55 Amount of moves per layout per case
46 5 Validation study 2 influence of passageway configuration
542 Utility histogramThe utilities distribution for 100 epochs for each layout have been plotted in a histogram in Figure 513These distribution indicate how close each state is to an exit and therefore it can assess the layoutThe choice in state reward and discount factor have a tremendous influence on these results as hasbeen discussed in subsection 534 These variables are kept constant for each deck which gives thepossibility to compare each layout with each other
No1 BL
-1 -05 0 05 1
Utility
0
100
200
300
400
500
Fre
quen
cy
No1 V1
-1 -05 0 05 1
Utility
0
100
200
300
400
500
Fre
quen
cy
No2 BL
-1 -05 0 05 1
Utility
0
100
200
300
400
500
Fre
quen
cy
No2 V1
-1 -05 0 05 1
Utility
0
100
200
300
400
500
Fre
quen
cy
-012 037
-003 038
-025 039
005 036
Figure 513 Utility frequency plot
A high mean utility value indicates all states are relatively close to an exit Therefore a high mean represents a layout where exits are more evenly located The baseline layouts have the highest mean compared to the variant 1 layout The upper decks have both also a higher mean compared to the lower decks Which is probable since the lower decks (No 2) have a higher amount of states per exit than the upper decks The average amount of states per exit values are 242 for No1 BL 270 for No1 V1 301 for No2 BL and 338 for No2 V1
The standard deviation indicates how many state utilities deviate from the mean A high standard deviation indicates many states deviate from the mean a low deviation means the opposite A low standard deviation coincides with a larger amount of isolated compartments than a high standard dis-tribution The latter indicate large amount of evenly distributed compartments given that the discount factor and state rewards are equal for both comparison designs see Figure 34 From this perspective a high mean is preferred over a low mean therefore the baseline performs better than the variant 1 A high standard deviation is preferred over a low standard deviation if the mean is low If the mean is high than a low standard deviation is preferred indicating that a lot of compartments are located close to an exit The difference of the standard deviations between the baseline and variant 1 model is small
543 Maximum probability occurring during simulationThe MDP-model uses a transition matrix and initial state distribution matrix to simulate the evacuation of crew Each iteration involves multiplying the previous state vector with the transition matrix to get the new distribution If the state vectors for each iteration are concatenated to create an additional so-lution matrix then for each state the maximal occurring probability can be found This value indicates that at some point during the simulation a certain amount of crew occupied that state Congestion could be identified using this value as a metric which is a function of crew and state geometric prop-erties
Congestion is defined as a certain amount of persons per square meter [16] For the SOLAS simplified approach the criteria is 35 persons per m whereas for the advanced approach it is 4 persons per m Casarosa [15] used 4 persons per m since the approach utilized by maritimeEXODUS is an advanced
54 MDP results 47
approach The following figures uses a congestion criteria of 35 persons per m since the MDP-model is an early stage simplified model (agents are not modelled individually)
The frigate has a complement of 262 crew members but the distribution has not been given An indication of the distribution is given with table D-2 and D-3 from Casarosa [15] These tables give results of the blanket search scenario for the low resolution model Counting crew for each deck results in 30 crew members for deck no1 and 70 crew members for deck no2 Resulting congestion threshold values are given in Table 56
Deck Crew Congestion thresholdTotal[-]
Single[] [persm2] [ state]
No1 30 333 35 7No2 70 142 35 3
Table 56 Congestion threshold parameters
Case 1 Max probability plot - No1 Baseline
Case 1 Max probability plot - No1 Variant 1
0
001
002
003
004
005
006
007
008
Popu
latio
n pe
rcen
tage
Figure 514 Maximum probability occurring for each state is plotted per layout the congestion threshold is 007
Case 1 Max probability plot - No2 Baseline
Case 1 Max probability plot - No2 Variant 1
0
0005
001
0015
002
0025
003
0035
004
Popu
latio
n pe
rcen
tage
Figure 515 Maximum probability occurring for each state is plotted per layout the congestion threshold is 007
48 5 Validation study 2 influence of passageway configuration
Case 2 Max probability plot - No1 Baseline
Case 2 Max probability plot - No1 Variant 1
0
001
002
003
004
005
006
007
008
Popu
latio
n pe
rcen
tage
Figure 516 Maximum probability occurring for each state is plotted in a single layout The congestion threshold is 003
Case 2 Max probability plot - No2 Baseline
Case 2 Max probability plot - No2 Variant 1
0
0005
001
0015
002
0025
003
0035
004
Popu
latio
n pe
rcen
tage
Figure 517 Maximum probability occurring for each state is plotted per layout the congestion threshold is 007
55 Additional damage caseIt is probable that a damage occurred causing the initialization of an evacuation Only considering evacuation cases without any damage that affects personnel movement seems insufficient A better understanding of the evacuation performance can be gained by evaluating ship designs and consider-ing multiple probable scenarios Casarosa [15] defined both evacuation scenarios as well as normal operation scenarios to create an outline of different situations that may occur during the operational life of the ship However no damage scenarios were considered to the author of this thesis knowledge A damage that disables a stairwell or blocks a passageway could occur during an evacuation The result is that the certain flight options are eliminated and evacuees have to take alternative escape routes These variations to the normal evacuation also affects the evacuation performance of the two designs The assessment of scenario deviations helps better understand design adaptability or escape arrangement flexibility Analyzing escape arrangement flexibility is one of the objectives of performing an evacuation analysis as described by IMO guidelines [24] These variations should also be taken into account to better judge each design on its egress performance
Thus an additional damage case has been defined to demonstrate the escape arrangement flexibility of both designs Which in turn reduces uncertainty in conclusions drawn on evacuation performance of both layouts ergo which performs best Only deck No2 will be investigated in more detail since this deck seems to be most critical Various damage cases could be considered Examples are blocking a part of the passageway which could be caused by a fire or by removing an exit from the layout to simulate a case where one staircase is obstructed The design redundancy and adaptability can be outlined by performing a range of damage cases Each of these scenarios can help gain insight in how and where a design can be further improved However this is not the goal of this section This section will demonstrate the MDP-model capability to assess a damage case
55 Additional damage case 49
The damage case to further assess layout redundancy will be a case where the most critical exit isblocked or obstructed from use The worst performing deck is deck No2 where exit 1 was deemedmost critical Results of the damage case are given in Table 57 and plotted Figure 518 The maximumoccurring probabilities are given in the appendix see section A2 Congestion only occurred for thebaseline model Two areas can be identified for the night case where population percentage exceeded3 per state the states are colored red where this exceedance occurs Throughout the variant 1 layoutthe population percentage remained below the threshold Hence the variant 1 layout outperformedthe baseline model regarding possible congestion This can be a result of the availability of multipleroutes towards an exit for the parallel passageway configuration
Baseline Variant 1Metrics Case 1 Case 2 Case 1 Case 2120583utility -021 -035120590utility 047 04195 mark 82 92
Percentageof populationat exit
2 0847 0596 0807 05443 0062 0062 0074 00994 0016 0267 0023 02615 0055 0055 0064 00646 0020 0197 0014 0014
Table 57 Summary of results for the damage case
0 20 40 60 80 100 1200
02
04
06
08
1
Pro
babi
lity
Case 1
95 reached an exit after 82 moves
0 20 40 60 80 100 1200
02
04
06
08
1
Pro
babi
lity
Case 1
95 reached an exit after 92 moves
0 20 40 60 80 100 120
Moves
0
02
04
06
08
1
Pro
babi
lity
MovesCase 2
95 reached an exit after 82 moves
0 20 40 60 80 100 120
Moves
0
02
04
06
08
1
Pro
babi
lity
MovesCase 2
95 reached an exit after 92 moves
Exit2 Exit3 Exit4 Exit5 Exit6 95 mark
Baseline Variant 1
Figure 518 Exit percentage results when exit 1 is removed for deck No2
Results show that the baseline layout having a single passageway throughout the ship still outper-forms the variant 1 layout The population distribution among the exits are almost equal for bothlayouts The majority of the crew has evacuated after 82 epochs for the baseline layout and after 92epochs for the variant 1 layout This is an increase of 82 minus 43 = 39 epochs for the baseline layoutand 92 minus 67 = 25 epochs for the variant 1 model Indicating that the variant 1 model evacuation timeonly increases by 27 whereas the baseline layout increase by 90 There is no difference betweenspeed of convergence between day and night case
50 5 Validation study 2 influence of passageway configuration
Exit 3
Exit 3
Exit 4
Exit 4
Exit 5
Exit 5
Exit 6
Exit 6
Exit 2
Exit 2
Case 1 Initial distribution 50 line Case 2 Initial distribution 50 line
Removing exitBaseline deck No2
Variant 1 deck No2
Figure 519 Layout areas that indicate which part of the population will evacuate to the nearest exit Two lines are addedindicating the dividing line 50 of the population is located left of this line
Figure 519 shows the layout areas where population will egress towards a certain exit The exit thecrew will move to according the MDP model are the red states in each area Two boundary lines areplotted for both layouts which split the population in half This is done for both cases to indicate thatmore than half of the population is located aft of exit 2 Which results in exit 2 being the most used exit
0 10 20 30 40 50
Moves
0
01
02
03
04
05
06
07
08
09
1
Pop
ulat
ion
perc
enta
ge
Deck No1
0 20 40 60 80 1000
01
02
03
04
05
06
07
08
09
1
Pop
ulat
ion
perc
enta
ge
Deck No2
c1 baseline c1 variant 1 c2 variant 1
0 20 40 60 80 100
Moves
0
01
02
03
04
05
06
07
08
09
1
Pop
ulat
ion
perc
enta
ge
Damage case (Deck No2)
c2 baseline
Moves
Figure 520 Comparison of percentage of population reaching an exit state for both decks and additional damage case
Lastly Figure 520 shows for both decks and the additional damage case the total percentage of thepopulation that has reached and exit per epoch No difference in convergence speed was noticedbetween day and night cases However Figure 520 does show different evacuation behavior betweenthe day and night cases which is expected since there is a difference in initial population distributionSudden changes in the graph indicate that a large group of the population has reached an exit Theparallel passageway configuration has a property that has not been further investigated yet The crewcan always reach all the locations in the vessel when a damage that blocks the passageway occurs inthe parallel passageway part of the vessel This is not the case for the single passageway design crewwill then have use a different to go around the blockage This design feature should be consideredwhen evaluating which design performs best
56 Conclusion and Discrepancy 51
56 Conclusion and DiscrepancyThe intention of performing an early stage ship design evacuation analysis is to gain better insight in design performance [15] The International Maritime Organization identifies several objectives of an early stage evacuation analysis [24] Which if successfully conducted improves ship safety and evacuation performance The goal of this validation study was to recreate an early stage ship design used by Casarosa [15] and compare conclusions drawn from both models The software program used by Casarosa [15] is maritimeEXODUS which was able to identify critical areas and which design per-formed better according to a predefined human performance metric First the discrepancy between the models is commented upon This discrepancy helps investigate model fidelity and understand to what extend conclusions are in agreement with each other In addition the model input and output variations are used to assess the level of uncertainty or the confidence in the final conclusion
It should be acknowledged that the comparison made is between a simplified method2 and an ad-vanced method Where a simplified and advanced method refers to the IMO definition [24] The main difference between these methods is how the population is simulated which is either as a whole or each evacuee individually The choice in approach cases a difference in method outputs which are used to assess the design Casarosa [15] was able to create for both configurations 3 different resolu-tion layouts with each 7 different evacuation scenarios and calculate 18 different performance metrics for each resolution layout and each scenarios The MDP model was not able to recreate the various layouts scenarios and could not calculate the 18 performance metrics These limitations are a result of employing a simplified method Only a small amount of metrics similar to those used by Casarosa [15] were able to be calculated by the MDP model
Next not all input information could be acquired due to the confidential nature of naval warship design The main information lacking were the compartment types the exact amount of crew per deck and the initial distribution Nonetheless based on available information it is assumed that MDP model input used coincides with authors input to a certain degree and that the conclusion is still reasonably valid Similarly the congestion threshold applied is not yet verified thus it is unknown if the definition used is well-grounded Consequently the layout performance conclusion will mainly be a based on the utility distribution the exit behavior and the maximum occurring probabilities These performance metrics will be used to assess the evacuation scenario towards the emergency areas these are assumed to be located above deck No1 This assumption results in only comparing the MDP model with evacuation scenario 1 Lastly there was no exit flow limit defined for the MDP model in other words no limit was set to the amount of population able to enter an exit per epoch A possible implementation to incorporate this would be to stretch all curves accordingly or by implementing a dynamically changing Markov chain based on state capacity The latter idea is further explained in chapter 8 The most used exit is located aft and hence this area of the design is more critical
From discrepancy described it can be concluded that there is still uncertainty between model likeness and hence this should be taken into account in ascertain conclusion confidence On the basis thereof it is concluded that the MDP model was able to differentiate between the two layouts and identify which performed best The single passageway performed overall better than the parallel passageway This was thought to be mainly due to crew having to traverse less distance towards exits Next the utility distribution determined that exits of the baseline layout were more effectively placed throughout the layout This resulted in the baseline layout states being on average more close to an exit than the variant 1 layout states The average distance towards the nearest exit has the most influence on the utility distribution
No congestion was identified using the defined congestion threshold The most probable location for congestion could be identified which was during the night for deck No2 This was due to the clustering of accommodation spaces At night two-thirds of the crew is located in the accommodation spaces and could only egress towards exit 1 for deck No2 This resulted in exit 1 being most critical for deck No2 This coincides with the conclusion drawn from Casarosa [15] If escape scenario 1 coincides with
2The MDP model does not share the same underlying mathematical framework as the method described by IMO guidelines [24]but model assumptions do coincide to a greater extend to the simplified method assumptions
52 5 Validation study 2 influence of passageway configuration
the assumptions of the MDP-model then conclusions of both studies are in agreement Both studies conclude that the baseline model outperforms the variant 1 model
Casarosa [15] concluded that in order to improve the baseline layout an additional ladder is to be added at deck No1 between exit 1 and 2 see Figure 51 From Figure 58 it can be concluded that the area between exit 1 and exit 2 is most isolated Also this coincides with Figure 514 for deck No1 showing possible congestion at exit 1 and exit 2 As Casarosa [15] stated the intention behind performing an evacuation analysis for an early stage ship design is to gain better insight in design performance Not so much at getting precise measurements close to reality It is concluded that the MDP model
bull Can estimate evacuation duration to a reasonable degree
bull Can identify critical exits
bull Show potential in analyzing escape arrangement flexibility
bull Can identify areas of possible congestion
The MDP model concluded that a single passageway outperforms a parallel passageway however aparallel passageway shows more adaptability to damage cases
6Discussion
The objective of this thesis is to investigate the potential of using a Markov-Decision-Process (MDP)framework to assess an early stage ship design from an evacuation perspective One main questionand four sub questions are defined This chapter discusses the findings and its significance this issummarized per sub-question In addition are the method limitations discussed The main question ofthis thesis is
How does a ship design alter when it is egress based driven and could a Ship-Centric Markov Decision Process provide a tool for such a method in the prelimi-nary design stage
The first sub-question is defined to understand for which type of vessels an evacuation analysis needsto be performed and how other industries perform such an analysis The second sub-question focuseson the functionality of similar tools and provides a basis for the method development The relationshipbetween design and evacuation is investigated with sub question three Two validation studies wereperformed to answer this question Finally sub-question four will help determine to what extend themain question can be answered The first sub-question is
1 For which types of vessels does egress influence the design and how do other industries sim-ulate egress
Regulation stipulates that an evacuation analysis is to be performed on ro-ro passenger ships whichhave a keel-laid date on or after the 1st of July 1999 New IMO amendments makes it in additionalso mandatory for other passenger ships which with a keel-laid date on or after 1 January 2020 toperform this analysis Special purpose vessels with more than 240 personnel are also considered otherpassenger ships and hence need to comply with the same guidelines For these ship types such ananalysis assesses the evacuation performance and their findings can affect the design The regulationguidelines give benchmark data to compare results with This data originates from the building in-dustry The building industry models egress with similar software methods utilizing both macroscopicas microscopic approaches In addition different specific egress strategies are defined for differentemergencies The evacuation process defined in the offshore industry shares a similar structure as themarine industry process In addition challenges imposed by the environment are also similar Theoffshore industry focus on risk-based methods to improve the evacuation escape and rescue (EER)process
2 What information is necessary for an egress model as input and what information should themodel provide the designer
53
54 6 Discussion
The capabilities of an evacuation model depend on the applied underlying principle which can be basedon an optimization methodology on a simulation approach or on a risk-based-assessment [59] Eitherprinciple needs information regarding population enclosure and behavior as input Model input infor-mation is partly determined by whether or not the population is treated as individuals or as a groupRegulation stipulates which specific information is necessary for the different approaches [3 24] Thechoice in population definition also affects how behavior is considered The simplified method consid-ering the population as a whole is more appropriate to use for an early stage ship design due to theease in ability to provide an approximation of the vessels evacuation performance [24] The behaviorof a single evacuee cannot be simulated when agents are not modelled individually This contributesto a reduced model fidelity and hence result accuracy is lost Population characteristics are mainly afunction of ship type which affects the population demographics awareness and response times Themodel output depends on the application of the egress tool The evacuation time is the most importantoutput variable when the model is used to check if design meets the IMO criteria The goal should beto be able to confirm that the design meet required criteria identify and eliminate congestion demon-strate escape arrangement flexibility identify areas of counter- and cross flow and provide evacuationinformation to the operators [24] Model output should facilitate information to asses either some orall of these goals
3 How does general arrangement design influence egress
The general arrangement is a function of various factors such as the ship type and ship requirements Passenger vessels include many public areas whereas special purpose vessels have in addition to crew accommodation a wide variety of service spaces This configuration affects initial population distri-bution [23] in turn affecting the evacuation performance Only two design aspects were investigated in more detail the choice in exit locations and the influence of the passageway configuration on an evacuation Kurdi et al [14] demonstrated the influence different exit configurations have on the evac-uation duration and distribution of the population among the exits The authors demonstrated most evenly distributed exits throughout the layout was found most beneficial to the evacuation process Casarosa [15] demonstrated the influence of two different passageway configurations on personnel movement on board a frigate The conclusions were based on a human performance metric (HPM) to assess different scenarios and layout resolutions The low-resolution layouts corresponded with an early stage ship design A single passageway throughout the vessels performed overall better than two parallel passageways This is because the population for the single passageway configuration had to on average traverse less distance towards an exit Similarly the exits were more evenly placed throughout the layout The additional damage case showed that the parallel passageway configuration performance was less sensitive when the most critical exit was removed This could lead to the conclu-sion that a parallel passageway is more redundant and escape arrangement more flexible This design was further improved by eliminating congestion through adding an additional ladder Both studies showed the major influence exit placement has on egress performance
4 Is an SC-MDP a viable method for modeling egress in general and which aspects of egress isit able to capture
From the literature study it is concluded that the amount of vessels which have to perform an evacua-tion analysis will increase The new amendments could create an increase in the demand for evacuationmodels or evacuation research The diversity in the various models are due to the complexity of anevacuation process Different models are able to capture different aspects of the highly dynamic sys-tem A Markov-Decision-Process is probabilistic approach to simulate system behavior The validationstudies determined that the method is able to differentiate between designs and identify critical aspectssuch as unevenly used exits The second sub question describes the different elements in evacuationmodels and the objective of an evacuation analysis The MDP method was not able to evaluate all ofthe IMO given objectives given by [24] This is caused by to the method assumptions To improvethe models shortcomings improvements are suggested and given in chapter 8 The method is ableto incorporate population distributions identify critical exits and locate possible congested areas atthe time of writing The third sub-questions demonstrated the MDP model capability to assess layouts
55
based on on exit- and passageway configurations to a certain extend By adding additional scenar-ios conclusion confidence is improved The MDP framework demonstrated potential to simulate egress
Regarding the limitations of this thesis and differences with other models A noticeable difference between a Markov-Decision-Process based model and the models incorporated by the validation stud-ies is the method approach The MDP model is a stochastic method whereas the validation studies a deterministic method As a result both validation studies needed to simulated the process a hundred times to get an averaged result Whilst the MDP-model only has to simulate the process once This gives the advantage that the method can be faster performed and more easily used during early stage ship design However as also was shown in section 53 the methodology proposed was not able to incorporate all aspects of an evacuation nor calculate similar metrics as Casarosa [15] Table 52 shows how much criteria the MDP-model was not able to be calculate This is a result of as explained by sub-question 2 a choice in modeling the population as a whole Not modeling all persons as individuals makes it unable to calculate metrics related to individuals for example how often a watertight door is used Improvements to the MDP-model is explained in chapter 8
The first part of the main question - How does a ship design alter when it is egress based drive -is answered to a certain extend using literature on ship design using sub-question 4 and with the two validation studies First the implications the ship design process has on the evacuation analysis is discussed Then the main question is answered using the conclusions from the two validation studies
The capacity to modify to the layout decreases as the ship design process progresses [2] The ship design process can be split up in three major stages [48] This thesis focused on the first stage the early stage which holds the most design freedom The concept stage follows after the early stage and lastly detail design commences The early design process can differ for each ship type and level of novelty of the ships design [49] At the time of writing an evacuation analysis tends not be performed early on in the design process [64] The insufficient literature found on the intricate relationship be-tween a ships design and the evacuation performance limits the ability to completely answer the first part of the main question
The relevant decisions that occur during each stage of the design process affect how how a ships layout changes Design modifications which improve evacuation can be justified with evacuation tools except these tools are limited to different design stage Model fidelity increases as models get more advanced Simplified methods are used early in the design stage and have lower fidelity which prevents calcu-lating accurate evacuation times It is unclear whether evacauability is currently incorporated in early design and used as a measure or style Early stage models could be used when design evolves to frequently evaluate evacuation performance An evacuation analysis is not always carried out during early stage ship design [64]
The general arrangement of passenger ships (both cruise ships as ferries) tend to start by determining the location of public spaces and accommodation spaces [52] An ship arrangement will improve de-pending to the evacuability aspects the model is able to capture The first validation study demonstrated that placing exits on all sides of a room improves egress performance From the second validation study it becomes apparent that clustered accommodation compartments cause the nearest exit to be most critical Choosing a compartment configuration which disperses the population more evenly among the layout for both day and night cases will reduce possible congestion inception Staircase locations should prevent area isolated areas but still be in agreement with the assumed population distribution Next it was determined that decreasing the distances towards the exits improves evacuation Provid-ing multiple escape options increases the evacuation redundancy of a design However it should be noted that above conclusions were based on limited scenarios and metrics Increasing the scenarios considered and including damage cases could improve conclusion confidence In short a ship design will change based on the method employed and the methods capabilities The designer can only assess as much as the tools able him or her to
7Conclusion
This research showed the possible demand for a model capable of evaluating evacuation performanceand identifying critical areas early on in the design stage This work successfully extended the work byKana and Singer [12] Kana and Droste [27] who proposed a Markov Decision Process based method-ology to be used to evaluate the evacuation performance of an early stage ship design From theliterature study it was concluded that an evacuation process is a highly dynamic process Two valida-tion studies were performed to determine if a Markov decision process based approach can be used toassess the ships evacuation performance
The first validation study demonstrated that the MDP model was able to differentiate based on evac-uation performance between four rectangular rooms Both the MDP method as well as the methodsused in the comparison study determined that exits on all sides of the room evacuated the fastest Itis concluded that MDP model is able to identify an optimal exit configuration for a rectangular grid
The second validation study concluded that the MDP model can differentiate between two decks ofa naval ship design The layouts were analyzed based on how quickly the majority of the populationreaches an exit how the exits are dispersed throughout the layout how the population is distributedamong the exits and possible congestion locations Taking the MDP model assumptions into accountevacuating a layout with a single passageway proved to be faster than with a double passagewayHowever the latter showed to be more redundant to damage scenarios
The extent to which the method can be used should be further investigated As a result of the secondvalidation study where the model was be applied to a naval warship design it is deemed probablethat it can also be used for other complex ships such as cruise ships and special purpose ships Thisassumption should be investigated in further detail An overview of the thesis findings are listed below
bull The relationship between a ships design and the evacuation performance is complexbull Early stage ship design holds the most potential to improve the evacuation performancebull The physical arrangement of a ship strongly affects evacuation process and efficiencybull Exits that are evenly dispersed throughout the layout and are located in accordance with theinitial distribution improve MDP simulation convergence and exit usage
bull An increase in the amount of evacuation analysis both for passengers vessels as well as specialpurpose vessels is expected due to regulation changes This applies to ships constructed on orafter 1 January 2020 and carrying more than 36 passengers or 240 special personnel
bull The Markov decision process model shows potential to be used as a tool to differentiate betweenearly stage ship designs
57
8Future work
Each variable used for input for any method influences the output and therefore conclusions drawnTherefore each input variable value should be justified This thesis focuses on testing the potentialof the MDP method Further research should focus on justifying certain input values The discountfactor should reflect a persons short term goals and long term goals The action probability could forexample reflect a persons uncertainty in decision making These aspects are further highlighted inthis section In short this section are recommendations for future research in this method
Improving model resolutionCurrently the walls are included in the layout as states in other words only by adding a wall two statesare disconnected from each other This wall state shares the same geometric attributes as a regularstate Therefore a course grid will result in unrealistic wide walls A feature which is not incorporatedbut could improve the models accuracy and running time is to be able to remove edges between nodesin order to simulate a wall This is graphically represented by Figure 81 and it can be seen that thelayout is better represented if edges are simply removed
1 2
Figure 81 Example why removing edges will represent a layout better than wall states Gray nodes are wall nodes removingedge between state 1 and 2 will represent a wall
Multi-deckCurrently only one deck is simulated with the MDP-model however the method could be used on amulti-deck layout A stairway is added by linking all deck exits states with the corresponding adjacentdeck exit states Adding states in between the exit states can represent the time it takes to go upor a down a stairway The amount of states could differ per exit type The more states in betweenthe longer it takes for passengers to go up or down the stairways Emergency station nodes shouldthen have a positive reward instead of the exit locations to simulate occupants moving towards theemergency stations
Modify utilities to including stability loss and initial population distributionTwo different proposals are made which were not yet investigate in more detail but could improve theMDP methodology Firstly the rewards in all states were kept the same therefore the policies werealso mainly a result of distance from an exit The rewards could also be not all the same to create anasymmetrical utility distribution throughout the layout For example by setting negative rewards atport side lower than starboard an incentive is created to move towards starboard side of the vesselSince less negative rewards would increase the utility and therefore influence the policies This trans-versely asymmetrical reward distribution would simulate a ship heeling It is assumed people tend to
59
60 8 Future work
want to move upwards when a ship starts to heel Since evacuations are done when the ship is in acritical state stability loss should be incorporated in the simulations
Secondly the utility distribution used did not consider the initial distribution of evacuees The samevalue was given to all state nodes whereas it would be more realistic to place more value on highlypopulated areas Therefore using the initial state distribution to scale the utility values accordinglywould penalize populated areas further away from an exit Similarly non-populated isolated areaswould be less valuated Response time also differs for day and night scenario and by including theinitial distribution a heavier penalty is given isolated accommodation areas far away from an exit
Counter flowIn this thesis only one population was simulated Therefore the entire population used the nearestexit to egress towards to As described by regulation counter and cross flow should also be investi-gated One way of doing this is to simulate the two populations separately and create two differentMarkov-Chain solution matrices as given by Equation 38 The ratio between population sizes can beused to scale down both matrices according For example if the ratio between passengers and crew is3 to 1 than this should also be reflected in both matrices Ie the passenger population is multipliedby 75 and the crew population by 25 These two solution matrices are then added together to createone solution matrix An animation of this simulation is added in Appendix A
State occupancy thresholdIn order to limit the percentage of agents occupying one state a state capacity limit could be intro-duced If 119909 represents a person then 4119909 could be a state capacity indicating only 4 persons perstate is allowed If a state is saturated the transition probabilities to neighbouring states should beadjusted This concept is further explained in this sectionAn illustration is given in Figure 82 for anarbitrary layout
1
2
3
4
5
6
1
1
8
119904
010000⋮
119872
1 1 0 8 0 0 ⋯
1 0 1 0 8 0 ⋯0 1 1 0 0 8 ⋯0 0 0 1 1 0 ⋯0 0 0 1 0 1 ⋯0 0 0 0 1 1 ⋯⋮ ⋮ ⋮ ⋮ ⋮ ⋮ ⋱
119904
101080⋮
1
1
1
1
1
1
8
8
8
8
8
1
1
1
2
3
4
5
6
5
5
0
1
1
1
1
1
1
8
8
8
8
8
1
1
1
1
1
1
119872
1 1 0 8 0 0 ⋯
1 0 1 0 8 0 ⋯0 5 5 0 0 0 ⋯0 0 0 1 1 0 ⋯0 0 0 1 0 1 ⋯0 0 0 0 1 1 ⋯⋮ ⋮ ⋮ ⋮ ⋮ ⋮ ⋱
119904
01
06
05
16008⋮
119872
1 1 0 8 0 0 ⋯
1 0 1 0 8 0 ⋯0 1 1 0 0 8 ⋯0 0 0 1 1 0 ⋯0 0 0 1 0 1 ⋯0 0 0 0 1 1 ⋯⋮ ⋮ ⋮ ⋮ ⋮ ⋮ ⋱
1
2
3
4
5
6
1
1
8
1
1
1
1
1
1
8
8
8
8
8
1
1
1
1
epoch 0 epoch 1 epoch 2
Figure 82 Arbitrary layout example changing transition matrix
The layout used is a 10x20 grid with no walls The initial distribution is 100 at state 10 and is locatedat the bottom left corner The exit node is state 191 and located at the top-right corner An MDP isused to calculate all the policies and create a transition matrix which is a 200x200 matrix The actionprobabilities are 8 in the desired direction and 1 at perpendicular directions
61
0 10 20 30 40 50 60 70 80
epoch
0
02
04
06
08
1
Exi
t
Exit behavior for regular MC
0 10 20 30 40 50 60 70
epoch
0
02
04
06
08
1
Exi
t
Exit behavior for dynamic changing MC
Figure 83 Exit results for the regular and dynamic changing MC
The idea behind the method is that when a state probability exceeds a threshold all adjacent stateswith a policy to move towards the rsquofullrsquo state are updated The highest values are deleted (in theexample 8 values are deleted) in the corresponding row of the transition matrix The remaining val-ues are adjusted accordingly so the sum of the row again equals 1 For example if the remainingprobabilities are 1 to the left and 1 to the right then these are changed to 5 and 5 At each iter-ation all states exceeding the limit and all states below the limit are located If the cell is below thelimit than the adjacent state probabilities are reset The exit behavior is plotted and given in Figure 83
AAppendix
A1 Validation study 2 Exit results
Case 1Baseline Variant 1
Exit No1 No2 No1 No21 151 (45) 737 (516) 146 (44) 761 (533)2 343 (103) 099 (69) 191 (57) 054 (38)3 036 (11) 058 (41) 176 (53) 074 (51)4 242 (73) 038 (26) 114 (34) 039 (27)5 228 (68) 050 (35) 373 (112) 060 (42)6 018 (13) 012 (09)
Table A1 Exit convergence results for case 1 In brackets the conversion to amount of crew
Case 2Baseline Variant 1
Exit No1 No2 No1 No21 162 (49) 515 (36) 154 (46) 505 (353)2 273 (82) 081 (57) 229 (69) 058 (40)3 167 (50) 062 (44) 163 (49) 099 (69)4 199 (60) 267 (187) 185 (55) 261 (183)5 198 (59) 055 (39) 269 (81) 064 (44)6 020 (14) 014 (10)
Table A2 Exit convergence results for case 2 In brackets the conversion to amount of crew
Deck No1 Deck No2Metric Case Baseline Variant 1 Baseline Variant 1
Std Dev 1 0102 (1) 009 (088) 0256 (096) 0266 (1)2 004 (092) 0043 (1) 0175 (1) 017 (097)
95 mark 12 36 (088) 41 (1) 43 (064) 67 (1)Sum normalized values 280 288 260 297Difference +31 +142
Table A3 Comparison between standard deviation of final population distribution over exits and 95 mark In brackets thenormalized values which are summed to compare overall score
63
64 A Appendix
A2 Maximum probability plots for the additional damage case
Case 1 Max probability plot - No2 Baseline
Case 1 Max probability plot - No2 Variant 1
0
001
002
003
004
Popu
latio
n pe
rcen
tage
Figure A1 Maximum probability plot for the night case of deck No2
Case 2 Max probability plot - No2 Baseline
Case 2 Max probability plot - No2 Variant 1
0
001
002
003
004
Popu
latio
n pe
rcen
tage
Figure A2 Maximum probability plot for the day case of deck No2
A3 Value iteration code 65
A3 Value iteration code1 U = zeros ( numStates 1 numActions ) I n i t i a l i z e U t i l i t y matr ix2 Q = zeros ( numStates 1 numActions ) I n i t i a l i z e Qua l i t y matr ix3 numEpochs=1004 d iscount = 0955 g loba l tmpPol i cy 6
7 U_ l i s t=zeros ( numStates numEpochs ) Save u t i l i t y each i t e r a t i o n8 p o l i c y _ l i s t=zeros ( numStates numEpochs ) Save p o l i c i e s each i t e r a t i o n9
10 Solve MDP using value i t e r a t i o n11 f o r e=1numEpochs12 f o r i =1numActions13 Ca l cu l a t e Qua l i t y matr ix14 Q( 1 i )=R+discountP ( i )U( i ) 15 end16 prepare f o r next epoch17 [U tmpPol i cy ] = max(Q [ ] 3 ) 18
19 Reset e x i t u t i l i t i e s rewards20 f o r i =1 length ( e x i t s )21 U( e x i t s ( i )==sta teLoc )=ex i tR ( i ) 22 end23
24 Reset f i r e hazard u t i l i t i e s rewards25 f o r i =1 length ( f i r e s )26 U( f i r e s ( i )==sta teLoc )=f i r eR 27 end28
29 Update U matr ix f o r next i t e r a t i o n30 f o r t =1numActions 231 U=cat (3 UU) 32 end33
34 Safe so l u t i o n to the l i s t35 U_ l i s t ( e )=U( 1 1 ) 36 p o l i c y _ l i s t ( e )=tmpPol i cy 37 end
66 A Appendix
A4 AnimationFor the following animations a Adobe Flash plugin is required an installation guide for Mac and Windowscan be found on link However when this document is opened with Adobe Reader a pop-up shouldgive information how to download the plugins
Value iteration for No1 BL
Addition of two Markov chain solutionsBelow an arbitrary layout is given where two Markov-Chain solutions have been added together andplotted The first group consists of an population which has only access the bottom exits The secondgroup has been delayed for 40 steps and has access to all exits

Analysis of evacuation performanceof early stage ship designs using aMarkov-Decision-Process model
by
RS Joustraperformed at
Bureau Veritas Marine Nederland BV
in partial fulfillment of the requirements for the degree of
Master of Science
at the Delft University of Technologyto be defended on Thursday September 20 2018 at 1415 AM
Thesis number SDPO18038mStudent number 4405803Project duration January 11 2018 ndash September 20 2018Thesis committee Prof dr ir JJ Hopman TU Delft
Dr AA Kana TU DelftDr Ir I Akkerman TU DelftIr N Daniels Bureau Veritas Marine Nederland BV
An electronic version of this thesis is available at httprepositorytudelftnl
Summary
This thesis research is conducted on behalf of the Delft University of Technology and Bureau Veritas Rotterdam BV and the goal is to improve ship evacuation by analyzing this aspect early on in the design process First this summary will provide a background on the difficulties involved with the ship evacuation process Next an explanation is given why this thesis proposes a different model And lastly how this model is validated is elaborated upon
A ship evacuation is a highly complex process and it is one of the most important aspects concerning the safety of crew and passengers on-board This process is affected by various factors largely by the general arrangement The layout of a ship varies throughout the design period but the most design freedom occurs during the early stage [1] An estimated 90 of the decisions which have major im-pact on final design have been made in this stage [2] As a result this stage holds the most potential to improve the ship evacuation performance This stage is characterized by a lack of detailed layout information available which results in reduced accuracy in evacuation prediction As of 1st of July 2020 all passenger ships with more than 36 passengers have to perform an evacuation analysis based on guidelines created by the International Maritime Organization (IMO) [3] The guidelines describe two methods a simplified method for the early design stage and an advanced method for the detailed or final design stage The simplified method translates the ship design to a hydraulic network which in turn results in various method limitations The goal of an evacuation analysis is among other things to provide the designer with information about possible congestion points identify areas of counter- and cross flows prove that the escape arrangements are sufficiently flexible and prove that the evacuation time does not exceed a threshold
Evacuation models capable of performing an evacuation analysis tend to have four general compo-nents that define the various aspects influencing the process The four components are configuration environmental procedural and behavior component [4] Including evacuee behavior in an evacuation model tends to be difficult due to the complexity [5] and lack of research available [6] Evacuation mod-els can be categorized using various descriptors [7ndash11] however resolution tends to dominate High resolution models are called macroscopic models whereas low resolution models are called microscopic models Microscopic models simulate each individual evacuee as an agent with certain attributes such as walking speed and destination Most early stage evacuation analysis are macroscopic models and simulate the population as a whole A different macroscopic approach is proposed by Kana and Singer [12] which uses probability theory to incorporate the stochastic nature of an evacuation process This method consists of a Markov-Decision-Process (MDP) to calculate the most probable evacuation routes Policies are determined for each small geometric area called a state in the layout These policies affect evacuation routes The evacuation process can then be simulated by using the MDP policies and an initial population distribution The initial population distributions are defined by the Fire Safety Systems Code [13] Design variations can be compared based on the calculated optimal routes the time it takes for the process to converge and how the population is distributed among the exits A lack of literature is noticed that investigates the relationship between early stage ship design and the ship evacuation performance Two different studies were found which can be used to validate the MDP methodology
The first validation study determines which exit configuration is most optimal from an egress per-spective Kurdi et al [14] defined four different layouts for two population sizes Having exits on all sides was determined to be the most efficient layout The MDP model consisted of the same setup as the validation study [14] The MDP method is able to identify the same exit configuration as most efficient based on the population distributed among the exits and simulation convergence times The second validation study evaluates two different frigate layouts with varying passageway configuration [13 15] One layout has a single passageway throughout the ship The other layout has a parallel pas-sageway configuration Casarosa [15] used a microscopic model to calculate a range of performance metrics for 7 different scenarios
iii
iv 0 Summary
All evacuees were modeled as singular agents with different behavior and objectives 3 out of 7 scenarios were emergency scenarios where only 1 scenario corresponds with the MDP assumptions Discrepancy between models is considered as a result of limited and confidential layout information used by Casarosa [15] The MDP method was able to differentiate between the two layout config-urations and can identify critical areas in the layout However due to the assumptions it cannot be determined to what extend the method inputs were similar Nevertheless both validation studies showed the potential of using a Markov-Decision-Process based method to evaluate early stage ship designs on evacuation performance
Preface
The drive to continue studying after finishing my bachelor at the NHL University of Applied sciencesled to my enrollment at the Delft University of Technology The motivation behind this next step wasto further improve myself and take on more complex problems This thesis is my final achievement atthe TU Delft and I am eager to embark on new challenges I could not have achieved this without thehelp and support of many
First I want to thank Austin Kana who supervised my progress Austin first pitched the idea behind thisthesis in his dissertation I am grateful for his trust in continuing his idea and take it a step further Inaddition his enthusiasm for the topic and involvement throughout the months was much appreciatedAlso I thank Hans Hopman for sharing his experience in ship design and being critical on my workHis comments and suggestions guided me towards my goal
Next I wish to thank Nick Daniels who with his extensive experience and knowledge of regulationswas always available to give feedback and new insights The regulatory framework is not easy to com-prehend in such a short period even after having worked at Bureau Veritas myself for almost threeyears His guidance greatly reduced my struggle to get a clear picture of all relevant rules LikewiseI would thank all colleagues at Bureau Veritas with special thanks to Krasimira Charchieva and FrankKersbergen Both spend time making sure I found what I was looking for and that I understood itcorrectly This was greatly appreciated
Last but not least I would like to thank my family for always supporting my decision to continuestudying even if it took a bit longer than expected Help was always there when I needed it andconfidence in my ability to finish this thesis In addition I want to express gratitude towards myfriends who always stood ready for support showed interest in my work and made sure I was stillgetting enough fun
RS JoustraDelft September 2018
v
Contents
Summary iii
List of Figures ix
List of Tables xi
1 Introduction 111 Background 112 Research objective 213 Method proposal 2
2 Literature study 521 Regulation 5
211 Safety Of Life At Sea SOLAS 5212 Alternative Design Approach 8213 Code of Safety for Special Purpose Ships 2008 8214 Remarks 9
22 Evacuation 10221 Building industry 10222 Offshore Installations 11223 Marine industry 12
23 Design 14231 Early stage layout 14232 Layout and safety 16
24 Modeling 17241 Building evacuation models 18242 Marine evacuation models 19
25 Problem summary and method proposal 19
3 Research method 2131 Markov-Chain 2132 Markov Decision Process 2233 Solution Markov Chain 2334 Marine aspect of the MDP 24
341 Determining the initial distribution of an early ship layout 24342 Translating layout to model 24343 Influence of scale on model complexity 25344 Choice of horizon 26
35 Performance metrics 27351 Utility distribution 27352 Exit convergence behavior 27353 Maximum occurring probability 28
4 Validation study 1 influence of exit configuration 2941 Goal 2942 Paper summary 2943 MDP Results 30
431 Exit usage 30432 Utility distribution 31
44 Conclusion 32
vii
viii Contents
5 Validation study 2 influence of passageway configuration 3551 Goal 3552 Paper summary 3553 Model aspects 37
531 Layout 38532 Choice of actions 39533 Amount of decks and exit type 39534 Choice in discount factor and state rewards 40535 Initial distribution 40536 Designated emergency stations 42
54 MDP results 42541 Exit convergence results 44542 Utility histogram 46543 Maximum probability occurring during simulation 46
55 Additional damage case 4856 Conclusion and Discrepancy 51
6 Discussion 53
7 Conclusion 57
8 Future work 59
A Appendix 63A1 Validation study 2 Exit results 63A2 Maximum probability plots for the additional damage case 64A3 Value iteration code 65A4 Animation 66
Bibliography 67
List of Figures
11 Graphical representation of a Markov-Chain with two states 3
21 Performance standard according to IMO [16] 722 IMO framework - passenger ship safety Adopted from [11] 1023 EER process as defined by Health and Safety Executive [17] 1224 Marine evacuation process copied from [11 Ch2 p 54] 1225 General design characteristics from Cooper et al [1] 1526 Two naval vessel layouts copied from Casarosa [15] 1627 Model decisions from Gershenfeld [18] 17
31 Influence of action probability variation on direction uncertainty of evacuee The figureillustrates what the probability of ending up in a certain state is if the policy would be tomove in a straight line The red line indicates the policy direction With an uncertaintyof 07 the probability decreases each time step with 07 for the agent to remain headingin the most optimal direction 24
32 Intermediate Matlab model steps 2533 Example how the horizon choice determines whether or not all evacuees were able to
reach an exit Such a plot also can show which areas are difficult to reach The colorintensity denotes the utility values of each cell 26
34 Four different utility distribution extremes The number below each graph indicates theorder of performance 27
35 Example of the exit convergence plot 2836 Example plot with the top figure indicating the layout and the figure below plotting the
maximum occurring probabilities for each state 28
41 Four different layouts created by Kurdi et al [14] the red box denotes an exit Fourwalls are randomly placed throughout the grid for each layout Note The layouts arenot symmetrical 29
42 Exit convergence results for each layout for N=50 3143 Exit convergence results for each layout for N=100 3144 Exit convergence results for each layout for an evenly distributed population across the
grid 3145 Percentage of crowds at exit for each method and all layouts table results 3246 Histogram of the calculated utilities for each layout 32
51 Example layout drawn in Rhinoceros with the passageway figure covered on top 3852 Policy and utility plot for no1 BL for two grids with different resolutions 3853 Exit convergence behavior for no1 BL for 1119898 (left) and 06119898 (right) 3954 Example with an arbitrary layout where the compartment exit location choice influences
results 3955 Histogram for layout no1 bl with three different discount factors (1 095 and 09) and
three different state rewards (-005 -004 and -003) 4056 Assumed compartment type Blue denote service spaces orange denote public spaces
and green denote accommodation spaces 4257 Project EGO layouts translated in MDP program gray indicates walls white are states
red is an exit state Exits are number from aft to forward in ascending order 4258 Snapshot of the value iteration algorithm for layout No1 baseline after 20 iterations
showing the area which has found a solution and which area has not Red indicates thedividing line between the two areas 43
ix
x List of Figures
59 Policy and utility plot for no1 BL for two grids with different resolution 43510 Policy and utility plot for no1 BL for two grids with different resolution 43511 Exit percentage with distribution based on FSS - case 1 44512 Exit percentage with distribution based on FSS - case 2 45513 Utility frequency plot 46514 Maximum probability occurring for each state is plotted per layout the congestion thresh-
old is 007 47515 Maximum probability occurring for each state is plotted per layout the congestion thresh-
old is 007 47516 Maximum probability occurring for each state is plotted in a single layout The congestion
threshold is 003 48517 Maximum probability occurring for each state is plotted per layout the congestion thresh-
old is 007 48518 Exit percentage results when exit 1 is removed for deck No2 49519 Layout areas that indicate which part of the population will evacuate to the nearest exit
Two lines are added indicating the dividing line 50 of the population is located left ofthis line 50
520 Comparison of percentage of population reaching an exit state for both decks and addi-tional damage case 50
81 Example why removing edges will represent a layout better than wall states Gray nodesare wall nodes removing edge between state 1 and 2 will represent a wall 59
82 Arbitrary layout example changing transition matrix 6083 Exit results for the regular and dynamic changing MC 61
A1 Maximum probability plot for the night case of deck No2 64A2 Maximum probability plot for the day case of deck No2 64
List of Tables
31 Overview of FSS regulation regarding the distribution of persons for case 1 (night) andcase 2 (day) 24
32 Excel Cell identifiers 25
41 Order from lowest standard deviation (1) to highest deviation (4) Indicating whichdesign distributes pedestrians most evenly amongst the exits 33
3342 Comparison of the evacuation time
51 Scenario scores for emergency scenarios copied from Casarosa [15] chapter 4 - Table447 36
52 List of performance metrics used for calculating HPM All metrics that the MDP-model iscurrently not capable of calculating are greyed out 37
53 Number states for each layout type 4154 Ratio of compartment type with total amount of states 4155 Amount of moves per layout per case 4556 Congestion threshold parameters 4757 Summary of results for the damage case 49
A1 Exit convergence results for case 1 In brackets the conversion to amount of crew 63A2 Exit convergence results for case 2 In brackets the conversion to amount of crew 63A3 Comparison between standard deviation of final population distribution over exits and
95 mark In brackets the normalized values which are summed to compare overall score 63
xi
1Introduction
11 BackgroundIn 2016 there were 2611 maritime shipping incidents In EU states or vessels sailing under one of theEU state flags 976 persons were injured and 115 fatalities occurred due to shipping incidents [19]During the last 10 years the number of casualties in maritime shipping incidents declined there is noroom for complacency [20] Casualties andor loss of life can occur when passengers cannot get ontime to the life vessels or when passengers are unable to leave the vessel in time the first place Muchresearch is spent on improving maritime shipping safety starting from the titanic incident resultingin the creation of Safety Of Life At Sea (SOLAS) in 1914 The mission of the International MaritimeOrganization (IMO) is to promote safe secure environmentally sound efficient and sustainable ship-ping through cooperation One of the challenges involved is the evacuation of crew and passengers onvessels during an emergency Such an emergency follows after certain events occurring on a vesselThe events leading up to an evacuation could be for example due to a fire or flooding [21]
The evacuation progress depends on a multitude of factors including but not limited to the numberof passengers population demographics type of hazard training of crew protocols or the layout ofthe vessel Ship arrangement design heavily influences evacuation of passenger and crew during anemergency From all possible locations in a ship the evacuation routes should be known Howeverpassengers often are not familiar with the layout of the ship resulting in difficulty to egress Widthof stairways and hallways influence the flow rate possible through the ship There should be enoughinformation available to guide passengers towards safety by means of for example evacuation signsor emergency lighting [22]
Evacuation is one of the most important aspects concerning the safety of those on board [23] Anevacuation analysis gives insight in how individuals move throughout the vessel during an emergencyand can be used to for example evaluate potential congestion points In may 2016 the IMO approvedrevised guidelines making evacuation analysis mandatory both for ro-ro passenger vessels as well asother passenger ships constructed on or after the first of January 2020 MSC1Circ1533 also rec-ommends that the guidelines are used in early design process This to enable designers to identifycongestion points or critical areas [24] The regulation changes also give rise to a demand in moreinsight in egress modeling
Improving evacuation time is beneficial from a safety perspective but can also be beneficial from a fi-nancial perspective The vessel layout is defined in early stages of ship design and is mostly fixed afterthat Changes in design layout in late-stage is difficult to implement Hence to assess the ship layoutfrom an egress perspective in early stage ship design could prove beneficial in evacuation performancewhen the ship is operational
An evacuation analysis can either be a simplified analysis based on formulas provided by IMO or anadvanced analysis where the movement of each person is considered [25] The latter could be a
1
2 1 Introduction
multi-agent simulation or velocity based personal movement models Examples of software for build-ing emergency evacuation simulations are for example flow based cellular automata agent-basedand activity based [26] Examples of software capable of simulation egress are EVACNET4 WAYOUTPathFinder and EGRESS 2002
Due to the size and complexity of new vessels modeling evacuation patterns in early stage becomesharder Multi-agent simulations andor velocity based personnel movements models are both compu-tational expensive aswell as require a detailed layout of the vessel The focus for this thesis will be onthe combination of early stage ship design and egress possibilities within this domain Kana and Singer[12] Kana and Droste [27] proposed an Markov-Decision-Process (MDP) to model evacuation and thestudies showed potential for the MDP ability to simulate evacuation This thesis will expand upon saidresearch
12 Research objectiveThe main objective of this thesis will be to research if and how Ship-Centric Markov Decision Process(SC-MDP) could be used for an early stage design model used for egress modeling The main question
How does a ship design alter when it is egress based driven and could a Ship-Centric Markov DecisionProcess provide a tool for such a method in the early design stage
To answer the above question several sub questions should be also answered
1 For which types of vessels does egress influence the design and how do other industries simulateegress
2 What information is necessary for an egress model as input and what information should themodel provide the designer
3 How does general arrangement design influence egress
4 Is an SC-MDP a viable method for modeling egress in general and which aspects of egress is itable to capture
13 Method proposalThe SC-MDP is utilizes a Markov Decision Processes which is an extension of Markov chains A Markovchain describes how a process changes through time in case future and past events are independentMeaning that any decision made in its current state does not depend on past decisions A Markov chainconsists of states in which a system can be in The transition matrix gives the probability to leap fromstate to state The probability to be located in a state at a certain epoch is given by the state vector 119904
An example of a transition probability graph is given in the Figure 11 This graphically show twostates the system can be in and the respective probabilities to change from one state to another or tostay (119901 ) in the same state A Markov decision process gives a sequence of Markov chains for eachdecision made in this case for each state change As described in Artificial Intelligence a modernapproach[28] a Markov decision process is a sequential decision problem for a fully observable (theagent always knows where it is) stochastic environment with a Markovian transition model (decisionfor the next state does not depend on previous states) and additive rewards
A Markov-Decision-Process consists of decisions and expected utilities For egress modeling rewardswill influence how a person will move through the ship avoiding a fire for example The rewardsfunction as an incentive for agents to evacuate Next a state represent a small area the actions rep-resent the movement of an individual or the population in this case the rewards could simulate thepain individuals or a population suffers during the evacuation and the transition matrix represents theprobability of moving from state to state choosing certain actions
13 Method proposal 3
Figure 11 Graphical representation of a Markov-Chain with two states
The method will be validated using two validation studies The first study determines the ability foran MDP to differentiate between different designs where the exits are placed at different locations Arecently published article by Kurdi et al [14] investigated this problem By comparing outcomes andconclusions the MDP model can be validated The second study is done by Casaroza [15] which amongother things investigated the influence of passageway configuration on evacuation performance Sim-ilarly a different design aspect is varied to study the influence on personnel movement The secondvalidation study will determine if the MDP is also able to identify critical areas and give the ship designerinformation needed to further optimize and improve the safety of the design
2Literature study
21 RegulationAn evacuation analysis is a method which gives the designer insight regarding the evacuation per-formance of a design For certain ships such an analysis can be mandatory depending under whichflag it sails The international Maritime Organization (IMO) created the Safety Of Life At Sea (SOLAS)convention which stipulates regulations including the assessment of the evacuation performance If acountry has signed this treaty all ships sailing under their flag has to fulfill SOLAS requirements IMOamends the convention on a regular basis and as such the industry has to adapt to new regulationsThe regulations are a starting point to get a better understanding for which ships an evacuation analysisis mandatory why this is mandatory and what the main objective or goals are for these analysis Manyof the evacuation simulation tools are developed with the changes in requirements and the introductionof Circ 909 being a stimuli [9 29ndash32] Therefore this section will describe the regulation regardingevacuation criteria
SOLAS and Fire Safety Systems (FSS) are conventions regulating means of escape for the ships of inter-est These conventions are all setup through IMO Classification societies may have added regulationsof their own to provide additional service for the industry The IMO will be used as the main sourceregarding a mandatory evacuation analysis Different regulatory bodies have their own regulationswhich quickly makes the domain arduous to map Therefore classification societies flag states portauthorities and the such are left out of the scope
The IMO regulations has been used as a basis to determine for which ships an evacuation analysisis mandatory The SOLAS convention was adopted in 1914 in response of the titanic disaster Fourversions followed after the 1914 version these came into force in 1929 1948 1960 and 1974 [33]From then on multiple amendments have been made A distinction is made between amendments andcirculars If a flag state ratifies SOLAS then all amendments are also ratified and should be incorporatedinto law of the flag state Circulars however provide guidelines and additional information and are notmandatory Flag states can choose to ratify certain circulars and make them mandatory for all shipssailing under this flag
211 Safety Of Life At Sea SOLASRegulations tend to be reformed after major disasters After the Herald of the Free Enterprise disaster(1984) and the Estonia disaster (1994) IMO made evacuation analysis mandatory for ro-ro passen-ger ships [34] Both disasters resulted in a great loss of life This evacuation analysis regulation wasimplemented after the 1995 conference of Safety Of Life At Sea rsquo95 expanding regulation 28 to include
5
6 2 Literature study
3 Requirements applicable to ro-ro passenger ships constructed on or after 1 July 1999For ro-ro passenger ships constructed on or after 1 July 1999 escape routes shall be evaluatedby an evacuation analysis early in the design process The analysis shall be used to identify andeliminate as far as practicable congestion which may develop during an abandonment
After consolidated 2014 version as of now there have been 8 amendments which have a date of en-try ranging from 172014 to 112020 These are amendments 365(93) 366(93) 380(94) 386(94)392(95) 395(95) 404(96) and 409(97) The amendments containing regulation changes regardingevacuation is 404(96) Therefore SOLAS consolidated edition 2014 and MSC404(96) are used to cate-gorize the requirements from an evacuation analysis perspective Anything not resulting in a mandatoryevacuation analysis is left out of the scope Only ro-ro passenger ships are required to perform thisanalysis for the consolidated 2014 SOLAS version whereas for regular passenger ships a reference is toa circular This circular is MSC1Circ1533 which contains guidelines on how to perform an evacuationanalysis conform IMO standards MSC404(96) stipulates that other passenger ships constructed on orafter 1 January 2020 should also perform an evacuation analysis Researching which countries ratifiedthe circular has not been done since as of 2020 all passengers ships carrying more than 36 passengershave to perform an evacuation analysis
Regulation 13 - Means of escapeRegulation 13 contains the mandatory evacuation analysis A reference is made to MSC1Circ1533 atthe title of paragraph sect327 Amendment MSC404(96) changed regulation 13 where the mandatoryevacuation analysis was previously defined under paragraph sect74 it is now be defined as given belowThe in bold accentuated sentence parts give an indication of some of the desired objectives of theanalysis
3271 Escape routes shall be evaluated by an evacuation analysis early in the designprocess This analysis shall apply to1 ro-ro passenger ships constructed on or after 1 July 1999 and2 other passenger ships constructed on or after 1 January 2020 carrying more than 36 passen-gers
3272 The analysis shall be used to identify and eliminate as far as practicable congestionwhich may develop during an abandonment due to normal movement of passengers and crewalong escape routes including the possibility that crew may need to move along theseroutes in a direction opposite to the movement of passengers In addition the analysisshall be used to demonstrate that escape arrangements are sufficiently flexible to providefor the possibility that certain escape routes assembly stations embarkation stations or survivalcraft may not be available as a result of a casualty
Safe return to portSOLAS II-221 Safe return to port states that certain ships should be able to return to port after ahazardous event Passenger ships constructed on or after 1 July 2010 having a length of 120 m ormore or having three or more main vertical zones should be able to return to port under its ownpropulsion after a casualty threshold is exceeded This casualty threshold is defined in a context of afire and further described in SOLAS II-2 213 Next to this a list of 14 items are given stipulating systemsthat shall remain operational and hence not be affected by a fire Apart from these systems a safearea should also be incorporated in the design which ensures that the health of crew and passengersare remained Such an area should contain sanitation water food and more basic services [3]
MSC1Circ1533MSC1Circ1533 contains the revised guidelines on evacuation analysis for new and existing passengerships In may 2016 the Maritime Safety Committee approved the guidelines as a guide for making evac-uation analysis The SOLAS regulation are changed to make evacuation analysis mandatory both forro-ro passenger and other passenger ships constructed after 1 January 2020 The guidelines providedtwo different methods The first described method is a simplified analysis and the second method as
21 Regulation 7
a more advanced analysis The aim of the analysis is to compare the performance of the ship withbenchmark scenarios instead of simulating actual evacuation At this moment there is still a lack ofactual verification data and therefore the guidelines are mostly based on data coming from the civilbuilding industry [24] The guidelines suggest for the evacuation analysis on existing passenger shipsto focus on identifying critical areas
Response (R) Travel (T)
125 (R+T)
Embarkation and Launch (E+L)
E + L
3
(max 30 min)
Calculated evacuation duration
Maximum allowable evacuation duration (n)ro-ro passenger ships n= 60 min other than ro-ro passenger ships n = 80 min
Mustering phase
Abandonment phase
Figure 21 Performance standard according to IMO [16]
The performance standard of IMO regarding allowable evacuation durationrsquos are given in Figure 21The mustering phase consist of a response duration (R) and a travel duration (T) After this embarka-tion and launch follows for which the duration is denoted as (E+L) The evacuation durationrsquos specifiedby IMO is based on an analysis of fire risk [16] These durations combined will give an indication ofthe evacuation duration However there can still be a difference between estimated evacuation timesand actual estimation times due to for example inadequate evacuation planning [35]
A minimum of four scenarios should be considered combining primary and secondary cases with dayand night scenarios The primary cases are in accordance with chapter 13 of the FSS code and thecalculation shall be done for each main vertical zone The secondary case will focus on the zones gen-erating the longest assembly duration Additional cases are also presented where the option is givento consider the open deck as an additional public space (case 5) or to analyze the travel duration fromassembly station to the entry point of LSA (case 6) Case 6 should be taken into account if separateembarkation and assembly stations are employed The arrangements should be modified if the totalevacuation duration see Figure 21 does not comply with the allowed duration in order to make thedesign comply Additional information for each method is given below
The simplified method is explain in Annex 2 of MSC1Circ1533 a short method explanation will begiven here The routes corridors and stairways are modelled as a hydraulic network The pipes arecorridors and stairways whereas the doors are modelled as valves There are 5 specific assumptionsgiven First all passengers simultaneously start evacuating Second walking speed depends only onthe density of people and the flow always moves in the direction of the escape route also there is noovertaking Thirdly persons move unhindered Fourthly counter flow is not modelled and is taken intoaccount with a counter flow correction factor Fifthly additional simplifications are taken into accountusing a correction factor and a safety factor For the simplified method the congestion criteria is 35persons per m or greater and difference between inlet and outlet flows is 15 persons per secondFor the advanced method the congestion criteria is 4 persons per m
The guidelines on how to perform an evacuation analysis refer to the Fire Safety Systems (FSS) codeto determine the initial distribution Below the regulation part regarding distribution of persons asdescribed in chapter 13 Arrangement of means of escape [13] Case 2 is taken from resolutionMSC410(97) which will go into force on 1 January 2020 similar with amendment MSC404(96)
8 2 Literature study
21222 Distribution of persons
bull Case 1Passengers in cabins with maximum berthing capacity fully occupied members of the crewin cabins occupied to 23 of maximum berthing capacity and service spaces occupied by13 of the crew
bull Case 2Passengers in public spaces occupied to 34 of maximum capacity 13 of the crew dis-tributed in public spaces service spaces occupied by 13 of the crew and crew accommo-dation occupied by 13 of the crew
212 Alternative Design ApproachAn alternative design approach can be performed if the design does not meet IMO criteria The alter-native design report should provide proof that the design meets the fire safety objectives and reachesan equivalent level of safety This approach is described in SOLAS chapter II-IConstruction - Structurestability Installations II-2 Construction - Fire protection fire detection and fire extinction and IIILife-saving appliances and arrangements Means of escape is governed in chapter II-2 and thus thealternative design approach is elaborated upon in this section
The approach stipulates that documents should be provided which described which part of the designis not meeting the criteria This design part can be for example an area of a space in the ship Nextto this the expected hazard and hazard properties should be defined These describe in detail thepossible ignition sources fire growth potential smoke and toxic generation and potential spreadingFor this system and hazard a required level of safety is defined which is of an equal degree of safety asthe rules The approach requires more time than the prescriptive based approach however the ben-efits could be having more options cost effective design and improved knowledge of loss potential [36]
A reference is given in II-2 for additional information to MSCCirc1002 which give guidelines on al-ternative design and arrangement for fire safety [3] [36] For carrying out an alternative design thedesign team should appoint a coordinator communicate regularly with the Administration determinesafety margins conduct a preliminary analysis in qualitative terms conduct a quantitative analysis anddocument each part
Fire hazards should be defined in detail considering at least pre-fire situation ignition sources initialfuels secondary fuels extension potential target locations critical factors and relevant statistical dataThe fire hazards are grouped in three incident classes namely localized major or catastrophic Whichconsist either of a fire limited to a specific area a fire limited to the ship boundaries or a fire affectingalso the surrounding ships or communities Risk can never be completely eliminated and designersperforming the risk assessment should keep this in mind [36] One aspect of the analysis is to defineperformance criteria The evacuation time can be amongst the criteria which need to be assessed
213 Code of Safety for Special Purpose Ships 2008The Code (SPS) provides international standards for special purpose ships The definition of a specialpurpose ship is that it is a mechanically self-propelled ship which by reason of its function carries onboard more than 12 special personnel Below are some rules taken out given an example when a spe-cial purpose ship is treated as a passenger ship An special purpose ship is not considered a passengership in general because of the assumptions stated in the preamble 4
Special personnel are able bodied with enough knowledge of the layout of the ship and havereceived some training in safety procedures and the handling of equipment that they need notbe treated as passengers
21 Regulation 9
Chapter 6 references to SOLAS II-2 which contains the evacuation analysis regulation In SPS chapter6 it states that
Chapter 6 - Fire Protection
bull 61 For ships carrying more than 240 persons on board the re uirements ofchapter II-2 of SOLAS for passenger ships carrying more than 36 passengersshould be applied
bull 62 For ships carrying more than 60 (but not more than 240) persons on board the require-ments of chapter II-2 of SOLAS for passenger ships carrying not more than 36 passengersshould be applied
bull 63 For ships carrying not more than 60 persons on board the requirements of chapter II-2of SOLAS for cargo ships should be applied
Before amendment MSC404(96) the SPS regulation referred to SOLAS II-2 where SPS ships shouldbe seen as passenger ships An evacuation analysis was only mandatory for ro-ro ships and such ananalysis is not mentioned in the part for passenger ships The change in regulations also makes itmandatory for Special Purpose Ships with more than 240 persons on board to perform an evacuationanalysis This is also stated in IMO [37] under sect14102 rdquoevacuation analysis to be mandatory forspecial-purpose ships carrying more than 240 persons on boardrdquo
214 RemarksFrom IMO requirements the criteria to perform an evacuation analysis is if either the ship is catego-rized as a passenger ship with more than 36 passengers if it is a ro-ro passenger ship or if the ship isa special purpose ship with more than 240 persons on board The International Code for Fire SafetySystems (FSS) has been reviewed but no evacuation simulation is described in this convention Chapter13 Arrangements of means of escape describes the required widths of stairways and hallways Thelongest evacuation time from two cases (day and night) is used The maximum capacity of a space iscalculated by being either equal to the number of seats or similar arrangements or by assigning 2 mof floor space to each occupant
The IMO framework regarding the development of the process from hazard detection is depicted inFigure 22 Some flag state disagreed about taking trim and heel into account [38] Which was eitherdue to lack of statistical evidence on the influence on evacuation or that the loss of stability would onlylinearly affect the evacuation times The focus of an analysis should be rdquoidentify congestion pointsandor critical areas and to provide recommendations as to where these points and critical areas arelocated on boardrdquo [39] In other words only take things you know into account otherwise you risk ofdeviating from the analysis goal
Possible modeling requirements taken from regulations are to be able to
bull Analyze egress in early design stagebull Identify congestion pointsbull Demonstrate escape arrangements to be sufficiently flexiblebull Identify areas of countercross flow
If the design does not meet IMO criteria than an alternative design approach is an option Designersshould provide sufficient proof that the design meets the level of safety and objectives required by IMOand FSS
10 2 Literature study
Casualty detected
Casualty within threshold criteria
Prepare to abandon
ship
Abandon ship into
survival craft
Recovery from survival
craft
Resc
ue to
a p
lace
of s
afet
y
100 ship survivability (indefinitely)
100 ship survivability for a specified period of time
Flooding Fire
Time to remain habitable
(3 hours)
Abandon ship
(30 min)
Time to recover
(5 days)
Ship functions Systems available after a casualty
Yes Yes
No
Return to Port
Figure 22 IMO framework - passenger ship safety Adopted from [11]
22 EvacuationTo evacuate is to move people from a dangerous place to somewhere safe1 Different industries posedifferent environments and hazards and therefore have their own dangerous places and safe areasEach type of hazard creates its own challenges which are different for each industry Proper evacua-tion management is thus a basic requirement in safety concepts [40] In the event of an emergencyeveryone present should be able to move safely from a hazardous location to one of relative safetyThis should also be the primary aim of an egress system where the concept of relative safety is animportant one [41] Relative safety in the sense that it is in-feasible to design a perfect egress systemwhich prevents everyone from being injured or killed [41]
This section will focus on different evacuation aspects in the building industry fixed offshore instal-lations and maritime evacuations In section 21 it became apparent that almost all the data andparameters in the guidelines on the evacuation of ships are based on data derived from the civil build-ing experience [16] Kobes et al [42] also confirmed similarities between ship evacuations and buildingevacuations The most noticeable differences being the ships motions which come into play
Fixed offshore platform evacuation shares similar challenges to ship evacuations since both operatein the same environment The offshore industry deals with a high risk environment Precautions canlimit the chance that an emergency event will occur however the consequences remain enormousFrom the literature it became apparent that offshore industry focuses mainly on risk assessments andhence that is described in further detail The building industry has a variety of different building typeswhich is why different egress strategies are developed for different situations for example one mightconsider the difference in difficulty between evacuating a hospital or a skyscraper
221 Building industryThe ability to successfully evacuate in a dangerous situation in depends on the architectural layout andbuilding components [42] The characteristics of the layout and occupant demographics influencesthe egress strategy An egress strategy is a plan that takes certainties into account when addressinguncertainties in order to attempt to achieve a desired outcome [41] In the building industry egressstrategies are for example protect-in-place relocate to a safe place phased evacuation or simulta-neous evacuation This section will describe some of the egress strategies used in the building industry
Protect-in-place strategies allow for occupants to remain where they are during an emergency Thisstrategy is applied to structures where occupants have a limited ability to move It was developed after
1merriam webster
22 Evacuation 11
terrorists placed a car bomb outside a building and then sounded the fire alarm Relocation to a safearea is a strategy where occupants are relocated within the building to a safe area In some cases it ismore effective to relocate a group within the building rather than to evacuate the entire building Thesetwo strategies could be employed by hospitals or institutional facilities Phased evacuation means firstrelocating occupants who are in immediate danger and letting other occupants who must for the timebeing remain in place For high buildings this strategy is often applied This strategy does not considermultiple simultaneous events instead it assumes that occupants outside the dangerous area are notaffected Simultaneous evacuation would allow all occupants to leave the facility at the same timeduring an event Some of these strategies could also be beneficial in the maritime sector Large cruiseships have diverse passenger demographics and hence care should taken with the evacuation strategy
Next to these strategies designers should also take into account people with disabilities and they shouldincorporate the movement limitations in the egress strategy In Europe 1 in 7 people report havingdifficulty with basic activity [43] A basic activity can be lifting standing walking bending seeinghearing concentrating or remembering Design strategies that take this group into account fall intothree categories Either defend-in-place allowing for evacuation through safe means (for exampleelevators) or implementing procedures to assist this group during emergencies
An egress strategy can be developed from a prescriptive approach or from a performance based ap-proach A prescriptive approach uses a developed code and checks if the performance meets the codecriteria Due to the diversity of buildings and the occupant population one universally accepted maxi-mum evacuation time would not be logical Therefore performance-based approaches were developedto assess hazards and to determine the maximum time available for occupants to evacuate This anal-ysis is more specific to a certain building design Such an approach generally consists of 7 interrelatedsteps
1 Identify project information2 Identify goals and objectives3 Develop performance criteria4 Identify scenarios and select design scenarios and design loads5 Develop candidate design options6 Evaluate candidate design options and select a final design7 Develop final design documentation
A performance-based approach can involve time-based egress calculations this method is the onemost commonly used It involves developing a hazard and estimating the available time assessing theresponse time of occupants to begin egressing and comparing these two times to determine whetherthe occupants can be safely evacuated A key factor in this calculation is to determine when the envi-ronment becomes untenable ie when it becomes incapable of supporting life Therefore untenableconditions need to be defined These conditions are for example thermal exposure inhalation of toxicproducts and visibility limitations
222 Offshore InstallationsEvacuation escape and rescue (EER) plays a vital role in protecting the lives of personnel in the eventof a hazard on a fixed offshore installation platform Most of the casualties in several offshore accidentsoccurred during the EER process[5] The objective of the evacuation system is to leave the installationwithout directly accessing the sea whereas escaping is the process of leaving the installation whenthe evacuation system has failed [11] The general stages of an offshore evacuation are described inMethodology for Hazard Identification on EER Assessments by Health and (HSE) [12] and they can beseen in Figure 23
Espen et al [5] describe the influence that risk influencing factors (RIFs) have on EER operationsHere an RIF is defined as rdquoan aspect (eventcondition) of a system or activity that affects the risklevel of this system or activityrdquo The authors accomplished this by reviewing the Deepwater HorizonEER operations during the disaster of 20th April 2010 and using research obtained from the buildingindustry since these industries share similarities regarding fire hazards Including the human behaviorin modeling EER processes for offshore installations tends to be difficult due to the lack of research
12 2 Literature study
Alarm Access Muster Egress Evacuate Escape Rescue
Detect Choose Access route
Register at muster point
Choose egress route Via bridge By sea Approach
survivors
Interpret Move along access route
Communicate with OIM
Move along egress route by helicopter Directly into
sea Help survivors
Act Receive instructions By sea
1 2 3 4 5 6 7
1
2
3
1
2
1
2
3
1
2
1
2
3
1
2
1
2
or
or
or
Figure 23 EER process as defined by Health and Safety Executive [17]
data available [5]
Hazards on offshore installations can mainly be divided into three categories physical hazards com-mand and control hazards and behavioral hazards These are due to equipment and physical condi-tions poor procedures protocols and communication and hazards attributed to human factors [44]
Human and organizational factors are composed of human factors which is a range of human char-acteristics that influence behavior and organizational factors which are characterized by the tasks ofpersonnel training protocols and the like The influence of design is itemized under the installationRIFs These factors are for example layout materials the size of the installation the distance to themuster area the complexity of escape routes equipment passed and the protection of the musterarea Hazard RIFs depend on the type of hazard and the characteristics affiliated with it as well as theinfluence of the hazard on human perception The hazard can create an untenable environment
223 Marine industryA maritime evacuation starts when the alarm has been sounded and continues until the last personis safe The evacuation process is very complex [11] and it is difficult to evacuate occupants from anenclosure [4] Figure 24 shows the overall process including activities performed by crew Rescueoperations are not included in the process depicted in Figure 24 and this only shows the ship-relatedevacuation activities and the lifeboats-related activitiesThe above figure gives the overall marine evacuation process However from a passenger point of
Manning ofembarkation
station
Preparationof lifeboat forembarkation
(by pax)Embarkation
Launching ofSurvival
Craft
Embarkationcompleted
Decision toAssembly
Boat castsoff
Waiting forRescue
AssemblyPassengers
Assemblycompleted
casualty
Ship Lifeboats
Figure 24 Marine evacuation process copied from [11 Ch2 p 54]
view this process can be divided into two distinct stages the mustering stages and the abandonmentstage [4] The mustering stage consists of mustering all passengers at the designated areas on boardFrom there the passengers can enter the lifeboats that is defined as the abandonment stage Glenand Galea [4] describe the evacuation process as the following enumeration of events this list sharesa similar structure to that described in Figure 23
22 Evacuation 13
Mustering phase Abandonment phase1 Reacting to the alarm 1 Moving as a group to an abbandoment station2 Deciding where to go 2 Deploying life saving appliances3 Retrieving life jackets 3 Abandoning the ship4 Getting to the muster stations
Rescue follows after the mustering and abandonment phase The entire process is also influenced bythe behavior of the passengers on board It is very complicated to predict human behavior duringan evacuation [6] Currently such human behavior is modelled through variation in human attributessuch as walking speed gender or age Nevalainen et al [6] consider human behavior by studying thecognitive process of a person to try to understand the decision-making process
Reacting to the alarm during the mustering phase depends on the day part IMO stipulates this to be 5minutes during the day and 10 minutes during the night [24] Evacuation delays due to reaction timecan be attributed to alarm recognition assessment of relevance threat recognition need for informa-tion and orientation and commitment to other tasks Three types of behavior can be observed afterevacuees hear an alarm Either the evacuee waits for further instructions or for other people to actsearches for additional information to assess the situation or he starts to evacuate immediately [45]Human behavior has not been considered in this research due to the complexity of the matter
Most emergencies on board ships can be classified in six groups [46] These emergencies occur in thecasualty block in Figure 24 More specific emergencies can then be specified under one of the thesemain categories The literature found on evacuation mainly starts with fire being the initial hazardousevent The six categories are
1 Fire2 Damage to the ship3 Pollution4 Unlawful acts threatening the safety of the ship and the security of its passengers and crew5 Personnel accidents6 Cargo-related accidents7 Emergency assistance given to other ships
The evacuability of a ship is defined as the evacuation performance capability [11] Evacuability includesfactors that influence evacuation performance The term is a function of a set of initial conditionsand evacuation dynamics These initial conditions depend on the environment the distribution ofpassengers and the awareness time The evacuation dynamics describe the speed of movementof passengers which is again a function of gender age mobility impairment ship motions and theoverall well-being of the evacuees Factors influencing the evacuability are listed below with the initialconditions and evacuation dynamics in the main categories and the respective sub-factors influencingthese main components listed below
bull Environment (env)ndash Geometryndash Topologyndash Semanticsndash Scenario
bull Distribution (d)ndash Location of people
bull Crewndash Controlling spacesndash Searchingndash Reducing Los Paxndash Re-routing
bull Awareness Time (r)
ndash Initial Reaction Timendash In-situ Reaction Time
bull Speed (s)
ndash Genderndash Agendash mobility Impairmentndash Ship motionsndash Well-Being
14 2 Literature study
Evacuability is a function of the variables as given in the function [11]
119864 = 119891 (119890119899119907 119889 119903(119905) 119904 [119890119907119886119888119901119897119886119899 119888119903119890119908119891119906119899119888119905119894119900119899119886119897119894119905119910119898119900119887119894119897119894119905119910119894119898119901119886119894119903119898119890119899119905119894119899119889119890119909] 119905) (21)
Not all of the above points are available in early ship design This design stage does hold the greatestpotential for improving safety [11] Personnel movement on board a ship is strongly related to layoutdesign or more specifically to the physical arrangement of the ship Issues related to personnelmovement are addressed after ship layout has been finalized and thus this issue can be investigatedwithin the finalized design constraints This results in an inefficient solution to the personnel movements[47]
23 Design231 Early stage layoutThe ship design process can be subdivided in distinct stages Droste et al [48] identifies three majorstages early stage ship design contract design and detail design Only the first stage evaluatesdifferent designs whereas the latter two stages focus on a single design The duration of each stagevaries with ship type and ship complexity Not all ship design follows the same process [49] and there-fore only a general description of the early stage characteristics will be given The latter two detailstages are out of the scope The choice to focus on the early ship design stage is due to the designfreedom This stage is characterized by a still fluent ship design where decisions have major impact onthe ship process and final result [2] An estimated 90 of the decisions which have major impact onfinal design have been made in this stage Later in the project decisions cause design lock-in Designlock-in implies that design aspects are fixed and unchangeable
The early stage can be again subdivided in different sub-stages Andrews [50] identifies three distinctsub-stages for warships which are concept exploration concept studies and concept design van Oerset al [51] describes two distinct sub-stages used by The Netherlands Defence Material Organisation(DMO) which consists of an A-phase (concept exploration) and B-phase (concept definition) Both ap-proaches are used for the design of complex naval warships and are an example how different instancesdefine different design process stages Both approaches start with exploring the solution space consid-ering initial requirements then identify design options to further investigate impact of design choiceson ship function And lastly ensure that sufficient design information is gathered to justify proceedingto the contract stage The process where requirements are evaluated throughout the early stage andare updated according to new gained information is termed Requirement Elucidation by Andrews [49]A critical aspects of the previous three stages is to keep evaluating the functionality of the requirementsand whether or not they should be adjusted
It should be noted that previous described ship design process is also affected by the ship type andlevel of novelty [49] There can be considerable difference between the design process of a specificinnovative ship design and large serie transportation vessels [2] An evacuation analysis has to be per-formed for both highly complex ships such as large cruise ships and special purpose vessels (havingmore than 240 special personnel on-board) and smaller less complex ships such as smaller ferriesIt is considered impractical to perform a review of all design-models -tools and -methods applied tothe various ships described Nevertheless the early design stage for all vessels coincides with themost design freedom and hence design decisions made during this stage affects the final evacuationperformance or evacuability It is therefore of interest to further capture early stage ship design aspects
The relation between design freedom and the different project stages is depicted in the Figure 25The total cost and knowledge of the problem increase while design freedom decreases Choices inphysical layout are made during the early design stage and physical layout relates closely to egressperformance The physical layout aspects which influence egress performance are elaborated in thissection
The layout of a vessel is a function of the ship type and purpose The type and purpose of a shipdetermines the amount location and function of the spaces Ship design varies per ship type and
23 Design 15
RequirementsDefinition
ConceptualDesign
PreliminaryDesign
Detail Design + Manufacturing
100
0
Design Freedom Cost Committed
Knowledge
Figure 25 General design characteristics from Cooper et al [1]
hence categorizing can help understand design impediments [49] For passenger ships the compart-ment type or function can be either that the compartment is used for passenger purposes or crewpurposes Passenger purpose compartments are for example cabins theaters discos casinos andaccommodation Crew purpose compartments are machinery spaces galleys bridge crew cabins andthe such Passenger ships are configuration-driven ships where the layout configuration dominates thevessel performance [48] The layout of special purpose vessel vessels composes of cabins variety ofwork stations depending on ship function workshops recreational spaces and more The geometricaland topological features of the compartments affects the initial population distribution The compart-ment type can also have influence on the response time of evacuees [23] for example the crew couldhave a delay due to safe work termination protocols whereas passengers in cabins do not
As previous described designers should decide the compartment configuration based on requirementsand the ships function The general arrangement design of a passenger cruise or ferry ship startswith the choice in location of public spaces and cabins [52] As such decisions made regarding thespace locations affect various design characteristics such as weight distribution population distributionevacuation performance access and so on This concept is termed rdquostylerdquo by Brown and Andrews [53]and can be defined as
rdquothe combination of whole ship performance metrics and local system metrics groupinginformation form different domains to enable the inclusion of ill-defined knowledgerdquo [52]
Thus style captures overall design characteristics and properties examples of style are configuration robustness operability sustainability survivability and so on Improving survivability has influence on a range of design aspects such as number of bulkheads layout configuration defense systems and more [52] One suggested style is evacuability defining this as a style has not been encountered in literature read Improving the evacuability of a ship will affect a range of different design features such as compartment geometry and topology Casarosa [15] does include personnel movement as a design style which is similar to evacuability except also considering normal operations instead of only focusing on an emergency scenario Two studies which focus on the influence of a design configuration on evacuation performance are highlighted below
The fire safety engineering group at the University of Greenwich in collaboration with University College London conducted project EGO in the 2005-2007 period [54] This project explored the interface between design issues and crew numbers functions and movement issues This was achieved by connecting the design software PARAMARINE-SURFCON with maritimeEXODUS The two designs are given in Figure 26 and were compared using a human metric indicator The analysis was made on a naval combatant with 262 crew A difference in performance was shown between the two designs The designs were evaluated using a Human Performance Metric (HPM) In this case the HPM was calculated using a range of evaluation criteria The evaluation criteria contained both evacuation scenario criteria and normal operation scenario criteria Their study concluded that one single centralized passageway performed better than two parallel passageways
16 2 Literature study
Figure 26 Two naval vessel layouts copied from Casarosa [15]
Choosing the location for exits also influenced evacuation performance Passengers have to decide which exit to use when they can choose between multiple exits Generally they tend to choose a familiar exit or follow other people [14] An imbalance in exit options can cause overcrowding or congestion Kurdi et al [14] examined the influence of exit placement on evacuation in a congested environment Four different arrangements were created exits on one side exits on adjacent sides exits on opposite sides and exits on all sides The outcomes were then compared to evaluate each setup in terms of evacuation performance The authors used a 17x20 square grid where occupants could move in four directions Each grid had a size equal to one square meter each agent could only occupy one grid node and the speed of agents was 1 ms An evacuation strategy was devised using both simulated annealing and Depth-first search to calculate evacuation times Using the depth-first approach it was concluded that placing exits on adjacent sides of beneficial for evacuation performance This approach more closely coincided with pedestrian evacuation in dangerous situations Both Kurdi et al [14] and Casarosa [15] will be used for validating the MDP model
232 Layout and safetyAhola et al [55] identified five safety perception themes ie how passengers perceive safety The themes are life-saving appliances communication emotions other people and architecture The avail-ability of life-saving appliances for example life-vests lifebuoys and the such contribute to a significant part of perceived the safety on board Clear communication from competent-looking officers and other people creates an environment in which the passengers feel safe Lastly the influence of architecture or the environment is primarily perceived through the interaction between passenger and environ-ment This theme coincides mostly with the scope of the literature research and as such is described in more detail
The passenger environment theme is subdivided in architecture and decoration cluster The former is described as the openness of the spaces transparency of the layout and the vertical spaces Passen-gers tend to feel more safe in large open spaces such as the main lobby than smaller spaces such as corridors Which is contradictory with the actual safety of these spaces Large spaces tend to be less safe than smaller narrow spaces This is due to the fact that hazards spread more easily in large areas Staircases and elevators had a large impact on the perceived safety due to these being thought of as impractical Passengers thought the width of staircases to be too narrow causing congestion Designers need to recognize critical properties of the layout and improve these to increase natural navigation in emergency situations [55]
24 Modeling 17
The width and brightness of corridors have influence on the path passenger take during an emergencysituation Passengers prefer to choose a wider corridor over a narrow corridor Similarly they choosea brighter corridor over a darker one The brightness is a more dominant factor in route choice thanwidth when combined [56] Due to design restrictions of the width of corridors Ahola and Mugge [57]researched the influence of vertical height of corridors on perceived safety
These two influences width and brightness of corridors are researched without taking a ship heel intoaccount As one can imagine inclined corridors also influence movement speed and the decision mak-ing process of passengers A summary of research on the influence of deck inclination on movementspeed of passengers is given by Meyer-Koumlnig [31] Not all angles of inclination have been tested duringsafety of participants No significant change in evacuation duration is calculated up to 15 degrees ofinclination [31] Critical deck slopes range between 14 and 39 degrees [58]
24 ModelingThis section describes different computer software used for modeling evacuation on ships First threegeneral descriptors are given which apply to simulation and models in general Since most literaturefound on ship evacuation model uses a more specific categorization criteria these will follow Thepurpose of being able to describe a model from different perspectives will help to get a better under-standing of all models [7]
The three descriptors given by Sokolowski and Banks [7] are scale fidelity and resolution Scale is thesize of the modeled event with respect to space and time Resolution is the level of detail of the spacefor example amount of grid nodes with respect to the size Resolution tends to decrease when scaleincreases due to computer limitations Fidelity describes how closely the model resembles reality Amodel with a high fidelity will resemble reality more closely compared to a model with a low fidelity
Certain decision has to be made when developing a model[18] Some of these decision descriptions aregiven in Figure 27 It should be noted that these decisions descriptions are not necessarily absoluteie either fully microscopic or fully macroscopic model Figure 27 gives an overview of properties ofmodels explained in this chapter Some of the model decisions in Figure 27 return in literature onevacuation modeling The main descriptors in marine evacuation literature are microscopic or macro-scopic models Microscopic models then either utilize a discrete method or continuous method to modelagent movement Evacuation models are often characterized based on the resolution A model with a
deterministic
continuous
general
macroscopic
analytical
first principle models
quantitative
stochastic
discrete
specific
microscopic
numerical
model estimation
qualitative
Figure 27 Model decisions from Gershenfeld [18]
low resolution is called a macroscopic model if the model has high resolution it is called a microscopicmodel In order to model each individual in a microscopic model one has to define the environmentas small discrete geometric elements [11] A mesoscopic model would have sub-models with differentresolutions Mesoscopic models are a combination of microscopic modeling at low level and macro-scopic modeling at high level At the low the level the interaction between agent and environment isdefined whereas at high level the planning of routing is determined [11 32]
18 2 Literature study
In many of the literature on ship evacuation models the fidelity scale and resolution criteria are notmentioned and the models are grouped according to the termmicroscopic mesoscopic and macroscopicmodels [11] Guedes Soares et al [11] and Łozowicka and Czyz [10] both define these three cate-gories Boulougouris and Papanikolaou [9] in addition describe regression-based models route-choicemodels and queuing models Kostas et al [8] categorizes crowd motion models on three approachesbased on a fluid model based on cellular automata model or based on a particle approach
Macroscopic modeling composes of a graph network where arcs represent distances between pointsThis method models the ship layout as a hydraulic network where corridors represent pipes doorsrepresent valves and compartments represent tanks [10] Gas-kinetic models use a gas analogy anddescribe how the flow density and velocity change over time [9] Microscopic modeling takes eachoccupant into account and models the movement of all occupants [10] Microscopic models are thensubdivided in social force models and cellular automata models The difference is that cellular automatamodels are discrete models whereas social force models are continuous The social force model con-sists of a set of definitions how people interact between each other or more specifically define forcesto describe the attraction repulsion or acceleration of the agents These forces define the social fieldsurrounding an agent which mimics a personrsquos internal motivation to react to another person
Three other type of models are described by Boulougouris and Papanikolaou [9] regression modelsqueuing models and route-choice models Regression models predict occupant flow using relationsbetween flow variables Route-choice models use utility maximization to describe occupant movementbetween nodes Queuing models use a markov-chain to describe occupant movement between nodes
241 Building evacuation modelsGwynne et al [59] analyze 16 computer simulation models used in the built environment to modelevacuation At the time being 6 were still under development A distinction can be made by the fun-damental approach used by the models The models can be distinguished by their approach and levelof sophistication Three fundamentally different approaches are identified namely an optimizationapproach a simulation approach and a risk assessment approach Optimization models (2 out of 16models) assume that occupants will evacuate in the most efficient manner possible They do not takenon-evacuation activities into account Simulating models (12 out of 16 models) do take individualbehaviour and movement into account and they try to realistically model the agentrsquos movements Thelast group the risk assessment models (2 out of 16 models) first identify hazards and attempt toquantify the risk By repeating the calculations one can statistically assess the variations in the risk
The models are also distinguishable from the point of view of how they translate the design into a gridnetwork The nodes either represent a small area (fine grid) or a compartment or corridor (coursegrid) It is the choice of grid density that determines whether the model is able to capture individualsor only groups Similarly the models can either define the population from an individual perspectiveor from a global perspective The former allows the designer to assign attributes to each individualThese attributes then influence the decision-making process and therefore also the movement Theglobal perspective defines a population without considering each individual and limits its capability tocapture effects which influence individual occupants
The decision-making process of each individual or group is governed by choice in the behavioural sys-tem Five different systems are identified which define the behaviour of the occupants One can haveno behavioural rule system a functional analogy behavioural system an implicated behavioural systema rule-based behavioural system or an artificial intelligence-based behavioural system These differentsystems determine the individual andor population responses throughout a simulation They further-more determine the interaction between people-people people-structure and people-environmentThis interaction occurs on three different levels psychological sociological and physiological It is aresponse based on the attributes of the individual on the interaction between individuals or the re-sponse is based between an individual and his environment All in all the modeling of human behaviouris complex and to date no model has been able to precisely capture the human behaviour
25 Problem summary and method proposal 19
242 Marine evacuation modelsEach model has four general components which need to be defined [4] These are configuration en-vironmental procedural and behavior aspects Configuration is the translation from layout to modeland within this category the layout is defined Environmental aspects contain all hazards and how theydevelop Procedural aspects cover personnel procedures and define the knowledge of the passengerswith respect to the layout of the ship Behavior aspects defines how passengers react to stimuli Themodels described in this section use different methods to adress these four aspects An example ofevacuation models used in the marine industry are maritimeExodus EVI ODIGO EVDOMON NMRIevacuation simulator IMEX en AENEAS A short description of maritimeEXODUS NMRI evacuation sim-ulator EVI and ODIGO are given below
Glen and Galea [4] describes challenges in evacuation modeling and expands on an already developedevacuation model EXODUS to be also suited for ship evacuation analysis The new model maritime-EXODUS is developed by the University of Greenwich maritimeExodus is a multi-agent based modelwhich consists of five sub-models governing different aspects of the evacuation These are a passen-ger movement behavior toxicity and hazard sub-models The motion of each occupant is determinedby a set of rules of which many are stochastic based This results in a slightly different outcome eachtime the simulation is run [29] maritimeEXODUS is a microscopic model where the layout is discretizedinto a two-dimensional grid
The National Maritime Research Institute (NMRI) evacuation simulator composes of three sub modelsa space model evacuees model and disaster model The space model defines configuration aspectsand is a microscopic model The evacuees model defines the procedure and behavior aspects and doesthis using a social force model to define the interaction between agents The environment aspects aredefined in the disaster model of the NMRI evacuation simulator and can influence the walking speedbased on the outcome of a computational fluid dynamic (CFD) code [60]
The evacuation model EVI is a multi-agent mesoscopic model It uses a social force model at micro-scopic level to define interactions between agents and the wayfinding process is modelled at macro-scopic level The wayfinding is done through a graph representation of the ship layout from whichedges of the graph can be influenced to represent a hazard spreading The agents can be categorizedwithin different groups such as passengers or crew these groups can then been assigned objectiveto influence the movement patterns The objectives are evacuate return to cabin go to a specificlocation search cabins and assign an alternative route The hazard spreading information for exampleis initially not given to the passengers and instead the crew is given the objective to re-route [32]
Boulougouris and Papanikolaou [9] explain the workings of the EVDEMON model which is a multi-agentbased cellular automata model The layout is divided into cells of approximately 40x40cm Each cellcan either be occupied or not and passengers can then move in 8 directions The speed is determinedby limiting the amount of cells an agent can move each time step The way-finding method is basedon A algorithm instead of a shortest path method
Kana and Singer [12] and Kana and Droste [27] proposed an evacuation analysis tool using a ship-centric Markov decision process framework The method makes use of eigenvalue and eigenvectorspectral analysis to assess policy variations First the bellman equation is solved using value iterationto generate series of policies The authors then create a new transition matrix by selecting the optimalpolicy for each epoch By performing spectral analysis on the resulting matrix a better understandingis gained of the dynamics of the modelled system This thesis expands on these two research papers
25 Problem summary and method proposalRecent IMO regulatory changes result in more vessels having to perform an evacuation analysis In ad-dition to ro-ro passenger ships all passenger ships with more than 36 passengers and special purposeships with more than 240 special personnel need to analyze evacuation There is a notable differencebetween passengers and special personnel The latter are occupants presumed to have enough knowl-edge of the ship layout and safety procedures Either population affects the evacuation process which
20 2 Literature study
is of importance to the safety of those on-board Therefore it is of interest to a designer to evaluatethe ship layout from an evacuation perspective Early ship design holds the most design freedom andchanges in layout are more easily implemented during this stage This stage also coincides with ageneral layout and detailed information is not yet available For these reasons a method which is ableto evaluate the design from an evacuation perspective using limited information is neededSimulation can help capture essential features of real-life applications which evolve over time and arehighly complex To simulate is defined in Jensen and Bard [61] as
rdquoto duplicate the dynamic behavior of some aspect of a system by substituting the propertiesof another system for the critical properties of the system being studiedrdquo
There is always some degree of uncertainty involved in real-world systems [7] A ship evacuation issimilarly governed by uncertainties which result in different outcomes each evacuation This is the rea-son why a deterministic multi-agent approach has to be run hundreds of times to ensure all possibleoutcomes have been calculated Each evacuee has to make decisions in order to get to safety whichare uncertain in nature The combination of a stochastic system sequential decision-making and lowinformation availability is the reason to evaluate if a Markov-Decision-Process model has potential tobe used as an evacuation analysis tool
A Markov-Decision-Process is used for a variety of purposes and in a variety of fields It is used forqueuing systems search engines manufacturing models customer classification models inventorymodels and more All of these uses share some common attributes The processes are stochasticand a sequence of decision have to be made The model can help understand how the system beingstudied behaves Kana and Singer [12] and Kana and Droste [27] showed promise in using an MDPfor egress modeling This idea can be extending in creating a tool to help justify design decision andimprove the safety on board ships
3Research method
The method which will be used to assess the design is a Markov Decision Process (MDP) and a MarkovChain (MC) In order to do this the design has to be translated into something which can be used asinput for the MDP The layout has to be discretized into grid nodes which represents small areas Allthese nodes are connected with each other indicating how someone can move between them Forthe following chapters the assumption is made that a person can only move in an up down rightor left direction This configuration is also used by Kana and Singer [12] A grid node can at most beconnected with four adjacent nodes as a consequence of the directional freedom A wall grid node isconnected to no other node and therefore cannot be rsquoenteredrsquo
A Markov decision process is an extension of a Markov chain Both of these methods involve a systemsthat transition between states For example a person can be located in a certain area grid node orstate For this thesis the states are similar to the grid nodes described in the previous paragraph Thearea is not taken into account in both an MDP as MC model In other words the size of a grid node isnot represented by a size in state Therefore it is up to the designer to choose an appropriate size ofthe grid node A second important concept in the two stochastic models are state vectors These vec-tors represent how the system is distributed among the states Or for an evacuation how passengersare distributed among those states The state vector indicates the probability of the system to be in acertain state For example a probability of 02 for state 119894 would mean there is a 20 probability thatthe system is located in state 119894 For this thesis it would mean that 20 of the population is located instate 119894 The method is probabilistic since no actual agents are simulated but probabilities
A third important concept is transition probabilities associated with actions For each state the prob-ability of moving to an adjacent state after choosing a certain action (up down left or right) shouldbe defined The choice in probability highly affects the calculated results Let the transition probabilityof successfully executing the most optimal action be 08 The most optimal action is given by thepolicies This means that if the most optimal action up is chosen in state 119894 the probability of movingto the above state is 8 Or 80 of the population in state 119894 follow the most optimal route Duringan evacuation not everyone follows the most optimal path towards an exit Unclear instructions orpanic can cause people to egress in a non efficient way These transition probabilities represent thisnon-efficient behavior The following section describes the two methods in more detail
31 Markov-ChainA Markov-Chain can describe how a stochastic system with different states changes Such a chainconsists of states and probabilities to move from one state to another This thesis only considersMarkov-Chain with a finite amount of states The set of all states is called a state space At eachepoch or time step the system changes stochasticallyThe variables indicating the probability to movefrom state 119904 to 119904 are defined in the transition matrix 119872 (Equation 31)
21
22 3 Research method
119872 = [119898 119898 ⋯119898 119898 ⋯⋮ ⋮ ⋱
] (31)
For this example the probability is given by element 119898 The size of this matrix is therefore 119899x119899 Eachrow represents the current state and the each column represents the next state The state vector 119904indicates the probability of being located in a certain state and is given by Equation 32 The initial statevector is denoted as 119904 Each row in 119872 sums up to one which is an Markov-Chain property Similarlythe sum of all elements in the state vector 119904 sums up to one The probability of being located in the next(time) step 119904 is then calculated by multiplying the transition matrix with the state vector (Equation 33)
119904 = [119904 119904 ⋯ 119904 ] (32)
119904 = 119904 119872 (33)
32 Markov Decision ProcessA Markov decision process is a Markov chain including actions and (discounted) rewards Actions 119860(119904)can be chosen at each state These actions result in gained rewards (119877(119904)) The transition matrix isdenoted as 119875(119904 |119904 119886) and contains the probability of ending up in a certain next state 119904 after choosingan action 119886 from a current state 119904 A short description of an MDP is given by [28] which states
A Markov decision process is a sequential decision problem for a fully observable stochasticenvironment with a Markovian transition model and additivediscounted rewards It consistsof a set of actions 119860(119904) states 119904 with an initial state 119904 a transition model 119875(119904 |119904 119886) and areward function 119877(119904)
A sequential decision problem is a problem where the utility depends on a sequence of decisions Utilityis a measure of preference over a sequence of decisions Fully observable states that an agent alwaysknows where it is And Markovian means that the probability of reaching the next state only dependson the current state No previous sequence of visited states will change the probability of moving tothe next state
A solution to the above problem is called a policy A policy is denoted with 120587 where 120587(119904) denotesthe action recommended by policy 120587 for state 119904 The optimal policy is denoted with 120587lowast which is apolicy which yields the highest utility The objective is therefore to find a policy which if followedyields the highest utility for a sequence of decisionsactions A policy indicates the optimal action anevacuee should take to reach an exit Policies are based on distance to nearest exit discount factorstate rewards exit reward
To calculate the utility of a sequence one can look at the preceding states This can be done by additiverewards where the utility of a sequence equals the sum of all the rewards of the sequence states Adiscount factor 120574 can be used when less value is placed on rewards received in the future The utilityof a sequence becomes a discounted version of the additive rewards when adding a discount factor 120574
bull Additive rewards
119880 ([119904 119904 119904 ]) = 119877(119904 ) + 119877(119904 ) + 119877(119904 ) + (34)
bull Discounted rewards
119880 ([119904 119904 119904 ]) = 119877(119904 ) + 120574119877(119904 ) + 120574 119877(119904 ) + (35)
The discount factor is a number between 0 and 1 and it determines how much value is placed onrewards gained in the future A discount of 1 reduces the discounted rewards function (Equation 35)to an additive reward function (Equation 34) People tend to prefer rewards immediately over futurerewards For the model this means that immediate safety is preferred over future safety Thus a dis-counted rewards function is used
33 Solution Markov Chain 23
The set of decisions 120587 and the utilities of a state 119904 are given by Equation 36 and Equation 37 from[28] The bellman equation states that the utility of a state is the reward of the current state plus theexpected discounted utility of the next state The assumption is that the optimal action will be chosenThe choice of policy is the argument of the maximum expected utility
119880(119904) = 119877(119904) + 120574 maxisin ( )
sum119875(119904 |119904 119886) 119880(119904 ) (36)
120587(119904) = argmaxsum119875(119904 |119904 119886) 119880(119904 ) (37)
The bellman equation can be solved with a value iteration algorithm or policy iteration algorithm Fornow only the value iteration algorithm will be discussed The value iteration initializes by setting theutilities of all states to zero (119880(119904) = 0) Then the bellman equation is used to find the expected utilityfor each action An intermediate step is done to create a quality matrix which calculates the utility perstate per action Lastly the action yielding the maximum utility is chosen for each state From thesesteps a new utility vector containing the maximum utilities for each state is created This new utilityfunction will be used for the next iteration replacing the previous utility vector This is iterated untilthe new utility vector barely differs from the previous utility vector The difference between currentand previous utility can be calculated and a threshold defined to end the loop [28]
33 Solution Markov ChainThe optimal policies indicate what an agent should do in each state in case the objective is to maximizeutility The rewards gained at an exit and lost at each state can be thought of as a level of safety Haz-ards have a large negative reward and reduce the safety of occupants Occupants are safe when an exitis reached hence exit states contain a positive reward value All other states contain a negative reward
The MDP solution consisting policies indicating which action to choose for each state can be used tocreate a Markov Chain Using the Markov Chain an simulation can be run indicating how the populationevacuates The same probabilities as used by the MDP are used by the Markov Chain which denotethe probability of moving in a certain direction If in state 119904 the optimal policy is to move towards theadjacent state 119904 then the Markov Chain matrix has an element value of for example 119898 = 8 Thismeans that an agent in for example state 119904 will move with a probability of 8 towards state 119904 Adifferent interpretation would be if 100 of the population is located in 119904 then after one epoch 80will have moved towards state 119904 This last interpretation is used in this thesis
The action certainty value represents to what extend policies are followed This is demonstrated witha simple 1111990911 grid where all policies point in the same direction An agent has been placed in themiddle state of one side of the room (15) The agent follows the optimal policies which point to theother side of the room Figure 31 show the probability of an agent being in a state after some timeOnly the probabilities of a single row is plotted and the row which is plotted increases with each timeIn other words at 119905 = 1 row 1 is plotted and at 119905 = 119899 row 119899 is plotted The higher the action probabilitythe more likely an agent follows the optimal policies
24 3 Research method
1110987
Time and state row
6
Action certainty of 07
05
02
11 410
04
9
State
8 3
Pro
babi
lity
7
06
6 25
08
4 3 1
1
2 1
1110987
Time and state row
6
Action certainty of 08
05
02
11 410
04
9
State
8 3
Pro
babi
lity
06
7 6 25
08
4 3 1
1
2 1
1110987
Time and state row
6
Action certainty of 09
05
02
11 410
04
9
State
8 3
Pro
babi
lity
7
06
6 25
08
4 3 1
1
2 1
Figure 31 Influence of action probability variation on direction uncertainty of evacuee The figure illustrates what the probabilityof ending up in a certain state is if the policy would be to move in a straight line The red line indicates the policy directionWith an uncertainty of 07 the probability decreases each time step with 07 for the agent to remain heading in the most optimaldirection
34 Marine aspect of the MDP341 Determining the initial distribution of an early ship layoutThe FSS code can be used as a starting point to determine the initial distribution of passengers through-out the layout To incorporate the regulation into the initial distribution an estimate of the amountof passengers or crew is needed per deck or a passenger-crew ratio is required The latter would besufficient because the MDP uses a probability distribution instead of a deterministic distribution of thepopulation Table 31 gives an overview of crew and passenger distribution as stipulated by FSS [13]
Case 1 Case 2Space type Passenger Crew Passenger CrewPublic spaces 0 0 34 13Accomodation 1 23 14 13Service spaces 0 13 0 13
Table 31 Overview of FSS regulation regarding the distribution of persons for case 1 (night) and case 2 (day)
342 Translating layout to modelThis section briefly explains how a layout is translated to a grid suitable for Matlab An arbitrary layoutis used for this section and the next subsection 343 The layout does not need to contain detailedinformation because the model is used during early stage ship design The layout used for the nextexample is the Pride of America Layout found on the website of the Norwegian Cruise Line1 The MDPprocess starting with a simple layout and ending with the optimal policies is visualized in Figure 32A short description for each step is given below
1 A layout containing compartment locations and type walls and stairs is used This layout ispreferred to be an early stage layout However for this thesis a final layout is used because ofthe difficulty in obtaining an early stage ship layout
2 A figure of the layout is loaded in Excel An identifier is used for each cell within figure bor-ders These identifier determine the state properties The identifiers and definitions are given inTable 32
3 Matlab imports the Excel file and uses predefined numbers to identify each cell location and typeAn additional Excel file is used for defining each compartment type This is used to create theintial state vector
1httpswwwnclcomfrencruise-shippride-of-americadeck-plans
34 Marine aspect of the MDP 25
Cell number Definition[empty] Area each evacuee can be located in1 Wall(s)2 Exit state(s)3 Hazard(s)12 Service space13 Public space14 Accommodation
Table 32 Excel Cell identifiers
4 The MDP model calculates all utilities and policies for each state using the value iteration algorithm
1 2 3 4
Figure 32 Intermediate Matlab model steps
343 Influence of scale on model complexityLittman et al [62] describes different methods of solving an MDP and explains the complexity of solvingsuch a problem The different solving methods (linear programming policy iteration and value itera-tion) are explained in more detail in the literature The value iteration method is used for this thesis tosolve the MDP The Matlab code for the value iteration is provided in section A3 The running time ofthis algorithm is a function of the amount of states and actions The big-O notation is used to classifyalgorithms based on the running time For the value iteration the running time for each iteration is119978(119860119873 ) The amount of actions 119860 is kept at 4 for this thesis The amount of states depends per layoutand is thus the only variable influencing the running time per iteration
26 3 Research method
The running time and amount of iterations determine how long it takes to find the optimal policiesA way of stopping the algorithm is by applying a stopping rule This stopping rule determines eachiteration the residual between previous and current iteration If this residual gets below a certainthreshold the iteration stops However for the thesis it was noticed that in order to compare utilitiesbetween different layouts the amount of iteration should be the same Therefore a maximum amountof epochs was chosen which ensured that the optimal policies were found which is heavily influencedby the distance between the exit and the state furthest away
For the following section the same layout is used as given in Figure 32 which was thought sufficientlylarge to verify an MDP capability to model a deck of a ship The deck consisted of 6275 statesexcluding walls since these nodes would not be used Matlab was used for the following calculationsImporting the deck and translating the Excel file to an array takes 4 seconds The value iteration witha maximum amount of iterations of 200 epochs takes 193 seconds The value iteration running timeis proportional to the maximum amount of iterations Regarding the memory usage only 29 GB ofmemory was used of the 73 GB memory available It was concluded that for this thesis the MDP modelwill be not computational intensive2
344 Choice of horizonThe amount of decisions an evacuee is given to reach an exit is also governed by the maximum amountof epochs the value iteration gets to calculate the amount of policies If there is no fixed epoch limitor the value iteration is run until convergence then the horizon is infinite If only a limited amount ofepochs is chosen limiting the value iterations ability to calculate the optimal policy then the horizon isfinite Therefore the choice whether there is a finite or infinite horizon can influence the solution Forthis thesis all simulations were performed with a infinite horizon It does not matter how far you arelocated from an exit eventually you will be able to reach one
The algorithm was stopped when it was observed that the calculated optimal policies were not changinganymore If this was not the case then some areas could not have sensed an exit and were thereforeunable to determine which policy was best Figure 33a gives an example with a finite horizon Thesolution did not converge because of the amount of iterations was limited In addition the bordersof areas which are solved are highlighted These borders indicate the dividing line between policiesleading to an exit and policies which do not Figure 33b shows an example where the solution isconverged An infinite horizon is assumed because passengers tend to know where exits are locatedThis is due to evacuation drills on-board ships evacuation plans and general knowledge of a vesselAn infinite horizon means the iteration algorithm will stop when an optimal policy is found for eachstate A finite horizon can be used to identify isolated areas
-05
0
05
1
(a) Example of solution with finite horizon in this case 20epochs
-1
-05
0
05
1
(b) Example of solution with infinite horizon
Figure 33 Example how the horizon choice determines whether or not all evacuees were able to reach an exit Such a plot alsocan show which areas are difficult to reach The color intensity denotes the utility values of each cell
2Calculations were performed on a laptop with Intel i5-3210M CPU and 8192 MB RAM
35 Performance metrics 27
35 Performance metricsThe following sections will further elaborate upon chosen metrics to evaluate the design These metricswill be used to evaluate a design in validation studies in chapter 4 and chapter 5 The utilities andpolicies are a product of the MDP model The utilities will be assessed based on the distribution andthe policies are used for the Markov Chain simulation From this simulation the time it takes for thepopulation to reach an exit can be found In addition how the population is distributed among theexits can be calculated Finding the maximum occurring probability for each state can indicate whichareas are more likely to congest Below the utility distribution exit usage and maximum probabilityoccurring plots are further clarified
351 Utility distributionThe final utility distribution is used to determine the optimal policies At each state the optimal policywill indicate which action to take to maximize utility The utilities are a function of the reward in thecurrent state and a discounted expected utility in the adjacent state as given by the Bellman equation(Equation 36) The rewards are the same for each state and are negative to create an incentive foran evacuee to move towards an exit where a larger positive reward is given The utility distributioncan give insight in the effectiveness of a design in order to compare different layout configurationsThe mean 120583 is used to asses how well exits are distributed throughout the ship A high mean indicatesthat on average each state is close to an exit The standard deviation 120596 is used as an indication howmany states are close to an exit
119891119903119890
119902119906
119890119899
119888119910
119891119903119890
119902119906
119890119899
119888119910119891
119903119890119902
119906119890
119899119888119910
119891119903119890
119902119906
119890119899
119888119910
119880119905119894119897119894119905119910 119880119905119894119897119894119905119910
119880119905119894119897119894119905119910119880119905119894119897119894119905119910
1 2
3 4
uarr 120583 rarrlarr 120590
darr 120583 rarrlarr 120590
uarr 120583 larrrarr 120590
darr 120583 larrrarr 120590
Figure 34 Four different utility distribution extremes The number below each graph indicates the order of performance
Whether a small or a large standard deviation is preferred depends on the mean value 120583 If the meanis high then a small standard deviation means that many states are located near an exit If the mean islow then a small standard deviation means that many states are far away from an exit The differentcombinations are given by Figure 34 The numbers indicate the order of preference It should benoted that the initial distribution also affects how well exits are placed Including the initial populationdistribution in the utility distribution plot would place more value on crowded areas close to an exitThis idea is further explained in chapter 8 but is left out of the scope of this thesis
352 Exit convergence behaviorFrom the simulation the final population distribution among the exits is given Plotting the state vectorelements representing the exit nodes for each iteration gives a plot as given in Figure 35 Each of thethree lines represents an exit The steepness of this curve indicates how quickly evacuees enter anexit node The difference between the exits converged probability indicate whether the population isequally spread over all exits All exits consist of a single state and hence share the same geometricproperties The figure can provide the naval architect with information regarding which exits are mostcritical
28 3 Research method
119875119903119900
119887119886
119887119894119897
119894119905119910
119872119900119907119890119904
1
2
3
95 119898119886119903119896
Figure 35 Example of the exit convergence plot
Figure 35 indicates that exit 1 is most used and exit 3 least used The sum of the converged values ofall exist equals 1 or 100 A 95 mark is given for the exit convergence plot to get a variable whichcan be used to compare different layouts This mark indicates when almost all of the population hasreached an exit It could be that the last 5 represents the part of the population performing a searchand rescue or a part of the crew performing a final sweep
353 Maximum occurring probabilityConcatenation of the state vectors for each epoch creates the Markov-Chain simulation matrix as givenEquation 38 Each row represents an epoch each column represents a state From this matrix themaximum occurring probability for each state can be found This maximum value indicates the mostbusy or congested moment during the simulation These values are found by taking the maximumvalue of each column in Equation 38 Plotting the maximum values can indicate where possible con-gestion occurs An example of such a plot is given in Figure 36 This figure shows the top view of adeck of a frigate The top figure shows the layout where gray nodes indicate walls white nodes arestates and red nodes are the exit states From this figure it can be seen that in this particular casecongestion will most likely occur aft of the two exits The color bar indicates the percentage of thepopulation located in a state
119872 = (
119904 hellip 119904119890119901119900119888ℎ ∶ 1 119904 hellip 119904119890119901119900119888ℎ ∶ 2 ⋮ ⋱ ⋮119890119901119900119888ℎ ∶ 119905 0 hellip 119886
) (38)
0
001
002
003
004
005
006
007
Figure 36 Example plot with the top figure indicating the layout and the figure below plotting the maximum occurring proba-bilities for each state
4Validation study 1 influence of exit
configuration
41 GoalIt can be of interest to a designer to vary certain design aspects and analyze the impact the variationshave on the design performance A measurement for performance could be as also used in SOLAS theevacuation time Thus the influence of certain design decisions on evacuation time can be of interestto a designer There is limited literature describing the relationship between the location of the exitsand evacuation performance [14]
The previous chapter explained the MDP framework and how this can be used to simulate egress Thischapter will compare the MDP with a study done by Kurdi et al [14] The author evaluates for a simplesquare layout different exit configurations on evacuation performance The goal is to validate the MDPmethodology by comparing conclusion drawn on a simple layout with authors conclusions
42 Paper summaryKurdi et al [14] analyzed the influence of exit location configuration on evacuation time and how thepopulation is distributed among the exits This was done using both a Depth-First-Search (DFS) as aSimulated Annealing (SA) method The four layouts which were used are given in Figure 41 Eachlayout consists of a 17x20 grid and is divided in four quadrants The width and height of each gridnode is 1 meter similar to the width of an exit Two different population sizes were used one with50 pedestrians (N=50) and one with 100 pedestrians (N=100) Each individual had four actions tochoose from similar to the MDP framework The simulations were run 100 times where each time thepopulation was randomly distributed throughout the layout For each simulation four wall grid nodeswere randomly placed throughout the layout This was done to describes how pedestrians have tomake a decision regarding an exit including obstacles in their way
1 2 3 4 1 2
3
4
3
4
1
2
1 2
3 4
(a) One side (b) Adjacent sides (c) Opposite sides (d) All sides
Figure 41 Four different layouts created by Kurdi et al [14] the red box denotes an exit Four walls are randomly placedthroughout the grid for each layout Note The layouts are not symmetrical
29
30 4 Validation study 1 influence of exit configuration
The metrics used to evaluate each setup are the calculated evacuation time and percentage of crowdsat the exits The evacuation time is calculated using the amount of evacuees using exit 119894 (119899 ) thewidth of the exit 119894 (119870 ) and the speed of each pedestrian 119869 given by Equation 41 The percentage ofcrows at exits is calculated with Equation 42 using the amount of evacuees from exit 119894 and the totalnumber of pedestrians 119873 Results show that the DFS method is able to model evacuation behaviormore realistic than the SA method Next having exits on adjacent sides of the room performed forboth 119873 = 50 and 119873 = 100 worst Locating the exits on all sides resulted in the best performance
119899119870 + 119869 (41)
119899 100119873 (42)
43 MDP ResultsIn order to assess each layout a Markov-Chain was created using the MDP policies (section 33) Theinitial distribution as described in the paper is used as the initial state vector As described earlierauthors had to run 100 simulations with different population sizes in order to get realistic results Thisis not necessary for the MDP model due to the ability to distribute an arbitrary large population evenlyamong the layout This can be achieved by allocated to each state a population size equal to 1 dividedby the state space size The state space size equals 119899 = 17lowast20minus4 = 336 Therefore this case assumeseach state has a probability of being occupied by a pedestrian by one divided by total amount of statesThe discount factor which is kept constant for all calculations done in this chapter is 09 This valueinfluences the histogram which is used to assess exit location efficiency Changing the discount factorwould not affect conclusions drawn from the histogram No variable discount factor was used becausethe objective is to the proposed methodology with existing research The stationary MDP solution wasused for to construct the Markov-Chain
Let the desired direction probability be defined as a way of incorporating uncertainty in the behaviorof an agent This value influences if all agents move most optimally towards an exit or how muchthey deviate This value is used to construct the MDP transition matrix 119875(119904 |119904 119886) It determines theprobability of moving in the desired direction see section 33 for a more detailed explanation
431 Exit usageResults are given in Figure 42 Figure 43 and Figure 44 Which are in similar order regarding the119873 = 50 119873 = 100 and 119873 = 336 cases These plots indicate how the population is distributed amongthe exits If the lines are more close to each other the exits are more evenly used In Figure 44bexit 1 is most used In other words this design would place a higher toll on exit 1 To indicate whenthe majority of the population has reached an exit a 95 threshold mark has been added for eachplot The layout with exits on all sides converges the fastest for each population size Indicating thatthis design the most evenly and effectively placed exits
An overview of the results is given in Figure 45 A short description of the results is given for eachpopulation size and method The SA method has the least deviation between final exit population dis-tributions This method distributes the evacuees most evenly over each exit Kurdi et al [14] concludethat in real evacuations the population rarely is distributed evenly among the exits and that thereforethe DFS method can simulate pedestrian movement more realistic Regarding the 119873 = 50 case thedifference between the MDP and other methods for this population size is the largest It should benoted that the exits are not placed evenly across the sides of the layout There are 3 nodes betweenthe wall and exit 1 4 nodes between exit 1 and exit 2 4 nodes between exit 2 and exit 3 3 nodesbetween exit 3 and exit 4 and 2 nodes between exit 4 and the wall The amount of nodes betweenwall-exit1 exit1-exit2 exit2-exit3 exit3-exit4 exit4-wall for 119873 = 50 is 4-3-2-4-3 whereas for 119873 = 100it is 3-4-4-3-2 Also regarding the layout with exits on adjacent sides for a population of 119873 = 50 theamount of nodes between the wall and exit 1 is 4 Whereas for the population 119873 = 100 it is 6There are similar deviations between the 119873 = 50 and 119873 = 100 cases for layout with adjacent sidesand also for the layout with exits on all sides Thus no concise conclusion can be drawn between the
43 MDP Results 31
0 10 20 30 40 50
Moves
0
005
01
015
02
025
03
035
04
Pro
babi
lity
(a) Exits on one side
95 in 24 moves
0 10 20 30 40 50
Moves
0
005
01
015
02
025
03
035
04
Pro
babi
lity
(b) Exits on adjacent sides
95 in 23 moves
exit 1 exit 2 exit 3 exit 4 95 mark
0 10 20 30 40 50
Moves
0
005
01
015
02
025
03
035
04
Pro
babi
lity
(c) Exits on opposite sides
95 in 17 moves
0 10 20 30 40 50
Moves
0
005
01
015
02
025
03
035
04
Pro
babi
lity
(d) Exits on all side
95 in 14 moves
Figure 42 Exit convergence results for each layout for N=50
0 10 20 30 40 50
Moves
0
005
01
015
02
025
03
035
04
045
Pro
babi
lity
(a) Exits on one side
95 in 24 moves
Exit 1 Exit 2 Exit 3 Exit 4 95 mark
0 10 20 30 40 50
Moves
0
005
01
015
02
025
03
035
04
045
Pro
babi
lity
(b) Exits on adjacent sides
95 in 24 moves
0 10 20 30 40 50
Moves
0
005
01
015
02
025
03
035
04
045
Pro
babi
lity
(c) Exits on opposite sides
95 in 17 moves
0 10 20 30 40 50
Moves
0
005
01
015
02
025
03
035
04
045
Pro
babi
lity
(d) Exits on all side
95 in 15 moves
Figure 43 Exit convergence results for each layout for N=100
0 10 20 30 40 50
Moves
0
005
01
015
02
025
03
035
04
Pro
babi
lity
(a) Exits on one side
95 in 24 moves
0 10 20 30 40 50
Moves
0
005
01
015
02
025
03
035
04
Pro
babi
lity
(b) Exits on adjacent sides
95 in 22 moves
Exit 1 Exit 2 Exit 3 Exit 4 95 mark
0 10 20 30 40 50
Moves
0
005
01
015
02
025
03
035
04
Pro
babi
lity
(c) Exits on opposite sides
95 in 16 moves
0 10 20 30 40 50
Moves
0
005
01
015
02
025
03
035
04
Pro
babi
lity
(d) Exits on all sides
95 in 14 moves
Figure 44 Exit convergence results for each layout for an evenly distributed population across the grid
119873 = 50 and 119873 = 100 cases since layouts were not similar However there can be still something saidbetween the different layout types in other words which layout performed best
432 Utility distributionThe layout are also evaluated by analyzing the MDP utility distribution in addition to the exit analysisdone above The distributions are plotted in a histogram in Figure 46 including the mean and standarddeviation per layout The utility for each state is a function of the distance to an exit the state rewardsand the discount factor The rewards and the discount factor are kept the constant Therefore theutility will be a function of distance between the state and the nearest exit The exits for the layoutwith exits on all sides is most evenly spread out over the design A high mean utility value is preferredindicating the average state is in the vicinity of an exit
32 4 Validation study 1 influence of exit configuration
N=50
Exit 1 Exit 2 Exit 3 Exit4 Exit 1 Exit 2 Exit 3 Exit4 Exit 1 Exit 2 Exit 3 Exit4 Exit 1 Exit 2 Exit 3 Exit4SA 243 244 252 260 247 255 241 256 243 257 247 254 245 252 253 249
DFS 301 224 212 243 386 160 120 335 268 236 250 245 246 240 257 257
MDP 259 175 201 366 391 153 165 292 370 259 144 227 242 288 203 267
N=100
Exit 1 Exit 2 Exit 3 Exit4 Exit 1 Exit 2 Exit 3 Exit4 Exit 1 Exit 2 Exit 3 Exit4 Exit 1 Exit 2 Exit 3 Exit4SA 255 250 259 248 248 225 244 252 250 250 246 253 255 251 247 247
DFS 302 230 230 248 419 154 116 311 276 253 222 250 249 258 254 239
MDP 306 292 190 213 462 119 158 262 190 241 231 339 231 269 268 232
N=332
Exit 1 Exit 2 Exit 3 Exit4 Exit 1 Exit 2 Exit 3 Exit4 Exit 1 Exit 2 Exit 3 Exit4 Exit 1 Exit 2 Exit 3 Exit4MDP 285 207 204 304 392 192 136 280 292 237 214 258 252 235 232 281
Opposite All
One Adjacent Opposite All
One Adjacent Opposite All
One Adjacent
Figure 45 Percentage of crowds at exit for each method and all layouts table results
Exits on one side
-1 -05 0 05 1
Utility
0
20
40
60
80
Fre
quen
cy
Exits on adjacent sides
-1 -05 0 05 1
Utility
0
20
40
60
80
Fre
quen
cy
Exit on opposite sides
-1 -05 0 05 1
Utility
0
20
40
60
80
Fre
quen
cy
Exits on all sides
-1 -05 0 05 1
Utility
0
20
40
60
80
Fre
quen
cy
mean 02600 03313
mean 00616 03826
mean 03474 02460
mean 03882 02044
Figure 46 Histogram of the calculated utilities for each layout
44 ConclusionThe DFS method will be used for the comparison since authors stated that pedestrians tend to adopt aDFS approach when choosing exits It is therefore assumed that the DFS approach yields the highestfidelity Having exits on all sides results in the smallest standard deviation of exit loads for bothpopulation sizes The standard deviation and the mean of the utility distribution is used to evaluatehow evenly the exits are distributed as explained in section 35 The layouts ranked from best to worstperformance based on utility distribution is exits on all sides opposite sides adjacent sides one sideThe population distribution among the exits for both 119873 = 50 and 119873 = 100 are given in Table 41 andare ranked from smallest standard deviation to largest standard deviation
The DFS 119873 = 50 and 119873 = 100 rank layouts in similar order the same order is concluded from the119873 = 336 MDP case Only for the MDP 119873 = 50 and 119873 = 100 cases is the order slightly different Thisis due to the MDP only simulating 1 out of the 100 population distributions which was based on theexample layout given in by [14] The population was not evenly distributed throughout the layout forthe example layout given by the author The top left quadrant contains twice as many pedestrians as
44 Conclusion 33
N=50 N=100 N=336Rank of smallest 120590 DFS MDP DFS MDP MDP
1 All All All All All2 Opposite One Opposite One Opposite3 One Opposite One Opposite One4 Adjacent Adjacent Adjacent Adjacent Adjacent
Table 41 Order from lowest standard deviation (1) to highest deviation (4) Indicating which design distributes pedestriansmost evenly amongst the exits
the bottom left quadrant for the layout with exists on opposite sides Resulting in the majority of thepopulation egress to exit 1
Having exits on all sides always ranked best having exits on adjacent sides always ranked worst Sincethe MDP is an probabilistic method which does not need to model each agentpedestrian individuallythe 119873 = 336 would give a similar solution as the 100 simulations done by Kurdi et al [14] The119873 = 336 case concludes the same as the DFS cases In other words a designer would come to thesame conclusion (using the percentage of crowds at exits) which layout configuration performed bestusing either method
The evacuation time could not be calculated using the MDP method Only the amount of epochs afterwhich the solution is converged A 95 threshold is added to Figure 42 Figure 43 and Figure 44 Atthe moment the epochs cannot be thought of as a time unit because there is no population size perstate threshold defined This means that in essence a large portion of pedestrians could be located inone state which is unrealistic Therefore no evacuation time is calculated for the MDP case Howeverlisting the layouts in order of evacuation time for the DFS method and in order of epochs in MDP cansay something which layouts evacuate the fastest This conclusion can be seen in Table 42 and bothDFS 119873 = 50 and 119873 = 100 arrive at the same conclusion The MDP method identifies similar best andsecond-best layouts only the third and fourth performing layouts are in a different order
DFS (N=50) DFS (N=100) MDP (N=336)1 all all all2 opposite opposite opposite3 one one adjacent4 adjacent adjacent one
Table 42 Comparison of the evacuation time
The percentage of crowds at exit are slightly different between MDP and DFS however the conclusionare the same The MDP method was not able to calculate similar evacuation times as the comparisonstudy However the identified best and second-best layouts based on convergence speed coincidedwith those identified by Kurdi et al [14] In conclusion the MDP-model was able to assess a simplelayout with different exit configurations on evacuation performance Also the model can distinguishlayouts based on how quickly the simulation converges and how well population is distributed amongthe exits
5Validation study 2 influence of
passageway configuration
51 GoalFour objectives are defined for the second validation study will focus on validating the MDP-model withfindings from project EGO [15 54]
1 To recreate the early stage designs used by project EGO and identify discrepancy between themodels
2 To compare identified critical areas of the MDP-model with project EGO
3 To compare conclusions drawn from MDP-model with project EGO
4 To conclude the MDP-model capacity to differentiate between two designs from evacuation per-spective
First a summary is given of project EGO and which metrics the authors used to measure how wella design performed Secondly a sensitivity study is done to conclude which input parameters arejustified for the MDP-model Thirdly the MDP-model results are presented And finally conclusionsand discrepancies are elaborated upon
52 Paper summaryProject EGO aims to understand the relationship between ship design and crew movement identifyKPIrsquos to assess this relationship link evacuation software with design software and demonstrate themodel capability The first goal of project EGO coincides partly with the main question of the thesiswhich is how a design affects egress performance and therefore project EGO is deemed suitable tovalidate the MDP-model Project EGO is performed by the fire safety engineering group in collaborationbetween the university of Greenwich University College London Directorate of Sea systems and theUnited Kingdomrsquos Ministry of defense
The design used for the analysis is a frigate type-22 with a complement of 262 The vessels has 8decks and a overall length of approximately 146 meter a maximum upper deck beam of 1475 meterand a draft of 475 meter Two different frigate designs are compared with each other and are given inFigure 51 Only two of the eight decks were different between the two frigate designs Three differentresolutions were used for the comparison study a low- medium- and high-resolution layout Thesedifferent resolutions reflect different stages in ship design where different layout information is avail-able The low-resolution model represents an early stage layout and for example lacks the locationof furniture in the cabins
35
36 5 Validation study 2 influence of passageway configuration
The paper makes use of a two different software models and evaluates different designs for differentscenarios on a range of performance metrics The software used is PARAMARINE ndash SURFCON for shipdesign and maritimeEXODUS for evacuation modeling An explanation how the latter model works isgiven in subsection 242 In short the model takes each evacuee individually into account whereeach individual has properties that influence its behavior The software is also capable of assigningindividual agents different goals for example search for survivors
Each simulation is done for different scenarios which reflect vessel operations Seven different evalua-tion scenarios were defined both for normal operations (4) as emergency scenarios (3) The scenariosperformance was measured using a Human Performance Metric (HPM) Only the emergency scenariosare evaluated for this study due to the other scenarios being out of the scope of the thesis Theemergency scenarios are
bull ES1 Crew moves from normal day location to emergency station
bull ES2 Crew moves from emergency station to muster station
bull ES3 Crew moves from action station to muster station
For each scenario a weighted HPM was calculated This metric is the sum of the normalized perfor-mance metric multiplied by a weight factor 18 performance metrics were defined which are dividedin 2 congestion criteria (C1 and C2) 5 general criteria (G1 to G5) and 11 geometric criteria (M1 to M3M5 M8 M13 to M18) and are listed in Table 52 All criteria greyed out are considered not calculableby the MDP-model as of yet Some criteria are also not viable for early ship design since not all designcharacteristics are known For example the location of the watertight doors can still be unknown to thedesigner thus the amount of times an evacuee has to open a watertight door is deemed incalculableduring early stage
Only the results of the early stage calculations are given The medium- and detailed-layouts are out ofthe scope of this thesis The results of the low-resolution model are given in Table 51
Evaluation scenarioScenarioweight BL VR1
Difference betweenbaseline and variant 1
ES Normal day cruising A 1 3875 4355 -124ES Normal day cruising B 1 4619 4561 13ES Action stations evacuation 1 4593 4080 112
Overall performance of design 3703 3730
Table 51 Scenario scores for emergency scenarios copied from Casarosa [15] chapter 4 - Table 447
The NOP-scenarios are excluded from the table the overall design performance is based on the above three scenarios Results are given in Table 51 and show that the variant 1 (V1) design performed slightly better than the baseline (BL) design ES involves movement of crew from their normal day cruising locations towards the emergency stations The baseline model outperformed variant 1 by 124 for C but 112 worse for C Only for the normal day cursing B do both layouts perform almost equally
Variant 1 model outperforms the baseline model if the normal operation scenarios are also considered This is because the variant 1 design performed better on the normal operation scenarios Casarosa [15] was able to identify congestion locations and by adding an additional ladder the congestion could improved The baseline model improved significantly after this improvement was realized However these improvements were only applied to the high-resolution model and not for the low-resolution model
1The metric Time to reach final state is assumed to the equivalent of the MDP model metric amount of epochs until convergence
53 Model aspects 37
HPM performancemetrics Definition
Congestioncriteria
C1the number of locations in which the population density exceeds 4 pm2for more than 10 of the overall scenario time
C2the maximum time that the population density exceeded the regulatorymaximum of 4 pm2 for 10 of the simulation time
GeneralcriteriaG1 average time required to complete all operationsG2 average time spent in transitionG3 time to reach final state1
G4 average time spent in congestionG5 average distance travelledGeometriccriteriaM1 the number of WTD used during the scenarioM2 the number of hatches used during the scenarioM3 the number of ladders used during the scenarioM5 the number of doors used during the scenarioM8 the number of times the FG moved between decks
M13average number of components used per member of the FGduring the scenario
M14 most times a wt door was operatedM15 most times a hatch was operatedM16 average number of doors used per personM17 average number of wt doors per personM18 average number of hatches used
Table 52 List of performance metrics used for calculating HPM All metrics that the MDP-model is currently not capable ofcalculating are greyed out
53 Model aspectsFirst all different aspects are discussed which affect the results for example there was some dis-crepancy between input of both methods Similarly comparing a detailed microscopic method witha macroscopic model also decreases model resemblance These differences are highlighted and theexpected influence on results are discussed Six design aspects will be elaborated upon and its effectson the results are discussed
1 Layout2 Choice in amount of actions3 Amount of decks and exit type4 Choice in discount factor and state rewards5 Initial distribution6 Designated emergency stations
The layout aspects consider problems resulting from translating a continuous design to a discretizedgrid Resolution is lost in this process The aim is to minimize the difference between the MDP layoutand project EGO layout Since the grid size impacts model resolution the size should be reasonableFor each grid an agent can either go in 4-directions or 8-directions maritimeEXODUS gives agents8-directions of freedom while the MDP-model only 4 hence this contrast can have implications in con-clusions drawn maritimeEXODUS also enables agents to move between decks whereas this is not yetimplemented in the MDP-model Both models implement a nearest exit strategy
38 5 Validation study 2 influence of passageway configuration
531 LayoutFour different layouts were given by [54] which are used for this validation study The discretizationof the layout to a graph network used by the MDP method is discussed in this section Deck number1 for the baseline design is modelled with a grid size of approximately 1119898 and one with 06119898 Thepolicy and utility distribution is plotted and shown in Figure 52 A discount factor of 095 is used andaction certainty probability of 09 These values are kept constant for all following calculations A highdiscount factor means more value is given to rewards received in the future A high action certaintyprobability means evacuees follow the most optimal policies with a high probability It is assumed thatcrew on a frigate will most likely traverse the optimal path to an exit
Figure 51 Example layout drawn in Rhinoceros with the passageway figure covered on top
Utility and policy plot for epoch for = 095
-1
0
1
(a) Grid size of approximatelyUtility and policy plot for epoch for = 095
-1
0
1
(b) Grid size of approximately
Figure 52 Policy and utility plot for no1 BL for two grids with different resolutions
The color intensity in above figures is a function of the amount of nodes until an exit is reached theaction probability and the discount value The exit states have a utility of 1 and have the lightest colorDark regions are furthest away from an exit Adjacent grid nodes where policies result in different exitsindicate a dividing line between two areas Each area will rsquomost likelyrsquo end up at a different exit Thesedividing lines influence exit convergence behavior
The exit convergence behavior for all layouts is plotted in Figure 53 and indicate the percentage orprobability of the population that has reached an exit state node Also a 95 mark has been added in-dicating when the majority of the population has reached an exit For the 1119898 -grid this mark is reachedafter 24 time-steps whereas for the 06119898 -grid it reaches this mark after 40 time-steps which is 67slower However the difference is inversely proportional to the grid size The convergence rate isrelative to the grid size the same for the both grids
The difference in exit for the same exits is caused by the difference in dividing line locations Ascan be seen in Figure 52 not all of these locations are similar An example where the location of thedividing line can affect the exit behavior is given in Figure 54 If the green line is a doorway all agents
53 Model aspects 39
0 10 20 30 40 50 60 70
Steps
0
005
01
015
02
025
03
Pro
babi
lity
Exit convergence rate for solution Markov Chain
95 reached an exit
0 10 20 30 40 50 60 70
Steps
0
005
01
015
02
025
03
Pro
babi
lity
Exit convergence rate for solution Markov Chain
95 reached an exit
Exit 1 Exit 2 Exit 3 Exit 4 Exit 5 95 mark
Figure 53 Exit convergence behavior for no1 BL for (left) and (right)
in the compartment will egress to the right If the red line is a doorway all agents will egress to the leftThese situations are more likely to occur with lower resolution models Therefore some compartmentsend up in a different exit for 06119898 in Figure 52 With a higher resolution grid this sensitivity can bereduced and thus a resolution of approximately 06119898 is used for the validation study
Figure 54 Example with an arbitrary layout where the compartment exit location choice influences results
532 Choice of actionsThe software used by project EGO for evacuation analysis is maritimeEXODUS The agents are able to move in 8 different directions in maritimeEXODUS and 4 directions in the MDP model This difference could cause a difference in results It is assumed that more directional freedom does not necessarily change a persons egress behavior Only a quicker convergence is expected since diagonal movements are more efficient unless this is accounted for If unaccounted for the agent will cover 41 more distance when choosing the diagonal action compared to a non-diagonal action This has to be com-pensated in the software to even out with transverse and longitudinal action directions The added value of 8-directional freedom did not outweigh the increase in accuracy of results The goal is to differentiate between designs and identify critical areas It is assumed that the difference in results will remain the same whether 4 or 8 directional freedom is used
533 Amount of decks and exit typemaritimeEXODUS is capable of linking each deck with adjacent decks The frigate consists of 8 decks and the two different designs only vary for two decks Casarosa [15] modelled all decks and defined for all exits the specific exit type Each type determines the speed and amount of passengers able to transit the nodes [15] Staircase or ladder types used by maritimeEXODUS and SURFCON are given in the list below
bull Internal and external stairs
ndash Connects deckndash Connects with outside
40 5 Validation study 2 influence of passageway configuration
bull Vertical ladders
ndash Horizontal hatch with vertical ladderndash Emergency exit with vertical ladder
Vertical ladders consists of 3 elements 1 ladder transit node and 2 free space nodes Stairs aredefined by a series of nodes between the two decks Based on the height between the decks and thestep height the software program automatically calculates the number of steps and therefore statesfor each stairway The MDP-model has no decks connected with each other and models each deckindividually It is assumed that the emergency stations are located above deck No1 and No2 Nextwhen agents will move straight towards the emergency stations and thus do not leave exit nodes atdeck No1 and No2 Based on this assumptions it was not deemed necessary to connect the decksAnalyzing each deck individually is assumed sufficient However it is noted that crew using a certainexit on the deck below will affect how quickly crew can escape on the deck above Due to crowdingwithin the staircase No flow restrictions are incorporated in the MDP-model
534 Choice in discount factor and state rewardsThe input of the MDP-model has influence on the results and therefore on the conclusions drawnfrom this validation study This section will describe why a certain discount factor and state rewardis chosen In order to do this a utility histogram is plotted for layout No1 BL to show the influencethe state rewards and discount factor have on the utility distribution The utility distribution is used todetermine all policies Figure 55 indicates that higher state rewards will shift the peak to the rightincrease the frequency of the peak and lowers the standard deviation
Discount = 1 reward = -005
-1 -05 0 05 1Utility
0
100
200
300
Fre
quen
cy
Discount = 1 reward = -004
-1 -05 0 05 1Utility
0
100
200
300
Fre
quen
cy
Discount = 1 reward = -003
-1 -05 0 05 1Utility
0
100
200
300
Fre
quen
cy
Discount = 095 reward = -005
-1 -05 0 05 1Utility
0
100
200
300
Fre
quen
cy
Discount = 095 reward = -004
-1 -05 0 05 1Utility
0
100
200
300
Fre
quen
cy
Discount = 095 reward = -003
-1 -05 0 05 1Utility
0
100
200
300
Fre
quen
cy
Discount = 09 reward = -005
-1 -05 0 05 1Utility
0
200
400
Fre
quen
cy
Discount = 09 reward = -004
-1 -05 0 05 1Utility
0
200
400
Fre
quen
cy
Discount = 09 reward = -003
-1 -05 0 05 1Utility
0
200
400
Fre
quen
cy
003 052
023 042
042 031
-015 036
-015 040
008 032
-002 026
-017 030
-009 028
Figure 55 Histogram for layout no1 bl with three different discount factors (1 095 and 09) and three different state rewards(-005 -004 and -003)
A discount factor of 095 and state rewards of -004 is used for further computations The high discountfactor is due to crew having knowledge of the layout of the vessel These values result in a histogramwhere the layout differences are captured in variations of the histogram parameters
535 Initial distributionThe emergency scenarios are based on the Naval Ship Code which are rules published by the NATOas Allied Naval Engineering Publication 77 Chapter VII ndash Escape Evacuation and Rescue describesthe rules necessary to meet the goals of said chapter These goals are described by regulation 0 andensure that the design shall
53 Model aspects 41
11 provide effective escape for all embarked persons from all manned spaces to a place of safetyin the event of foreseeable accidents and emergencies at least until the threat has receded12 provide an effective means of evacuation from the ship 13 provide an effective means ofrecovering persons from the sea
Regulation 3 of chapter VII of the Naval Ship Code stipulates the evacuation analysis and demonstra-tion rules Alternative to these rules the naval administration may accept the use regulation from avalidated classification society international conventions or a suitable validated alternative approachThe international convention approach is described in section 21 the alternative approach describedin subsection 212
The analysis described in the Naval Ship Code is similar to the analysis described by IMO in Circ1533only with few exceptions These exceptions are described in VII ndash regulation 3 ndash paragraph sect 8 Theexceptions are regarding the evacuation target times range of watertight integrity conditions and aminimum of 6 scenarios is to be considered The initial distribution of persons should be represen-tative for the vesselrsquos operations The initial distribution of crew is not given by the validation studyand whether a distribution based on different operations is used or based on the FSS is unknownHowever it is stated that the scenarios do not accurately model actual naval operations Therefore adistributed crew in compliance with FSS code is used and is assumed to be sufficiently representable
Since no compartment information is given and therefore the function of each compartment is un-known a best guess is made based on location and size The assumed function for each compartmentfor each deck is given in Figure 56 The compartment type will be used to create an initial distributionTable 31 is used for ratio of crew for each space type
A minimum of four scenarios should be considered regarding the distribution of persons on board asstipulated by Circ1533 [24] see subsection 211 Since it is unclear whether the vertical zones aredefined in early stage only two cases are simulated For the night case (case 1) 23th of the crew islocated in accommodation spaces and 13th of the crew is located in the service spaces For the daycase (case 2) 13th the crew is evenly distributed among the public spaces the accommodation spacesand the service spaces The initial distribution table with the assumed compartment types and amountof states belonging to each type is given in Table 53 The percentage of a certain compartment typecompared to total states is given in Table 54 The final layout used with all compartment allocated toa specific type is graphically plotted in Figure 56
Compartment type LayoutNo1 BL No1 V1 No2 BL No2 V1
Wall 1674 1532 2640 2416Corridors 423 628 587 884Exits 5 5 6 6Service spaces 334 299 823 790Public spaces 323 303 281 257Accomodation 130 122 118 102
Table 53 Number states for each layout type
Compartment type Compartment type states total statesNo1 BL No1 V1 No2 BL No2 V2
Service space 42 42 67 69Public space 41 41 23 22Accomodation 17 17 10 9
Table 54 Ratio of compartment type with total amount of states
42 5 Validation study 2 influence of passageway configuration
Layout No1 Baseline
Layout No1 Variant 1
Layout No2 Baseline
Layout No2 Variant 1
Figure 56 Assumed compartment type Blue denote service spaces orange denote public spaces and green denote accom-modation spaces
536 Designated emergency stationsThe emergency scenarios each have their own initial distribution and final destinations for each crewmember However this information is not given An assumptions is made that each crew membermoves in an upward direction towards the deck above him Emergency stations should be located nearembarkation stations [63] which are assumed to be located above the decks given in Figure 51
54 MDP resultsPrevious section described the influences of the model aspects on the outcome and conclusions Theconclusion from previous section will serve to justify input for the MDP-model for the validation studyThe action certainty is 09 the discount factor is 095 the state rewards -004 and the exit reward 1This reflects a crew following optimal evacuation policies with high accuracy and valuing future safetyover immediate safety No hazards are modelled and therefore all states have the same negativereward The layout used is given in Figure 57 below The compartment types are given in Figure 56
Layout No1 Baseline
Layout No1 Variant 1
Layout No2 Baseline
Layout No2 Variant 1
Figure 57 Project EGO layouts translated in MDP program gray indicates walls white are states red is an exit state Exits arenumber from aft to forward in ascending order
The amount of epochs used for solving the Bellman equation see Equation 36 is 100 This valueensures all states in the layout are reached by the value iteration algorithm This also ensures that ifa random state is chosen and the policies are follow an exit is found If less epochs are chosen thenstates which are a distance equal to amount of epochs away from exits are not reachable or agents donot have enough time to move towards an exit This is shown in Figure 58 below
It also becomes apparent which region is furthest away from the exits or is most isolated An anima-tion plot of the value iteration gives insight which areas are difficult to reach after how many epochseach state is reached and after how many epochs the solutions remains the same The solution tendsto not change much after all states are reached some policies keep alternating between two actionshowever these will not change the final solution The isolated regions in combination with the initialdistribution influence the convergence behavior for all the exits
54 MDP results 43
Utility and policy plot for epoch = 20
-05
0
05
1
Figure 58 Snapshot of the value iteration algorithm for layout No1 baseline after 20 iterations showing the area which hasfound a solution and which area has not Red indicates the dividing line between the two areas
The final utility and policy plot for all decks are given in Figure 59 and Figure 510 All exit states arebright yellow and the states furthest away dark blue Therefore dark regions indicate remote areas ofthe layout and occupants located there take longest to reach an exit From these figure it can also beseen which compartments egress to which exits by following the policies
No1 BL
-1
-05
0
05
1
(a) Utility and policy plot for No1 BLNo1 V1
-1
-05
0
05
1
(b) Utility and policy plot for No1 V1
Figure 59 Policy and utility plot for no1 BL for two grids with different resolution
No2 BL
-1
-05
0
05
1
(a) Utility and policy plot for No2 BLNo2 V1
-1
-05
0
05
1
(b) Utility and policy plot for No2 V1
Figure 510 Policy and utility plot for no1 BL for two grids with different resolution
44 5 Validation study 2 influence of passageway configuration
541 Exit convergence resultsThe exit convergence behavior for case 1 (day) and case 2 (night) have been plotted in Figure 511and Figure 512 The final convergence values for both figures are given in Appendix A Table A1 andTable A2 A 95 mark has been added to indicate after how many epochs the majority of evacueeshave reached an exit This mark is also used as a performance metric to compare the designs Bothdesign variants show similar convergence results for deck No1 night case Exit behavior for exit 1 and2 is also in accordance with Figure 58 where it can be seen that crew located furthest away egressto these exits Therefore these exits converge slowest First a comparison between layouts for eachdeck is given after that a comparison between the day and night cases is give
Deck No1 outperformed deck No2 for both layouts as well as the cases This is due to deck No1 beingsmaller in size and better placed exits and therefore evacuees have to on average traverse less dis-tance towards exits There is a difference of 20 (or 7 moves) between the baseline decks and 63(or 26 moves) between the variant 1 decks In addition the population evacuating deck No1 is dis-tributed more evenly amongst the exits indicating that the exits of deck No1 is better distributed thandeck No2 regardless of passageway configuration Whether this difference in population distributionamongst the exits is beneficial depends on the staircase capacity The exit usage should relate to thestaircase capacity however for this study the exits capacity or staircase capacity is assumed to beunknown
0 10 20 30 40 50 60
Moves
0
01
02
03
04
Pro
babi
lity
Case 1 Exit convergence rate - No1 bl
95 reached an exit after 36 moves
0 10 20 30 40 50 60
Moves
0
01
02
03
04P
roba
bilit
yCase 1 Exit convergence rate - No1 v1
95 reached an exit after 41 moves
Exit1 Exit2 Exit3 Exit4 Exit5 95 mark
0 20 40 60 80
Moves
0
01
02
03
04
05
06
07
08
Pro
babi
lity
Case 1 Exit convergence rate - No2 bl
95 reached an exit after 43 moves
0 20 40 60 80
Moves
0
01
02
03
04
05
06
07
08
Pro
babi
lity
Case 1 Exit convergence rate - No2 v1
95 reached an exit after 67 moves
Exit1 Exit2 Exit3 Exit4 Exit5 Exit6 95 mark
Figure 511 Exit percentage with distribution based on FSS - case 1
The bottleneck exits or slowest converging exits for case 1 are exits 1 and 2 For case 2 exit 1 isconverging the slowest for all layouts This indicates that isolated areas are near exits 1 and 2 whichis at the aft of the vessel The wavy exit 1 curve at deck No2 for the variant 1 layout is caused bydifferent regions of the layout reaching an exit at different intervals Each compartment has its owncumulative probability and the larger the room the larger the impact all evacuees have on exit conver-gence behavior when they reach an exit The steepness is determined by the rate of crew reachingan exit A more steep curve indicates a higher amount of population percentage per epoch that arriveat an exit A steep curve could indicate possible congestion at that exit In reality the steepness islimited since there exists a maximum amount of persons per time unit that can enter an exit
54 MDP results 45
0 10 20 30 40 50 60
Moves
0
01
02
03
04
Popu
latio
n pe
rcen
tage
Case 2 Exit convergence rate - No1 bl
95 reached an exit after 36 moves
0 10 20 30 40 50 60
Moves
0
01
02
03
04
Popu
latio
n pe
rcen
tage
Case 2 Exit convergence rate - No1 v1
95 reached an exit after 41 moves
Exit1 Exit2 Exit3 Exit4 Exit5 95 mark
0 20 40 60 80
Moves
0
01
02
03
04
05
06
Popu
latio
n pe
rcen
tage
Case 2 Exit convergence rate - No2 bl
95 reached an exit after 43 moves
0 20 40 60 80
Moves
0
01
02
03
04
05
06
Popu
latio
n pe
rcen
tage
Case 2 Exit convergence rate - No2 v1
95 reached an exit after 67 moves
Exit1 Exit2 Exit3 Exit4 Exit5 Exit6 95 mark
Figure 512 Exit percentage with distribution based on FSS - case 2
The least used exits coincide with the isolated exits from the initial distribution point of view The population is most dispersed during the day case where 13th of the crew is located in each space type This results in a more evenly distributed population among the exits as can be seen from the re-sults A comparison between the standard deviations of the final exit distribution is given in Appendix A Table A3 The same approach as Casarosa [15] has been used to normalize the results and sum them to get an overall score However due to the limited amount of performance metrics it is uncertain how usable this metric is If layout configurations are compared on exit distribution then the variant 1 layout outperforms the baseline model for case 1 deck No1 and case 2 deck No2 The baseline layout outperforms variant 1 regarding convergence speed for deck No1 (5 epoch difference) and significantly outperforms for deck No2 (24 epoch difference) There is no difference in convergence speed between day and night cases There is a difference between exit usage which is expected since population is distributed differently
95 mark reached after movesLayout case 1 case 2No1 BL 36 36No1 V1 41 41No2 BL 43 43No2 V1 67 67
Table 55 Amount of moves per layout per case
46 5 Validation study 2 influence of passageway configuration
542 Utility histogramThe utilities distribution for 100 epochs for each layout have been plotted in a histogram in Figure 513These distribution indicate how close each state is to an exit and therefore it can assess the layoutThe choice in state reward and discount factor have a tremendous influence on these results as hasbeen discussed in subsection 534 These variables are kept constant for each deck which gives thepossibility to compare each layout with each other
No1 BL
-1 -05 0 05 1
Utility
0
100
200
300
400
500
Fre
quen
cy
No1 V1
-1 -05 0 05 1
Utility
0
100
200
300
400
500
Fre
quen
cy
No2 BL
-1 -05 0 05 1
Utility
0
100
200
300
400
500
Fre
quen
cy
No2 V1
-1 -05 0 05 1
Utility
0
100
200
300
400
500
Fre
quen
cy
-012 037
-003 038
-025 039
005 036
Figure 513 Utility frequency plot
A high mean utility value indicates all states are relatively close to an exit Therefore a high mean represents a layout where exits are more evenly located The baseline layouts have the highest mean compared to the variant 1 layout The upper decks have both also a higher mean compared to the lower decks Which is probable since the lower decks (No 2) have a higher amount of states per exit than the upper decks The average amount of states per exit values are 242 for No1 BL 270 for No1 V1 301 for No2 BL and 338 for No2 V1
The standard deviation indicates how many state utilities deviate from the mean A high standard deviation indicates many states deviate from the mean a low deviation means the opposite A low standard deviation coincides with a larger amount of isolated compartments than a high standard dis-tribution The latter indicate large amount of evenly distributed compartments given that the discount factor and state rewards are equal for both comparison designs see Figure 34 From this perspective a high mean is preferred over a low mean therefore the baseline performs better than the variant 1 A high standard deviation is preferred over a low standard deviation if the mean is low If the mean is high than a low standard deviation is preferred indicating that a lot of compartments are located close to an exit The difference of the standard deviations between the baseline and variant 1 model is small
543 Maximum probability occurring during simulationThe MDP-model uses a transition matrix and initial state distribution matrix to simulate the evacuation of crew Each iteration involves multiplying the previous state vector with the transition matrix to get the new distribution If the state vectors for each iteration are concatenated to create an additional so-lution matrix then for each state the maximal occurring probability can be found This value indicates that at some point during the simulation a certain amount of crew occupied that state Congestion could be identified using this value as a metric which is a function of crew and state geometric prop-erties
Congestion is defined as a certain amount of persons per square meter [16] For the SOLAS simplified approach the criteria is 35 persons per m whereas for the advanced approach it is 4 persons per m Casarosa [15] used 4 persons per m since the approach utilized by maritimeEXODUS is an advanced
54 MDP results 47
approach The following figures uses a congestion criteria of 35 persons per m since the MDP-model is an early stage simplified model (agents are not modelled individually)
The frigate has a complement of 262 crew members but the distribution has not been given An indication of the distribution is given with table D-2 and D-3 from Casarosa [15] These tables give results of the blanket search scenario for the low resolution model Counting crew for each deck results in 30 crew members for deck no1 and 70 crew members for deck no2 Resulting congestion threshold values are given in Table 56
Deck Crew Congestion thresholdTotal[-]
Single[] [persm2] [ state]
No1 30 333 35 7No2 70 142 35 3
Table 56 Congestion threshold parameters
Case 1 Max probability plot - No1 Baseline
Case 1 Max probability plot - No1 Variant 1
0
001
002
003
004
005
006
007
008
Popu
latio
n pe
rcen
tage
Figure 514 Maximum probability occurring for each state is plotted per layout the congestion threshold is 007
Case 1 Max probability plot - No2 Baseline
Case 1 Max probability plot - No2 Variant 1
0
0005
001
0015
002
0025
003
0035
004
Popu
latio
n pe
rcen
tage
Figure 515 Maximum probability occurring for each state is plotted per layout the congestion threshold is 007
48 5 Validation study 2 influence of passageway configuration
Case 2 Max probability plot - No1 Baseline
Case 2 Max probability plot - No1 Variant 1
0
001
002
003
004
005
006
007
008
Popu
latio
n pe
rcen
tage
Figure 516 Maximum probability occurring for each state is plotted in a single layout The congestion threshold is 003
Case 2 Max probability plot - No2 Baseline
Case 2 Max probability plot - No2 Variant 1
0
0005
001
0015
002
0025
003
0035
004
Popu
latio
n pe
rcen
tage
Figure 517 Maximum probability occurring for each state is plotted per layout the congestion threshold is 007
55 Additional damage caseIt is probable that a damage occurred causing the initialization of an evacuation Only considering evacuation cases without any damage that affects personnel movement seems insufficient A better understanding of the evacuation performance can be gained by evaluating ship designs and consider-ing multiple probable scenarios Casarosa [15] defined both evacuation scenarios as well as normal operation scenarios to create an outline of different situations that may occur during the operational life of the ship However no damage scenarios were considered to the author of this thesis knowledge A damage that disables a stairwell or blocks a passageway could occur during an evacuation The result is that the certain flight options are eliminated and evacuees have to take alternative escape routes These variations to the normal evacuation also affects the evacuation performance of the two designs The assessment of scenario deviations helps better understand design adaptability or escape arrangement flexibility Analyzing escape arrangement flexibility is one of the objectives of performing an evacuation analysis as described by IMO guidelines [24] These variations should also be taken into account to better judge each design on its egress performance
Thus an additional damage case has been defined to demonstrate the escape arrangement flexibility of both designs Which in turn reduces uncertainty in conclusions drawn on evacuation performance of both layouts ergo which performs best Only deck No2 will be investigated in more detail since this deck seems to be most critical Various damage cases could be considered Examples are blocking a part of the passageway which could be caused by a fire or by removing an exit from the layout to simulate a case where one staircase is obstructed The design redundancy and adaptability can be outlined by performing a range of damage cases Each of these scenarios can help gain insight in how and where a design can be further improved However this is not the goal of this section This section will demonstrate the MDP-model capability to assess a damage case
55 Additional damage case 49
The damage case to further assess layout redundancy will be a case where the most critical exit isblocked or obstructed from use The worst performing deck is deck No2 where exit 1 was deemedmost critical Results of the damage case are given in Table 57 and plotted Figure 518 The maximumoccurring probabilities are given in the appendix see section A2 Congestion only occurred for thebaseline model Two areas can be identified for the night case where population percentage exceeded3 per state the states are colored red where this exceedance occurs Throughout the variant 1 layoutthe population percentage remained below the threshold Hence the variant 1 layout outperformedthe baseline model regarding possible congestion This can be a result of the availability of multipleroutes towards an exit for the parallel passageway configuration
Baseline Variant 1Metrics Case 1 Case 2 Case 1 Case 2120583utility -021 -035120590utility 047 04195 mark 82 92
Percentageof populationat exit
2 0847 0596 0807 05443 0062 0062 0074 00994 0016 0267 0023 02615 0055 0055 0064 00646 0020 0197 0014 0014
Table 57 Summary of results for the damage case
0 20 40 60 80 100 1200
02
04
06
08
1
Pro
babi
lity
Case 1
95 reached an exit after 82 moves
0 20 40 60 80 100 1200
02
04
06
08
1
Pro
babi
lity
Case 1
95 reached an exit after 92 moves
0 20 40 60 80 100 120
Moves
0
02
04
06
08
1
Pro
babi
lity
MovesCase 2
95 reached an exit after 82 moves
0 20 40 60 80 100 120
Moves
0
02
04
06
08
1
Pro
babi
lity
MovesCase 2
95 reached an exit after 92 moves
Exit2 Exit3 Exit4 Exit5 Exit6 95 mark
Baseline Variant 1
Figure 518 Exit percentage results when exit 1 is removed for deck No2
Results show that the baseline layout having a single passageway throughout the ship still outper-forms the variant 1 layout The population distribution among the exits are almost equal for bothlayouts The majority of the crew has evacuated after 82 epochs for the baseline layout and after 92epochs for the variant 1 layout This is an increase of 82 minus 43 = 39 epochs for the baseline layoutand 92 minus 67 = 25 epochs for the variant 1 model Indicating that the variant 1 model evacuation timeonly increases by 27 whereas the baseline layout increase by 90 There is no difference betweenspeed of convergence between day and night case
50 5 Validation study 2 influence of passageway configuration
Exit 3
Exit 3
Exit 4
Exit 4
Exit 5
Exit 5
Exit 6
Exit 6
Exit 2
Exit 2
Case 1 Initial distribution 50 line Case 2 Initial distribution 50 line
Removing exitBaseline deck No2
Variant 1 deck No2
Figure 519 Layout areas that indicate which part of the population will evacuate to the nearest exit Two lines are addedindicating the dividing line 50 of the population is located left of this line
Figure 519 shows the layout areas where population will egress towards a certain exit The exit thecrew will move to according the MDP model are the red states in each area Two boundary lines areplotted for both layouts which split the population in half This is done for both cases to indicate thatmore than half of the population is located aft of exit 2 Which results in exit 2 being the most used exit
0 10 20 30 40 50
Moves
0
01
02
03
04
05
06
07
08
09
1
Pop
ulat
ion
perc
enta
ge
Deck No1
0 20 40 60 80 1000
01
02
03
04
05
06
07
08
09
1
Pop
ulat
ion
perc
enta
ge
Deck No2
c1 baseline c1 variant 1 c2 variant 1
0 20 40 60 80 100
Moves
0
01
02
03
04
05
06
07
08
09
1
Pop
ulat
ion
perc
enta
ge
Damage case (Deck No2)
c2 baseline
Moves
Figure 520 Comparison of percentage of population reaching an exit state for both decks and additional damage case
Lastly Figure 520 shows for both decks and the additional damage case the total percentage of thepopulation that has reached and exit per epoch No difference in convergence speed was noticedbetween day and night cases However Figure 520 does show different evacuation behavior betweenthe day and night cases which is expected since there is a difference in initial population distributionSudden changes in the graph indicate that a large group of the population has reached an exit Theparallel passageway configuration has a property that has not been further investigated yet The crewcan always reach all the locations in the vessel when a damage that blocks the passageway occurs inthe parallel passageway part of the vessel This is not the case for the single passageway design crewwill then have use a different to go around the blockage This design feature should be consideredwhen evaluating which design performs best
56 Conclusion and Discrepancy 51
56 Conclusion and DiscrepancyThe intention of performing an early stage ship design evacuation analysis is to gain better insight in design performance [15] The International Maritime Organization identifies several objectives of an early stage evacuation analysis [24] Which if successfully conducted improves ship safety and evacuation performance The goal of this validation study was to recreate an early stage ship design used by Casarosa [15] and compare conclusions drawn from both models The software program used by Casarosa [15] is maritimeEXODUS which was able to identify critical areas and which design per-formed better according to a predefined human performance metric First the discrepancy between the models is commented upon This discrepancy helps investigate model fidelity and understand to what extend conclusions are in agreement with each other In addition the model input and output variations are used to assess the level of uncertainty or the confidence in the final conclusion
It should be acknowledged that the comparison made is between a simplified method2 and an ad-vanced method Where a simplified and advanced method refers to the IMO definition [24] The main difference between these methods is how the population is simulated which is either as a whole or each evacuee individually The choice in approach cases a difference in method outputs which are used to assess the design Casarosa [15] was able to create for both configurations 3 different resolu-tion layouts with each 7 different evacuation scenarios and calculate 18 different performance metrics for each resolution layout and each scenarios The MDP model was not able to recreate the various layouts scenarios and could not calculate the 18 performance metrics These limitations are a result of employing a simplified method Only a small amount of metrics similar to those used by Casarosa [15] were able to be calculated by the MDP model
Next not all input information could be acquired due to the confidential nature of naval warship design The main information lacking were the compartment types the exact amount of crew per deck and the initial distribution Nonetheless based on available information it is assumed that MDP model input used coincides with authors input to a certain degree and that the conclusion is still reasonably valid Similarly the congestion threshold applied is not yet verified thus it is unknown if the definition used is well-grounded Consequently the layout performance conclusion will mainly be a based on the utility distribution the exit behavior and the maximum occurring probabilities These performance metrics will be used to assess the evacuation scenario towards the emergency areas these are assumed to be located above deck No1 This assumption results in only comparing the MDP model with evacuation scenario 1 Lastly there was no exit flow limit defined for the MDP model in other words no limit was set to the amount of population able to enter an exit per epoch A possible implementation to incorporate this would be to stretch all curves accordingly or by implementing a dynamically changing Markov chain based on state capacity The latter idea is further explained in chapter 8 The most used exit is located aft and hence this area of the design is more critical
From discrepancy described it can be concluded that there is still uncertainty between model likeness and hence this should be taken into account in ascertain conclusion confidence On the basis thereof it is concluded that the MDP model was able to differentiate between the two layouts and identify which performed best The single passageway performed overall better than the parallel passageway This was thought to be mainly due to crew having to traverse less distance towards exits Next the utility distribution determined that exits of the baseline layout were more effectively placed throughout the layout This resulted in the baseline layout states being on average more close to an exit than the variant 1 layout states The average distance towards the nearest exit has the most influence on the utility distribution
No congestion was identified using the defined congestion threshold The most probable location for congestion could be identified which was during the night for deck No2 This was due to the clustering of accommodation spaces At night two-thirds of the crew is located in the accommodation spaces and could only egress towards exit 1 for deck No2 This resulted in exit 1 being most critical for deck No2 This coincides with the conclusion drawn from Casarosa [15] If escape scenario 1 coincides with
2The MDP model does not share the same underlying mathematical framework as the method described by IMO guidelines [24]but model assumptions do coincide to a greater extend to the simplified method assumptions
52 5 Validation study 2 influence of passageway configuration
the assumptions of the MDP-model then conclusions of both studies are in agreement Both studies conclude that the baseline model outperforms the variant 1 model
Casarosa [15] concluded that in order to improve the baseline layout an additional ladder is to be added at deck No1 between exit 1 and 2 see Figure 51 From Figure 58 it can be concluded that the area between exit 1 and exit 2 is most isolated Also this coincides with Figure 514 for deck No1 showing possible congestion at exit 1 and exit 2 As Casarosa [15] stated the intention behind performing an evacuation analysis for an early stage ship design is to gain better insight in design performance Not so much at getting precise measurements close to reality It is concluded that the MDP model
bull Can estimate evacuation duration to a reasonable degree
bull Can identify critical exits
bull Show potential in analyzing escape arrangement flexibility
bull Can identify areas of possible congestion
The MDP model concluded that a single passageway outperforms a parallel passageway however aparallel passageway shows more adaptability to damage cases
6Discussion
The objective of this thesis is to investigate the potential of using a Markov-Decision-Process (MDP)framework to assess an early stage ship design from an evacuation perspective One main questionand four sub questions are defined This chapter discusses the findings and its significance this issummarized per sub-question In addition are the method limitations discussed The main question ofthis thesis is
How does a ship design alter when it is egress based driven and could a Ship-Centric Markov Decision Process provide a tool for such a method in the prelimi-nary design stage
The first sub-question is defined to understand for which type of vessels an evacuation analysis needsto be performed and how other industries perform such an analysis The second sub-question focuseson the functionality of similar tools and provides a basis for the method development The relationshipbetween design and evacuation is investigated with sub question three Two validation studies wereperformed to answer this question Finally sub-question four will help determine to what extend themain question can be answered The first sub-question is
1 For which types of vessels does egress influence the design and how do other industries sim-ulate egress
Regulation stipulates that an evacuation analysis is to be performed on ro-ro passenger ships whichhave a keel-laid date on or after the 1st of July 1999 New IMO amendments makes it in additionalso mandatory for other passenger ships which with a keel-laid date on or after 1 January 2020 toperform this analysis Special purpose vessels with more than 240 personnel are also considered otherpassenger ships and hence need to comply with the same guidelines For these ship types such ananalysis assesses the evacuation performance and their findings can affect the design The regulationguidelines give benchmark data to compare results with This data originates from the building in-dustry The building industry models egress with similar software methods utilizing both macroscopicas microscopic approaches In addition different specific egress strategies are defined for differentemergencies The evacuation process defined in the offshore industry shares a similar structure as themarine industry process In addition challenges imposed by the environment are also similar Theoffshore industry focus on risk-based methods to improve the evacuation escape and rescue (EER)process
2 What information is necessary for an egress model as input and what information should themodel provide the designer
53
54 6 Discussion
The capabilities of an evacuation model depend on the applied underlying principle which can be basedon an optimization methodology on a simulation approach or on a risk-based-assessment [59] Eitherprinciple needs information regarding population enclosure and behavior as input Model input infor-mation is partly determined by whether or not the population is treated as individuals or as a groupRegulation stipulates which specific information is necessary for the different approaches [3 24] Thechoice in population definition also affects how behavior is considered The simplified method consid-ering the population as a whole is more appropriate to use for an early stage ship design due to theease in ability to provide an approximation of the vessels evacuation performance [24] The behaviorof a single evacuee cannot be simulated when agents are not modelled individually This contributesto a reduced model fidelity and hence result accuracy is lost Population characteristics are mainly afunction of ship type which affects the population demographics awareness and response times Themodel output depends on the application of the egress tool The evacuation time is the most importantoutput variable when the model is used to check if design meets the IMO criteria The goal should beto be able to confirm that the design meet required criteria identify and eliminate congestion demon-strate escape arrangement flexibility identify areas of counter- and cross flow and provide evacuationinformation to the operators [24] Model output should facilitate information to asses either some orall of these goals
3 How does general arrangement design influence egress
The general arrangement is a function of various factors such as the ship type and ship requirements Passenger vessels include many public areas whereas special purpose vessels have in addition to crew accommodation a wide variety of service spaces This configuration affects initial population distri-bution [23] in turn affecting the evacuation performance Only two design aspects were investigated in more detail the choice in exit locations and the influence of the passageway configuration on an evacuation Kurdi et al [14] demonstrated the influence different exit configurations have on the evac-uation duration and distribution of the population among the exits The authors demonstrated most evenly distributed exits throughout the layout was found most beneficial to the evacuation process Casarosa [15] demonstrated the influence of two different passageway configurations on personnel movement on board a frigate The conclusions were based on a human performance metric (HPM) to assess different scenarios and layout resolutions The low-resolution layouts corresponded with an early stage ship design A single passageway throughout the vessels performed overall better than two parallel passageways This is because the population for the single passageway configuration had to on average traverse less distance towards an exit Similarly the exits were more evenly placed throughout the layout The additional damage case showed that the parallel passageway configuration performance was less sensitive when the most critical exit was removed This could lead to the conclu-sion that a parallel passageway is more redundant and escape arrangement more flexible This design was further improved by eliminating congestion through adding an additional ladder Both studies showed the major influence exit placement has on egress performance
4 Is an SC-MDP a viable method for modeling egress in general and which aspects of egress isit able to capture
From the literature study it is concluded that the amount of vessels which have to perform an evacua-tion analysis will increase The new amendments could create an increase in the demand for evacuationmodels or evacuation research The diversity in the various models are due to the complexity of anevacuation process Different models are able to capture different aspects of the highly dynamic sys-tem A Markov-Decision-Process is probabilistic approach to simulate system behavior The validationstudies determined that the method is able to differentiate between designs and identify critical aspectssuch as unevenly used exits The second sub question describes the different elements in evacuationmodels and the objective of an evacuation analysis The MDP method was not able to evaluate all ofthe IMO given objectives given by [24] This is caused by to the method assumptions To improvethe models shortcomings improvements are suggested and given in chapter 8 The method is ableto incorporate population distributions identify critical exits and locate possible congested areas atthe time of writing The third sub-questions demonstrated the MDP model capability to assess layouts
55
based on on exit- and passageway configurations to a certain extend By adding additional scenar-ios conclusion confidence is improved The MDP framework demonstrated potential to simulate egress
Regarding the limitations of this thesis and differences with other models A noticeable difference between a Markov-Decision-Process based model and the models incorporated by the validation stud-ies is the method approach The MDP model is a stochastic method whereas the validation studies a deterministic method As a result both validation studies needed to simulated the process a hundred times to get an averaged result Whilst the MDP-model only has to simulate the process once This gives the advantage that the method can be faster performed and more easily used during early stage ship design However as also was shown in section 53 the methodology proposed was not able to incorporate all aspects of an evacuation nor calculate similar metrics as Casarosa [15] Table 52 shows how much criteria the MDP-model was not able to be calculate This is a result of as explained by sub-question 2 a choice in modeling the population as a whole Not modeling all persons as individuals makes it unable to calculate metrics related to individuals for example how often a watertight door is used Improvements to the MDP-model is explained in chapter 8
The first part of the main question - How does a ship design alter when it is egress based drive -is answered to a certain extend using literature on ship design using sub-question 4 and with the two validation studies First the implications the ship design process has on the evacuation analysis is discussed Then the main question is answered using the conclusions from the two validation studies
The capacity to modify to the layout decreases as the ship design process progresses [2] The ship design process can be split up in three major stages [48] This thesis focused on the first stage the early stage which holds the most design freedom The concept stage follows after the early stage and lastly detail design commences The early design process can differ for each ship type and level of novelty of the ships design [49] At the time of writing an evacuation analysis tends not be performed early on in the design process [64] The insufficient literature found on the intricate relationship be-tween a ships design and the evacuation performance limits the ability to completely answer the first part of the main question
The relevant decisions that occur during each stage of the design process affect how how a ships layout changes Design modifications which improve evacuation can be justified with evacuation tools except these tools are limited to different design stage Model fidelity increases as models get more advanced Simplified methods are used early in the design stage and have lower fidelity which prevents calcu-lating accurate evacuation times It is unclear whether evacauability is currently incorporated in early design and used as a measure or style Early stage models could be used when design evolves to frequently evaluate evacuation performance An evacuation analysis is not always carried out during early stage ship design [64]
The general arrangement of passenger ships (both cruise ships as ferries) tend to start by determining the location of public spaces and accommodation spaces [52] An ship arrangement will improve de-pending to the evacuability aspects the model is able to capture The first validation study demonstrated that placing exits on all sides of a room improves egress performance From the second validation study it becomes apparent that clustered accommodation compartments cause the nearest exit to be most critical Choosing a compartment configuration which disperses the population more evenly among the layout for both day and night cases will reduce possible congestion inception Staircase locations should prevent area isolated areas but still be in agreement with the assumed population distribution Next it was determined that decreasing the distances towards the exits improves evacuation Provid-ing multiple escape options increases the evacuation redundancy of a design However it should be noted that above conclusions were based on limited scenarios and metrics Increasing the scenarios considered and including damage cases could improve conclusion confidence In short a ship design will change based on the method employed and the methods capabilities The designer can only assess as much as the tools able him or her to
7Conclusion
This research showed the possible demand for a model capable of evaluating evacuation performanceand identifying critical areas early on in the design stage This work successfully extended the work byKana and Singer [12] Kana and Droste [27] who proposed a Markov Decision Process based method-ology to be used to evaluate the evacuation performance of an early stage ship design From theliterature study it was concluded that an evacuation process is a highly dynamic process Two valida-tion studies were performed to determine if a Markov decision process based approach can be used toassess the ships evacuation performance
The first validation study demonstrated that the MDP model was able to differentiate based on evac-uation performance between four rectangular rooms Both the MDP method as well as the methodsused in the comparison study determined that exits on all sides of the room evacuated the fastest Itis concluded that MDP model is able to identify an optimal exit configuration for a rectangular grid
The second validation study concluded that the MDP model can differentiate between two decks ofa naval ship design The layouts were analyzed based on how quickly the majority of the populationreaches an exit how the exits are dispersed throughout the layout how the population is distributedamong the exits and possible congestion locations Taking the MDP model assumptions into accountevacuating a layout with a single passageway proved to be faster than with a double passagewayHowever the latter showed to be more redundant to damage scenarios
The extent to which the method can be used should be further investigated As a result of the secondvalidation study where the model was be applied to a naval warship design it is deemed probablethat it can also be used for other complex ships such as cruise ships and special purpose ships Thisassumption should be investigated in further detail An overview of the thesis findings are listed below
bull The relationship between a ships design and the evacuation performance is complexbull Early stage ship design holds the most potential to improve the evacuation performancebull The physical arrangement of a ship strongly affects evacuation process and efficiencybull Exits that are evenly dispersed throughout the layout and are located in accordance with theinitial distribution improve MDP simulation convergence and exit usage
bull An increase in the amount of evacuation analysis both for passengers vessels as well as specialpurpose vessels is expected due to regulation changes This applies to ships constructed on orafter 1 January 2020 and carrying more than 36 passengers or 240 special personnel
bull The Markov decision process model shows potential to be used as a tool to differentiate betweenearly stage ship designs
57
8Future work
Each variable used for input for any method influences the output and therefore conclusions drawnTherefore each input variable value should be justified This thesis focuses on testing the potentialof the MDP method Further research should focus on justifying certain input values The discountfactor should reflect a persons short term goals and long term goals The action probability could forexample reflect a persons uncertainty in decision making These aspects are further highlighted inthis section In short this section are recommendations for future research in this method
Improving model resolutionCurrently the walls are included in the layout as states in other words only by adding a wall two statesare disconnected from each other This wall state shares the same geometric attributes as a regularstate Therefore a course grid will result in unrealistic wide walls A feature which is not incorporatedbut could improve the models accuracy and running time is to be able to remove edges between nodesin order to simulate a wall This is graphically represented by Figure 81 and it can be seen that thelayout is better represented if edges are simply removed
1 2
Figure 81 Example why removing edges will represent a layout better than wall states Gray nodes are wall nodes removingedge between state 1 and 2 will represent a wall
Multi-deckCurrently only one deck is simulated with the MDP-model however the method could be used on amulti-deck layout A stairway is added by linking all deck exits states with the corresponding adjacentdeck exit states Adding states in between the exit states can represent the time it takes to go upor a down a stairway The amount of states could differ per exit type The more states in betweenthe longer it takes for passengers to go up or down the stairways Emergency station nodes shouldthen have a positive reward instead of the exit locations to simulate occupants moving towards theemergency stations
Modify utilities to including stability loss and initial population distributionTwo different proposals are made which were not yet investigate in more detail but could improve theMDP methodology Firstly the rewards in all states were kept the same therefore the policies werealso mainly a result of distance from an exit The rewards could also be not all the same to create anasymmetrical utility distribution throughout the layout For example by setting negative rewards atport side lower than starboard an incentive is created to move towards starboard side of the vesselSince less negative rewards would increase the utility and therefore influence the policies This trans-versely asymmetrical reward distribution would simulate a ship heeling It is assumed people tend to
59
60 8 Future work
want to move upwards when a ship starts to heel Since evacuations are done when the ship is in acritical state stability loss should be incorporated in the simulations
Secondly the utility distribution used did not consider the initial distribution of evacuees The samevalue was given to all state nodes whereas it would be more realistic to place more value on highlypopulated areas Therefore using the initial state distribution to scale the utility values accordinglywould penalize populated areas further away from an exit Similarly non-populated isolated areaswould be less valuated Response time also differs for day and night scenario and by including theinitial distribution a heavier penalty is given isolated accommodation areas far away from an exit
Counter flowIn this thesis only one population was simulated Therefore the entire population used the nearestexit to egress towards to As described by regulation counter and cross flow should also be investi-gated One way of doing this is to simulate the two populations separately and create two differentMarkov-Chain solution matrices as given by Equation 38 The ratio between population sizes can beused to scale down both matrices according For example if the ratio between passengers and crew is3 to 1 than this should also be reflected in both matrices Ie the passenger population is multipliedby 75 and the crew population by 25 These two solution matrices are then added together to createone solution matrix An animation of this simulation is added in Appendix A
State occupancy thresholdIn order to limit the percentage of agents occupying one state a state capacity limit could be intro-duced If 119909 represents a person then 4119909 could be a state capacity indicating only 4 persons perstate is allowed If a state is saturated the transition probabilities to neighbouring states should beadjusted This concept is further explained in this sectionAn illustration is given in Figure 82 for anarbitrary layout
1
2
3
4
5
6
1
1
8
119904
010000⋮
119872
1 1 0 8 0 0 ⋯
1 0 1 0 8 0 ⋯0 1 1 0 0 8 ⋯0 0 0 1 1 0 ⋯0 0 0 1 0 1 ⋯0 0 0 0 1 1 ⋯⋮ ⋮ ⋮ ⋮ ⋮ ⋮ ⋱
119904
101080⋮
1
1
1
1
1
1
8
8
8
8
8
1
1
1
2
3
4
5
6
5
5
0
1
1
1
1
1
1
8
8
8
8
8
1
1
1
1
1
1
119872
1 1 0 8 0 0 ⋯
1 0 1 0 8 0 ⋯0 5 5 0 0 0 ⋯0 0 0 1 1 0 ⋯0 0 0 1 0 1 ⋯0 0 0 0 1 1 ⋯⋮ ⋮ ⋮ ⋮ ⋮ ⋮ ⋱
119904
01
06
05
16008⋮
119872
1 1 0 8 0 0 ⋯
1 0 1 0 8 0 ⋯0 1 1 0 0 8 ⋯0 0 0 1 1 0 ⋯0 0 0 1 0 1 ⋯0 0 0 0 1 1 ⋯⋮ ⋮ ⋮ ⋮ ⋮ ⋮ ⋱
1
2
3
4
5
6
1
1
8
1
1
1
1
1
1
8
8
8
8
8
1
1
1
1
epoch 0 epoch 1 epoch 2
Figure 82 Arbitrary layout example changing transition matrix
The layout used is a 10x20 grid with no walls The initial distribution is 100 at state 10 and is locatedat the bottom left corner The exit node is state 191 and located at the top-right corner An MDP isused to calculate all the policies and create a transition matrix which is a 200x200 matrix The actionprobabilities are 8 in the desired direction and 1 at perpendicular directions
61
0 10 20 30 40 50 60 70 80
epoch
0
02
04
06
08
1
Exi
t
Exit behavior for regular MC
0 10 20 30 40 50 60 70
epoch
0
02
04
06
08
1
Exi
t
Exit behavior for dynamic changing MC
Figure 83 Exit results for the regular and dynamic changing MC
The idea behind the method is that when a state probability exceeds a threshold all adjacent stateswith a policy to move towards the rsquofullrsquo state are updated The highest values are deleted (in theexample 8 values are deleted) in the corresponding row of the transition matrix The remaining val-ues are adjusted accordingly so the sum of the row again equals 1 For example if the remainingprobabilities are 1 to the left and 1 to the right then these are changed to 5 and 5 At each iter-ation all states exceeding the limit and all states below the limit are located If the cell is below thelimit than the adjacent state probabilities are reset The exit behavior is plotted and given in Figure 83
AAppendix
A1 Validation study 2 Exit results
Case 1Baseline Variant 1
Exit No1 No2 No1 No21 151 (45) 737 (516) 146 (44) 761 (533)2 343 (103) 099 (69) 191 (57) 054 (38)3 036 (11) 058 (41) 176 (53) 074 (51)4 242 (73) 038 (26) 114 (34) 039 (27)5 228 (68) 050 (35) 373 (112) 060 (42)6 018 (13) 012 (09)
Table A1 Exit convergence results for case 1 In brackets the conversion to amount of crew
Case 2Baseline Variant 1
Exit No1 No2 No1 No21 162 (49) 515 (36) 154 (46) 505 (353)2 273 (82) 081 (57) 229 (69) 058 (40)3 167 (50) 062 (44) 163 (49) 099 (69)4 199 (60) 267 (187) 185 (55) 261 (183)5 198 (59) 055 (39) 269 (81) 064 (44)6 020 (14) 014 (10)
Table A2 Exit convergence results for case 2 In brackets the conversion to amount of crew
Deck No1 Deck No2Metric Case Baseline Variant 1 Baseline Variant 1
Std Dev 1 0102 (1) 009 (088) 0256 (096) 0266 (1)2 004 (092) 0043 (1) 0175 (1) 017 (097)
95 mark 12 36 (088) 41 (1) 43 (064) 67 (1)Sum normalized values 280 288 260 297Difference +31 +142
Table A3 Comparison between standard deviation of final population distribution over exits and 95 mark In brackets thenormalized values which are summed to compare overall score
63
64 A Appendix
A2 Maximum probability plots for the additional damage case
Case 1 Max probability plot - No2 Baseline
Case 1 Max probability plot - No2 Variant 1
0
001
002
003
004
Popu
latio
n pe
rcen
tage
Figure A1 Maximum probability plot for the night case of deck No2
Case 2 Max probability plot - No2 Baseline
Case 2 Max probability plot - No2 Variant 1
0
001
002
003
004
Popu
latio
n pe
rcen
tage
Figure A2 Maximum probability plot for the day case of deck No2
A3 Value iteration code 65
A3 Value iteration code1 U = zeros ( numStates 1 numActions ) I n i t i a l i z e U t i l i t y matr ix2 Q = zeros ( numStates 1 numActions ) I n i t i a l i z e Qua l i t y matr ix3 numEpochs=1004 d iscount = 0955 g loba l tmpPol i cy 6
7 U_ l i s t=zeros ( numStates numEpochs ) Save u t i l i t y each i t e r a t i o n8 p o l i c y _ l i s t=zeros ( numStates numEpochs ) Save p o l i c i e s each i t e r a t i o n9
10 Solve MDP using value i t e r a t i o n11 f o r e=1numEpochs12 f o r i =1numActions13 Ca l cu l a t e Qua l i t y matr ix14 Q( 1 i )=R+discountP ( i )U( i ) 15 end16 prepare f o r next epoch17 [U tmpPol i cy ] = max(Q [ ] 3 ) 18
19 Reset e x i t u t i l i t i e s rewards20 f o r i =1 length ( e x i t s )21 U( e x i t s ( i )==sta teLoc )=ex i tR ( i ) 22 end23
24 Reset f i r e hazard u t i l i t i e s rewards25 f o r i =1 length ( f i r e s )26 U( f i r e s ( i )==sta teLoc )=f i r eR 27 end28
29 Update U matr ix f o r next i t e r a t i o n30 f o r t =1numActions 231 U=cat (3 UU) 32 end33
34 Safe so l u t i o n to the l i s t35 U_ l i s t ( e )=U( 1 1 ) 36 p o l i c y _ l i s t ( e )=tmpPol i cy 37 end
66 A Appendix
A4 AnimationFor the following animations a Adobe Flash plugin is required an installation guide for Mac and Windowscan be found on link However when this document is opened with Adobe Reader a pop-up shouldgive information how to download the plugins
Value iteration for No1 BL
Addition of two Markov chain solutionsBelow an arbitrary layout is given where two Markov-Chain solutions have been added together andplotted The first group consists of an population which has only access the bottom exits The secondgroup has been delayed for 40 steps and has access to all exits