Embed Size (px)
Citation preview
Analysis of Handover Decision Making in Downlink
Long Term Evolution Networks
By
Elujide, Israel Oludayo
(21242553)
Submitted in fulfillment of the requirements of the Master of Technology degree in
Information Technology
In the
Department of Information Technology in the Faculty of Accounting and Informatics
Durban University of Technology
Durban, South Africa
July, 2014
i
DECLARATION
I, Israel O. Elujide, declare that this dissertation represents my own work and has not
been previously submitted in any form for another degree at any university or
institution of higher learning. All information cited from published and unpublished
works have been acknowledged.
Student Date
Approved for final submission
Supervisor:
Prof. O. O. Olugbara Date
Co-supervisors:
Dr P. A. Owolawi Date
Prof. T. Nepal Date
ii
DEDICATION
To
My mum
(Mrs. R. Olaitan Elujide)

iii
ACKNOWLEDGMENTS
I am grateful to God and His Son, the source of wisdom and my inspirations, for
successful completion of this work.
I would like to extend my gratitude to my supervisor, Prof. Olu Olugbara, for being
always supportive and cooperative. I also appreciate my co-supervisors Dr Pius Owolawi
and Prof T. Nepal for their encouragement and invaluable guidance throughout the
dissertation.
I am grateful to my family for their love, support and encouragement throughout my
study. I owe them everything and wish I could show them how much I love and
appreciate them.
I am thankful to all my friends and colleagues for their support and advice during this
work, especially Gbolahan Aiyetoro, Olutosin Oduwole, Stephen Fashoto, Olateju
Mogbonjubola, Momed Neves and Stanley Oyewole.
Finally, my sincere gratitude goes to my heartthrob, Oluwabukola Rotimi, whose love
and encouragement allow me to press forward. She certainly deserves more than I can
possibly offer so I would like to give her a heartfelt “thanks.”
iv
TABLE OF CONTENTS
DECLARATION .................................................................................................................... i
DEDICATION ...................................................................................................................... ii
ACKNOWLEGDMENTS .................................................................................................... iii
TABLE OF CONTENTS ...................................................................................................... iv
LIST OF FIGURES ............................................................................................................ vii
LIST OF TABLES .............................................................................................................. viii
LIST OF ABBREVIATIONS ............................................................................................... ix
PUBLICATIONS FROM THE DISSERTATION ............................................................... xii
ABSTRACT ....................................................................................................................... xiii
CHAPTER 1: INTRODUCTION .................................................................................... 1
1.1 Motivation .......................................................................................................... 4
1.2 Research Problem .............................................................................................. 5
1.3 Objectives ........................................................................................................... 6
1.3.1 Methodology ............................................................................................... 6
1.3.2 Simulation Tool .......................................................................................... 7
1.4 Thesis Layout ...................................................................................................... 9
CHAPTER 2: LONG TERM EVOLUTION ................................................................. 11
2.1 Motivation for LTE Development ..................................................................... 11
2.2 LTE Overview ................................................................................................... 12
2.3 LTE Requirements ........................................................................................... 13
2.3.1 Capability Related Requirements ............................................................ 14
2.3.2 System Performance Requirements ........................................................ 15
2.3.3 Deployment Requirements...................................................................... 16
2.4 Network Architecture ........................................................................................ 17
2.4.1 Evolved UTRAN (E-UTRAN)................................................................... 18
2.4.2 Evolved Packet Core (EPC) ..................................................................... 19
2.5 LTE Protocol Structure .................................................................................... 21
2.5.1 Internet Protocol (IP) ............................................................................... 22
2.5.2 Non Access Stratum (NAS) ...................................................................... 23
2.5.3 Radio Resource Control (RRC) ............................................................... 23
v
2.5.4 Packet Data Convergence Protocol (PDCP) ............................................ 23
2.5.5 Radio Link Control (RLC) ........................................................................ 23
2.5.6 Media Access Control (MAC) .................................................................. 23
2.5.7 Physical Layer (PHY) ............................................................................... 24
CHAPTER 3: HANDOVER IN LTE ............................................................................ 25
3.1 LTE Handover Overview .................................................................................. 25
3.2 LTE Air Interface .............................................................................................. 26
3.2.1 Downlink Transmission Scheme (OFDMA) ............................................ 27
3.2.2 Uplink Transmission Scheme (SC-FDMA) ............................................. 28
3.3 LTE Frame Structure ........................................................................................ 29
3.3.1 UE Measurement ..................................................................................... 29
3.3.2 L 1 Filtering .............................................................................................. 31
3.3.3 L 3 Filtering ............................................................................................. 33
3.4 LTE Downlink Channel Estimation ................................................................. 33
3.4.1 Linear Filtering ........................................................................................ 35
3.4.2 Local Averaging Filtering ........................................................................ 37
3.4.3 L 3 Filtered Locally Averaged L 1 Signal ................................................. 38
3.5 Handover Procedure in LTE ............................................................................ 39
3.5.1 Handover Initiation/Preparation ............................................................ 41
3.5.2 Handover Execution ................................................................................ 41
3.5.3 Handover Completion ............................................................................. 41
3.6 Handover Design Goal ..................................................................................... 42
3.6.1 Reduction in Number of Handover Failure ............................................. 42
3.6.2 Reduction in Overall Number of Handover Initiated ............................. 42
3.6.3 Reduction in Handover Delay ................................................................. 42
3.6.4 Reduction of Handover Impact on System and Service Performance ... 42
3.7 Handover Performance Evaluation ................................................................. 43
CHAPTER 4: MODEL IMPLEMENTATION............................................................ 44
4.1 Simulation Tool ................................................................................................ 44
4.2 Key Performance Indicators (KPI) ................................................................... 44
4.2.1 Normalized User Throughput .................................................................. 45
vi
4.2.2 Cell Spectral Efficiency ............................................................................ 45
4.2.3 Handover Failure ..................................................................................... 46
4.3 Simulation Model ............................................................................................. 47
4.4 Spectral Efficiency ............................................................................................ 49
4.4.1 Spectral Efficiency at 3 km/h .................................................................. 50
4.4.2 Spectral Efficiency at 30 km/h ............................................................... 51
4.4.3 Spectral Efficiency at 120 km/h .............................................................. 52
4.5 User Throughput .............................................................................................. 53
4.5.1 Peak User Throughput ............................................................................. 54
4.5.2 Average User Throughput ....................................................................... 55
4.5.3 Cell Edge User Throughput ..................................................................... 56
4.6 Handover Failure ............................................................................................. 57
CHAPTER 5: CONCLUSION AND FUTURE WORK ............................................. 59
5.1 Conclusion ........................................................................................................ 59
5.2 Future Work ..................................................................................................... 60
CHAPTER 6: REFERENCES ....................................................................................... 62

vii
LIST OF FIGURES
Figure 1-1: Flow chart of research study ....................................................................... 8
Figure 2-1: LTE Network ............................................................................................. 12
Figure 2-2: Progression of LTE Release ...................................................................... 14
Figure 2-3: LTE Network Architecture ....................................................................... 18
Figure 2-4: Evolved Packet System ............................................................................. 20
Figure 2-5: User plane protocol stack ......................................................................... 22
Figure 2-6: Control plane protocol stack ..................................................................... 22
Figure 3-1: Comparison of spectral efficiency in OFDM to classical multicarrier
modulation............................................................................................. 26
Figure 3-2: Comparison between multiuser communication systems ....................... 27
Figure 3-3: LTE downlink physical resource block .................................................... 28
Figure 3.4: LTE frame structure ................................................................................. 29
Figure 3.5: LTE downlink distribution of reference signal ........................................ 30
Figure 3.6: LTE handover measurement and filtering .............................................. 31
Figure 3.7: LTE downlink channel estimation process............................................... 32
Figure 3.8: An implementation of an OFDM transmitter .......................................... 33
Figure 3.9: An OFDM Communication System .......................................................... 34
Figure 3.10: A schematic representation of local averaging filtering technique ........ 37
Figure 3.11: LTE handover procedure ......................................................................... 40
Figure 4.1: Network layout seven-site hexagonal grid ................................................ 47
Figure 4.2: Empirical CDF of average UE spectral efficiency at speed of 3 km/h ..... 50
Figure 4.3: Empirical CDF of average UE spectral efficiency at speed of 30 km/h ... 51
Figure 4.4: Empirical CDF of average UE spectral efficiency at speed of 120 km/h . 52
Figure 4.5: Peak user throughput at different UE speed ............................................ 54
Figure 4.6: Average user throughput at different UE speed ....................................... 55
Figure 4.7: Cell edge user throughput at different UE speed ..................................... 56
Figure 4.8: Effect of UE speed on average number of handover failure..................... 58

viii
LIST OF TABLES
Table 2.1: Comparison of 3GPP Technology.................................................................. 13
Table 2.2: Overview of LTE Requirements ..................................................................... 17
Table 4.1: Parameters and assumption for simulation ................................................. 48
ix
LIST OF ABBREVIATIONS
1G First Generation
2G Second Generation
3G Third Generation
4G Fourth Generation
3GPP Third Generation Partnership Project
aGW Access Gateway
AMPS Advanced Mobile Phone System
ARQ Automatic Repeat Request
CDF Cumulative Distribution Function
CDMA Code Division Multiple Access
CN Core Network
CoMP Coordinated Multipoint transmission or reception
CQI Channel Quality Indicator
DAB Digital Audio Broadcasting
DECT Digital Enhanced Cordless Telecommunications
DFT Discrete Fourier Transform
DL Downlink
DVB Digital Video Broadcast
E-UTRAN Enhanced – UMTS Terrestrial Radio Access Network
eNodeB Enhanced Node B
EPC Evolved Packet Core
ETSI European Telecommunications Standard Institute
FDD Frequency Division Duplex
FDMA Frequency Division Multiple Access
FPLMTS Future Public Land Mobile Telecommunication Systems
GERAN GSM EDGE Radio Access Network
GGSN Gateway GPRS Support Node
GPRS General Packet Radio System
GSM Global System for Mobile Communication
GTP GPRS Tunnelling Protocol
x
HSDPA High Speed Downlink Packet Access
HSPA High Speed Packet Access
HSUPA High Speed Uplink Packet Access
HSS Home Subscriber Server
IIR Infinite Impulse Response
IP Internet Protocol
IMS IP Multimedia Subsystem
IMT International Mobile Telecommunications
IS Interim Standard
ITU International Telecommunication Union
ITU-R ITU Radiocommunication sector
L 1 Layer 1
L 3 Layer 3
LIPA Local IP Access
LTE Long Term Evolution
MAC Medium Access Control
MATLAB Matrix Laboratory
MBMS Multimedia Broadcast Multicast Service
Mbps Megabits per second
MCS Modulation Coding Scheme
MDT Minimization of Drive Tests
MME Mobility Management Entity
MHz Megahertz
NAS Non Access Stratum
NMT Nordic Mobile Telephone
OFDM Orthogonal Frequency Division Multiplexing
OFDMA Orthogonal Frequency Division Multiple Access
OSI Open Systems Interconnection
PAPR Peak-to-Average Power Ratio
PCRF Policy and Charging Rules Function
PDCP Packet Data Convergence Protocol
PDN Packet Data Network
xi
P-GW PDN GateWay
PHY Physical Layer
PRB Physical Resource Block
PS Packet Switched
QoS Quality of Service
RAN Radio Access Network
RB Resource Block
RLC Radio Link Control
RNC Radio Network Controller
RRC Radio Resource Control
RRM Radio Resource Management
SAE System Architecture Evolution
SC-FDMA Single Carrier-Frequency Division Multiple Access
SCTP Stream Control Transmission Protocol
SGSN Serving GPRS Support Node
SON Self-Optimizing Networks
TACS Total Access Communication System
TDD Time Division Duplex
TDMA Time Division Multiple Access
TTI Transmission Time Interval
UDP User Datagram Protocol
UE User Equipment
UL Uplink
UMTS Universal Mobile Telecommunication System
UPE User Plane Entity
USIM Universal Subscriber Identity Module
UTRAN UMTS Terrestrial Radio Access Network
U-plane User Plane
WCDMA Wideband Code Division Multiple Access
WiFi Wireless Fidelity
WiMAX Worldwide Interoperability for Microwave Access
xii
PUBLICATIONS FROM THE DISSERTATION
Elujide, I. O., Olugbara, O. O., Owolawi, P. A. and Nepal, T. 2013. Effect of Layer 3
Filtering on Local Averaging Handover Technique in Long Term Evolution Networks.
In: Proceeding of Southern Africa Telecommunication Networks and Application
Conference (SATNAC) 2013. 1-4 Sep. 2013. 79-83.
Elujide, I. O., Olugbara, O. O., Owolawi, P. A. and Nepal, T. 2013. Performance of Local
Averaging Handover Technique in Long Term Evolution Networks. Submitted for
journal publication.
xiii
ABSTRACT
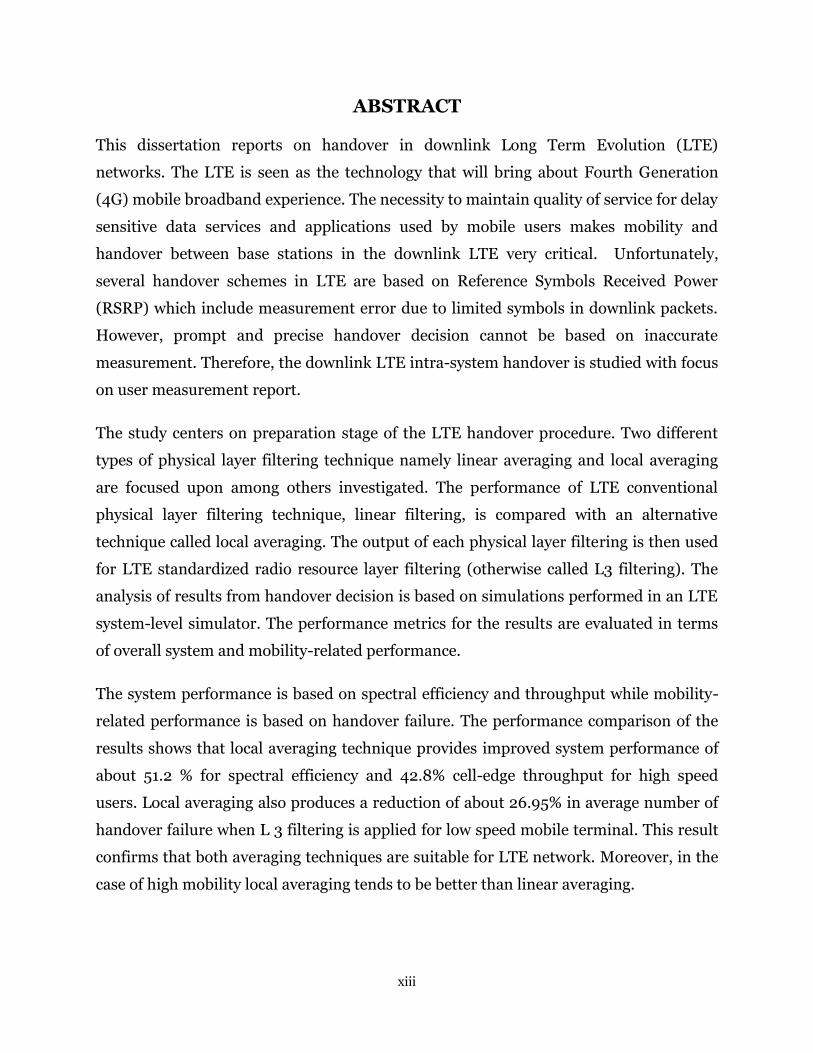
This dissertation reports on handover in downlink Long Term Evolution (LTE)
networks. The LTE is seen as the technology that will bring about Fourth Generation
(4G) mobile broadband experience. The necessity to maintain quality of service for delay
sensitive data services and applications used by mobile users makes mobility and
handover between base stations in the downlink LTE very critical. Unfortunately,
several handover schemes in LTE are based on Reference Symbols Received Power
(RSRP) which include measurement error due to limited symbols in downlink packets.
However, prompt and precise handover decision cannot be based on inaccurate
measurement. Therefore, the downlink LTE intra-system handover is studied with focus
on user measurement report.
The study centers on preparation stage of the LTE handover procedure. Two different
types of physical layer filtering technique namely linear averaging and local averaging
are focused upon among others investigated. The performance of LTE conventional
physical layer filtering technique, linear filtering, is compared with an alternative
technique called local averaging. The output of each physical layer filtering is then used
for LTE standardized radio resource layer filtering (otherwise called L3 filtering). The
analysis of results from handover decision is based on simulations performed in an LTE
system-level simulator. The performance metrics for the results are evaluated in terms
of overall system and mobility-related performance.
The system performance is based on spectral efficiency and throughput while mobility-
related performance is based on handover failure. The performance comparison of the
results shows that local averaging technique provides improved system performance of
about 51.2 % for spectral efficiency and 42.8% cell-edge throughput for high speed
users. Local averaging also produces a reduction of about 26.95% in average number of
handover failure when L 3 filtering is applied for low speed mobile terminal. This result
confirms that both averaging techniques are suitable for LTE network. Moreover, in the
case of high mobility local averaging tends to be better than linear averaging.
1
CHAPTER 1
INTRODUCTION
In the recent years, the rate of growth in telecommunication industry has been
remarkable. This growth can be seen in network penetration of telecommunication
carriers, increasing revenue from service provision, deployment of network facilities and
competitions between carriers in the industry. Although the effect of this growth has
rippled down to various segments of the industry but none compares to mobile
communication. The growth in mobile communication in the past few years is visible in
the explosive number of mobile subscribers and rapid trends of the mobile
communication which is likely to continue in the near future.
The major development in mobile communication system started in 1970s with first trial
implementation in Chicago. The trial system used a technology called Advanced Mobile
Phone System (AMPS) and the first commercial version was launched in 1983 (Smith
2006). At this time, other countries also developed similar version of mobile
communication technology. A popular version in Europe then was based on a
technology called Nordic Mobile Telephone (NMT) operating in 450 megahertz (MHz)
and 900 MHz band. Another variant of AMPS was later implemented in Britain known
as Total Access Communication System (TACS). The success experienced by these
technologies soon made mobile communication spread worldwide. Even though several
other technologies were developed, these three were the most successful and considered
the first generation (1G) of mobile communication system (Sesia, Toufik and Baker
2009 ; Smith 2006). The success of first generation mobile communication system was
far more than imagined and actually revealed its flaws. The main weakness in the
system is limited capacity meaning that the system functions well under a considerable
number of mobile subscribers but performance degrades drastically when the number of
mobile users becomes large and are densely concentrated in a location such as stadiums
or metropolitan areas. Another major weakness in the 1G technology is security because
the communications were subjected to eavesdropping. In order to mitigate these
2
weaknesses considerable efforts were channel towards development of a new technology
which led to the advent of second generation (2G) mobile communication system.
The 2G mobile communication system was developed to handle the limited capacity
problem of 1G and addressed it by changing the technology from analogue to digital.
Three versions of 2G technologies stood out namely Interim Standard (IS) 136, IS Code
Division Multiple Access (CDMA) and Global System for Mobile Communication (GSM)
(Smith 2006). IS 136, an improvement to AMPS technology, addressed the limited
capacity problem by digitizing the voice channel while the control channel remained
analogue. The digitization of the voice channel improved the capacity by allowing up to
three subscribers to be serviced concurrently. However, the analogue segment of the
system limited the service offering. IS CDMA was also a popular 2G technology.
Contrary to IS 136 that used time for sharing communication access between users, IS
CDMA made use of code. The use of code division for simultaneous frequency sharing
between multiple users provided better capacity than analogue system where the whole
frequency was dedicated to a single user. The GSM also addressed the challenges of 1G
mobile communication by looking at NMT which was a popular technology in Europe.
The widespread of the technology in Europe revealed the incompatibility problem of the
analogues system between several countries. Hence, there is need for developing a
standardized European-wide digital communication system and that led to creation of a
group called Group Specialé Mobile (GSM) (Smith 2006). The activities of the group
were then turned over to newly created ETSI in 1989 which finalized the technical
specifications. The standardized specifications of GSM technology between European
countries paved way for international roaming that was considered a huge success.
Having seen the success of GSM, other countries outside Europe started adopting the
technology. It was then realized that the technology was beyond Europe and took on a
new name called Global System of Mobile Communication (GSM). Although the 2G
system was a success compared to 1G mobile communication system yet it had its
limitation. The 2G system was optimized for voice communication with several calling
features and more secured than 1G system however, it was not well suited for data
services.
3
The popularity of Internet and multimedia communication introduced new level of
challenges for mobile communication. Although users want to retain the experience
with voice communication yet they also want to participate in various level of
communication services possible such as e-mail, Instant Messaging (IM), social media,
web browsing and so on. Not only do users want to enjoy these services but also
unwilling to sacrifice mobility. In order to provide these level of requirements, it
becomes imperative to develop a new advanced technology. This led to creation of third
generation (3G) mobile communication technology. On seeing the level of demand for
3G mobile communication, several organizations started addressing the issues in the
80s. The work was pioneered by International Telecommunication Union (ITU) and was
termed Future Public Land Mobile Telecommunication Systems (FPLMTS) which was
later changed to IMT-2000. The focus of ITU-2000 initially covers specific areas such as
user data rates, multimedia service provision, operating bandwidths and flexibility
between carriers to support mobile subscribers. The focus was later reviewed and five
technologies were selected for terrestrial mobile communication services which are
Wideband CDMA (WCDMA), CDMA 2000, Time Division-Synchronous CDMA (TD-
SCDMA), Universal Wireless Communications 136 (UWC-136) and Digital Enhanced
Cordless Telecommunications (DECT) (Smith 2006). Although these technologies were
able to provide a reasonable access to data services on terrestrial mobile network
however there is a new level of demand by users which is mobile broadband access. This
consequentially ushers in the fourth generation (4G) mobile communication.
The need for mobile broadband springs up as a result of the explosion of packet data on
cellular system which cannot be adequately handled by legacy cellular technologies like
Global System for Mobile Communications (GSM). The need brings about competition
between several access technologies. The major competitors for provision of mobile
broadband on wireless devices are mobile Worldwide Interoperability for Microwave
Access (mobile WiMAX), Long Term Evolution (LTE) of Universal Mobile
Telecommunications System (UMTS) and Ultra-Mobile Broadband (UMB) (Ortiz 2007;
Vaughan-Nichols 2008; Miyahara 2009). The concern is not only the provision of
mobile broadband but also sustainability and suitability of the technology towards
future provision. This makes Third Generation Partnership Project (3GPP) to wade in

4
competition for provision of mobile broadband. The 3GPP thereby develops a
technology path with series of developmental progression to succeed the second
generation (2G) technology, GSM, with more advanced capabilities. The technology
path chosen is LTE with a view to advancing the expansion trend towards future next
generation wireless cellular technology. This makes LTE to be the most popularly
adopted of all the competing technologies (Gessner and Roessler 2009). The widespread
adoption of LTE facilitated continual improvement of its system specification and made
LTE to be seen as the technology that will help achieve the provision of mobile
broadband in the near future.
The aims of LTE technology to enhance the technology of radio access network to
facilitate efficient service delivery. The LTE radio access technology differs from that of
legacy technology because it has capability to provide multi-user access in both
frequency and time domain (Sesia, Toufik and Baker 2009; Zukang et al. 2012).
However, LTE radio access network like most cellular networks also faces challenge of
terminal mobility (Rappaport 1996; Wang et al. 2009).
1.1 MOTIVATION
Mobility is movement of communication terminals and continuous connectivity within
the cell coverage area. The continuous connectivity of mobile users within the cell
without a reduction in services accessibility or users’ satisfaction in term of service
performance poses a serious problem. The problem becomes acute when a user
traverses to another cell. As a user crosses to another cell, the on-going processes on
user’s device may need to be transferred to a new set of network nodes (base station,
relay node and mobility management entity) within split second. The transfer is called
handover. Handover is a transfer of user equipment call or data session from one cell to
another cell to support user mobility and achieve better quality of service (De la Roche
and Allen 2012). The transfer should be done seamlessly without service interruption to
ongoing processes or the user being aware of such transfer. Therefore, maintaining
continuous connectivity, avoiding service interruption and ensuring user satisfaction as
well as making effective use of radio network resources make handover in cellular
network very critical.

5
1.2 RESEARCH PROBLEM
Mobility of user is an important factor in most modern wireless technology with a target
of high quality of service (QoS) and user satisfaction. Theoretical targets are sometimes
hard to achieve in real life considering effects of other factors on wireless medium such
as geographical landscape, building, weather and interference from other wireless
equipment using the same medium (Rappaport 1996). In order to maintain a significant
level of QoS especially for mobile user, it is important to keep track of the wireless
medium and put it to good use. Hence, every mobile user needs to keep track of its
wireless medium status.
As each mobile user moves within the cell, it sends reports of its wireless medium to
base station (serving base station) at interval which could either be periodic or non-
periodic (Donthi and Mehta 2010). The report gives the base station an estimate of the
channel quality of downlink for this particular user. Then, the base station uses the
measurement report from the user in combinations with other parameters to determine
when it is necessary to transfer (handover) the user to one of its neighbouring base
stations (target base station). If the report about the radio link of the wireless medium
given by the user to its serving base station is erroneous, then two problems ensue:
a) Firstly, the serving base station may fail to negotiate resources needed for user’s
handover at appropriate time thereby resulting in early or late handover initiation.
b) Secondly, the radio link may deteriorate to an extent that when the handover
command is eventually issued, the quality of the radio link may not be able to
support the services of the user which either results in poor QoS or termination of
services.
Hence, it is important to improve on accuracy of the downlink measurement to enhance
promptness and accurate handover decision for maintaining the high QoS demands of
mobile users.

6
1.3 OBJECTIVES
This work investigates Intra Radio Access Technology (Intra-RAT) handover between
homogenous LTE networks. It also assesses the measurement techniques in downlink
LTE. The challenges of downlink measurement for LTE handover are presented and two
types of measurement techniques are focused among others being studied. The main
goal is to improve the downlink measurement for the handover decision to facilitate
prompt and accurate handover decision making. To this end, the following objectives
are identified:
a) Analysis of features relevant to LTE downlink measurement for Intra-RAT
handover
b) Elucidation on LTE downlink measurement techniques with specific focus on the
most widely used technique which is used as a benchmark for the proposed
technique
c) Development of handover decision based on measurement from each of these
techniques - that is, the most common and proposed technique
d) Evaluation and comparison of the handover decision developed using the
techniques
The section below describes the approach adopted to achieve the above-mentioned
objectives, factors and tools used to realize the aim.
1.3.1 METHODOLOGY
LTE is a fairly new technology and standardization of several parts of the technology is
still ongoing. This implies that references and previous work on this specific subject in
the domain are limited. Therefore, 3GPP standardization documents and technical
drafts as well as previous work on handover in cellular network are relied upon.
In order to provide necessary background for this work, preliminary study of the LTE
technology is done. This provides useful information on various aspects of the
technology such as architecture, protocols and network elements used for this work.
7
This is followed by specific literature study and review of the research problem. The
literature study gives adequate insight into what is expected in terms of input and
output. Thereafter, a discussion is presented on method used and simulation tool
chosen for investigating the performance of the downlink handover measurement
techniques. This is followed by integration of the downlink measurement techniques
and handover decision into the simulation tool. Then, the work is being reviewed and
several simulation scenarios are investigated until desired result is achieved. The flow
chart in Figure 1.1 shows the successive steps followed during this study.

8
Figure 1.1: Flow chart of research study
Yes
No
Start
Preliminary study of LTE
Specific study of problem/Review of
related work
Theoretical understanding of input and
output (standard/technical requirements
and specifications, best practices, etc.)
Selection of LTE simulation tool for
handover/Comprehensive study of
the simulation tool
Work on LTE
downlink handover in
the simulation tool
Integration and handover decision
using measurement techniques
Evaluation and comparison
of handover decisions based
on the techniques
End
Review: Are the objectives
achieved?
Documentation
9
1.3.2 SIMULATION TOOL
An LTE system-level simulator is chosen to implement the study. The simulator is
designed by Ikuno, Wrulich and Rupp (2010) using object-oriented MATLAB
programming. The choice of the software tool is informed by the availability of other
LTE system aspects, free non-commercial use of the simulator for academic research
purposes, the adaptability of software modules to achieve research objectives and
reliability of result (Mehlführer et al.2011). The simulation tool is user friendly with
each LTE functional part clearly separated. The object oriented nature of the
programming eliminates redundancy and replication of the software modules. The tool
also benefits from a reservoir of functions available in the MATLAB function library
which are necessary for accurate computations of complex mathematical equations.
However, the simulation tool requires high computational power of a workstation. After
the necessary adjustment and modification of software module, a simulation script
containing the information for desired scenario is used as input. The overall LTE system
of the software tool functions based on the specification and configuration in the
simulation script. The output of the scenario is displayed in the MATLAB command
window and stored as a simulation trace in a separate file. The simulation trace is then
analyzed and presented in a readable manner such as graphs.
1.4 THESIS LAYOUT
The research study is mobility related evaluation. An adequate understanding of the
technology concepts and standards is fundamental to perform such thorough study.
Knowledge of the specifications and requirements for functionality and performance is
equally important to know if the technology implementation satisfies the conditions
stated in the 3GPP standards. Therefore this thesis provides an extensive overview of
concepts in the technology before delving into theory and simulation of handover
measurements.
The layout of this thesis is as follows. Chapter 2 introduces LTE in general as a fourth
generation (4G) mobile network technology. Chapter 3 then focuses on handover within
LTE. Chapter 4 presents the implementation in the simulation tool and discussion of

10
results. Then Chapter 5 provides a conclusion to the study in this thesis and
considerations for future work.
11
CHAPTER 2
LONG TERM EVOLUTION
This chapter presents an overview of Third Generation Partnership Project (3GPP) Long
Term Evolution (LTE) of Universal Mobile Telecommunication Systems (UMTS) which
is recognized as the fourth generation (4G) mobile network technology. The key concept
of LTE technology and specifications are explained in this chapter. The specifications,
white papers and technical documents for this new cellular technology are so vast and
various aspects of the specifications are still being reviewed. In order to keep with length
constraint of the thesis, this chapter gives a brief introduction to LTE technology and
dwells only on key aspects of the technology relating to handover.
2.1 MOTIVATION FOR LTE DEVELOPMENT
The LTE is developed by 3GPP as the technology to handle the demand of UMTS: a
technology that would provide a robust and sustainable wireless access than presently
offered by other available technologies. It should also support the exponential growth of
broadband needs of mobile users due to service and network systems convergence. The
provision of the mobile broadband should not only be limited to home or workplace but
everywhere. The ubiquitous provision of mobile broadband necessitates viewing from
both users’ and operators’ perspective. For users, the concern is on provision of high
downlink data rate that will enable real-time user services like video streaming, online
gaming and mobile television. In addition to high downlink data rate, accessibility of a
wide range of mobile devices, security, cost of service and convenience are also
important. The concern of operators, on the other hand, spans through issues such as
increased bandwidth access, migration from existing system to the new system, efficient
utilization of wireless spectrum and provision of higher capability to enable provision of
new services. Easing these concerns makes it important to standardize various aspects
of the LTE system. The standardization targets issues relating to LTE system
deployment and service performance requirements. The requirements involve various
aspects of LTE such as system architecture which focuses on system convergence by

12
defining how to accommodate existing 3GPP and other wireless technology, interface
specification as well as testing and verification.
2.2 LTE OVERVIEW
The 3GPP inaugurated project that commenced standardization of LTE at a workshop in
Toronto in November 2004 (Dahlman et al. 2010). The project involves a number of
telecommunication standardization bodies, researchers and development engineers.
The collaboration for the project led to joint development of specifications for LTE radio
access and non-radio aspect of the system. The standardization includes both the radio
access, Evolved UMTS Terrestrial Radio Access Network (E-UTRAN) and non-radio
aspect, Evolved Packet Core (EPC). Figure 2.1 shows the LTE technology radio access
network, E-UTRAN, and the core network, EPC.
S1-U
S1-U
S1-U
S1-MM
E
S1-M
ME
X2
X2
X2
S1-MME
eNodeB
eNodeBeNodeB
UE
MME S-GW
EPC
E-UTRAN
MME (Mobility Management Entity) S-GW (Serving Gateway)
Figure 2.1: LTE Network (3GPP 2008a)
The standardization involves setting new high level requirements to improve service
provisioning. A brief description of LTE requirement in comparison with other previous
3GPP technology is shown in table 1.
13
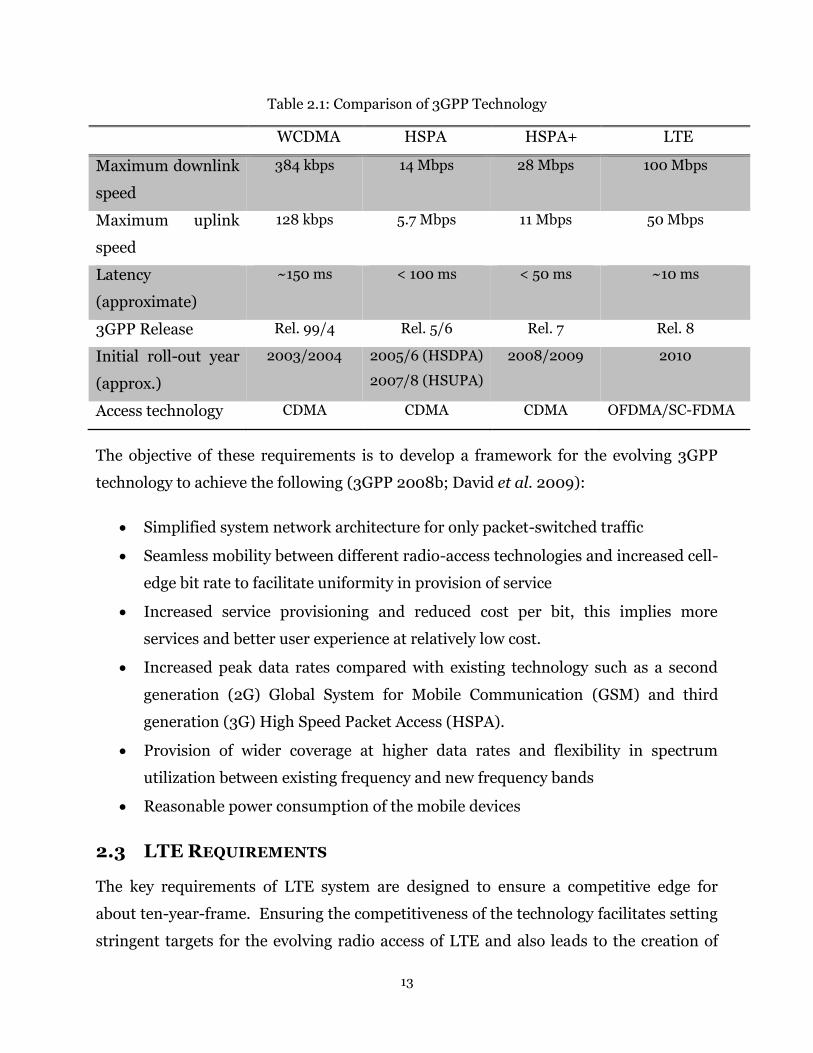
Table 2.1: Comparison of 3GPP Technology
WCDMA HSPA HSPA+ LTE
Maximum downlink
speed
384 kbps 14 Mbps 28 Mbps 100 Mbps
Maximum uplink
speed
128 kbps 5.7 Mbps 11 Mbps 50 Mbps
Latency
(approximate)
~150 ms < 100 ms < 50 ms ~10 ms
3GPP Release Rel. 99/4 Rel. 5/6 Rel. 7 Rel. 8
Initial roll-out year
(approx.)
2003/2004 2005/6 (HSDPA)
2007/8 (HSUPA)
2008/2009 2010
Access technology CDMA CDMA CDMA OFDMA/SC-FDMA
The objective of these requirements is to develop a framework for the evolving 3GPP
technology to achieve the following (3GPP 2008b; David et al. 2009):
Simplified system network architecture for only packet-switched traffic
Seamless mobility between different radio-access technologies and increased cell-
edge bit rate to facilitate uniformity in provision of service
Increased service provisioning and reduced cost per bit, this implies more
services and better user experience at relatively low cost.
Increased peak data rates compared with existing technology such as a second
generation (2G) Global System for Mobile Communication (GSM) and third
generation (3G) High Speed Packet Access (HSPA).
Provision of wider coverage at higher data rates and flexibility in spectrum
utilization between existing frequency and new frequency bands
Reasonable power consumption of the mobile devices
2.3 LTE REQUIREMENTS
The key requirements of LTE system are designed to ensure a competitive edge for
about ten-year-frame. Ensuring the competitiveness of the technology facilitates setting
stringent targets for the evolving radio access of LTE and also leads to the creation of
14
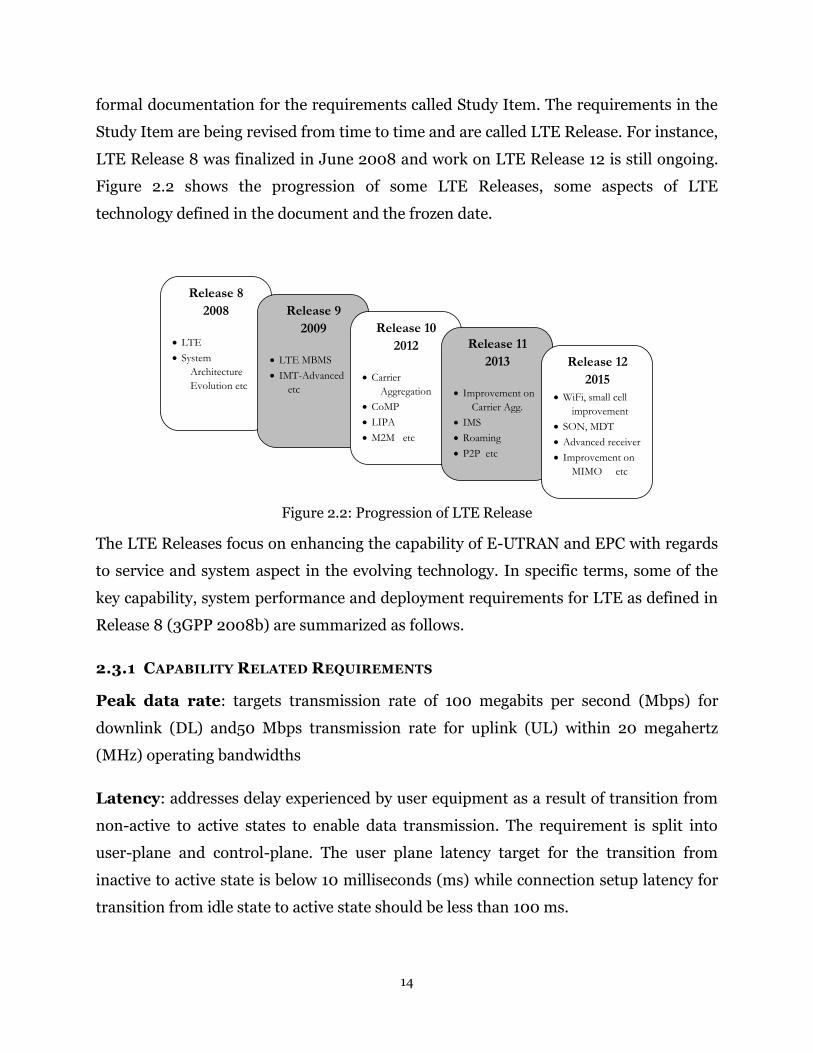
formal documentation for the requirements called Study Item. The requirements in the
Study Item are being revised from time to time and are called LTE Release. For instance,
LTE Release 8 was finalized in June 2008 and work on LTE Release 12 is still ongoing.
Figure 2.2 shows the progression of some LTE Releases, some aspects of LTE
technology defined in the document and the frozen date.
Release 8
2008
LTE
System
Architecture
Evolution etc
Release 9
2009
LTE MBMS
IMT-Advanced
etc
Release 10
2012
Carrier
Aggregation
CoMP
LIPA
M2M etc
Release 11
2013
Improvement on
Carrier Agg.
IMS
Roaming
P2P etc
Release 12
2015
WiFi, small cell
improvement
SON, MDT
Advanced receiver
Improvement on
MIMO etc
Figure 2.2: Progression of LTE Release
The LTE Releases focus on enhancing the capability of E-UTRAN and EPC with regards
to service and system aspect in the evolving technology. In specific terms, some of the
key capability, system performance and deployment requirements for LTE as defined in
Release 8 (3GPP 2008b) are summarized as follows.
2.3.1 CAPABILITY RELATED REQUIREMENTS
Peak data rate: targets transmission rate of 100 megabits per second (Mbps) for
downlink (DL) and50 Mbps transmission rate for uplink (UL) within 20 megahertz
(MHz) operating bandwidths
Latency: addresses delay experienced by user equipment as a result of transition from
non-active to active states to enable data transmission. The requirement is split into
user-plane and control-plane. The user plane latency target for the transition from
inactive to active state is below 10 milliseconds (ms) while connection setup latency for
transition from idle state to active state should be less than 100 ms.

15
Mobile terminal capacity: for operation within the 5 MHz spectrum allocation, the
number of supported mobile terminals should not be less than 200. Likewise, in a
higher operating bandwidth beyond 5 MHz at least 400 mobile terminals should be
supported.
2.3.2 SYSTEM PERFORMANCE REQUIREMENTS
User throughput: is used to assess the delivery of consistent user experience across
the cell coverage area and usually scaled with spectrum bandwidth. The target is set in
terms of average user throughput and cell edge user throughput. The average user
throughput per megahertz specification for both downlink and uplink are 3-4 times and
2-3 times that of Release 6 respectively (3GPP 2008b).
Cell spectral efficiency: is the target to be achieved within cell in terms of the
normalized system data rate of bandwidth and the number of cells. Peak spectral
efficiency target is 52 and 2 bits per second per hertz (bps/Hz) for DL and UL
respectively. Average cell spectral efficiency target is set to be 1.69 bps/Hz per cell for
DL and 0.74 bps/Hz per cell for UL. Likewise, the cell edge user spectral efficiency
requirement is 0.05 and 0.024 bps/Hz per cell for DL and UL respectively.
Mobility: is the performance requirement relative to the speed of the mobile terminal
across the cellular network. The specification is that radio access network should be
optimized for low terminal speed between 0-15 kilometres per hour (km/h) while higher
performance should be guaranteed at higher terminal speed between 15-120 km/h. For
higher terminal speed between 120-350 km/h, mobility of the user across the cellular
network should be sustained.
Coverage: is to enable flexibility in various deployment scenarios to support reuse of
the existing radio access network sites and same carrier frequency while complying with
the user throughput, cell spectral efficiency and mobility performance target. The E-
UTRAN coverage target should support deployment scenarios of varying cell range such
as 0-5 kilometres (km), 0-30 km and 0-100 km.
16
2.3.3 DEPLOYMENT REQUIREMENTS
Spectrum flexibility: specifies allocation of spectrum into different sizes such as 1.25,
2.5, 5.0, 10, 15 and 20 MHz. This allows scalability and optimal usage of available
spectrum to support transmission in the downlink and uplink as well as facilitate
operation in both paired and unpaired spectrum.
Coexistence and Internetworking: states the requirements for inter-networking
between the LTE radio access and other 3GPP systems. The specification states target
for E-UTRAN terminal, E-UTRAN measurement and handover interruption time
between the various systems. For instance, handover interruption time for real-time
services of terminal moving from E-UTRAN to Universal Terrestrial Radio Access
Network (UTRAN) is less than 300 ms while the handover interruption time
requirement for non-real-time service between E-UTRAN and GSM EDGE Radio Access
Network (GERAN) is less than 500 ms.
An overview of LTE key requirements is shown in Table 2.2.
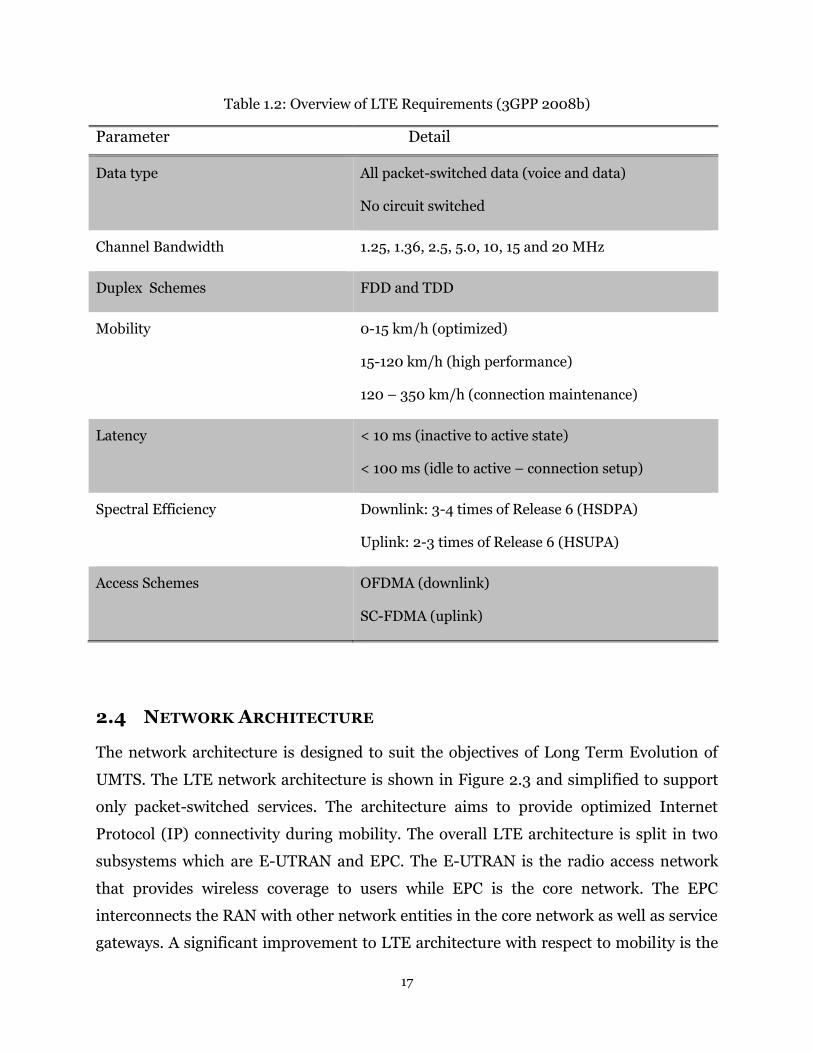
17
Table 1.2: Overview of LTE Requirements (3GPP 2008b)
Parameter Detail
Data type All packet-switched data (voice and data)
No circuit switched
Channel Bandwidth 1.25, 1.36, 2.5, 5.0, 10, 15 and 20 MHz
Duplex Schemes FDD and TDD
Mobility 0-15 km/h (optimized)
15-120 km/h (high performance)
120 – 350 km/h (connection maintenance)
Latency < 10 ms (inactive to active state)
< 100 ms (idle to active – connection setup)
Spectral Efficiency Downlink: 3-4 times of Release 6 (HSDPA)
Uplink: 2-3 times of Release 6 (HSUPA)
Access Schemes OFDMA (downlink)
SC-FDMA (uplink)
2.4 NETWORK ARCHITECTURE
The network architecture is designed to suit the objectives of Long Term Evolution of
UMTS. The LTE network architecture is shown in Figure 2.3 and simplified to support
only packet-switched services. The architecture aims to provide optimized Internet
Protocol (IP) connectivity during mobility. The overall LTE architecture is split in two
subsystems which are E-UTRAN and EPC. The E-UTRAN is the radio access network
that provides wireless coverage to users while EPC is the core network. The EPC
interconnects the RAN with other network entities in the core network as well as service
gateways. A significant improvement to LTE architecture with respect to mobility is the
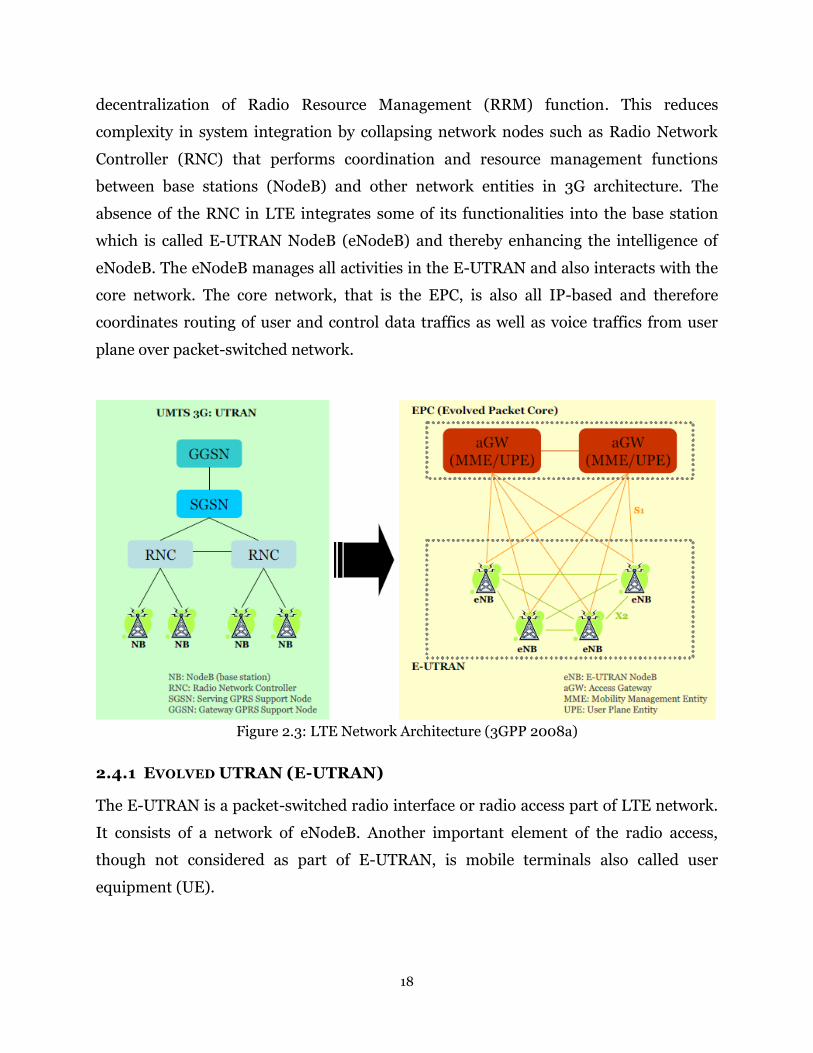
18
decentralization of Radio Resource Management (RRM) function. This reduces
complexity in system integration by collapsing network nodes such as Radio Network
Controller (RNC) that performs coordination and resource management functions
between base stations (NodeB) and other network entities in 3G architecture. The
absence of the RNC in LTE integrates some of its functionalities into the base station
which is called E-UTRAN NodeB (eNodeB) and thereby enhancing the intelligence of
eNodeB. The eNodeB manages all activities in the E-UTRAN and also interacts with the
core network. The core network, that is the EPC, is also all IP-based and therefore
coordinates routing of user and control data traffics as well as voice traffics from user
plane over packet-switched network.
Figure 2.3: LTE Network Architecture (3GPP 2008a)
2.4.1 EVOLVED UTRAN (E-UTRAN)
The E-UTRAN is a packet-switched radio interface or radio access part of LTE network.
It consists of a network of eNodeB. Another important element of the radio access,
though not considered as part of E-UTRAN, is mobile terminals also called user
equipment (UE).

19
The UE is a mobile terminal usually a handheld device that connects to eNodeB over the
radio interface. The connection between the UE and the network is secured through
Universal Subscriber Identity Module (USIM). The USIM provides a unique identity to
the UE and sufficient security through function such as encryption, authentication and
data integrity.
The eNodeB connects UEs by providing the wireless access coverage. It also serves as
the anchor between the UE in E-UTRAN and EPC. Since there is no centralized RNC in
the E-UTRAN, the eNodeB performs coordination of user traffics and resource
management function between UEs. Each eNodeB interconnects with its neighbours
through an interface called X2 and to the EPC by means of S1 interface. The
interconnections between the eNodeB in the E-UTRAN allow scalability and prevent
single point of failure. Also, the interfaces that provide interconnections between
various network elements are all standardized to allow interoperability between
different vendors.
2.4.2 EVOLVED PACKET CORE (EPC)
The EPC consists of several logical nodes and is responsible for overall control of UE in
radio network with other packet data network (PDN). The logical nodes which made up
an essential part of the EPC are the PDN Gateway (P-GW), Serving Gateway (S-GW) and
Mobility Management Entity (MME). Figure 2.4 shows LTE Evolved Packet System
(EPS).
20
SGi
Rx Gx
S5/S8 S1-U
S11
S6a
S1-MME
LTE-Uu Operator’s IP services
PDN Gateway
PCRF
UE Serving Gateway
eNodeB
HSS
MME
E-UTRAN EPC
Legend
Traffic
Signal
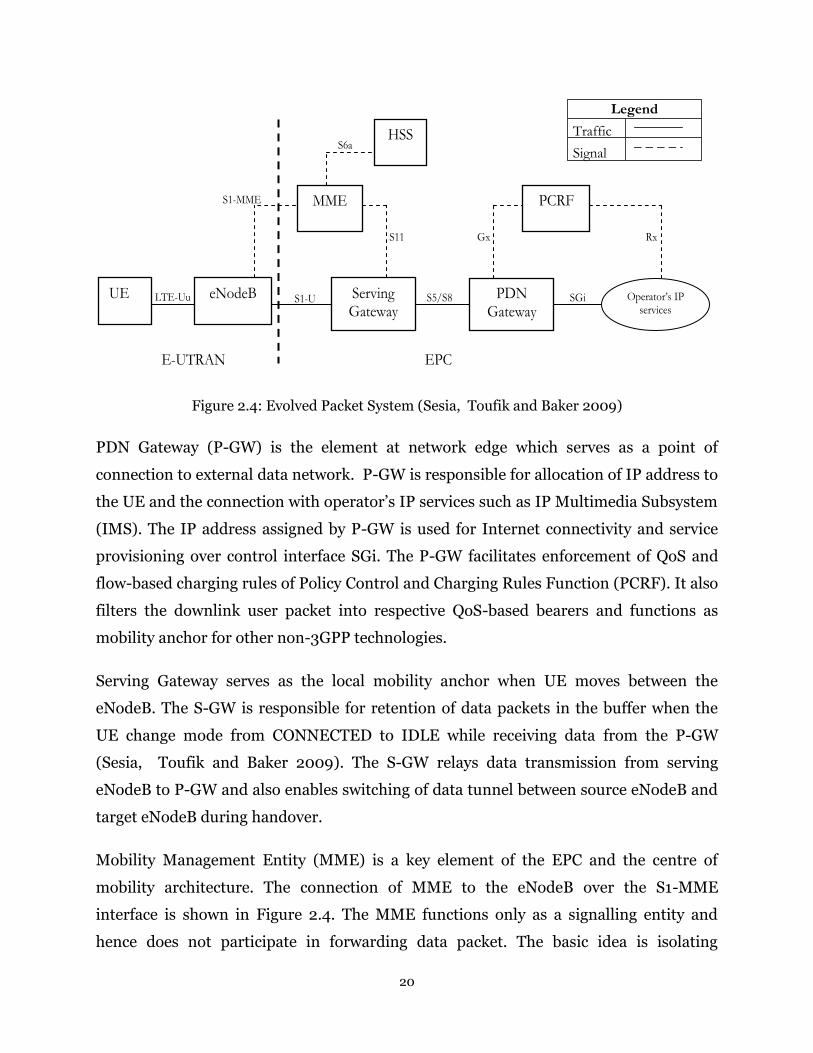
Figure 2.4: Evolved Packet System (Sesia, Toufik and Baker 2009)
PDN Gateway (P-GW) is the element at network edge which serves as a point of
connection to external data network. P-GW is responsible for allocation of IP address to
the UE and the connection with operator’s IP services such as IP Multimedia Subsystem
(IMS). The IP address assigned by P-GW is used for Internet connectivity and service
provisioning over control interface SGi. The P-GW facilitates enforcement of QoS and
flow-based charging rules of Policy Control and Charging Rules Function (PCRF). It also
filters the downlink user packet into respective QoS-based bearers and functions as
mobility anchor for other non-3GPP technologies.
Serving Gateway serves as the local mobility anchor when UE moves between the
eNodeB. The S-GW is responsible for retention of data packets in the buffer when the
UE change mode from CONNECTED to IDLE while receiving data from the P-GW
(Sesia, Toufik and Baker 2009). The S-GW relays data transmission from serving
eNodeB to P-GW and also enables switching of data tunnel between source eNodeB and
target eNodeB during handover.
Mobility Management Entity (MME) is a key element of the EPC and the centre of
mobility architecture. The connection of MME to the eNodeB over the S1-MME
interface is shown in Figure 2.4. The MME functions only as a signalling entity and
hence does not participate in forwarding data packet. The basic idea is isolating
21
signalling and traffic so as to enable network capacity of each to growth independently
(Khan 2009). Some of the functions of MME include management of tracking area list,
selection of P-GW/S-GW, locating UE in IDLE mode, roaming and bearer management.
It also performs user authentication and security function through the S6a interface
with Home Subscriber Sever (HSS) and hence facilitates access restriction for roaming
as well as enforcing user’s predefined QoS profile. The MME is also plays major role in
interworking with other legacy network and during intra-system handover.
2.5 LTE PROTOCOL STRUCTURE
This section explains the protocol structure for LTE system. LTE protocol is similar to
the conceptual model defined by Open System Interconnection (OSI) reference model
(Zimmermann 1980). In the OSI model, the function of each communication system is
split into various partitions consisting of abstract layers. Each layer within the protocol
stack communicates with one directly linked to it (above or below) and sometimes adds
more features to the layer below. The function definition at each layer allows easy
standardization and also provides a framework whereby changes in functionality at a
layer do not affect the other layers. Similarly, the LTE protocol structure is divided into
series of abstraction layers and further separated into user and control plane which
allow independence.
On the user plane, the data packets created by applications from the core network are
encapsulated using a specific protocol and tunnelled from the P-GW through the
eNodeB to the user. The control plane, on the contrary, deals with the signalling
messages and radio specific functionality from the MME to the user (Rayal 2010; Ali-
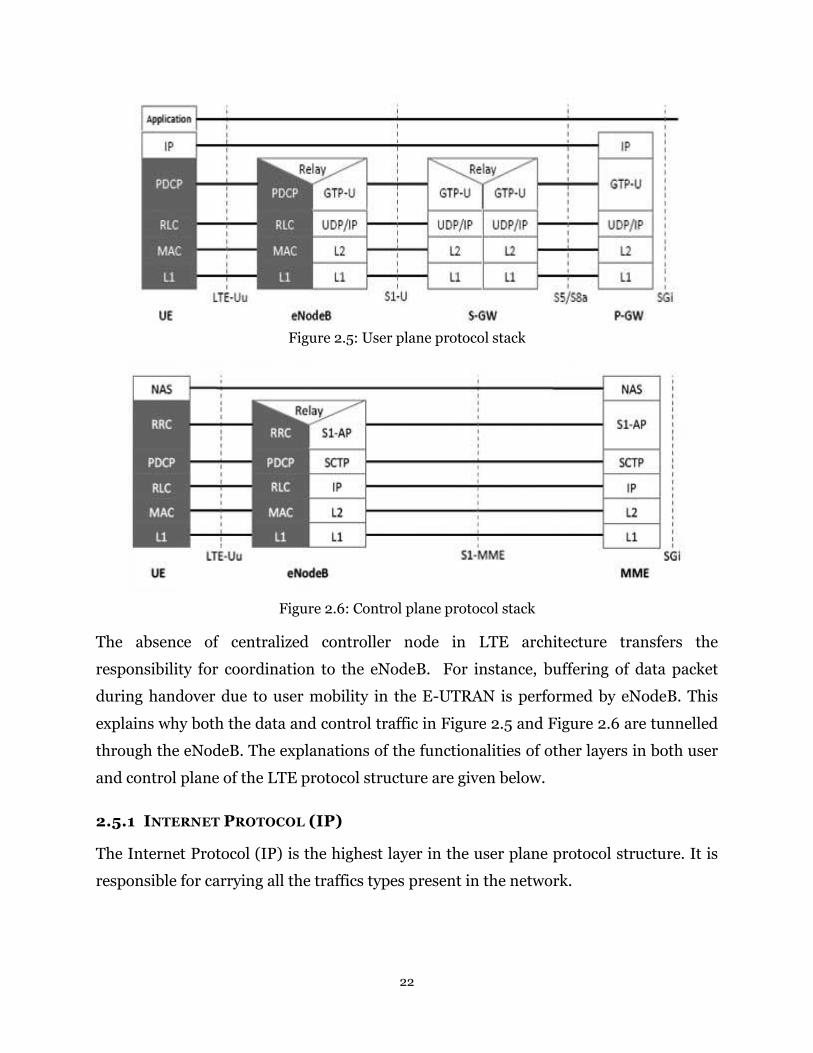
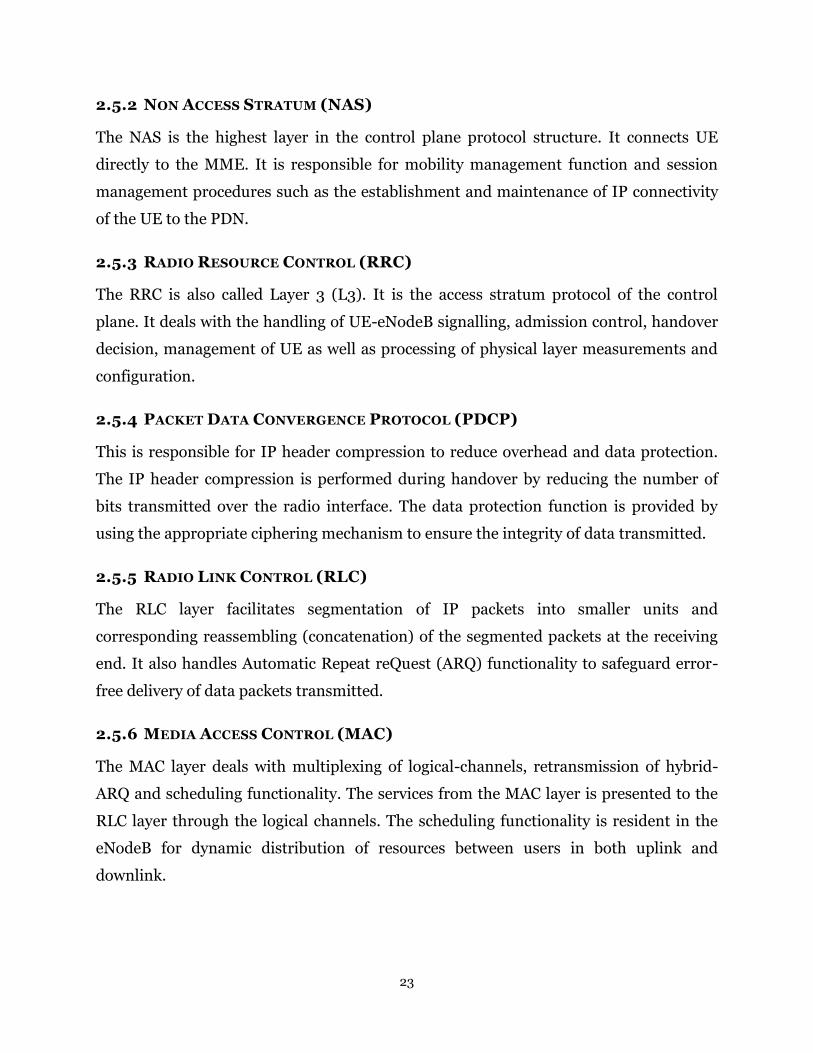
Yahiya 2011). Figure 2.5 and Figure 2.6 show the protocol stack for the EUTRAN user
plane and control plane respectively.
22
Figure 2.5: User plane protocol stack
Figure 2.6: Control plane protocol stack
The absence of centralized controller node in LTE architecture transfers the
responsibility for coordination to the eNodeB. For instance, buffering of data packet
during handover due to user mobility in the E-UTRAN is performed by eNodeB. This
explains why both the data and control traffic in Figure 2.5 and Figure 2.6 are tunnelled
through the eNodeB. The explanations of the functionalities of other layers in both user
and control plane of the LTE protocol structure are given below.
2.5.1 INTERNET PROTOCOL (IP)
The Internet Protocol (IP) is the highest layer in the user plane protocol structure. It is
responsible for carrying all the traffics types present in the network.
23
2.5.2 NON ACCESS STRATUM (NAS)
The NAS is the highest layer in the control plane protocol structure. It connects UE
directly to the MME. It is responsible for mobility management function and session
management procedures such as the establishment and maintenance of IP connectivity
of the UE to the PDN.
2.5.3 RADIO RESOURCE CONTROL (RRC)
The RRC is also called Layer 3 (L3). It is the access stratum protocol of the control
plane. It deals with the handling of UE-eNodeB signalling, admission control, handover
decision, management of UE as well as processing of physical layer measurements and
configuration.
2.5.4 PACKET DATA CONVERGENCE PROTOCOL (PDCP)
This is responsible for IP header compression to reduce overhead and data protection.
The IP header compression is performed during handover by reducing the number of
bits transmitted over the radio interface. The data protection function is provided by
using the appropriate ciphering mechanism to ensure the integrity of data transmitted.
2.5.5 RADIO LINK CONTROL (RLC)
The RLC layer facilitates segmentation of IP packets into smaller units and
corresponding reassembling (concatenation) of the segmented packets at the receiving
end. It also handles Automatic Repeat reQuest (ARQ) functionality to safeguard error-
free delivery of data packets transmitted.
2.5.6 MEDIA ACCESS CONTROL (MAC)
The MAC layer deals with multiplexing of logical-channels, retransmission of hybrid-
ARQ and scheduling functionality. The services from the MAC layer is presented to the
RLC layer through the logical channels. The scheduling functionality is resident in the
eNodeB for dynamic distribution of resources between users in both uplink and
downlink.

24
2.5.7 PHYSICAL LAYER (PHY)
The Physical Layer is also referred to as Layer 1 (L 1). The PHY layer handles radio
interface measurements, coding/decoding, antenna-mapping,
modulation/demodulation functions. The PHY layer (L 1) measurements are presented
directly to L 3 for processing which is vital to handover decision. The PHY layer services
are presented to the MAC layer through transport channels.

25
CHAPTER 3
HANDOVER IN LTE
This chapter presents an important aspect of LTE technology that is mobility which has
several advantages. The mobility entails that nomadic users are always connected within
the radio access network. As a mobile user moves within the radio access network, the
connection of the user has to be transferred (handover) between cells to maintain
continuous service provision. The key principle in handover design is enabling seamless
mobility and uninterrupted service transition between cells during handover.
3.1 LTE HANDOVER OVERVIEW
Handover is an essential part of Radio Resource Management (RRM) and it involves
transfer of user equipment (UE) call or data session from one cell to another to facilitate
continuous connection. The main aim of handover is the maintenance of quality of
service and preservation of cellular system capacity. Handover in LTE is UE-assisted
network controlled. The handover is of two types which are Intra Radio Access
Technology (Intra-RAT) and Inter Radio Access Technology (Inter-RAT). LTE Intra-
RAT handover is purely hard handover and involves transfer between similar (LTE)
technologies while Inter-RAT handover is soft handover involving dissimilar
technologies.
This study investigates LTE Intra-RAT handover which is hard handover. The hard
handover, also called “break-before-make”, implies termination of connection with
serving eNodeB of the old cell before establishing a connection with target eNodeB in
the new cell. The brief interruption in the user plane by hard handover may cause data
loss. Therefore, a mechanism must be in place to reduce the amount of data loss.
Seamless or lossless mode is used for downlink packet data forwarding to minimize the
amount of data loss in the user plane (Amin and Yla-Jaaski 2013; Sesia, Toufik and
Baker 2012).
26
3.2 LTE AIR INTERFACE
The LTE air interface is viewed as a matter of utmost concern since it may create
bottlenecks in the radio link. The air interface sometimes contributes to several user
delays in wireless networks because of the nature of the wireless environment. For
example, a user's delay involving handover may result in reduced quality of service for
ongoing communication or service termination. Therefore, a special attention is given to
LTE air interface technology such as carrier technology, modulation schemes and
antenna technology.
The LTE air interface adopts multicarrier technology. The multicarrier technology
subdivides the available transmission bandwidth into parallel sub-channels. A classic
example of multicarrier technology is frequency division multiplexing in which each
user is separated from another spectrally allowing multiple users to use separate
channels and aggregate channel bandwidth is equal to the transmission bandwidth
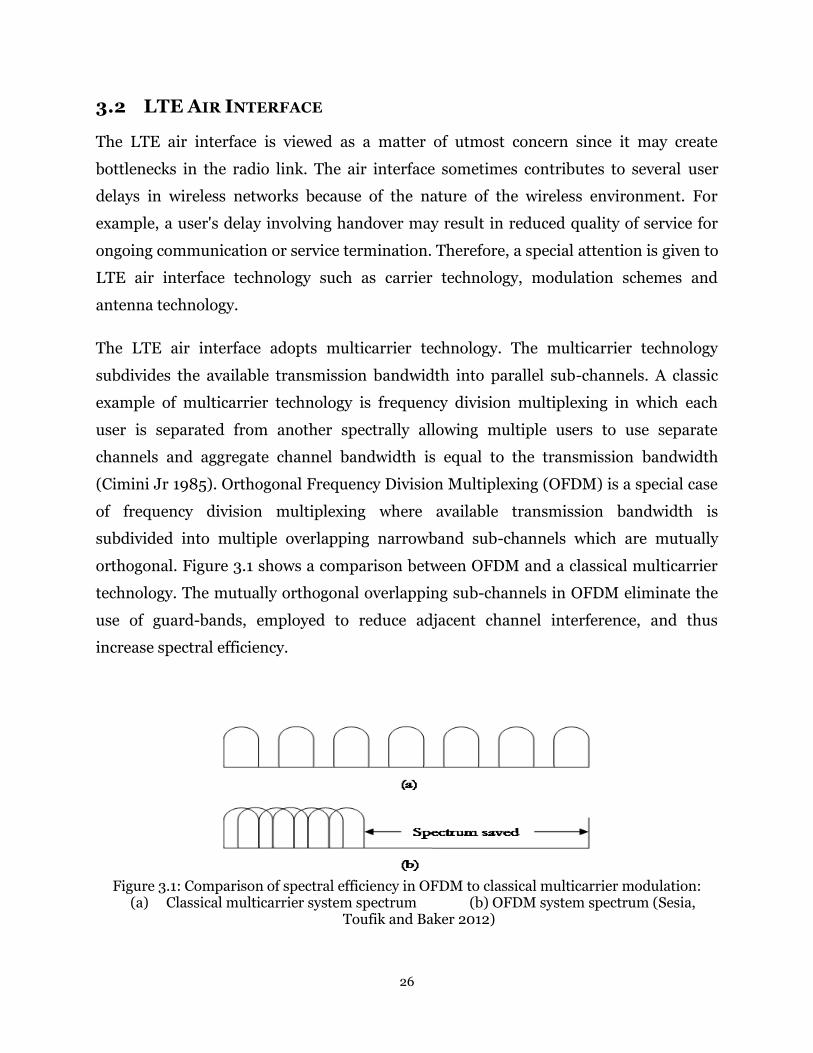
(Cimini Jr 1985). Orthogonal Frequency Division Multiplexing (OFDM) is a special case
of frequency division multiplexing where available transmission bandwidth is
subdivided into multiple overlapping narrowband sub-channels which are mutually
orthogonal. Figure 3.1 shows a comparison between OFDM and a classical multicarrier
technology. The mutually orthogonal overlapping sub-channels in OFDM eliminate the
use of guard-bands, employed to reduce adjacent channel interference, and thus
increase spectral efficiency.
Figure 3.1: Comparison of spectral efficiency in OFDM to classical multicarrier modulation:
(a) Classical multicarrier system spectrum (b) OFDM system spectrum (Sesia, Toufik and Baker 2012)
27
The OFDM is used in broadcast wireless systems such as Digital Audio Broadcasting
(DAB) and Digital Video Broadcasting (DVB) as well as low-power wireless systems like
Wireless Fidelity (Wi-Fi). These systems benefits from OFDM low-complexity receiver
architecture, robustness against multipath fading and ability to operate in different
channel bandwidth depending on available spectrum (Cimini Jr 1985; Sesia, Toufik and
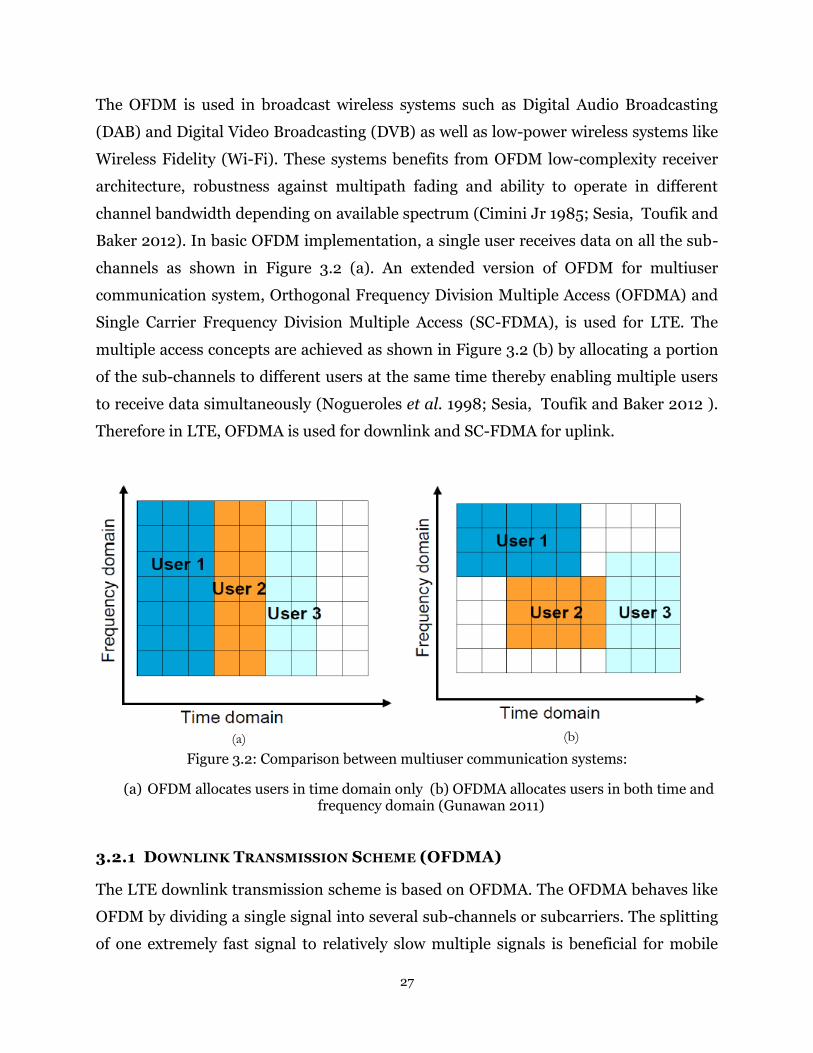
Baker 2012). In basic OFDM implementation, a single user receives data on all the sub-
channels as shown in Figure 3.2 (a). An extended version of OFDM for multiuser
communication system, Orthogonal Frequency Division Multiple Access (OFDMA) and
Single Carrier Frequency Division Multiple Access (SC-FDMA), is used for LTE. The
multiple access concepts are achieved as shown in Figure 3.2 (b) by allocating a portion
of the sub-channels to different users at the same time thereby enabling multiple users
to receive data simultaneously (Nogueroles et al. 1998; Sesia, Toufik and Baker 2012 ).
Therefore in LTE, OFDMA is used for downlink and SC-FDMA for uplink.
(a) (b)
Figure 3.2: Comparison between multiuser communication systems:
(a) OFDM allocates users in time domain only (b) OFDMA allocates users in both time and frequency domain (Gunawan 2011)
3.2.1 DOWNLINK TRANSMISSION SCHEME (OFDMA)
The LTE downlink transmission scheme is based on OFDMA. The OFDMA behaves like
OFDM by dividing a single signal into several sub-channels or subcarriers. The splitting
of one extremely fast signal to relatively slow multiple signals is beneficial for mobile

28
access and allows robustness against multipath distortion experience by a single signal.
The signals from several subcarriers are then collected at the receiver to obtain high
speed transmission. Also in OFDMA, a portion of the subcarriers is dynamically
assigned to several users thereby facilitating multiuser access. The allocation in time
domain is also performed to achieve multiuser access by dividing a group of subcarriers
within the same frequency domain to different users for specific time duration. The time
domain multiple allocations of subcarriers are called Time Division Multiple Access
(TDMA). A group of subcarriers in time-frequency blocks is known as Physical Resource
Block (PRB). Figure 3.3 (a) shows a group of subcarriers representing one PRB in both
time and frequency domain.
(a) (b)
Figure 3.3: LTE downlink physical resource block (Dahlman et al. 2010)
Figure 3.3 (b) is the frequency domain illustration of a downlink subcarriers group
representing one resource block. The resource block consists of 12 consecutive
subcarriers, with 15 kilohertz (kHz) subcarrier spacing, corresponding to resource block
bandwidth of 180 kHz. Therefore, LTE downlink carrier ranges from six to hundreds of
resource block according to downlink transmission bandwidth of 1.25 MHz to 20 MHz.
3.2.2 UPLINK TRANSMISSION SCHEME (SC-FDMA)
The uplink transmission scheme of LTE is based on SC-FDMA. The SC-FDMA is chosen
because it reduces the variation in instantaneous transmit power, the Peak-to-Average-
Power-Ratio (PAPR), experienced with OFDM. This attribute makes possible the design
of an efficient and a cost-effective power amplifier. Therefore, the SC-FDMA is generally
referred to as Discrete Fourier Transform (DFT) based OFDMA. Similar to OFDMA, SC-
FDMA also operates in time-frequency domain and signal processing has a lot in
common which allows parameters in both downlink and uplink to be harmonized.

29
3.3 LTE FRAME STRUCTURE
The transmission in downlink and uplink are arranged into radio frames with duration
of 10ms. The radio frame is further divided into ten 1ms subframes with each being split
into two slots of 0.5ms. The radio frame structure for both Frequency Division Duplex
(FDD) and Time Division Duplex (TDD) are supported. The generic frame structure for
LTE is shown in Figure 3.4.
# 0 # 2 # 3 # 4# 1 # 18 # 19
One radio frame = 10 ms
One slot = 0.5 ms
One subframe = 1 ms
Figure 3.4: LTE frame structure (3GPP 2008a)
The subframes within one radio frame can be used for either downlink or uplink
transmission (3GPP 2006; 3GPP 2008a; Dahlman et al. 2010). For instance, all
subframes operating in FDD are used entirely for either downlink or uplink
transmission. The subframes in TDD, on the other hand, are flexibly assigned for use
between downlink and uplink.
3.3.1 UE MEASUREMENT
The UE control plane protocol, Access Stratum (AS), handles radio-related
functionalities and also interacts with the Non-Access Stratum (NAS). The radio-related
functions of AS is dependent on the state of UE whether it is connected or not. The UE
state, in other words, is called the Radio Resource Control (RRC) state which is either
RRC_CONNECTED or RRC_IDLE (ETSI 2009; Sesia, Toufik and Baker 2012). The UE
in active mode, that is RRC-CONNECTED state, has to monitor the control channel to
facilitate dynamic allocation of network (E-UTRAN) shared resource. Therefore, the UE
provides the E-UTRAN with measurements on its downlink channel quality (from its
cell and neighboring cells) to enable selection of the appropriate cell to connect. The UE
measurement is necessary to allow mobility of the user within and between the E-
UTRAN. Two types of UE measurements specified for E-UTRAN are Reference Signal
30
Received Power (RSRP) and Reference Signal Receive Quality (RSRQ) (3GPP
2010;ETSI 2009).
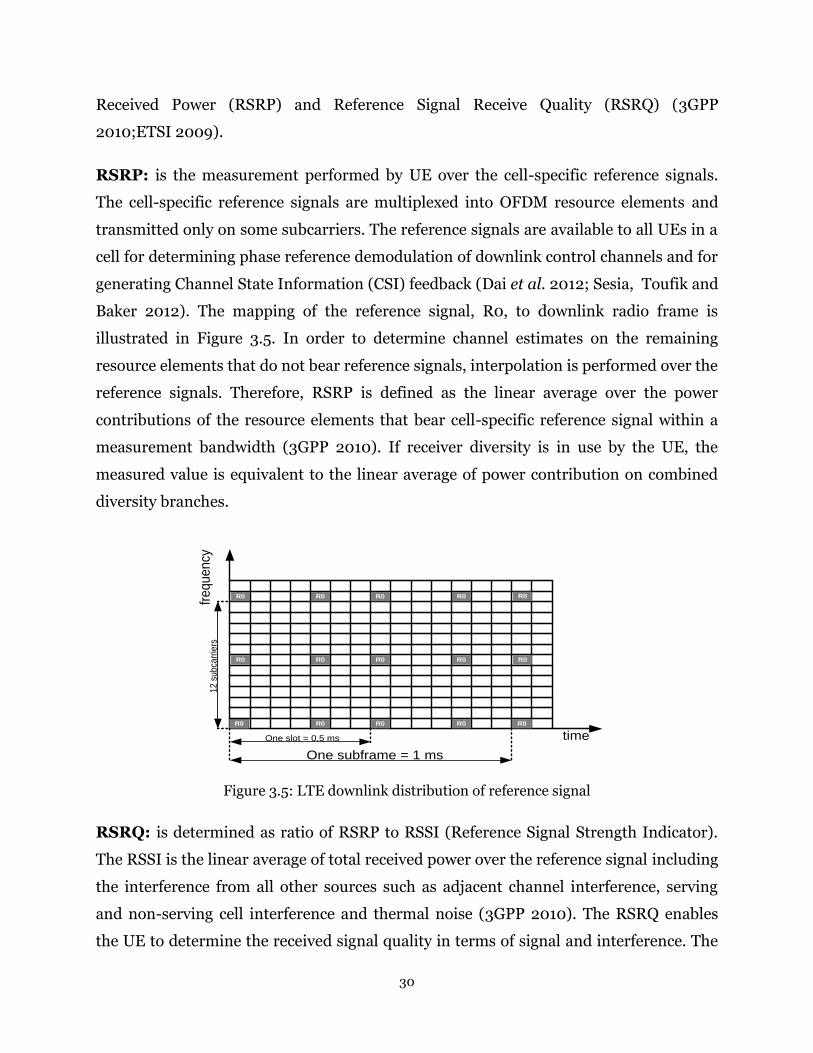
RSRP: is the measurement performed by UE over the cell-specific reference signals.
The cell-specific reference signals are multiplexed into OFDM resource elements and
transmitted only on some subcarriers. The reference signals are available to all UEs in a
cell for determining phase reference demodulation of downlink control channels and for
generating Channel State Information (CSI) feedback (Dai et al. 2012; Sesia, Toufik and
Baker 2012). The mapping of the reference signal, R0, to downlink radio frame is
illustrated in Figure 3.5. In order to determine channel estimates on the remaining
resource elements that do not bear reference signals, interpolation is performed over the
reference signals. Therefore, RSRP is defined as the linear average over the power
contributions of the resource elements that bear cell-specific reference signal within a
measurement bandwidth (3GPP 2010). If receiver diversity is in use by the UE, the
measured value is equivalent to the linear average of power contribution on combined
diversity branches.
R0
R0
R0
R0 R0 R0 R0
R0 R0
R0 R0 R0
R0 R0
R0
One subframe = 1 ms
One slot = 0.5 ms time
fre
qu
en
cy1
2 s
ub
carr
iers
Figure 3.5: LTE downlink distribution of reference signal
RSRQ: is determined as ratio of RSRP to RSSI (Reference Signal Strength Indicator).
The RSSI is the linear average of total received power over the reference signal including
the interference from all other sources such as adjacent channel interference, serving
and non-serving cell interference and thermal noise (3GPP 2010). The RSRQ enables
the UE to determine the received signal quality in terms of signal and interference. The

31
RSRQ is therefore essential for handover within the E-UTRAN since the quality varies
with location of users within the cell. The RSRQ is defined in equation (3-1)
(3-1)
where N is the number of resource blocks used for calculating the RSRP. It should also
be noted that the number of resource block used in the calculation of RSRP and RSSI
must be the same (3GPP 2010).
The UE measurement is performed on the downlink and used for handover. In order to
use UE measurement for handover, the measurement must to be processed at the PHY
layer (L 1) and RRC layer (L 3) as shown is Figure 3.6 (ETSI 2012a). The following
sections explain the concepts of L 1 and L 3 processing of downlink handover
measurement.
Downlink
measurement
Handover
parameters Filter
parameters
Measurement Reporting Processing
Layer 3 filtering
Handover evaluation
Criteria
Layer 1 filtering
Decision
Figure 3.6: LTE handover measurement and filtering
3.3.2 L 1 FILTERING
The downlink measurement is performed on the physical layer (L 1) of LTE. The
physical layer of LTE is based on OFDMA access technology and is known to be robust
against multipath distortion experienced on high frequency selective channel. The
robustness is achieved by splitting the distortion or fading across several subcarriers to
simplify channel equalization at the receiver. At the receiver, the whole knowledge of the
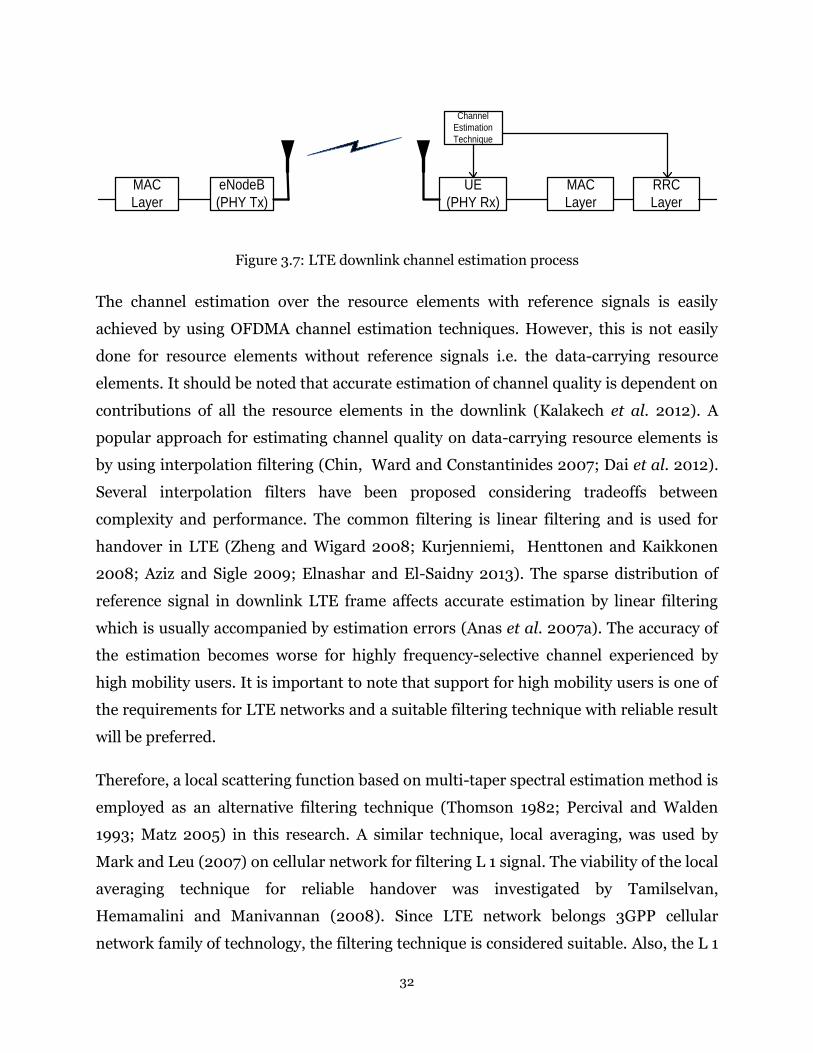
channel is needed to perform coherent detection and decoding. Figure 3.7 depicts LTE
downlink channel estimation process.
32
RRC
Layer
MAC
Layer
eNodeB
(PHY Tx)
Channel
Estimation
Technique
UE
(PHY Rx)
MAC
Layer
Figure 3.7: LTE downlink channel estimation process
The channel estimation over the resource elements with reference signals is easily
achieved by using OFDMA channel estimation techniques. However, this is not easily
done for resource elements without reference signals i.e. the data-carrying resource
elements. It should be noted that accurate estimation of channel quality is dependent on
contributions of all the resource elements in the downlink (Kalakech et al. 2012). A
popular approach for estimating channel quality on data-carrying resource elements is
by using interpolation filtering (Chin, Ward and Constantinides 2007; Dai et al. 2012).
Several interpolation filters have been proposed considering tradeoffs between
complexity and performance. The common filtering is linear filtering and is used for
handover in LTE (Zheng and Wigard 2008; Kurjenniemi, Henttonen and Kaikkonen
2008; Aziz and Sigle 2009; Elnashar and El-Saidny 2013). The sparse distribution of
reference signal in downlink LTE frame affects accurate estimation by linear filtering
which is usually accompanied by estimation errors (Anas et al. 2007a). The accuracy of
the estimation becomes worse for highly frequency-selective channel experienced by
high mobility users. It is important to note that support for high mobility users is one of
the requirements for LTE networks and a suitable filtering technique with reliable result
will be preferred.
Therefore, a local scattering function based on multi-taper spectral estimation method is
employed as an alternative filtering technique (Thomson 1982; Percival and Walden
1993; Matz 2005) in this research. A similar technique, local averaging, was used by
Mark and Leu (2007) on cellular network for filtering L 1 signal. The viability of the local
averaging technique for reliable handover was investigated by Tamilselvan,
Hemamalini and Manivannan (2008). Since LTE network belongs 3GPP cellular
network family of technology, the filtering technique is considered suitable. Also, the L 1

33
filtering technique is implementation dependent and not restricted by LTE standard
(3GPP 2011).
3.3.3 L 3 FILTERING
The L 3 filtering is standardized for handover decision in LTE and to ensure that an
instantaneous L 1 measurement does not trigger an undesirable action (Anas et al.
2007b; 3GPP 2009). It has been observed that application of L 3 filtering eliminates
“ping-pong” handover - a situation whereby user handover to a cell for a better quality
and due to interference handover again to the original cell with a few time (Anas et al.
2007b). The L 3 filtering is performed on local averaged L 1 signal to make it suitable for
handover decision in LTE. The effect of L 3 filtering is then observed on handover
performance.
3.4 LTE DOWNLINK CHANNEL ESTIMATION
This section presents architecture of an OFDM transmitter and receiver used in LTE
downlink and also explains the concept of channel estimation by using the filtering
techniques. Figure 3.8 shows a typical implementation of an OFDM transmitter.
Serial to
Parallel
Converter
Signal
Constellation
Mapper
(MCS e.g. QPSK,
QAM)
∑
S0
S1
SL-1
Y1
YL-1
Y0
Figure 3.8: An implementation of an OFDM transmitter
As shown in Figure 3.8, a serial data symbol is passed through a serial to parallel
converter to generate an L-dimension parallel data block S[k] = [S0[k], S1[k], …, SL-
1[k]]T. Each component of the parallel data streams is independently modulated
resulting in complex vector Y[k] = [Y0[k], Y1[k], …, YL-1[k]]T used as input to an M-
34
input Inverse Fast Fourier Transpose (IFFT) to generate a time-domain M complex
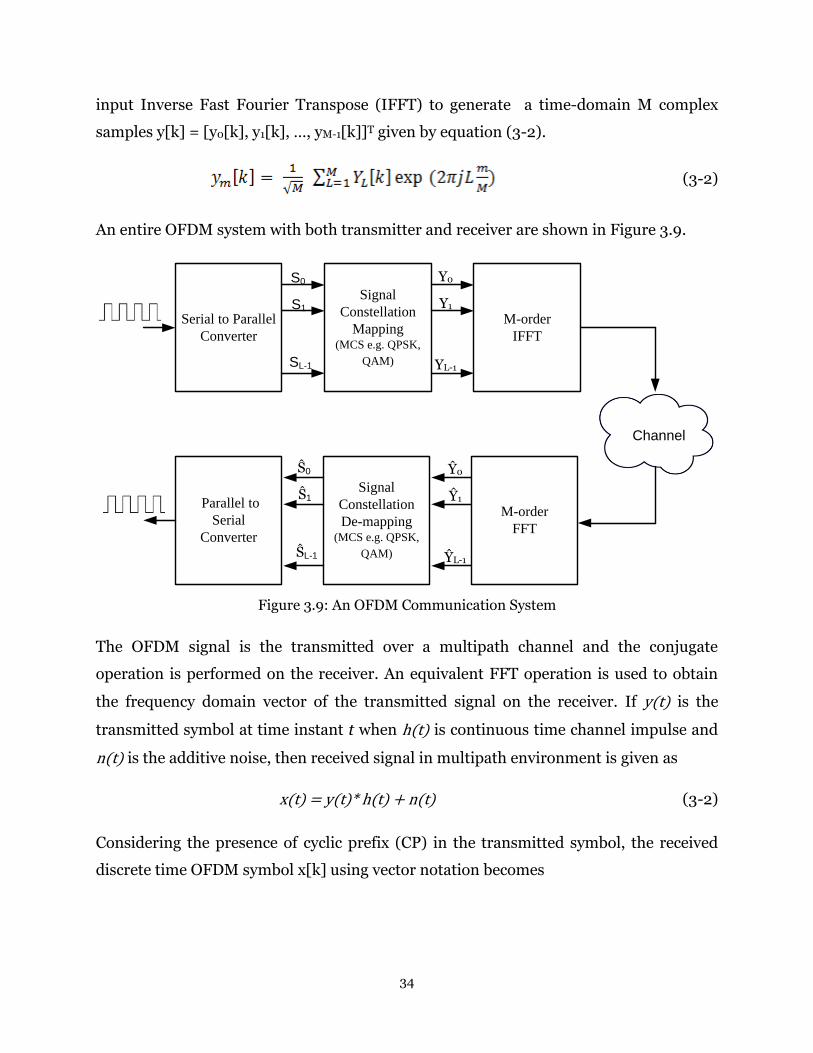
samples y[k] = [y0[k], y1[k], …, yM-1[k]]T given by equation (3-2).
(3-2)
An entire OFDM system with both transmitter and receiver are shown in Figure 3.9.
Signal
Constellation
Mapping (MCS e.g. QPSK,
QAM)
Signal
Constellation
De-mapping(MCS e.g. QPSK,
QAM)
Ŝ0 Ŷ0
Serial to Parallel
Converter
M-order
FFT
Ŝ1
ŜL-1
Ŷ1
ŶL-1
Parallel to
Serial
Converter
Channel
Y0
Y1
YL-1
S0
S1
SL-1
M-order
IFFT
Figure 3.9: An OFDM Communication System
The OFDM signal is the transmitted over a multipath channel and the conjugate
operation is performed on the receiver. An equivalent FFT operation is used to obtain
the frequency domain vector of the transmitted signal on the receiver. If y(t) is the
transmitted symbol at time instant t when h(t) is continuous time channel impulse and
n(t) is the additive noise, then received signal in multipath environment is given as
x(t) = y(t)* h(t) + n(t) (3-2)
Considering the presence of cyclic prefix (CP) in the transmitted symbol, the received
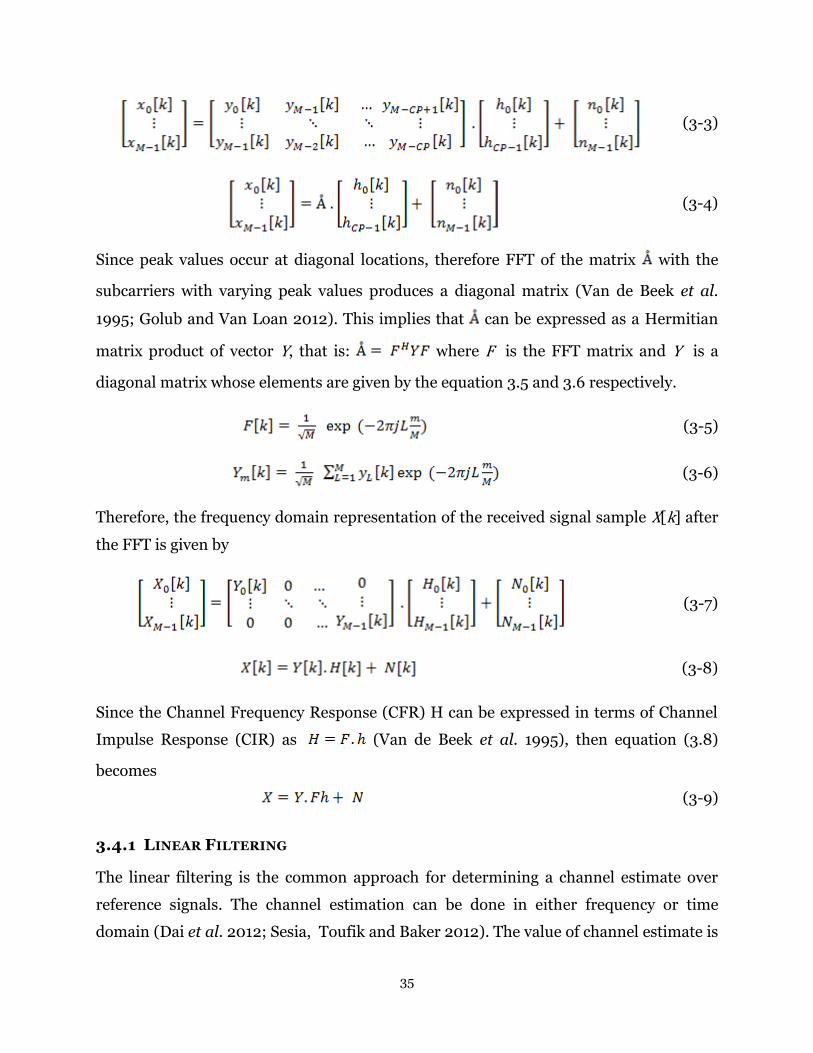
discrete time OFDM symbol x[k] using vector notation becomes
35
(3-3)
(3-4)
Since peak values occur at diagonal locations, therefore FFT of the matrix with the
subcarriers with varying peak values produces a diagonal matrix (Van de Beek et al.
1995; Golub and Van Loan 2012). This implies that can be expressed as a Hermitian
matrix product of vector Y, that is: where F is the FFT matrix and Y is a
diagonal matrix whose elements are given by the equation 3.5 and 3.6 respectively.
(3-5)
(3-6)
Therefore, the frequency domain representation of the received signal sample X[k] after
the FFT is given by
(3-7)
(3-8)
Since the Channel Frequency Response (CFR) H can be expressed in terms of Channel
Impulse Response (CIR) as (Van de Beek et al. 1995), then equation (3.8)
becomes
(3-9)
3.4.1 LINEAR FILTERING
The linear filtering is the common approach for determining a channel estimate over
reference signals. The channel estimation can be done in either frequency or time
domain (Dai et al. 2012; Sesia, Toufik and Baker 2012). The value of channel estimate is
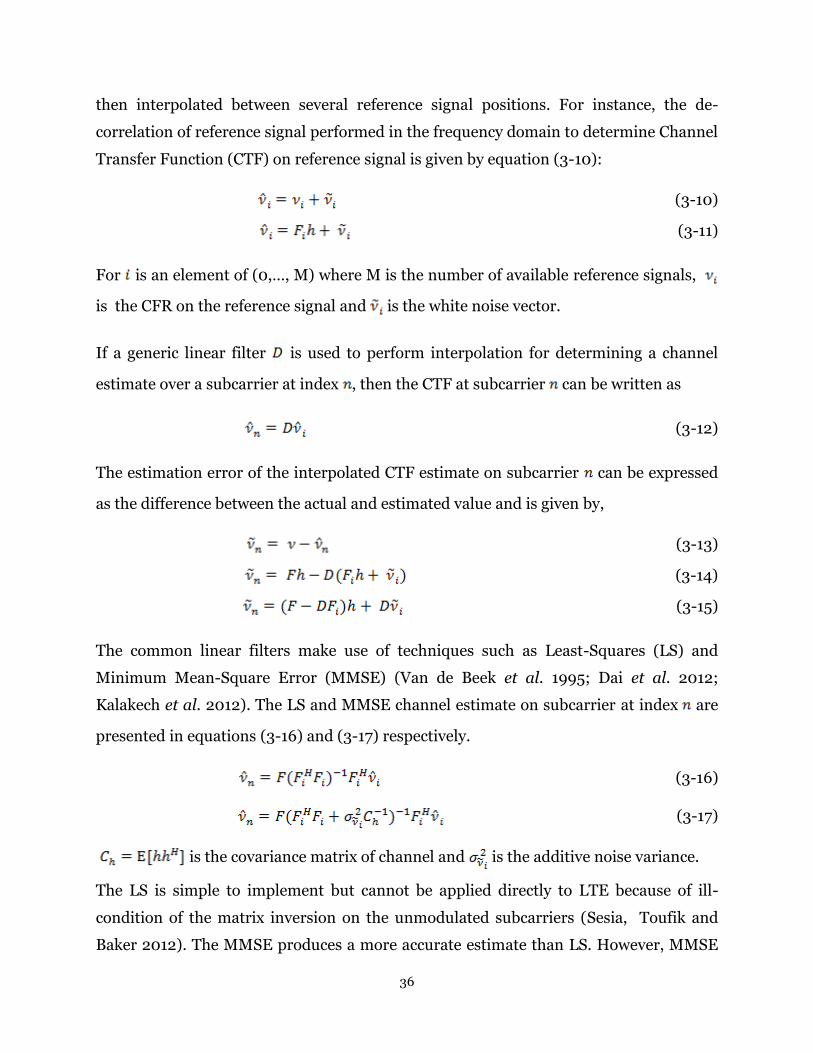
36
then interpolated between several reference signal positions. For instance, the de-
correlation of reference signal performed in the frequency domain to determine Channel
Transfer Function (CTF) on reference signal is given by equation (3-10):
(3-10)
(3-11)
For is an element of (0,…, M) where M is the number of available reference signals,
is the CFR on the reference signal and is the white noise vector.
If a generic linear filter is used to perform interpolation for determining a channel
estimate over a subcarrier at index , then the CTF at subcarrier can be written as
(3-12)
The estimation error of the interpolated CTF estimate on subcarrier can be expressed
as the difference between the actual and estimated value and is given by,
(3-13)
(3-14)
(3-15)
The common linear filters make use of techniques such as Least-Squares (LS) and
Minimum Mean-Square Error (MMSE) (Van de Beek et al. 1995; Dai et al. 2012;
Kalakech et al. 2012). The LS and MMSE channel estimate on subcarrier at index are
presented in equations (3-16) and (3-17) respectively.
(3-16)
(3-17)
is the covariance matrix of channel and is the additive noise variance.
The LS is simple to implement but cannot be applied directly to LTE because of ill-
condition of the matrix inversion on the unmodulated subcarriers (Sesia, Toufik and
Baker 2012). The MMSE produces a more accurate estimate than LS. However, MMSE
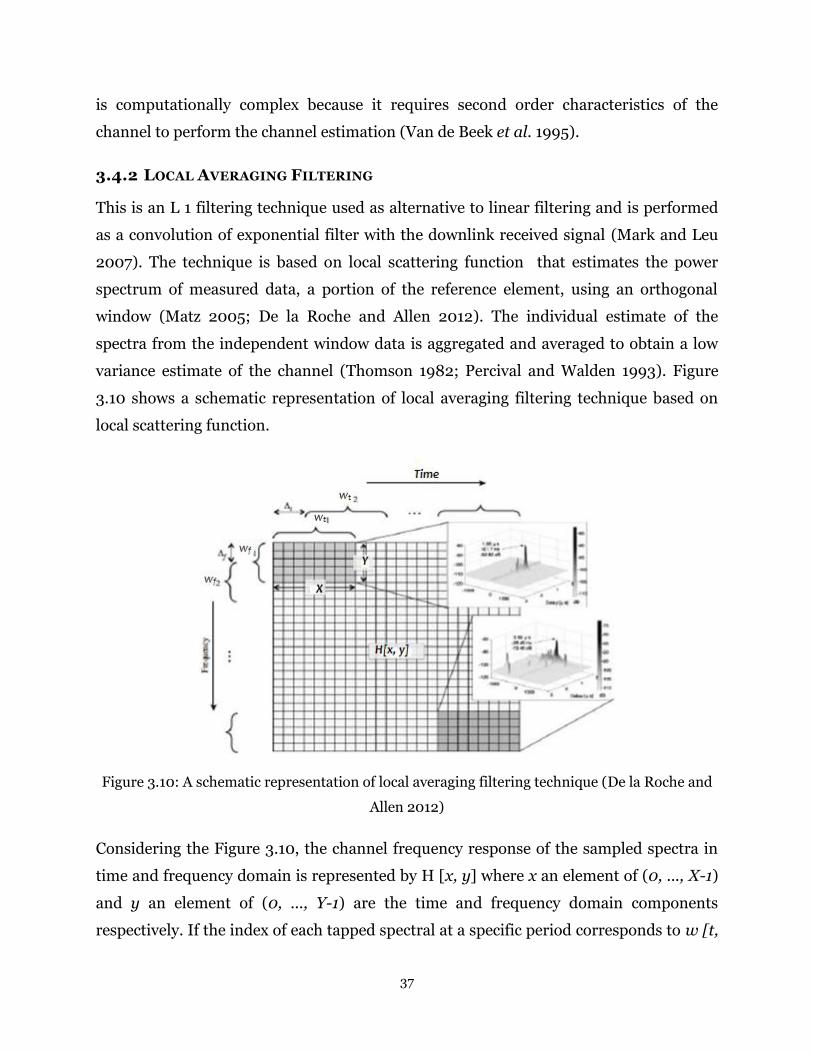
37
is computationally complex because it requires second order characteristics of the
channel to perform the channel estimation (Van de Beek et al. 1995).
3.4.2 LOCAL AVERAGING FILTERING
This is an L 1 filtering technique used as alternative to linear filtering and is performed
as a convolution of exponential filter with the downlink received signal (Mark and Leu
2007). The technique is based on local scattering function that estimates the power
spectrum of measured data, a portion of the reference element, using an orthogonal
window (Matz 2005; De la Roche and Allen 2012). The individual estimate of the
spectra from the independent window data is aggregated and averaged to obtain a low
variance estimate of the channel (Thomson 1982; Percival and Walden 1993). Figure
3.10 shows a schematic representation of local averaging filtering technique based on
local scattering function.
Figure 3.10: A schematic representation of local averaging filtering technique (De la Roche and
Allen 2012)
Considering the Figure 3.10, the channel frequency response of the sampled spectra in
time and frequency domain is represented by H [x, y] where x an element of (0, ..., X-1)
and y an element of (0, ..., Y-1) are the time and frequency domain components
respectively. If the index of each tapped spectral at a specific period corresponds to w [t,
38
f], then the relative sampled spectral index in time and frequency domain are
respectively given by x' (- , ..., ) and y' (- , ..., ). Therefore, the local
scattering function estimate at each index, corresponding to a discrete sample, is given
by
(3-18)
(3-19)
where M and N denotes the total number of tapped spectral used both in time and
frequency domain. The Qp is the window function expressed as
(3-20)
where avf , represented by equation (3-20), is the exponential filter used for the local
averaging and avN is the averaging window size.
3.4.3 L 3 FILTERED LOCALLY AVERAGED L 1 SIGNAL
The L 3 filtering is performed using first order Infinite Impulse Response (IIR) filter. In
order to make local averaging filtering suitable for handover decision in LTE, the L 3
filtering is performed on locally averaged L 1 signal and effect of L 3 filtering is observed
in handover performance. The expression for an L 3 filter configuration as specified in
(3GPP 2009) is represented by a function shown in equation (3-21).
(3-21)
where nQ is the updated L3 output of first order IIR filter used for handover evaluation
criteria, 1nQ is the previous L3 filtering output, is the latest output of local averaged
L1 filtering and c is the L3 filter coefficient.
39
3.5 HANDOVER PROCEDURE IN LTE
One of the major goals of handover in LTE is to provide a seamless transition of UE from
one cell to another without interruption to user’s voice or data services. The transition
between the cells, from serving cell to target cell, comes with stringent delay
requirements. Also, the handover in LTE is UE-assisted network controlled handover.
The handover procedure in LTE is initiated with UE performing measurement of
attributes on its serving cell and neighbouring cells. The UE sends this measurement
report to the eNodeB (source) in its serving cell. The UE performs L 3 filtering on the
measurement report at its radio resource control layer (Sesia, Toufik and Baker 2012;
ETSI 2012b). As discussed in previous section, the L 3 filtering is a recommended
processing needed to ensure conformity of the measurement report to pre-defined
criteria before it is used for decision. The handover decision is performed by the eNodeB.
The overall handover procedure is illustrated in Figure 3.11 and is divided into
initialization, preparation, execution and completion phases.
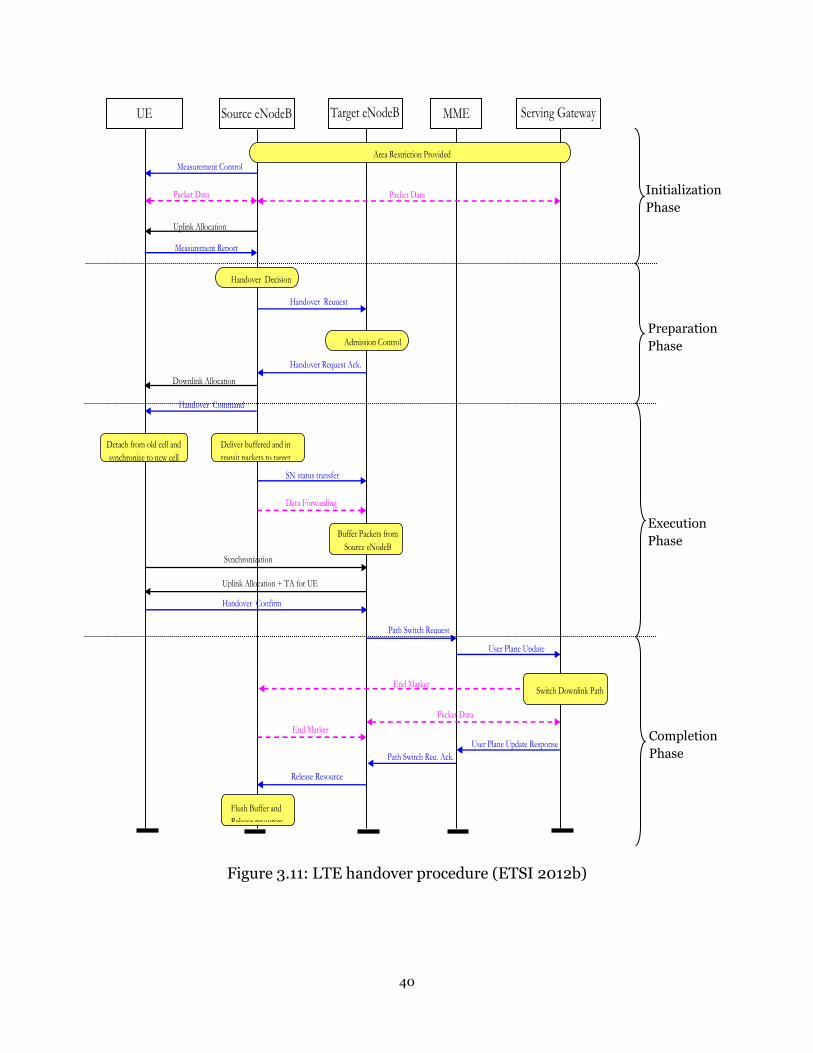
40
User Plane Update Response
Path Switch Req. Ack.
Packet Data Packet Data
Uplink Allocation
Area Restriction Provided
Measurement Control
Handover Decision
Handover Request
Measurement Report
Admission Control
UE Source eNodeB Target eNodeB MME Serving Gateway
End Marker
End Marker
Packet Data
Synchronization
Uplink Allocation + TA for UE
Handover Confirm
Path Switch Request
User Plane Update
Switch Downlink Path
Release Resource
Flush Buffer and
Release resources
Handover Request Ack.
Buffer Packets from
Source eNodeB
Downlink Allocation
Data Forwarding
Handover Command
SN status transfer
Detach from old cell and
synchronize to new cell
Deliver buffered and in
transit packets to target
eNodeB
Figure 3.11: LTE handover procedure (ETSI 2012b)
Completion
Phase
Execution
Phase
Preparation
Phase
Initialization
Phase
41
3.5.1 HANDOVER INITIATION/PREPARATION
In handover preparation phase, the source eNodeB makes decision to handover the UE
based on filtered measurement report and radio resource management information
available. The source eNodeB sends handover request to target eNodeB. This is followed
by exchange of necessary signaling information between source and target eNodeB over
X2 interface (3GPP 2009). The target eNodeB performs admission control to guarantee
that resource is available for the UE and sends handover request acknowledgement to
the source eNodeB. The reception of handover request acknowledgement at the source
eNodeB initiates handover execution
3.5.2 HANDOVER EXECUTION
In this phase, the source eNodeB issues handover command to the UE in downlink and
begins data forwarding to the target eNodeB over X2 interface. The data forwarding is a
necessary process to minimize amount of data loss during handover. Two modes that
may be used for downlink packets data forwarding in LTE user plane are seamless and
lossless (Lin et al. 2010; Sesia, Toufik and Baker 2012; Amin and Yla-Jaaski 2013). The
mode is chosen based on bearer or sensitivity of UE downlink data packets to packet
loss. The data forwarding is followed by the source eNodeB releasing its connection with
the UE and sending status transfer message to the target eNodeB. Then, the UE
synchronizes with the target eNodeB. The target eNodeB responds with uplink
allocation and timing advance for the UE. This phase is finalized with the UE sending
handover confirm message to the target eNodeB which in turns starts sending data to
the UE.
3.5.3 HANDOVER COMPLETION
The handover completion phase is implemented after a successful handover execution.
This phase involves processes to release all the resources used for handover. The phase
is triggered by the target eNodeB informing the source eNodeB to release resources for
the handover.
42
3.6 HANDOVER DESIGN GOAL
The design goal of most handover design is to maintain continuous connection, enhance
capacity and quality of service perceived by mobile user. According to Pollini (1996) and
Tripathi, Reed and VanLandingham (2001), the goals of handover design are as follows.
3.6.1 REDUCTION IN NUMBER OF HANDOVER FAILURE
The preservation of ongoing service is essential during handover. So, every handover
design tries to ensure reduction in the number of service termination that occurs during
handover.
3.6.2 REDUCTION IN OVERALL NUMBER OF HANDOVER INITIATED
Handover procedure is critical because of the need to select appropriate target among
several neighbouring cells. The selection must ensure that resource of the new cell can
support the new user (handover UE). Inappropriate selection may lead to the new user
initiating handover after a little time in the new cell which is called ‘ping-pong’
handover. The ping-pong handover, which is switching between cells, degrades the
overall performance of the cell and reduces perceived quality of the service by the user.
Therefore from a design point of view, it is necessary to minimize the overall number of
handover initiated.
3.6.3 REDUCTION IN HANDOVER DELAY
The transition of user from one cell to another should be fast to avoid degradation in
quality of service. This is more important for handover in LTE which is hard handover
with interruption in the user plane.
3.6.4 REDUCTION OF HANDOVER IMPACT ON SYSTEM AND SERVICE PERFORMANCE
The impact of handover on overall system should be minimized. Therefore, an efficient
handover algorithm should achieve a balance between service quality and system
performance which includes the overall cell throughput and spectral efficiency of the
cell.
43
3.7 HANDOVER PERFORMANCE EVALUATION The handover performance evaluation metrics are chosen according to system level
performance and mobility related performance (Gora and Gouraud 2010; ETSI 2012b).
The system level performance is analyzed in terms of peak user, average user and cell
edge user throughput and spectral efficiency. The mobility related performance is
evaluated as handover success rate and handover delay.
44
CHAPTER 4
MODEL IMPLEMENTATION
This chapter presents the implementation of the handover process of this research. The
implementation is done using the LTE system level simulator. This is in accordance with
specification for International Mobile Telecommunications Advanced (IMT-Advanced)
that evaluation of radio technology be performed through simulation, analytical and
inspection procedure (ITU-R 2009). The system level simulator helps perform holistic
evaluation of mobility on the overall communication system with respect to several
users. The users provide the channel state information of the downlink to the eNodeB to
enable effective handover decision making. The channel model approach is used to
allow for realistic modelling of the propagation condition experienced by the users while
considering investigated scenarios.
4.1 SIMULATION TOOL
The system level simulator employed for this research work is developed with
MATLAB® using object-oriented programming and allows for study of various aspects
of the LTE network (Mehlführer et al. 2011). The simulator is adapted for the two LTE
handover filtering investigated namely linear and local averaging. In order to examine
the performance of each of the filtering techniques on handover, necessary changes were
made to the physical layer and radio resource layer of the simulator. The simulation is
performed in two phases. In the first phase, investigation of the suitability of the local
average handover filtering technique is evaluated on the overall performance of the LTE
system. Having seen improvement, the impact of the L 3 filtering on the handover
decision is then carried out in the second phase. The simulation parameters and system
configurations are ensured to be in conformity with recommendations in International
Telecommunication Union Radiocommunication (ITU-R) and 3GPP standards.
4.2 KEY PERFORMANCE INDICATORS (KPI)
The KPI are the technically chosen characteristics in evaluating the performance of a
communication system. A typical communication system involves several cells and
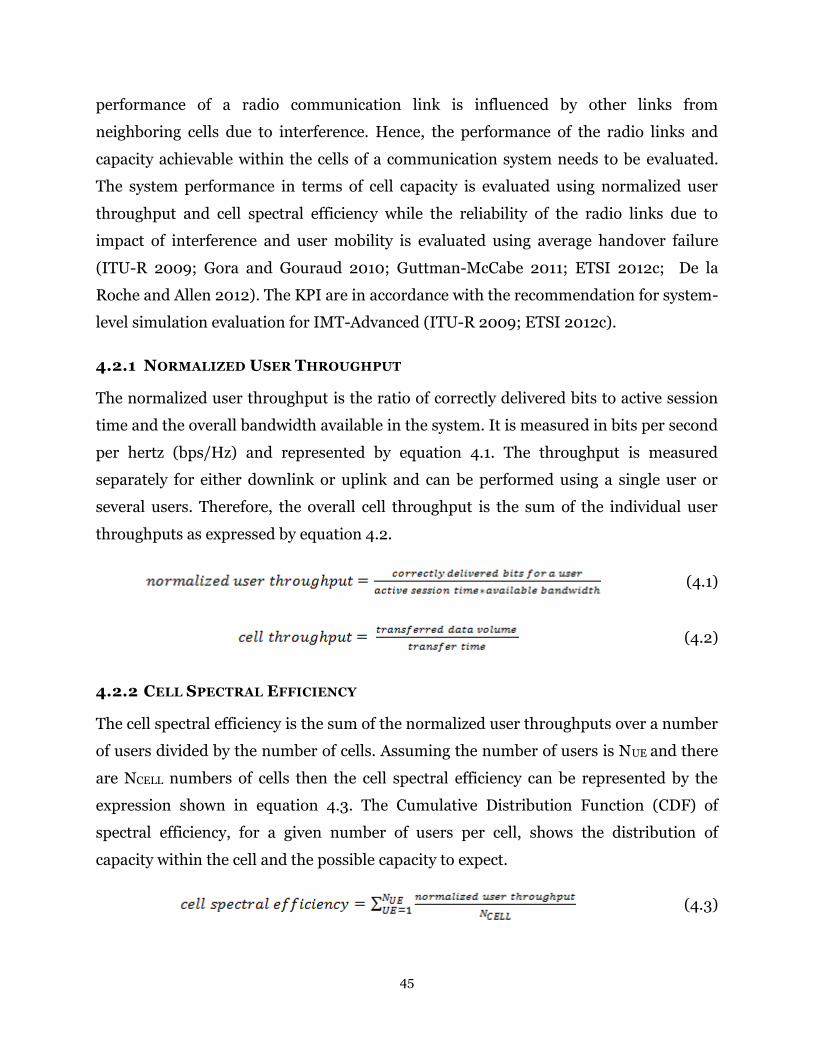
45
performance of a radio communication link is influenced by other links from
neighboring cells due to interference. Hence, the performance of the radio links and
capacity achievable within the cells of a communication system needs to be evaluated.
The system performance in terms of cell capacity is evaluated using normalized user
throughput and cell spectral efficiency while the reliability of the radio links due to
impact of interference and user mobility is evaluated using average handover failure
(ITU-R 2009; Gora and Gouraud 2010; Guttman-McCabe 2011; ETSI 2012c; De la
Roche and Allen 2012). The KPI are in accordance with the recommendation for system-
level simulation evaluation for IMT-Advanced (ITU-R 2009; ETSI 2012c).
4.2.1 NORMALIZED USER THROUGHPUT
The normalized user throughput is the ratio of correctly delivered bits to active session
time and the overall bandwidth available in the system. It is measured in bits per second
per hertz (bps/Hz) and represented by equation 4.1. The throughput is measured
separately for either downlink or uplink and can be performed using a single user or
several users. Therefore, the overall cell throughput is the sum of the individual user
throughputs as expressed by equation 4.2.
(4.1)
(4.2)
4.2.2 CELL SPECTRAL EFFICIENCY
The cell spectral efficiency is the sum of the normalized user throughputs over a number
of users divided by the number of cells. Assuming the number of users is NUE and there
are NCELL numbers of cells then the cell spectral efficiency can be represented by the
expression shown in equation 4.3. The Cumulative Distribution Function (CDF) of
spectral efficiency, for a given number of users per cell, shows the distribution of
capacity within the cell and the possible capacity to expect.
(4.3)
46
Although it is known that other factors such as scheduler, modulation scheme affect the
achievable spectral efficiency, the evaluation of each handover filtering technique within
the cell coverage is performed to observe impact on overall cell capacity while these
other factors are kept constant. It is worthy of note that cell spectral efficiency is a
principal indicator that helps operator determine the capacity to expect in a cell
(Guttman-McCabe 2011).
4.2.3 HANDOVER FAILURE
The handover failure is an indicator of mobility performance on the overall network.
This is because of negative effect of multiple handovers on the system. After a failed
handover, a new handover procedure is initiated to get the user connected to the system.
This consequently impacts negatively on network performance due to increase in
number of signaling overhead required for each handover procedure which involves re-
routing of network resources between several network nodes. A handover failure is very
likely to result in service failure or reduced QoS and should be avoided as possible to
preserve continuous service provisioning. Hence, it is considered as one of the most
important performance indicators for handover and user mobility.
Handover can fail due to a number of reasons. One being that the signal strength can
drop below the minimum signal strength required for acceptable communication link
quality which may lead to service disruption or termination. Another reason is that
handover failure may be as a result of long handover delay due to error in UE
measurement report which may cause deterioration of the radio link or loss in
connection to the serving eNodeB. In the second case, the failure is due to the inefficient
handover procedure which is mainly based on handover initiation. Therefore, the
handover failure due to handover measurement and filtering is considered in this study.
The average number of handover failure is as defined in equation 4.4.
(4.4)
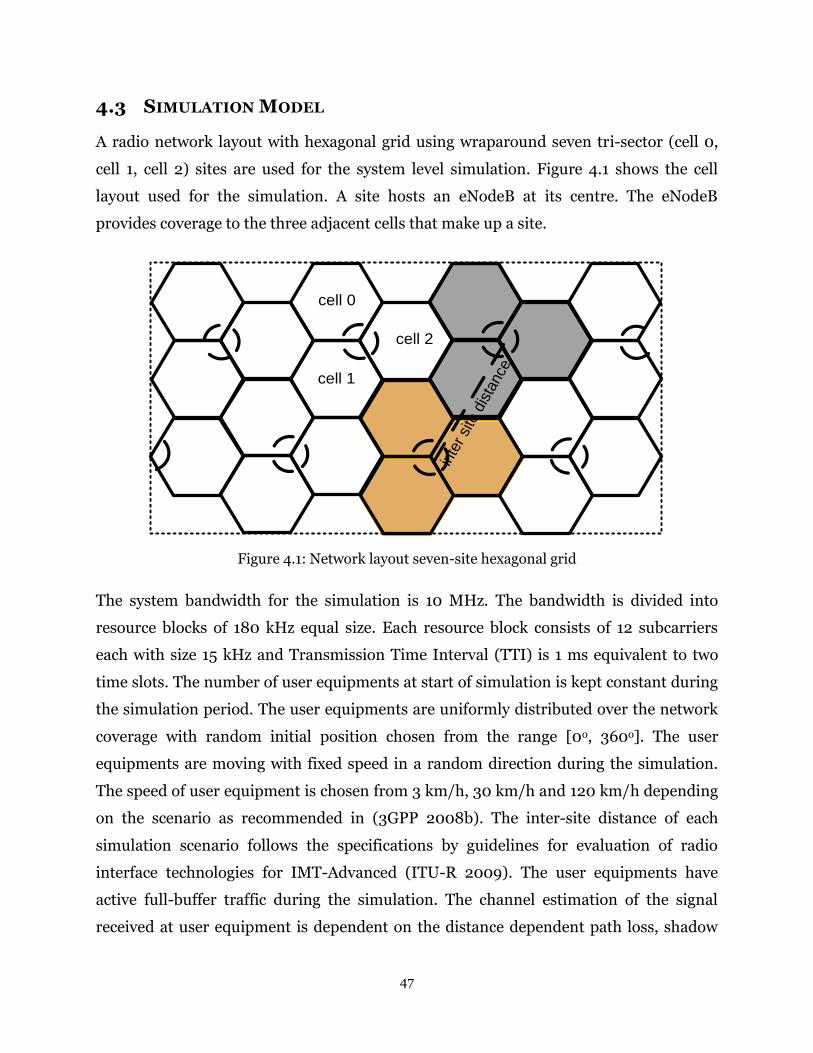
47
4.3 SIMULATION MODEL
A radio network layout with hexagonal grid using wraparound seven tri-sector (cell 0,
cell 1, cell 2) sites are used for the system level simulation. Figure 4.1 shows the cell
layout used for the simulation. A site hosts an eNodeB at its centre. The eNodeB
provides coverage to the three adjacent cells that make up a site.
cell 1
cell 0
cell 2
inte
r si
te d
ista
nce
Figure 4.1: Network layout seven-site hexagonal grid
The system bandwidth for the simulation is 10 MHz. The bandwidth is divided into
resource blocks of 180 kHz equal size. Each resource block consists of 12 subcarriers
each with size 15 kHz and Transmission Time Interval (TTI) is 1 ms equivalent to two
time slots. The number of user equipments at start of simulation is kept constant during
the simulation period. The user equipments are uniformly distributed over the network
coverage with random initial position chosen from the range [0o, 360o]. The user
equipments are moving with fixed speed in a random direction during the simulation.
The speed of user equipment is chosen from 3 km/h, 30 km/h and 120 km/h depending
on the scenario as recommended in (3GPP 2008b). The inter-site distance of each
simulation scenario follows the specifications by guidelines for evaluation of radio
interface technologies for IMT-Advanced (ITU-R 2009). The user equipments have
active full-buffer traffic during the simulation. The channel estimation of the signal
received at user equipment is dependent on the distance dependent path loss, shadow

48
fading and fast fading. The path loss model used is as specified in (3GPP 2006). The
shadow fading in Claussen (2005) with standard deviation of 8dB and 0 mean, and fast
fading in Hentilä et al. (2007) are used for the simulation. The details of other simulator
parameters are provided in Table 4.1.
Table 4.1: Parameters and assumption for simulation
Parameters Assumption
Cell Layout Hexagonal grid – 7 sites, 3sectors per eNodeB
Carrier frequency 2 GHz
Number of physical resource block (PRB)
50
Number of subcarrier per PRB
12
System Bandwidth 10 MHz , 180 kHz per PRB
eNodeB Tx Power 46 dBm
Number of UE per sector 10
Traffic Type Full buffer
Handover Margin 1 dB
L3 sampling interval 200 TTI
L3 filter coefficient 4
Averaging window (Nav) 5 and 6
UE direction Range [0o,360o]
UE speed 3 km/h, 30 km/h,120 km/h
UE noise figure 7 dB
UE position Uniform distribution
Packet Scheduler Proportional fair
Path loss 128.1 + 37.6log10 (R in km) dB
Shadow Fading Standard deviation = 8 dB Correlation mean = 0 Correlation between eNodeB = 0.5
Fast fading Winner channel Model

49
4.4 SPECTRAL EFFICIENCY
The resource-limited nature of wireless radio access necessitates the efficient use of the
spectrum. The knowledge of spectrum efficiency of a technology and radio-channel
bandwidth enables estimation of capacity within a cell and makes spectral efficiency to
be one of the major deployment factors of interest to operators. Due to the requirements
of LTE system, enhanced capacity is vital as it allows operators to provide wider
coverage for users. Also, high capacity within the cell will also bring about satisfying
experiences of true mobile broadband when users are accessing mobile data-services
and applications.
The following sections present the results and discussion on cell spectral efficiency at
different speeds when each of the handover filtering technique is applied by users in the
system.
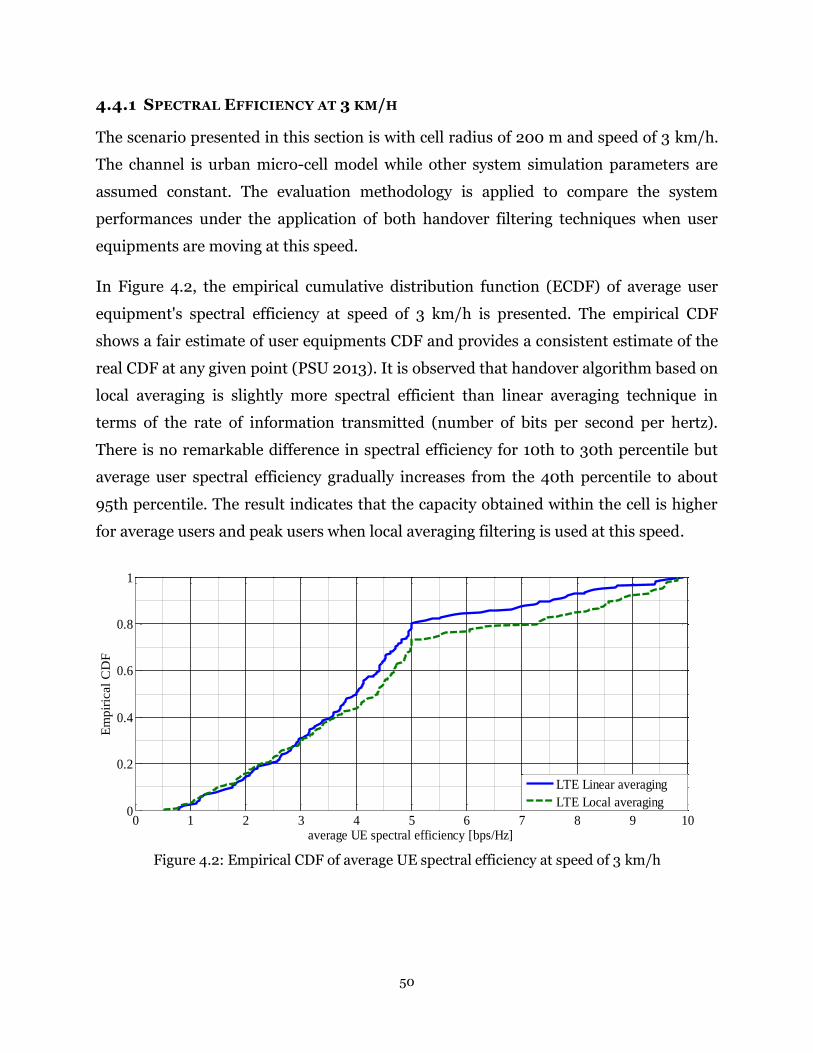
50
4.4.1 SPECTRAL EFFICIENCY AT 3 KM/H
The scenario presented in this section is with cell radius of 200 m and speed of 3 km/h.
The channel is urban micro-cell model while other system simulation parameters are
assumed constant. The evaluation methodology is applied to compare the system
performances under the application of both handover filtering techniques when user
equipments are moving at this speed.
In Figure 4.2, the empirical cumulative distribution function (ECDF) of average user
equipment's spectral efficiency at speed of 3 km/h is presented. The empirical CDF
shows a fair estimate of user equipments CDF and provides a consistent estimate of the
real CDF at any given point (PSU 2013). It is observed that handover algorithm based on
local averaging is slightly more spectral efficient than linear averaging technique in
terms of the rate of information transmitted (number of bits per second per hertz).
There is no remarkable difference in spectral efficiency for 10th to 30th percentile but
average user spectral efficiency gradually increases from the 40th percentile to about
95th percentile. The result indicates that the capacity obtained within the cell is higher
for average users and peak users when local averaging filtering is used at this speed.
0 1 2 3 4 5 6 7 8 9 100
0.2
0.4
0.6
0.8
1
average UE spectral efficiency [bps/Hz]
Em
pir
ical
CD
F
LTE Linear averaging
LTE Local averaging
Figure 4.2: Empirical CDF of average UE spectral efficiency at speed of 3 km/h

51
4.4.2 SPECTRAL EFFICIENCY AT 30 KM/H
The analysis of the condition experienced in the system when the cell radius is 500m
and user equipments are moving with speed of 30 km/h is presented in this section. The
other system simulation parameters are kept constant. The KPI is used as an evaluation
methodology to compare system performances under the application of both handover
filtering techniques when user equipments are moving at this speed.
In Figure 4.3, the ECDF shows that the probability of average user equipment spectral
efficiency is high when local averaging was used in the handover algorithm. This
suggests that the number of bits transported within the bandwidth for this speed is
higher for local averaging than linear averaging when used as filtering technique by the
user equipment. It is observed from the result that there is a huge difference between
linear averaging and local averaging in terms of the amount of information transmitted
by an average user from about the 5th percentile to the 90th percentile. The local
averaging technique produced higher average user spectral efficiency in bps/Hz or bit
per channel use than linear averaging.
0 1 2 3 4 5 6 7 8 9 100
0.2
0.4
0.6
0.8
1
average UE spectral efficiency [bps/Hz]
Em
pir
ical
CD
F
LTE Linear averaging
LTE Local averaging
Figure 4.3: Empirical CDF of average UE spectral efficiency at speed of 30 km/h
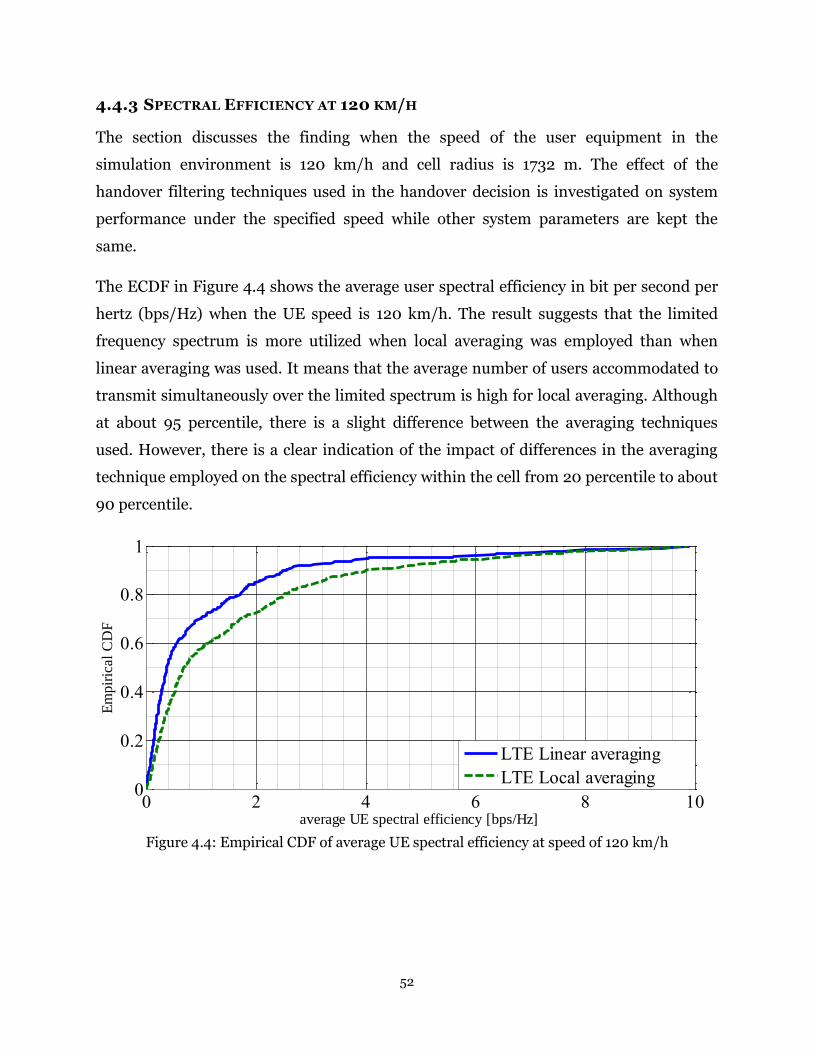
52
4.4.3 SPECTRAL EFFICIENCY AT 120 KM/H
The section discusses the finding when the speed of the user equipment in the
simulation environment is 120 km/h and cell radius is 1732 m. The effect of the
handover filtering techniques used in the handover decision is investigated on system
performance under the specified speed while other system parameters are kept the
same.
The ECDF in Figure 4.4 shows the average user spectral efficiency in bit per second per
hertz (bps/Hz) when the UE speed is 120 km/h. The result suggests that the limited
frequency spectrum is more utilized when local averaging was employed than when
linear averaging was used. It means that the average number of users accommodated to
transmit simultaneously over the limited spectrum is high for local averaging. Although
at about 95 percentile, there is a slight difference between the averaging techniques
used. However, there is a clear indication of the impact of differences in the averaging
technique employed on the spectral efficiency within the cell from 20 percentile to about
90 percentile.
0 2 4 6 8 100
0.2
0.4
0.6
0.8
1
average UE spectral efficiency [bps/Hz]
Em
pir
ical
CD
F
LTE Linear averaging
LTE Local averaging
Figure 4.4: Empirical CDF of average UE spectral efficiency at speed of 120 km/h

53
4.5 USER THROUGHPUT
One of the major goals of handover in LTE like any communication system is to provide
a seamless transition of UE from one cell to another without interruption to user’s voice
or data services while maintaining the quality of service (QoS). Maintaining the QoS is
very essential and most operators use various sophisticated techniques to maximize the
efficiency and performance of their networks to achieve best possible net data rates
(user throughput). Therefore, the distribution of user throughput is a good indicator of
the QoS and fairness achievable by users within the cell. It also shows the data rates
experienced by users at different locations within the cell. For instance, ninety-five
percent (95%) user throughput is considered as the peak throughput, mean user
throughput is considered a typical data rate achievable within the coverage area of the
network while the five percent (5%) user throughput is termed cell-edge user
throughput. This explains the reason for using user throughput distribution as a metric
for analysis of system level performance.
The following sections present the results of user throughput at different speeds when
each of the handover filtering technique is applied by users in the system.
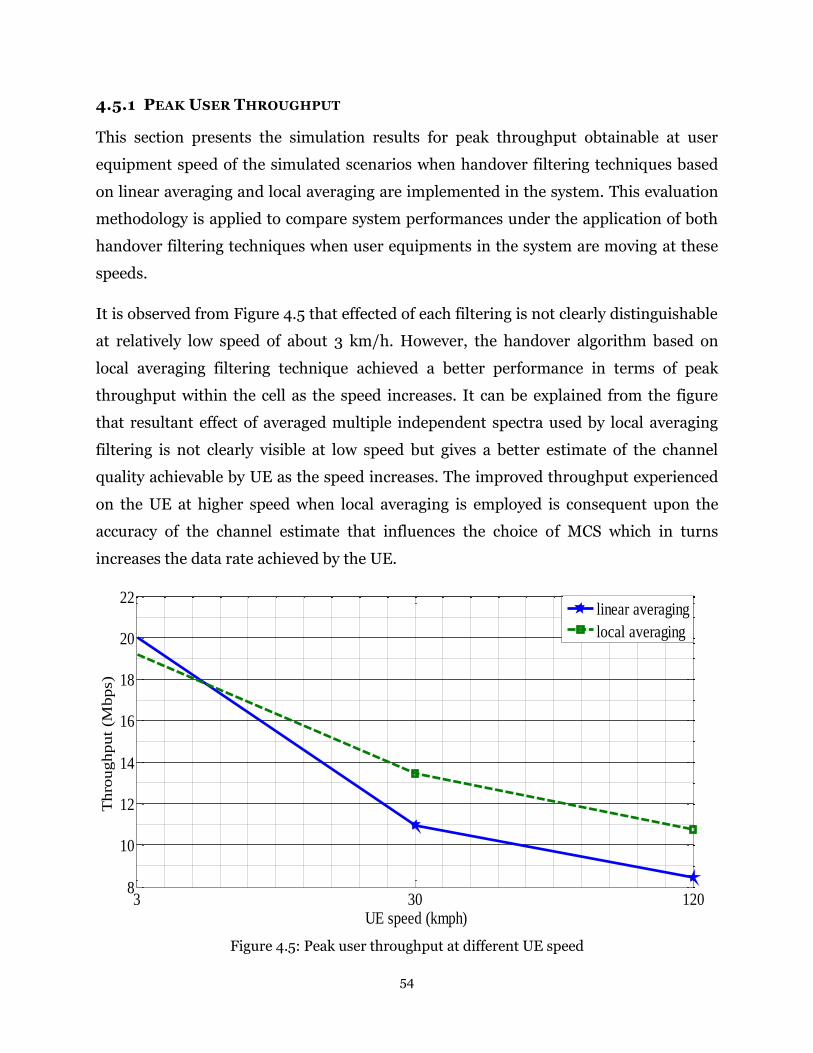
54
4.5.1 PEAK USER THROUGHPUT
This section presents the simulation results for peak throughput obtainable at user
equipment speed of the simulated scenarios when handover filtering techniques based
on linear averaging and local averaging are implemented in the system. This evaluation
methodology is applied to compare system performances under the application of both
handover filtering techniques when user equipments in the system are moving at these
speeds.
It is observed from Figure 4.5 that effected of each filtering is not clearly distinguishable
at relatively low speed of about 3 km/h. However, the handover algorithm based on
local averaging filtering technique achieved a better performance in terms of peak
throughput within the cell as the speed increases. It can be explained from the figure
that resultant effect of averaged multiple independent spectra used by local averaging
filtering is not clearly visible at low speed but gives a better estimate of the channel
quality achievable by UE as the speed increases. The improved throughput experienced
on the UE at higher speed when local averaging is employed is consequent upon the
accuracy of the channel estimate that influences the choice of MCS which in turns
increases the data rate achieved by the UE.
3 30 1208
10
12
14
16
18
20
22
Thro
ughput
(Mbps)
UE speed (kmph)
linear averaging
local averaging
Figure 4.5: Peak user throughput at different UE speed
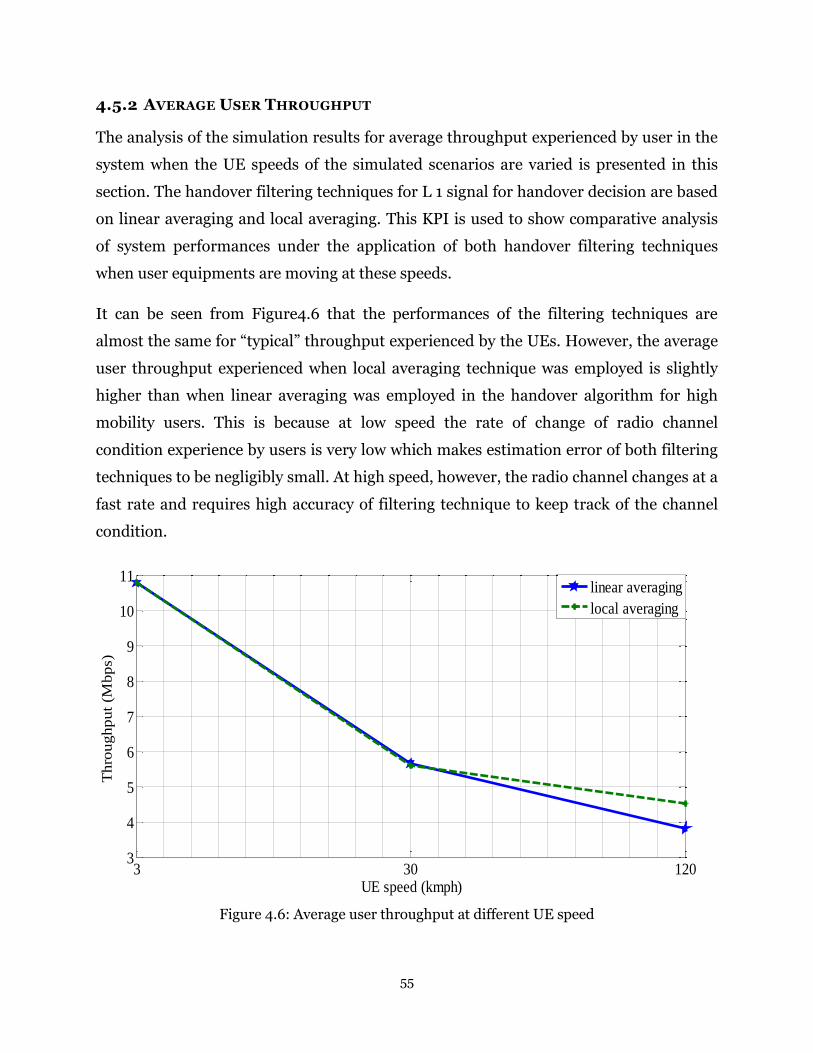
55
4.5.2 AVERAGE USER THROUGHPUT
The analysis of the simulation results for average throughput experienced by user in the
system when the UE speeds of the simulated scenarios are varied is presented in this
section. The handover filtering techniques for L 1 signal for handover decision are based
on linear averaging and local averaging. This KPI is used to show comparative analysis
of system performances under the application of both handover filtering techniques
when user equipments are moving at these speeds.
It can be seen from Figure4.6 that the performances of the filtering techniques are
almost the same for “typical” throughput experienced by the UEs. However, the average
user throughput experienced when local averaging technique was employed is slightly
higher than when linear averaging was employed in the handover algorithm for high
mobility users. This is because at low speed the rate of change of radio channel
condition experience by users is very low which makes estimation error of both filtering
techniques to be negligibly small. At high speed, however, the radio channel changes at a
fast rate and requires high accuracy of filtering technique to keep track of the channel
condition.
3 30 1203
4
5
6
7
8
9
10
11
Th
rou
gh
put
(Mb
ps)
UE speed (kmph)
linear averaging
local averaging
Figure 4.6: Average user throughput at different UE speed
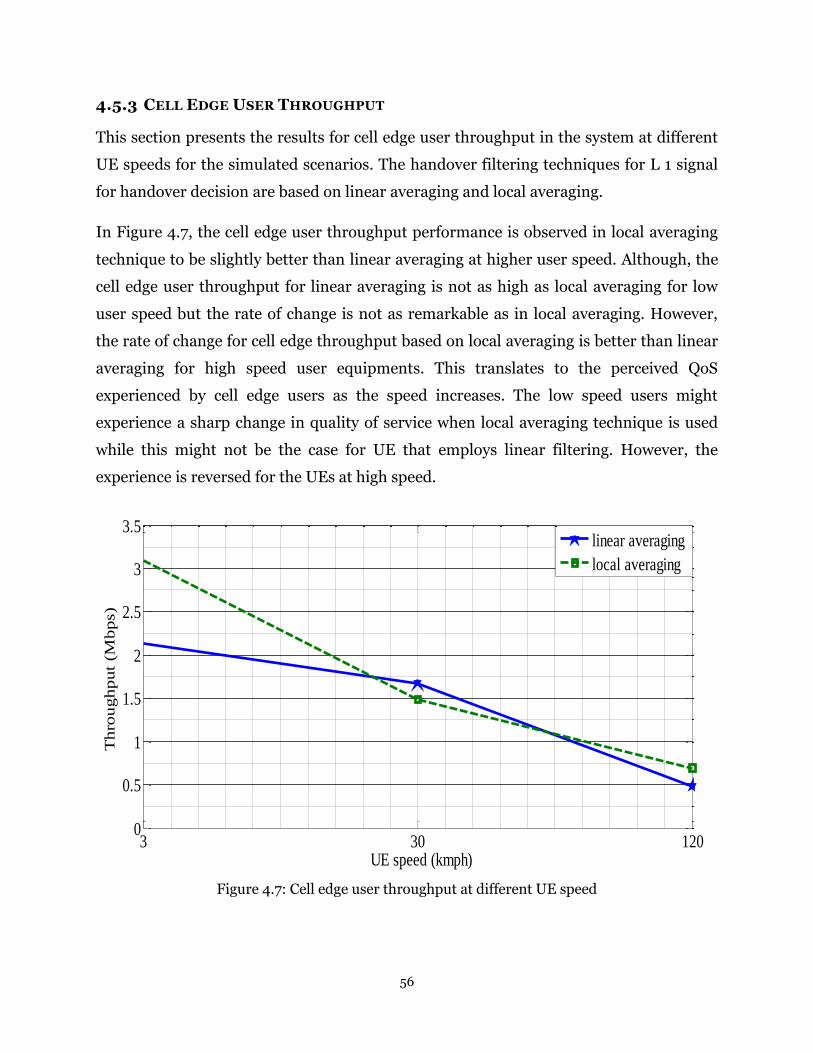
56
4.5.3 CELL EDGE USER THROUGHPUT
This section presents the results for cell edge user throughput in the system at different
UE speeds for the simulated scenarios. The handover filtering techniques for L 1 signal
for handover decision are based on linear averaging and local averaging.
In Figure 4.7, the cell edge user throughput performance is observed in local averaging
technique to be slightly better than linear averaging at higher user speed. Although, the
cell edge user throughput for linear averaging is not as high as local averaging for low
user speed but the rate of change is not as remarkable as in local averaging. However,
the rate of change for cell edge throughput based on local averaging is better than linear
averaging for high speed user equipments. This translates to the perceived QoS
experienced by cell edge users as the speed increases. The low speed users might
experience a sharp change in quality of service when local averaging technique is used
while this might not be the case for UE that employs linear filtering. However, the
experience is reversed for the UEs at high speed.
3 30 1200
0.5
1
1.5
2
2.5
3
3.5
Thro
ughput
(Mbps)
UE speed (kmph)
linear averaging
local averaging
Figure 4.7: Cell edge user throughput at different UE speed
57
4.6 HANDOVER FAILURE
Handover is essential for continuous service provision and is a key to maintain the
quality of service (QoS) requirement of the users. Maintaining handover is important to
most operators because it is a reflection of QoS to the users. Hence like spectral
efficiency, handover performance is always of interest to operators. In this section we
investigate the performance of the filtering technique on handover performance using
the average number of handover failure. Handover failure is one of the important KPI to
evaluate LTE mobility performance because it links directly to QoS achievable on the
network (ETSI 2012c). In LTE, different mobility performance is required for each
scenario as stated in the standard. For instance, the low speed users (stationary or
pedestrians) are expected to have continuous connectivity with fairly high data rate,
while high speed users (vehicular) must be ensured to stay connected. These
requirements dictate difference level of QoS among user within the cell coverage area.
Therefore, the effect of the filtering technique on average number of handover failure is
investigated for each of the scenarios.
Figure 4.8 shows the average number of handover failure per user equipment speed.
When the speed is as low as 3 km/h, the rate of handover failure obtained is low for both
handover filtering techniques with handover failure in linear averaging as low as less
than 1.5%. The average number of handover failure observed is also remarkably low for
local averaging with a value less than 1%.

58
3 30 1200
0.005
0.01
0.015
0.02
0.025
0.03A
ver
age
num
ber
of
han
dover
fai
lure
UE speed (kmph)
Linear averaging
local averaging
local+L3 filtering
Figure 4.8: Effect of UE speed on average number of handover failure
As expected, the average number of handover failure increases as the user speed
increases. At high speed, the difference in performance of both handover filtering
techniques is not too significant. However, the effect of L3 filtering on handover failure
becomes clearly visible at high speed. This is because L 3 filtered output that is used for
triggering the handover decision reduces the L 1 measurement and estimation error that
becomes high as user speed increases due to the high uncorrelated nature of the time-
varying channel between user equipments and base stations.
59
CHAPTER 5
CONCLUSION AND FUTURE WORK
This chapter presents a summary of the research study documented in this thesis. The
synopsis of the research task and the final result is presented first. Then, insights into
possible future work and improvement are stated.
5.1 CONCLUSION
In order to handle the data explosion on mobile telecommunication, several proposals
were presented on how well they could address this demand. Out of the numerous
propositions, the 3GPP is observed to be the likely possible solution that will help
achieve the goal of mobile broadband. Then 3GPP comes up with a technology that will
help maintain a competitive edge for the future mobile network. This technology is LTE
of UMTS. Like any mobile communication system, mobility of user presents a serious
challenge to LTE. This is because of high QoS demand of mobile user. The possibility of
achieving the high QoS demand is further jeopardized as a user moves across cells due
to interference from the neighbouring cells. This is why the handover of user between
base stations is considered as a major aspect of mobile cellular networks because it
impacts on the capacity within the cell and the achievable QoS by users. Hence, the work
in this thesis is based on handover in downlink LTE. The research focuses on how to
ensure accuracy of the downlink measurement needed to enhance promptness and
accurate handover decision that is required for high QoS demands of mobile users. Two
types of handover filtering techniques are investigated. Handover decisions based on
each filtering technique are implemented in a dynamic LTE system-level simulator. The
simulator helps to analyze the performance of each technique on the overall LTE system
and mobility. The result of the analysis shows the effect of each handover filtering
techniques on achievable capacity within the system in terms of spectral efficiency and
user throughput while mobility related performance is presented in terms of average
number of handover failure.
60
The spectral efficiency for pedestrian speed (3 km/h) user equipment for local averaging
with respect to linear averaging produces an increase of 9.1%, 10.8% and 15.1% for cell-
edge, average and peak users respectively. From the result obtained at UE speed of 30
km/h, the comparison between the linear averaging and local averaging technique
shows increased capacity of 31.6%, 37.9% and 15.3% for cell-edge, average and peak user
respectively when local averaging is used as filtering technique by the user equipment.
Likewise, the spectral efficiency of high speed (120 km/h) UE also produces 52.1%,
68.7% and 40.8% increase for cell-edge, average and peak user respectively when local
averaging is compared with linear averaging technique in the simulation environment.
The system throughput for cell-edge users shows 44.8%, 11.7% and 42.8% improvement
for UE speed of 3 km/h, 30 km/h and 120 km/h respectively when local averaging
filtering was employed. The peak user throughput for linear averaging is 4.1% better
than local averaging. However, the local averaging shows better performance of about
23.1% and 27.4% for UE speed of 30 km/h and 120 km/h respectively.
Finally, the result obtained from comparison of average number of handover failure
between the L 1 filtering techniques shows that there is a significant reduction in
average number of handover of about 80.9% for pedestrian users (3 km/h) when local
averaging is employed. The result for the UE speed of 30 km/h and 120 km/h show
reduction of about 0.5% and 4.6% respectively in average number of handover failure
for local averaging filtering technique. The application of L 3 filtering on local averaging
further improved the performance by 26.9%, 8.6% and 0.8% for UE speed of 3 km/h, 30
km/h and 120 km/h.
5.2 FUTURE WORK
This research work considers how handover downlink measurement used for handover
decision impact on the performance achievable on the whole LTE system. This work like
any worthwhile project provides direction for further improvements. The work in this
thesis covers the handover filtering techniques used by a user equipment to estimate the
downlink channel quality for making handover decision. Since the measurement report
is an effective way to improve quality of handover decision, considering several filtering
techniques are vitally important. Thanks to 3GPP for not raising the bar on the

61
particular filtering technique to employ in LTE system. It then behooves us to try many
possible filtering techniques until desired results are achieved. Some of the techniques
proposed in Kalakech et al. (2012), Dai et al. (2012), Chin, Ward and Constantinides
(2007) and Van de Beek et al. (1995) can be investigated, compared and implemented in
the LTE system to see how they improve quality of handover decision.
62
CHAPTER 6
REFERENCES
3GPP. 2006.3rd Generation Partnership Project; Technical Specification Group Radio Access Network; Physical layer aspects for evolved Universal Terrestrial Radio Access (UTRA) (Release 7), France: 3GPP Organizational Partners. 3GPP. 2008a. LTE; Evolved Universal Terrestrial Radio Access (E-UTRA) and Evolved Universal Terrestrial Radio Access Network (E-UTRAN); Overall description; Stage 2, France: 3GPP Organizational Partners.
3GPP. 2008b. 3rd Generation Partnership Project; Technical Specification Group Radio Access Network; Requirements for Evolved UTRA (E-UTRA) and Evolved UTRAN (E-UTRAN) (Release 8). FRANCE: 3GPP Organizational Partnership Project.
3GPP. 2009. 3rd Generation Partnership Project; Technical Specification Group Radio Access Network; Evolved Universal Terrestrial Radio Access (E-UTRA); Requirements for support of radio resource management (Release 9), 3GPP TS 36.133 V9.2.0 (2009-12). France: 3GPP Organizational Partners. Available: http://www.quintillion.co.jp/3GPP/Specs/36133-920.pdf (Accessed 25 March 2013).
3GPP. 2010. 3rd Generation Partnership Project; Technical Specification Group Radio Access Network; Evolved Universal Terrestrial Radio Access (E-UTRA); Physical layer; Measurements (Release 9). France: 3GPP Organizational Partners. Available: http ://www.3gpp.org (Accessed 13 June 2013).
3GPP. 2011. 3rd Generation Partnership Project; Technical Specification Group Radio Access Network; Evolved Universal Terrestrial Radio Access (E-UTRA) and Evolved Universal Terrestrial Radio Access Network (E-UTRAN); Overall description; Stage 2 (Release 10), France: 3GPP Organizational Partners.
Ali-Yahiya, T. 2011. Understanding LTE and its Performance. Springer.
Anas, M., Calabrese, F. D., Mogensen, P. E., Rosa, C. and Pedersen, K. I. 2007a. Performance evaluation of received signal strength based hard handover for UTRAN LTE.In: Proceedings of IEEE 65th Vehicular Technology Conference, 2007. VTC 2007-Spring. 1046-1050.
Anas, M., Calabrese, F. D., Ostling, P.-E., Pedersen, K. I. and Mogensen, P. E. 2007b.Performance analysis of handover measurements and layer 3 filtering for UTRAN LTE.In: Proceedings of IEEE 18th International Symposium on Personal, Indoor and Mobile Radio Communications, 2007. PIMRC 2007. 1-5. Aziz, D. and Sigle, R. 2009. Improvement of LTE handover performance through interference coordination.In: Proceedings of IEEE 69th Vehicular Technology Conference, 2009. VTC 2009-Spring. 1-5.
63
Chin, W. H., Ward, D. B. and Constantinides, A. G. 2007. Algorithm for exploiting channel time selectivity in pilot-aided MIMO systems. IET Communications, 1 (6): 1267-1273.
Cimini Jr, L. 1985. Analysis and simulation of a digital mobile channel using orthogonal frequency division multiplexing. IEEE Transactions on Communications, 33 (7): 665-675.
Claussen, H. 2005. Efficient modelling of channel maps with correlated shadow fading in mobile radio systems. In: Proceedings of IEEE 16th International Symposium on Personal, Indoor and Mobile Radio Communications, 2005. PIMRC 2005. 512-516.
Dai, X., Zhang, W., Xu, J., Mitchell, J. E. and Yang, Y. 2012. Kalman interpolation filter for channel estimation of LTE downlink in high-mobility environments. EURASIP Journal on Wireless Communications and Networking, 2012 (1): 1-14.
Dahlman, E., Parkvall, S., Skold, J. and Beming, P. 2010. 3G evolution: HSPA and LTE for mobile broadband. Access Online via Elsevier.
David, M.-S., Jose F, M., Jorge, C.-P., Daniel, C., Salvador, G. and Narcís, C. 2009. On the way towards fourth-generation mobile: 3GPP LTE and LTE-advanced. EURASIP Journal on Wireless Communications and Networking, 2009.
De la Roche, G. and Allen, B. 2012. LTE-advanced and Next Generation Wireless Networks: Channel Modelling and Propagation. Wiley. com.
Donthi, S. N. and Mehta, N. B. 2010. Performance analysis of subband-level channel quality indicator feedback scheme of LTE.In: Proceedings of National Conference on Communications, 2010. NCC 2010. 1-5.
Elnashar, A. and El-Saidny, M. A. 2013. Looking at LTE in Practice: A Performance Analysis of the LTE System Based on Field Test Results. IEEE Vehicular Technology Magazine, 8 (3): 81-92.
ETSI. 2009. LTE; Evolved Universal Terrestrial Radio Access (E-UTRA); User Equipment (UE) conformance specification; Radio transmission and reception; Part 3: Radio Resource Management (RRM) conformance testing (3GPP TS 36.521-3 version 8.1.0 Release 8). France: European Telecommunications Standards Institute. Available: http://www.etsi.org/deliver/etsi_ts/136500_136599/13652103/08.01.00_60/ts_13652103v080100p.pdf (Accessed 21 January 2013).
ETSI. 2012a. LTE; Evolved Universal Terrestrial Radio Access (E-UTRA) and Evolved Universal Terrestrial Radio Access Network (E-UTRAN); Overall description; Stage 2 (3GPP TS 36.300 version 10.7.0 Release 10). France: European Telecommunications Standards Institute. Available: http://www.etsi.org (Accessed 02 July 2013).
ETSI. 2012b. LTE; Evolved Universal Terrestrial Radio Access (E-UTRA); Radio Resource Control (RRC); Protocol specification (3GPP TS 36.331 version 10.5.0 Release 10). France: European Telecommunications Standards Institute. Available: http://www.etsi.org (Accessed 02 July 2013).
64
ETSI. 2012c. LTE; Evolved Universal Terrestrial Radio Access (E-UTRA); Radio Resource Control (RRC); Protocol specification (3GPP TS 36.331 version 10.5.0 Release 10). France: European Telecommunications Standards Institute. Available: http://www.etsi.org (Accessed 02 November 2012).
Gessner, C. and Roessler, A. 2009. LTE technology and LTE test; a deskside chat. Rohde & Schwarz: 92.
Golub, G. H. and Van Loan, C. F. 2012. Matrix computations. JHU Press.
Gora J. and Gouraud A. 2010.Scenarios, Key Performance Indicators and Evaluation Methodology for Advanced Cellular Systems: Advanced Radio Interface Technologies for 4G Systems, 2010, pp. 41.
Gunawan, A. H. 2011. LTE network and protocol, Telkom Indonesia. Available:http://ittelkom.ac.id/staf/itm/MATERI%20TRAINING/LTE/Slides%20-%20Day%20One.pdf (Accessed 09 July 2013).
Guttman-McCabe, C. 2011. Efficient use of spectrum. Washington, DC: Federal Communications Commission.
Hentilä, L., Kyösti, P., Käske, M., Naradzic, M. and Alatossava, M. 2007. MATLAB implementation of the WINNER phase II channel model. Available: http://www.ist-winner. org/phase 2 model. html2007
Ikuno, J. C., Wrulich, M. and Rupp, M. 2010. System level simulation of LTE networks.In: Proceedings of IEEE 71st Vehicular Technology Conference, 2010. VTC 2010-Spring. 1-5.
ITU-R. 2009. Guidelines for evaluation of radio interface technologies for IMT-Advanced. Geneva: International Telecommunication Union.
Kalakech, A., Brunel, L., Berbineau, M. and Mottier, D. 2012. A Novel OFDM Power Based Estimation for Dynamic Channel Tracking in Downlink LTE.In: Proceedings of IEEE Vehicular Technology Conference, 2012. VTC 2012-Fall. 1-5. Khan, F. 2009. LTE for 4G mobile broadband: air interface technologies and performance. Cambridge University Press.
Kurjenniemi, J., Henttonen, T. and Kaikkonen, J. 2008. Suitability of RSRQ measurement for quality based inter-frequency handover in LTE.In: Proceedings of IEEE International Symposium on Wireless Communication Systems. 2008. ISWCS '08. 703-707.
Lin, C. C., Sandrasegaran, K., Ramli, H. and Xue, M. 2010. Requirement of Handover Modeling in the Downlink 3GPP Long Term Evolution System.In: IEEE 24th International Conference on Advanced Information Networking and Applications Workshops, 2010. WAINA 2010. 305-310.

65
Mark, B. L. and Leu, A. E. 2007. Local Averaging for Fast Handoffs in Cellular Networks. IEEE Transaction on Wireless Communications, 6 (3): 866 -874.
Matz, G. 2005. On non-WSSUS wireless fading channels. IEEE Transactions on Wireless Communications, 4 (5): 2465-2478.
Mehlführer, C., Ikuno, J. C. C., Šimko, M., Schwarz, S., Wrulich, M. and Rupp, M. 2011. The Vienna LTE simulators-Enabling reproducibility in wireless communications research. EURASIP Journal on Advances in Signal Processing, 2011 (1): 1-14.
Miyahara, K. J. 2009. IMT-Advanced - Objective and Challenges.In: Proceedings of Annual IEEE Compound Semiconductor Integrated Circuit Symposium, 2009. CISC 2009. 1-4.
Nogueroles, R., Bossert, M., Donder, A. and Zyablov, V. 1998. Improved performance of a random OFDMA mobile communication system.In: Proceedings of IEEE 48th IEEE Vehicular Technology Conference, 1998. VTC 98. 2502-2506.
Ortiz, S. 2007. 4G Wireless Begins to Take Shape. Computer, 40 (11): 18-21.
Percival, D. and Walden, A. 1993. Spectral analysis for physical applications: multitaper and conventional univariate techniques, 583 pp. Cambridge Univ. Press, New York.
Pollini, G. P. 1996. Trends in handover design. IEEE Communications Magazine, 34 (3): 82-90.
PSU. 2013. Density Estimation: The Empirical CDF. Available: https://onlinecourses.science.psu.edu/stat464/node/84 (Accessed 27 June 2013)
Rappaport, T. S. 1996. Wireless communications: principles and practice. Prentice Hall PTR New Jersey.
Rayal, F. 2010. LTE in a Nutshell: Protocol Architecture. Telesystem Innovations Inc. Available: www.tsiwireless.com (Accessed 23 August 2013).
Sesia, S., Toufik, I. and Baker, M. 2009. LTE: the UMTS long term evolution. Wiley Online Library.
Smith, C. 2006. 3G wireless networks. McGraw-Hill, Inc.
Tamilselvan, S., Hemamalini, A. and Manivannan, K. 2008. Performance Analysis of Fast Handoff Algorithms Using Local Averaging Technique in Cellular Networks. IEEE: 183-188.
Thomson, D. J. 1982. Spectrum estimation and harmonic analysis. Proceedings of the IEEE, 70 (9): 1055-1096.
Tripathi, N. D., Reed, J. H. and VanLandingham, H. F. 2001. Radio resource management in cellular systems. Springer.
66
Van de Beek, J.-J., Edfors, O., Sandell, M., Wilson, S. K. and Borjesson, P. O. 1995. On channel estimation in OFDM systems.In: Proceedings of IEEE 45th Vehicular Technology Conference, 1995. VTC ‘95. 815-819.
Vaughan-Nichols, S. J. 2008. Mobile WiMax: The Next Wireless Battle Ground. Computer, 41 (6): 16-18.
Wang, H., Kondi, L., Luthra, A. and Ci, S. 2009. 4G wireless video communications. Wiley. com.
Zheng, N. and Wigard, J. 2008. On the performance of integrator handover algorithm in LTE networks.In: Proceedings of IEEE 68thVehicular Technology Conference, 2008. VTC 2008-Fall. 1-5.
Zimmermann, H. 1980. OSI reference model--The ISO model of architecture for open systems interconnection. IEEE Transactions on Communications, 28 (4): 425-432.
Zukang, S., Papasakellariou, A., Montojo, J., Gerstenberger, D. and Fangli, X. 2012.
Overview of 3GPP LTE-advanced carrier aggregation for 4G wireless communications.
IEEE Communications Magazine, 50 (2): 122-130.


![3GPP TS 29 - arib.or.jp · PDF file3GPP TS 29.215 V10.3.0 (2011-09) ... The AF exchanges session information with the H-PCRF or V-PCRF as specified in 3GPP TS 29.214[5]. The PCRF (V-PCRF)](https://img.pdfslide.net/doc/110x75/5aa26f457f8b9ab4208d09d2/3gpp-ts-29-ariborjp-ts-29215-v1030-2011-09-the-af-exchanges-session.jpg)