Embed Size (px)
Citation preview
Factors contributing to road fatalities
Analysis of in-depth investigation data from passenger car intersection crashes and from collisions between bicycles and motorized vehicles
Juned Akhtar, Mikael Ljung Aust, Rickard J. Eriksson, Helen Fagerlind, Alena Høye, Ross Phillips and Fridulv Sagberg TØI Report 1067/2010

TØI Report
1067/2010
Factors contributing to road fatalities Analysis of in-depth investigation data from passenger car intersection crashes and from collisions between bicycles and motorized vehicles
Juned Akhtar, Mikael Ljung Aust, Rickard J. Eriksson, Helen Fagerlind, Alena Høye, Ross Owen Phillips and Fridulv Sagberg
This report is covered by the terms and conditions specified by the Norwegian Copyright Act. Contents of the report may be used for referencing or as a source of information. Quotations or references must be attributed to the Institute of Transport Economics (TØI) as the source with specific mention made to the author and report number. For other use, advance permission must be provided by TØI.
ISSN 0808-1190
ISBN 978-82-480-1070-8 Paper version
ISBN 978-82-480-1069-2 Electronic version Oslo, May 2010
Tittel: Faktorer som bidrar til dødsulykker i veitrafikken: Analyse av data fra dybdestudier av kryssulykker med personbil og kollisjoner mellom sykkel og bil
Factors contributing to road fatalities: Analysis of in-depth investigation data from passenger car intersection crashes and from collisions between bicycles and motorized vehicles
Title:
Forfattere: Juned Akhtar Mikael Ljung Aust Rickard J. Eriksson Helen Fagerlind Alena Høye Ross Owen Phillips Fridulv Sagberg
Author(s): Juned Akhtar Mikael Ljung Aust Rickard J. Eriksson Helen Fagerlind Alena Høye Ross Owen Phillips Fridulv Sagberg
TØI rapport: Sider
TØI report: Pages
Dato: Date: 03.2010 03.2010 1067/2010 1067/2010 118 118 978-82-480-1070-8 978-82-480-1070-8 ISBN Paper: ISBN Papir:
ISSN 0808-1190 ISSN 0808-1190 978-82-480-1069-2 ISBN Elektronisk: 978-82-480-1069-2 ISBN Electronic:
Finansieringskilde: Financed by: The Research Council of Norway Norges Forskningsråd
Project: Prosjekt: 3385 - Gransking av ulykker og farlige hendelser i transport
3385 - Gransking av ulykker og farlige hendelser i transport
Torkel Bjørnskau Kvalitetsansvarlig: Torkel Bjørnskau Quality manager: Fridulv Sagberg Prosjektleder: Fridulv Sagberg Project manager:
Dybdestudier Dødsulykker Oppmerksomhet Trafikksikkerhet Ulykker
Emneord: Attention Bicycle accidents In-depth analyses Intersection Traffic safety
Key words:
Det ble foretatt dybdeanalyser av kryssulykker med personbil innblandet, og av kollisjoner mellom syklist og motorkjøretøy. De fleste kryssulykkene var kollisjon mellom personbil som svingte til venstre, og møtende motorsykkel eller tungbil. Den vanligste medvirkende faktoren for føreren i bilen som svingte, var at han/hun ikke la merke til møtende trafikant, på grunn av at oppmerksomheten var rettet mot andre aspekter ved trafikken. I de fleste sykkelulykkene hadde bilisten oversett syklisten, enten på grunn av uoppmerksomhet eller på grunn av vanskelige siktforhold. Lav forventning om syklister i trafikken er en medvirkende faktor til uoppmerksomhet. Dårlige siktforhold var dels knyttet til veiutformingen og dels til kjøretøy. Spesielt for tunge kjøretøy er de store blindsonene rundt kjøretøyet et problem med hensyn til å oppfatte syklister. Analysene gir grunnlag for flere anbefalinger om forbedringer av datainnsamlingen når det gjelder dybdestudier av veiulykker.
Sammendrag: In-depth studies were made of intersection crashes involving a passenger car, and of collisions between bicycle and motorized vehicle. Most intersection crashes were collisions between left-turning car and oncoming motorcycle or heavy vehicle. The most frequent contributing factor for the turning driver was failure to observe the oncoming vehicle, because of attention being focused on other aspects of traffic. In most bicycle crashes the driver reported failure to observe the bicyclist. This was found to be a result of inattention and/or poor visibility. Low expectation of seeing bicyclists in traffic was a likely contributing factor to inattention. Poor visibility was partly due to the road design or environment, and partly to the vehicle. Especially for heavy vehicles the blind zones make it difficult to observe bicyclists close to the vehicle. The analyses give rise to recommendations for improvement regarding data collection in in-depth analyses of road crashes.
Summary:
Copyright © Transportøkonomisk Institutt Denne publikasjonen er vernet i henhold til Åndsverkloven av 1961
Ved gjengivelse av materiale fra publikasjonen, må fullstendig kilde oppgis
Transportøkonomisk Institutt Gaustadalleen 21, 0349 Oslo Telefon 22 57 38 00 - www.toi.no
Institute of Transport Economics Gaustadalleen 21, 0349 Oslo, Norway Telefon 22 57 38 00 - www.toi.no
Preface
This report presents aggregate analyses of in-depth crash investigations of two types of road crashes, i.e., intersection crashes involving at least one passenger car, and collisions between bicycles and motorised vehicles. It makes up one part of the documentation from the project ”Investigating transport accidents and incidents: Method development and analysis of preconditions for learning”, funded by the Research Coun-cil of Norway, under the RISIT programme (“Risk and Safety in Transport”).
The project was carried out by TØI together with Chalmers University of Technology, as a part of TØI’s involvement in the SAFER Vehicle and Traffic Safety Centre in Gothenburg. The Norwegian Public Roads Administration has helpfully provided access to in-depth study reports from their crash investigation teams (UAG).
Mikael Ljung Aust at Chalmers has analysed the intersection crashes and authored Part 1 of the report together with Helen Fagerlind. Rickard J. Eriksson has developed the ”DREAM wiki” analysis tool that is described in Section 3.2. The bicycle crashes were analysed by Juned Akhtar, Alena Høye, and Ross Phil-lips at TØI. Juned Akhtar has also written Part 2 of the report. Fridulv Sagberg at TØI has been project manager and has edited the report. Trude C. Rømming has prepared the report for publishing and printing.
Oslo, May 2010 Transportøkonomisk institutt
Lasse Fridstrøm Torkel Bjørnskau instituttsjef forskningsleder

Contents Summary Sammendrag 1 General introduction ......................................................................................... 1
1.1 A brief description of DREAM 3.0 .............................................................. 11.2 Phenotypes ................................................................................................... 21.3 Genotypes ..................................................................................................... 2
PART 1: DREAM analysis of in-depth study data of fatal intersection accidents .................................................................................................................. 32 Introduction ....................................................................................................... 4
2.1 Source material characteristics ..................................................................... 4
3 Method ............................................................................................................... 63.1 DREAM methodology ................................................................................. 63.2 DREAM wiki ............................................................................................... 73.3 Analysis procedure ....................................................................................... 8
4 Results .............................................................................................................. 114.1 The full data set – an overview .................................................................. 114.2 LTAP / OD Crashes ................................................................................... 124.3 LTAP / LD crashes .................................................................................... 164.4 SCP crashes ................................................................................................ 184.5 RTIP crashes .............................................................................................. 194.6 LTIP crashes .............................................................................................. 214.7 Aggregate analysis on a higher level ......................................................... 234.8 Data quality ................................................................................................ 26
5 Intersection crashes - conclusions .................................................................. 30PART 2: In-depth analyses of 15 fatal collisions between bicycle and motorized vehicle ................................................................................................. 316 Background and method ................................................................................ 32
6.1 The primary data ........................................................................................ 326.2 Modification of DREAM: Estimating level of certainty when determining the genotypes ..................................................................................................... 32
7 Results of the DREAM analyses .................................................................... 337.1 Truck hitting two cyclists from behind ...................................................... 337.2 Truck running over a cyclist ...................................................................... 357.3 Truck running over and then reversing over a cyclist ................................ 367.4 Passenger car colliding with cyclist ........................................................... 387.5 Passenger car colliding with cyclist while overtaking a truck ................. 397.6 Passenger car colliding with two cyclists .................................................. 407.7 Truck running over cyclist ......................................................................... 427.8 Cyclist hit truck .......................................................................................... 43
7.9 Truck running over and dragging cyclist over 200 metres ...................... 457.10 Taxi colliding with cyclist in a intersection ............................................... 467.11 Cyclist colliding with passenger car in intersection ................................... 487.12 Taxi colliding with cyclist with passenger ................................................. 507.13 Passenger car hitting cyclist from behind .................................................. 517.14 Police chased car hits two cyclist ............................................................... 537.15 Passenger car hit cyclist in a intersection ................................................... 54
8 Aggregating DREAM charts .......................................................................... 568.1 Common causation patterns ....................................................................... 568.2 The aggregation .......................................................................................... 60
9 Bicycle accidents – discussion and conclusions ............................................ 61PART 3: General discussion and conclusions .................................................. 6210 Causal factors in crashes ................................................................................ 6311 Implications for data collection and analyses by NPRA investigation teams ..................................................................................................................... 64References ............................................................................................................. 66APPENDIX 1 Genotypes, phenotypes and links used in the analysis of intersection crashes .............................................................................................. 67APPENDIX 2 All aggregations of intersection crashes .................................... 69APPENDIX 3 DREAM charts for all intersection crashes ............................. 83APPENDIX 4 Some methodological considerations on DREAM 3.0 based on the bicycle case studies ................................................................................. 113APPENDIX 5 Various notes on the bicycle accident analyses ....................... 115
TØI Report 1067/2010 Authors: Juned Akhtar, Mikael Ljung Aust, Rickard J. Eriksson, Helen Fagerlind,
Alene Høye, Ross Phillips and Fridulv Sagberg Oslo 2010, 118 pages
The report can be ordered from: Institute of Transport Economics, Gaustadalléen 21, NO 0349 Oslo Telephone: +47 22 57 38 00 Telefax: +47 22 60 92 00 i
Summary:
Factors contributing to road fatalities Analysis of in-depth investigation data from passenger car intersection crashes and from collisions between bicycles and motorized vehicles
Inattention or distraction among drivers are frequent causes of intersection crashes and of collisions between bicycles and motorized vehicles. This is shown by analyses of data from in-depth studies of fatal road crashes for the years 2005-2007, collected by crash investigation teams of the Norwegian Public Roads Administration. The intersection crashes that were analysed included cases involving at least one car, and in the majority of crashes the other party was either a heavy vehicle or a motorcycle; i.e., most fatal intersection crashes are collisions between vehicles with a large mass difference. The most frequent course of events was a car driver turning left before an oncoming vehicle that was not observed or observed too late. High speed combined with expectancies that the turning driver would yield, in some cases contributed to the failure of an avoidance manoeuvre on the part of the driver going straight. In the bicycle crashes there were many cases where the car driver had not seen the bicyclist before the crash, either due to inattention and low expectancy of bicycle traffic, or to sight obstacles in the vehicle or in the road environment. The crashes were analysed by using the “Driver Reliability and Error Analysis Method” (DREAM), and the analyses revealed some needs for improvement in road crash data collection and causation analyses.
Analyses based on reports from accident investigation teams of the Norwegian Public Roads Administration All fatal road crashes in Norway are investigated in depth by multidisciplinary teams within the Norwegian Public Roads Administration (NPRA), and a report is prepared for each crash. In this study, reports from the NPRA investigation teams were used for further investigation of two selected types of crashes. The first type is intersection crashes involving at least one passenger car, and the second type is collisions between bicycles and motorized vehicles.
The main purpose of the study was two-fold. The first objective was to apply the Driver Reliability and Error Analysis Method (DREAM) for analysis of contributing factors, in order to get a more complete picture of the most frequent risk factors in the two types of crashes. The second purpose was to make an assessment of the data and analyses provided in the reports from the NPRA crash
Factors contributing to road fatalities
ii Copyright © Institute of Transport Economics, 2010
investigation teams, and to discuss the need for improvements regarding data collection and/or methods of analysis.
An additional purpose was to develop a computerbased tool ( a ”wiki”) to assist in the use of DREAM for causal analysis, including links to relevant parts of the DREAM manual in English, Swedish and Norwegian.
From among the crash reports for the years 2005-2007 all crashes of the two mentioned types were selected. This resulted in 28 intersection crashes and 15 collisions between bicycle and motorised vehicle. In the case where the two categories overlapped, i.e. intersection crash between bicycle and passenger car, the crash was included among bicycle crashes.
DREAM – a tool for analysing events and their possible causes DREAM is an adaptation to the traffic safety domain of the Cognitive Reliability and Error Analysis Method CREAM (E. Hollnagel: Cognitive reliability and error analysis method CREAM. Oxford: Elsevier Science, 1998). DREAM contains a classification scheme with a large number of factors that can be used to code crash causation information. The scheme distinguishes between observable effects due to loss of control (called phenotypes) and the contributing factors which bring those effects about (called genotypes). The genotypes include contributing factors both at the sharp end (close in time/space to the crash) as well as at the blunt end (more distant in time/space, yet important for the development of events).
DREAM also includes a linking system which specifies possible interactions between contributing factors. When information on causation is coded into a chart, the linking system ensures that the description of how one contributing factor leads to another is not arbitrary. The linking system basically limits the range of possible factor interactions to those currently supported by scientific knowledge, thus restricting and guiding the coding of causation information. The inherent structure in the linking system also makes it possible to aggregate causation information from multiple case studies in a structured, and principally semi-automated fashion, reducing the number of subjective judgements necessary to identify a pattern of contributing factors for a group of crashes. An important aspect of DREAM (and other applications based on CREAM) is its ability to capture the complexity of accident causation, resulting in a network of possibly contributing factors.
Perceptual problems and wrong expectations are critical factors For the intersection crashes the DREAM charts for individual crashes were aggregated based on a crash typology where crashes are sorted according to actual and intended vehicle trajectories.
Overall, results indicate that turning drivers to a large extent are faced with perception difficulties and unexpected behaviours in relation to the conflict vehicle, while at the same time trying to negotiate a demanding traffic situation. Drivers going straight on the other hand have less perception difficulties. Instead,
Factors contributing to road fatalities
Copyright © Institute of Transport Economics, 2010 iii
their main problem is that they largely expect turning drivers to yield. When this assumption is violated, they are either slow to react or do not react at all.
It is notable that in a majority of crashes the other party was either a heavy vehicle or a motorcycle; i.e., most fatal intersection crashes are collisions between vehicles with a large mass difference. Very few fatal intersection crashes involve only two passenger cars.
A1.1 Timing: too early (25)
A1.2 Timing: too late (8)
A1.3 Timing: no action (13)
A2.1 Speed: too high (9)
A5.1 Force: surplus force (1)
C1 Misjudgement of time gaps (4)
C2 Misjudgement of situation (53)
B1 - Missed observation (22)
B2 Late observation (3)
D1 Priority error (8)
E4 Under the influence of substances (6)
F2 Expectance of certain behaviours (31)
F5 Overestimation of skills (4)
F6 Insufficient skills/knowledge (8)
E2 Inattention (18)
E4.1 Alcohol (6)
E4.1 Drugs (1)
E5 Excitement seeking (8)
E5 Psychological stress (2)
F4 Habitually stretching rules and recommendations (1)
J1 Reduced visibility (4)
K1 Temporary obstruction of view (5)
K2 Permanent obstruction of view (12)
M1 Inadequate transmission from other
road users (9)
N4 Inadequate training (4)
E2.1 Driving-related distracters outside
vehicle (14)
J1.1 Low sun (2)
N1 Time pressure (1)A6.1 Object: adjacent
object (1)
G3 Temporary sight obstruction (2)
E2.1 Driving-related distracters inside
vehicle (1)
E2.3 Non driving-related distracters inside vehicle (1)
G3.1 Dirty windows and/or dirty mirrors(1)
Q2 Inadquate road design (1) L5 Inadequate road
geometry (1) All drivers
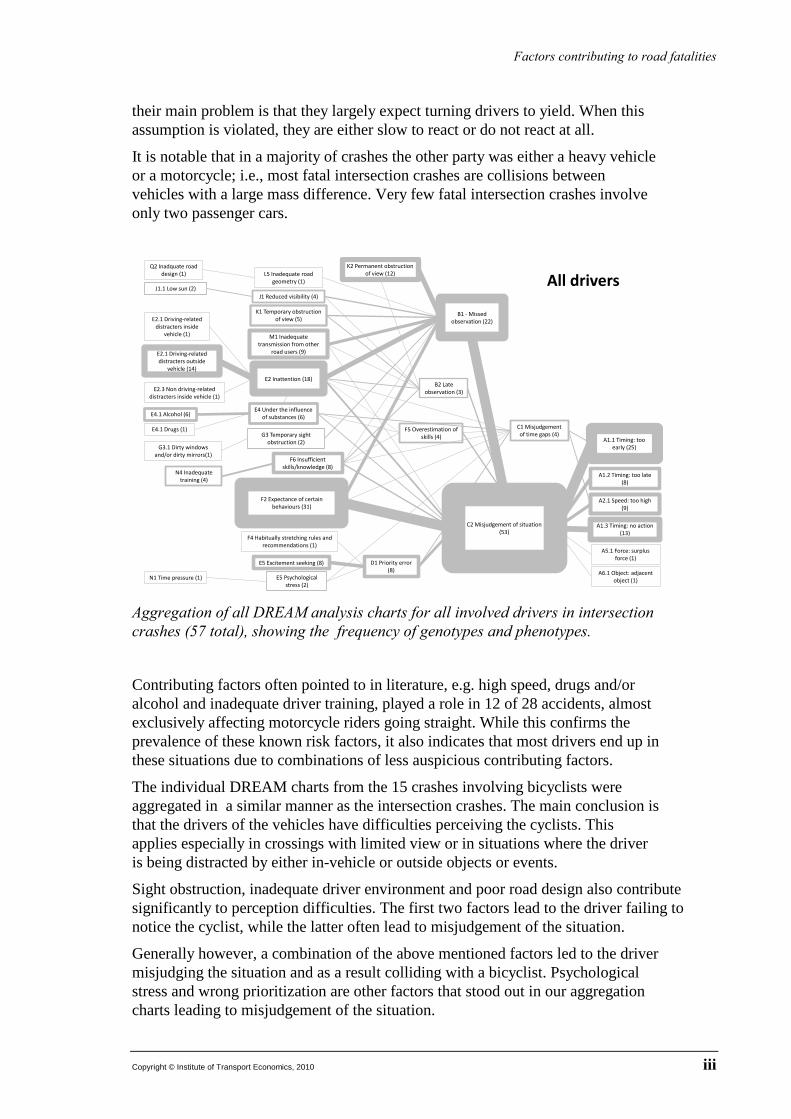
Aggregation of all DREAM analysis charts for all involved drivers in intersection crashes (57 total), showing the frequency of genotypes and phenotypes.
Contributing factors often pointed to in literature, e.g. high speed, drugs and/or alcohol and inadequate driver training, played a role in 12 of 28 accidents, almost exclusively affecting motorcycle riders going straight. While this confirms the prevalence of these known risk factors, it also indicates that most drivers end up in these situations due to combinations of less auspicious contributing factors.
The individual DREAM charts from the 15 crashes involving bicyclists were aggregated in a similar manner as the intersection crashes. The main conclusion is that the drivers of the vehicles have difficulties perceiving the cyclists. This applies especially in crossings with limited view or in situations where the driver is being distracted by either in-vehicle or outside objects or events.
Sight obstruction, inadequate driver environment and poor road design also contribute significantly to perception difficulties. The first two factors lead to the driver failing to notice the cyclist, while the latter often lead to misjudgement of the situation.
Generally however, a combination of the above mentioned factors led to the driver misjudging the situation and as a result colliding with a bicyclist. Psychological stress and wrong prioritization are other factors that stood out in our aggregation charts leading to misjudgement of the situation.
Factors contributing to road fatalities
iv Copyright © Institute of Transport Economics, 2010
The investigated accidents were limited in number, and general conclusions should therefore be drawn with caution, and even more caution is required for proposing concrete countermeasures. Nevertheless on the ground of the many “missed observations” in our study, it stands to reason to suggest general measures to increase bicyclist visibility, and to help drivers observe bicyclists in time and consequently avoiding collision.
Potential for improvement of data collection from road crashes Concerning the data and analyses contained in the NPRA crash investigation reports, some limitations and challenges were noted. A general observation is that there are overall fewer contributing factors coded for drivers who are not considered legally “at fault” for a crash, for example, the driver going straight in a crash with a left-turning driver. It is easy to come to think that the investigation effort should focus more on the driver at fault, since that driver is the one who needs accident countermeasures the most. However, question of who is to blame is in a majority of cases irrelevant from a countermeasure development point of view. This underlying investigator mindset therefore needs addressing, to avoid future bias in the reported information.
In can also be seen that information on relevant factors more distant in time/space (the blunt end) is more limited than information on those close in time/space to the crash. This points to the importance of having an explicit analysis method which clearly defines the scope of possible contributing factors and influences to be controlled for in accident investigation.
On a more detailed level, there seem to be certain discrepancies between teams and investigators in terms of how data collection is managed. Furthermore, the main reports are written to describe inclusions rather than exclusions, i.e. reasons for why certain factors are thought to contribute are included, but reasons for excluding other possible factors are left out. When a risk factor is absent in a crash report, there may be two possible explanations. One is that the accident investigations have failed to identify instances where these factors have contributed despite their assumed association with traffic accidents, and the other that these factors simply do not contribute. It is important that the analysts are systematic in trying both to prove the presence of possible contributing factors as well as to disprove the presence of other factors.
The DREAM methodology used here contains a number of factors which were not applicable to any of the analysed crashes. There is reason to further investigate whether this may be related to a too limited collection of data about the crashes in the first place, in order to point out possible room for improvement.
TØI-rapport 1067/2010 Forfatter(e): Juned Akhtar, Mikael Ljung Aust, Rickard J. Eriksson, Helen Fagerlind,
Alene Høye, Ross Phillips og Fridulv Sagberg Oslo 2010, 118 sider
Rapporten kan bestilles fra: Transportøkonomisk institutt, Gaustadalléen 21, NO 0349 Oslo Telefon: 22 57 38 00 Telefax: 22 60 92 00 I
Sammendrag:
Faktorer som bidrar til dødsulykker på vei Analyse av data fra dybdestudier av kryssulykker med personbil og kollisjoner mellom sykkel og bil
Uoppmerksomhet eller distraksjon blant bilførere er viktige årsaker til kryssulykker og til kollisjoner mellom bil og sykkel. Det viser en gjennomgang av materiale fra dybdestudier av dødsulykker for årene 2005-2007, innsamlet av Statens vegvesens ulykkesanalysegrupper. Kryssulykkene omfattet tilfeller hvor det var minst én personbil innblandet, og i et stort flertall av ulykkene var motparten enten et tungt kjøretøy eller en motorsyklist; dvs. at dødsulykker i kryss i stor grad er kollisjoner mellom kjøretøyer med ulik masse. Det hyppigste hendelsesforløpet var en bilist som svingte til venstre foran møtende kjøretøy som ikke ble oppdaget, eller ble oppdaget for sent. Stor fart kombinert med forventning om at svingende trafikant ville vike, bidro i noen tilfeller til at møtende trafikant ikke klarte å unngå ulykken. I sykkelulykkene var det mange tilfeller hvor bilisten ikke hadde sett syklisten på forhånd, enten på grunn av uoppmerksomhet og lav forventning om sykkeltrafikk, eller på grunn av sikthindringer i kjøretøyet (spesielt i tunge kjøretøy) eller i vegmiljøet. Ulykkene ble analysert ved hjelp av ”Driver Reliability and Error Analysis Method” (DREAM). Analysene avdekker behov for flere forbedringer når det gjelder datainnsamling og årsaksanalyse i forbindelse med veitrafikkulykker.
Analyser basert på Statens vegvesens UAG-materiale Alle dødsulykker på norske veier blir gjenstand for dybdeanalyser som gjennomføres av ulykkesanalysegrupper (UAG) i Statens vegvesen. Det lages en rapport fra hver ulykke. I dette prosjektet ble materiale fra ulykkesanalysene benyttet for nærmere studier av mulige årsaksfaktorer ved to utvalgte typer ulykker. Den ene ulykkestypen er kryssulykker hvor minst én personbil er innblandet, og den andre typen er kollisjoner mellom syklister og motorkjøretøy. Analysene omfatter bare atferden til førerne av de involverte motorkjøretøyene, og ikke syklistene.
Det var to hovedformål med undersøkelsen. Det første var å anvende ”Driver Reliability and Error Analysis Method” (DREAM) for å få et mer fullstendig bilde av de hyppigste medvirkende faktorer til de to ulykkestypene. Det andre formålet var å vurdere kvaliteten av datainnsamling og analyser som ligger til grunn for rapportene fra UAGene, og å drøfte behov for forbedringer.
Et tilleggsformål var å utviklet et datamaskinbasert verktøy (en ”wiki”) for å bruke DREAM i ulykkesanalyser. Dette verktøyet inneholder lenker til de relevante delene av håndboka for DREAM på engelsk, svensk og norsk.
Faktorer som bidrar til dødsulykker på vei
II Copyright © Transportøkonomisk institutt, 2010 Denne publikasjonen er vernet i henhold til Åndsverkloven av 1961
Fra ulykkesrapportene for årene 2005-2007 ble alle ulykker av de to nevnte typene valgt ut. Dette utvalget omfattet 28 kryssulykker og 15 sykkelulykker. I de tilfellene hvor kategoriene var overlappende, dvs. kryssulykker med syklist og personbil, ble ulykkene inkludert blant sykkelulykkene.
DREAM – et analyseverktøy for hendelser og faktorer som medvirker til disse DREAM er en tilpasning av ”Cognitive Reliability and Error Analysis Method” (CREAM) til veitrafikkulykker (E. Hollnagel: Cognitive reliability and error analysis CREAM. Oxford: Elsevier Science, 1998). DREAM inneholder et klassifikasjonsskjema med et stort antall hendelser og tilstander som benyttes for å kode medvirkende faktorer til ulykkene. Skjemaet skiller mellom fenotyper, dvs. observerbare hendelser som skyldes tap av kontroll, og genotyper, dvs. faktorer som antas å forårsake de observerbare hendelsene. Genotypene omfatter medvirkende faktorer både i ”den spisse enden” (nært hendelsen i tid og/eller rom) og i ”den butte enden” (lenger unna i tid og/eller rom, men likevel av betydning for hendelsesforløpet).
DREAM inneholder dessuten et system for lenking mellom de medvirkende faktorene. Når informasjon om en medvirkende faktor kodes inn i et diagram, sikrer lenkingssystemet at beskrivelsen av hvordan en faktor kan påvirkes av en annen, ikke blir tilfeldig. Lenkingssystemet begrenser mulige koblinger mellom faktorer til dem som det foreligger vitenskapelig grunnlag for, og på den måten begrenser og styrer lenkingssystemet analysearbeidet. Strukturen i lenkingssystemet og klassifikasjonsskjemaet, med forhåndsdefinerte kategorier, gjør det også mulig å aggregere analyseresultater fra et antall enkelthendelser på en strukturert, og halvveis automatisk, måte slik at en reduserer bruk av subjektivt skjønn for å finne mønstre av medvirkende faktorer for en gitt type hendelser. Et viktig aspekt ved DREAM (og også ved andre CREAM-baserte metoder) er at den fanger kompleksiteten i hendelsesforløpet fram mot en ulykke eller farlig hendelse og genererer et nettverk av mulige medvirkende faktorer.
Perseptuelle problemer og feil forventninger er kritiske faktorer For kryssulykkene ble DREAM-diagrammene for enkeltulykkene aggregert basert på en typologi hvor ulykkene ble sortert etter faktiske og intenderte trafikk-retninger for de involverte kjøretøyene.
For førere som svinger i kryss tyder resultatene på at perseptuelle problemer og uventet atferd fra motpartens side, kombinert med håndtering av en krevende trafikksituasjon, medvirket til ulykkene. Førere som kjører rett fram, berøres i mindre grad av perseptuelle problemer. Deres hovedproblem er at de stort sett forventer at den svingende parten vil vike. Når denne forventningen ikke innfris, klarer de ikke å reagere raskt nok, eller reagerer ikke i det hele tatt.
Det var påfallende at personbilens motpart i de aller fleste tilfellene var et kjøretøy med enten mye større masse (tungt kjøretøy) eller mye mindre masse (motorsykkel/moped). Det var svært få dødsulykker hvor begge parter var personbiler.
Faktorer som bidrar til dødsulykker på vei
Copyright © Transportøkonomisk institutt, 2010 III Denne publikasjonen er vernet i henhold til Åndsverkloven av 1961
A1.1 Timing: too early (25)
A1.2 Timing: too late (8)
A1.3 Timing: no action (13)
A2.1 Speed: too high (9)
A5.1 Force: surplus force (1)
C1 Misjudgement of time gaps (4)
C2 Misjudgement of situation (53)
B1 - Missed observation (22)
B2 Late observation (3)
D1 Priority error (8)
E4 Under the influence of substances (6)
F2 Expectance of certain behaviours (31)
F5 Overestimation of skills (4)
F6 Insufficient skills/knowledge (8)
E2 Inattention (18)
E4.1 Alcohol (6)
E4.1 Drugs (1)
E5 Excitement seeking (8)
E5 Psychological stress (2)
F4 Habitually stretching rules and recommendations (1)
J1 Reduced visibility (4)
K1 Temporary obstruction of view (5)
K2 Permanent obstruction of view (12)
M1 Inadequate transmission from other
road users (9)
N4 Inadequate training (4)
E2.1 Driving-related distracters outside
vehicle (14)
J1.1 Low sun (2)
N1 Time pressure (1)A6.1 Object: adjacent
object (1)
G3 Temporary sight obstruction (2)
E2.1 Driving-related distracters inside
vehicle (1)
E2.3 Non driving-related distracters inside vehicle (1)
G3.1 Dirty windows and/or dirty mirrors(1)
Q2 Inadquate road design (1) L5 Inadequate road
geometry (1) All drivers
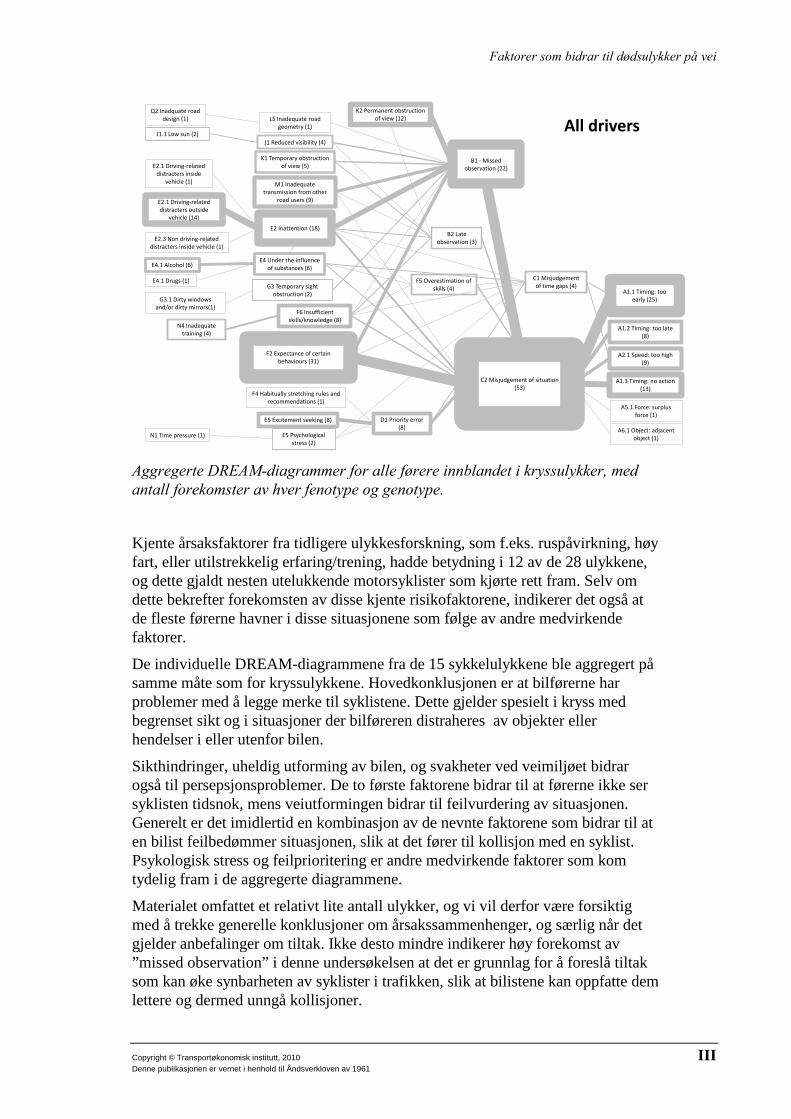
Aggregerte DREAM-diagrammer for alle førere innblandet i kryssulykker, med antall forekomster av hver fenotype og genotype.
Kjente årsaksfaktorer fra tidligere ulykkesforskning, som f.eks. ruspåvirkning, høy fart, eller utilstrekkelig erfaring/trening, hadde betydning i 12 av de 28 ulykkene, og dette gjaldt nesten utelukkende motorsyklister som kjørte rett fram. Selv om dette bekrefter forekomsten av disse kjente risikofaktorene, indikerer det også at de fleste førerne havner i disse situasjonene som følge av andre medvirkende faktorer.
De individuelle DREAM-diagrammene fra de 15 sykkelulykkene ble aggregert på samme måte som for kryssulykkene. Hovedkonklusjonen er at bilførerne har problemer med å legge merke til syklistene. Dette gjelder spesielt i kryss med begrenset sikt og i situasjoner der bilføreren distraheres av objekter eller hendelser i eller utenfor bilen.
Sikthindringer, uheldig utforming av bilen, og svakheter ved veimiljøet bidrar også til persepsjonsproblemer. De to første faktorene bidrar til at førerne ikke ser syklisten tidsnok, mens veiutformingen bidrar til feilvurdering av situasjonen. Generelt er det imidlertid en kombinasjon av de nevnte faktorene som bidrar til at en bilist feilbedømmer situasjonen, slik at det fører til kollisjon med en syklist. Psykologisk stress og feilprioritering er andre medvirkende faktorer som kom tydelig fram i de aggregerte diagrammene.
Materialet omfattet et relativt lite antall ulykker, og vi vil derfor være forsiktig med å trekke generelle konklusjoner om årsakssammenhenger, og særlig når det gjelder anbefalinger om tiltak. Ikke desto mindre indikerer høy forekomst av ”missed observation” i denne undersøkelsen at det er grunnlag for å foreslå tiltak som kan øke synbarheten av syklister i trafikken, slik at bilistene kan oppfatte dem lettere og dermed unngå kollisjoner.
Faktorer som bidrar til dødsulykker på vei
IV Copyright © Transportøkonomisk institutt, 2010 Denne publikasjonen er vernet i henhold til Åndsverkloven av 1961
Potensial for forbedring av UAG-rapportene Når det gjelder data og analyser i rapportene fra UAGene, viste gjennomgangen en del begrensninger og utfordringer. En generell observasjon er at det er registrert færre medvirkende faktorer for førere som ikke blir vurdert til å ha ”skyld” i ulykken, f.eks. den som kjører rett fram og kolliderer med en venstresvingende bil. Det er lett å komme til å tro at granskingen bør fokusere mer på den ”skyldige” parten, og at forebyggende tiltak er viktigst i forhold til denne parten. Imidlertid er det fra et ulykkesforebyggende perspektiv i de fleste tilfeller irrelevant hvilken part som har skyld i juridisk forstand.
Det var også en tendens til at informasjon om faktorer i ”den butte enden” (lengre fra ulykken i tid og/eller rom) var mer begrenset enn informasjon om de direkte utløsende faktorene. Dette viser behovet for en eksplisitt analysemetode som klart definerer rammene for mulige medvirkende faktorer og forhold som bør sjekkes i ulykkesanalyser.
På et mer detaljert nivå ser det ut til å være en del variasjon mellom de ulike UAGene når det gjelder innsamling og håndtering av data. Videre er rapportene stort sett skrevet slik at de viser inkluderte faktorer, dvs. faktorer som har vist seg eller som antas å ha medvirket, mens det ikke framgår om det er andre faktorer som har vært vurdert men ikke vist seg å ha hatt betydning. Når risikofaktorer er fraværende i en ulykkesrapport, kan det ha to mulige forklaringer. Den ene er at granskerne ikke har undersøkt disse faktorenes selv om de kan ha medvirket, og den andre forklaringen er at disse faktorene ganske enkelt ikke har forekommet. Det er viktig at granskerne er systematiske både når det gjelder å dokumentere mulige medvirkende faktorer og å avkrefte faktorer som ikke har medvirket.
Klassifikasjonsskjemaet i DREAM inneholder et stort antall faktorer som ikke var benyttet i noen av analysene i denne undersøkelsen. Dette kan ha sammenheng med at datainnsamlingen har vært for begrenset i første omgang. En bør se nærmere på om det er mulighet for forbedringer av selve datainnsamlingen.
Factors contributing to road fatalities
Copyright © Institute of Transport Economics, 2010 1
1 General introduction
All fatal crashes in Norway are analyzed in depth by multidisciplinary crash investigation teams (UAGs1
This report consists of three parts. Parts 1 and 2 consist of analyses of fatal road crashes, based on the mentioned reports from the NPRA in-depth investigations.
) organized by the Norwegian Public Roads Administration (NPRA). The teams collect data from on-the-scene and/or on-the-site investigations and produce a report of each crash. For the purpose of this study we obtained reports and related data from all fatal crashes in Norway in the period 2005 – 2007.
Part 1 is an analysis of intersection crashes involving at least one passenger car, and Part 2 is a similar analysis of collisions between bicycles and motorized vehicles. Part 3 is a general discussion and some concluding comments on the two preceding parts.
Common to both parts is the use of the method Driver Reliability and Error Analysis Method (DREAM) for identifying the factors contributing to crashes. This general introduction contains a short description of DREAM.
1.1 A brief description of DREAM 3.0 DREAM is based on the Cognitive Reliability and Error Assessment Method (CREAM), was developed by Erik Hollnagel (1998) for the analysis of safety-related errors in MTO (Man- Technology-Organisation) systems, and to determine the human, technological and organizational factors that may be involved in error causation. Although CREAM was originally developed in a setting of nuclear power plant operation, it is a generic approach including a taxonomy of cognitive reliability and error concepts that are relevant to any MTO system. However, to capture the domain-specific technological and organizational factors, the taxonomy needs to be adapted when the method is applied in other domains.
The Driving Reliability and Error Assessment Method DREAM (Ljung, 2002; Ljung, Furberg and Hollnagel, 2005; Huang & Ljung, 2004) is an adaptation of CREAM to the road transport domain. DREAM was developed in the FICA project at Chalmers University of Technology (Ljung, Fagerlind, Lövsund and Sandin 2007) to help provide condensed overviews of crash contributing factors on a case by case basis, as well as to facilitate aggregation of case causation data into aggregated causation patterns, or causation charts. It was also used in the EU project SafetyNet (SAFETYNET 2005, 2008, Wallén Warner, Ljung Aust, Björklund, Johansson and Sandin 2008). For a discussion of how to create and interpret aggregated causation charts using DREAM, see Sandin (Sandin and Ljung 2007, Sandin 2008, Wallén Warner and Sandin 2009).
1 UAG = ”ulykkesanalysegruppe”
Factors contributing to road fatalities
2 Copyright © Institute of Transport Economics, 2010
CREAM has also been adapted to the railway sector and to maritime accidents. Although the taxonomies differ between domains, there is a common core in all applications, and the method of causation analysis is the same, which potentially makes this approach useful for comparative studies across domains. In this study DREAM version 3.0 is used (Wallén Warner et al., 2008).
1.2 Phenotypes The starting point of a CREAM-based analysis, and in our case DREAM analysis, is the identification of the action (by a human operator or by a system such as a driver-and-car) immediately leading up to the critical event. This action is called the error mode or, using a biological analogy to designate observable events, a phenotype, as opposed to a genotype, which is a more or less covert cause of a phenotype.
For a given incident, the relevant general phenotype is chosen from a list of six classes, presumed to cover all possible physical relations between objects, which characterize an action: Timing, Speed, Distance, Direction, Force and Object.
1.3 Genotypes The error modes are specifications of the general phenotypes, such as for example “too short distance”, “too high speed”, or “wrong direction”. Possible causal factors are thus specified in a predefined classification system, and the analysis consists of establishing links backwards from the phenotype to the different genotypes. In our version of DREAM (3.0) all phenotypes link to same first-order genotypes.
In the analysis, a given genotype is always an antecedent either to a phenotype or to a different genotype. At the same time it may be a consequent of other genotypes. The taxonomy specifies the possible connections backward from a consequent to an antecedent, which in turn is the consequent of one or more other antecedents. In this way, and according to the rules for the analysis, a network of (assumed) causal relationships is constructed.
The relationship between the various categories in the taxonomy is based on a cognitive theoretical model. Thus, the whole analysis is built on three components, which according to Hollnagel (1998) are necessary preconditions for any valid causal analysis; the MCM framework: a Model of human cognition, a Classification scheme, and a Method describing the links between the model and the classification.
In DREAM 3.0 there are 51 genotypes. These are organized according to the driver – vehicle/traffic environment – organization triad.
Factors contributing to road fatalities
Copyright © Institute of Transport Economics, 2010 3
PART 1:
DREAM analysis of in-depth study data of fatal intersection accidents

Factors contributing to road fatalities
4 Copyright © Institute of Transport Economics, 2010
2 Introduction
This part is devoted to the analysis of fatal intersection accidents, occurring in the years 2005-2007. For every analysis, the source material has been the in-depth study reports produced by the different UAG’s. This means that the analysis solely has made use of the available material, no attempt at further reconstructions or bringing new information to light has been made.
The data available per accident varies in scope; for some accidents there is just the final report (usually a 5-10 page pdf document) available, whereas for other accidents the files include various protocols filled out by the investigators, such as Åstedsrapport, Kjøretøyskjema, etc. As will be discussed below, the extra information available through the protocols outside the main report sometimes (but not always) hold valuable extra information. Valuable is here taken not to mean that it brings new information to light which is unavailable in the main report, but in the sense that can it be used to discard possible contributing factors not mentioned in the main report.
2.1 Source material characteristics The material encompasses a total of 28 intersection crashes with fatal outcome. These were retrieved from a total of 559 fatal crashes, occurring in the years 2005-2007. Somewhat surprisingly, only 3 of these are car-to-car crashes. In the other 25 there is a large mass difference between the involved vehicles, since at least one of the vehicles is either a light vehicle (e.g. a motorcycle) or a heavy vehicle (e.g. a truck). When conjuncted with the fact that intersection accidents is on the top three list of common car-to-car accident types, one immediate conclusion from this is that the forces generated by intersection collisions generally are sufficiently low to leave car drivers alive. The 28 crashes all involve two vehicles, except one, which involves three vehicles. An overview of the number and type of vehicles is given in table 1. In that table, there is also a listing of to which extent each vehicle type was turning or going straight through the intersection.
Factors contributing to road fatalities
Copyright © Institute of Transport Economics, 2010 5
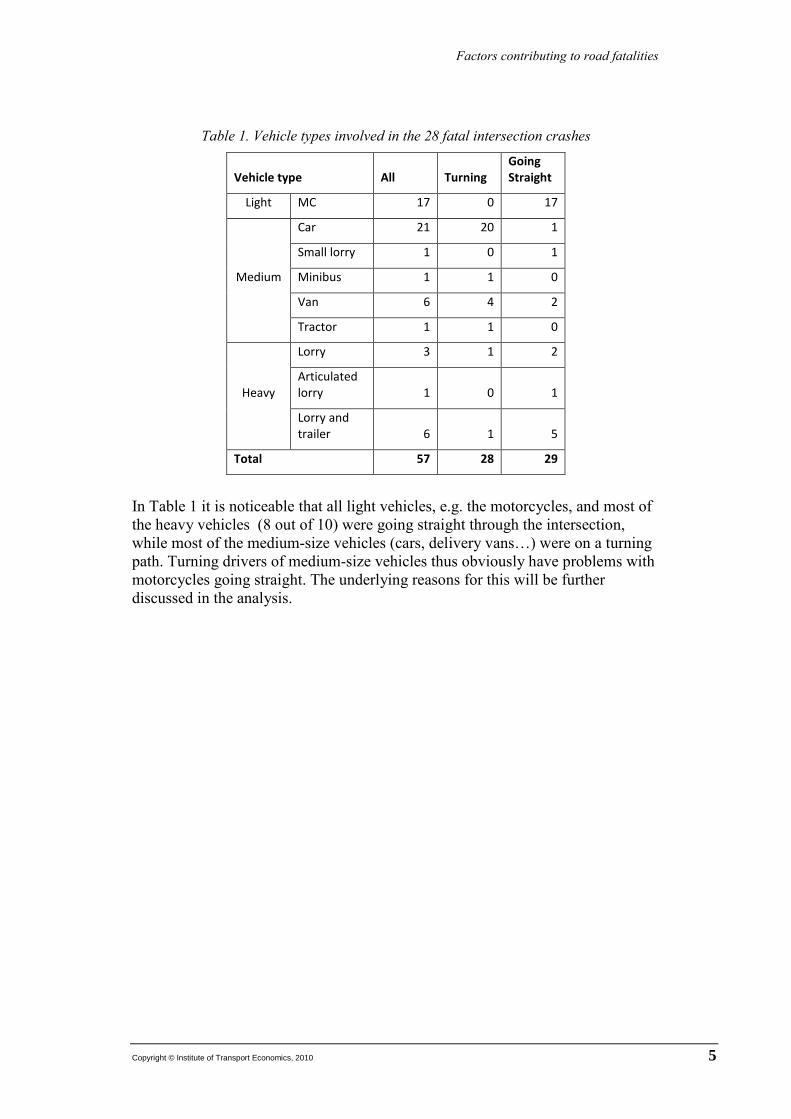
Table 1. Vehicle types involved in the 28 fatal intersection crashes
Vehicle type All Turning Going Straight
Light MC 17 0 17
Medium
Car 21 20 1
Small lorry 1 0 1
Minibus 1 1 0
Van 6 4 2
Tractor 1 1 0
Heavy
Lorry 3 1 2
Articulated lorry 1 0 1
Lorry and trailer 6 1 5
Total 57 28 29
In Table 1 it is noticeable that all light vehicles, e.g. the motorcycles, and most of the heavy vehicles (8 out of 10) were going straight through the intersection, while most of the medium-size vehicles (cars, delivery vans…) were on a turning path. Turning drivers of medium-size vehicles thus obviously have problems with motorcycles going straight. The underlying reasons for this will be further discussed in the analysis.
Factors contributing to road fatalities
6 Copyright © Institute of Transport Economics, 2010
3 Method
3.1 DREAM methodology Details on crash contributing factors for each driver in each in-depth study case file were first coded using the Driving Reliability and Error Analysis Method (DREAM) (Ljung 2002, Ljung, Furberg and Hollnagel 2005). DREAM is an adaptation to the traffic safety domain of the Cognitive Reliability and Error Analysis Method (CREAM) (Hollnagel 1998).
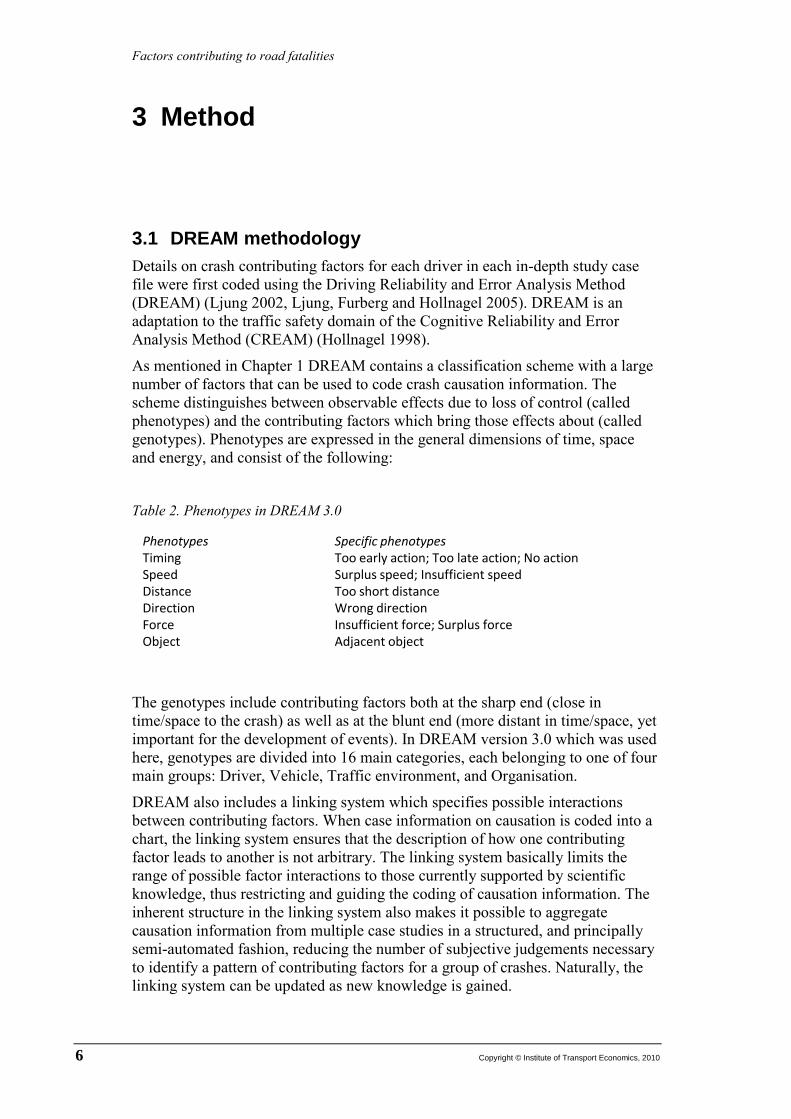
As mentioned in Chapter 1 DREAM contains a classification scheme with a large number of factors that can be used to code crash causation information. The scheme distinguishes between observable effects due to loss of control (called phenotypes) and the contributing factors which bring those effects about (called genotypes). Phenotypes are expressed in the general dimensions of time, space and energy, and consist of the following:
Table 2. Phenotypes in DREAM 3.0
The genotypes include contributing factors both at the sharp end (close in time/space to the crash) as well as at the blunt end (more distant in time/space, yet important for the development of events). In DREAM version 3.0 which was used here, genotypes are divided into 16 main categories, each belonging to one of four main groups: Driver, Vehicle, Traffic environment, and Organisation.
DREAM also includes a linking system which specifies possible interactions between contributing factors. When case information on causation is coded into a chart, the linking system ensures that the description of how one contributing factor leads to another is not arbitrary. The linking system basically limits the range of possible factor interactions to those currently supported by scientific knowledge, thus restricting and guiding the coding of causation information. The inherent structure in the linking system also makes it possible to aggregate causation information from multiple case studies in a structured, and principally semi-automated fashion, reducing the number of subjective judgements necessary to identify a pattern of contributing factors for a group of crashes. Naturally, the linking system can be updated as new knowledge is gained.
Phenotypes Specific phenotypesTiming Too early action; Too late action; No actionSpeed Surplus speed; Insufficient speedDistance Too short distanceDirection Wrong directionForce Insufficient force; Surplus forceObject Adjacent object
Factors contributing to road fatalities
Copyright © Institute of Transport Economics, 2010 7
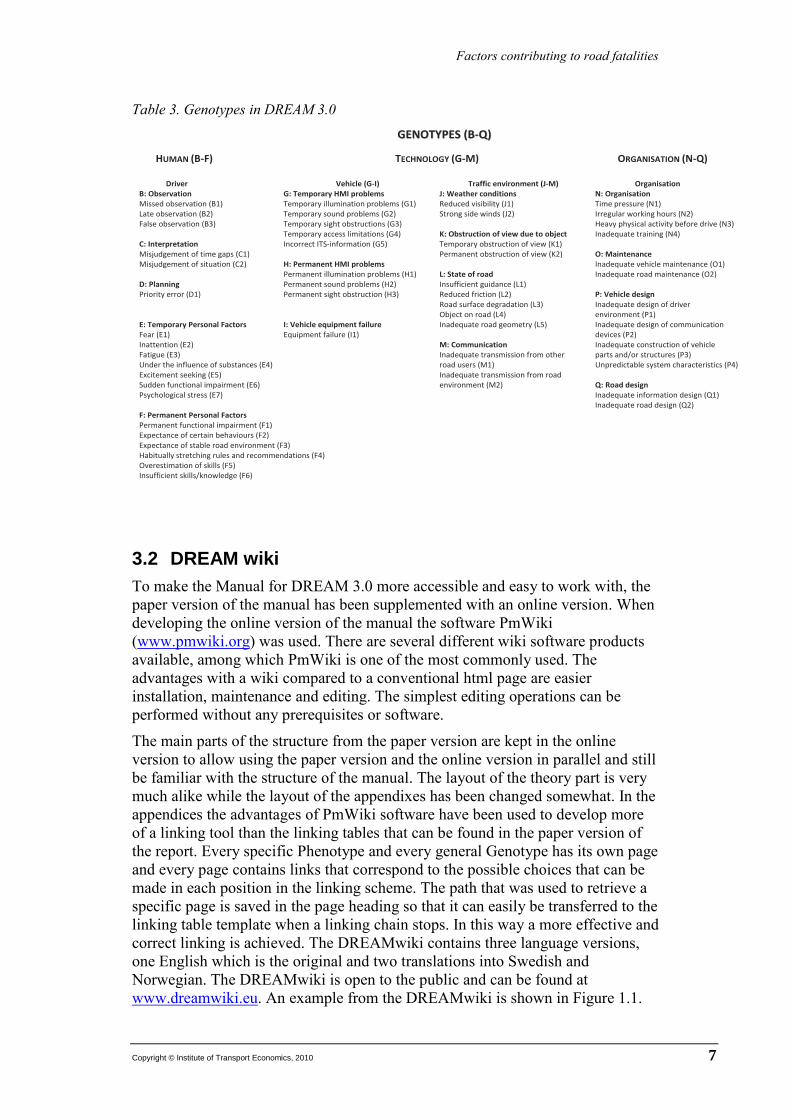
Table 3. Genotypes in DREAM 3.0
3.2 DREAM wiki To make the Manual for DREAM 3.0 more accessible and easy to work with, the paper version of the manual has been supplemented with an online version. When developing the online version of the manual the software PmWiki (www.pmwiki.org) was used. There are several different wiki software products available, among which PmWiki is one of the most commonly used. The advantages with a wiki compared to a conventional html page are easier installation, maintenance and editing. The simplest editing operations can be performed without any prerequisites or software.
The main parts of the structure from the paper version are kept in the online version to allow using the paper version and the online version in parallel and still be familiar with the structure of the manual. The layout of the theory part is very much alike while the layout of the appendixes has been changed somewhat. In the appendices the advantages of PmWiki software have been used to develop more of a linking tool than the linking tables that can be found in the paper version of the report. Every specific Phenotype and every general Genotype has its own page and every page contains links that correspond to the possible choices that can be made in each position in the linking scheme. The path that was used to retrieve a specific page is saved in the page heading so that it can easily be transferred to the linking table template when a linking chain stops. In this way a more effective and correct linking is achieved. The DREAMwiki contains three language versions, one English which is the original and two translations into Swedish and Norwegian. The DREAMwiki is open to the public and can be found at www.dreamwiki.eu. An example from the DREAMwiki is shown in Figure 1.1.
GGEENNOOTTYYPPEESS ((BB--QQ))
HUMAN (B-F) TECHNOLOGY (G-M) ORGANISATION (N-Q)
Driver Vehicle (G-I) Traffic environment (J-M) Organisation B: Observation G: Temporary HMI problems J: Weather conditions N: Organisation Missed observation (B1) Temporary illumination problems (G1) Reduced visibility (J1) Time pressure (N1) Late observation (B2) Temporary sound problems (G2) Strong side winds (J2) Irregular working hours (N2) False observation (B3) Temporary sight obstructions (G3) Heavy physical activity before drive (N3) Temporary access limitations (G4) K: Obstruction of view due to object Inadequate training (N4) C: Interpretation Incorrect ITS-information (G5) Temporary obstruction of view (K1) Misjudgement of time gaps (C1) Permanent obstruction of view (K2) O: Maintenance Misjudgement of situation (C2) H: Permanent HMI problems Inadequate vehicle maintenance (O1) Permanent illumination problems (H1) L: State of road Inadequate road maintenance (O2) D: Planning Permanent sound problems (H2) Insufficient guidance (L1) Priority error (D1) Permanent sight obstruction (H3) Reduced friction (L2) P: Vehicle design Road surface degradation (L3) Inadequate design of driver
Object on road (L4) environment (P1) E: Temporary Personal Factors I: Vehicle equipment failure Inadequate road geometry (L5) Inadequate design of communication Fear (E1) Equipment failure (I1) devices (P2) Inattention (E2) M: Communication Inadequate construction of vehicle Fatigue (E3) Inadequate transmission from other parts and/or structures (P3) Under the influence of substances (E4) road users (M1) Unpredictable system characteristics (P4) Excitement seeking (E5) Inadequate transmission from road Sudden functional impairment (E6) environment (M2) Q: Road design Psychological stress (E7) Inadequate information design (Q1) Inadequate road design (Q2) F: Permanent Personal Factors Permanent functional impairment (F1) Expectance of certain behaviours (F2) Expectance of stable road environment (F3) Habitually stretching rules and recommendations (F4) Overestimation of skills (F5) Insufficient skills/knowledge (F6)

Factors contributing to road fatalities
8 Copyright © Institute of Transport Economics, 2010
Figure 1.1. One example of the DREAMwiki (www.dreamwiki.eu)
3.3 Analysis procedure In any analysis procedure, some overall classifications usually are applied to organise the analysis. In this study, the organising principles come from a statistical study carried out at Volpe National Transportation Systems Center to describe crossing path crashes in the US (Najm et al., 2001). The researchers developed a crash typology which sorts crashes into groups based on actual and intended vehicle trajectories prior to the crash.
One reason for selecting this typology is that vehicle trajectories are coded in most types of data sources which can be used to study intersection crashes, something which facilitates comparison of this material to other intersection crash studies. Another reason is that vehicle trajectories provide a very natural frame of reference if study results are to be used for countermeasure development.
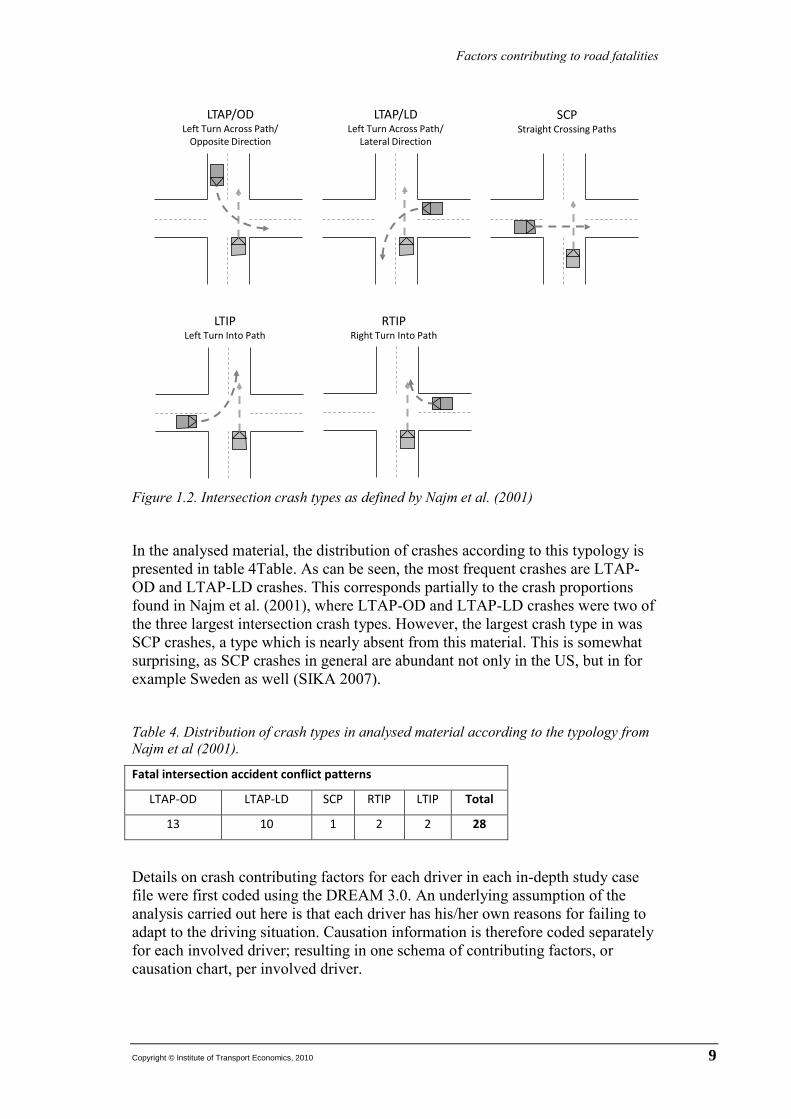
The crash types developed by Najm et al (2001) are shown in Figure 1.2. As an example, the typical scenario for an LTAP/OD crash is a left turning vehicle cutting across the path of another vehicle coming from the opposite direction, and which intends to cross the intersection on a straight path.
Factors contributing to road fatalities
Copyright © Institute of Transport Economics, 2010 9
Figure 1.2. Intersection crash types as defined by Najm et al. (2001)
In the analysed material, the distribution of crashes according to this typology is presented in table 4Table. As can be seen, the most frequent crashes are LTAP-OD and LTAP-LD crashes. This corresponds partially to the crash proportions found in Najm et al. (2001), where LTAP-OD and LTAP-LD crashes were two of the three largest intersection crash types. However, the largest crash type in was SCP crashes, a type which is nearly absent from this material. This is somewhat surprising, as SCP crashes in general are abundant not only in the US, but in for example Sweden as well (SIKA 2007).
Table 4. Distribution of crash types in analysed material according to the typology from Najm et al (2001).
Fatal intersection accident conflict patterns
LTAP-OD LTAP-LD SCP RTIP LTIP Total
13 10 1 2 2 28
Details on crash contributing factors for each driver in each in-depth study case file were first coded using the DREAM 3.0. An underlying assumption of the analysis carried out here is that each driver has his/her own reasons for failing to adapt to the driving situation. Causation information is therefore coded separately for each involved driver; resulting in one schema of contributing factors, or causation chart, per involved driver.
LTAP/ODLeft Turn Across Path/
Opposite Direction
LTAP/LD Left Turn Across Path/
Lateral Direction
SCPStraight Crossing Paths
LTIPLeft Turn Into Path
RTIPRight Turn Into Path

Factors contributing to road fatalities
10 Copyright © Institute of Transport Economics, 2010
Next, the individual causation charts were aggregated in a number of ways in order to provide a foundation for analysis of patterns among crash contributing factors. First, all causation charts were aggregated into a single graph, to provide a kind of complete overview of the analysed data and illustrate how complex the interactions which lead to fatal crashes can be.
However, to understand more in detail why particular groups of drivers ended up in out-of-control situations, the 57 individual causation charts were sorted and compiled according to the crash typology in Figure 1.2 above, and furthermore according to which path each driver was on. This resulted in two aggregate causation charts for each crash type, i.e. one for each vehicle trajectory. For example, for LTAP / OD crashes, one aggregate causation chart for all left turning drivers (those on a LTAP trajectory) was created, and one for all drivers going straight (those on the OD trajectory). An exception was made for drivers involved in the single SCP crash in the data, where both drivers by definition were on the same type of trajectory. The two SCP drivers were therefore aggregated into a single causation chart. Finally, in order to “zoom out” a bit, all drivers going straight and all drivers on a turning path were aggregated for the full data set, i.e. all crashes.

Factors contributing to road fatalities
Copyright © Institute of Transport Economics, 2010 11
4 Results
In the figures below, the total number of times a contributing factor occurs is represented by the number in brackets within each box. Note that DREAM allows attribution of, for example, multiple planning failures or multiple missed observations to a single driver. Some contributing factors can therefore exist in more than one instance per chart, which means their frequency of occurrence can exceed the number of aggregated charts (i.e. the number of drivers).
For visual guidance when looking for patterns, the factor frequency numbers are indicated through box border thickness as well. For links between boxes, the number of times a link occurs is not written out, but indirectly represented through the thickness of the connecting lines.
Note that for simplified reading, all detailed information which motivates the choice of each phenotype and genotype in the individual charts has been removed from the aggregations below. However, in the analysis, that information is of course used. For interested readers, the full analysis for each accident can be found in Appendix 3.
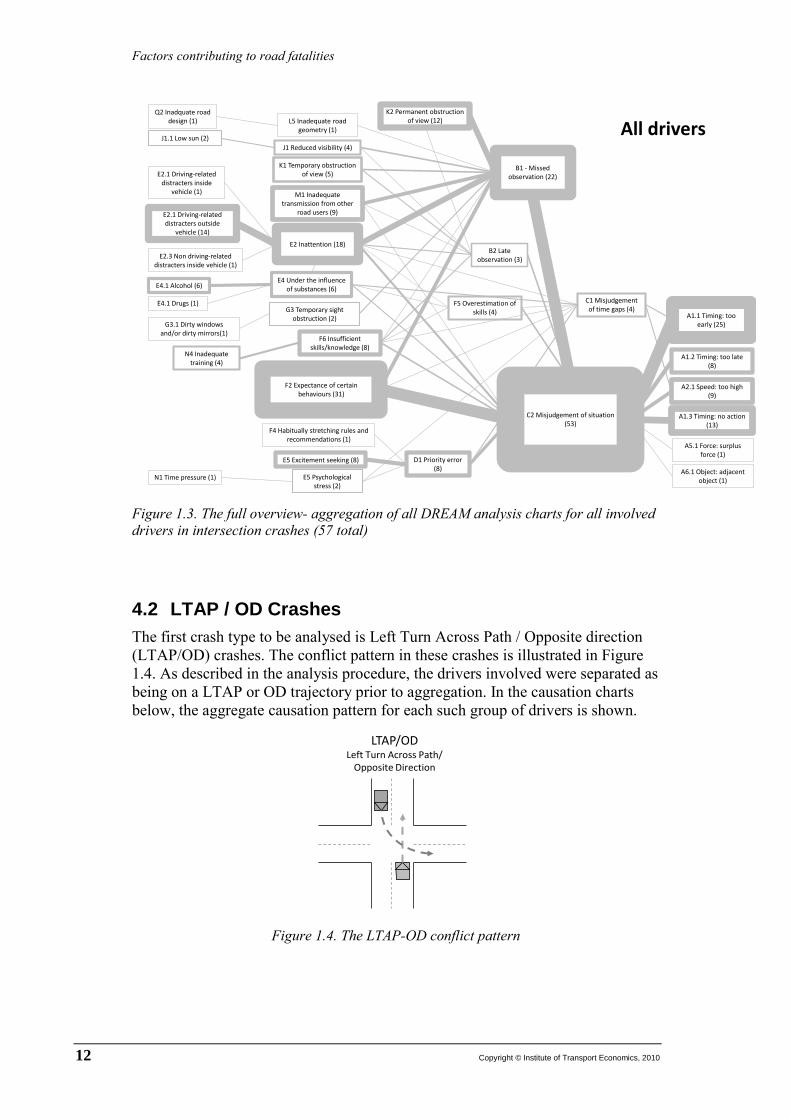
4.1 The full data set – an overview Figure 1.3 illustrates the result of the aggregated DREAM analysis for all 57 involved drivers in the full data set.
As can be seen in Figure 1.3, the overall most common contributing factor is Misjudgement of situation, with 53 occurrences across all 28 crashes. The most common precursors, or antecedents, of those situational misjudgements are Expectancy of certain behaviours and Missed observation. Interestingly, while many missed observations have Permanent obstruction of view as antecedent, there is also a frequent contribution from Inattention, which in turn is mainly linked to Driving related distracters outside vehicle. However, as can be seen in Figure 1.3, a large number of other contributing factors are involved as well. To gain further understanding, an analysis of the patterns among contributing factors for each crash types is necessary.
Factors contributing to road fatalities
12 Copyright © Institute of Transport Economics, 2010
Figure 1.3. The full overview- aggregation of all DREAM analysis charts for all involved drivers in intersection crashes (57 total)
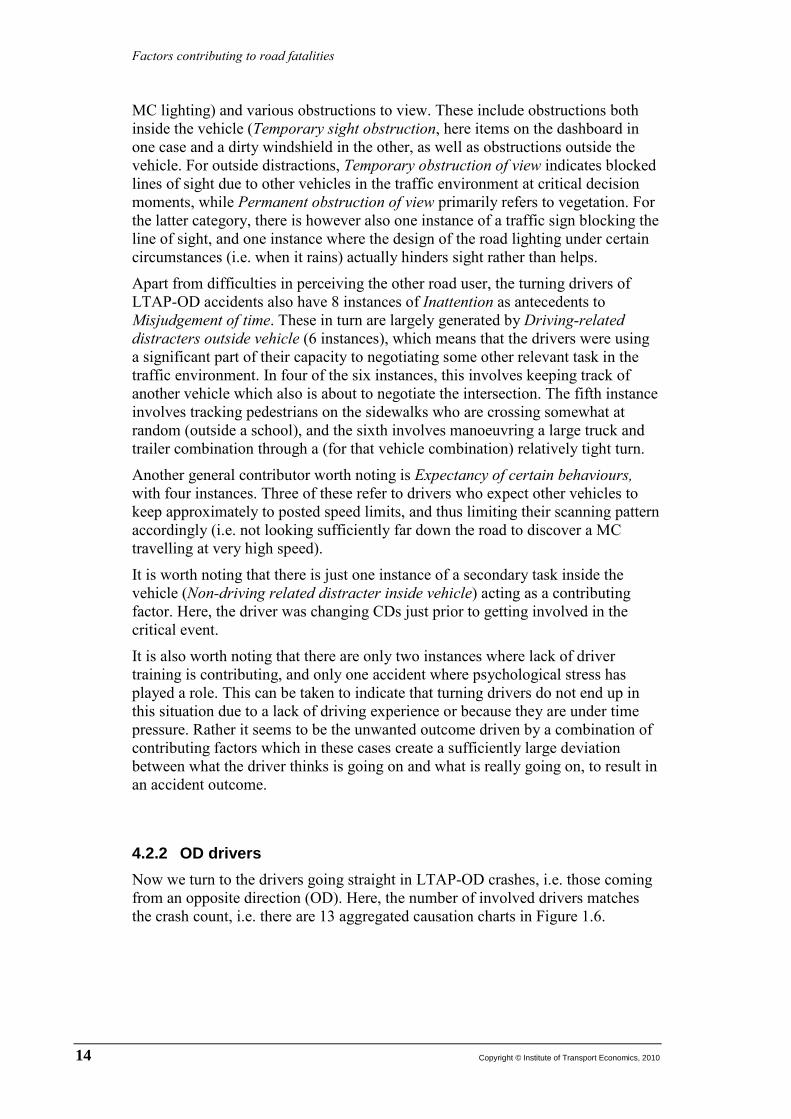
4.2 LTAP / OD Crashes The first crash type to be analysed is Left Turn Across Path / Opposite direction (LTAP/OD) crashes. The conflict pattern in these crashes is illustrated in Figure 1.4. As described in the analysis procedure, the drivers involved were separated as being on a LTAP or OD trajectory prior to aggregation. In the causation charts below, the aggregate causation pattern for each such group of drivers is shown.
Figure 1.4. The LTAP-OD conflict pattern
A1.1 Timing: too early (25)
A1.2 Timing: too late (8)
A1.3 Timing: no action (13)
A2.1 Speed: too high (9)
A5.1 Force: surplus force (1)
C1 Misjudgement of time gaps (4)
C2 Misjudgement of situation (53)
B1 - Missed observation (22)
B2 Late observation (3)
D1 Priority error (8)
E4 Under the influence of substances (6)
F2 Expectance of certain behaviours (31)
F5 Overestimation of skills (4)
F6 Insufficient skills/knowledge (8)
E2 Inattention (18)
E4.1 Alcohol (6)
E4.1 Drugs (1)
E5 Excitement seeking (8)
E5 Psychological stress (2)
F4 Habitually stretching rules and recommendations (1)
J1 Reduced visibility (4)
K1 Temporary obstruction of view (5)
K2 Permanent obstruction of view (12)
M1 Inadequate transmission from other
road users (9)
N4 Inadequate training (4)
E2.1 Driving-related distracters outside
vehicle (14)
J1.1 Low sun (2)
N1 Time pressure (1)A6.1 Object: adjacent
object (1)
G3 Temporary sight obstruction (2)
E2.1 Driving-related distracters inside
vehicle (1)
E2.3 Non driving-related distracters inside vehicle (1)
G3.1 Dirty windows and/or dirty mirrors(1)
Q2 Inadquate road design (1) L5 Inadequate road
geometry (1) All drivers
LTAP/ODLeft Turn Across Path/
Opposite Direction
Factors contributing to road fatalities
Copyright © Institute of Transport Economics, 2010 13
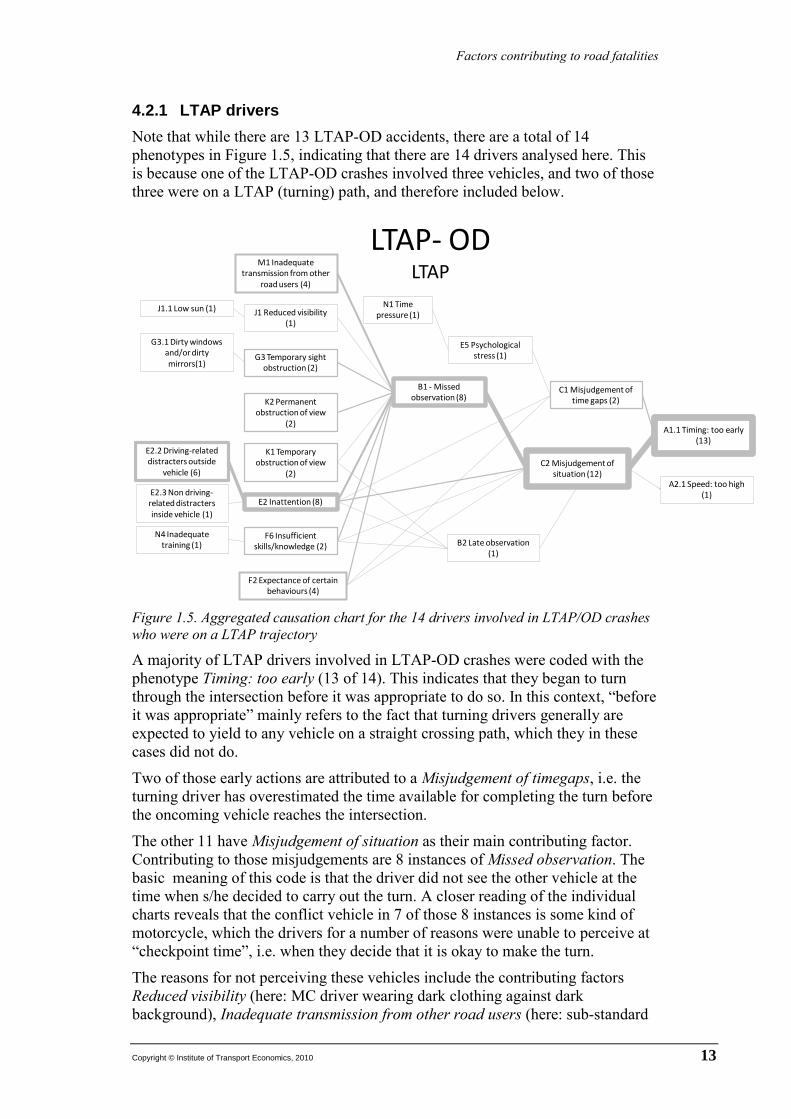
4.2.1 LTAP drivers Note that while there are 13 LTAP-OD accidents, there are a total of 14 phenotypes in Figure 1.5, indicating that there are 14 drivers analysed here. This is because one of the LTAP-OD crashes involved three vehicles, and two of those three were on a LTAP (turning) path, and therefore included below.
Figure 1.5. Aggregated causation chart for the 14 drivers involved in LTAP/OD crashes who were on a LTAP trajectory
A majority of LTAP drivers involved in LTAP-OD crashes were coded with the phenotype Timing: too early (13 of 14). This indicates that they began to turn through the intersection before it was appropriate to do so. In this context, “before it was appropriate” mainly refers to the fact that turning drivers generally are expected to yield to any vehicle on a straight crossing path, which they in these cases did not do.
Two of those early actions are attributed to a Misjudgement of timegaps, i.e. the turning driver has overestimated the time available for completing the turn before the oncoming vehicle reaches the intersection.
The other 11 have Misjudgement of situation as their main contributing factor. Contributing to those misjudgements are 8 instances of Missed observation. The basic meaning of this code is that the driver did not see the other vehicle at the time when s/he decided to carry out the turn. A closer reading of the individual charts reveals that the conflict vehicle in 7 of those 8 instances is some kind of motorcycle, which the drivers for a number of reasons were unable to perceive at “checkpoint time”, i.e. when they decide that it is okay to make the turn.
The reasons for not perceiving these vehicles include the contributing factors Reduced visibility (here: MC driver wearing dark clothing against dark background), Inadequate transmission from other road users (here: sub-standard
A1.1 Timing: too early (13)
A2.1 Speed: too high (1)
C1 Misjudgement of time gaps (2)
C2 Misjudgement of situation (12)
B1 - Missed observation (8)
B2 Late observation (1)
F2 Expectance of certain behaviours (4)
F6 Insufficient skills/knowledge (2)
E2 Inattention (8)
E5 Psychological stress (1)
J1 Reduced visibility (1)
K1 Temporary obstruction of view
(2)
K2 Permanent obstruction of view
(2)
M1 Inadequate transmission from other
road users (4)
N4 Inadequate training (1)
E2.2 Driving-related distracters outside
vehicle (6)
J1.1 Low sun (1) N1 Time pressure (1)
G3 Temporary sight obstruction (2)
E2.3 Non driving-related distracters inside vehicle (1)
G3.1 Dirty windows and/or dirty mirrors(1)
LTAP- ODLTAP
Factors contributing to road fatalities
14 Copyright © Institute of Transport Economics, 2010
MC lighting) and various obstructions to view. These include obstructions both inside the vehicle (Temporary sight obstruction, here items on the dashboard in one case and a dirty windshield in the other, as well as obstructions outside the vehicle. For outside distractions, Temporary obstruction of view indicates blocked lines of sight due to other vehicles in the traffic environment at critical decision moments, while Permanent obstruction of view primarily refers to vegetation. For the latter category, there is however also one instance of a traffic sign blocking the line of sight, and one instance where the design of the road lighting under certain circumstances (i.e. when it rains) actually hinders sight rather than helps.
Apart from difficulties in perceiving the other road user, the turning drivers of LTAP-OD accidents also have 8 instances of Inattention as antecedents to Misjudgement of time. These in turn are largely generated by Driving-related distracters outside vehicle (6 instances), which means that the drivers were using a significant part of their capacity to negotiating some other relevant task in the traffic environment. In four of the six instances, this involves keeping track of another vehicle which also is about to negotiate the intersection. The fifth instance involves tracking pedestrians on the sidewalks who are crossing somewhat at random (outside a school), and the sixth involves manoeuvring a large truck and trailer combination through a (for that vehicle combination) relatively tight turn.
Another general contributor worth noting is Expectancy of certain behaviours, with four instances. Three of these refer to drivers who expect other vehicles to keep approximately to posted speed limits, and thus limiting their scanning pattern accordingly (i.e. not looking sufficiently far down the road to discover a MC travelling at very high speed).
It is worth noting that there is just one instance of a secondary task inside the vehicle (Non-driving related distracter inside vehicle) acting as a contributing factor. Here, the driver was changing CDs just prior to getting involved in the critical event.
It is also worth noting that there are only two instances where lack of driver training is contributing, and only one accident where psychological stress has played a role. This can be taken to indicate that turning drivers do not end up in this situation due to a lack of driving experience or because they are under time pressure. Rather it seems to be the unwanted outcome driven by a combination of contributing factors which in these cases create a sufficiently large deviation between what the driver thinks is going on and what is really going on, to result in an accident outcome.
4.2.2 OD drivers Now we turn to the drivers going straight in LTAP-OD crashes, i.e. those coming from an opposite direction (OD). Here, the number of involved drivers matches the crash count, i.e. there are 13 aggregated causation charts in Figure 1.6.
Factors contributing to road fatalities
Copyright © Institute of Transport Economics, 2010 15
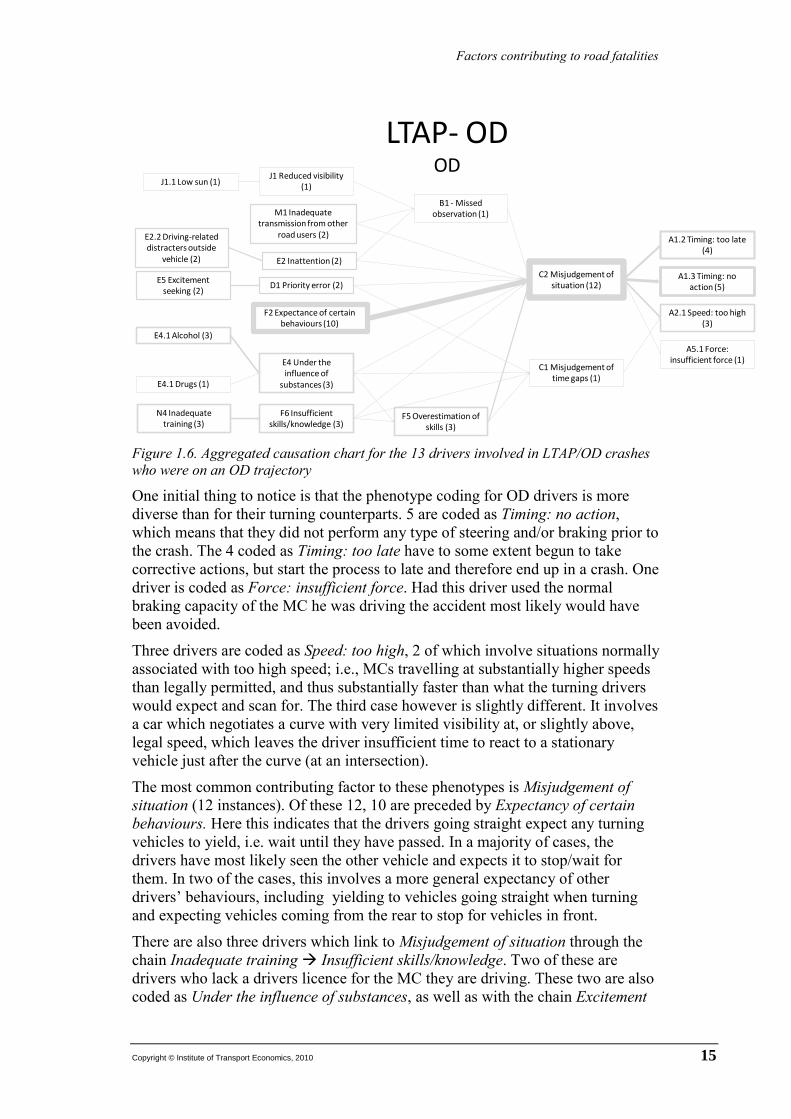
Figure 1.6. Aggregated causation chart for the 13 drivers involved in LTAP/OD crashes who were on an OD trajectory
One initial thing to notice is that the phenotype coding for OD drivers is more diverse than for their turning counterparts. 5 are coded as Timing: no action, which means that they did not perform any type of steering and/or braking prior to the crash. The 4 coded as Timing: too late have to some extent begun to take corrective actions, but start the process to late and therefore end up in a crash. One driver is coded as Force: insufficient force. Had this driver used the normal braking capacity of the MC he was driving the accident most likely would have been avoided.
Three drivers are coded as Speed: too high, 2 of which involve situations normally associated with too high speed; i.e., MCs travelling at substantially higher speeds than legally permitted, and thus substantially faster than what the turning drivers would expect and scan for. The third case however is slightly different. It involves a car which negotiates a curve with very limited visibility at, or slightly above, legal speed, which leaves the driver insufficient time to react to a stationary vehicle just after the curve (at an intersection).
The most common contributing factor to these phenotypes is Misjudgement of situation (12 instances). Of these 12, 10 are preceded by Expectancy of certain behaviours. Here this indicates that the drivers going straight expect any turning vehicles to yield, i.e. wait until they have passed. In a majority of cases, the drivers have most likely seen the other vehicle and expects it to stop/wait for them. In two of the cases, this involves a more general expectancy of other drivers’ behaviours, including yielding to vehicles going straight when turning and expecting vehicles coming from the rear to stop for vehicles in front.
There are also three drivers which link to Misjudgement of situation through the chain Inadequate training Insufficient skills/knowledge. Two of these are drivers who lack a drivers licence for the MC they are driving. These two are also coded as Under the influence of substances, as well as with the chain Excitement
A1.2 Timing: too late (4)
A1.3 Timing: no action (5)
A2.1 Speed: too high (3)
A5.1 Force: insufficient force (1)
C1 Misjudgement of time gaps (1)
C2 Misjudgement of situation (12)
B1 - Missed observation (1)
D1 Priority error (2)
E4 Under the influence of
substances (3)
F2 Expectance of certain behaviours (10)
F5 Overestimation of skills (3)
E2 Inattention (2)
E4.1 Alcohol (3)
E4.1 Drugs (1)
E5 Excitement seeking (2)
F6 Insufficient skills/knowledge (3)
J1 Reduced visibility (1)
M1 Inadequate transmission from other
road users (2)
N4 Inadequate training (3)
E2.2 Driving-related distracters outside
vehicle (2)
J1.1 Low sun (1)
LTAP- ODOD
Factors contributing to road fatalities
16 Copyright © Institute of Transport Economics, 2010
seeking Priority error. The third driver is driving a high performance MC, the full brake capacity of which he is not capable of using.
In comparison to the turning drivers, there are only two instances of Driving related distracters outside vehicle, so traffic situation seems overall not to have been as taxing for the drivers going straight as for the turning drivers. This likely reflects the fact that drivers going straight have priority over any other traffic, and thus are less concerned with other vehicles approaching, or being in, the intersection.
Just as for LTAP drivers, there is also a notable absence of secondary distraction tasks and psychological stress. There is in other words no indication that these drivers were challenged with a particularly difficult traffic situation.
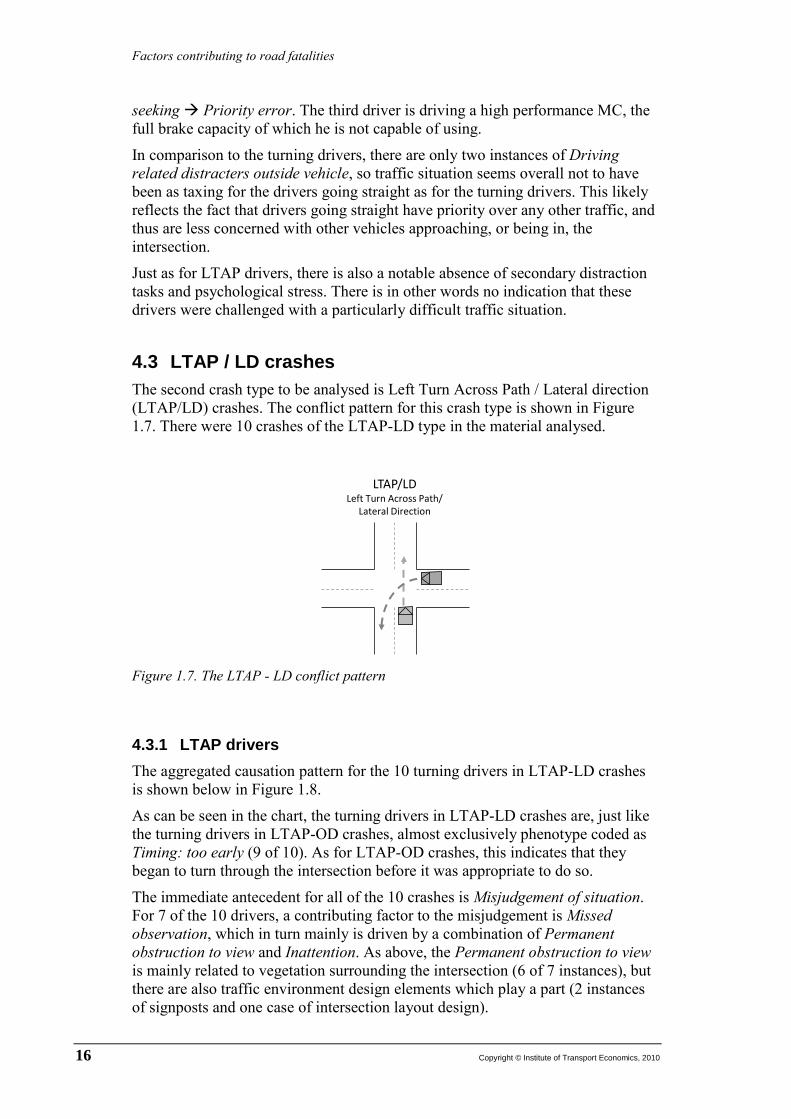
4.3 LTAP / LD crashes The second crash type to be analysed is Left Turn Across Path / Lateral direction (LTAP/LD) crashes. The conflict pattern for this crash type is shown in Figure 1.7. There were 10 crashes of the LTAP-LD type in the material analysed.
Figure 1.7. The LTAP - LD conflict pattern
4.3.1 LTAP drivers The aggregated causation pattern for the 10 turning drivers in LTAP-LD crashes is shown below in Figure 1.8.
As can be seen in the chart, the turning drivers in LTAP-LD crashes are, just like the turning drivers in LTAP-OD crashes, almost exclusively phenotype coded as Timing: too early (9 of 10). As for LTAP-OD crashes, this indicates that they began to turn through the intersection before it was appropriate to do so.
The immediate antecedent for all of the 10 crashes is Misjudgement of situation. For 7 of the 10 drivers, a contributing factor to the misjudgement is Missed observation, which in turn mainly is driven by a combination of Permanent obstruction to view and Inattention. As above, the Permanent obstruction to view is mainly related to vegetation surrounding the intersection (6 of 7 instances), but there are also traffic environment design elements which play a part (2 instances of signposts and one case of intersection layout design).
LTAP/LD Left Turn Across Path/
Lateral Direction

Factors contributing to road fatalities
Copyright © Institute of Transport Economics, 2010 17
Figure 1.8. Aggregated causation chart for the 10 drivers involved in LTAP/LD crashes who were on a LTAP trajectory
The 6 Inattention instances are mainly attributed to various distractors, the most common being the 4 instances of Driving related distracters outside vehicle, e.g. other vehicles which must be considered when negotiation of the traffic situation. There is also one instance of a Driving related distracter inside vehicle and one instance where Inattention is attributed to the driver being drunk (Alcohol). In two of the three cases where Insufficient skills/knowledge has been coded, this refers to young (18 yrs) and relatively inexperienced drivers who have had their driving licences for a short time. The third case involves a driver who is negotiating the manual shift of a rental car, while being used to automatic gear in his own vehicle.
4.3.2 LD drivers The aggregated causation pattern for the 10 drivers going straight in LTAP-LD crashes is shown below in Figure 1.9. Like the OD drivers of LTAP-OD accidents, the LD drivers have a more diverse phenotype coding. 5 are coded as Timing: no action, which means that they did not perform any type of steering and/or braking prior to the crash. The 3 coded as Timing: too late have to some extent begun to take corrective actions, but start the process to late and therefore end up in a crash. One driver is coded as Speed: too high, indicating a travel speed substantially over the speed limit.
A1.1 Timing: too early (9)
C2 Misjudgement of situation (10)
B1 - Missed observation (7)
E4 Under the influence of
substances (1)F2 Expectance of certain
behaviours (2)
F6 Insufficient skills/knowledge (3)
E2 Inattention (6)
E4.1 Alcohol (1)
K1 Temporary obstruction of view (1)
K2 Permanent obstruction of view (7)
E2.2Driving-related distracters outside
vehicle (4)
A6.1 Object: adjacent object (1)
E2.1 Driving-related distracters inside
vehicle (1)
Q2 Inadquate road design (1)
L5 Inadequate road geometry (1)
LTAP- LDLTAP

Factors contributing to road fatalities
18 Copyright © Institute of Transport Economics, 2010
Figure 1.9. Aggregated causation chart for the 10 drivers involved in LTAP/LD crashes who were on a LD trajectory
In terms of contributing factors, there is one instance of Misjudgement of timegaps, where an MC driver overestimated the time available for passing through the intersection before the turning vehicle would be blocking the MC’s travel path. This driver is also coded as Excitement seeking Priority error and Alcohol Under the influence of substances, and the phenotype attributed is Speed: too high, so this is a case of a speeding and drunk MC driver.
The other 9 phenotypes are attributed to Misjudgement of situation. As for OD drivers in LTAP-OD crashes, a majority of these have Expectancy of certain behaviours as a contributing factor. For most of those 8 instances, the LD driver has seen the conflict vehicle in, or approaching, the intersection, but expects that it will stop and yield.
There are some visibility issues reported for these drivers as well. There are 2 instances of Missed observation and 2 instances of Late observation. The instances of Missed observation are in turn attributed to one instance of Inadequate transmission from other road users and one instance of Permanent obstruction to view. It is worth noting that the latter are not nearly as many as for the turning drivers. This actually indicates an implicit contradiction, which is further discussed below under general aspects of which types of information on causation can be expected from turning drivers and drivers going straight, respectively.
4.4 SCP crashes There was just one SCP crash in the material, the conflict pattern of which is shown in Figure 1.10.
A1.2 Timing: too late (3)
A1.3 Timing: no action (5)
A2.1 Speed: too high (2)
C1 Misjudgement of time gaps (1)
C2 Misjudgement of situation (9)
B1 - Missed observation (2)
B2 Late observation (2)
D1 Priority error (2)
E4 Under the influence of
substances (2)
F2 Expectance of certain behaviours (8)
E4.1 Alcohol (2)
E5 Excitement seeking (2)
F4 Habitually stretching rules and
recommendations (1)
K2 Permanent obstruction of view
(1)
M1 Inadequate transmission from
other road users (1)
LTAP- LDLD
Factors contributing to road fatalities
Copyright © Institute of Transport Economics, 2010 19
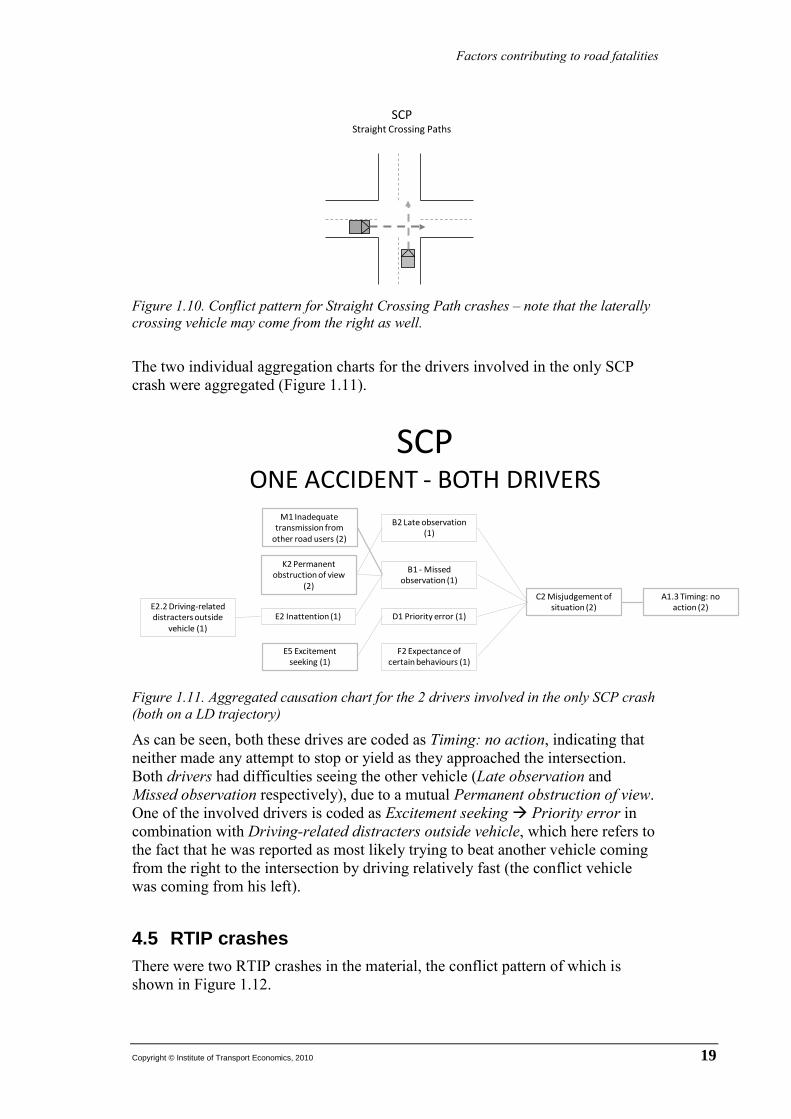
Figure 1.10. Conflict pattern for Straight Crossing Path crashes – note that the laterally crossing vehicle may come from the right as well.
The two individual aggregation charts for the drivers involved in the only SCP crash were aggregated (Figure 1.11).
Figure 1.11. Aggregated causation chart for the 2 drivers involved in the only SCP crash (both on a LD trajectory)
As can be seen, both these drives are coded as Timing: no action, indicating that neither made any attempt to stop or yield as they approached the intersection. Both drivers had difficulties seeing the other vehicle (Late observation and Missed observation respectively), due to a mutual Permanent obstruction of view. One of the involved drivers is coded as Excitement seeking Priority error in combination with Driving-related distracters outside vehicle, which here refers to the fact that he was reported as most likely trying to beat another vehicle coming from the right to the intersection by driving relatively fast (the conflict vehicle was coming from his left).
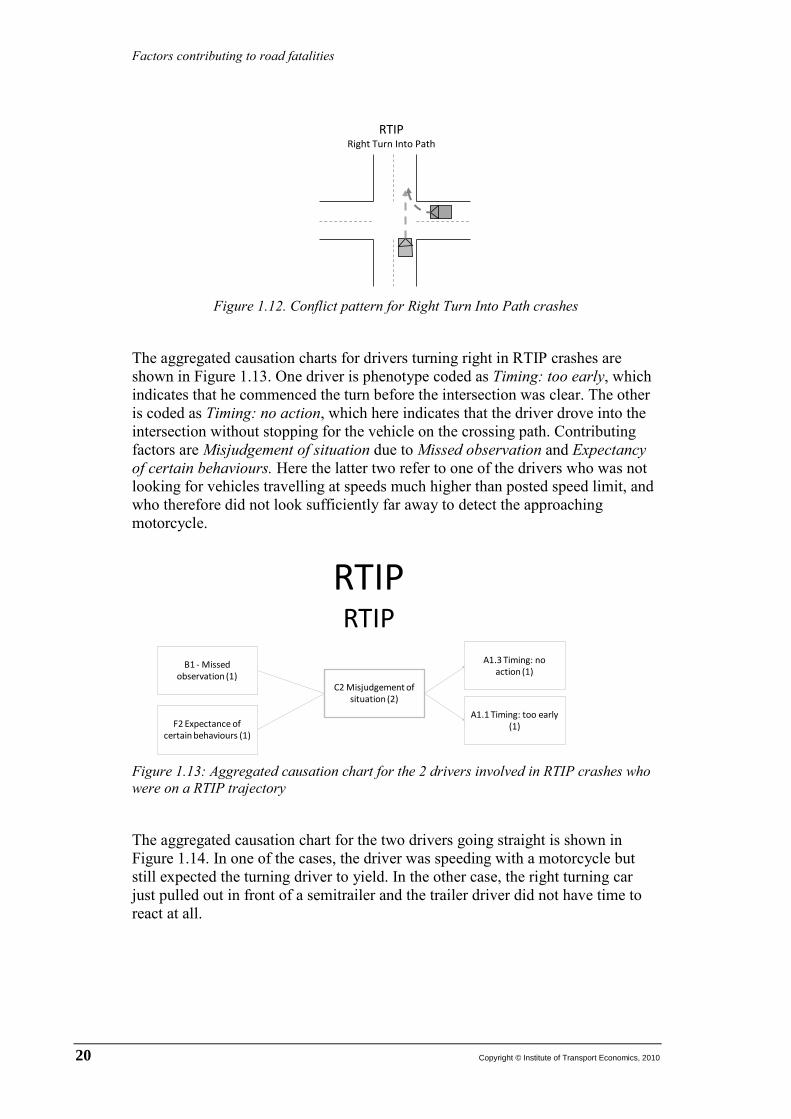
4.5 RTIP crashes There were two RTIP crashes in the material, the conflict pattern of which is shown in Figure 1.12.
SCPStraight Crossing Paths
SCPONE ACCIDENT - BOTH DRIVERS
A1.3 Timing: no action (2)
C2 Misjudgement of situation (2)
B1 - Missed observation (1)
B2 Late observation (1)
F2 Expectance of certain behaviours (1)
D1 Priority error (1)E2 Inattention (1)
E5 Excitement seeking (1)
K2 Permanent obstruction of view
(2)
M1 Inadequate transmission from
other road users (2)
E2.2 Driving-related distracters outside
vehicle (1)
Factors contributing to road fatalities
20 Copyright © Institute of Transport Economics, 2010
Figure 1.12. Conflict pattern for Right Turn Into Path crashes
The aggregated causation charts for drivers turning right in RTIP crashes are shown in Figure 1.13. One driver is phenotype coded as Timing: too early, which indicates that he commenced the turn before the intersection was clear. The other is coded as Timing: no action, which here indicates that the driver drove into the intersection without stopping for the vehicle on the crossing path. Contributing factors are Misjudgement of situation due to Missed observation and Expectancy of certain behaviours. Here the latter two refer to one of the drivers who was not looking for vehicles travelling at speeds much higher than posted speed limit, and who therefore did not look sufficiently far away to detect the approaching motorcycle.
Figure 1.13: Aggregated causation chart for the 2 drivers involved in RTIP crashes who were on a RTIP trajectory
The aggregated causation chart for the two drivers going straight is shown in Figure 1.14. In one of the cases, the driver was speeding with a motorcycle but still expected the turning driver to yield. In the other case, the right turning car just pulled out in front of a semitrailer and the trailer driver did not have time to react at all.
RTIP
Right Turn Into Path
A1.3 Timing: no action (1)
A1.1 Timing: too early (1)
C2 Misjudgement of situation (2)
B1 - Missed observation (1)
F2 Expectance of certain behaviours (1)
RTIPRTIP
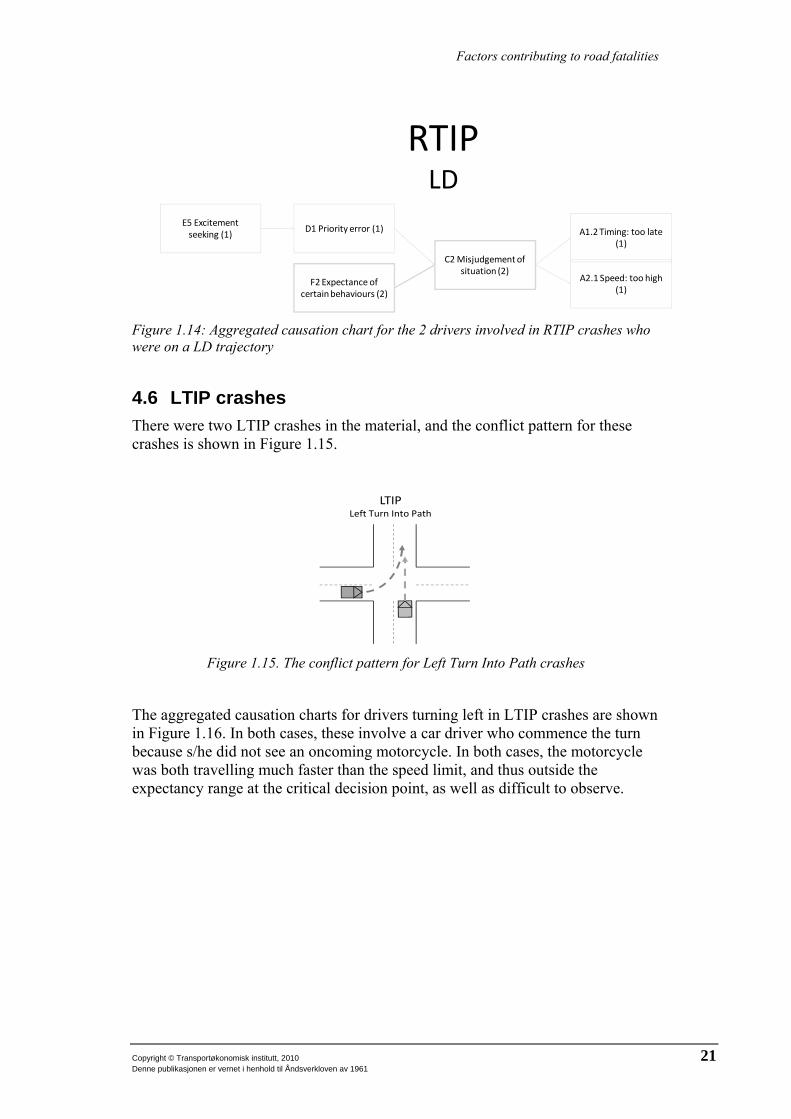
Factors contributing to road fatalities
Copyright © Transportøkonomisk institutt, 2010 21 Denne publikasjonen er vernet i henhold til Åndsverkloven av 1961
Figure 1.14: Aggregated causation chart for the 2 drivers involved in RTIP crashes who were on a LD trajectory
4.6 LTIP crashes There were two LTIP crashes in the material, and the conflict pattern for these crashes is shown in Figure 1.15.
Figure 1.15. The conflict pattern for Left Turn Into Path crashes
The aggregated causation charts for drivers turning left in LTIP crashes are shown in Figure 1.16. In both cases, these involve a car driver who commence the turn because s/he did not see an oncoming motorcycle. In both cases, the motorcycle was both travelling much faster than the speed limit, and thus outside the expectancy range at the critical decision point, as well as difficult to observe.
A1.2 Timing: too late (1)
A2.1 Speed: too high (1)
C2 Misjudgement of situation (2)
D1 Priority error (1)
F2 Expectance of certain behaviours (2)
E5 Excitement seeking (1)
RTIPLD
LTIPLeft Turn Into Path
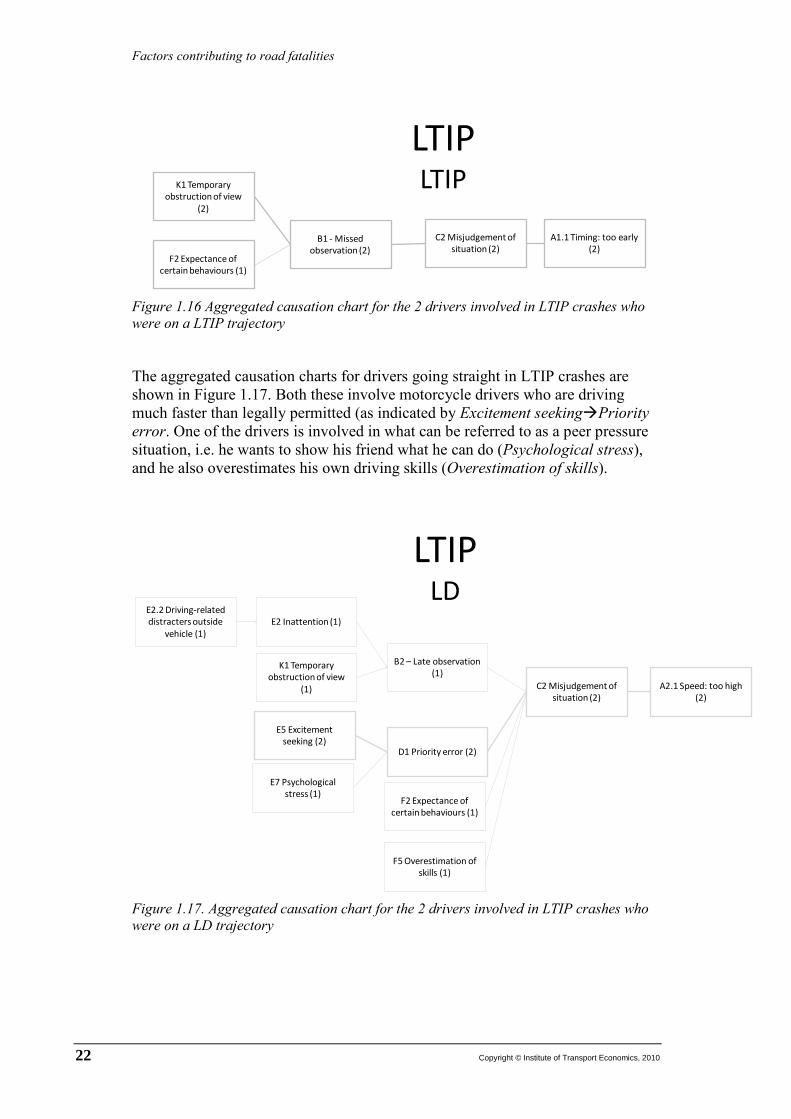
Factors contributing to road fatalities
22 Copyright © Institute of Transport Economics, 2010
Figure 1.16 Aggregated causation chart for the 2 drivers involved in LTIP crashes who were on a LTIP trajectory
The aggregated causation charts for drivers going straight in LTIP crashes are shown in Figure 1.17. Both these involve motorcycle drivers who are driving much faster than legally permitted (as indicated by Excitement seekingPriority error. One of the drivers is involved in what can be referred to as a peer pressure situation, i.e. he wants to show his friend what he can do (Psychological stress), and he also overestimates his own driving skills (Overestimation of skills).
Figure 1.17. Aggregated causation chart for the 2 drivers involved in LTIP crashes who were on a LD trajectory
A1.1 Timing: too early (2)
C2 Misjudgement of situation (2)
B1 - Missed observation (2)
F2 Expectance of certain behaviours (1)
K1 Temporary obstruction of view
(2)
LTIPLTIP
LTIPLD
A2.1 Speed: too high (2)
C2 Misjudgement of situation (2)
B2 – Late observation (1)
D1 Priority error (2)
F2 Expectance of certain behaviours (1)
F5 Overestimation of skills (1)
E2 Inattention (1)
E5 Excitement seeking (2)
E2.2 Driving-related distracters outside
vehicle (1)
E7 Psychological stress (1)
K1 Temporary obstruction of view
(1)
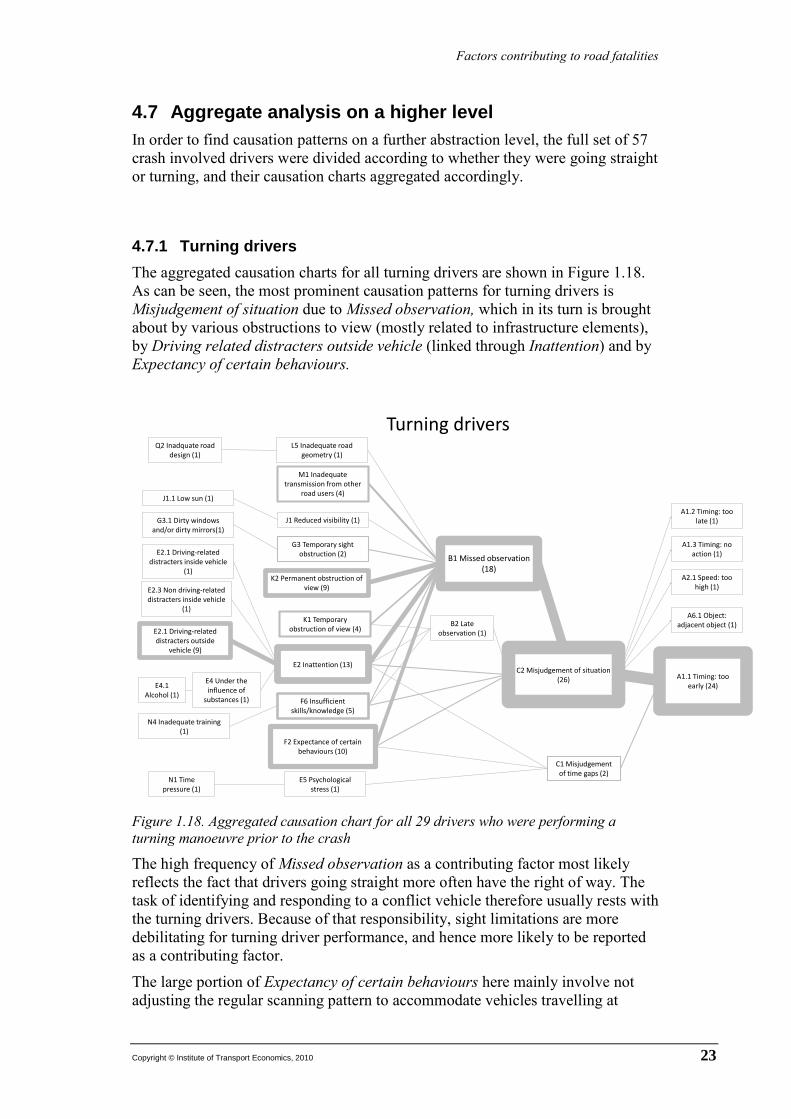
Factors contributing to road fatalities
Copyright © Institute of Transport Economics, 2010 23
4.7 Aggregate analysis on a higher level In order to find causation patterns on a further abstraction level, the full set of 57 crash involved drivers were divided according to whether they were going straight or turning, and their causation charts aggregated accordingly.
4.7.1 Turning drivers The aggregated causation charts for all turning drivers are shown in Figure 1.18. As can be seen, the most prominent causation patterns for turning drivers is Misjudgement of situation due to Missed observation, which in its turn is brought about by various obstructions to view (mostly related to infrastructure elements), by Driving related distracters outside vehicle (linked through Inattention) and by Expectancy of certain behaviours.
Figure 1.18. Aggregated causation chart for all 29 drivers who were performing a turning manoeuvre prior to the crash
The high frequency of Missed observation as a contributing factor most likely reflects the fact that drivers going straight more often have the right of way. The task of identifying and responding to a conflict vehicle therefore usually rests with the turning drivers. Because of that responsibility, sight limitations are more debilitating for turning driver performance, and hence more likely to be reported as a contributing factor.
The large portion of Expectancy of certain behaviours here mainly involve not adjusting the regular scanning pattern to accommodate vehicles travelling at
A1.1 Timing: too early (24)
A1.2 Timing: too late (1)
A1.3 Timing: no action (1)
A2.1 Speed: too high (1)
C1 Misjudgement of time gaps (2)
C2 Misjudgement of situation (26)
B1 Missed observation (18)
B2 Late observation (1)
E4 Under the influence of
substances (1)
F2 Expectance of certain behaviours (10)
F6 Insufficient skills/knowledge (5)
E2 Inattention (13)
E4.1 Alcohol (1)
E5 Psychological stress (1)
J1 Reduced visibility (1)
K1 Temporary obstruction of view (4)
K2 Permanent obstruction of view (9)
M1 Inadequate transmission from other
road users (4)
N4 Inadequate training (1)
E2.1 Driving-related distracters outside
vehicle (9)
J1.1 Low sun (1)
N1 Time pressure (1)
A6.1 Object: adjacent object (1)
G3 Temporary sight obstruction (2)E2.1 Driving-related
distracters inside vehicle(1)
E2.3 Non driving-related distracters inside vehicle
(1)
G3.1 Dirty windows and/or dirty mirrors(1)
Q2 Inadquate road design (1)
L5 Inadequate road geometry (1)
Turning drivers
Factors contributing to road fatalities
24 Copyright © Institute of Transport Economics, 2010
speeds well above the speed limit. The fact that these vehicles invariably are motorcycles can be taken to indicate that either car drivers do not speed in the same way as motorcyclists do. However, a more plausible explanation has to do with human visual attention selection processes.
As discussed at length in recent research on attention, there are two main ways in which driver attention can be captured. One is the way in which a stimulus, such as another vehicle, can be said to stand out in relation to its surroundings, i.e. its saliency. When attention is directed towards an object because it somehow stands out, this is referred to as bottom-up driven attention selection. For example, the colour red if often used on warning signs and lights, because it normally stands out in relation to the surroundings. The other way a stimuli can capture attention is through top-down selection, meaning that a driver is proactively selecting, or being partial to, certain stimuli, not because they stand out from a sensual point of view (though they may of course do so), but because they provide important cues for how the traffic situation will develop2
When a turning driver expects other vehicles to keep to the speed limit, while the other vehicle in fact is speeding, this in practice can be said to disable the top-down selection process. The threat object horizon which the driver thinks is relevant and therefore actively scans is in effect too small. This means that the only way for the conflict vehicle to capture the turning drivers attention is through bottom-up attention selection, i.e. by standing out in relation to its surroundings. Since a motorcycle is much less salient than a car (much smaller, less lighting) it will not stand out in relation to its surroundings the same way a car does. In the cases analysed here, it seems like the motorcycles simply do not not make it above the saliency threshold for bottom-up driven detection before it is too late. Several drivers describe their experience of the speeding motorcycles as “suddenly it was just there”, which cannot be true from a physics point of view, but which matches quite well with this theory of attention selection.
. For example, if a driver is about to turn left in an intersection, the turn indicator of a vehicle coming from the opposite direction may be less salient than its headlights. The turning driver will nonetheless focus on that turn indicator, to find out whether the other vehicle is turning or going straight (in which case the driver must yield right of way).
In this overview it is noticeable that the contributing factor Under the influence of substances is almost entirely absent. Only in one instance has Alcohol contributed to the development of events. In terms of other “high profile” contributing factors for fatal accidents, speeding only occurs once (Speed: too high), driver fatigue is entirely absent, and Inadequate training occurs once. This can mean two things. Either the accident investigations have failed to identify instances where these factors have contributed, despite their assumed association with fatal crashes, or turning drivers are not drivers for whom these factors contribute. This will be further discussed below.
Other noticeable “missing” factors are Time pressure and Psychological stress, and indications of secondary task engagement, e.g. Non-driving related
2 Note that this does not necessarily involve effort or conscious awareness. Routine driving, such as lead vehicle following, is often handled effortlessly, even if it involves some proactive and context-dependent attention selection, due to “implicit” expectations on how the situation will develop.
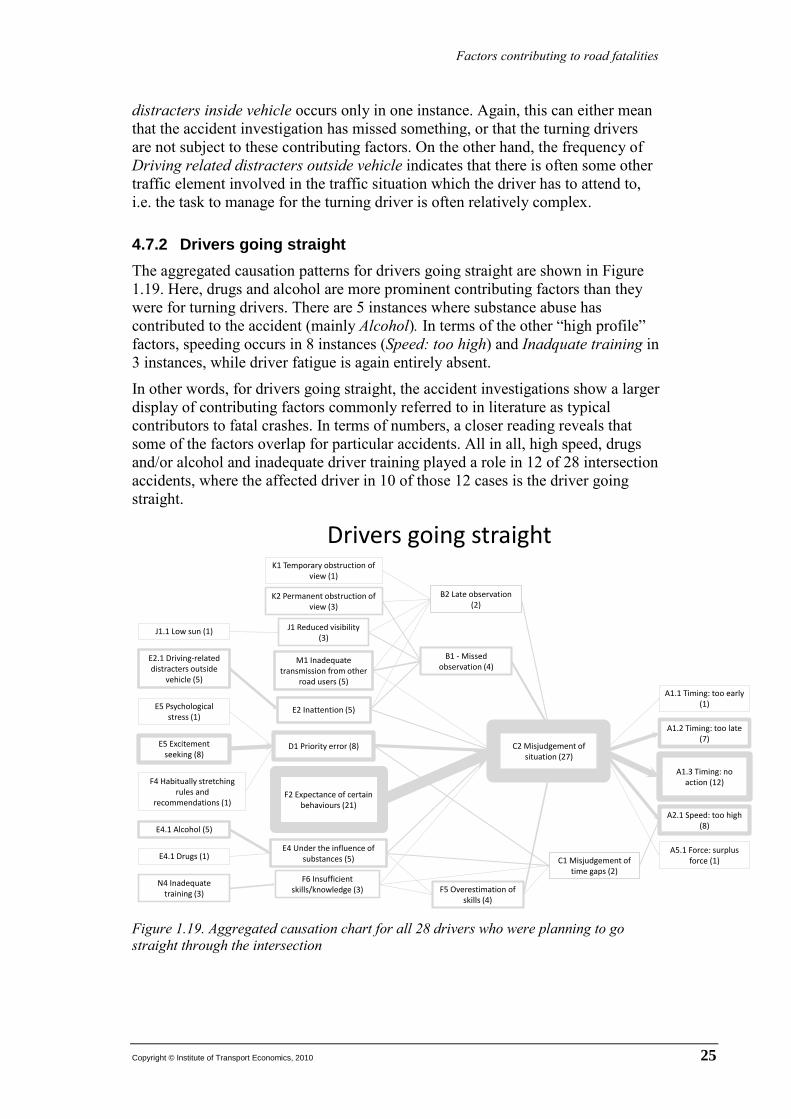
Factors contributing to road fatalities
Copyright © Institute of Transport Economics, 2010 25
distracters inside vehicle occurs only in one instance. Again, this can either mean that the accident investigation has missed something, or that the turning drivers are not subject to these contributing factors. On the other hand, the frequency of Driving related distracters outside vehicle indicates that there is often some other traffic element involved in the traffic situation which the driver has to attend to, i.e. the task to manage for the turning driver is often relatively complex.
4.7.2 Drivers going straight The aggregated causation patterns for drivers going straight are shown in Figure 1.19. Here, drugs and alcohol are more prominent contributing factors than they were for turning drivers. There are 5 instances where substance abuse has contributed to the accident (mainly Alcohol). In terms of the other “high profile” factors, speeding occurs in 8 instances (Speed: too high) and Inadquate training in 3 instances, while driver fatigue is again entirely absent.
In other words, for drivers going straight, the accident investigations show a larger display of contributing factors commonly referred to in literature as typical contributors to fatal crashes. In terms of numbers, a closer reading reveals that some of the factors overlap for particular accidents. All in all, high speed, drugs and/or alcohol and inadequate driver training played a role in 12 of 28 intersection accidents, where the affected driver in 10 of those 12 cases is the driver going straight.
Figure 1.19. Aggregated causation chart for all 28 drivers who were planning to go straight through the intersection
A1.1 Timing: too early (1)
A1.2 Timing: too late (7)
A1.3 Timing: no action (12)
A2.1 Speed: too high (8)
A5.1 Force: surplus force (1)C1 Misjudgement of
time gaps (2)
C2 Misjudgement of situation (27)
B1 - Missed observation (4)
B2 Late observation (2)
D1 Priority error (8)
E4 Under the influence of substances (5)
F2 Expectance of certain behaviours (21)
F5 Overestimation of skills (4)
E2 Inattention (5)
E4.1 Alcohol (5)
E4.1 Drugs (1)
E5 Excitement seeking (8)
E5 Psychological stress (1)
F4 Habitually stretching rules and
recommendations (1)
F6 Insufficient skills/knowledge (3)
J1 Reduced visibility (3)
K1 Temporary obstruction of view (1)
K2 Permanent obstruction of view (3)
M1 Inadequate transmission from other
road users (5)
N4 Inadequate training (3)
E2.1 Driving-related distracters outside
vehicle (5)
J1.1 Low sun (1)
Drivers going straight
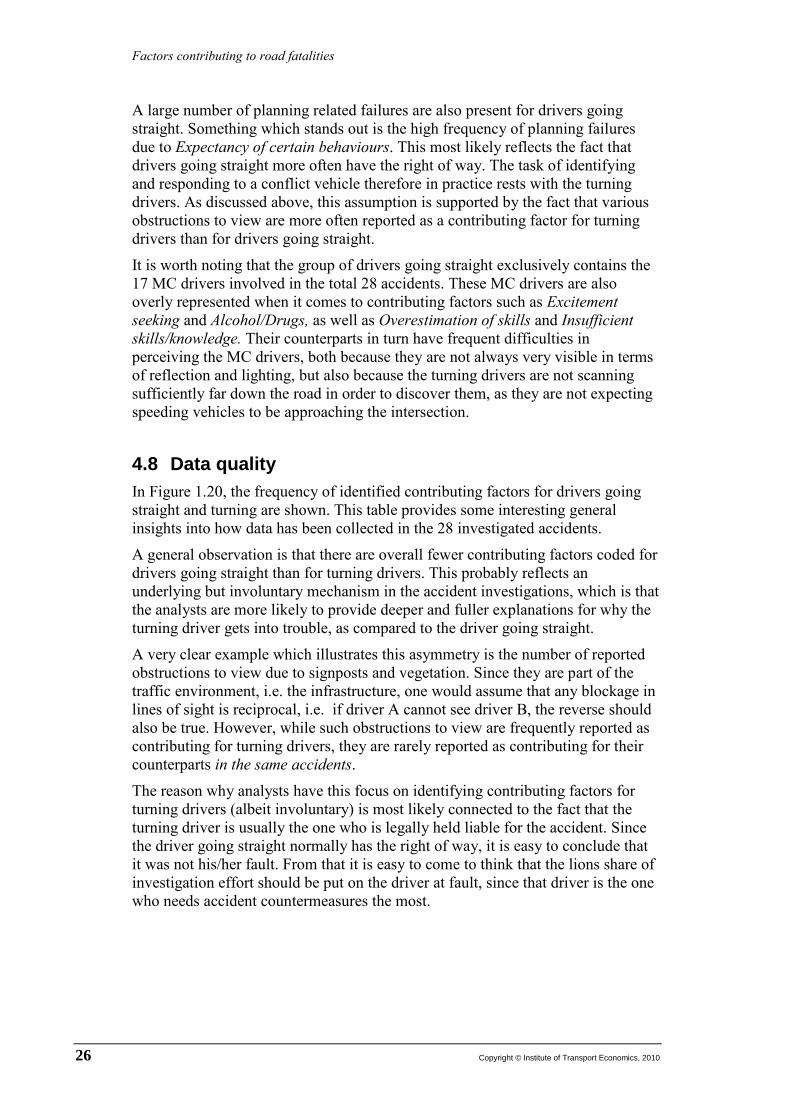
Factors contributing to road fatalities
26 Copyright © Institute of Transport Economics, 2010
A large number of planning related failures are also present for drivers going straight. Something which stands out is the high frequency of planning failures due to Expectancy of certain behaviours. This most likely reflects the fact that drivers going straight more often have the right of way. The task of identifying and responding to a conflict vehicle therefore in practice rests with the turning drivers. As discussed above, this assumption is supported by the fact that various obstructions to view are more often reported as a contributing factor for turning drivers than for drivers going straight.
It is worth noting that the group of drivers going straight exclusively contains the 17 MC drivers involved in the total 28 accidents. These MC drivers are also overly represented when it comes to contributing factors such as Excitement seeking and Alcohol/Drugs, as well as Overestimation of skills and Insufficient skills/knowledge. Their counterparts in turn have frequent difficulties in perceiving the MC drivers, both because they are not always very visible in terms of reflection and lighting, but also because the turning drivers are not scanning sufficiently far down the road in order to discover them, as they are not expecting speeding vehicles to be approaching the intersection.
4.8 Data quality In Figure 1.20, the frequency of identified contributing factors for drivers going straight and turning are shown. This table provides some interesting general insights into how data has been collected in the 28 investigated accidents.
A general observation is that there are overall fewer contributing factors coded for drivers going straight than for turning drivers. This probably reflects an underlying but involuntary mechanism in the accident investigations, which is that the analysts are more likely to provide deeper and fuller explanations for why the turning driver gets into trouble, as compared to the driver going straight.
A very clear example which illustrates this asymmetry is the number of reported obstructions to view due to signposts and vegetation. Since they are part of the traffic environment, i.e. the infrastructure, one would assume that any blockage in lines of sight is reciprocal, i.e. if driver A cannot see driver B, the reverse should also be true. However, while such obstructions to view are frequently reported as contributing for turning drivers, they are rarely reported as contributing for their counterparts in the same accidents.
The reason why analysts have this focus on identifying contributing factors for turning drivers (albeit involuntary) is most likely connected to the fact that the turning driver is usually the one who is legally held liable for the accident. Since the driver going straight normally has the right of way, it is easy to conclude that it was not his/her fault. From that it is easy to come to think that the lions share of investigation effort should be put on the driver at fault, since that driver is the one who needs accident countermeasures the most.
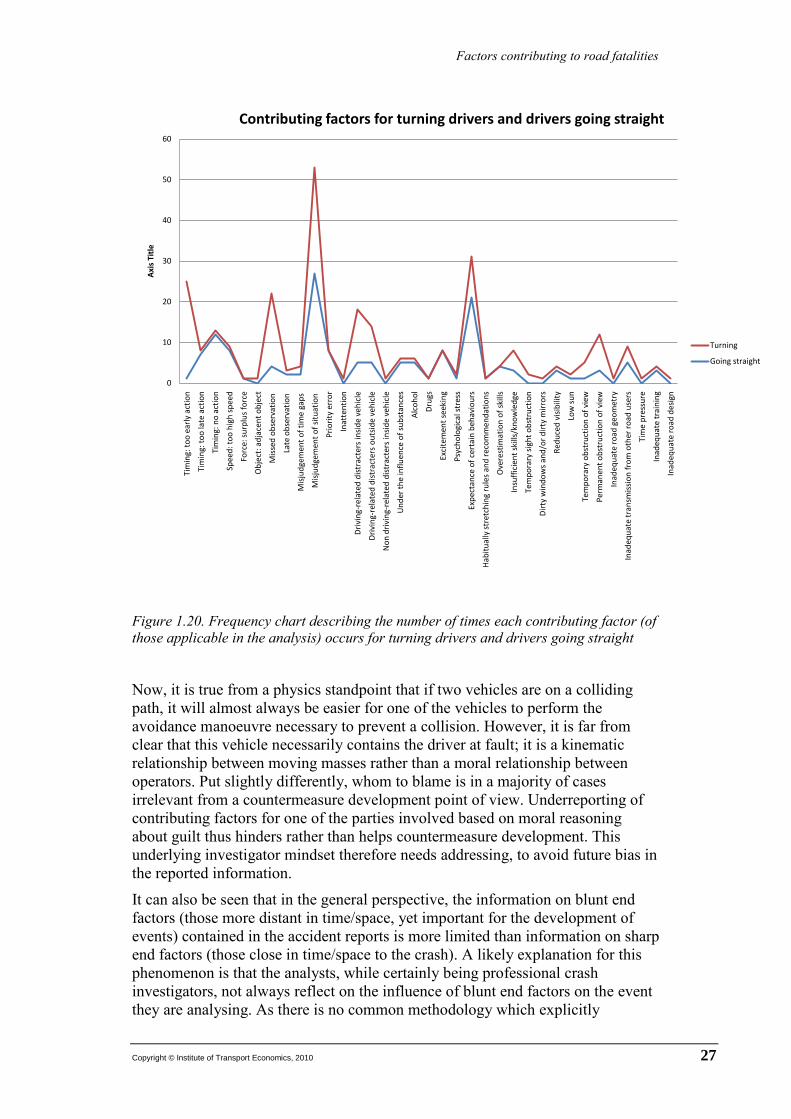
Factors contributing to road fatalities
Copyright © Institute of Transport Economics, 2010 27
Figure 1.20. Frequency chart describing the number of times each contributing factor (of those applicable in the analysis) occurs for turning drivers and drivers going straight
Now, it is true from a physics standpoint that if two vehicles are on a colliding path, it will almost always be easier for one of the vehicles to perform the avoidance manoeuvre necessary to prevent a collision. However, it is far from clear that this vehicle necessarily contains the driver at fault; it is a kinematic relationship between moving masses rather than a moral relationship between operators. Put slightly differently, whom to blame is in a majority of cases irrelevant from a countermeasure development point of view. Underreporting of contributing factors for one of the parties involved based on moral reasoning about guilt thus hinders rather than helps countermeasure development. This underlying investigator mindset therefore needs addressing, to avoid future bias in the reported information.
It can also be seen that in the general perspective, the information on blunt end factors (those more distant in time/space, yet important for the development of events) contained in the accident reports is more limited than information on sharp end factors (those close in time/space to the crash). A likely explanation for this phenomenon is that the analysts, while certainly being professional crash investigators, not always reflect on the influence of blunt end factors on the event they are analysing. As there is no common methodology which explicitly
0
10
20
30
40
50
60
Tim
ing:
too
early
act
ion
Tim
ing:
too
late
act
ion
Tim
ing:
no
actio
n
Spee
d: to
o hi
gh sp
eed
Forc
e: su
rplu
s for
ce
Obj
ect:
adja
cent
obj
ect
Miss
ed o
bser
vatio
n
Late
obs
erva
tion
Misj
udge
men
t of t
ime
gaps
Misj
udge
men
t of s
ituat
ion
Prio
rity
erro
r
Inat
tent
ion
Driv
ing-
rela
ted
dist
ract
ers
insid
e ve
hicl
e
Driv
ing-
rela
ted
dist
ract
ers
outs
ide
vehi
cle
Non
driv
ing-
rela
ted
dist
ract
ers
insid
e ve
hicl
e
Und
er th
e in
fluen
ce o
f sub
stan
ces
Alco
hol
Drug
s
Exci
tem
ent s
eeki
ng
Psyc
holo
gica
l str
ess
Expe
ctan
ce o
f cer
tain
beh
avio
urs
Habi
tual
ly st
retc
hing
rule
s and
reco
mm
enda
tions
Ove
rest
imat
ion
of sk
ills
Insu
ffici
ent s
kills
/kno
wle
dge
Tem
pora
ry si
ght o
bstr
uctio
n
Dirt
y w
indo
ws a
nd/o
r dirt
y m
irror
s
Redu
ced
visib
ility
Low
sun
Tem
pora
ry o
bstr
uctio
n of
vie
w
Perm
anen
t obs
truc
tion
of v
iew
Inad
equa
te ro
ad g
eom
etry
Inad
equa
te tr
ansm
issio
n fr
om o
ther
road
use
rs
Tim
e pr
essu
re
Inad
equa
te tr
aini
ng
Inad
equa
te ro
ad d
esig
n
Axis
Titl
e
Contributing factors for turning drivers and drivers going straight
Turning
Going straight
Factors contributing to road fatalities
28 Copyright © Institute of Transport Economics, 2010
describes the relevant scope of possible contributing factors, the analyst may view blunt end factors as part of the circumstances under which the event took place rather than contributing factors in themselves, and there is nothing and no one about there to correct it. This points to the importance of having an explicit, and in the analyst group anchored, analysis method which clearly defines the scope of possible contributing factors and influences to be controlled for in accident investigation. This in particular holds if the investigations are to yield results on blunt end factors.
On a more detailed level, there seem to be certain discrepancies between teams and investigators in terms of how data collection is managed and analysed. This observation has to be qualified somewhat, because during this project we have not had access to the complete background material from all accidents. For most accidents only the final report (usually a 5-10 page pdf document) has been available too us, whereas for other accidents we have also consulted the various protocols filled out by the investigators, such as Åstedsrapport, Kjøretøyskjema, etc. The extra information available through the protocols outside the main report sometimes (but not always) did hold valuable extra information for the analysis performed here. Valuable should here be taken not to mean that it brings new information to light which is unavailable in the main report. In that sense, the final reports overall are good at compiling the relevant information from the other documents. However, the main reports are written to describe inclusions rather than exclusions, i.e. reasons for why certain factors are thought to contribute are included, but reasons for excluding other possible factors are left out. In this regard, the extra information in the other protocols could sometimes be used to discard certain possible contributing factors, the established absence of which certainly make a difference in terms of how the accident causation process is viewed.
In the discussion above on noticeable “missing” factors such as driver fatigue and secondary task engagement, two possible explanations were offered. One was that the accident investigations have failed to identify instances where these factors have contributed despite their assumed association with traffic accidents, and the other was that these factors simply do not contribute. This dispute is not easy to settle, because it requires in-depth knowledge of the investigation procedure, which questions the analysts ask, and how systematic they are in trying both to prove the presence of possible contributing factors as well as to disprove the presence of other factors.
The DREAM methodology used here contains a number of genotypes which were not applicable to any of the 28 analysed accidents. Since DREAM has been put through extensive validation work and corroboration with other researchers’ findings on possible accident causes, there is reason to further investigate why many of the genotypes available in DREAM never get applied in the analysis. While the hoped for result of such a project would be that the accident analysis as currently being conducted is indeed sufficiently extensive, a more likely result is that there probably is room for improvement.
Finally, there is an unnecessary element of conjecture present in some of the accident reports. This seems to mainly be a confounding effect of either the

Factors contributing to road fatalities
Copyright © Institute of Transport Economics, 2010 29
STEP3
For example, in one accident the analyst says that the intersection may be difficult to negotiate for those unfamiliar with it. However, nowhere in the report is it stated whether the involved drivers had passed this intersection before. In other words, these conjectures are not corroborated by data in the report, they are just there as some sort of general possibilities. On a side note, for some accidents the extra accident information available could actually be used to discard some of these conjectures, which may otherwise have been necessary to include as contributing factors.
diagram nomenclature or the headlines used in the report templates. When the instructions say that the analyst should list possible contributing factors, some analysts have taken this as license to speculate. Rather than including only factors for which there is at least some empirical evidence (but all possible of those, naturally), the analysts at times make quite general speculations, regarding the capabilities of older drivers and other matters.
3 STEP (”Sequentially Timed Events Plotting”; Hendrick and Benner, 1987) is a method used by most UAGs in order to generate a timeline showing crash-relevant actions and events occurring prior to, during, and immediately following the crash.
Factors contributing to road fatalities
30 Copyright © Institute of Transport Economics, 2010
5 Intersection crashes - conclusions
Overall, results indicate that turning drivers to a large extent are faced with perception difficulties and unexpected behaviours in relation to the conflict vehicle, while at the same time trying to negotiate a demanding traffic situation. Drivers going straight on the other hand have less perception difficulties. Instead, their main problem is that they largely expect turning drivers to yield. When this assumption is violated, they are either slow to react or do not react at all.
Contributing factors often pointed to in literature, e.g. high speed, drugs and/or alcohol and inadequate driver training, played a role in 12 of 28 accidents; in 10 crashes these factors were found for the driver going straight. Five drivers were influenced by alcohol or drugs, four out of whom were going straight.
While this confirms the prevalence of these risk factors, it also indicates that most drivers end up in these situations due to combinations of less auspicious contributing factors.
The accidents have a certain stochastic element to them. While it certainly is true that any one of them could have been avoided, had at least one of the drivers been even more cautious, it is also clear that asking or demanding that level of caution in ordinary driving would severely hamper mobility. It is also quite contrary to driver expectations and previous experience, and basically amounts to staying continuously prepared for something extremely unlikely. Given swedish STRADA numbers on crash involved motor vehicle drivers (middle weight, i.e. excluding trucks and MC’s, resulting in light, severe and fatal injuries) and the number of kilometres travelled per annum, a rough calculation gives that one has to drive for 300 hours a year (15 000 km/yr) in 211 years to end up with 1:1 accident odds ratio. For fatal accidents only, those 211 years become roughly 10 000 years.
In terms of countermeasures, this means that there is no simple remedy available, in case someone thought so. Rather, a host of measures have to be applied. A natural focus point to start with would be the MC drivers going straight, as they form a large part of the problem. Measures to increase MC driver visibility (reflex vests, automatic and more intense lighting, etc) may make a difference. For MC drivers who are less inclined to use such vests, the type of gap availability estimators on trial in certain US intersections (and elsewhere) are a promising option.
Factors contributing to road fatalities
Copyright © Institute of Transport Economics, 2010 31
PART 2:
In-depth analyses of 15 fatal collisions between bicycle and motorized vehicle
Factors contributing to road fatalities
32 Copyright © Institute of Transport Economics, 2010
6 Background and method
6.1 The primary data Only final reports were used for our analysis. Out of a total of 26 fatal bicycle accidents, those 15 involving collision with a motorised vehicle were selected for analysis. The DREAM analysis was carried out only for the driver of the motorized vehicle.
6.2 Modification of DREAM: Estimating level of certainty when determining the genotypes
The 15 collisions were analysed using DREAM 3.0. An important modification of the method was made for these analyses to denote the varying levels of certainty associated with contributing factors. This implies that the analysis approach for the bicycle collisions differed slightly from the one that was used for the intersection crashes presented in Part 1.
DREAM forces the analyst to think through several stages of the accident and choose the most appropriate genotypes. The extent to which the analyst can be certain about this choice will depend on the information available. In some cases there will be gaps in the information about the pre-crash stage of an accident. This is more likely when one or more of the involved persons has been killed. In such cases the analyst has to employ deduction to a greater degree, and will be less certain about the choice of genotype.
To document the amount of certainty associated with each genotype, we decided to classify them in three categories, according to the level of direct evidence available from the available information. These categories are defined as follows:
Low certainty - conflicting records, no direct information or weak inference Medium certainty - reasonable inference / inference from an objective source High certainty - direct information/inference from an objective source.
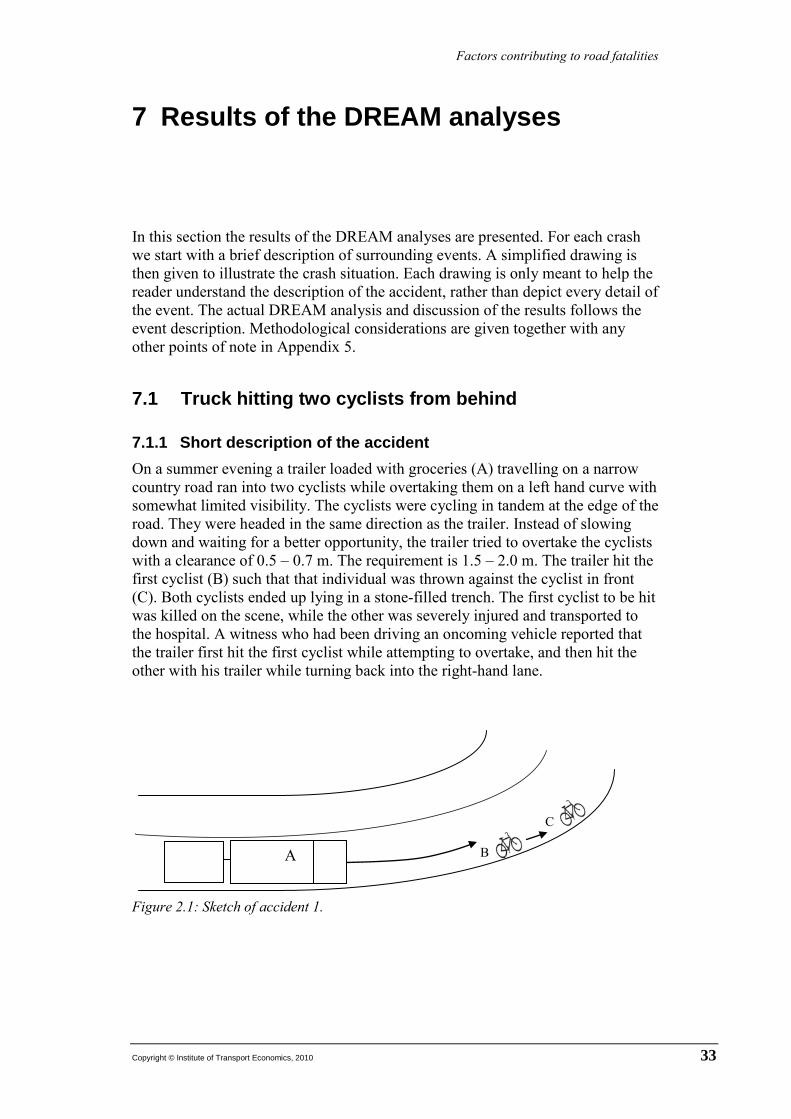
Factors contributing to road fatalities
Copyright © Institute of Transport Economics, 2010 33
B
C
7 Results of the DREAM analyses
In this section the results of the DREAM analyses are presented. For each crash we start with a brief description of surrounding events. A simplified drawing is then given to illustrate the crash situation. Each drawing is only meant to help the reader understand the description of the accident, rather than depict every detail of the event. The actual DREAM analysis and discussion of the results follows the event description. Methodological considerations are given together with any other points of note in Appendix 5.
7.1 Truck hitting two cyclists from behind
7.1.1 Short description of the accident On a summer evening a trailer loaded with groceries (A) travelling on a narrow country road ran into two cyclists while overtaking them on a left hand curve with somewhat limited visibility. The cyclists were cycling in tandem at the edge of the road. They were headed in the same direction as the trailer. Instead of slowing down and waiting for a better opportunity, the trailer tried to overtake the cyclists with a clearance of 0.5 – 0.7 m. The requirement is 1.5 – 2.0 m. The trailer hit the first cyclist (B) such that that individual was thrown against the cyclist in front (C). Both cyclists ended up lying in a stone-filled trench. The first cyclist to be hit was killed on the scene, while the other was severely injured and transported to the hospital. A witness who had been driving an oncoming vehicle reported that the trailer first hit the first cyclist while attempting to overtake, and then hit the other with his trailer while turning back into the right-hand lane.
Figure 2.1: Sketch of accident 1.
A

Factors contributing to road fatalities
34 Copyright © Institute of Transport Economics, 2010
7.1.2 Results of DREAM analysis This accident is considered to be a “catching up accident” where the driver kept “too short distance” to the vehicle in front. The first genotype is “Misjudgement of situation”. The driver had clearly deemed it safe to overtake, while the records reveal that the view to the road ahead would have been somewhat limited and that the road was too narrow for such a manoeuvre. The genotype “Priority error” is chosen because the driver chose to overtake the cyclist instead of slowing down to 30 km/h and wait for a better opportunity. The genotype “Inadequate road geometry” was chosen because the road is clearly not suited to the heavy traffic that routinely uses it, with trailers barely fitting inside the lanes. The genotype “Expectancy of certain behaviour” is chosen because the driver most likely expected that the cyclists would keep to their side of the road, even though he tried to overtake them with a marginal distance. He may have done so under pressure from the road geometry.
Figure 2.2. DREAM analysis of accident 1.
A3.1: Distance – too short distance. Passed too close to the cyclist
C2: Misjudgement of situation. The driver deemed it safe to overtake on the curve of a narrow road. (High)
D1: Priority error. The driver prioritized saving time and money above safe overtaking (Medium)
L5: Inadequate road geometry. The road is narrow. A trailer barely fits into the lane. (High)
F2:Expectancy of certain behaviour. The driver assumed that the cyclist would hold their position on the lane. (Medium)
Q2:Inadequate road design. The planning and the construction of the road is inadequate. Too narrow and low visibility for the heavy traffic. (High)
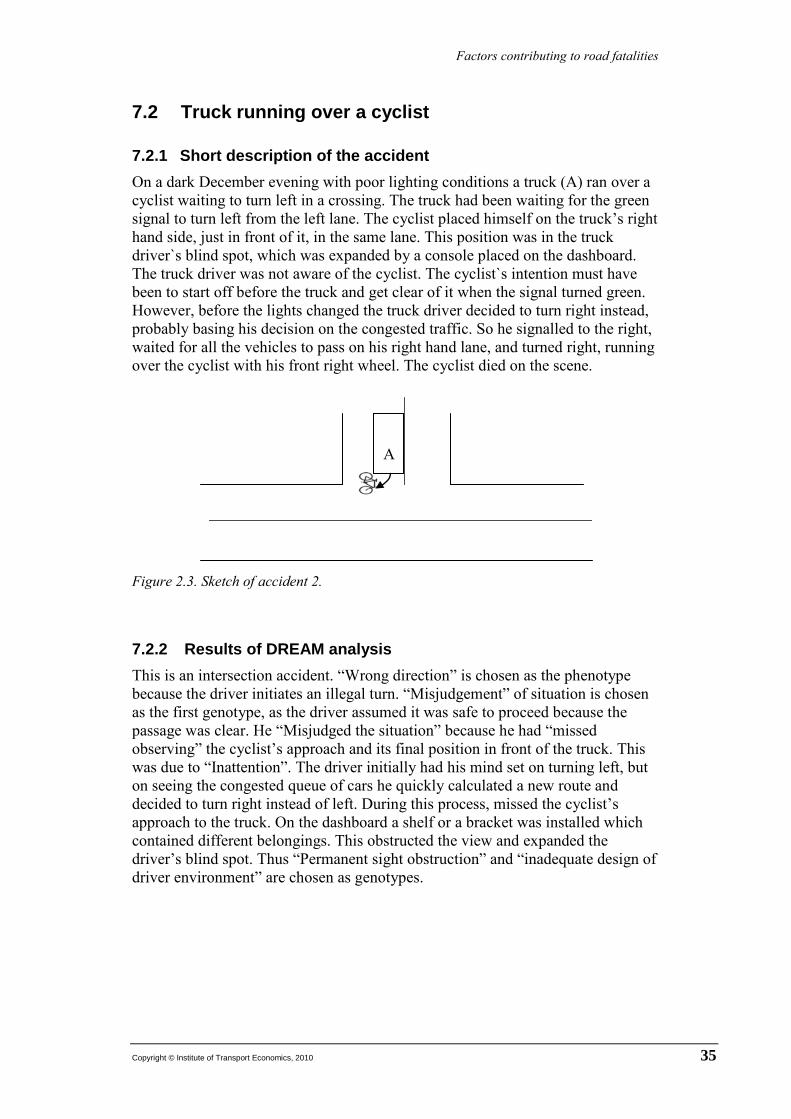
Factors contributing to road fatalities
Copyright © Institute of Transport Economics, 2010 35
7.2 Truck running over a cyclist
7.2.1 Short description of the accident On a dark December evening with poor lighting conditions a truck (A) ran over a cyclist waiting to turn left in a crossing. The truck had been waiting for the green signal to turn left from the left lane. The cyclist placed himself on the truck’s right hand side, just in front of it, in the same lane. This position was in the truck driver`s blind spot, which was expanded by a console placed on the dashboard. The truck driver was not aware of the cyclist. The cyclist`s intention must have been to start off before the truck and get clear of it when the signal turned green. However, before the lights changed the truck driver decided to turn right instead, probably basing his decision on the congested traffic. So he signalled to the right, waited for all the vehicles to pass on his right hand lane, and turned right, running over the cyclist with his front right wheel. The cyclist died on the scene.
Figure 2.3. Sketch of accident 2.
7.2.2 Results of DREAM analysis This is an intersection accident. “Wrong direction” is chosen as the phenotype because the driver initiates an illegal turn. “Misjudgement” of situation is chosen as the first genotype, as the driver assumed it was safe to proceed because the passage was clear. He “Misjudged the situation” because he had “missed observing” the cyclist’s approach and its final position in front of the truck. This was due to “Inattention”. The driver initially had his mind set on turning left, but on seeing the congested queue of cars he quickly calculated a new route and decided to turn right instead of left. During this process, missed the cyclist’s approach to the truck. On the dashboard a shelf or a bracket was installed which contained different belongings. This obstructed the view and expanded the driver’s blind spot. Thus “Permanent sight obstruction” and “inadequate design of driver environment” are chosen as genotypes.
A
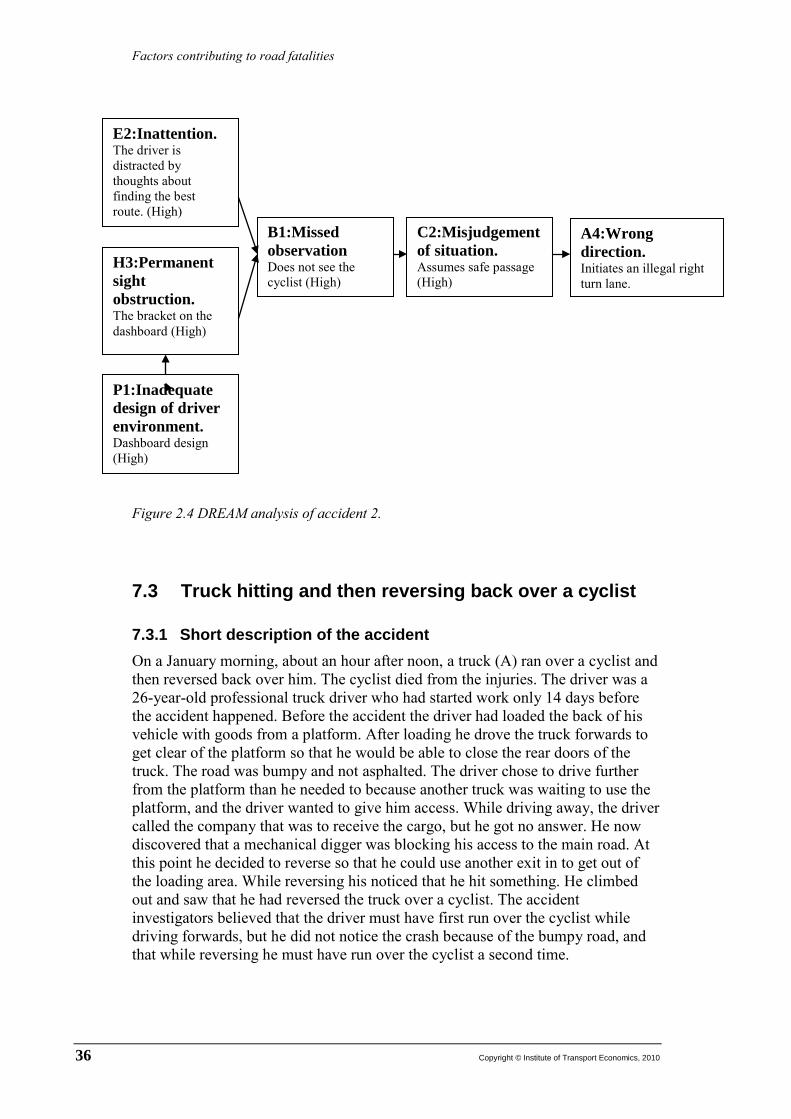
Factors contributing to road fatalities
36 Copyright © Institute of Transport Economics, 2010
Figure 2.4 DREAM analysis of accident 2.
7.3 Truck hitting and then reversing back over a cyclist
7.3.1 Short description of the accident On a January morning, about an hour after noon, a truck (A) ran over a cyclist and then reversed back over him. The cyclist died from the injuries. The driver was a 26-year-old professional truck driver who had started work only 14 days before the accident happened. Before the accident the driver had loaded the back of his vehicle with goods from a platform. After loading he drove the truck forwards to get clear of the platform so that he would be able to close the rear doors of the truck. The road was bumpy and not asphalted. The driver chose to drive further from the platform than he needed to because another truck was waiting to use the platform, and the driver wanted to give him access. While driving away, the driver called the company that was to receive the cargo, but he got no answer. He now discovered that a mechanical digger was blocking his access to the main road. At this point he decided to reverse so that he could use another exit in to get out of the loading area. While reversing his noticed that he hit something. He climbed out and saw that he had reversed the truck over a cyclist. The accident investigators believed that the driver must have first run over the cyclist while driving forwards, but he did not notice the crash because of the bumpy road, and that while reversing he must have run over the cyclist a second time.
A4:Wrong direction. Initiates an illegal right turn lane.
C2:Misjudgement of situation. Assumes safe passage (High)
B1:Missed observation Does not see the cyclist (High)
E2:Inattention. The driver is distracted by thoughts about finding the best route. (High)
H3:Permanent sight obstruction. The bracket on the dashboard (High)
P1:Inadequate design of driver environment. Dashboard design (High)
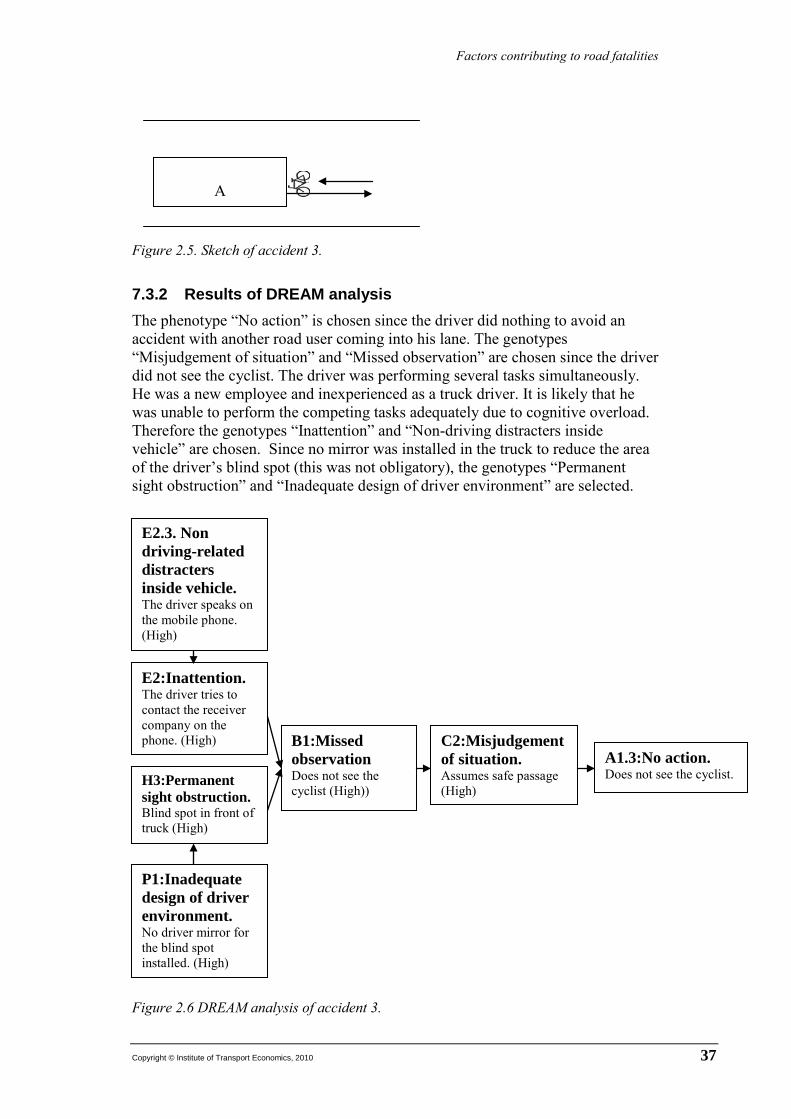
Factors contributing to road fatalities
Copyright © Institute of Transport Economics, 2010 37
Figure 2.5. Sketch of accident 3.
7.3.2 Results of DREAM analysis The phenotype “No action” is chosen since the driver did nothing to avoid an accident with another road user coming into his lane. The genotypes “Misjudgement of situation” and “Missed observation” are chosen since the driver did not see the cyclist. The driver was performing several tasks simultaneously. He was a new employee and inexperienced as a truck driver. It is likely that he was unable to perform the competing tasks adequately due to cognitive overload. Therefore the genotypes “Inattention” and “Non-driving distracters inside vehicle” are chosen. Since no mirror was installed in the truck to reduce the area of the driver’s blind spot (this was not obligatory), the genotypes “Permanent sight obstruction” and “Inadequate design of driver environment” are selected.
Figure 2.6 DREAM analysis of accident 3.
A1.3:No action. Does not see the cyclist.
C2:Misjudgement of situation. Assumes safe passage (High)
B1:Missed observation Does not see the cyclist (High))
H3:Permanent sight obstruction. Blind spot in front of truck (High)
E2:Inattention. The driver tries to contact the receiver company on the phone. (High)
P1:Inadequate design of driver environment. No driver mirror for the blind spot installed. (High)
A
E2.3. Non driving-related distracters inside vehicle. The driver speaks on the mobile phone. (High)
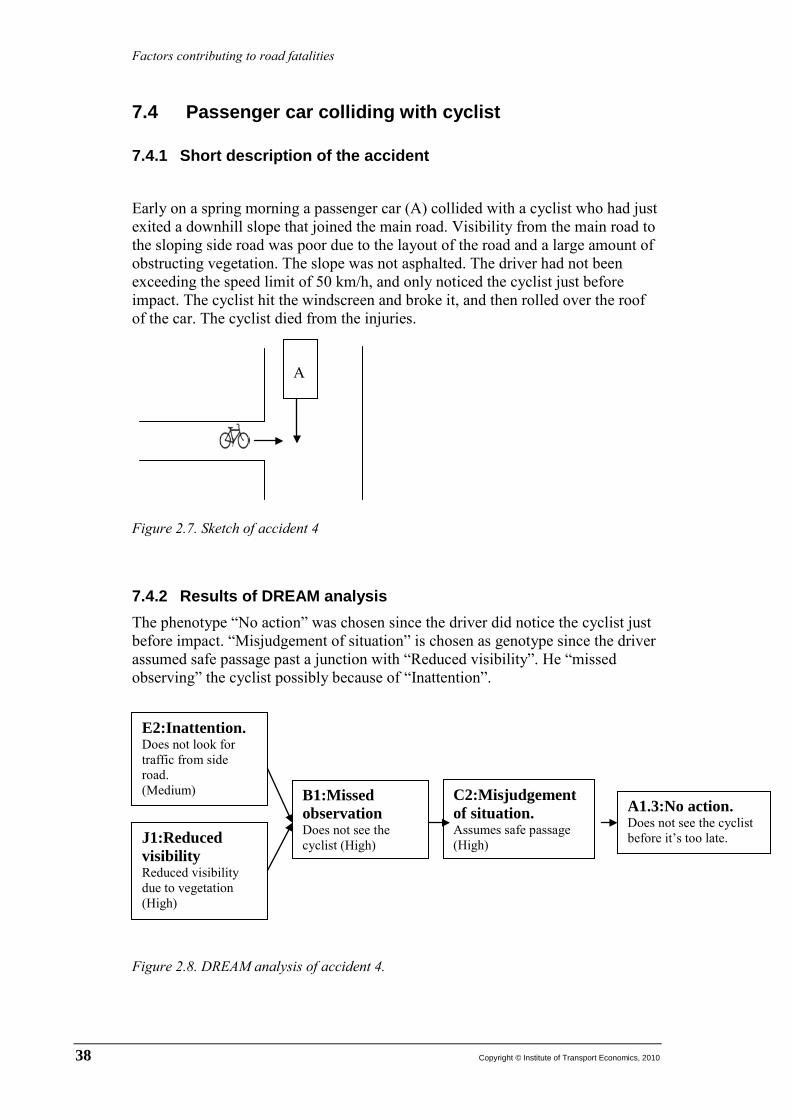
Factors contributing to road fatalities
38 Copyright © Institute of Transport Economics, 2010
7.4 Passenger car colliding with cyclist
7.4.1 Short description of the accident
Early on a spring morning a passenger car (A) collided with a cyclist who had just exited a downhill slope that joined the main road. Visibility from the main road to the sloping side road was poor due to the layout of the road and a large amount of obstructing vegetation. The slope was not asphalted. The driver had not been exceeding the speed limit of 50 km/h, and only noticed the cyclist just before impact. The cyclist hit the windscreen and broke it, and then rolled over the roof of the car. The cyclist died from the injuries.
Figure 2.7. Sketch of accident 4
7.4.2 Results of DREAM analysis The phenotype “No action” was chosen since the driver did notice the cyclist just before impact. “Misjudgement of situation” is chosen as genotype since the driver assumed safe passage past a junction with “Reduced visibility”. He “missed observing” the cyclist possibly because of “Inattention”.
Figure 2.8. DREAM analysis of accident 4.
A1.3:No action. Does not see the cyclist before it’s too late.
C2:Misjudgement of situation. Assumes safe passage (High)
B1:Missed observation Does not see the cyclist (High) J1:Reduced
visibility Reduced visibility due to vegetation (High)
E2:Inattention. Does not look for traffic from side road. (Medium)
A
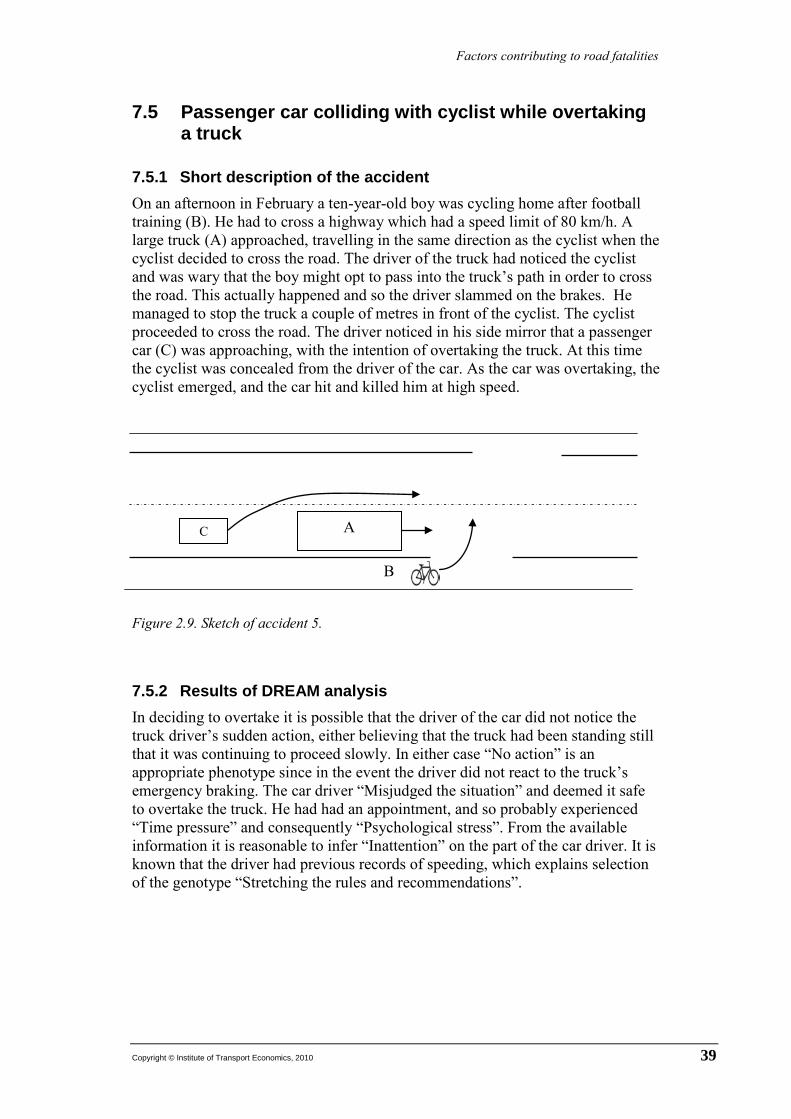
Factors contributing to road fatalities
Copyright © Institute of Transport Economics, 2010 39
7.5 Passenger car colliding with cyclist while overtaking a truck
7.5.1 Short description of the accident On an afternoon in February a ten-year-old boy was cycling home after football training (B). He had to cross a highway which had a speed limit of 80 km/h. A large truck (A) approached, travelling in the same direction as the cyclist when the cyclist decided to cross the road. The driver of the truck had noticed the cyclist and was wary that the boy might opt to pass into the truck’s path in order to cross the road. This actually happened and so the driver slammed on the brakes. He managed to stop the truck a couple of metres in front of the cyclist. The cyclist proceeded to cross the road. The driver noticed in his side mirror that a passenger car (C) was approaching, with the intention of overtaking the truck. At this time the cyclist was concealed from the driver of the car. As the car was overtaking, the cyclist emerged, and the car hit and killed him at high speed.
B
Figure 2.9. Sketch of accident 5.
7.5.2 Results of DREAM analysis In deciding to overtake it is possible that the driver of the car did not notice the truck driver’s sudden action, either believing that the truck had been standing still that it was continuing to proceed slowly. In either case “No action” is an appropriate phenotype since in the event the driver did not react to the truck’s emergency braking. The car driver “Misjudged the situation” and deemed it safe to overtake the truck. He had had an appointment, and so probably experienced “Time pressure” and consequently “Psychological stress”. From the available information it is reasonable to infer “Inattention” on the part of the car driver. It is known that the driver had previous records of speeding, which explains selection of the genotype “Stretching the rules and recommendations”.
A C
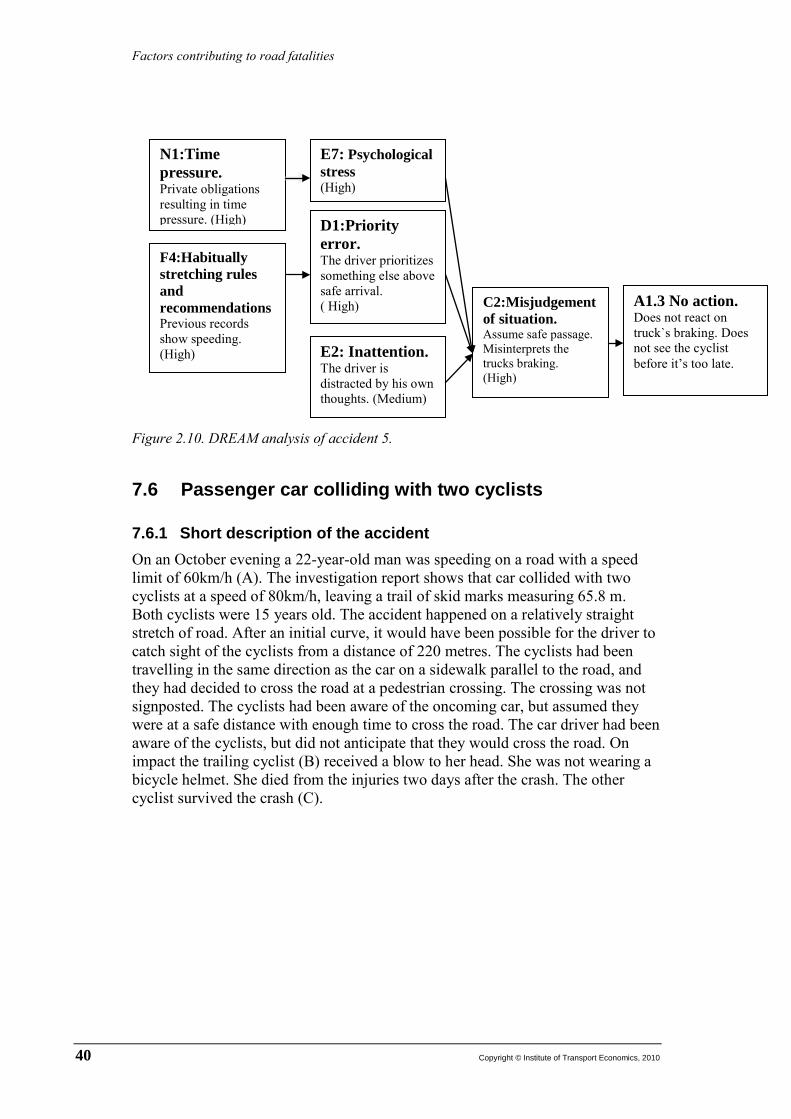
Factors contributing to road fatalities
40 Copyright © Institute of Transport Economics, 2010
Figure 2.10. DREAM analysis of accident 5.
7.6 Passenger car colliding with two cyclists
7.6.1 Short description of the accident On an October evening a 22-year-old man was speeding on a road with a speed limit of 60km/h (A). The investigation report shows that car collided with two cyclists at a speed of 80km/h, leaving a trail of skid marks measuring 65.8 m. Both cyclists were 15 years old. The accident happened on a relatively straight stretch of road. After an initial curve, it would have been possible for the driver to catch sight of the cyclists from a distance of 220 metres. The cyclists had been travelling in the same direction as the car on a sidewalk parallel to the road, and they had decided to cross the road at a pedestrian crossing. The crossing was not signposted. The cyclists had been aware of the oncoming car, but assumed they were at a safe distance with enough time to cross the road. The car driver had been aware of the cyclists, but did not anticipate that they would cross the road. On impact the trailing cyclist (B) received a blow to her head. She was not wearing a bicycle helmet. She died from the injuries two days after the crash. The other cyclist survived the crash (C).
A1.3 No action. Does not react on truck`s braking. Does not see the cyclist before it’s too late.
C2:Misjudgement of situation. Assume safe passage. Misinterprets the trucks braking. (High)
E7: Psychological stress (High)
N1:Time pressure. Private obligations resulting in time pressure. (High) D1:Priority
error. The driver prioritizes something else above safe arrival. ( High)
F4:Habitually stretching rules and recommendations Previous records show speeding. (High) E2: Inattention.
The driver is distracted by his own thoughts. (Medium)

Factors contributing to road fatalities
Copyright © Institute of Transport Economics, 2010 41
C
B c
Figure 2.11. Sketch of accident 6.
7.6.2 Results of DREAM analysis This is a crossing accident. “Too high speed” is selected as the phenotype. Alternatively “insufficient force” could have been chosen since the driver probably did not brake hard enough to stop in time. The driver “Misjudged the situation”, assuming that the cyclists would not cross the road (“Expectancy of certain behaviour”). He also had an appointment with some friends, which he “prioritized” over safety.
Figure 2.12. DREAM analysis of accident 6.
The appointment could also have led to “Time pressure” resulting in “Psychological stress”. Another reasonable inference from his surplus speed would be that the driver was “Excitement seeking” It is also noted that the traffic
A2.1:Too high speed. The driver approaches the intersection faster than expected.
C2:Misjudgement of situation. Assumes safe passage. (High)
F2:Expectancy of certain behaviour. Expecting the road users not to cross the road. (High)
D1:Priority error. The driver prioritizes something else above safe arrival.(High)
N1: Time pressure. Private obligations resulting in time pressure. (Medium)
E7:Psychological stress (Medium)
E5:Excitement seeking. Looking for “adrenaline kicks” (i.e.by driving too fast). (Medium)
A
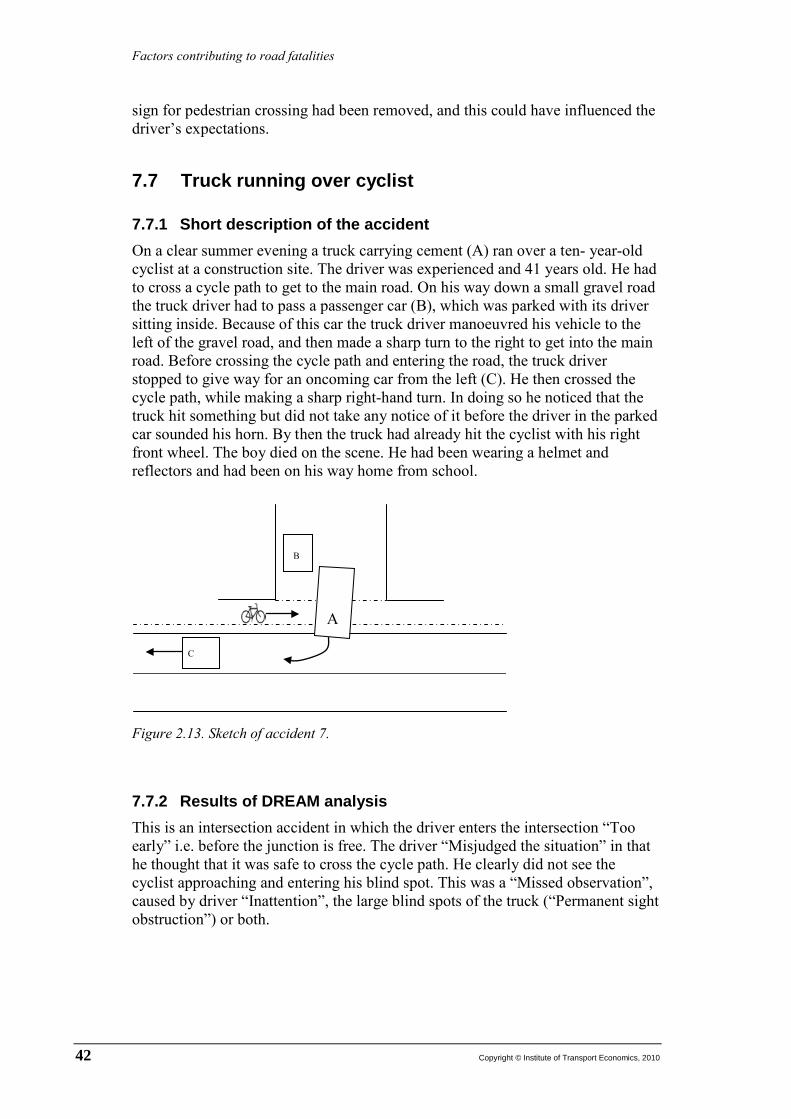
Factors contributing to road fatalities
42 Copyright © Institute of Transport Economics, 2010
sign for pedestrian crossing had been removed, and this could have influenced the driver’s expectations.
7.7 Truck running over cyclist
7.7.1 Short description of the accident On a clear summer evening a truck carrying cement (A) ran over a ten- year-old cyclist at a construction site. The driver was experienced and 41 years old. He had to cross a cycle path to get to the main road. On his way down a small gravel road the truck driver had to pass a passenger car (B), which was parked with its driver sitting inside. Because of this car the truck driver manoeuvred his vehicle to the left of the gravel road, and then made a sharp turn to the right to get into the main road. Before crossing the cycle path and entering the road, the truck driver stopped to give way for an oncoming car from the left (C). He then crossed the cycle path, while making a sharp right-hand turn. In doing so he noticed that the truck hit something but did not take any notice of it before the driver in the parked car sounded his horn. By then the truck had already hit the cyclist with his right front wheel. The boy died on the scene. He had been wearing a helmet and reflectors and had been on his way home from school.
Figure 2.13. Sketch of accident 7.
7.7.2 Results of DREAM analysis This is an intersection accident in which the driver enters the intersection “Too early” i.e. before the junction is free. The driver “Misjudged the situation” in that he thought that it was safe to cross the cycle path. He clearly did not see the cyclist approaching and entering his blind spot. This was a “Missed observation”, caused by driver “Inattention”, the large blind spots of the truck (“Permanent sight obstruction”) or both.
B
A
C
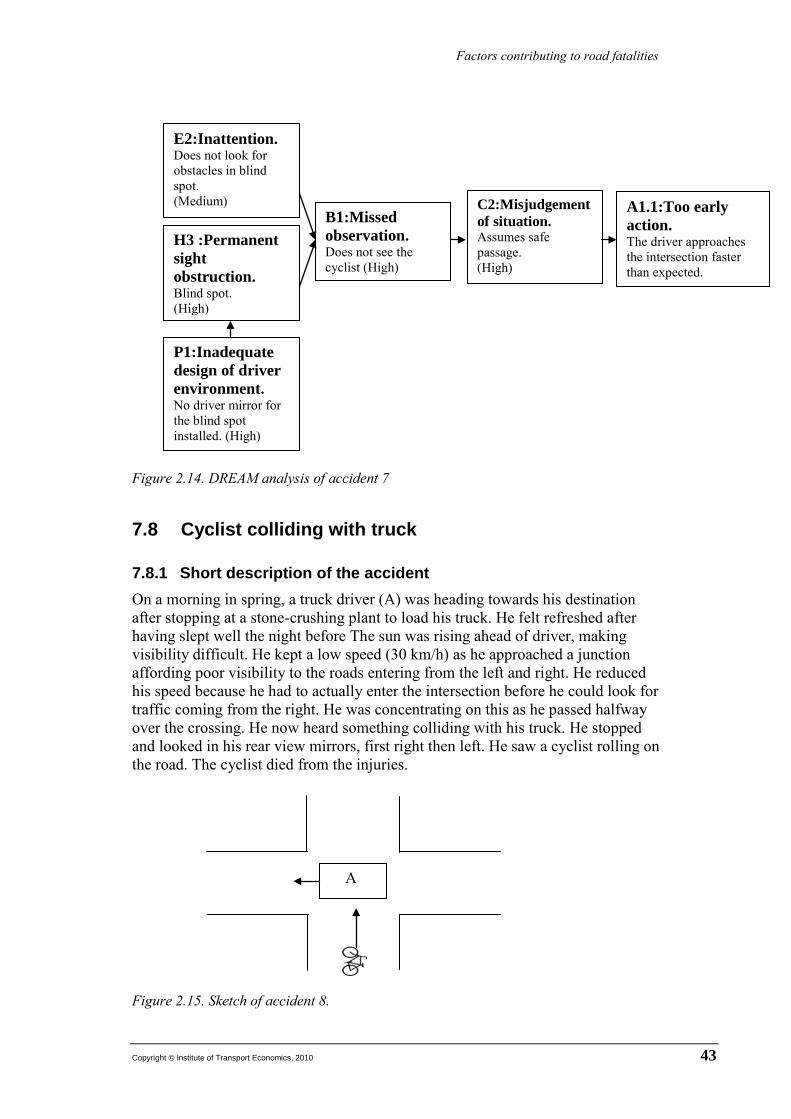
Factors contributing to road fatalities
Copyright © Institute of Transport Economics, 2010 43
Figure 2.14. DREAM analysis of accident 7
7.8 Cyclist colliding with truck
7.8.1 Short description of the accident On a morning in spring, a truck driver (A) was heading towards his destination after stopping at a stone-crushing plant to load his truck. He felt refreshed after having slept well the night before The sun was rising ahead of driver, making visibility difficult. He kept a low speed (30 km/h) as he approached a junction affording poor visibility to the roads entering from the left and right. He reduced his speed because he had to actually enter the intersection before he could look for traffic coming from the right. He was concentrating on this as he passed halfway over the crossing. He now heard something colliding with his truck. He stopped and looked in his rear view mirrors, first right then left. He saw a cyclist rolling on the road. The cyclist died from the injuries.
Figure 2.15. Sketch of accident 8.
A1.1:Too early action. The driver approaches the intersection faster than expected.
C2:Misjudgement of situation. Assumes safe passage. (High)
B1:Missed observation. Does not see the cyclist (High)
E2:Inattention. Does not look for obstacles in blind spot. (Medium)
H3 :Permanent sight obstruction. Blind spot. (High)
P1:Inadequate design of driver environment. No driver mirror for the blind spot installed. (High)
A

Factors contributing to road fatalities
44 Copyright © Institute of Transport Economics, 2010
7.8.2 Results of DREAM analysis This is an intersection accident. Even though the driver did not see the cyclist approaching, “No action” is chosen as the phenotype because in the event he did not stop or give way to the cyclist. The driver “Misjudged the situation” because he assumed safe passage and because he “Missed observation” of the cyclist. Also there was “Inadequate road geometry”, making him focus to his right. This has most certainly led to “Inattention” to his left. The low sun must have also contributed to “Reduced visibility”. The truck driver used his mental resources to ascertain whether traffic was approaching from the right, thus “Driving related distracters outside the vehicle”.
Figure 2.16. DREAM analysis of accident 8.
A1.3:No action. Does not see the cyclist before it’s too late.
C2:Misjudgement of situation. Assumes safe passage
B1:Missed observation Does not see the cyclist (High)
E2:Inattention. Low attention to the left. Reasonable inference. (Medium)
J1:Reduced visibility. Low sun. (High) L5:Inadequate
road geometry. The visibility around the corners is low. (High)
Q2:Inadequate road design. Low visibility around the corner. (High)
E2.2: Driving related distracters outside vehicle Concentrating on the right. (High)
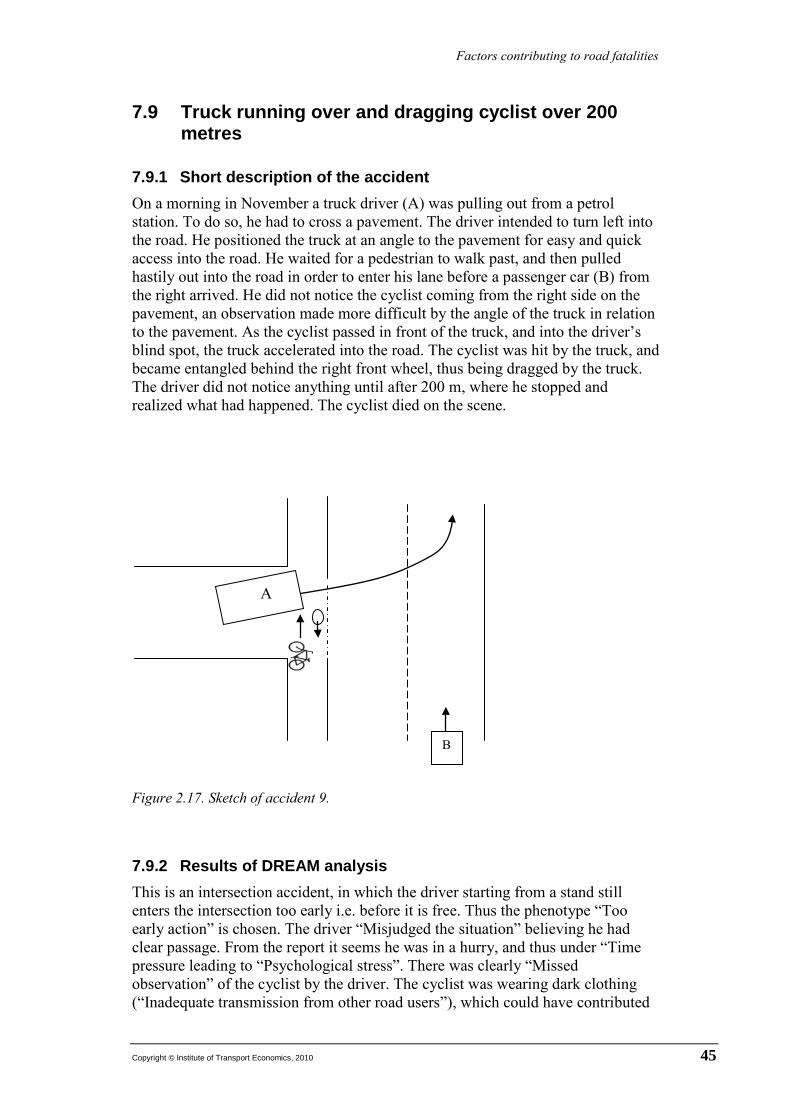
Factors contributing to road fatalities
Copyright © Institute of Transport Economics, 2010 45
7.9 Truck running over and dragging cyclist over 200 metres
7.9.1 Short description of the accident On a morning in November a truck driver (A) was pulling out from a petrol station. To do so, he had to cross a pavement. The driver intended to turn left into the road. He positioned the truck at an angle to the pavement for easy and quick access into the road. He waited for a pedestrian to walk past, and then pulled hastily out into the road in order to enter his lane before a passenger car (B) from the right arrived. He did not notice the cyclist coming from the right side on the pavement, an observation made more difficult by the angle of the truck in relation to the pavement. As the cyclist passed in front of the truck, and into the driver’s blind spot, the truck accelerated into the road. The cyclist was hit by the truck, and became entangled behind the right front wheel, thus being dragged by the truck. The driver did not notice anything until after 200 m, where he stopped and realized what had happened. The cyclist died on the scene.
Figure 2.17. Sketch of accident 9.
7.9.2 Results of DREAM analysis This is an intersection accident, in which the driver starting from a stand still enters the intersection too early i.e. before it is free. Thus the phenotype “Too early action” is chosen. The driver “Misjudged the situation” believing he had clear passage. From the report it seems he was in a hurry, and thus under “Time pressure leading to “Psychological stress”. There was clearly “Missed observation” of the cyclist by the driver. The cyclist was wearing dark clothing (“Inadequate transmission from other road users”), which could have contributed
A
B

Factors contributing to road fatalities
46 Copyright © Institute of Transport Economics, 2010
to the missed observation. “Inattention” towards the footpath due to focus on the vehicles approaching on the road also seems likely. The truck driver used his mental resources on the vehicles coming from the right i.e. “Driving related distracters outside the vehicle”. Also, the driver placed his truck at such an angle that the blind spot on his right was expanded. In addition there were raindrops on his side mirror which could have led to “Reduced visibility”.
Figure 2.18. DREAM analysis of accident 9.
7.10 Taxi colliding with cyclist
7.10.1 Short description of the accident Just after midnight on a Friday night, a minibus taxi (A) collided with a cyclist in an intersection. The roads leading to the junction were straight. However, while there was good visibility forward to the lights at the junction, high buildings
A1.1:Too early action. Drives before the passage is safe.
C2:Misjudgement of situation. Assumes safe passage
B1:Missed observation Does not see the cyclist (High)
E7:Psychological stress In a hurry. (Medium)
N1:Time pressure In a hurry. (Medium)
E2:Inattention. Low attention to the right. (Medium)
G3:Temporary sight obstruction Due to unfortunate placing of the truck (Medium)
M1:Inadequate transmission from other road users Dark clothing. Difficult to spot (High)
J1:Reduced visibility Raindrops on rear window. (Medium)
E2.2: Driving related distracters outside vehicle Concentrating to the right. (High)
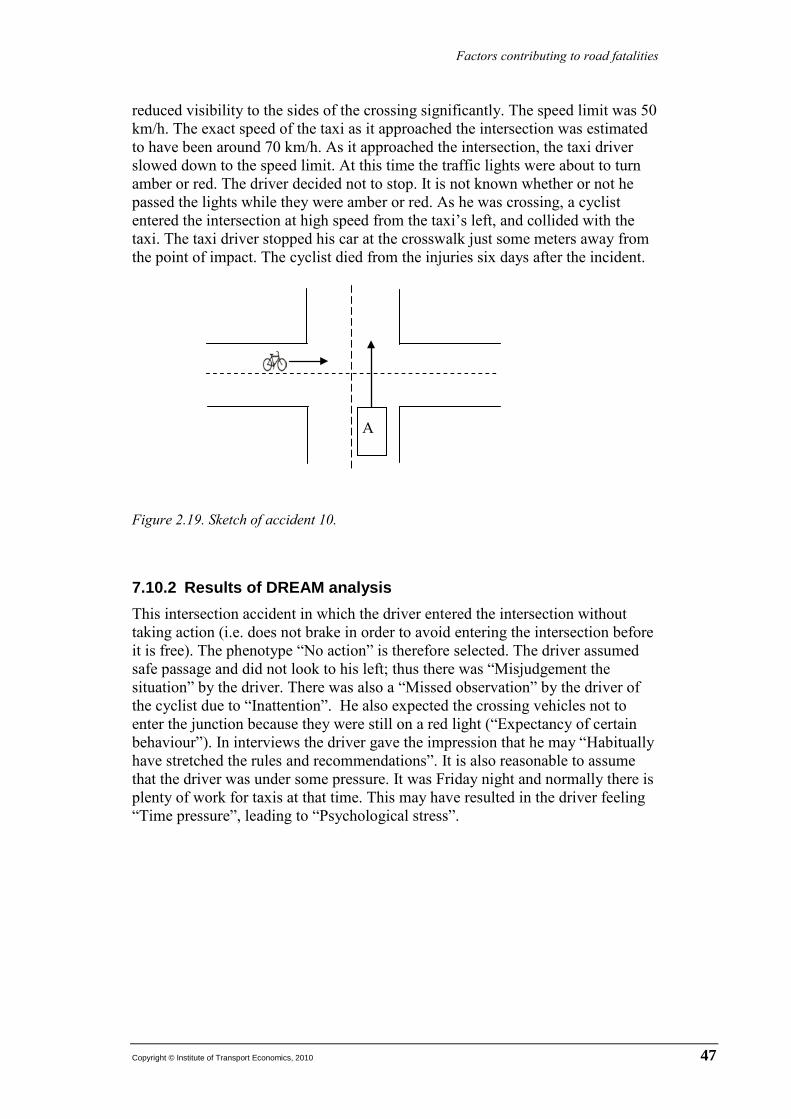
Factors contributing to road fatalities
Copyright © Institute of Transport Economics, 2010 47
reduced visibility to the sides of the crossing significantly. The speed limit was 50 km/h. The exact speed of the taxi as it approached the intersection was estimated to have been around 70 km/h. As it approached the intersection, the taxi driver slowed down to the speed limit. At this time the traffic lights were about to turn amber or red. The driver decided not to stop. It is not known whether or not he passed the lights while they were amber or red. As he was crossing, a cyclist entered the intersection at high speed from the taxi’s left, and collided with the taxi. The taxi driver stopped his car at the crosswalk just some meters away from the point of impact. The cyclist died from the injuries six days after the incident.
Figure 2.19. Sketch of accident 10.
7.10.2 Results of DREAM analysis This intersection accident in which the driver entered the intersection without taking action (i.e. does not brake in order to avoid entering the intersection before it is free). The phenotype “No action” is therefore selected. The driver assumed safe passage and did not look to his left; thus there was “Misjudgement the situation” by the driver. There was also a “Missed observation” by the driver of the cyclist due to “Inattention”. He also expected the crossing vehicles not to enter the junction because they were still on a red light (“Expectancy of certain behaviour”). In interviews the driver gave the impression that he may “Habitually have stretched the rules and recommendations”. It is also reasonable to assume that the driver was under some pressure. It was Friday night and normally there is plenty of work for taxis at that time. This may have resulted in the driver feeling “Time pressure”, leading to “Psychological stress”.
A
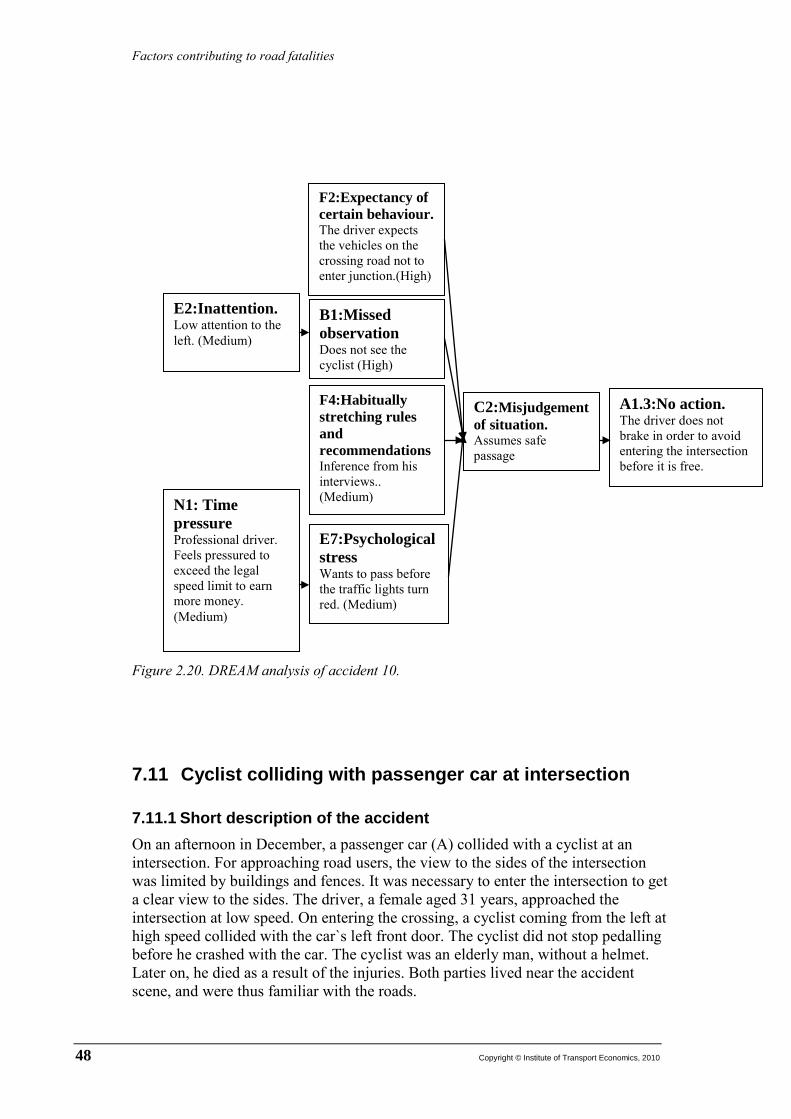
Factors contributing to road fatalities
48 Copyright © Institute of Transport Economics, 2010
Figure 2.20. DREAM analysis of accident 10.
7.11 Cyclist colliding with passenger car at intersection
7.11.1 Short description of the accident On an afternoon in December, a passenger car (A) collided with a cyclist at an intersection. For approaching road users, the view to the sides of the intersection was limited by buildings and fences. It was necessary to enter the intersection to get a clear view to the sides. The driver, a female aged 31 years, approached the intersection at low speed. On entering the crossing, a cyclist coming from the left at high speed collided with the car`s left front door. The cyclist did not stop pedalling before he crashed with the car. The cyclist was an elderly man, without a helmet. Later on, he died as a result of the injuries. Both parties lived near the accident scene, and were thus familiar with the roads.
A1.3:No action. The driver does not brake in order to avoid entering the intersection before it is free.
C2:Misjudgement of situation. Assumes safe passage
B1:Missed observation Does not see the cyclist (High)
E2:Inattention. Low attention to the left. (Medium)
F4:Habitually stretching rules and recommendations Inference from his interviews.. (Medium)
E7:Psychological stress Wants to pass before the traffic lights turn red. (Medium)
N1: Time pressure Professional driver. Feels pressured to exceed the legal speed limit to earn more money. (Medium)
F2:Expectancy of certain behaviour. The driver expects the vehicles on the crossing road not to enter junction.(High)
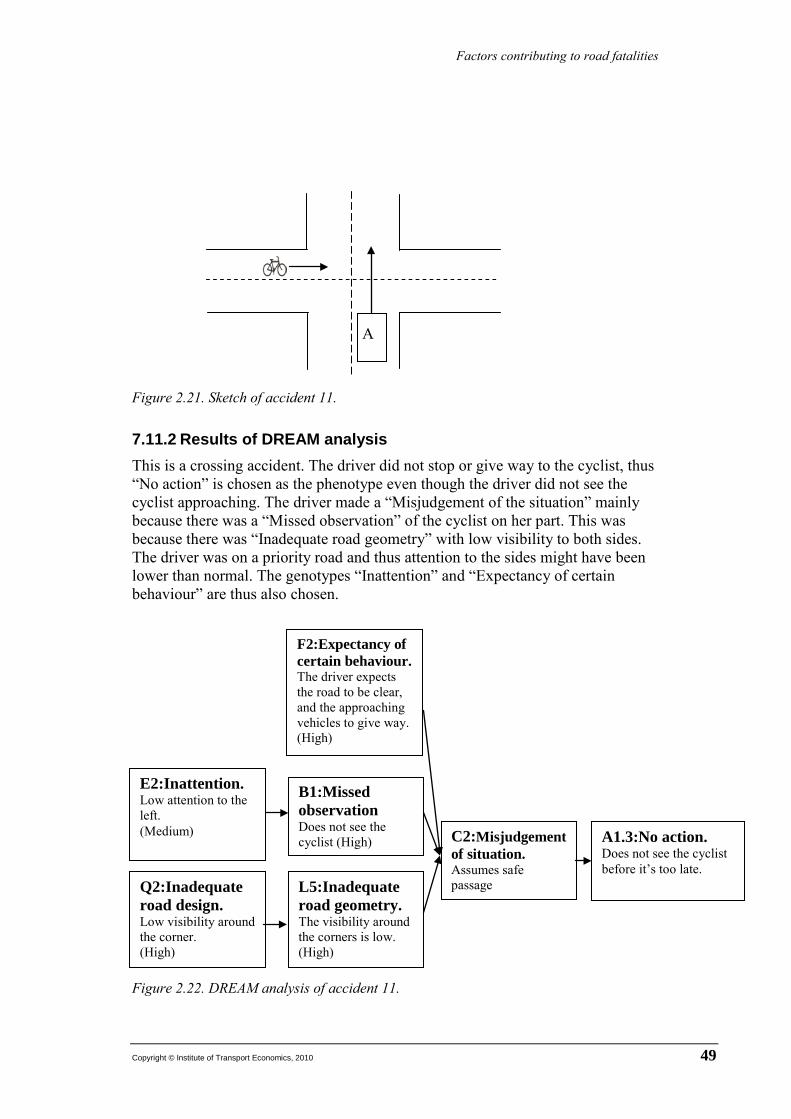
Factors contributing to road fatalities
Copyright © Institute of Transport Economics, 2010 49
Figure 2.21. Sketch of accident 11.
7.11.2 Results of DREAM analysis This is a crossing accident. The driver did not stop or give way to the cyclist, thus “No action” is chosen as the phenotype even though the driver did not see the cyclist approaching. The driver made a “Misjudgement of the situation” mainly because there was a “Missed observation” of the cyclist on her part. This was because there was “Inadequate road geometry” with low visibility to both sides. The driver was on a priority road and thus attention to the sides might have been lower than normal. The genotypes “Inattention” and “Expectancy of certain behaviour” are thus also chosen.
|
Figure 2.22. DREAM analysis of accident 11.
A1.3:No action. Does not see the cyclist before it’s too late.
C2:Misjudgement of situation. Assumes safe passage
B1:Missed observation Does not see the cyclist (High)
E2:Inattention. Low attention to the left. (Medium)
L5:Inadequate road geometry. The visibility around the corners is low. (High)
Q2:Inadequate road design. Low visibility around the corner. (High)
A
F2:Expectancy of certain behaviour. The driver expects the road to be clear, and the approaching vehicles to give way. (High)
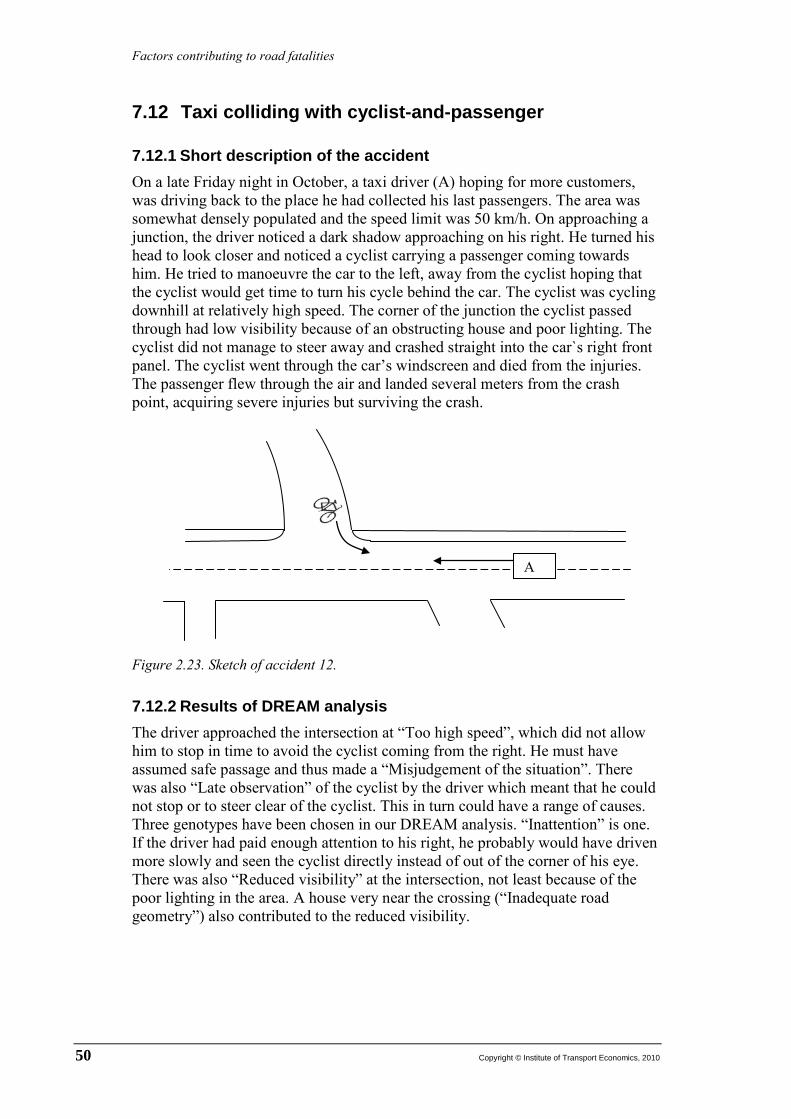
Factors contributing to road fatalities
50 Copyright © Institute of Transport Economics, 2010
7.12 Taxi colliding with cyclist-and-passenger
7.12.1 Short description of the accident On a late Friday night in October, a taxi driver (A) hoping for more customers, was driving back to the place he had collected his last passengers. The area was somewhat densely populated and the speed limit was 50 km/h. On approaching a junction, the driver noticed a dark shadow approaching on his right. He turned his head to look closer and noticed a cyclist carrying a passenger coming towards him. He tried to manoeuvre the car to the left, away from the cyclist hoping that the cyclist would get time to turn his cycle behind the car. The cyclist was cycling downhill at relatively high speed. The corner of the junction the cyclist passed through had low visibility because of an obstructing house and poor lighting. The cyclist did not manage to steer away and crashed straight into the car`s right front panel. The cyclist went through the car’s windscreen and died from the injuries. The passenger flew through the air and landed several meters from the crash point, acquiring severe injuries but surviving the crash.
Figure 2.23. Sketch of accident 12.
7.12.2 Results of DREAM analysis The driver approached the intersection at “Too high speed”, which did not allow him to stop in time to avoid the cyclist coming from the right. He must have assumed safe passage and thus made a “Misjudgement of the situation”. There was also “Late observation” of the cyclist by the driver which meant that he could not stop or to steer clear of the cyclist. This in turn could have a range of causes. Three genotypes have been chosen in our DREAM analysis. “Inattention” is one. If the driver had paid enough attention to his right, he probably would have driven more slowly and seen the cyclist directly instead of out of the corner of his eye. There was also “Reduced visibility” at the intersection, not least because of the poor lighting in the area. A house very near the crossing (“Inadequate road geometry”) also contributed to the reduced visibility.
A
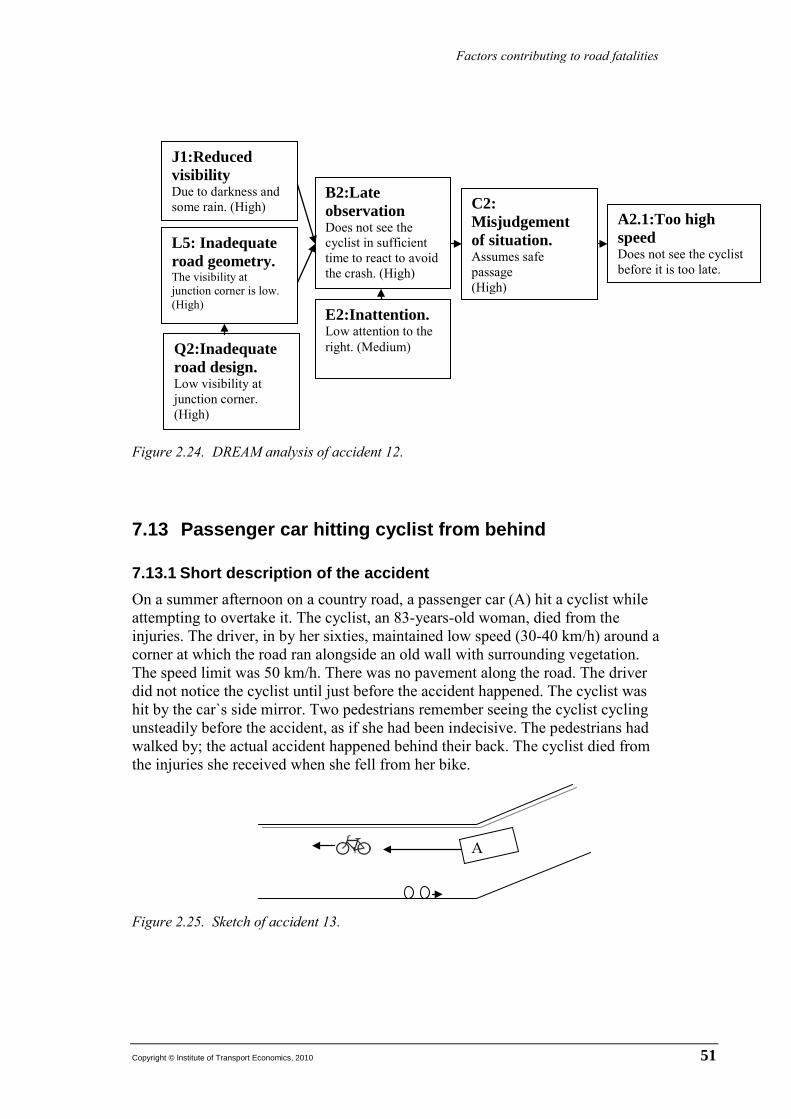
Factors contributing to road fatalities
Copyright © Institute of Transport Economics, 2010 51
Figure 2.24. DREAM analysis of accident 12.
7.13 Passenger car hitting cyclist from behind
7.13.1 Short description of the accident On a summer afternoon on a country road, a passenger car (A) hit a cyclist while attempting to overtake it. The cyclist, an 83-years-old woman, died from the injuries. The driver, in by her sixties, maintained low speed (30-40 km/h) around a corner at which the road ran alongside an old wall with surrounding vegetation. The speed limit was 50 km/h. There was no pavement along the road. The driver did not notice the cyclist until just before the accident happened. The cyclist was hit by the car`s side mirror. Two pedestrians remember seeing the cyclist cycling unsteadily before the accident, as if she had been indecisive. The pedestrians had walked by; the actual accident happened behind their back. The cyclist died from the injuries she received when she fell from her bike.
Figure 2.25. Sketch of accident 13.
A2.1:Too high speed Does not see the cyclist before it is too late.
C2: Misjudgement of situation. Assumes safe passage (High)
B2:Late observation Does not see the cyclist in sufficient time to react to avoid the crash. (High)
J1:Reduced visibility Due to darkness and some rain. (High)
L5: Inadequate road geometry. The visibility at junction corner is low. (High)
Q2:Inadequate road design. Low visibility at junction corner. (High)
E2:Inattention. Low attention to the right. (Medium)
A
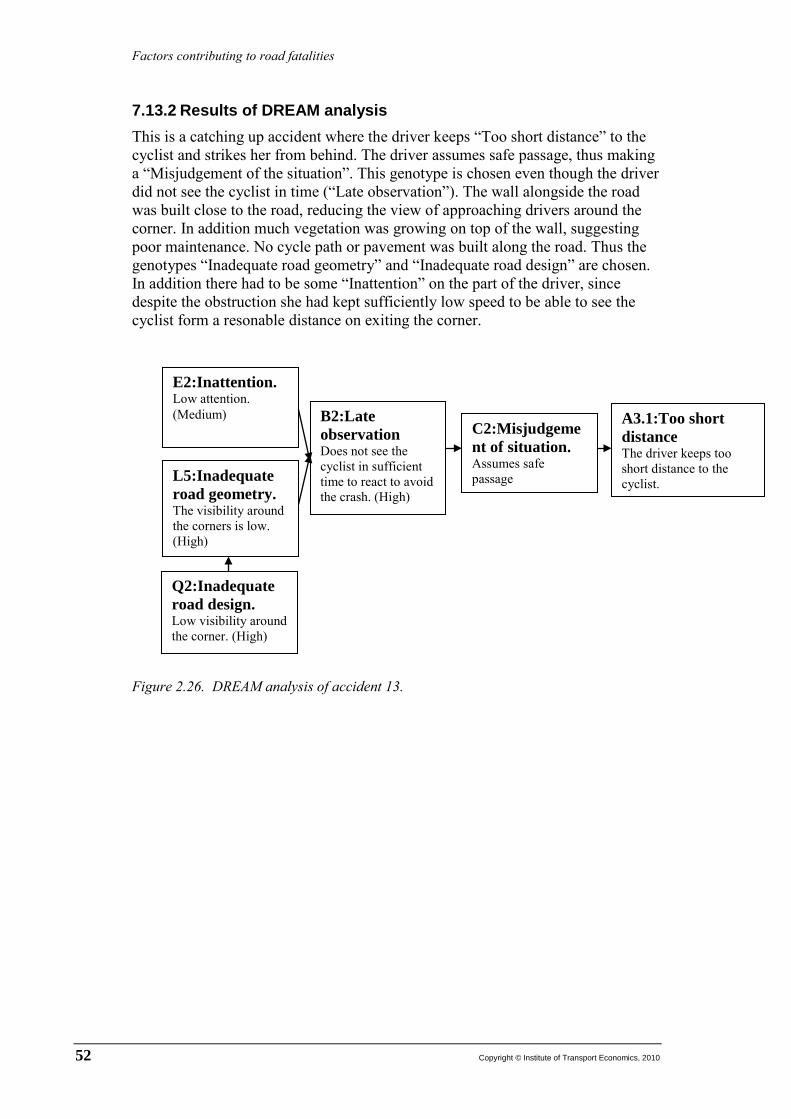
Factors contributing to road fatalities
52 Copyright © Institute of Transport Economics, 2010
7.13.2 Results of DREAM analysis This is a catching up accident where the driver keeps “Too short distance” to the cyclist and strikes her from behind. The driver assumes safe passage, thus making a “Misjudgement of the situation”. This genotype is chosen even though the driver did not see the cyclist in time (“Late observation”). The wall alongside the road was built close to the road, reducing the view of approaching drivers around the corner. In addition much vegetation was growing on top of the wall, suggesting poor maintenance. No cycle path or pavement was built along the road. Thus the genotypes “Inadequate road geometry” and “Inadequate road design” are chosen. In addition there had to be some “Inattention” on the part of the driver, since despite the obstruction she had kept sufficiently low speed to be able to see the cyclist form a resonable distance on exiting the corner.
Figure 2.26. DREAM analysis of accident 13.
A3.1:Too short distance The driver keeps too short distance to the cyclist.
C2:Misjudgement of situation. Assumes safe passage
B2:Late observation Does not see the cyclist in sufficient time to react to avoid the crash. (High)
L5:Inadequate road geometry. The visibility around the corners is low. (High)
E2:Inattention. Low attention. (Medium)
Q2:Inadequate road design. Low visibility around the corner. (High)
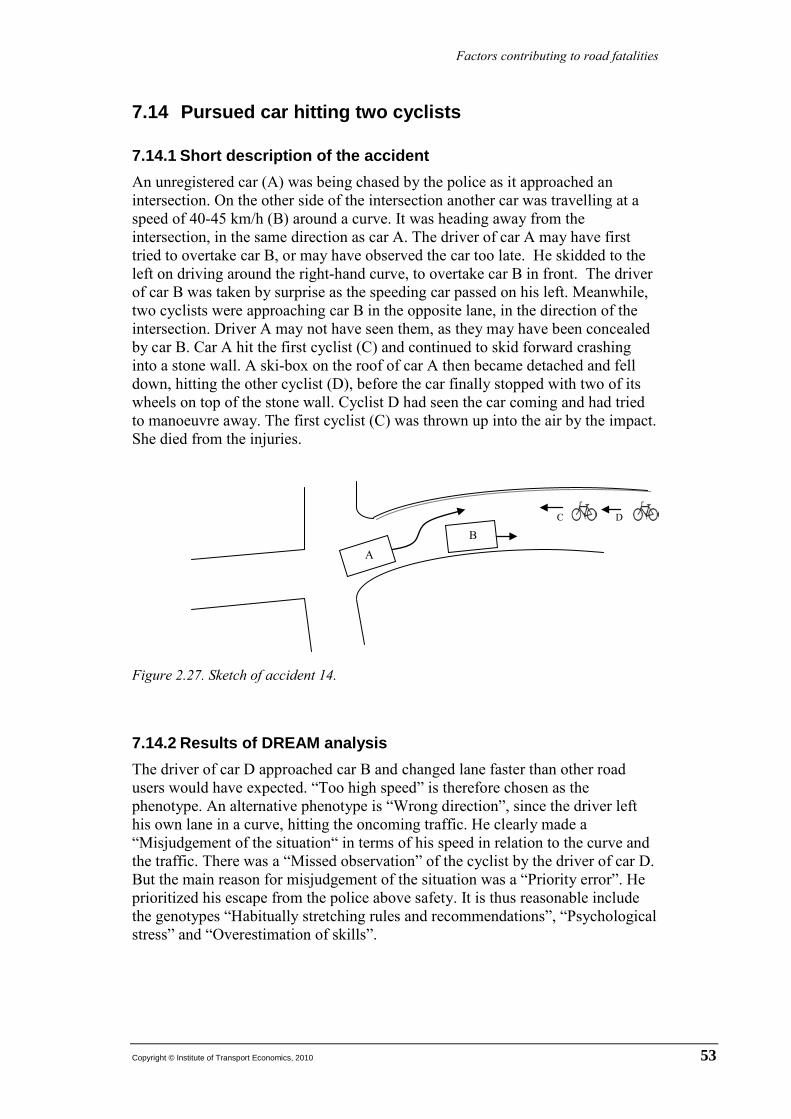
Factors contributing to road fatalities
Copyright © Institute of Transport Economics, 2010 53
7.14 Pursued car hitting two cyclists
7.14.1 Short description of the accident An unregistered car (A) was being chased by the police as it approached an intersection. On the other side of the intersection another car was travelling at a speed of 40-45 km/h (B) around a curve. It was heading away from the intersection, in the same direction as car A. The driver of car A may have first tried to overtake car B, or may have observed the car too late. He skidded to the left on driving around the right-hand curve, to overtake car B in front. The driver of car B was taken by surprise as the speeding car passed on his left. Meanwhile, two cyclists were approaching car B in the opposite lane, in the direction of the intersection. Driver A may not have seen them, as they may have been concealed by car B. Car A hit the first cyclist (C) and continued to skid forward crashing into a stone wall. A ski-box on the roof of car A then became detached and fell down, hitting the other cyclist (D), before the car finally stopped with two of its wheels on top of the stone wall. Cyclist D had seen the car coming and had tried to manoeuvre away. The first cyclist (C) was thrown up into the air by the impact. She died from the injuries.
Figure 2.27. Sketch of accident 14.
7.14.2 Results of DREAM analysis The driver of car D approached car B and changed lane faster than other road users would have expected. “Too high speed” is therefore chosen as the phenotype. An alternative phenotype is “Wrong direction”, since the driver left his own lane in a curve, hitting the oncoming traffic. He clearly made a “Misjudgement of the situation“ in terms of his speed in relation to the curve and the traffic. There was a “Missed observation” of the cyclist by the driver of car D. But the main reason for misjudgement of the situation was a “Priority error”. He prioritized his escape from the police above safety. It is thus reasonable include the genotypes “Habitually stretching rules and recommendations”, “Psychological stress” and “Overestimation of skills”.
B A
C D
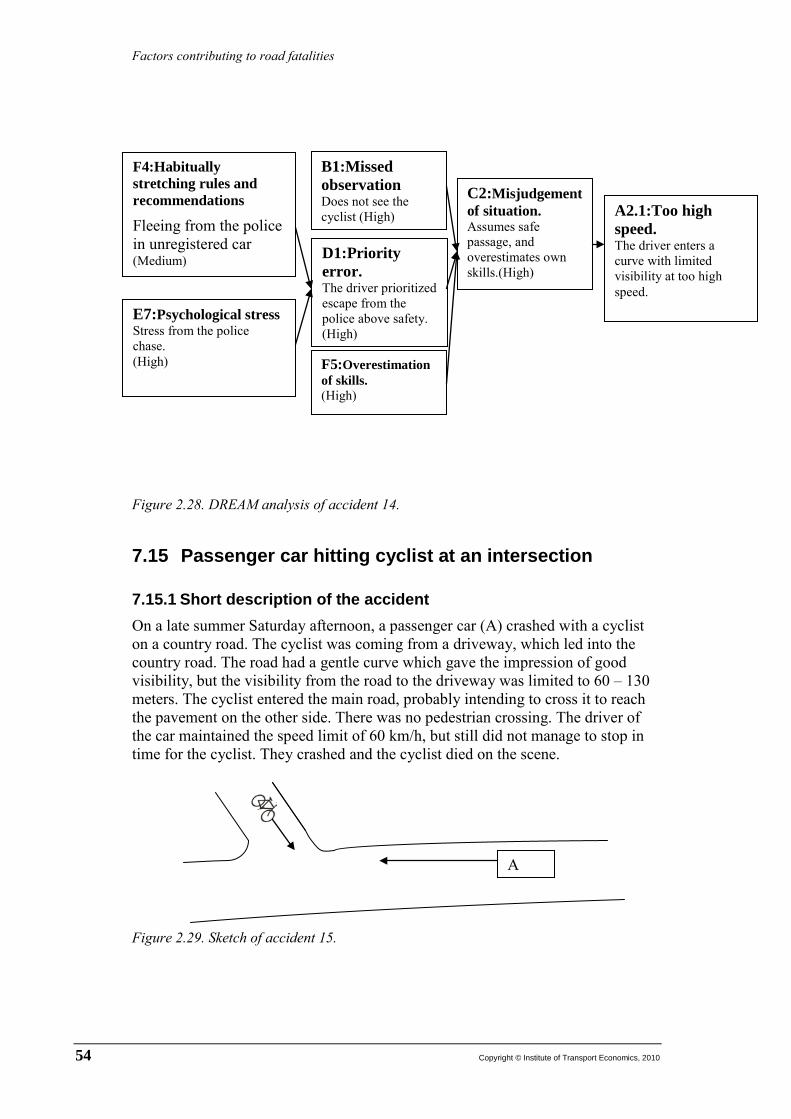
Factors contributing to road fatalities
54 Copyright © Institute of Transport Economics, 2010
Figure 2.28. DREAM analysis of accident 14.
7.15 Passenger car hitting cyclist at an intersection
7.15.1 Short description of the accident On a late summer Saturday afternoon, a passenger car (A) crashed with a cyclist on a country road. The cyclist was coming from a driveway, which led into the country road. The road had a gentle curve which gave the impression of good visibility, but the visibility from the road to the driveway was limited to 60 – 130 meters. The cyclist entered the main road, probably intending to cross it to reach the pavement on the other side. There was no pedestrian crossing. The driver of the car maintained the speed limit of 60 km/h, but still did not manage to stop in time for the cyclist. They crashed and the cyclist died on the scene.
Figure 2.29. Sketch of accident 15.
A2.1:Too high speed. The driver enters a curve with limited visibility at too high speed.
C2:Misjudgement of situation. Assumes safe passage, and overestimates own skills.(High)
B1:Missed observation Does not see the cyclist (High)
D1:Priority error. The driver prioritized escape from the police above safety. (High)
F4:Habitually stretching rules and recommendations Fleeing from the police in unregistered car (Medium)
E7:Psychological stress Stress from the police chase. (High)
A
F5:Overestimation of skills. (High)
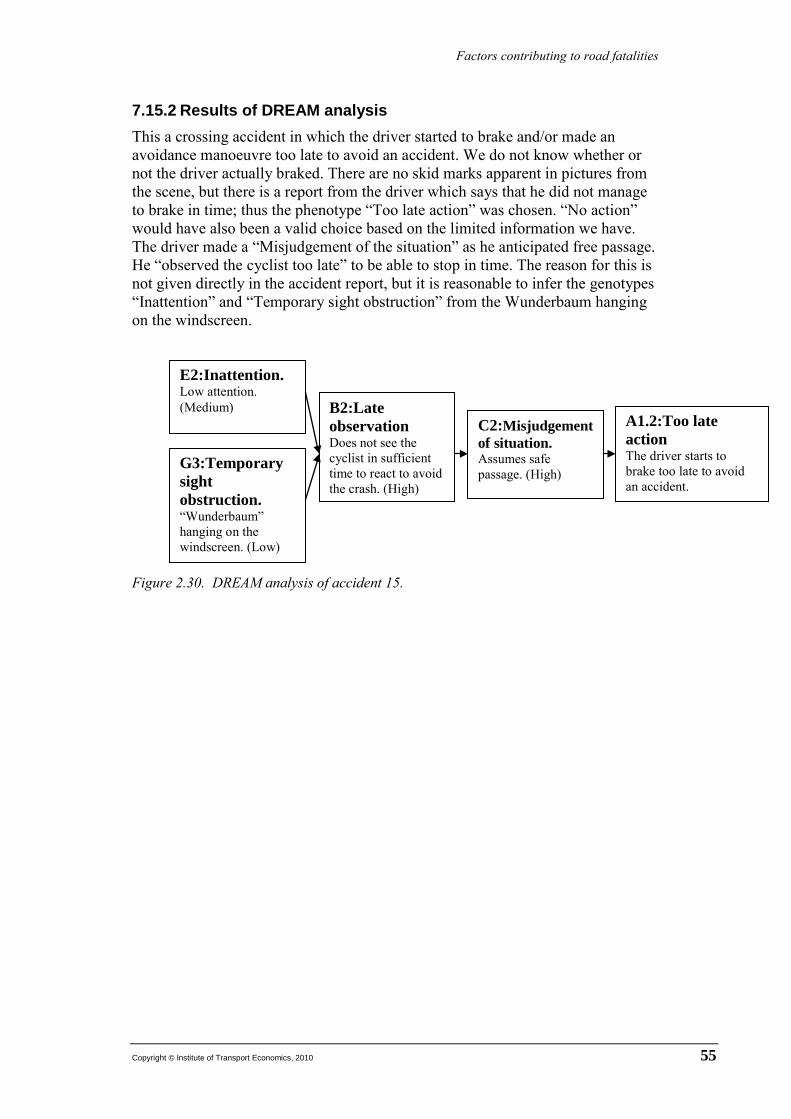
Factors contributing to road fatalities
Copyright © Institute of Transport Economics, 2010 55
7.15.2 Results of DREAM analysis This a crossing accident in which the driver started to brake and/or made an avoidance manoeuvre too late to avoid an accident. We do not know whether or not the driver actually braked. There are no skid marks apparent in pictures from the scene, but there is a report from the driver which says that he did not manage to brake in time; thus the phenotype “Too late action” was chosen. “No action” would have also been a valid choice based on the limited information we have. The driver made a “Misjudgement of the situation” as he anticipated free passage. He “observed the cyclist too late” to be able to stop in time. The reason for this is not given directly in the accident report, but it is reasonable to infer the genotypes “Inattention” and “Temporary sight obstruction” from the Wunderbaum hanging on the windscreen.
Figure 2.30. DREAM analysis of accident 15.
A1.2:Too late action The driver starts to brake too late to avoid an accident.
C2:Misjudgement of situation. Assumes safe passage. (High)
B2:Late observation Does not see the cyclist in sufficient time to react to avoid the crash. (High)
E2:Inattention. Low attention. (Medium)
G3:Temporary sight obstruction. “Wunderbaum” hanging on the windscreen. (Low)
Factors contributing to road fatalities
56 Copyright © Institute of Transport Economics, 2010
8 Aggregating DREAM charts
8.1 Common causation patterns The purpose of aggregating causation charts is to find common causation patterns. The fifteen accidents studied in this report have been studied with the same tool and the same methodology. We therefore have a consistency and we may aggregate the results.
We have analyzed 15 accidents involving at least one cyclist and at least one automobile. Using these analyses we have aggregated three charts. Chart A show all the genotypes and the connections between them regardless of their occurrence or frequencies. Chart B include only those genotypes and connections which appear at least twice, and chart C includes only those genotypes and their corresponding connections which are deemed “High - certainty” by the analyst.

Factors contributing to road fatalities
Copyright © Institute of Transport Economics, 2010 57
Figure 2.31. Aggregated DREAM chart including connections and genotypes for collisions between bicycles and motorized vehicles.
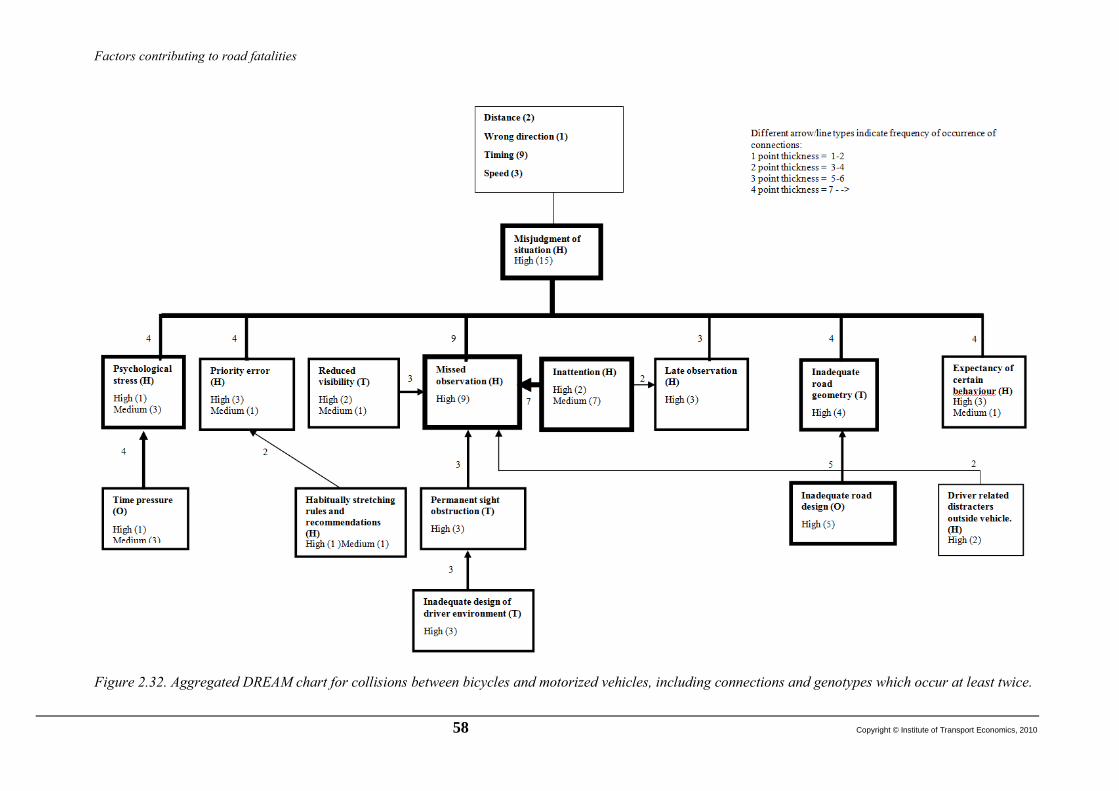
Factors contributing to road fatalities
58 Copyright © Institute of Transport Economics, 2010
Figure 2.32. Aggregated DREAM chart for collisions between bicycles and motorized vehicles, including connections and genotypes which occur at least twice.
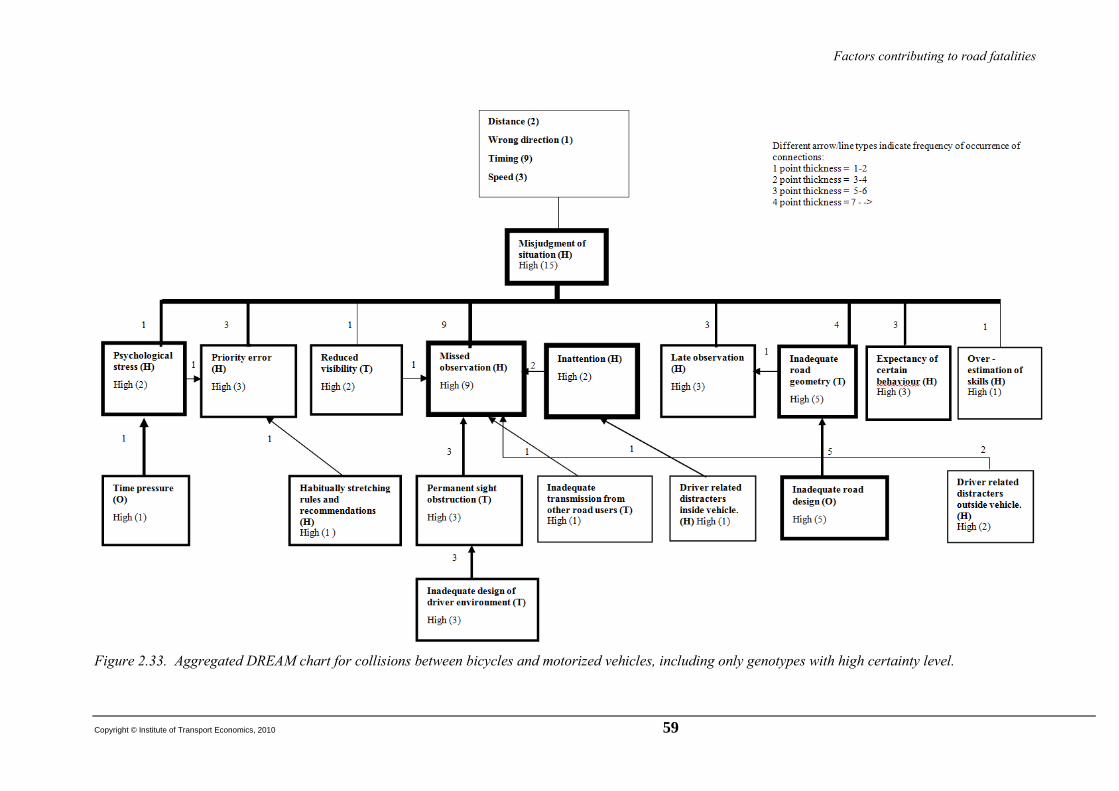
Factors contributing to road fatalities
Copyright © Institute of Transport Economics, 2010 59
Figure 2.33. Aggregated DREAM chart for collisions between bicycles and motorized vehicles, including only genotypes with high certainty level.
Factors contributing to road fatalities
60 Copyright © Institute of Transport Economics, 2010
8.2 The aggregation Looking at chart A, the picture is complicated. There are many genotypes, some with multiple connections between them. While some genotypes and connections clearly stand out in terms of the number of times they appear in the 15 analyses conducted, chart A does not distinguish between levels of certainties. We refined chart A in an attempt to highlight the most common and reliable causal patterns, resulting in charts B and C.
The most frequent phenotype is “Timing”, followed by “Speed” and then “Distance” and finally “Wrong direction”.
From chart B, we see that “Misjudgement of situation” is the immediate cause of each of these phenotypes.
“Misjudgement of situation” is often preceded by “Missed observation”, which has a high frequency in the chart and a high level of certainty attached.
“Missed observation” is highly linked to its antecedents “Inattention” and “Permanent sight obstruction”, the latter often preceded by “Inadequate design of driver environment” in the causal chain suggested.
“Physiological stress” and “Priority error” are also often linked with “Misjudgement of situation” in the run up to accidents. “Psychological stress” is often caused by “Time pressure”. “Priority error” is a product of both “Time pressure” and “Habitually stretching rules and recommendations”.
Also “Inadequate road geometry” is a significant of “Misjudgement of situation”. And the cause of “Inadequate road geometry” is almost always “Inadequate road design”
If we only consider genotypes with “high” certainty (chart C) we see that the frequencies for most genotypes is reduced, especially in the case of “Inattention”. “Missed observation” however still has high frequency, the other genotypes being much less frequent in comparison. The second most common cause is “Inadequate road geometry” and “Inadequate road design”.
Factors contributing to road fatalities
Copyright © Institute of Transport Economics, 2010 61
9 Bicycle accidents – discussion and conclusions
The overall conclusion from our study of 15 fatal collisions between a motorized vehicle and one or more bicycles is that poor driver perception of cyclists is often key in the run-up to the accident. This applies especially for those accidents occurring at junctions affording the driver limited views, or in situations where the driver is being distracted by either the traffic outside or by something inside the vehicle.
Sight obstruction, Inadequate driver environment and Poor road design also contribute significantly to perception difficulties. The first two genotypes lead to the driver failing to notice the cyclist, while the latter often leads to misjudgement of the situation.
Generally, however, a combination of the above mentioned-factors led to the driver misjudging the situation and as a result colliding with a bicyclist.
Psychological stress and Priority error are other factors that stood out in our aggregation charts leading to misjudgement of the situation.
The investigated accidents were limited in number and collected from only one country. General conclusions should therefore be drawn with caution and even more caution is required when proposing concrete countermeasures. Nevertheless on the ground of the many “Missed observations” in our study, it is reasonable to suggest general measures targeted at increasing bicyclist visibility, helping drivers to observe the bicyclist in time, and consequently avoiding collision.

Factors contributing to road fatalities
62 Copyright © Institute of Transport Economics, 2010
PART 3:
General discussion and conclusions

Factors contributing to road fatalities
Copyright © Institute of Transport Economics, 2010 63
10 Causal factors in crashes
The analyses of both intersection crashes and collisions involving bicycles share the common feature of inattention or distraction as important causal factors, thus confirming the notable role of those factors shown also in previous crash studies.
Concerning the intersection crashes, those perceptual difficulties were most notable primarily for turning drivers. This seemed to be related to a large extent to being faced with unexpected behaviours in relation to the conflict vehicle, while at the same time trying to negotiate a demanding traffic situation. Drivers going straight on the other hand have less perception difficulties. Instead, their main problem is that they largely expect turning drivers to yield.
Contributing factors often pointed to in literature, e.g. high speed, drugs and/or alcohol and inadequate driver training, played a role in 12 out of 43 crashes. While this confirms their prevalence, it also indicates that most drivers end up in these situations due to combinations of less auspicious contributing factors. It was also notable that 10 of the 12 drivers under influence were going straight, motorcyclists were over-represented and high speed was also a frequent factor.
It is difficult to point to practical implications in terms of specific countermeasures. Rather, a host of measures have to be applied. A natural focus point to start with would be the MC drivers going straight, as they form a large part of the problem. Measures to increase MC driver visibility (reflex vests, automatic and more intense lighting, etc) may make a difference. For MC drivers who are less inclined to use such vests, the type of gap availability estimators on trial in certain US intersections (and elsewhere) are a promising option.
Concerning the collisions between bicycle and motorized the perceptual problems of drivers were found especially in crossing with limited view or in situations where the driver is being distracted by either the traffic outside or by something inside the vehicle.
The many occurrences of “missed observations” as a causal factor points to the importance of any measures chat could increase the bicyclists’ visibility, thus helping drivers to observe the bicyclist in time and consequently avoiding a collision.
Factors contributing to road fatalities
64 Copyright © Institute of Transport Economics, 2010
11 Implications for data collection and analyses by NPRA investigation teams
Only final reports from the crash investigation teams were used for our analyses. The content and structure of the accident investigation reports which were used for the DREAM analysis varied in content and quality. Ideally the reports should have been in one template. Also, in order to minimize the need for guesswork on the part of the analyst, the accidents report should contain thorough interviews from all surviving parties, including witnesses. The interview should include detailed questions about their state of mind, health and what the experienced before the accident.
Comprehensive interviewing may even reveal organizational factors. For example, factors like stress and fatigue could possibly be traced back to organizational background factors. It can be questioned whether a DREAM analysis add much to the knowledge when based on reports with poor background data.
A general observation is that there are overall fewer contributing factors coded for drivers assumed not to be the party “at fault” for the crash. However, from a countermeasures point of view, information from both parties may in many cases be equally relevant. Underreporting of contributing factors for one of the parties involved based on moral reasoning about guilt thus hinders rather than helps countermeasure development. This underlying investigator mindset therefore needs addressing, to avoid future bias in the reported information.
In can also be seen that in the general perspective, the information on blunt end factors (those more distant in time/space, yet important for the development of events) contained in the accident reports is more limited than information on sharp end factors (those close in time/space to the crash). A likely explanation for this phenomenon is that the analysts not always reflect on the influence of blunt end factors on the event they are analysing. This points to the importance of having an explicit, and in the analyst group anchored, analysis method which clearly defines the scope of possible contributing factors and influences to be controlled for in accident investigation. This in particular holds if the investigations are to yield results on blunt end factors.
For several crashes some frequent risk factors, such as e.g. driver fatigue or secondary task engagement, were not mentioned in the reports. There may be two possible explanations. One is that the accident investigations have failed to identify instances where these factors have contributed despite their assumed association with traffic accidents, and the other was that these factors simply do not contribute. It is important that the reports include information showing whether a given factor was investigated or not, and not only mention when the factor was shown to be present.
Factors contributing to road fatalities
Copyright © Institute of Transport Economics, 2010 65
The DREAM methodology used here contains a number of genotypes which were not applicable to any of the analysed accidents. Since DREAM has been put through extensive validation work and corroboration with other researchers’ findings on possible accident causes, there is reason to further investigate why many of the genotypes available in DREAM never get applied in the analysis. While the hoped for result of such a project would be that the accident analysis as currently being conducted is indeed sufficiently extensive, a more likely result is that there probably is room for improvement.
Finally, there is an unnecessary element of conjecture present in some of the accident reports. When the instructions say that the analyst should list possible contributing factors, some analysts have taken this as license to speculate. Rather than including only factors for which there is at least some empirical evidence, the analysts at times make quite general speculations, regarding the capabilities of older drivers and other matters.
Factors contributing to road fatalities
66 Copyright © Institute of Transport Economics, 2010
References
Hendrick, K., Benner, L. (1987). Investigating accidents with Sequentially Timed and Events Plotting (STEP). New York: Marcel Decker. Hollnagel, E. (1998). CREAM - Cognitive Reliability and Error Analysis Method. Oxford: Elsevier Science. Huang, Y.-H., Ljung, M. (2004). Factors influencing the causation of accidents and incidents. In: D. de Waard, K.A. Brookhuis, C.M. Weikert (Eds.) Human factors in design (pp. 25-35). Maastricht: Shaker Publishing. Ljung, M. (2002). DREAM: Driving Reliability and Error Analysis Method. Master Thesis, Linköping University, Department of Computer and Information Science (IDA). Ljung, M., Fagerlind, H., Lövsund, P., Sandin, J. (2007). Accident investigations for active safety at chalmers - new demands require new methodologies. Vehicle System Dynamics, 45, 881 - 894. Ljung, M., Furberg, B., Hollnagel, E. (2005). Handbok för DREAM 2.1 (Manual for DREAM 2.1). Gothenburg: Chalmers University of Technology. Najm, W. G., Smith, J. D., Smith, D. L. (2001). Analysis of crossing path crashes. Cambridge, MA: Volpe National Transportation Systems Center. SAFETYNET (2005). Deliverable 5.2: In-depth accident causation data study methodology development report. Technical Report Deliverable 5.2, European Road Safety Observatory. SAFETYNET (2008). Deliverable 5.8: In-depth accident causation database and analysis report. Technical Report Deliverable 5.8, European Road Safety Observatory. Sandin, J. (2008) Aggregating case studies of vehicle crashes by means of causation charts - an evaluation and revision of the Driving Reliability and Error Analysis Method. Gothenburg: Chalmers University of Technology. Sandin, J., Ljung, M. (2007), "Understanding the causation of single-vehicle crashes: A methodology for in-depth on-scene multidisciplinary case studies. International Journal of Vehicle Safety 2007, 2, 316 - 333. SIKA (2007). Vägtrafikskador 2006. Utvidgat tabellverk enligt äldre publicering. Technical Report SIKA. Swedish Institute for Transport and Communication Analysis (SIKA). Wallén Warner, H., Ljung Aust, M., Björklund, G., Johansson, E., Sandin, J. (2008), "Manual for DREAM 3.0, Driving Reliability and Error Analysis Method. Deliverable D5.6 of the EU FP6 project SafetyNet. Wallén Warner, H., Sandin, J. (2009), "The intercoder agreement when using the Driving Reliability and Error Analysis Method in road traffic accident investigations. In press.
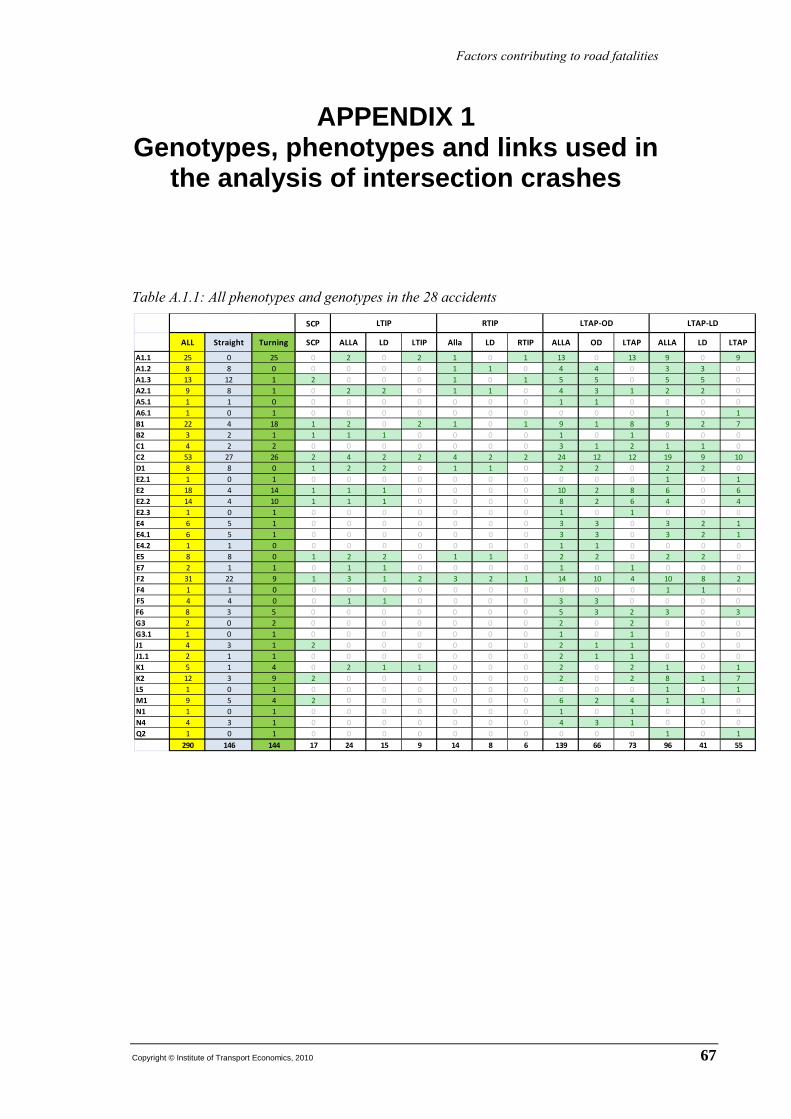
Factors contributing to road fatalities
Copyright © Institute of Transport Economics, 2010 67
APPENDIX 1 Genotypes, phenotypes and links used in
the analysis of intersection crashes
Table A.1.1: All phenotypes and genotypes in the 28 accidents
SCP
ALL Straight Turning SCP ALLA LD LTIP Alla LD RTIP ALLA OD LTAP ALLA LD LTAP
A1.1 25 0 25 0 2 0 2 1 0 1 13 0 13 9 0 9A1.2 8 8 0 0 0 0 0 1 1 0 4 4 0 3 3 0A1.3 13 12 1 2 0 0 0 1 0 1 5 5 0 5 5 0A2.1 9 8 1 0 2 2 0 1 1 0 4 3 1 2 2 0A5.1 1 1 0 0 0 0 0 0 0 0 1 1 0 0 0 0A6.1 1 0 1 0 0 0 0 0 0 0 0 0 0 1 0 1B1 22 4 18 1 2 0 2 1 0 1 9 1 8 9 2 7B2 3 2 1 1 1 1 0 0 0 0 1 0 1 0 0 0C1 4 2 2 0 0 0 0 0 0 0 3 1 2 1 1 0C2 53 27 26 2 4 2 2 4 2 2 24 12 12 19 9 10D1 8 8 0 1 2 2 0 1 1 0 2 2 0 2 2 0E2.1 1 0 1 0 0 0 0 0 0 0 0 0 0 1 0 1E2 18 4 14 1 1 1 0 0 0 0 10 2 8 6 0 6E2.2 14 4 10 1 1 1 0 0 0 0 8 2 6 4 0 4E2.3 1 0 1 0 0 0 0 0 0 0 1 0 1 0 0 0E4 6 5 1 0 0 0 0 0 0 0 3 3 0 3 2 1E4.1 6 5 1 0 0 0 0 0 0 0 3 3 0 3 2 1E4.2 1 1 0 0 0 0 0 0 0 0 1 1 0 0 0 0E5 8 8 0 1 2 2 0 1 1 0 2 2 0 2 2 0E7 2 1 1 0 1 1 0 0 0 0 1 0 1 0 0 0F2 31 22 9 1 3 1 2 3 2 1 14 10 4 10 8 2F4 1 1 0 0 0 0 0 0 0 0 0 0 0 1 1 0F5 4 4 0 0 1 1 0 0 0 0 3 3 0 0 0 0F6 8 3 5 0 0 0 0 0 0 0 5 3 2 3 0 3G3 2 0 2 0 0 0 0 0 0 0 2 0 2 0 0 0G3.1 1 0 1 0 0 0 0 0 0 0 1 0 1 0 0 0J1 4 3 1 2 0 0 0 0 0 0 2 1 1 0 0 0J1.1 2 1 1 0 0 0 0 0 0 0 2 1 1 0 0 0K1 5 1 4 0 2 1 1 0 0 0 2 0 2 1 0 1K2 12 3 9 2 0 0 0 0 0 0 2 0 2 8 1 7L5 1 0 1 0 0 0 0 0 0 0 0 0 0 1 0 1M1 9 5 4 2 0 0 0 0 0 0 6 2 4 1 1 0N1 1 0 1 0 0 0 0 0 0 0 1 0 1 0 0 0N4 4 3 1 0 0 0 0 0 0 0 4 3 1 0 0 0Q2 1 0 1 0 0 0 0 0 0 0 0 0 0 1 0 1
290 146 144 17 24 15 9 14 8 6 139 66 73 96 41 55
LTAP-OD LTAP-LDRTIPLTIP
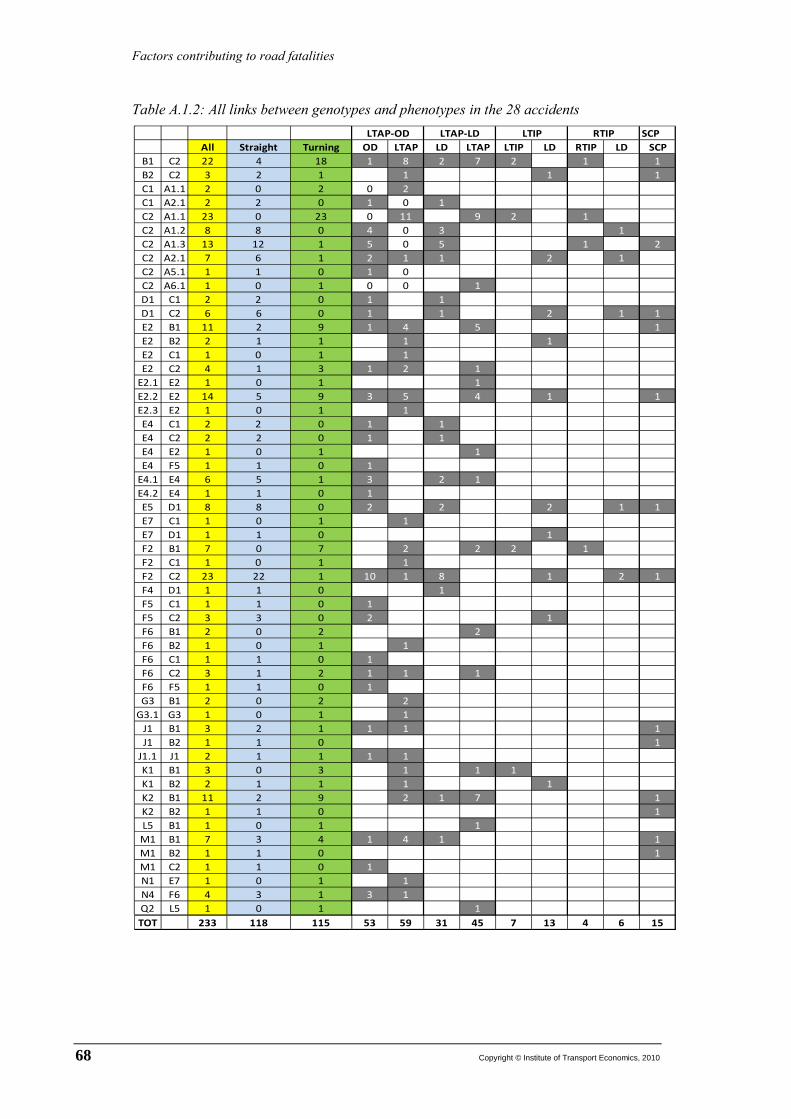
Factors contributing to road fatalities
68 Copyright © Institute of Transport Economics, 2010
Table A.1.2: All links between genotypes and phenotypes in the 28 accidents
SCPAll Straight Turning OD LTAP LD LTAP LTIP LD RTIP LD SCP
B1 C2 22 4 18 1 8 2 7 2 1 1B2 C2 3 2 1 1 1 1C1 A1.1 2 0 2 0 2C1 A2.1 2 2 0 1 0 1C2 A1.1 23 0 23 0 11 9 2 1C2 A1.2 8 8 0 4 0 3 1C2 A1.3 13 12 1 5 0 5 1 2C2 A2.1 7 6 1 2 1 1 2 1C2 A5.1 1 1 0 1 0C2 A6.1 1 0 1 0 0 1D1 C1 2 2 0 1 1D1 C2 6 6 0 1 1 2 1 1E2 B1 11 2 9 1 4 5 1E2 B2 2 1 1 1 1E2 C1 1 0 1 1E2 C2 4 1 3 1 2 1
E2.1 E2 1 0 1 1E2.2 E2 14 5 9 3 5 4 1 1E2.3 E2 1 0 1 1E4 C1 2 2 0 1 1E4 C2 2 2 0 1 1E4 E2 1 0 1 1E4 F5 1 1 0 1
E4.1 E4 6 5 1 3 2 1E4.2 E4 1 1 0 1E5 D1 8 8 0 2 2 2 1 1E7 C1 1 0 1 1E7 D1 1 1 0 1F2 B1 7 0 7 2 2 2 1F2 C1 1 0 1 1F2 C2 23 22 1 10 1 8 1 2 1F4 D1 1 1 0 1F5 C1 1 1 0 1F5 C2 3 3 0 2 1F6 B1 2 0 2 2F6 B2 1 0 1 1F6 C1 1 1 0 1F6 C2 3 1 2 1 1 1F6 F5 1 1 0 1G3 B1 2 0 2 2
G3.1 G3 1 0 1 1J1 B1 3 2 1 1 1 1J1 B2 1 1 0 1
J1.1 J1 2 1 1 1 1K1 B1 3 0 3 1 1 1K1 B2 2 1 1 1 1K2 B1 11 2 9 2 1 7 1K2 B2 1 1 0 1L5 B1 1 0 1 1M1 B1 7 3 4 1 4 1 1M1 B2 1 1 0 1M1 C2 1 1 0 1N1 E7 1 0 1 1N4 F6 4 3 1 3 1Q2 L5 1 0 1 1TOT 233 118 115 53 59 31 45 7 13 4 6 15
LTAP-OD LTAP-LD LTIP RTIP

Factors contributing to road fatalities
Copyright © Institute of Transport Economics, 2010 69
APPENDIX 2 All aggregations of intersection
crashes
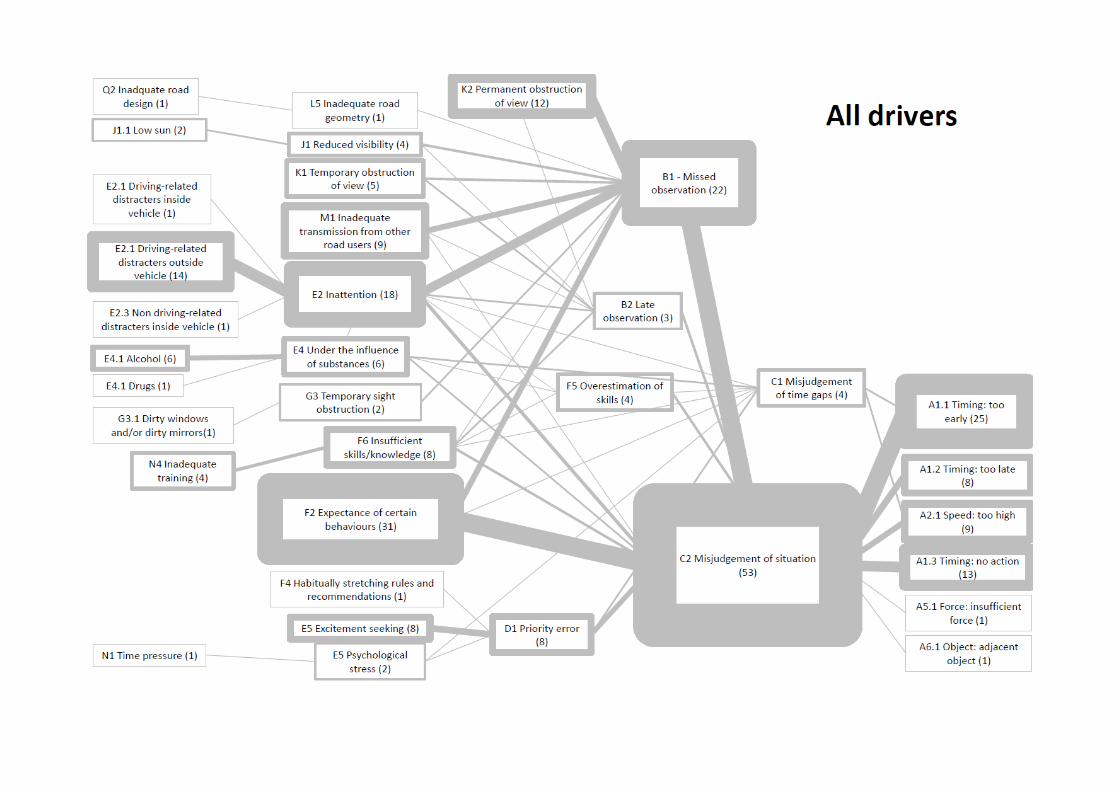
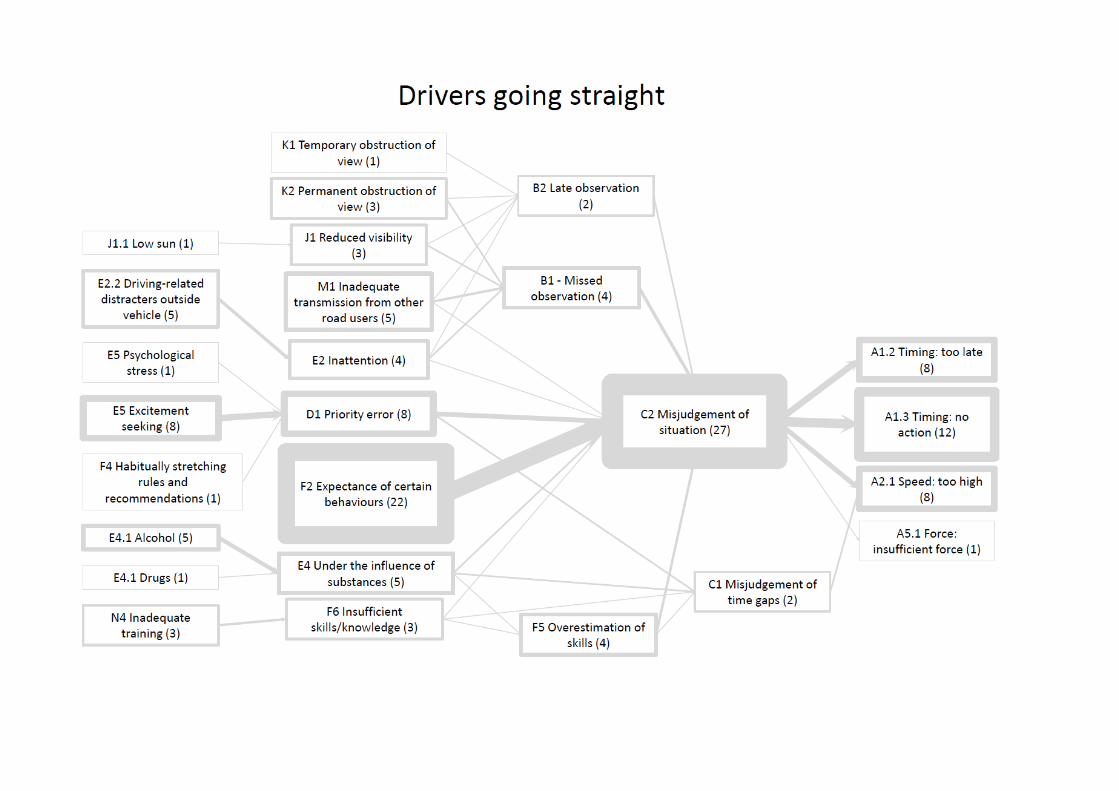
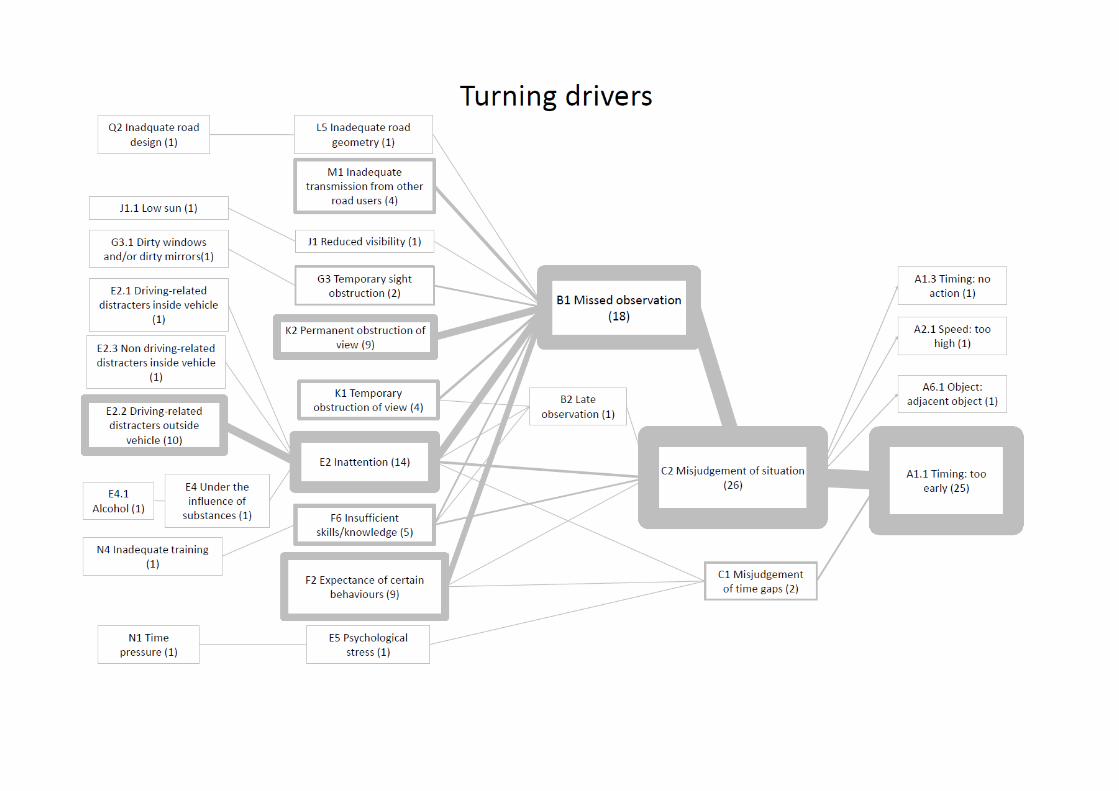

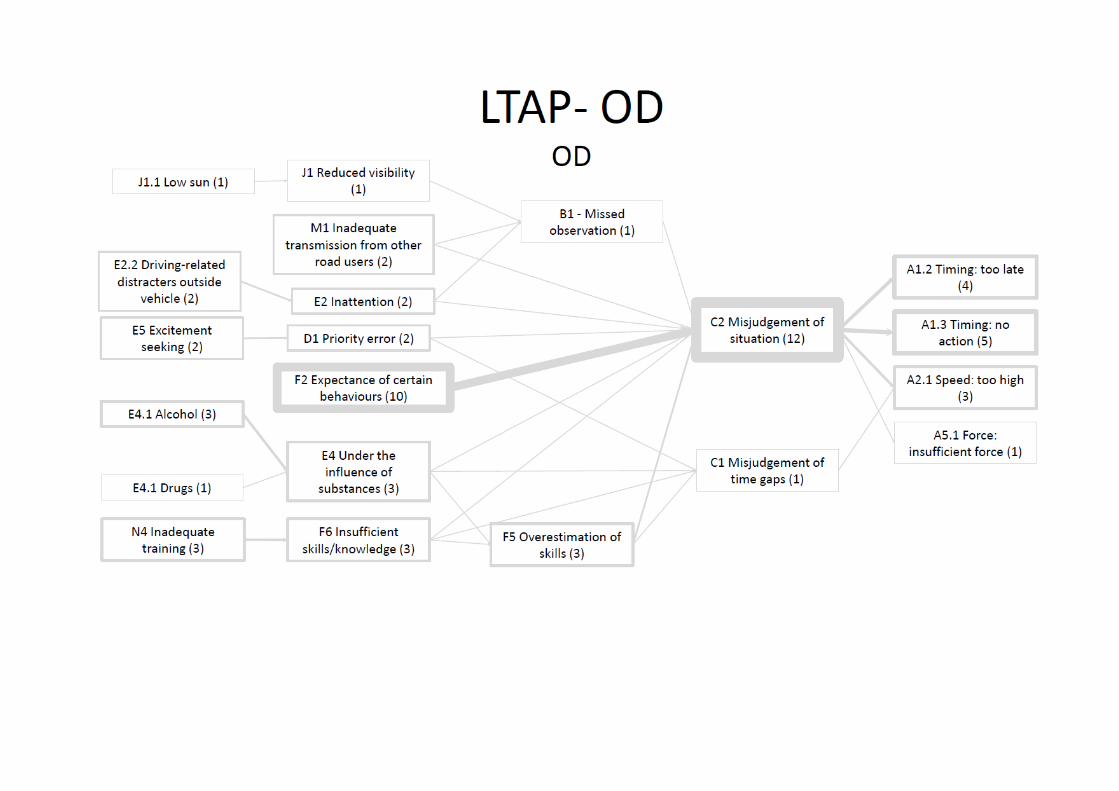
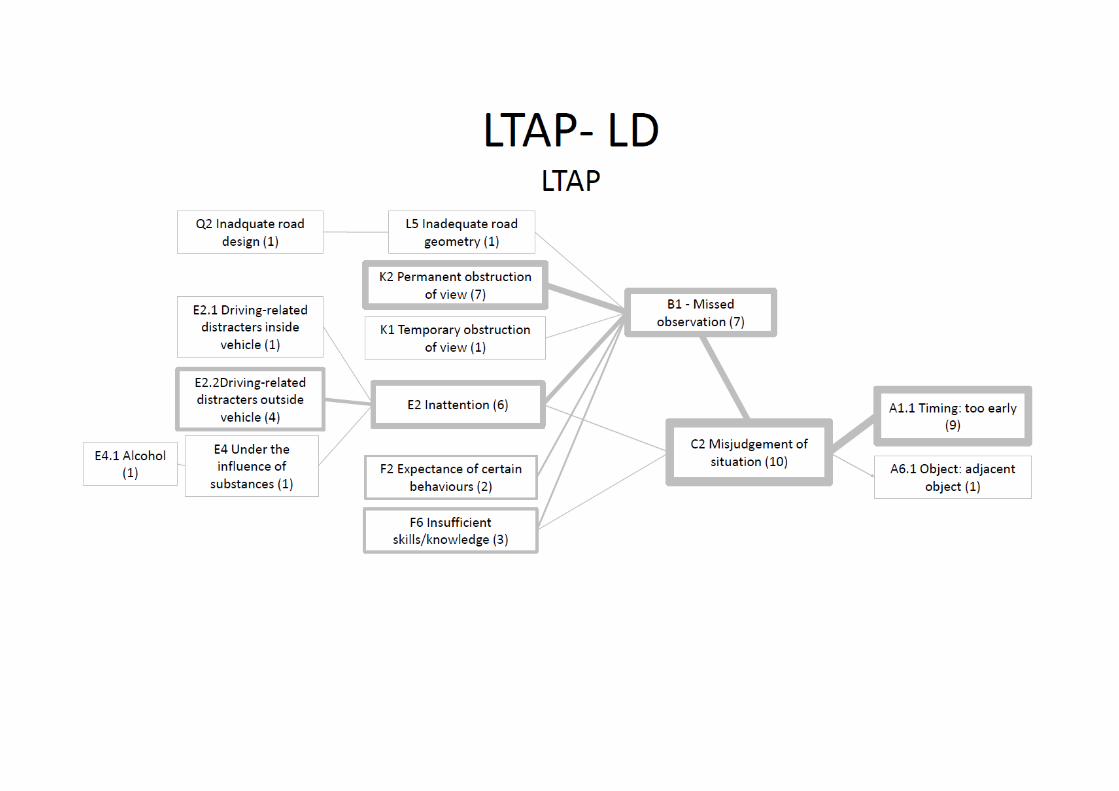


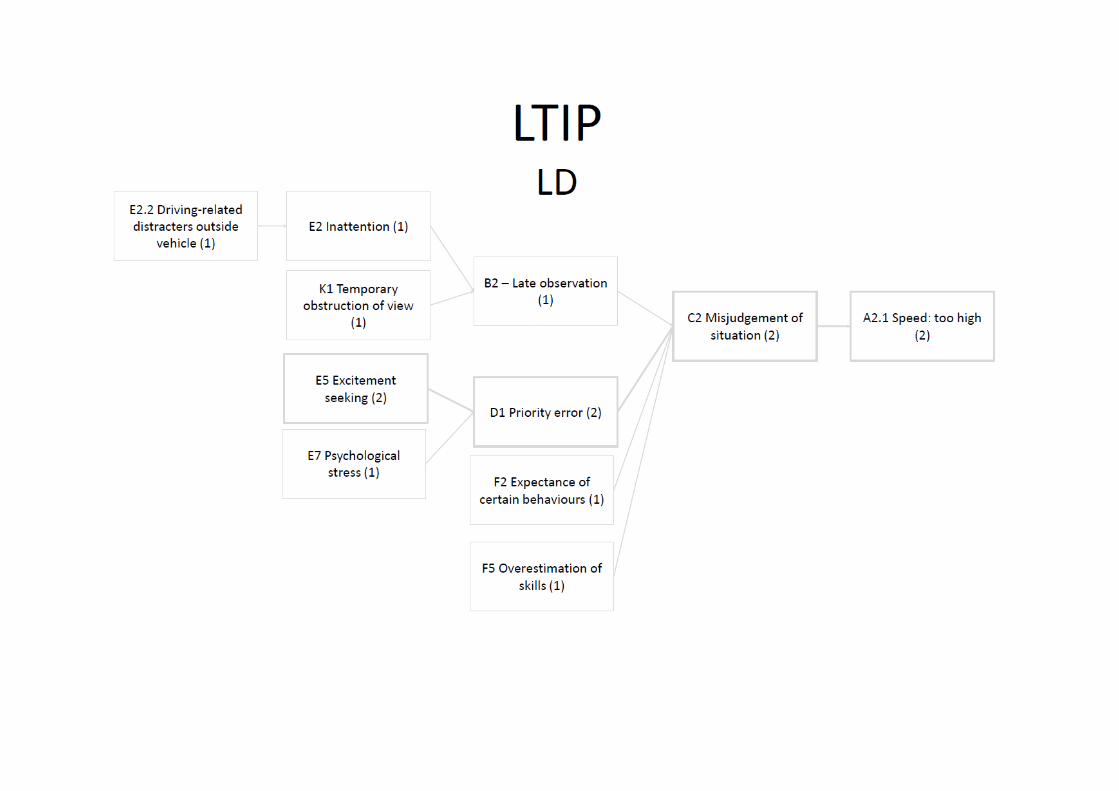
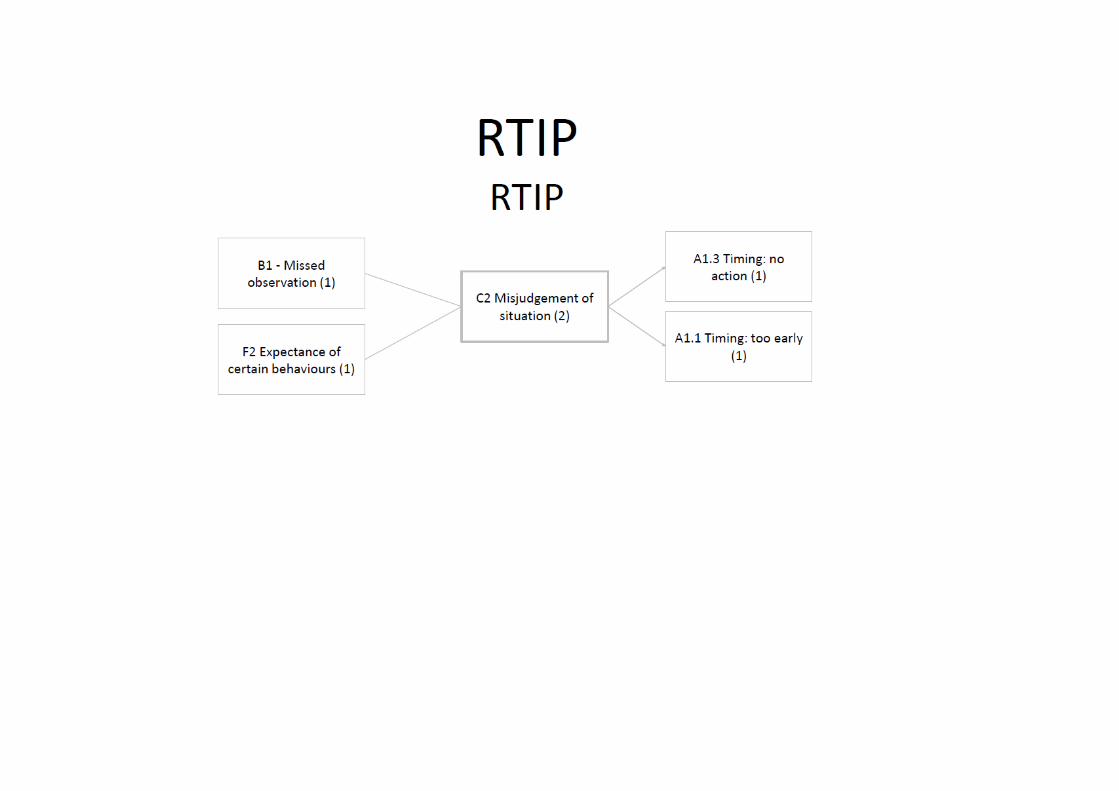

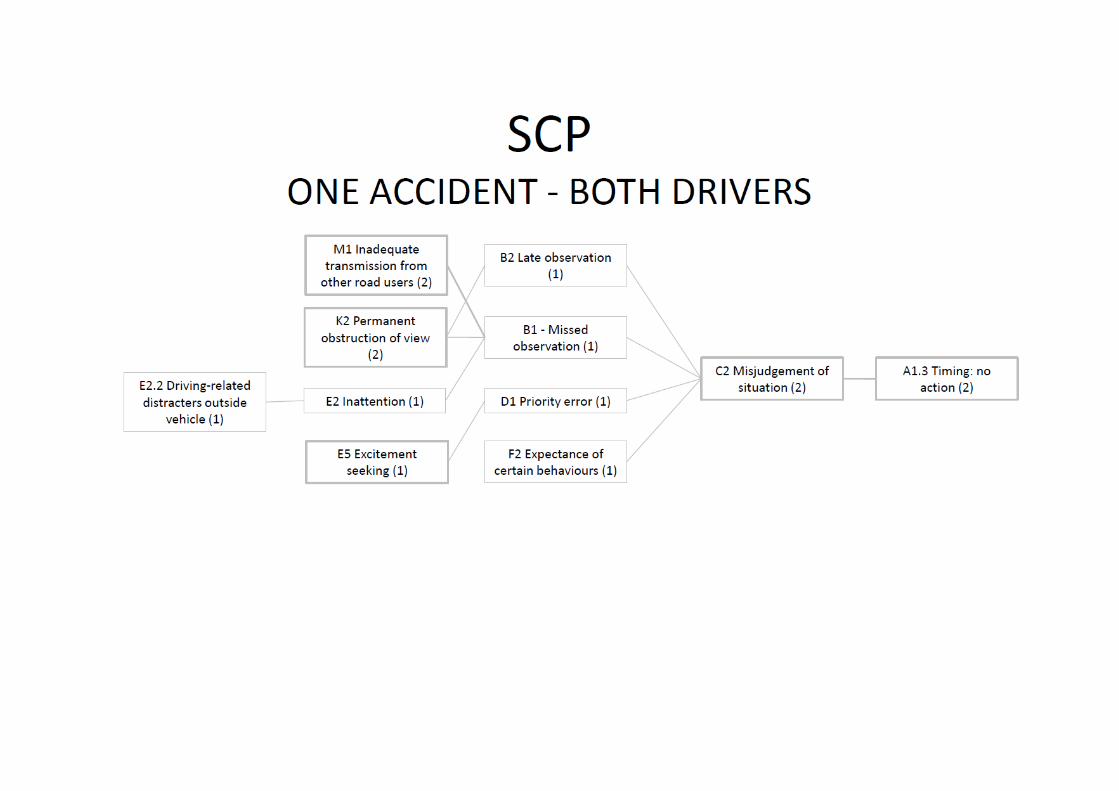

Factors contributing to road fatalities
82 Copyright © Institute of Transport Economics, 2010

Factors contributing to road fatalities
Copyright © Institute of Transport Economics, 2010 83
APPENDIX 3 DREAM charts for all intersection
crashes

1 LTAP-OD MC OD
A1.2 Timing: för sen handlingBörjar bromsa kraftigt när varebilen svänger, hjulen låser sig och MC välter
C2 Missbedömning av situationMc-føreren senket ikke farten frem mot krysset.
E2 OuppmärksamhetMc-føreren är inte helt koncentrerad på Varebilen
E2.2 Körrelateraddistraktion utanförfordonetMc-føreren har værtdistrahert avaktiviteter påfylkesvegen(trafikdirigering)
F2 Förväntning påandras beteendeMc-føreren har stoltpå at varebilenoverholdervikeplikten
1 LTAP-OD Varebil LTAP
A1.1 Timing: för tidig handlingVarebilen börjar svänga vänster innan MC har passerat
C2Missbedömning av situationenFöraren tror att han har en tillräcklig lucka att svänga i
B1 Missad observationFører av varebilen har trolig oversett motorsykkelen
E2OuppmärksamhetFöraren har inte full uppmärksamhet framåt
E2.2 Körrelaterad distraktion utanför fordonetVarebilførerens oppmerksomhet var rettet både mot aktivitetene på fylkesvegen og mot møtende trafikk.
G3 Tillfälliga inre sikthinder Avhengig av varebilens plassering mens han venter på å krysse vegen, kan det være en mulighet for at han ikke har sett møtende motorsykkel på grunn av diverse gjenstander som henger i speilet/står på dashbordet i siktsonen inne i bilen.
M1 Bristfällig kommunikation från andra trafikanterMC har automatisk tenning av kjørelys, trolig i bruk. Fører av varebilen kan dock ha tatt feil av motorsykkelens lys og lyset på bilen som kjørte bak. Bidragande till detta: Mørk sykkel og mørk-kledd fører mot mørk bakgrunn (mørk skog)
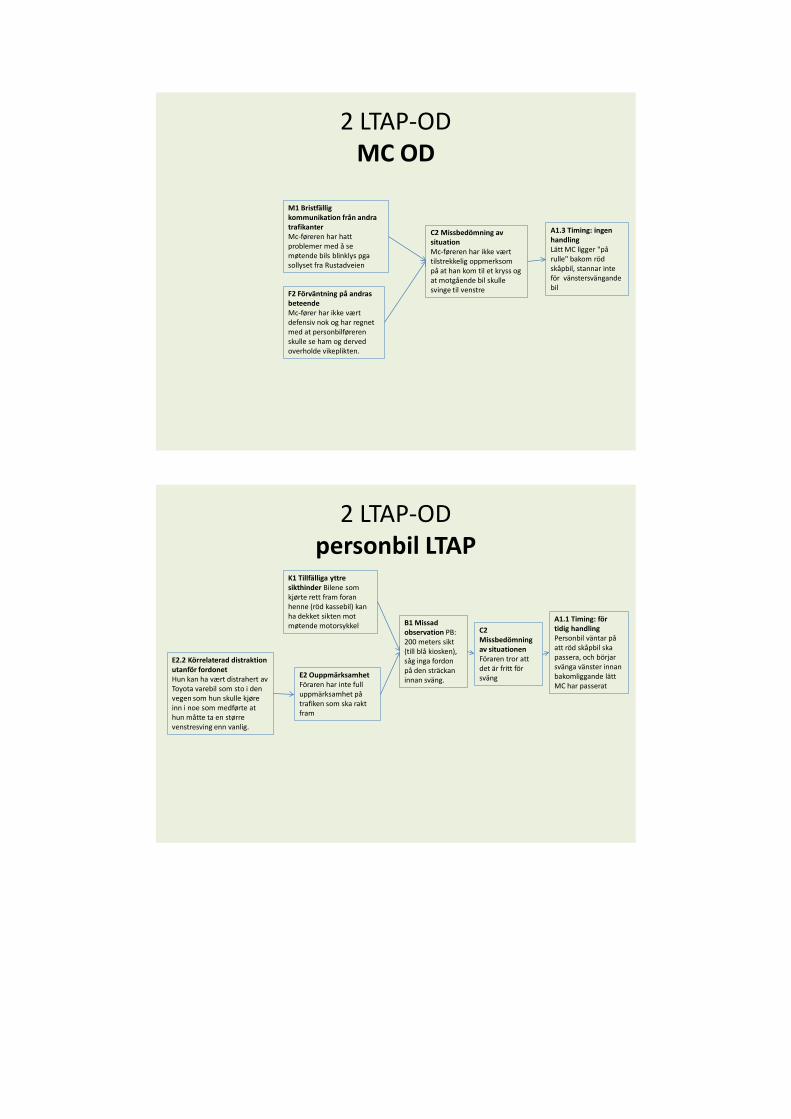
2 LTAP-OD MC OD
A1.3 Timing: ingen handling Lätt MC ligger "på rulle" bakom röd skåpbil, stannar inte för vänstersvängande bil
C2 Missbedömning av situation Mc-føreren har ikke vært tilstrekkelig oppmerksom på at han kom til et kryss og at motgående bil skulle svinge til venstre F2 Förväntning på andras
beteende Mc-fører har ikke vært defensiv nok og har regnet med at personbilføreren skulle se ham og derved overholde vikeplikten.
M1 Bristfällig kommunikation från andra trafikanter Mc-føreren har hatt problemer med å se møtende bils blinklys pga sollyset fra Rustadveien
2 LTAP-OD personbil LTAP
A1.1 Timing: för tidig handlingPersonbil väntar på att röd skåpbil ska passera, och börjar svänga vänster innan bakomliggande lätt MC har passerat
C2Missbedömning av situationenFöraren tror att det är fritt för sväng
B1 Missad observation PB: 200 meters sikt (till blå kiosken), såg inga fordon på den sträckan innan sväng.
K1 Tillfälliga yttre sikthinder Bilene som kjørte rett fram foran henne (röd kassebil) kan ha dekket sikten mot møtende motorsykkel
E2.2 Körrelaterad distraktion utanför fordonetHun kan ha vært distrahert av Toyota varebil som sto i den vegen som hun skulle kjøre inn i noe som medførte at hun måtte ta en større venstresving enn vanlig.
E2 Ouppmärksamhet Föraren har inte full uppmärksamhet på trafiken som ska rakt fram
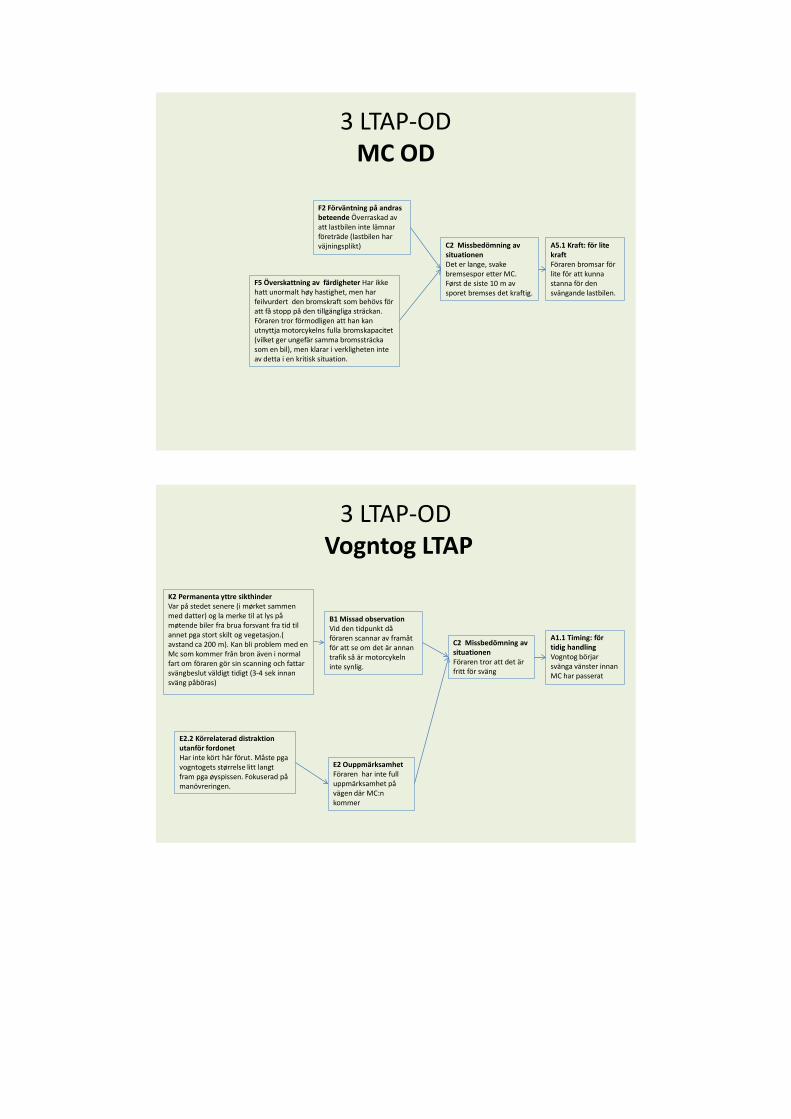
3 LTAP-OD MC OD
A5.1 Kraft: för lite kraft Föraren bromsar för lite för att kunna stanna för den svängande lastbilen.
C2 Missbedömning av situationenDet er lange, svake bremsespor etter MC. Først de siste 10 m av sporet bremses det kraftig.
F2 Förväntning på andras beteende Överraskad av att lastbilen inte lämnar företräde (lastbilen har väjningsplikt)
F5 Överskattning av färdigheter Har ikke hatt unormalt høy hastighet, men har feilvurdert den bromskraft som behövs för att få stopp på den tillgängliga sträckan. Föraren tror förmodligen att han kan utnyttja motorcykelns fulla bromskapacitet (vilket ger ungefär samma bromssträcka som en bil), men klarar i verkligheten inte av detta i en kritisk situation.
3 LTAP-OD Vogntog LTAP
A1.1 Timing: för tidig handling Vogntog börjar svänga vänster innan MC har passerat
C2 Missbedömning av situationenFöraren tror att det är fritt för sväng
B1 Missad observation Vid den tidpunkt då föraren scannar av framåt för att se om det är annan trafik så är motorcykeln inte synlig.
K2 Permanenta yttre sikthinder Var på stedet senere (i mørket sammen med datter) og la merke til at lys på møtende biler fra brua forsvant fra tid til annet pga stort skilt og vegetasjon.( avstand ca 200 m). Kan bli problem med en Mc som kommer från bron även i normal fart om föraren gör sin scanning och fattar svängbeslut väldigt tidigt (3-4 sek innan sväng påböras)
E2.2 Körrelaterad distraktion utanför fordonetHar inte kört här förut. Måste pga vogntogets størrelse litt langt fram pga øyspissen. Fokuserad på manövreringen.
E2 Ouppmärksamhet Föraren har inte full uppmärksamhet på vägen där MC:n kommer
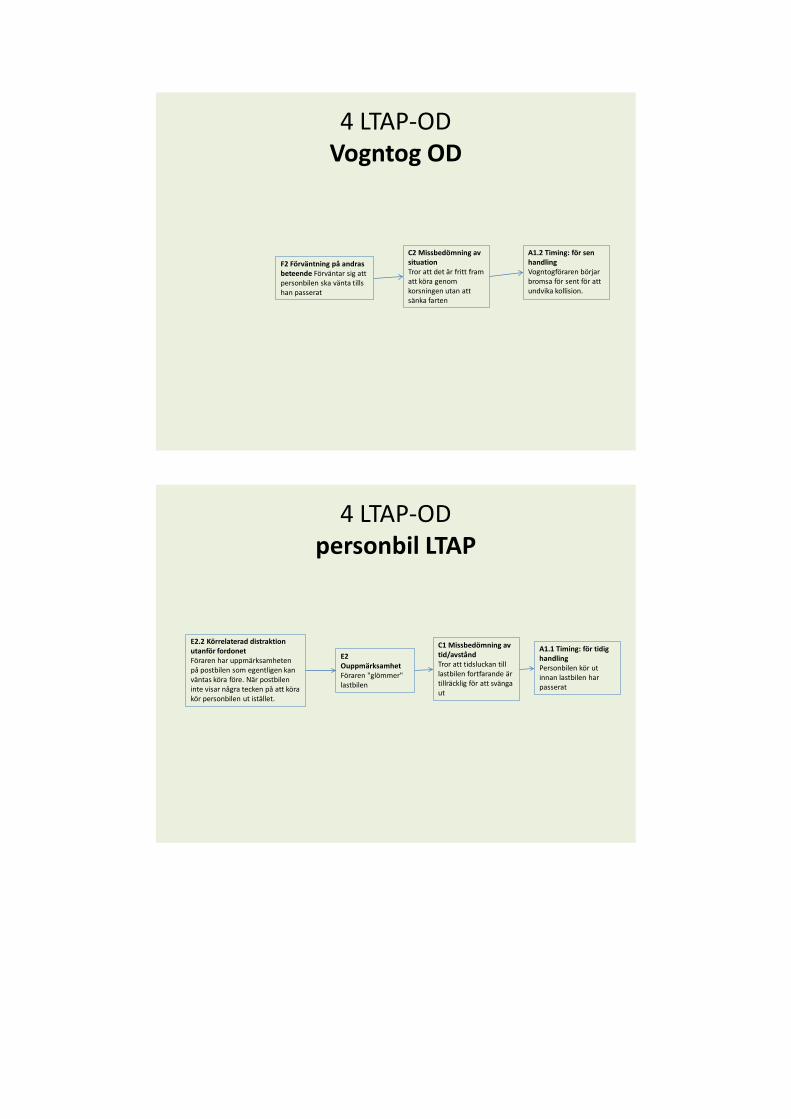
4 LTAP-OD Vogntog OD
A1.2 Timing: för sen handling Vogntogföraren börjar bromsa för sent för att undvika kollision.
C2 Missbedömning av situation Tror att det är fritt fram att köra genom korsningen utan att sänka farten
F2 Förväntning på andras beteende Förväntar sig att personbilen ska vänta tills han passerat
4 LTAP-OD personbil LTAP
A1.1 Timing: för tidig handling Personbilen kör ut innan lastbilen har passerat
C1 Missbedömning av tid/avstånd Tror att tidsluckan till lastbilen fortfarande är tillräcklig för att svänga ut
E2 Ouppmärksamhet Föraren "glömmer" lastbilen
E2.2 Körrelaterad distraktion utanför fordonet Föraren har uppmärksamheten på postbilen som egentligen kan väntas köra före. När postbilen inte visar några tecken på att köra kör personbilen ut istället.
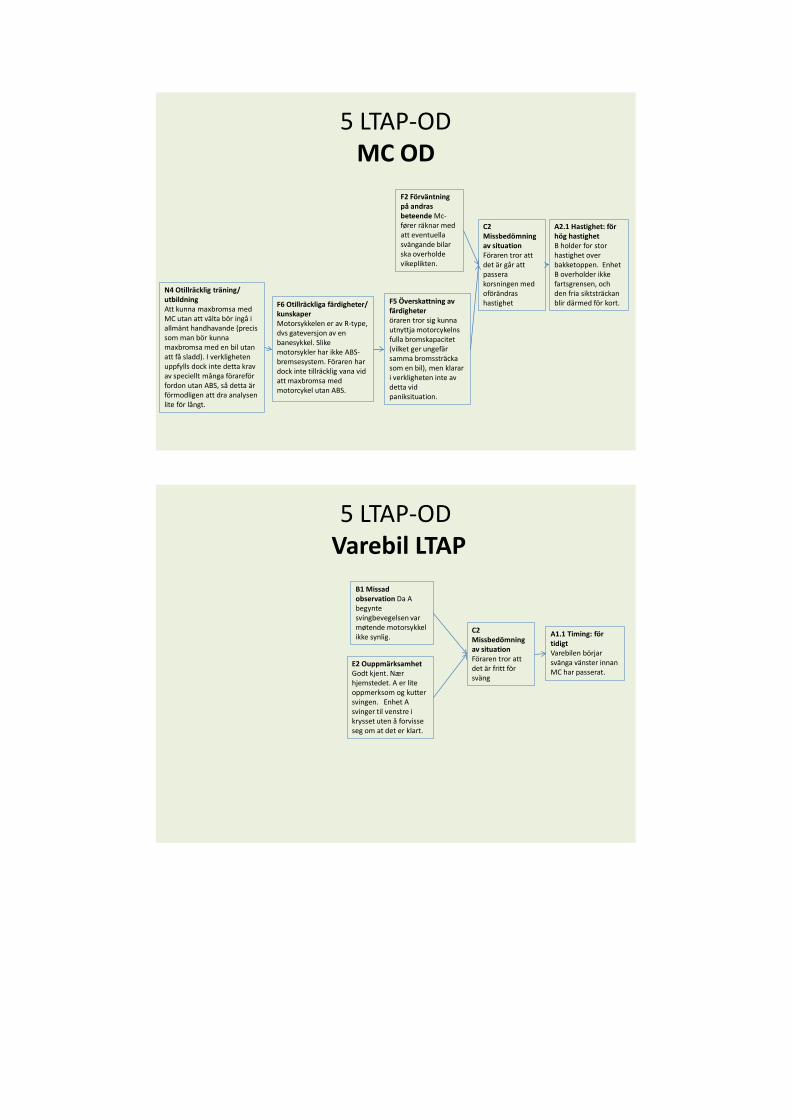
5 LTAP-OD MC OD
A2.1 Hastighet: för hög hastighet B holder for stor hastighet over bakketoppen. Enhet B overholder ikke fartsgrensen, och den fria siktsträckan blir därmed för kort.
C2 Missbedömning av situation Föraren tror att det är går att passera korsningen med oförändras hastighet
F2 Förväntning på andras beteende Mc-fører räknar med att eventuella svängande bilar ska overholde vikeplikten.
N4 Otillräcklig träning/ utbildning Att kunna maxbromsa med MC utan att välta bör ingå i allmänt handhavande (precis som man bör kunna maxbromsa med en bil utan att få sladd). I verkligheten uppfylls dock inte detta krav av speciellt många förareför fordon utan ABS, så detta är förmodligen att dra analysen lite för långt.
F6 Otillräckliga färdigheter/ kunskaper Motorsykkelen er av R-type, dvs gateversjon av en banesykkel. Slike motorsykler har ikke ABS-bremsesystem. Föraren har dock inte tillräcklig vana vid att maxbromsa med motorcykel utan ABS.
F5 Överskattning av färdigheter öraren tror sig kunna utnyttja motorcykelns fulla bromskapacitet (vilket ger ungefär samma bromssträcka som en bil), men klarar i verkligheten inte av detta vid paniksituation.
5 LTAP-OD Varebil LTAP
A1.1 Timing: för tidigt Varebilen börjar svänga vänster innan MC har passerat.
C2 Missbedömning av situation Föraren tror att det är fritt för sväng
B1 Missad observation Da A begynte svingbevegelsen var møtende motorsykkel ikke synlig.
E2 Ouppmärksamhet Godt kjent. Nær hjemstedet. A er lite oppmerksom og kutter svingen. Enhet A svinger til venstre i krysset uten å forvisse seg om at det er klart.

6 LTAP-OD minibuss OD
A1.2 Timing: för sen handling Minibussföraren börjar bromsa för sent för att undvika kollision.
C2 Missbedömning av situation Föraren tror att det är fritt fram att köra genom korsningen utan att sänka farten
F2 Förväntning på andras beteende Sjåføren av minibussen var helt sikker på at den røde personbilen ville overholde vikeplikten
6 LTAP-OD personbil LTAP
A1.1 Timing: för tidigt Personbilen börjar svänga vänster innan minibussen har passerat
C2 Missbedömning av situation Föraren gör ingen extra kontroll, tror att tidsluckan till minibussen fortfarande är tillräcklig för att hinna svänga innan den kommer fram?Kombinasjon av fart og avstand til møtende trafikk, sett i forhold til eldre personers tidsbruk for selve handling?
E2 Ouppmärksamhet Föraren "glömmer" minibussen som är på väg mot korsningen
E2.2 Körrelaterad distraktion utanför fordonet Efter en första kontroll av att avståndet till minibussen är tillräckligt för hinna svänga har föraren uppmärksamheten riktad på Mercedesen som står stilla och ska svänga vänster ut på samma väg som personbilen kommer ifrån. Kan ha vært opptatt av ventende kjøretøy til venstre i vikepliktsituasjon
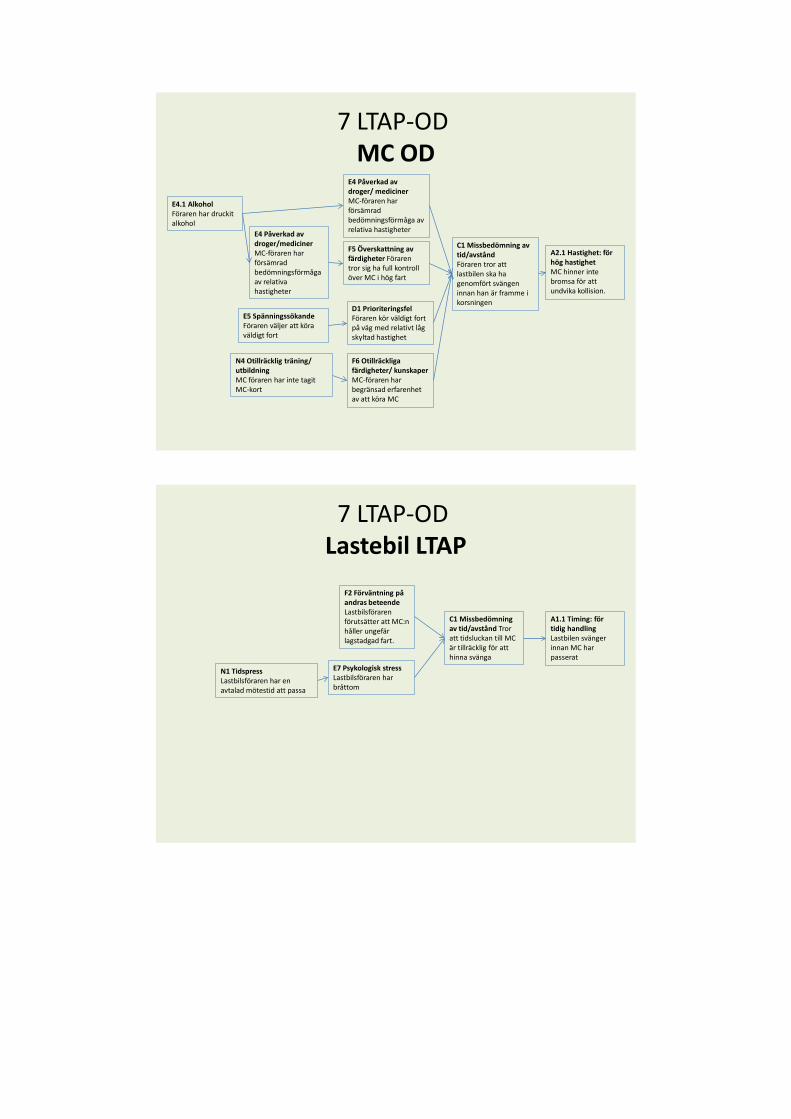
7 LTAP-ODMC OD
A2.1 Hastighet: för hög hastighet MC hinner inte bromsa för att undvika kollision.
C1 Missbedömning av tid/avstånd Föraren tror att lastbilen ska ha genomfört svängen innan han är framme i korsningen
E4 Påverkad av droger/ mediciner MC-föraren har försämrad bedömningsförmåga av relativa hastigheter
E4.1 Alkohol Föraren har druckit alkohol
E4 Påverkad av droger/mediciner MC-föraren har försämrad bedömningsförmåga av relativa hastigheter
F5 Överskattning av färdigheter Föraren tror sig ha full kontroll över MC i hög fart
E5 Spänningssökande Föraren väljer att köra väldigt fort
D1 Prioriteringsfel Föraren kör väldigt fort på väg med relativt låg skyltad hastighet
N4 Otillräcklig träning/ utbildning MC föraren har inte tagit MC-kort
F6 Otillräckliga färdigheter/ kunskaper MC-föraren har begränsad erfarenhet av att köra MC
7 LTAP-ODLastebil LTAP
A1.1 Timing: för tidig handling Lastbilen svänger innan MC har passerat
C1 Missbedömning av tid/avstånd Tror att tidsluckan till MC är tillräcklig för att hinna svänga
F2 Förväntning på andras beteendeLastbilsföraren förutsätter att MC:n håller ungefär lagstadgad fart.
N1 TidspressLastbilsföraren har en avtalad mötestid att passa
E7 Psykologisk stress Lastbilsföraren har bråttom
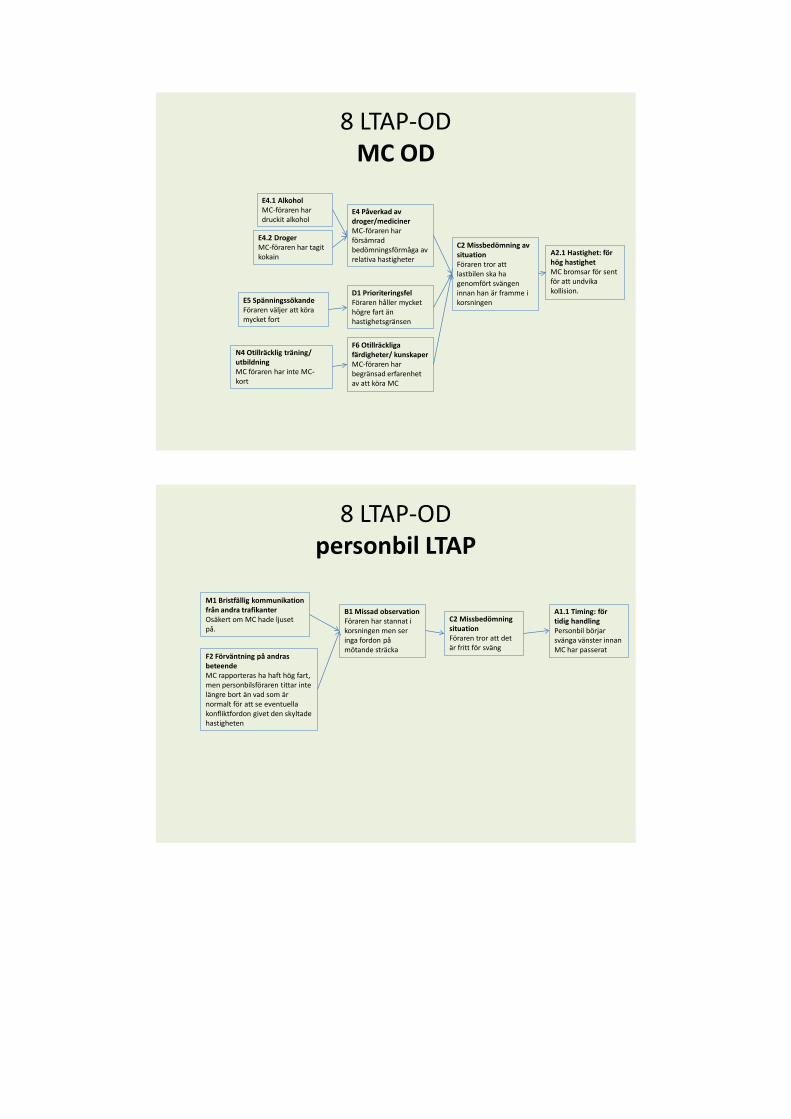
8 LTAP-OD MC OD
A2.1 Hastighet: för hög hastighet MC bromsar för sent för att undvika kollision.
C2 Missbedömning av situation Föraren tror att lastbilen ska ha genomfört svängen innan han är framme i korsningen
E4 Påverkad av droger/mediciner MC-föraren har försämrad bedömningsförmåga av relativa hastigheter
E4.1 Alkohol MC-föraren har druckit alkohol
E4.2 DrogerMC-föraren har tagit kokain
E5 Spänningssökande Föraren väljer att köra mycket fort
D1 Prioriteringsfel Föraren håller mycket högre fart än hastighetsgränsen
N4 Otillräcklig träning/ utbildning MC föraren har inte MC-kort
F6 Otillräckliga färdigheter/ kunskaper MC-föraren har begränsad erfarenhet av att köra MC
8 LTAP-OD personbil LTAP
A1.1 Timing: för tidig handling Personbil börjar svänga vänster innan MC har passerat
C2 Missbedömning situationFöraren tror att det är fritt för sväng
F2 Förväntning på andras beteende MC rapporteras ha haft hög fart, men personbilsföraren tittar inte längre bort än vad som är normalt för att se eventuella konfliktfordon givet den skyltade hastigheten
M1 Bristfällig kommunikation från andra trafikanter Osäkert om MC hade ljuset på.
B1 Missad observation Föraren har stannat i korsningen men ser inga fordon på mötande sträcka
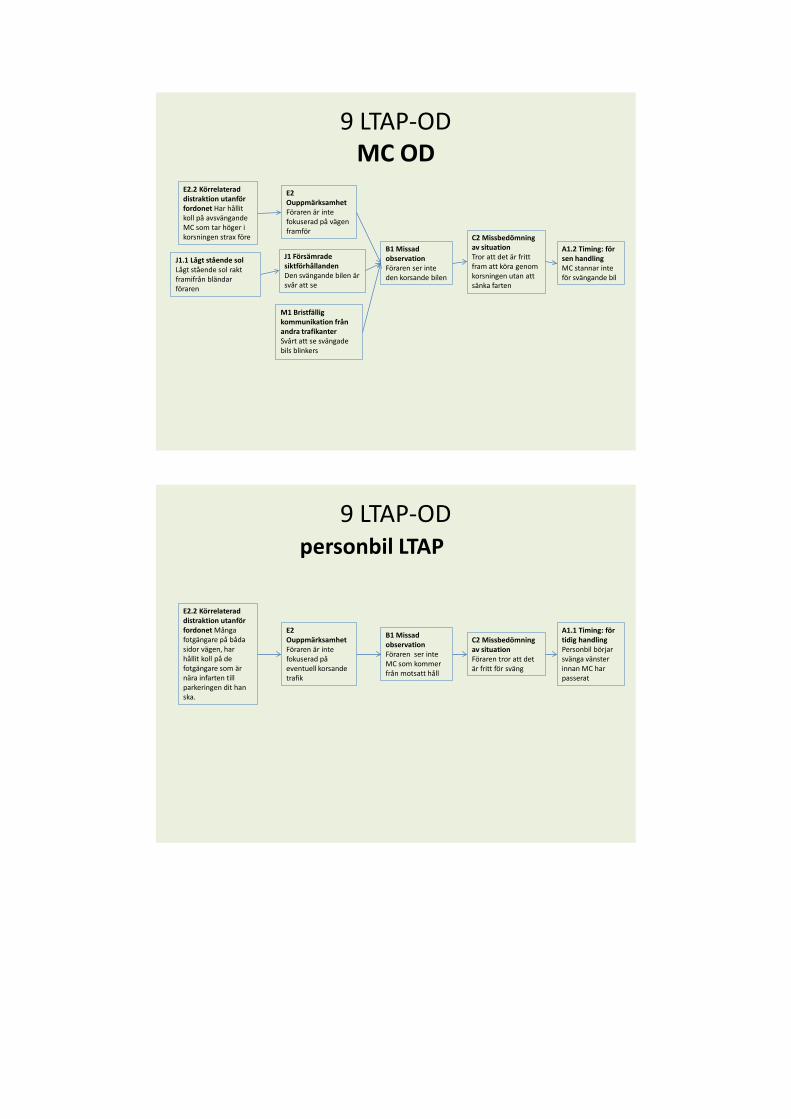
9 LTAP-OD MC OD
A1.2 Timing: för sen handling MC stannar inte för svängande bil
C2 Missbedömning av situation Tror att det är fritt fram att köra genom korsningen utan att sänka farten
B1 Missad observation Föraren ser inte den korsande bilen
E2 Ouppmärksamhet Föraren är inte fokuserad på vägen framför
E2.2 Körrelaterad distraktion utanför fordonet Har hållit koll på avsvängande MC som tar höger i korsningen strax före
J1.1 Lågt stående sol Lågt stående sol rakt framifrån bländar föraren
J1 Försämrade siktförhållanden Den svängande bilen är svår att se
M1 Bristfällig kommunikation från andra trafikanter Svårt att se svängade bils blinkers
9 LTAP-OD personbil LTAP
A1.1 Timing: för tidig handling Personbil börjar svänga vänster innan MC har passerat
C2 Missbedömning av situation Föraren tror att det är fritt för sväng
B1 Missad observation Föraren ser inte MC som kommer från motsatt håll
E2 Ouppmärksamhet Föraren är inte fokuserad på eventuell korsande trafik
E2.2 Körrelaterad distraktion utanför fordonet Många fotgängare på båda sidor vägen, har hållit koll på de fotgängare som är nära infarten till parkeringen dit han ska.
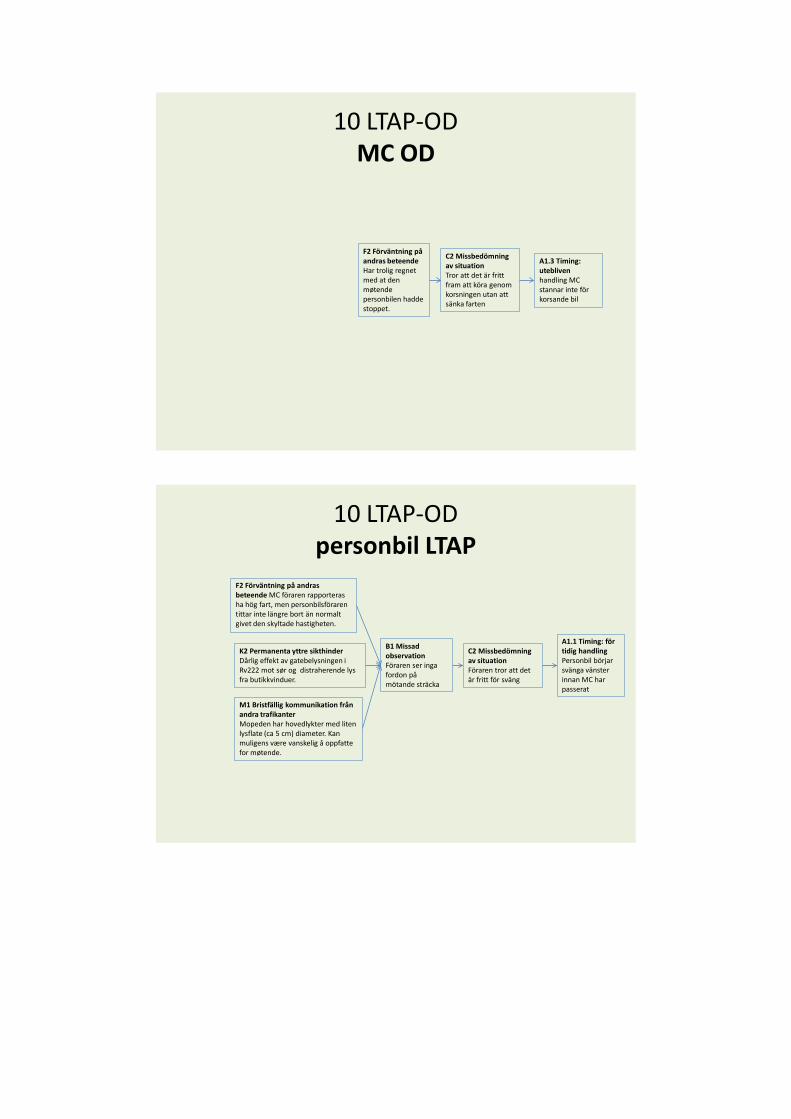
10 LTAP-OD MC OD
A1.3 Timing: utebliven handling MC stannar inte för korsande bil
C2 Missbedömning av situation Tror att det är fritt fram att köra genom korsningen utan att sänka farten
F2 Förväntning på andras beteende Har trolig regnet med at den møtende personbilen hadde stoppet.
10 LTAP-OD personbil LTAP
A1.1 Timing: för tidig handling Personbil börjar svänga vänster innan MC har passerat
C2 Missbedömning av situation Föraren tror att det är fritt för sväng
B1 Missad observation Föraren ser inga fordon på mötande sträcka
F2 Förväntning på andras beteende MC föraren rapporteras ha hög fart, men personbilsföraren tittar inte längre bort än normalt givet den skyltade hastigheten.
K2 Permanenta yttre sikthinder Dårlig effekt av gatebelysningen i Rv222 mot sør og distraherende lys fra butikkvinduer.
M1 Bristfällig kommunikation från andra trafikanter Mopeden har hovedlykter med liten lysflate (ca 5 cm) diameter. Kan muligens være vanskelig å oppfatte for møtende.
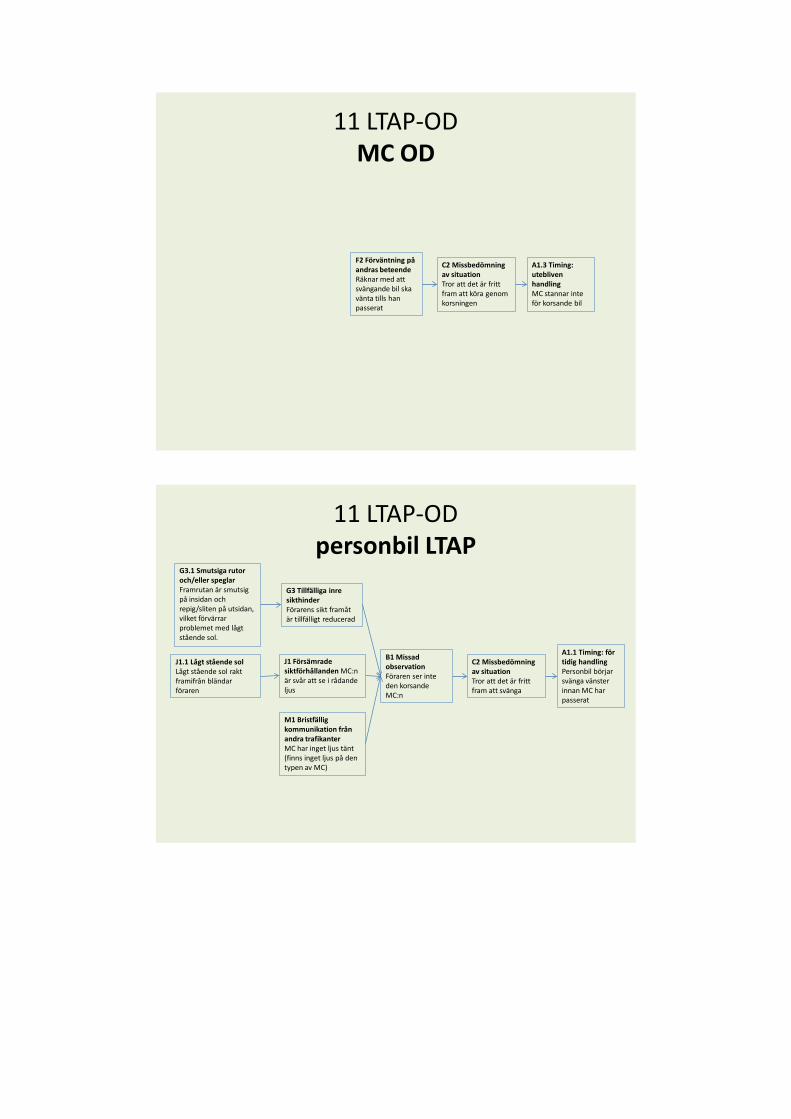
11 LTAP-OD MC OD
A1.3 Timing: utebliven handling MC stannar inte för korsande bil
C2 Missbedömning av situation Tror att det är fritt fram att köra genom korsningen
F2 Förväntning på andras beteende Räknar med att svängande bil ska vänta tills han passerat
11 LTAP-OD personbil LTAP
A1.1 Timing: för tidig handling Personbil börjar svänga vänster innan MC har passerat
C2 Missbedömning av situation Tror att det är fritt fram att svänga
B1 Missad observation Föraren ser inte den korsande MC:n
G3 Tillfälliga inre sikthinder Förarens sikt framåt är tillfälligt reducerad
G3.1 Smutsiga rutor och/eller speglar Framrutan är smutsig på insidan och repig/sliten på utsidan, vilket förvärrar problemet med lågt stående sol.
J1.1 Lågt stående sol Lågt stående sol rakt framifrån bländar föraren
J1 Försämrade siktförhållanden MC:n är svår att se i rådande ljus
M1 Bristfällig kommunikation från andra trafikanter MC har inget ljus tänt (finns inget ljus på den typen av MC)

12 LTAP-OD personbil LTAP
A1.1 Timing: för tidig handling Personbil börjar svänga vänster innan MC har passerat
C2 Missbedömning av situation Föraren tror att det är fritt för sväng
F6 Otillräckliga färdigheter/ kunskaper Föraren tror att MC ska stanna för honom när han svänger vänster, trots att det är han som egentligen har väjningsplikt.
N4 Otillräcklig träning/ utbildning Föraren har bara haft körkort i 11 dagar, och kuggat 3 gånger innan han tog det. Vissa moment i utbildningen måste dock ändå ha gått honom förbi.
12 LTAP-OD MC OD
A1.3 Timing: utebliven handling MC stannar inte för korsande bil
C2 Missbedömning av situation Tror att det är fritt fram att köra genom korsningen
F2 Förväntning på andras beteende Räknar med att svängande bil ska vänta tills han passerat
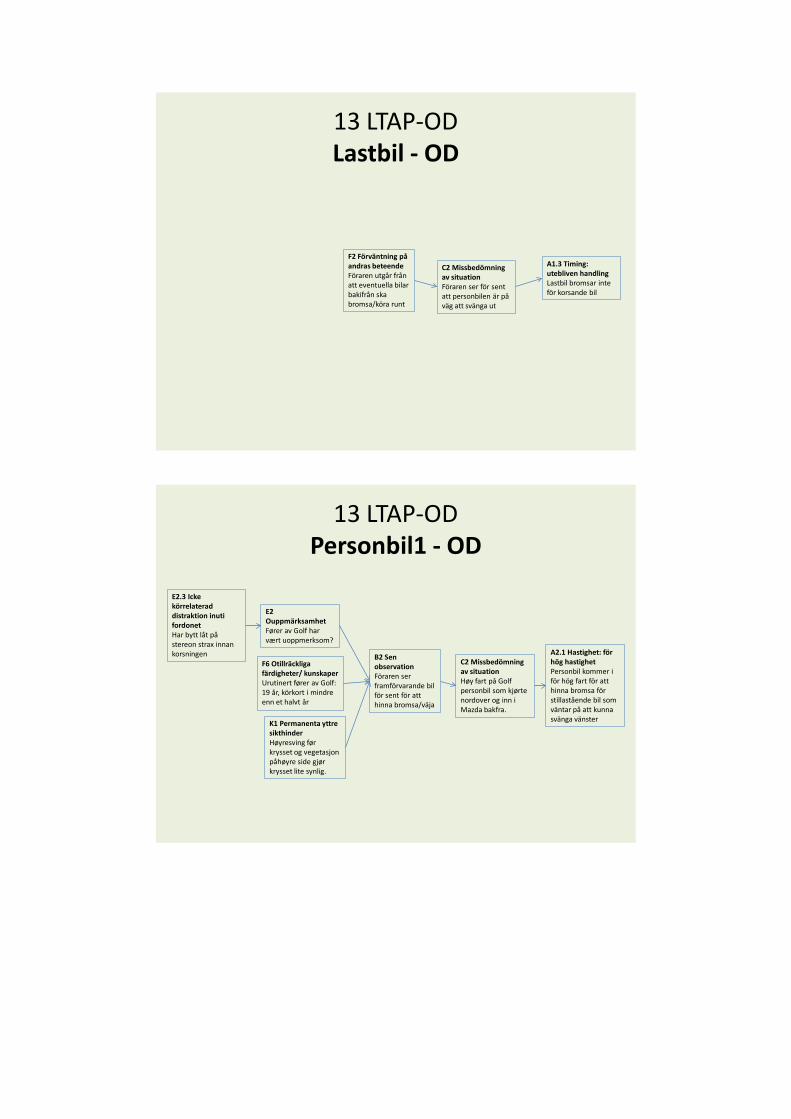
13 LTAP-ODLastbil - OD
A1.3 Timing: utebliven handling Lastbil bromsar inte för korsande bil
C2 Missbedömning av situation Föraren ser för sent att personbilen är på väg att svänga ut
F2 Förväntning på andras beteende Föraren utgår från att eventuella bilar bakifrån ska bromsa/köra runt
13 LTAP-ODPersonbil1 - OD
A2.1 Hastighet: för hög hastighet Personbil kommer i för hög fart för att hinna bromsa för stillastående bil som väntar på att kunna svänga vänster
C2 Missbedömning av situation Høy fart på Golf personbil som kjørte nordover og inn i Mazda bakfra.
B2 Sen observation Föraren ser framförvarande bil för sent för att hinna bromsa/väja
K1 Permanenta yttre sikthinder Høyresving før krysset og vegetasjon påhøyre side gjør krysset lite synlig.
E2.3 Icke körrelaterad distraktion inuti fordonet Har bytt låt på stereon strax innan korsningen
E2 Ouppmärksamhet Fører av Golf har vært uoppmerksom?
F6 Otillräckliga färdigheter/ kunskaper Urutinert fører av Golf: 19 år, körkort i mindre enn et halvt år
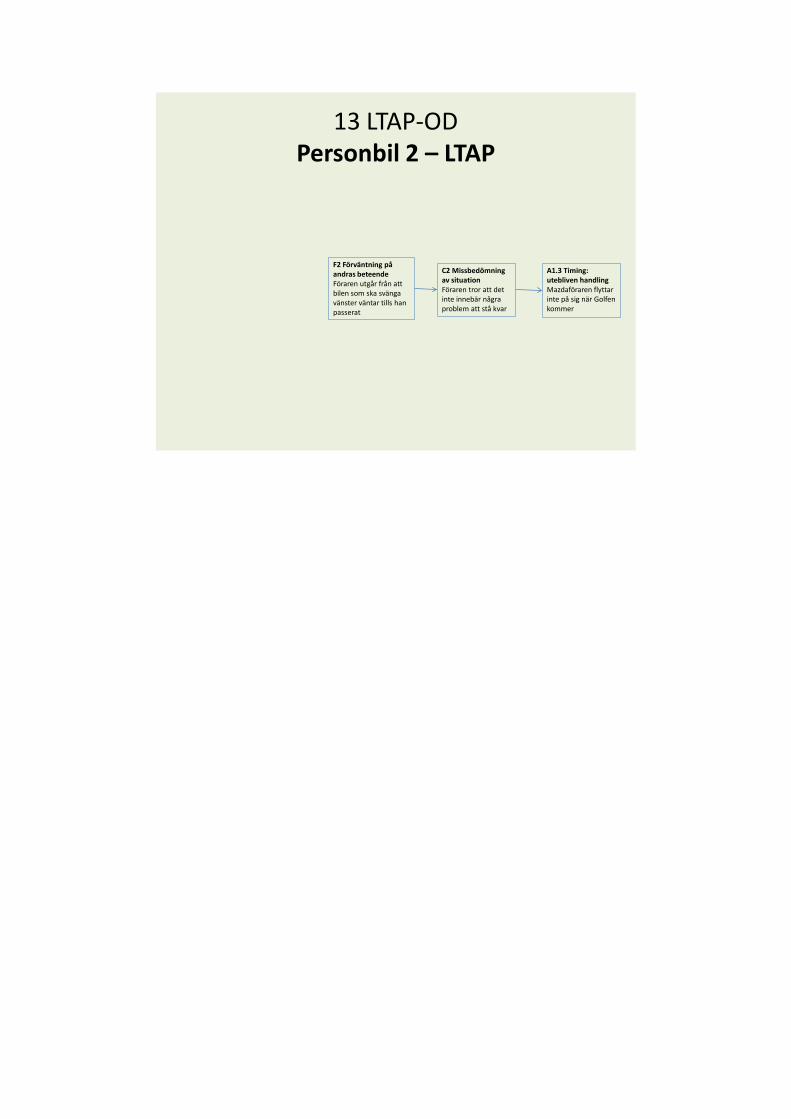
13 LTAP-ODPersonbil 2 – LTAP
A1.3 Timing: utebliven handling Mazdaföraren flyttar inte på sig när Golfen kommer
C2 Missbedömning av situation Föraren tror att det inte innebär några problem att stå kvar
F2 Förväntning på andras beteende Föraren utgår från att bilen som ska svänga vänster väntar tills han passerat
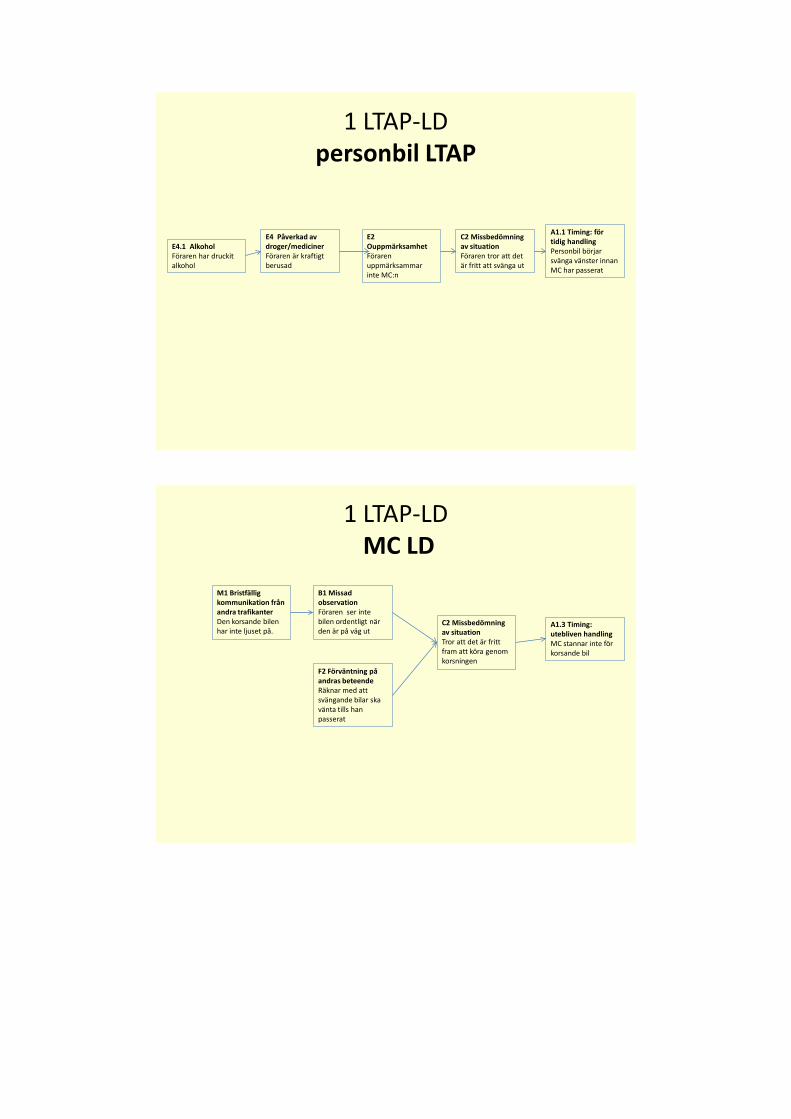
1 LTAP-LD personbil LTAP
A1.1 Timing: för tidig handling Personbil börjar svänga vänster innan MC har passerat
C2 Missbedömning av situation Föraren tror att det är fritt att svänga ut
E2 OuppmärksamhetFöraren uppmärksammar inte MC:n
E4.1 AlkoholFöraren har druckit alkohol
E4 Påverkad av droger/mediciner Föraren är kraftigt berusad
1 LTAP-LD MC LD
A1.3 Timing: utebliven handling MC stannar inte för korsande bil
C2 Missbedömning av situation Tror att det är fritt fram att köra genom korsningen
B1 Missad observation Föraren ser inte bilen ordentligt när den är på väg ut
F2 Förväntning på andras beteende Räknar med att svängande bilar ska vänta tills han passerat
M1 Bristfällig kommunikation från andra trafikanter Den korsande bilen har inte ljuset på.
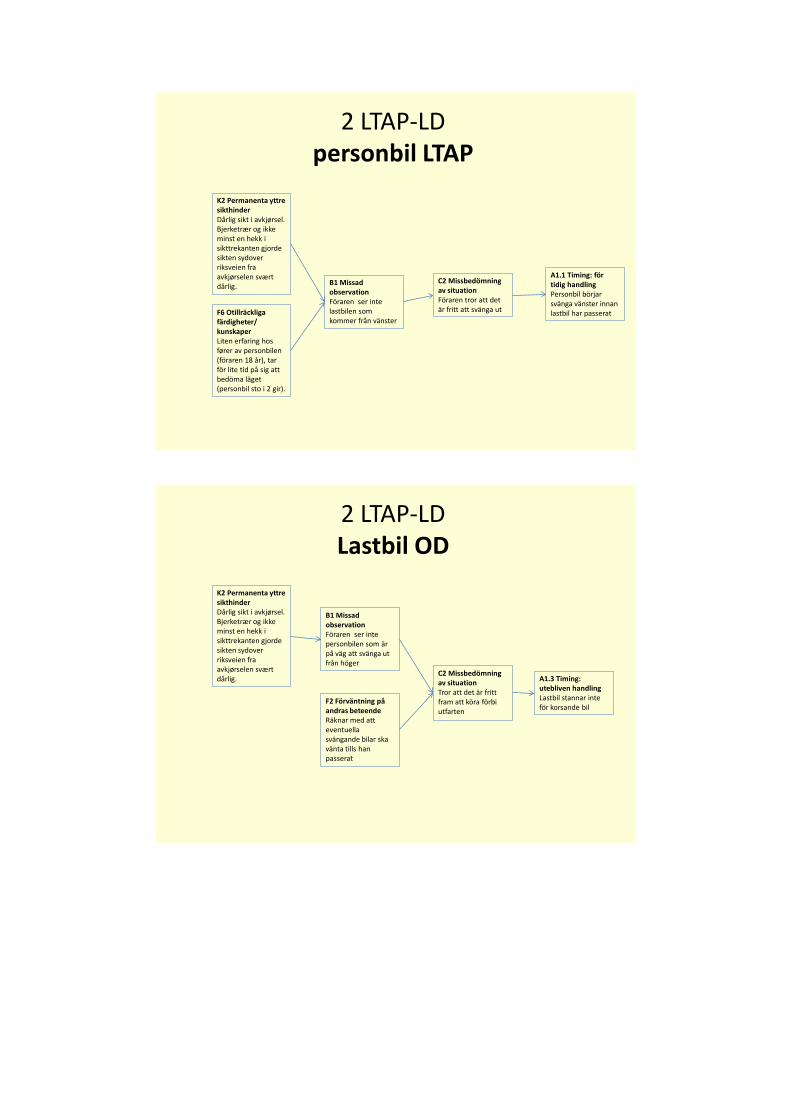
2 LTAP-LD personbil LTAP
A1.1 Timing: för tidig handling Personbil börjar svänga vänster innan lastbil har passerat
C2 Missbedömning av situation Föraren tror att det är fritt att svänga ut
B1 Missad observation Föraren ser inte lastbilen som kommer från vänster
F6 Otillräckliga färdigheter/ kunskaper Liten erfaring hos fører av personbilen (föraren 18 år), tar för lite tid på sig att bedöma läget (personbil sto i 2 gir).
K2 Permanenta yttre sikthinder Dårlig sikt i avkjørsel. Bjerketrær og ikke minst en hekk i sikttrekanten gjorde sikten sydover riksveien fra avkjørselen svært dårlig.
2 LTAP-LD Lastbil OD
A1.3 Timing: utebliven handling Lastbil stannar inte för korsande bil
C2 Missbedömning av situation Tror att det är fritt fram att köra förbi utfarten
B1 Missad observation Föraren ser inte personbilen som är på väg att svänga ut från höger
F2 Förväntning på andras beteende Räknar med att eventuella svängande bilar ska vänta tills han passerat
K2 Permanenta yttre sikthinder Dårlig sikt i avkjørsel. Bjerketrær og ikke minst en hekk i sikttrekanten gjorde sikten sydover riksveien fra avkjørselen svært dårlig.
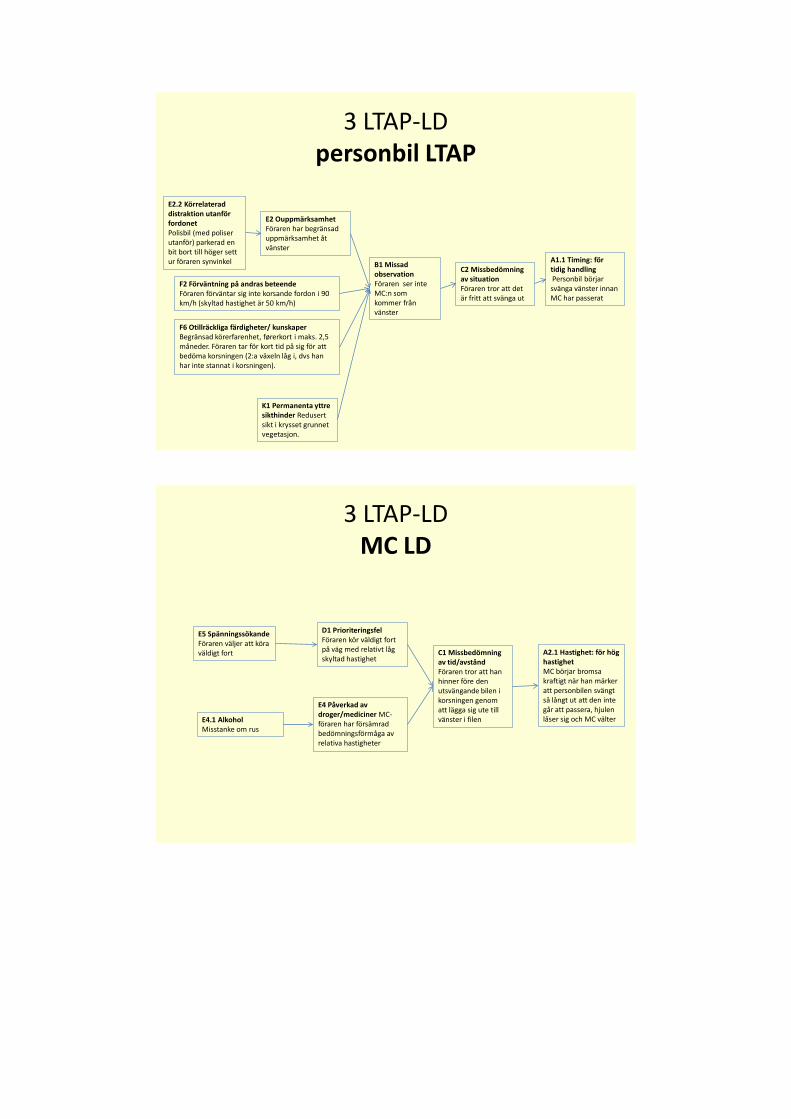
3 LTAP-LD personbil LTAP
A1.1 Timing: för tidig handlingPersonbil börjar svänga vänster innan MC har passerat
C2 Missbedömning av situation Föraren tror att det är fritt att svänga ut
B1 Missad observation Föraren ser inte MC:n som kommer från vänster
K1 Permanenta yttre sikthinder Redusert sikt i krysset grunnet vegetasjon.
E2.2 Körrelaterad distraktion utanför fordonet Polisbil (med poliser utanför) parkerad en bit bort till höger sett ur föraren synvinkel
E2 Ouppmärksamhet Föraren har begränsad uppmärksamhet åt vänster
F6 Otillräckliga färdigheter/ kunskaper Begränsad körerfarenhet, førerkort i maks. 2,5 måneder. Föraren tar för kort tid på sig för att bedöma korsningen (2:a växeln låg i, dvs han har inte stannat i korsningen).
F2 Förväntning på andras beteende Föraren förväntar sig inte korsande fordon i 90 km/h (skyltad hastighet är 50 km/h)
3 LTAP-LD MC LD
A2.1 Hastighet: för hög hastighet MC börjar bromsa kraftigt när han märker att personbilen svängt så långt ut att den inte går att passera, hjulen låser sig och MC välter
C1 Missbedömning av tid/avstånd Föraren tror att han hinner före den utsvängande bilen i korsningen genom att lägga sig ute till vänster i filen
E4 Påverkad av droger/mediciner MC-föraren har försämrad bedömningsförmåga av relativa hastigheter
E5 Spänningssökande Föraren väljer att köra väldigt fort
D1 Prioriteringsfel Föraren kör väldigt fort på väg med relativt låg skyltad hastighet
E4.1 Alkohol Misstanke om rus
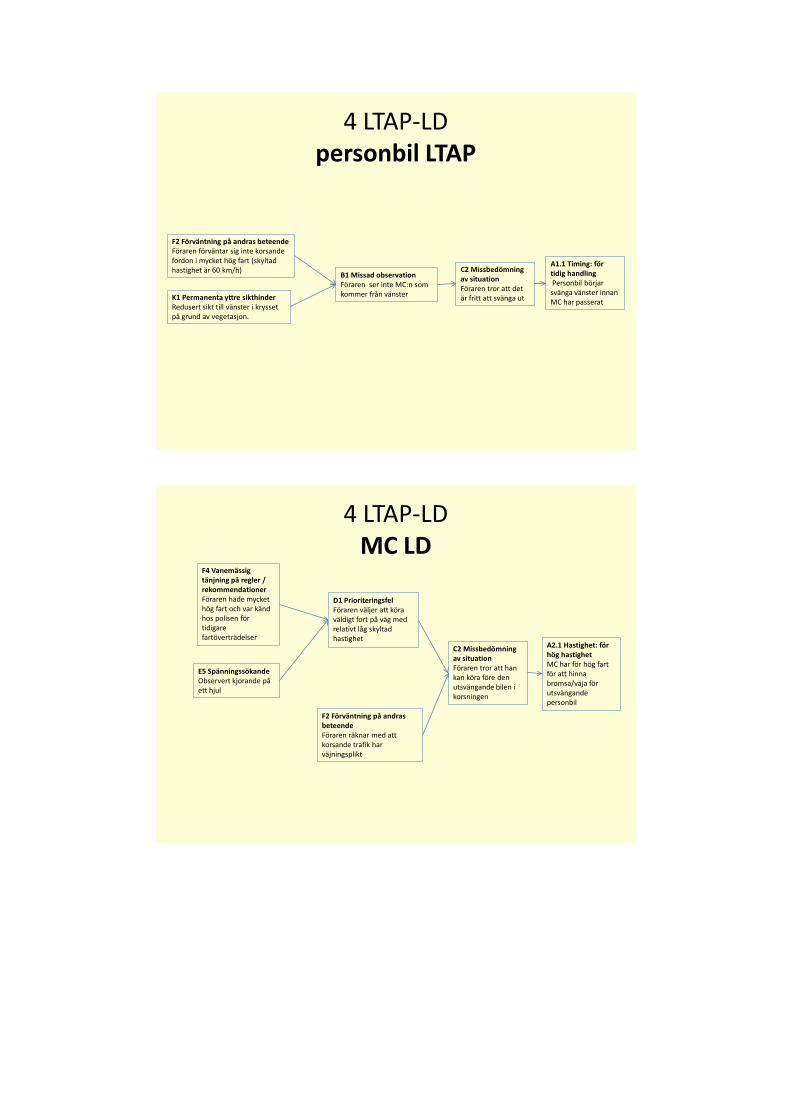
4 LTAP-LD personbil LTAP
A1.1 Timing: för tidig handlingPersonbil börjar svänga vänster innan MC har passerat
C2 Missbedömning av situation Föraren tror att det är fritt att svänga ut
B1 Missad observation Föraren ser inte MC:n som kommer från vänster K1 Permanenta yttre sikthinder
Redusert sikt till vänster i krysset på grund av vegetasjon.
F2 Förväntning på andras beteende Föraren förväntar sig inte korsande fordon i mycket hög fart (skyltad hastighet är 60 km/h)
4 LTAP-LD MC LD
A2.1 Hastighet: för hög hastighet MC har för hög fart för att hinna bromsa/väja för utsvängande personbil
C2 Missbedömning av situation Föraren tror att han kan köra före den utsvängande bilen i korsningen
F4 Vanemässig tänjning på regler / rekommendationer Föraren hade mycket hög fart och var känd hos polisen för tidigare fartöverträdelser
D1 Prioriteringsfel Föraren väljer att köra väldigt fort på väg med relativt låg skyltad hastighet
E5 Spänningssökande Observert kjorande på ett hjul
F2 Förväntning på andras beteende Föraren räknar med att korsande trafik har väjningsplikt
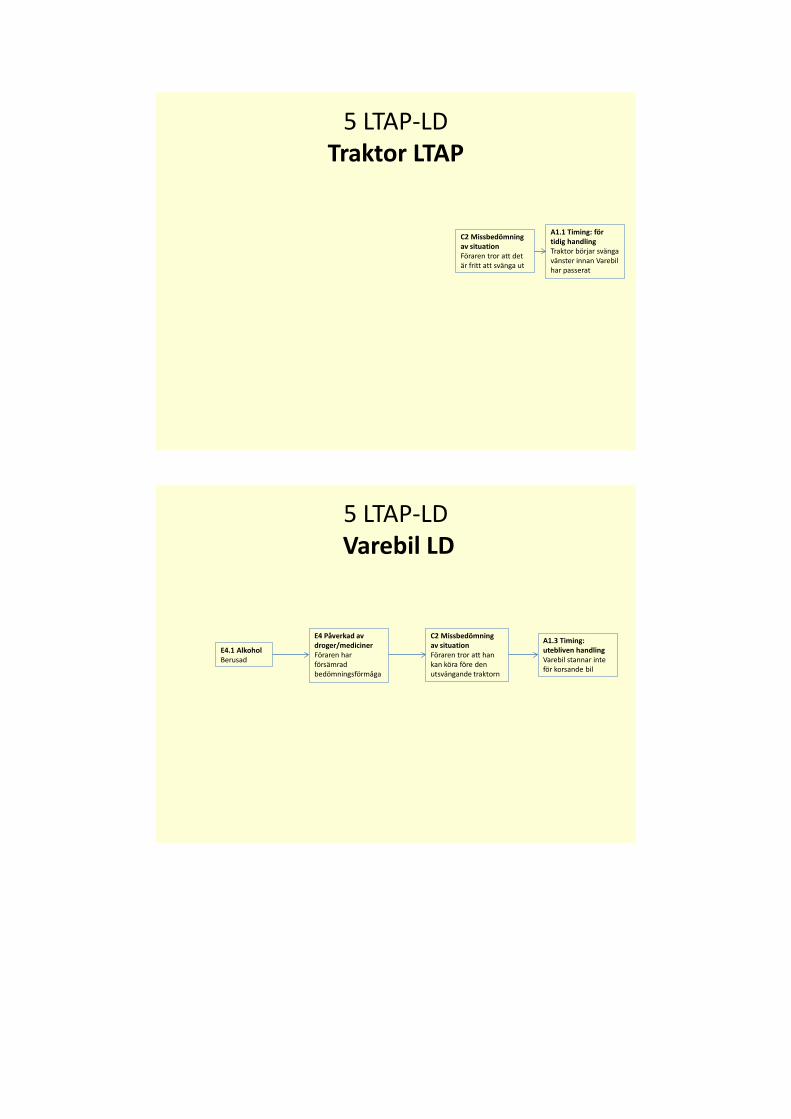
5 LTAP-LD Traktor LTAP
A1.1 Timing: för tidig handling Traktor börjar svänga vänster innan Varebil har passerat
C2 Missbedömning av situation Föraren tror att det är fritt att svänga ut
5 LTAP-LD Varebil LD
A1.3 Timing: utebliven handling Varebil stannar inte för korsande bil
C2 Missbedömning av situation Föraren tror att han kan köra före den utsvängande traktorn
E4 Påverkad av droger/mediciner Föraren har försämrad bedömningsförmåga
E4.1 Alkohol Berusad
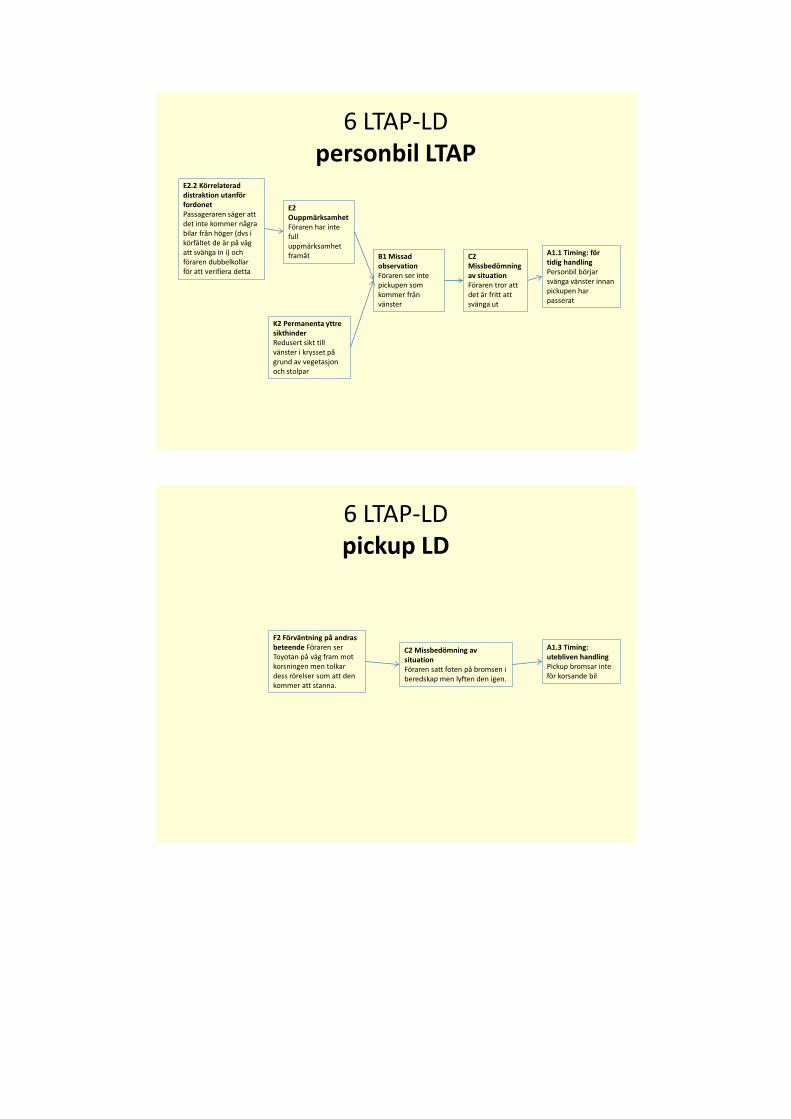
6 LTAP-LD personbil LTAP
A1.1 Timing: för tidig handling Personbil börjar svänga vänster innan pickupen har passerat
C2 Missbedömning av situation Föraren tror att det är fritt att svänga ut
K2 Permanenta yttre sikthinder Redusert sikt till vänster i krysset på grund av vegetasjon och stolpar
B1 Missad observation Föraren ser inte pickupen som kommer från vänster
E2 Ouppmärksamhet Föraren har inte full uppmärksamhet framåt
E2.2 Körrelaterad distraktion utanför fordonet Passageraren säger att det inte kommer några bilar från höger (dvs i körfältet de är på väg att svänga in i) och föraren dubbelkollar för att verifiera detta
6 LTAP-LD pickup LD
A1.3 Timing: utebliven handling Pickup bromsar inte för korsande bil
C2 Missbedömning av situation Föraren satt foten på bromsen i beredskap men lyften den igen.
F2 Förväntning på andras beteende Föraren ser Toyotan på väg fram mot korsningen men tolkar dess rörelser som att den kommer att stanna.
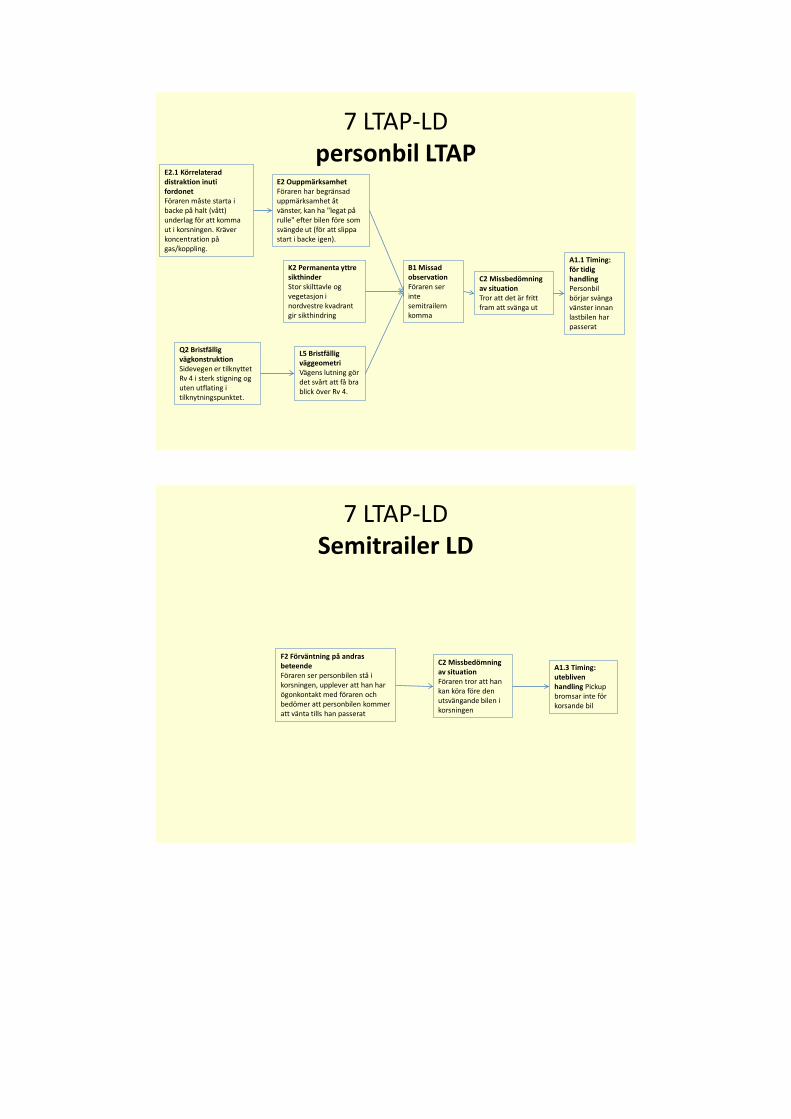
7 LTAP-LD personbil LTAP
A1.1 Timing: för tidig handling Personbil börjar svänga vänster innan lastbilen har passerat
C2 Missbedömning av situation Tror att det är fritt fram att svänga ut
E2 Ouppmärksamhet Föraren har begränsad uppmärksamhet åt vänster, kan ha "legat på rulle" efter bilen före som svängde ut (för att slippa start i backe igen).
K2 Permanenta yttre sikthinder Stor skilttavle og vegetasjon i nordvestre kvadrant gir sikthindring
B1 Missad observation Föraren ser inte semitrailern komma
E2.1 Körrelaterad distraktion inuti fordonet Föraren måste starta i backe på halt (vått) underlag för att komma ut i korsningen. Kräver koncentration på gas/koppling.
L5 Bristfällig väggeometri Vägens lutning gör det svårt att få bra blick över Rv 4.
Q2 Bristfällig vägkonstruktion Sidevegen er tilknyttet Rv 4 i sterk stigning og uten utflating i tilknytningspunktet.
7 LTAP-LD Semitrailer LD
A1.3 Timing: utebliven handling Pickup bromsar inte för korsande bil
C2 Missbedömning av situation Föraren tror att han kan köra före den utsvängande bilen i korsningen
F2 Förväntning på andras beteendeFöraren ser personbilen stå i korsningen, upplever att han har ögonkontakt med föraren och bedömer att personbilen kommer att vänta tills han passerat
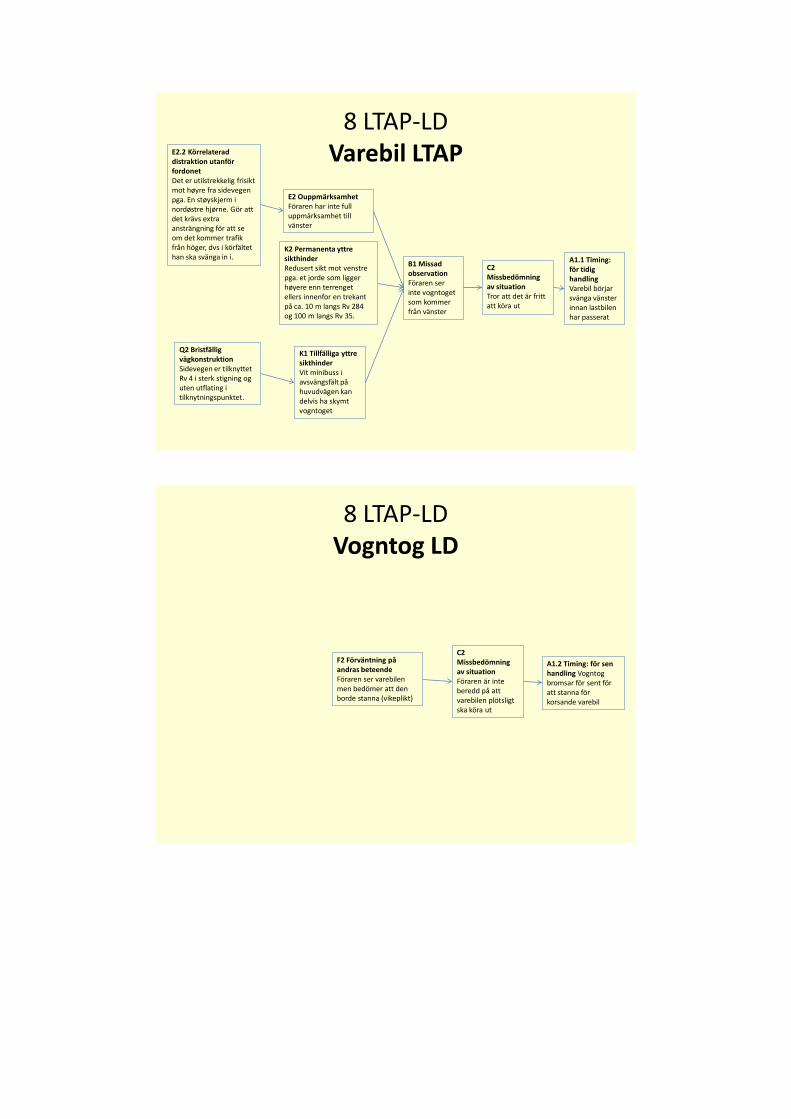
8 LTAP-LD Varebil LTAP
A1.1 Timing: för tidig handling Varebil börjar svänga vänster innan lastbilen har passerat
C2 Missbedömning av situation Tror att det är fritt att köra ut
E2 Ouppmärksamhet Föraren har inte full uppmärksamhet till vänster
K2 Permanenta yttre sikthinder Redusert sikt mot venstre pga. et jorde som ligger høyere enn terrenget ellers innenfor en trekant på ca. 10 m langs Rv 284 og 100 m langs Rv 35.
B1 Missad observation Föraren ser inte vogntoget som kommer från vänster
E2.2 Körrelaterad distraktion utanför fordonet Det er utilstrekkelig frisikt mot høyre fra sidevegen pga. En støyskjerm i nordøstre hjørne. Gör att det krävs extra ansträngning för att se om det kommer trafik från höger, dvs i körfältet han ska svänga in i.
K1 Tillfälliga yttre sikthinder Vit minibuss i avsvängsfält på huvudvägen kan delvis ha skymt vogntoget
Q2 Bristfällig vägkonstruktion Sidevegen er tilknyttet Rv 4 i sterk stigning og uten utflating i tilknytningspunktet.
8 LTAP-LD Vogntog LD
A1.2 Timing: för sen handling Vogntog bromsar för sent för att stanna för korsande varebil
C2 Missbedömning av situation Föraren är inte beredd på att varebilen plötsligt ska köra ut
F2 Förväntning på andras beteende Föraren ser varebilen men bedömer att den borde stanna (vikeplikt)
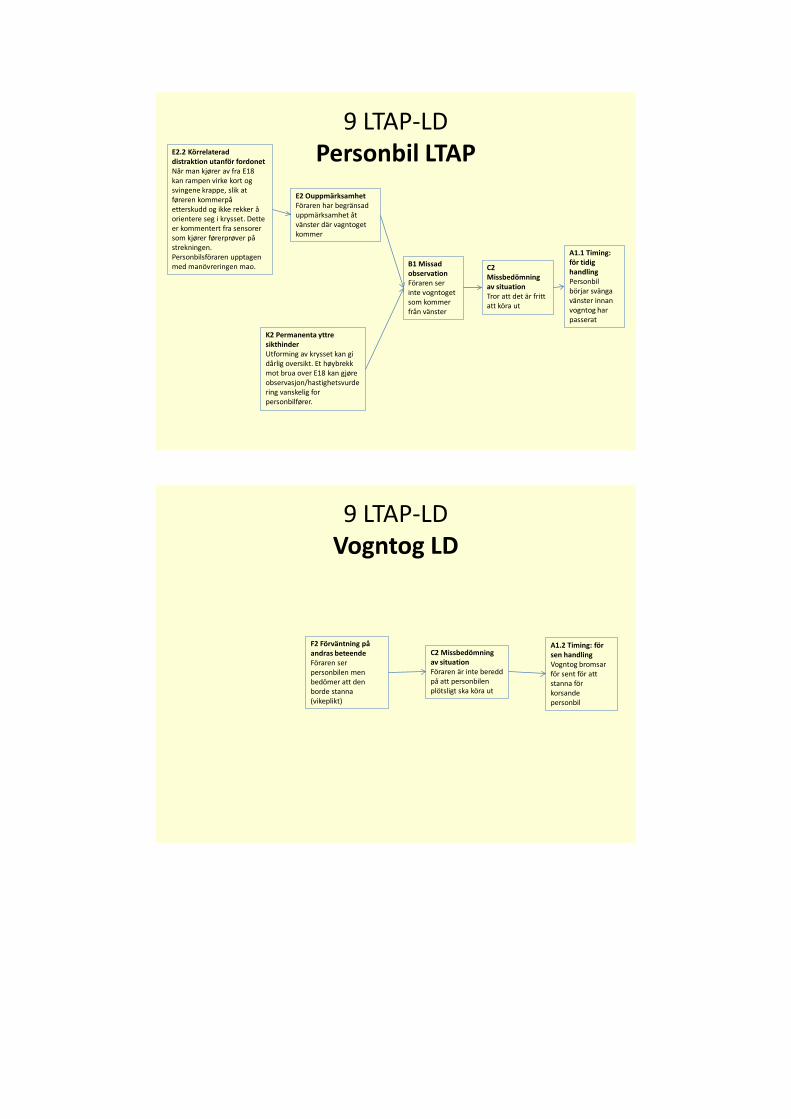
9 LTAP-LD Personbil LTAP
A1.1 Timing: för tidig handling Personbil börjar svänga vänster innan vogntog har passerat
C2 Missbedömning av situation Tror att det är fritt att köra ut
E2 Ouppmärksamhet Föraren har begränsad uppmärksamhet åt vänster där vagntoget kommer
K2 Permanenta yttre sikthinder Utforming av krysset kan gi dårlig oversikt. Et høybrekk mot brua over E18 kan gjøre observasjon/hastighetsvurdering vanskelig for personbilfører.
B1 Missad observation Föraren ser inte vogntoget som kommer från vänster
E2.2 Körrelaterad distraktion utanför fordonet Når man kjører av fra E18 kan rampen virke kort og svingene krappe, slik at føreren kommerpå etterskudd og ikke rekker å orientere seg i krysset. Dette er kommentert fra sensorer som kjører førerprøver på strekningen. Personbilsföraren upptagen med manövreringen mao.
9 LTAP-LD Vogntog LD
A1.2 Timing: för sen handling Vogntog bromsar för sent för att stanna för korsande personbil
C2 Missbedömning av situation Föraren är inte beredd på att personbilen plötsligt ska köra ut
F2 Förväntning på andras beteende Föraren ser personbilen men bedömer att den borde stanna (vikeplikt)

10 LTAP-LD Personbil LTAP
A6.1 Objekt: näraliggande objekt Personbilen kör ut framför Vogntoget
C2 Missbedömning av situation Föraren är klarar inte av att stanna vid stopplinjen
F6 Otillräckliga färdigheter/ kunskaper Föraren kör hyrbil med manuell växel, fast han är van vid automatväxel på sin egen bil
10 LTAP-LD Vogntog LD
A1.2 Timing: för sen handling Vogntog bromsar för sent för att stanna för korsande personbil
C2 Missbedömning av situation Föraren är inte beredd på att personbilen plötsligt ska köra ut
F2 Förväntning på andras beteende Föraren ser personbilen men bedömer att den borde stanna (vikeplikt)
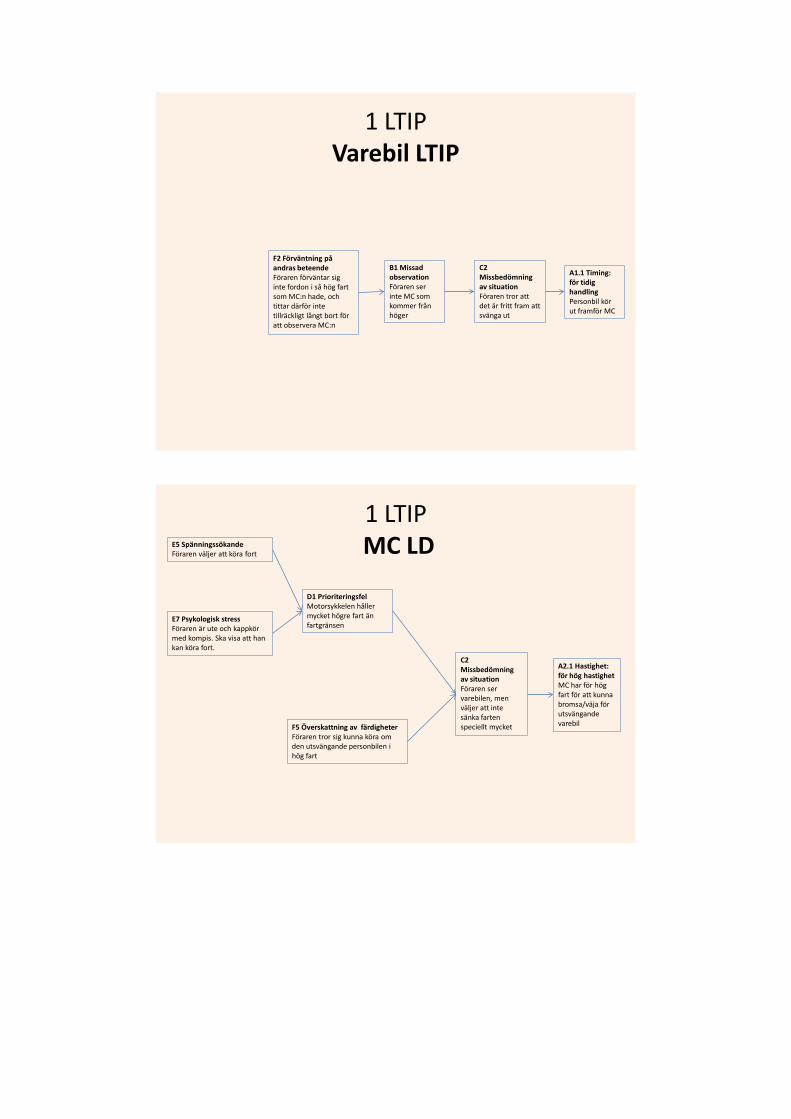
1 LTIP Varebil LTIP
A1.1 Timing: för tidig handling Personbil kör ut framför MC
C2 Missbedömning av situation Föraren tror att det är fritt fram att svänga ut
F2 Förväntning på andras beteende Föraren förväntar sig inte fordon i så hög fart som MC:n hade, och tittar därför inte tillräckligt långt bort för att observera MC:n
B1 Missad observation Föraren ser inte MC som kommer från höger
1 LTIP MC LD
A2.1 Hastighet: för hög hastighet MC har för hög fart för att kunna bromsa/väja för utsvängande varebil
C2 Missbedömning av situation Föraren ser varebilen, men väljer att inte sänka farten speciellt mycket
D1 Prioriteringsfel Motorsykkelen håller mycket högre fart än fartgränsen
E7 Psykologisk stress Föraren är ute och kappkör med kompis. Ska visa att han kan köra fort.
F5 Överskattning av färdigheter Föraren tror sig kunna köra om den utsvängande personbilen i hög fart
E5 Spänningssökande Föraren väljer att köra fort
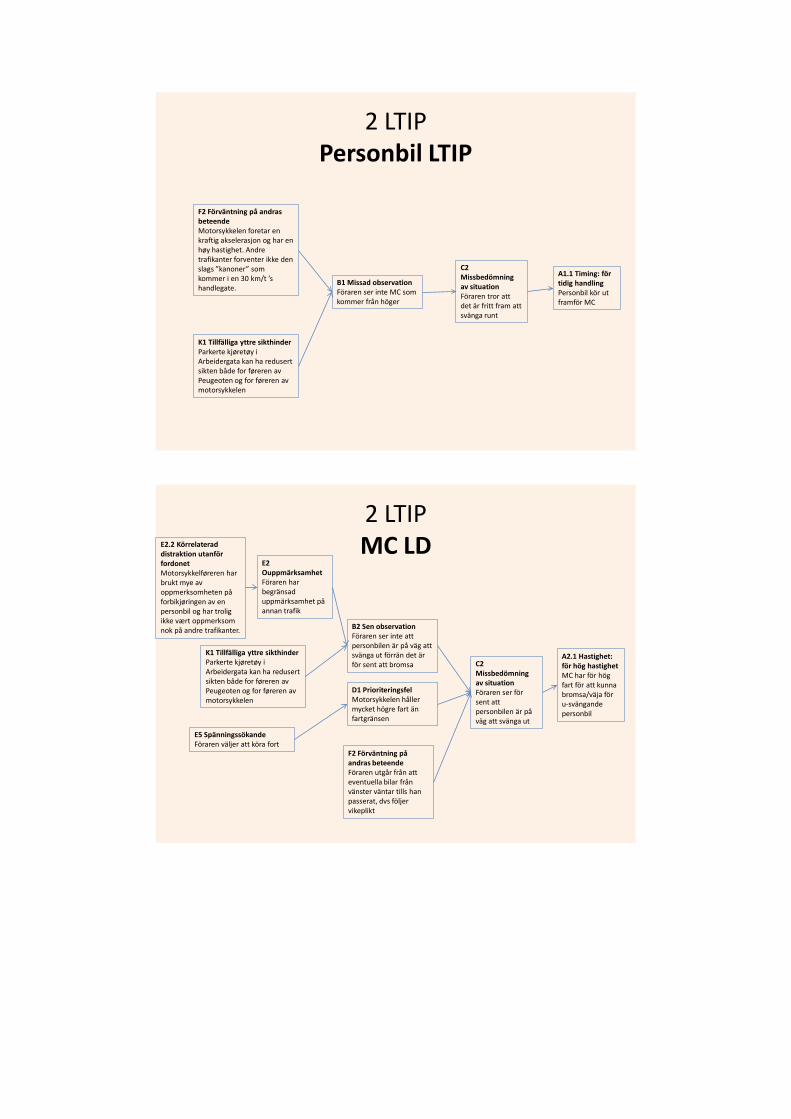
2 LTIP Personbil LTIP
A1.1 Timing: för tidig handling Personbil kör ut framför MC
C2 Missbedömning av situation Föraren tror att det är fritt fram att svänga runt
B1 Missad observation Föraren ser inte MC som kommer från höger
K1 Tillfälliga yttre sikthinder Parkerte kjøretøy i Arbeidergata kan ha redusert sikten både for føreren av Peugeoten og for føreren av motorsykkelen
F2 Förväntning på andras beteende Motorsykkelen foretar en kraftig akselerasjon og har en høy hastighet. Andre trafikanter forventer ikke den slags ”kanoner” som kommer i en 30 km/t ’s handlegate.
2 LTIP MC LD
A2.1 Hastighet: för hög hastighet MC har för hög fart för att kunna bromsa/väja för u-svängande personbil
C2 Missbedömning av situation Föraren ser för sent att personbilen är på väg att svänga ut
F2 Förväntning på andras beteende Föraren utgår från att eventuella bilar från vänster väntar tills han passerat, dvs följer vikeplikt
E2 Ouppmärksamhet Föraren har begränsad uppmärksamhet på annan trafik
K1 Tillfälliga yttre sikthinder Parkerte kjøretøy i Arbeidergata kan ha redusert sikten både for føreren av Peugeoten og for føreren av motorsykkelen
B2 Sen observation Föraren ser inte att personbilen är på väg att svänga ut förrän det är för sent att bromsa
E2.2 Körrelaterad distraktion utanför fordonet Motorsykkelføreren har brukt mye av oppmerksomheten på forbikjøringen av en personbil og har trolig ikke vært oppmerksom nok på andre trafikanter.
D1 Prioriteringsfel Motorsykkelen håller mycket högre fart än fartgränsen
E5 Spänningssökande Föraren väljer att köra fort

1 RTIP Personbil RTIP
A1.1 Timing: för tidig handling Personbil svänger ut på vägen framför MC:n
C2 Missbedömning av situation Föraren tror att det går bra att svänga ut
B1 Missad observation Föraren ser inte MC som kommer från höger
F2 Förväntning på andras beteende Föraren förväntar sig inte fordon i så hög fart som MC:n hade, och tittar därför inte tillräckligt långt bort för att observera MC:n
1 RTIP MC LD
A2.1 Hastighet: för hög hastighet MC har för hög fart för att kunna bromsa/väja för utsvängande personbil
C2 Missbedömning av situation Föraren är inte beredd på att personbilen plötsligt ska köra ut
D1 Prioriteringsfel Motorsykkelen kan ha kommet i stor fart
F2 Förväntning på andras beteende Föraren ser personbilen men bedömer att den borde stanna (vikeplikt)
E5 Spänningssökande Föraren väljer att köra mycket över hastighetsgränsen
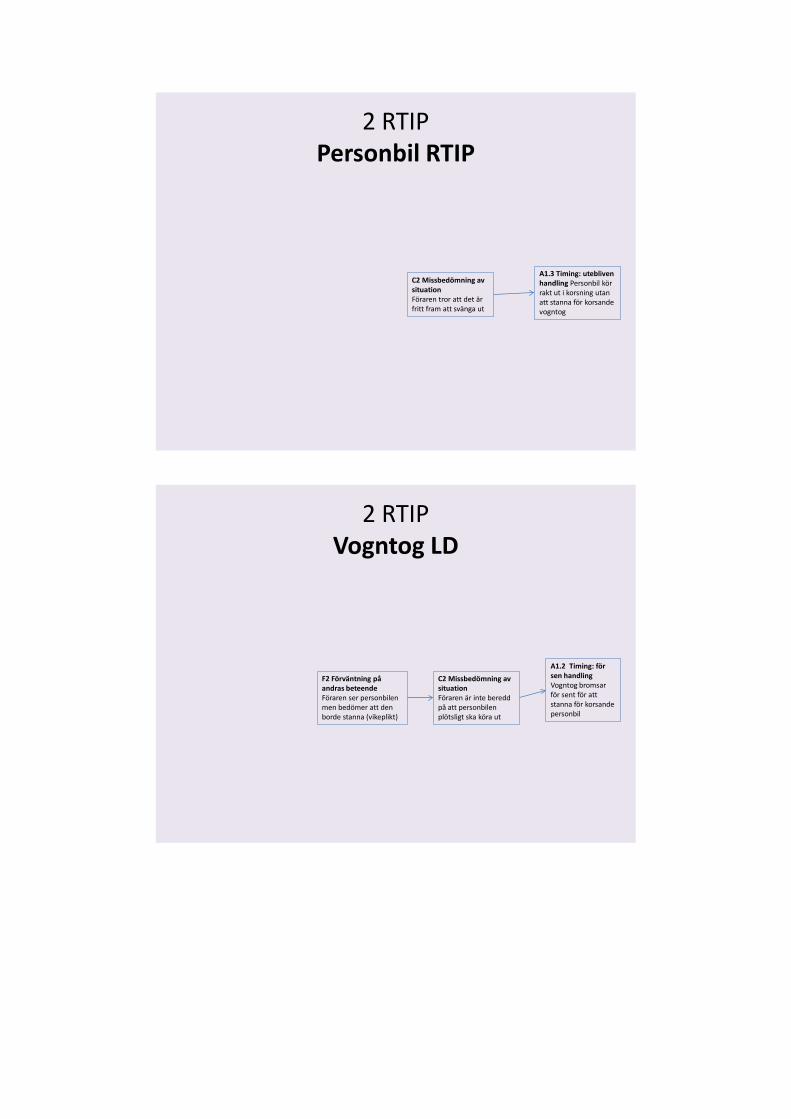
2 RTIP Personbil RTIP
A1.3 Timing: utebliven handling Personbil kör rakt ut i korsning utan att stanna för korsande vogntog
C2 Missbedömning av situationFöraren tror att det är fritt fram att svänga ut
2 RTIP Vogntog LD
A1.2 Timing: för sen handling Vogntog bromsar för sent för att stanna för korsande personbil
C2 Missbedömning av situation Föraren är inte beredd på att personbilen plötsligt ska köra ut
F2 Förväntning på andras beteende Föraren ser personbilen men bedömer att den borde stanna (vikeplikt)
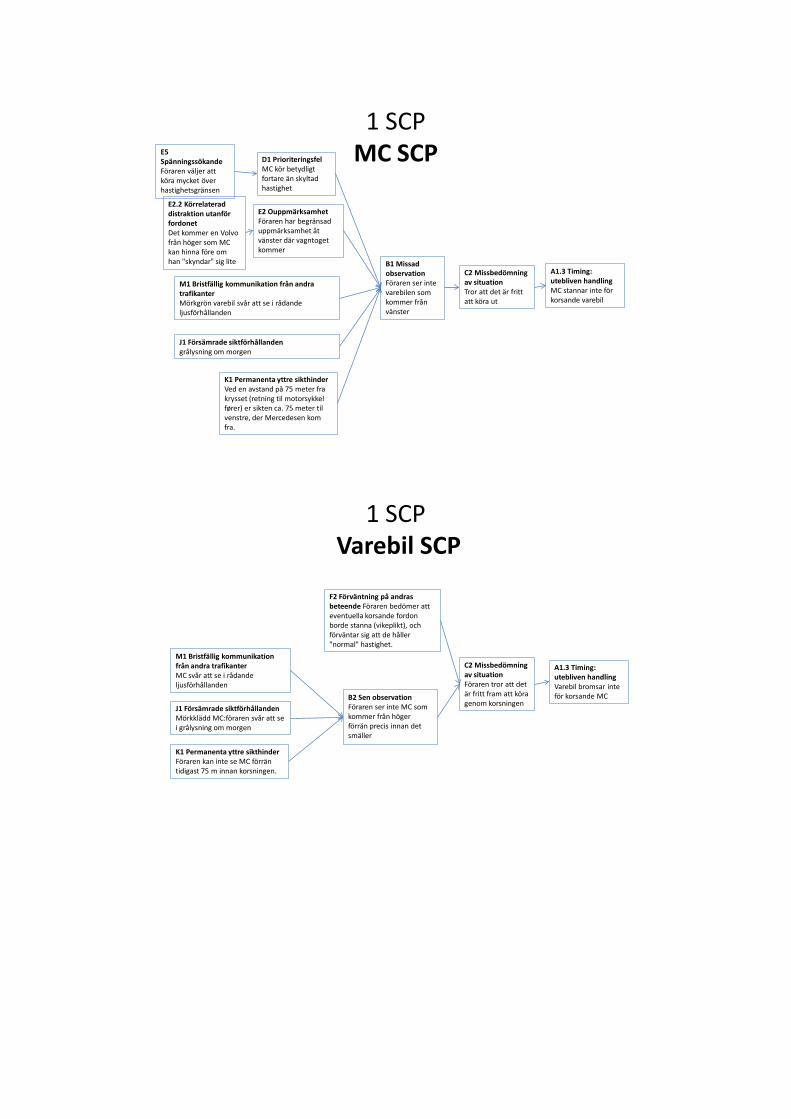
1 SCP MC SCP
A1.3 Timing: utebliven handling MC stannar inte för korsande varebil
C2 Missbedömning av situation Tror att det är fritt att köra ut
B1 Missad observation Föraren ser inte varebilen som kommer från vänster
K1 Permanenta yttre sikthinder Ved en avstand på 75 meter fra krysset (retning til motorsykkel fører) er sikten ca. 75 meter til venstre, der Mercedesen kom fra.
E2.2 Körrelaterad distraktion utanför fordonet Det kommer en Volvo från höger som MC kan hinna före om han "skyndar" sig lite
E2 Ouppmärksamhet Föraren har begränsad uppmärksamhet åt vänster där vagntoget kommer
J1 Försämrade siktförhållanden grålysning om morgen
M1 Bristfällig kommunikation från andra trafikanter Mörkgrön varebil svår att se i rådande ljusförhållanden
D1 Prioriteringsfel MC kör betydligt fortare än skyltad hastighet
E5 Spänningssökande Föraren väljer att köra mycket över hastighetsgränsen
1 SCP Varebil SCP
A1.3 Timing: utebliven handling Varebil bromsar inte för korsande MC
C2 Missbedömning av situation Föraren tror att det är fritt fram att köra genom korsningen
B2 Sen observation Föraren ser inte MC som kommer från höger förrän precis innan det smäller
K1 Permanenta yttre sikthinder Föraren kan inte se MC förrän tidigast 75 m innan korsningen.
J1 Försämrade siktförhållanden Mörkklädd MC:föraren svår att se i grålysning om morgen
M1 Bristfällig kommunikation från andra trafikanter MC svår att se i rådande ljusförhållanden
F2 Förväntning på andras beteende Föraren bedömer att eventuella korsande fordon borde stanna (vikeplikt), och förväntar sig att de håller "normal" hastighet.

Factors contributing to road fatalities
Copyright © Institute of Transport Economics, 2010 113
APPENDIX 4 Some methodological considerations on
DREAM 3.0 based on the bicycle case studies
DREAM - Phenotypes Several phenotypes could be explanatory to one accident. The analyst has to choose only one phenotype. The choice does however not affect the rest of the analysis as all genotypes link to all of the phenotypes. The kind of accident is therefore less important in our version of DREAM. Supporting this statement, we saw that two completely different kind of accident had exactly the same genotypes. Nevertheless we have chosen not to regard this as a problem since DREAM`s area of interest is primarily focused on the pre-crash stage.
DREAM - Genotypes Genotype “misjudgement of situation” suits a range of different situations. The choice of this genotype could sometimes seem unsuitable for the reader. However the definition of the genotype in the manual is much clearer and demonstrative than the actual name. The name should perhaps be considered revised. All our wide ranging accidents had “misjudgement of situation” as their first genotype. This indicates the need for further breaking down this genotype into categories.
DREAM - New version for cyclists? DREAM is developed for accidents involving cars. An accident is a result of several factors coming together simultaneously or in the right sequence. The genotypes and phenotypes are design especially for motorized vehicles. To analyze an accident with regards to a bicycle a version of DREAM would have to be developed. This may be a task for future research and development.
DREAM - Driver – Technology – Organization The genotypes are organized according to the driver – technology – organization triad. Sometimes there is an influence of one type of genotypes on another type which does not appear in the outcome. For instance, “temporary sight obstruction” was chosen as a genotype which is grouped under “technology”. But the reason for sight obstruction was a human fault, which does not appear directly in the analysis, and in lack of other genotypes to choose, technology is given a part of the fault of the driver missing to observe a cyclist.
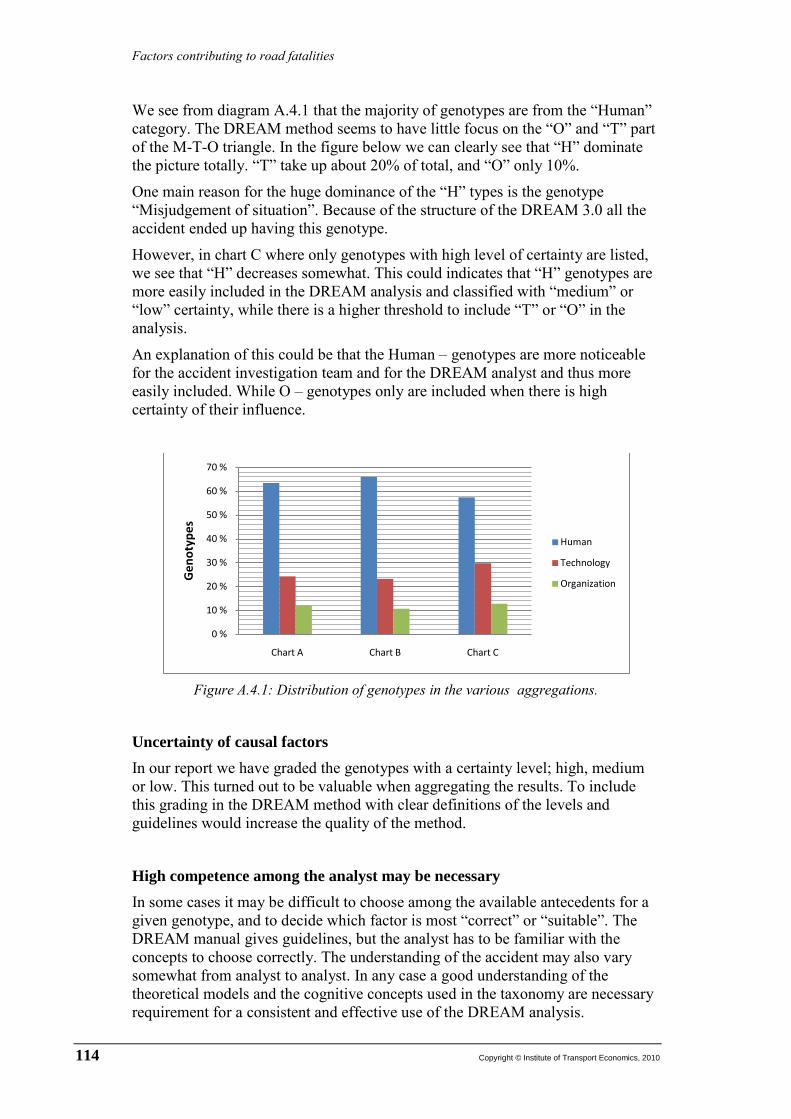
Factors contributing to road fatalities
114 Copyright © Institute of Transport Economics, 2010
We see from diagram A.4.1 that the majority of genotypes are from the “Human” category. The DREAM method seems to have little focus on the “O” and “T” part of the M-T-O triangle. In the figure below we can clearly see that “H” dominate the picture totally. “T” take up about 20% of total, and “O” only 10%.
One main reason for the huge dominance of the “H” types is the genotype “Misjudgement of situation”. Because of the structure of the DREAM 3.0 all the accident ended up having this genotype.
However, in chart C where only genotypes with high level of certainty are listed, we see that “H” decreases somewhat. This could indicates that “H” genotypes are more easily included in the DREAM analysis and classified with “medium” or “low” certainty, while there is a higher threshold to include “T” or “O” in the analysis.
An explanation of this could be that the Human – genotypes are more noticeable for the accident investigation team and for the DREAM analyst and thus more easily included. While O – genotypes only are included when there is high certainty of their influence.
Figure A.4.1: Distribution of genotypes in the various aggregations.
Uncertainty of causal factors In our report we have graded the genotypes with a certainty level; high, medium or low. This turned out to be valuable when aggregating the results. To include this grading in the DREAM method with clear definitions of the levels and guidelines would increase the quality of the method.
High competence among the analyst may be necessary In some cases it may be difficult to choose among the available antecedents for a given genotype, and to decide which factor is most “correct” or “suitable”. The DREAM manual gives guidelines, but the analyst has to be familiar with the concepts to choose correctly. The understanding of the accident may also vary somewhat from analyst to analyst. In any case a good understanding of the theoretical models and the cognitive concepts used in the taxonomy are necessary requirement for a consistent and effective use of the DREAM analysis.
0 %
10 %
20 %
30 %
40 %
50 %
60 %
70 %
Chart A Chart B Chart C
Gen
otyp
es
Human
Technology
Organization
Factors contributing to road fatalities
Copyright © Institute of Transport Economics, 2010 115
APPENDIX 5 Various notes on the bicycle accident
analyses
Accident nr 1. We see from this analysis that two different phenotypes can be used to describe the accident description. Nevertheless it is only allowed to choose one phenotype. However all phenotypes have the same genotypes. This decreases the importance of the phenotype, making them less interesting to the analysis.
Accident nr 2. The report this analysis was based upon did not contain any information on whether or not the cyclist tried to avoid the truck, or if the truck hit him completely by surprise. There is neither any information on exactly when the other road users alarmed the driver, weather it was before or after the truck crashed with the cyclist. It would also be interesting to have information about exactly when the cyclist arrived, his speed etc.
Accident nr 3 DREAM 3.0 contains rather limited number of phenotypes. The analyst could sometimes be confused about which one to choose. Interesting to note, that accident 2 and 3 have exactly the same genotypes, but the accident have different phenotypes.
Accident nr 4 The DREAM analysis was based upon a report which lacked many details about the accident. There were no records from witnesses, no mention about any brake tracks, the clothing of the cyclist, use of helmet, whether or not the involved parties where familiar with the road and the position of the cycle and the car after the collision. Information about the parties involved in the accident, like age, background, sex etc. are not considered directly by DREAM, but nevertheless they are vital for the analyst to be able to draw a full picture and chose the most accurate genotype with somewhat high level of certainty. But regardless, it is important that the accident investigation reports cover the background information. After covering several accidents, this information can be accumulated to give interesting results or at least indications about vulnerability.
Factors contributing to road fatalities
116 Copyright © Institute of Transport Economics, 2010
Accident nr 5 DREAM does take into account previous records of stretching rules and recommendation, which is regarded as a “human factor”. However DREAM does not directly intercept similar problems on “technology factors”. For instance number of previous accidents on the road. This information is often easy available in the accident reports. In this case the driver could have misjudged the situation because of the truck in front was obstructing the view to the cyclist. However in DREAM 3.0 there is no link between “misjudgement of situation” and “temporary obstruction of view”
Accident nr 6 There were few pictures in the report the DREAM analysis was based upon. Pictures and sketches are useful tools for the analyst to understand and analyze the accident. It helps to liberate the analyst from the conclusions drawn in the report and re-analyze the accident using DREAM method.
Accident nr 7 Genotype “misjudgement of situation” suits a range of different situations. The choice of this genotype could sometimes seem unsuitable for the reader. However the definition of the genotype in the manual is much clearer and demonstrative than the actual name. The name should perhaps be considered revised.
Accident nr 8 Reports of the accidents are written in different templates, and not all matters are discussed similarly or even mentioned in all of the reports. DREAM considers the drivers state in regards to freshness, drowsiness etc. However information about this is not included in all reports. A need of a common template for accident reports is highly present.
Accident nr 9 The genotype “Temporary sight obstruction” which is grouped as a “Technology” genotype was chosen for the driver placing his truck in a way that his view was obstructed. No extra mirror was installed to help the driver with this situation, but strictly speaking this was a human error and not a technological fault. No other genotype suited this incident. The report mentioned that the driver wanted to enter the road before the approaching vehicles from his right arrived. However, there is no mention in the reports about why he wanted to do this. Was he under time pressure? And if so, why? Was the act a pure excitement seeking stunt? And if so, does the driver have any previous records of doing so? And so on. The analysis could have shifted to emphasize organizational matters more than what emerges if such information was made available.
Factors contributing to road fatalities
Copyright © Institute of Transport Economics, 2010 117
Accident nr 10 Reconstruction of the event in pictures and drawings helps the analyst to better understand the situation, and analyze the event independently of the analysis made by the writer of the crash reports. Pictures from the drivers direction`s approach, the placing of the involved parties pre crash and post crash are important pictures for the analyst to have access to. Thorough description of the parties involved, like for instance information about the clothing, used of reflexes, helmet and a description of the that day`s activity are also essential to the DREAM analysis.
The genotype “Misjudgement of situation” has applied all the accidents. Situations where the driver is hit by a surprise because of some sudden behaviour from the other party are most likely classified as misjudgement by the driver. Even though the driver probably is free from any misjudgement, the genotype would be chosen in lack of other more suitable genotypes.
Accident nr 11 As stressed in accident 6, pictures from a reconstruction of the accident are important for the analyst to grasp the whole situation, and perform a DREAM analysis independently of the conclusions drawn in the report. In this report only one picture was given, without the placement of the vehicles, neither before nor after the accident.
The interviews from the driver and witnesses were very limited and did not include particulars of for instance their alertness, health and mind states and so on. There were no account on which direction the driver was concentrating on, weather to her left or to her right when the accident happened.
Accident nr 12 DREAM is developed for accidents involving cars. An accident is a result of several factors coming together simultaneously or in the right sequence. In this and other accidents much information available is not used because the analysis is not preformed for the other party involved in the accident. This is not done because, as mentioned earlier, the DREAM is strictly speaking not applicable for cyclist.
To fully grasp all the genotypes in an accident, the DREAM analysis should ideally be preformed for all parties involved in the accident. In our report however, at least one of the parties involved is a cyclist. As the tool DREAM is developed for the motorized vehicles, we have not performed a separate analysis for the cyclists.
Factors contributing to road fatalities
118 Copyright © Institute of Transport Economics, 2010
Accident nr 13 Many a time the crash scene investigation group is not alerted. This was also the case in this accident, and thus many details have been lost. Information from the crash scene is important for an accurate DREAM analysis.
Accident nr 14 There was no interview with the driver in the accident investigation report. Nor was there any interview with the surviving cyclist. Seeing an accident from the view point from all the parties involved helps the analyst to draw a more complete picture and pick the right genotypes with higher level of certainty. Again more pictures would have been useful.
Accident nr 15 A thorough interview with the driver was not given in the accident report. Information about what the driver was doing, where he was going, did he have time pressure etc. was not available in the accident report. A DREAM analysis based merely on visual facts has minor benefits.