Embed Size (px)
Citation preview
ANALYSIS OF SEPIC DC/DC CONVERTER USING PERTURB & OBSERVE
ALGORITHM FOR PHOTOVOLTAIC CHARGE CONTROLLER
WAN MUHAMMAD FIRDAUS BIN WAN SULAIMAN
Thesis submitted in fulfillment of the requirements for the award of the degree
of Master of Engineering in Electrical
Faculty of Electrical and Electronics Engineering
UNIVERSITI MALAYSIA PAHANG
APRIL 2015
vii
ABSTRACT
The solar energy is one of the renewable energy sources that plays an important part in our daily life nowadays. The solar energy harvesting system usually consists of solar panels and inverters. The inverter consists of many subsystems; solar charge controller is one of them. As the name suggests, solar charge controller plays a crucial role in harvesting maximum energy from the sun’s irradiation. This thesis focuses on solar charge controller area; which presents theoretical studies on the photovoltaic (PV) module characteristics and Maximum Power Point Tracking (MPPT) capability. This study uses real irradiation data to analyze the PV module characteristics and the MPPT algorithm in MATLAB. The simulations in PSIM software is to verify the Single Ended Primary Inductor Converter (SEPIC) circuit with Perturb & Observe (P&O) MPPT algorithm method. This simulation provides an information on the charge controller capability to produce an output power as close as the input power on the changement of the solar irradiation intensity. This simulation provides an information on how the P&O algorithm reacts to the changement of solar irradiation and how long it took for this MPPT to track the Maximum Power Point (MPP). The SEPIC hardware analysis is likely to be the determination of the losses in the SEPIC circuit at certain working frequency parameters and component selections. This experiment also contributes to the knowledge on the switching and conduction losses, where in reality depending on many parameters. On the ideal SEPIC circuit (lossless converter), the efficiency can reach as high as 98% at maximum solar irradiation. By comparison, given the same components with the same value, the experimental SEPIC circuit can obtain an efficiency of only 77%.
viii
ABSTRAK
Tenaga solar adalah salah satu sumber tenaga boleh diperbaharui yang memainkan peranan penting dalam kehidupan seharian kita pada masa kini. Sistem pengusahasilan tenaga solar ini biasanya terdiri daripada panel solar dan penyongsang. Penyongsang ini terdiri daripada banyak sistem kecil di mana pengawal caj solar adalah salah satu daripadanya. Seperti namanya, pengawal caj solar memainkan peranan penting dalam pengusahasilan tenaga maksimum dari sinaran matahari. Tesis ini memberi tumpuan kepada pengawal caj solar; yang mana akan membentangkan kajian secara teori kepada ciri-ciri modul PV dan keupayaan Pengesan Titik Kuasa Maksimum (MPPT). Kajian ini menggunakan data penyinaran sebenar untuk menganalisis ciri-ciri modul PV dan algoritma MPPT dalam MATLAB. Simulasi di PSIM adalah untuk pengesahan litar SEPIC dengan menggunakan kaedah MPPT yang dipilih. Simulasi ini memberi maklumat mengenai keupayaan pengesanan MPPT dari segi masa dan juga keamatan sinaran matahari. Analisis tentang perkakasan SEPIC menjadi penentu dalam kehilangankuasa dalam litar SEPIC pada frekuensi dan pilihan komponentertentu. Eksperimen ini memberi beberapa keputusan yang tidak dijangka dari segi nilai kehilangan kuasa. Ia juga menyumbang kepada pengetahuan tentang jangkaan dalam kehilangan kuasa semasa pensuisan dan konduksi yang pada hakikatnya bergantung kepada banyak parameter.
ix
TABLE OF CONTENTS
Page
SUPERVISOR’S DECLARATION .............................................................................. ii
STUDENT’S DECLARATION .................................................................................... iii
ACKNOWLEDGEMENTS .......................................................................................... iv
ABSTRACT .................................................................................................................... vi
ABSTRAK ..................................................................................................................... vii
TABLE OF CONTENT viii
LIST OF TABLES xi
LIST OF FIGURES xii
LIST OF SYMBOLS xiv
LIST OF ABBREVIATIONS ...................................................................................... xv
CHAPTER 1 INTRODUCTION
1.1 Overview ................................................................................................. 1
1.2 Problem Statement .................................................................................. 4
1.3 Objectives ................................................................................................ 5
1.4 Scope and Limitations ............................................................................. 5
1.5 Overview of the Thesis 6
CHAPTER 2 LITERATURE REVIEW
2.1 Introduction ............................................................................................. 7
2.2 Photovoltaic ............................................................................................. 8
2.2.1 Photovoltaic Cell ............................................................................... 9
2.2.2 Photovoltaic Module ......................................................................... 9
2.2.3 The I-V Curve and Maximum Power Point ..................................... 11
2.3 Maximum Power Point Tracking .......................................................... 12
x
2.3.1 Perturb & Observe Algorithm ......................................................... 12
2.3.2 Incremental Conductance Algorithm 14
2.4 DC/DC Converter .................................................................................. 16
2.4.1 SEPIC Topology ............................................................................. 19
2.5 Efficiency Analysis of DC/DC Converter ............................................. 22
2.6 Summary ............................................................................................... 23
CHAPTER 3 METHODOLOGY
3.1 Introduction ........................................................................................... 24
3.2 Modeling the PV Module in Matlab ..................................................... 25
3.3 SEPIC PSim Simulation ........................................................................ 31
3.3.1 PSIM Solar Module (Physical Model) Setup .................................. 32
3.3.2 SEPIC Components Sizing and Selection ....................................... 33
3.4 SEPIC Loss Analysis ............................................................................ 39
3.4.1 SEPIC losses ................................................................................... 40
3.5 Summary ............................................................................................... 45
CHAPTER 4 RESULTS AND DISCUSSIONS
4.1 Introduction ........................................................................................... 46
4.2 MATLAB PV Modeling Simulation ..................................................... 46
4.2.1 Real Solar Irradiation Data Collection ............................................ 46
4.2.2 Modeling of PV Module in MATLAB ........................................... 48
4.2.3 P&O MPPT Simulation in MATLAB Based on PV Module
Characteristics and Solar Irradiation Data Collection ............................................ 51
4.3 PSim Converter Circuit Simulation ...................................................... 54
4.3.1 SEPIC Close-loop Simulation under Constant Solar Irradiation .... 54
4.3.2 SEPIC Close-loop Simulation under Varying Solar Irradiation ..... 56
xi
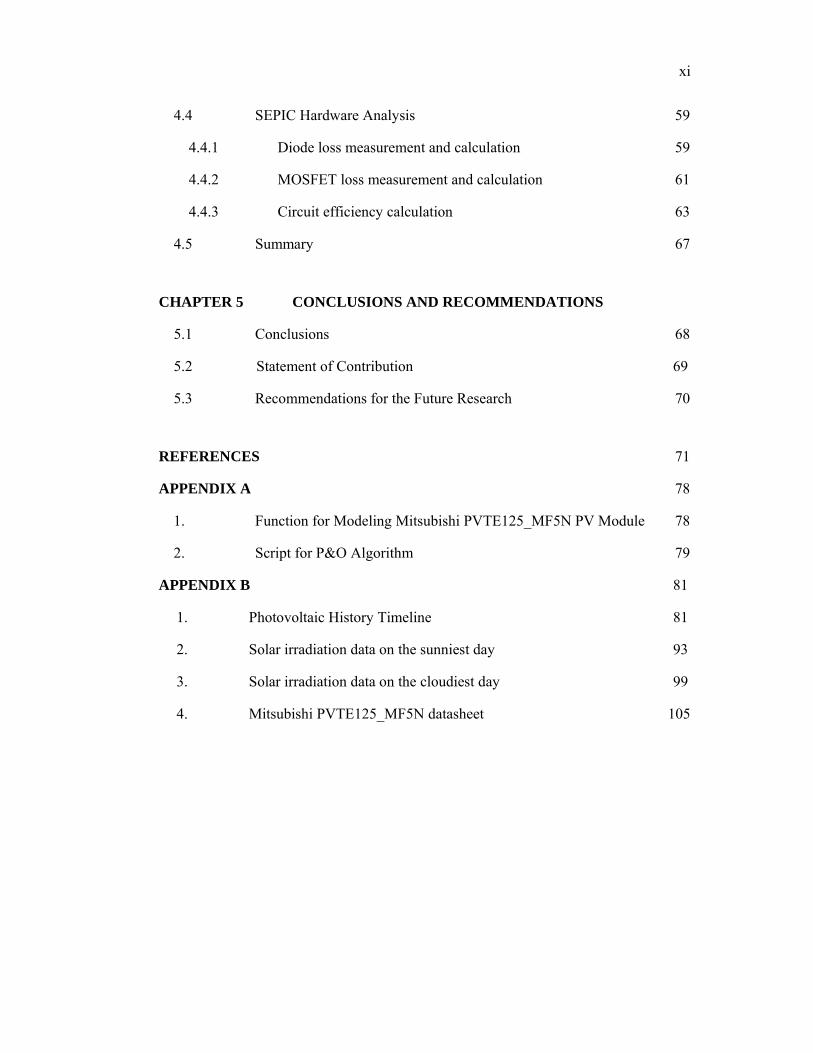
4.4 SEPIC Hardware Analysis .................................................................... 59
4.4.1 Diode loss measurement and calculation ........................................ 59
4.4.2 MOSFET loss measurement and calculation .................................. 61
4.4.3 Circuit efficiency calculation .......................................................... 63
4.5 Summary ............................................................................................... 67
CHAPTER 5 CONCLUSIONS AND RECOMMENDATIONS
5.1 Conclusions ........................................................................................... 68
5.2 Statement of Contribution 69
5.3 Recommendations for the Future Research .......................................... 70
REFERENCES .............................................................................................................. 71
APPENDIX A ................................................................................................................ 78
1. Function for Modeling Mitsubishi PVTE125_MF5N PV Module ....... 78
2. Script for P&O Algorithm ..................................................................... 79
APPENDIX B 81
1. Photovoltaic History Timeline 81
2. Solar irradiation data on the sunniest day 93
3. Solar irradiation data on the cloudiest day 99
4. Mitsubishi PVTE125_MF5N datasheet 105
xii
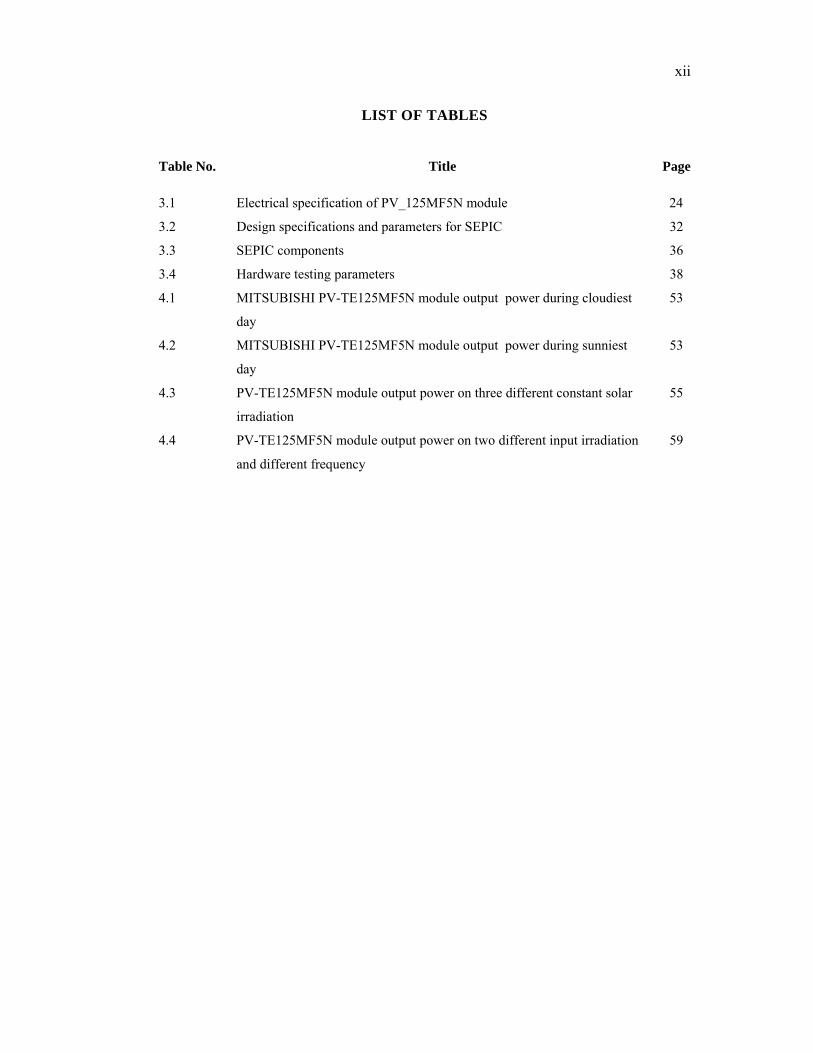
LIST OF TABLES
Table No. Title Page
3.1 Electrical specification of PV_125MF5N module 24
3.2 Design specifications and parameters for SEPIC 32
3.3 SEPIC components 36
3.4 Hardware testing parameters 38
4.1 MITSUBISHI PV-TE125MF5N module output power during cloudiest
day
53
4.2 MITSUBISHI PV-TE125MF5N module output power during sunniest
day
53
4.3 PV-TE125MF5N module output power on three different constant solar
irradiation
55
4.4 PV-TE125MF5N module output power on two different input irradiation
and different frequency
59
xiii
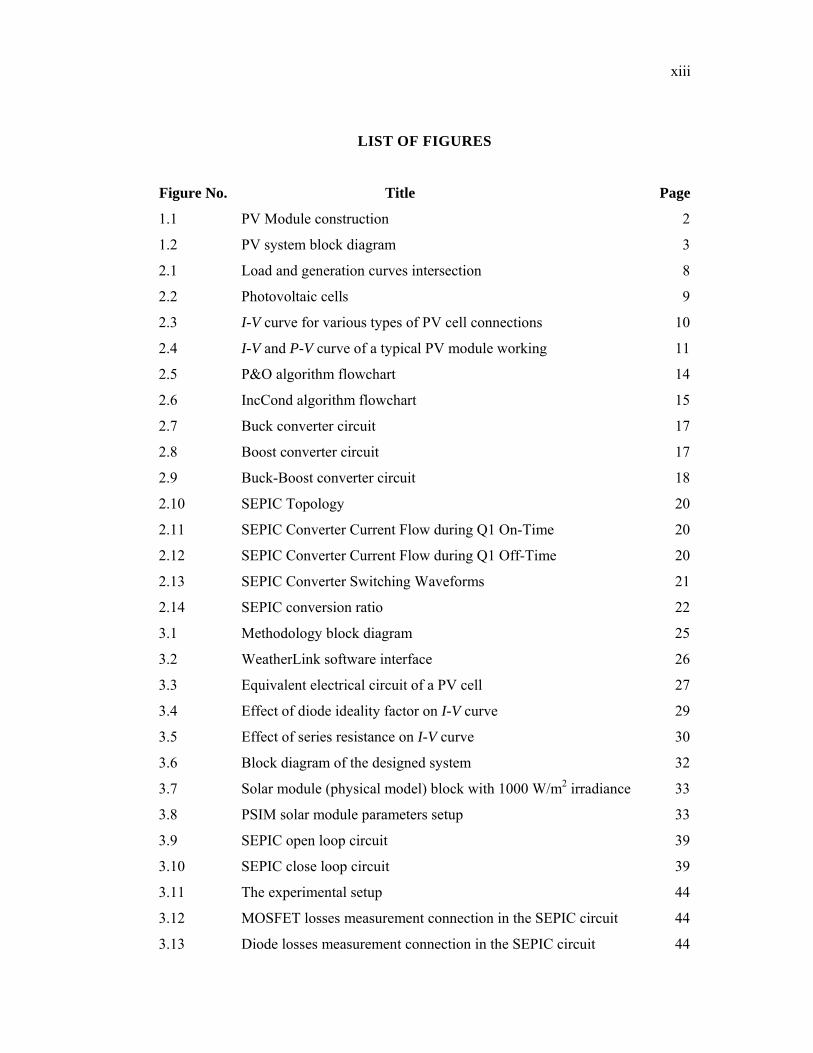
LIST OF FIGURES
Figure No. Title Page
1.1 PV Module construction ............................................................................. 2
1.2 PV system block diagram ........................................................................... 3
2.1 Load and generation curves intersection .................................................... 8
2.2 Photovoltaic cells ........................................................................................ 9
2.3 I-V curve for various types of PV cell connections .................................. 10
2.4 I-V and P-V curve of a typical PV module working ................................. 11
2.5 P&O algorithm flowchart ......................................................................... 14
2.6 IncCond algorithm flowchart .................................................................... 15
2.7 Buck converter circuit ............................................................................... 17
2.8 Boost converter circuit .............................................................................. 17
2.9 Buck-Boost converter circuit .................................................................... 18
2.10 SEPIC Topology ....................................................................................... 20
2.11 SEPIC Converter Current Flow during Q1 On-Time ............................... 20
2.12 SEPIC Converter Current Flow during Q1 Off-Time .............................. 20
2.13 SEPIC Converter Switching Waveforms .................................................. 21
2.14 SEPIC conversion ratio ............................................................................. 22
3.1 Methodology block diagram ..................................................................... 25
3.2 WeatherLink software interface ................................................................ 26
3.3 Equivalent electrical circuit of a PV cell .................................................. 27
3.4 Effect of diode ideality factor on I-V curve .............................................. 29
3.5 Effect of series resistance on I-V curve .................................................... 30
3.6 Block diagram of the designed system ..................................................... 32
3.7 Solar module (physical model) block with 1000 W/m2 irradiance ........... 33
3.8 PSIM solar module parameters setup ....................................................... 33
3.9 SEPIC open loop circuit ........................................................................... 39
3.10 SEPIC close loop circuit ........................................................................... 39
3.11 The experimental setup ............................................................................. 44
3.12 MOSFET losses measurement connection in the SEPIC circuit .............. 44
3.13 Diode losses measurement connection in the SEPIC circuit .................... 44
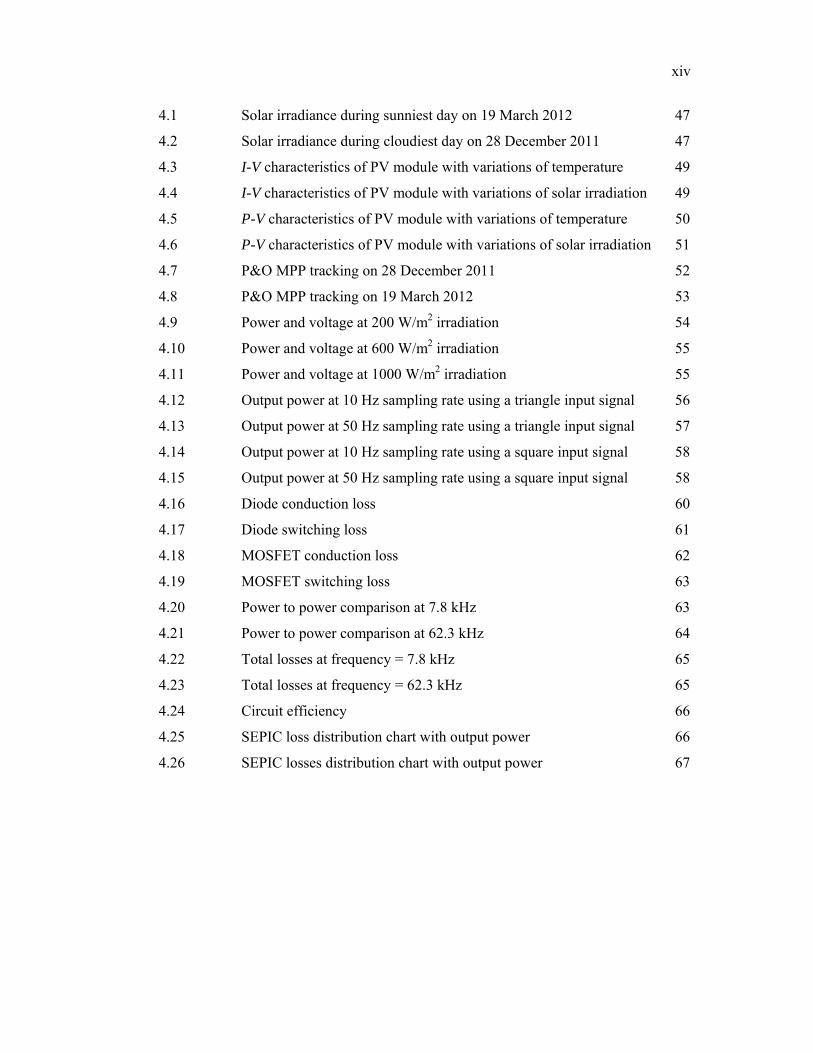
xiv
4.1 Solar irradiance during sunniest day on 19 March 2012 .......................... 47
4.2 Solar irradiance during cloudiest day on 28 December 2011 ................... 47
4.3 I-V characteristics of PV module with variations of temperature ............. 49
4.4 I-V characteristics of PV module with variations of solar irradiation ...... 49
4.5 P-V characteristics of PV module with variations of temperature ............ 50
4.6 P-V characteristics of PV module with variations of solar irradiation ..... 51
4.7 P&O MPP tracking on 28 December 2011 ............................................... 52
4.8 P&O MPP tracking on 19 March 2012 ..................................................... 53
4.9 Power and voltage at 200 W/m2 irradiation .............................................. 54
4.10 Power and voltage at 600 W/m2 irradiation .............................................. 55
4.11 Power and voltage at 1000 W/m2 irradiation ............................................ 55
4.12 Output power at 10 Hz sampling rate using a triangle input signal .......... 56
4.13 Output power at 50 Hz sampling rate using a triangle input signal .......... 57
4.14 Output power at 10 Hz sampling rate using a square input signal ........... 58
4.15 Output power at 50 Hz sampling rate using a square input signal ........... 58
4.16 Diode conduction loss ............................................................................... 60
4.17 Diode switching loss ................................................................................. 61
4.18 MOSFET conduction loss ......................................................................... 62
4.19 MOSFET switching loss ........................................................................... 63
4.20 Power to power comparison at 7.8 kHz .................................................... 63
4.21 Power to power comparison at 62.3 kHz .................................................. 64
4.22 Total losses at frequency = 7.8 kHz .......................................................... 65
4.23 Total losses at frequency = 62.3 kHz ........................................................ 65
4.24 Circuit efficiency ...................................................................................... 66
4.25 SEPIC loss distribution chart with output power ...................................... 66
4.26 SEPIC losses distribution chart with output power .................................. 67
xv
LIST OF SYMBOLS
k Boltzmann constant (1.3806503 × 10⁻²³J/K)
M Conversion ratio
D Duty cycle
n Diode ideality factor
I0 Reverse saturation current of the diode
q Electron charge (1.60217646 × 10⁻¹⁹C)
T Cell temperature in Kelvin = (273+25)
α Temperature coefficient of short circuit current (%/˚C)
G Irradiance (W/m2)
fsw Switching frequency (kHz)
Pm Maximum power
Vmp Voltage at maximum power point
Imp Current at maximum power point
Voc Open circuit voltage
Isc Short circuit voltage
Rs Series resistance
Cs Coupling capacitor
Vth(min) MOSFET minimum threshold voltage
VD Diode forward voltage drop
Inductors current
RDSon MOSFET drain-source resistance
QGD MOSFET gate-drain charge
DCR DC resistance
Qrr Diode reverse recovery charge
Vcf Voltage across diode during turn off condition
xvi
LIST OF ABBREVIATIONS
BJT Bipolar Junction Transistor
CCM Continuous conduction mode
DC Direct current
ESR Electrostatic charge resistance
IGBT Insulated Gate Bipolar Transistors
IncCond Incremental Conductance
I-V curve Current versus Voltage curve
kWp Kilowatt peak
MOSFET Metal Oxide Silicon Field Effect Transistors
MPP Maximum Power Point
MPPT Maximum Power Point Tracking
NREL National Renewable Energy Laboratory
PV Photovoltaic
P-V curve Power versus voltage curve
PWM Pulse-width modulation
P&O Perturb and Observe
RMS Root Mean Square
SCRs Silicon-Controlled Rectifiers
SEPIC Single Ended Primary Inductor Converter
SMPS Switch Mode Power Supplies
STC Standard Test Condition

CHAPTER 1
INTRODUCTION
1.1 OVERVIEW
Over the past few years, there was plenty speculation of fuel price hikes, a world
energy crisis and concerns of global warming. The increasing demand of energy and the
growing concern about the environment has sparked enormous interest in the utilization
of renewable energy. For the time being, renewable energy represents only 7 % of the
global energy consumed and it will slightly increase as the need for the global energy
increased (Bose, 2010). One of the alternative energy sources that are recently
flourishingis the sun, mainly because it is free, sustainable, environmental friendly and
maintenance free.
The sun's energy, which is converted to solar electricity, or photovoltaic (PV), is
likely being one of our major energy sources in the near future. PV is energy from the
sun, which the light is converted directly into electricity without creating any air or
water pollution. It consists of silicon, which going through a doping process to produce
positive and negative type semiconductor materials. When light enters the cell, some of
the photons from the light are absorbed by the semiconductor atoms, freeing electrons
from the cell’s negative layer to flow through an external circuit and back into the
positive layer. The main electrical characteristics of a PV cell or module are
summarized in the relationship between the current and voltage. The solar radiation that
is absorbed by the cell controls the current (I), while the increases in the temperature of
the solar cell reduce its voltage (V). A single PV cell is basically a direct current (DC)
source, where the current is determined by the area of the cell and the amount of
2
exposed solar irradiation. One of the examples of the PV module structure is as shown
in Figure 1.1.
Figure 1.1: PV Module construction
Source: Kroposki, Margolis et al. 2009
There was a long list to show a chronological history of solar PV, but it is
important to know that in 1839, French scientist, Edmond Becquerel, discovered the
photovoltaic effect while experimenting with an electrolytic cell made up of two metal
electrodes placed in an electricity-conducting solution; the electricity-generation
increased when exposed to light. In 1876, William Adams, a British physicist,
discovered a material of photovoltaic which is selenium with his student, Richard Day.
They, altogether, then made it to solid cells with 1 % – 2 % efficiency. And in 2008,
scientists at the U.S. Department of Energy's National Renewable Energy
Laboratory (NREL) have achieved a new world record in solar cell efficiency. They
managed to get a photovoltaic device have 40.8 % of efficiency. The achievement and
evolution in PV industry are really outstanding and exceptional. The PV system is
gaining an important as a renewable source due to advantages such as the absence of
fuel cost, little maintenance and no noise and wear due to the absence of moving parts.
Even though solar energy constitutes a very small percentage of our energy system
today, the size of the resource is enormous which we can state that the earth receives
more energy from the sun in one hour than the global population uses in an entire year
(Kroposki, Margolis et al., 2009).
disa
low
tech
con
201
of p
whe
sav
ene
fair
from
con
com
Tog
PV
wea
the
mo
Althoug
advantages
wer energy c
hnology as t
nsidered a lo
13), thus eve
photovoltaic
erever possi
vings in the
ergy availabl
rly high so it
m the solar
nverter with
mmonly em
gether, the D
V system at o
ather conditi
system. Fig
dule operati
Figu
gh the PV
to the use
conversion
the solar ene
oss. As PV i
ery power th
c power sys
ible. Even m
cost of oper
le from conv
t is importan
r array. To
an appropr
mployed with
DC/DC conv
optimal valu
ion; the outp
gure 1.2 show
on point alw
ure 1.2: PV s
system has
of photovol
efficiency.
ergy that dis
installation a
hat loss durin
tems has re
modest gain
rating the p
ventional sou
nt that the m
maximize t
riate Maxim
hin a contr
verter and M
ues in vario
put power o
ws the PV s
ways at the M
system block
s many adv
ltaic system
Efficiency i
appears with
averagely at
ng the proce
equired syste
ns in overall
ower system
urces the co
maximum ava
the power o
mum Power P
roller devic
MPPT algorith
us solar rad
of a PV pane
system block
MPP.
k diagram fr
vantages, th
s; the high
is the main
hout convert
a cost of ar
ess are costly
em designer
l efficiency
m. Compared
st of energy
ailable amou
output of th
Point Track
ce named S
hm control t
diation cond
el depends o
k diagram th
rom charge c
here are sti
installation
component
ting to electr
round RM50
y. The relativ
rs to maxim
can result
d to the cos
y from photo
unt of energy
he PV syste
king (MPPT)
Solar Charg
the terminal
itions, wher
on the termin
at works to e
controller’s p
ll two maj
cost and th
t in solar P
rical energy
000/kWp (A
vely high co
mize efficienc
in significa
st of electric
ovoltaic is st
y be extracte
em, a DC/D
) algorithm
ge Controlle
voltage of th
re at a certa
nal voltage
ensure the P
perspective
3
or
he
PV
is
li,
ost
cy
ant
cal
ill
ed
DC
is
er.
he
ain
of
PV
4
1.2 PROBLEM STATEMENT
In this thesis, the solar charge controller is being studied in term of efficiency
and performance. Questions have been raised about the efficiency where it is actively
discussed as one of the main issue which is causing either by MPPT algorithm or
DC/DC converter topology (J.M. Enrique, 2006; Esram and Chapman, 2007; A. Dolara,
2009; Patarau, Daraban et al., 2011). Research on the converter efficiency arises in
many scopes, but the one that should be concerned of, is the design of the converter
itself (Kimball, Flowers et al., 2004). There are increasing concern that apart from the
PV system, there are also a need for analysis on DC/DC converters’ efficiency in a wind
farm technology (Prabhakar, Bollinger et al., 2008) which triggered that the efficiency
issue of the DC/DC converters needs to be taken into consideration for the designers
regardless on which applications it will be used. While there has been considerable
research on the efficiency analysis of DC/DC converter, only certain studies have
proposed a new method of DC/DC to improve the converter efficiency (Kim, Lee et al.,
2013; Kawaguchi, Yamaguchi et al., 2008; Al-Saffar, Ismail et al., 2008). One major
issue arose that the converters used for photovoltaic applications had a common
reliability issues, which is a failed electrolytic capacitor used in filters (Lahyani, Venet
et al., 1998). Thus, it is important for the designers not only to maximize the extracted
energy, but also to ensure that the converter does not require failure prone components
like large capacitors. Previous studies of Martin A. Green (2013) on PV module, the
efficiency of conversion of the incident radiation to electrical energy in the PV cell is
low and could be as high as 24.1 % for thin film type module at Standard Test
Condition, STC.
5
1.3 OBJECTIVES
The objectives of this study are:
1. To develop a model of PV module in computer simulation based on varying
solar irradiation at a specific geographical location.
2. To realize a charge controller in computer simulation; consists of PV
module, SEPIC DC/DC converter and control system.
3. To analyze the efficiency and the losses of a SEPIC DC/DC converter via
practical experiment.
1.4 SCOPE AND LIMITATIONS
To achieve the objectives, this study is conducted on a best efforts basis. Like all other
studies, this study is focused at a specific scope and is bounded by limitations. It should
be noted that the study covers the overall study of solar charge controller; from the solar
irradiance, solar panel, DC/DC converter and its controller. The inverter is not part of
the study, and will be looked at as a load from the solar charge controller's perspective.
Objective 1:
Geographical and time scope: The context of the study is based on data logged from the
UMP's weather station at Pekan, Pahang. The data spans for over the period of one year
and three months; from Jan 2011 to March 2012.
Lab resource limitation: The model of PV is based on a readily available PV panel
during the study, the Mitsubishi PV-TE125MF5N.
Objective 2:
For Objective 2, a thorough literature study is conducted, mainly on choosing the
appropriate DC/DC converter topology and the suitable control algorithm. This is
explained in detail in Chapter 2. At the end of the literature review, the study narrowed
to focus on SEPIC DC/DC converter and Perturb & Observe (P&O) algorithm, hence
the title of the thesis. A simulation is conducted to achieve Objective 2, where the
SEPIC with P&O system is tested using the cloudiest and the sunniest data set from the
Objective 1 study.
6
Objective 3:
Objective 3 is about the efficiency and the losses of SEPIC DC/DC converter.
To achieve this objective, a SEPIC DC/DC converter is constructed with the same
parameters and same component sizing as in Objective 2. As for the controller, open-
loop control is sufficient for efficiency analysis, where an Arduino board is used as the
controller. The limitation of the Arduino board applied to the study, especially on the
switching frequencies, where the maximum possible is 62.3 kHz. The converter is
normally operate at swiching frequency higher than 50 kHz (Burmester, Rayudu et al.,
2013).
1.5 OVERVIEW OF THE THESIS
This study has been divided into two parts. The first part deals with the simulation
of solar charge controller while the second part deals with the DC/DC converter
efficiency analysis experiment. The charge controller has a DC/DC converter that using
a Single Ended Primary Inductor Converter (SEPIC) topology. This study includes a
simulation of the PV module and SEPIC circuit model in MATLAB and PSIM
respectively, plus a hardware testing for the SEPIC. The PV module used is the modules
that available in the Fakulti Kejuruteraan Elektrik & Elektronik, Universiti Malaysia
Pahang, which is Mitsubishi PV-TE125MF5N. This thesis is organized in five chapters.
Chapter 1 is a brief introduction of Renewable Energy as a whole and specifically on
the use of the PV system with the concern over its price compare to efficiency. In
Chapter 2, literatures that relevant to the issue are presented along with the reviews of
various books, journals and articles. The literatures focused on the PV cell
characteristics, MPPT algorithm (P&O) and DC/DC converter (SEPIC). Chapter 3
presents the methodology of the study. This chapter includes simulation procedures and
component selection for experimental purposes which involve some calculations.
Chapter 4 is relate or a continuation of Chapter 3 where the results that obtained from
simulation and experiment are presented and discussed. Graphs and figures are included
to be observed and discussed. In the last chapter (Chapter 5), the study is concluded and
summarized based on the methodology used and the results obtained. Moreover, further
works that can be conducted are also recommended.
CHAPTER 2
LITERATURE REVIEW
2.1 INTRODUCTION
French physicist, Edmund Becquerel, discovered the first photovoltaic effect
when he illuminated a metal electrode in an electrolytic solution back in 1839. Then,
William Adams, a British physicist, discovered a material of photovoltaic which is
selenium thirty-seven years later with his student, Richard Day. They, altogether then
made it to solid cells with 1 % – 2 % efficiency (Masters, 2004). The PV timeline
evolution is as per attached in APPENDIX B which is prepared by United States
Department of Energy. PV systems are comprised of photovoltaic cells, devices that
convert light energy directly into electricity. The word photovoltaic comes from
“photo,” meaning light, and “voltaic,” which refers to producing electricity. Therefore,
the photovoltaic process is producing electricity directly from sunlight (S.E.C.O, 1997).
The uses of solar energy become more demanding year by year. PV based
installation demand has grown consistently by 20 %–25 % per annum over the past 20
years (Carrasco, Franquelo et al., 2006). Today, the production of PV cells is following
an exponential growth curve since technological advancement of the late ‘80s that has
started to rapidly improve efficiency.
Despite its rapid growth, there remain several challenges that hinder the
widespread use of PV power systems. The main limitation is the high cost of the
module. It is difficult to ignore that the cost is basically determined by the economics of
scale of a certain country, supply-demand, price of basic material and the cell
manufacturing processes (Taheri, Salam et al., 2010). To ensure that the installation of
8
PV is effective, there is a need to ensure that the power output of the PV modules
should be at its optimum. Several attempts have been made to overcome the problem,
where one evidence suggests that this can be achieved by employing a specific circuit,
famously known as Maximum Power Point Tracker (MPPT) (Rebei, Gammoudi et al.,
2014; Zanotti, dos Santos et al., 2013; Durgadevi, Arulselvi et al., 2011; Coelho, Concer
et al., 2009) . Therefore, an efficient PV module requires the MPPT to assured that the
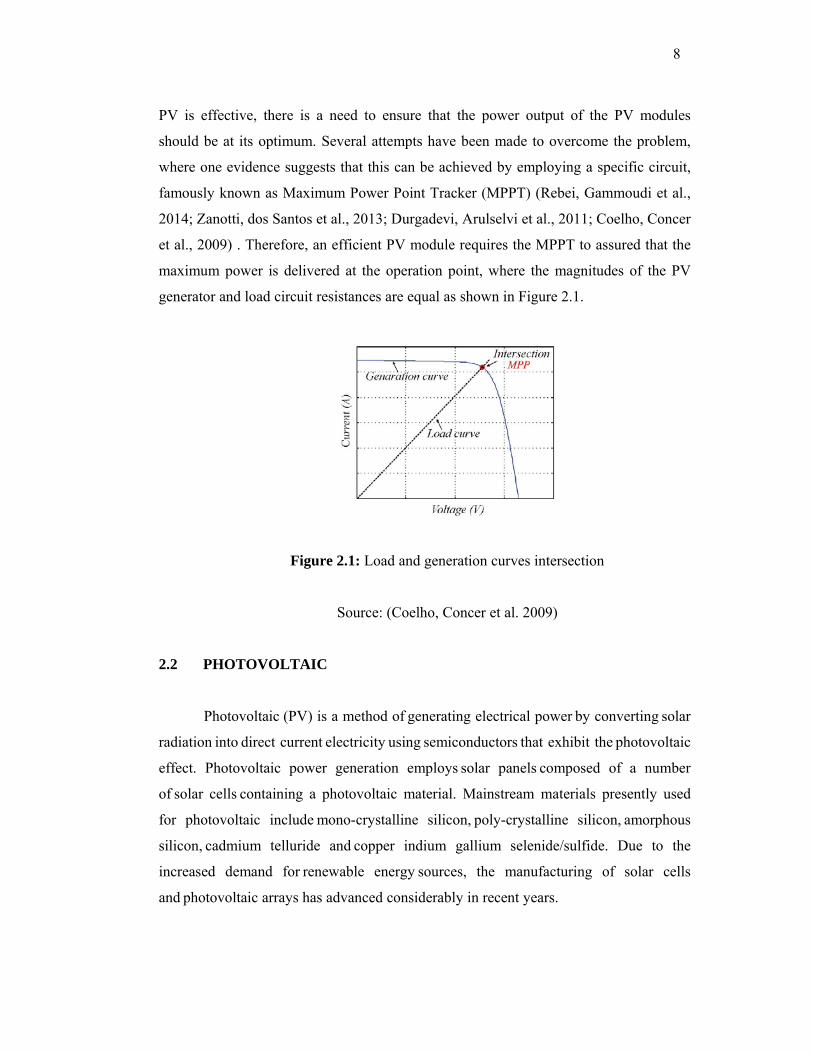
maximum power is delivered at the operation point, where the magnitudes of the PV
generator and load circuit resistances are equal as shown in Figure 2.1.
Figure 2.1: Load and generation curves intersection
Source: (Coelho, Concer et al. 2009)
2.2 PHOTOVOLTAIC
Photovoltaic (PV) is a method of generating electrical power by converting solar
radiation into direct current electricity using semiconductors that exhibit the photovoltaic
effect. Photovoltaic power generation employs solar panels composed of a number
of solar cells containing a photovoltaic material. Mainstream materials presently used
for photovoltaic include mono-crystalline silicon, poly-crystalline silicon, amorphous
silicon, cadmium telluride and copper indium gallium selenide/sulfide. Due to the
increased demand for renewable energy sources, the manufacturing of solar cells
and photovoltaic arrays has advanced considerably in recent years.
2.2
wat
laye
pho
the
laye
elec
betw
the
(V)
dete
vol
be c
2.2
con
amo
.1 Photovo
PV cell
ter pollution
er has a pos
otons from th
cell’s negat
er. This flo
ctrical chara
ween the cu
current (I),
).
A singl
ermined by
tage of an in
connected in
.2 Photovo
PV mod
nnected in s
ount of avai
oltaic Cell
ls convert s
n. PV cells ar
sitive charge
he light are
tive layer to
ow of electr
acteristics o
rrent and vo
while the in
e PV cell is
the area of
ndividual sil
n series to co
oltaic Modu
dules (the ty
eries by two
ilable light f
unlight dire
re made of a
e, the other n
absorbed by
o flow throu
rons produc
f a PV cell
oltage. The s
ncreases in th
Figur
Sourc
s basically a
f the cell an
licon cell is i
onstitute a m
ule
ype of mon
o wires and
falling on th
ectly into el
at least two l
negative. W
y the semicon
ugh an extern
ces electric
l or module
olar radiatio
he temperatu
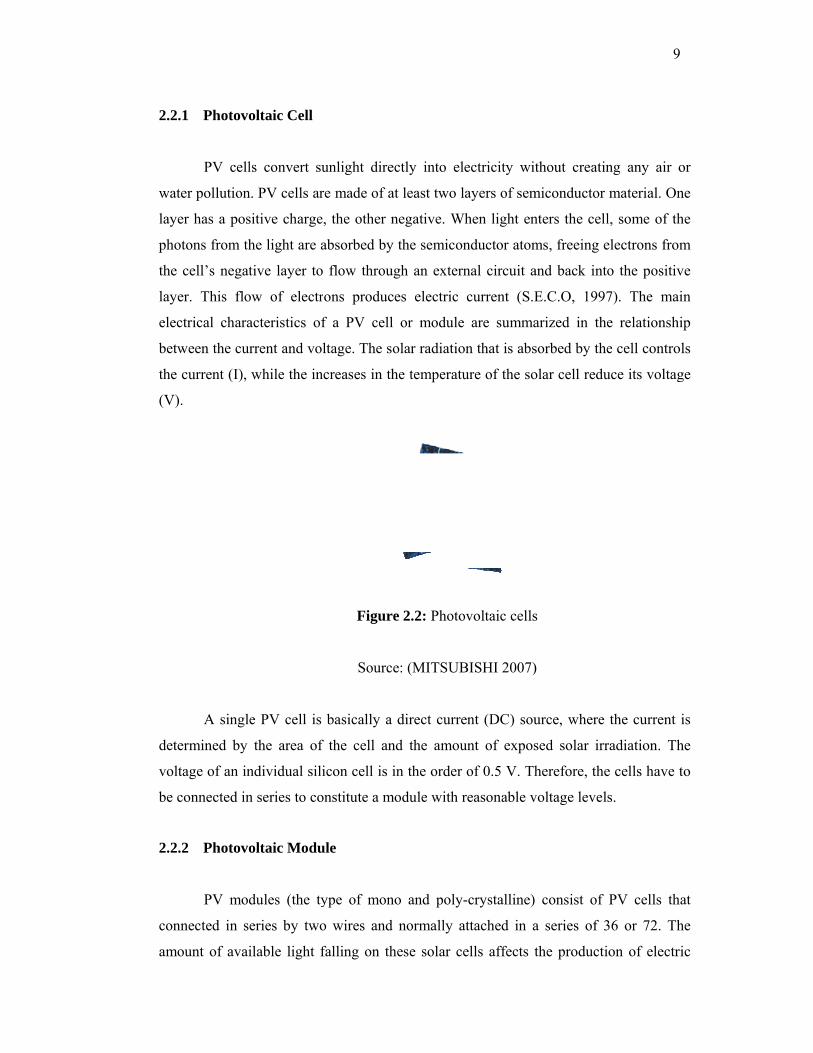
re 2.2: Photo
e: (MITSUB
direct curre
nd the amou
in the order
module with r
no and poly-
d normally a
hese solar ce
ectricity wit
layers of sem
When light en
nductor atom
nal circuit a
current (S.E
e are summa
on that is abs
ure of the so
ovoltaic cells
BISHI 2007)
ent (DC) sou
unt of expos
of 0.5 V. Th
reasonable v
-crystalline)
attached in a
ells affects t
thout creatin
miconductor
nters the cell
ms, freeing e
and back int
E.C.O, 1997
arized in the
sorbed by the
olar cell redu
s
)
urce, where
sed solar irr
herefore, the
voltage level
consist of
a series of 3
the producti
9
ng any air
material. On
l, some of th
electrons fro
o the positiv
7). The ma
e relationsh
e cell contro
uce its voltag
the current
radiation. Th
e cells have
s.
PV cells th
36 or 72. Th
ion of electr
9
or
ne
he
m
ve
ain
hip
ols
ge
is
he
to
hat
he
ric
10
current. The temperature of the cell affects its voltage and the larger the cell, the more
current it will produce. There are various types (Mono-crystalline, Poly-crystalline and
Amorphous) and sizes (typically sized from 60 W to 170 W) of PV module that
available in the PV market worldwide.
The reason to connect the cells in series is to provide a suitable voltage for
battery charging as well as storage (non grid-tied system). Furthermore, it was also
needed for the use of DC/DC converters in the solar charge controller system which
required a specific voltage. Typical PV module use 36 solar cells connected in series
and will have a total voltage of around 16 V (36 x 0.5 V) and this is why the individual
solar PV cells which make up a solar module have a standard size (156 mm x 156 mm)
(Yingli, 2013; KYOCERA, 2011; MITSUBISHI, 2007). There are also available
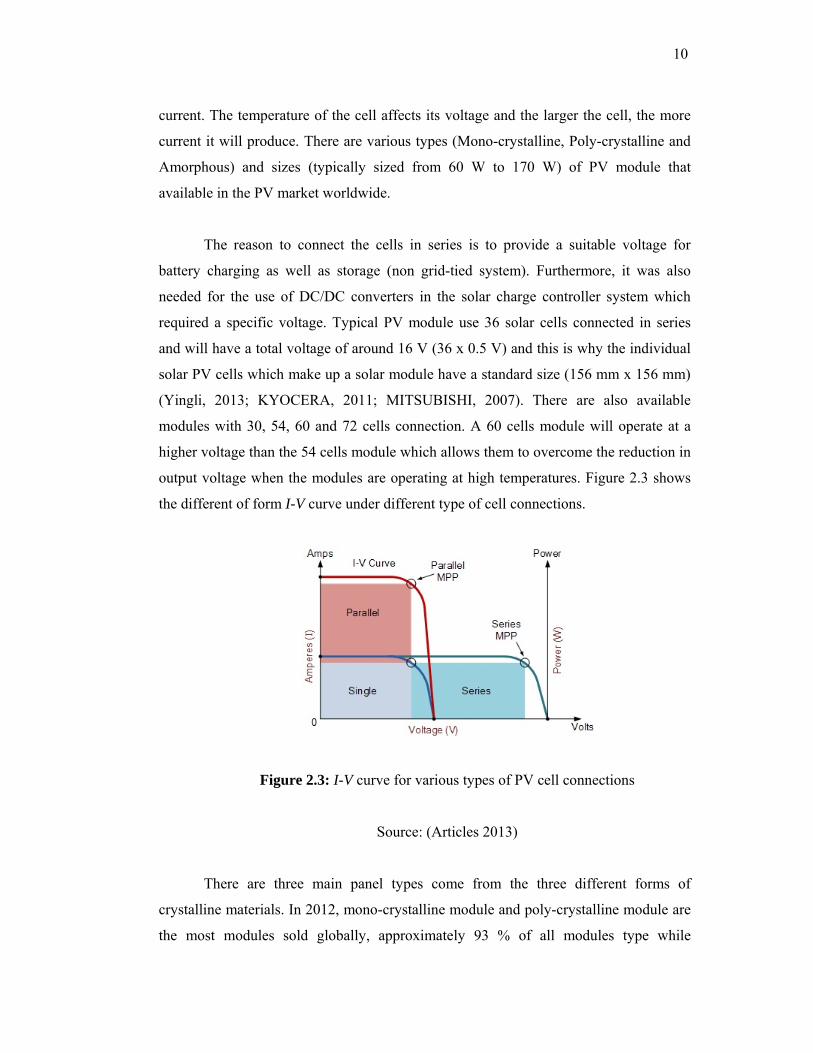
modules with 30, 54, 60 and 72 cells connection. A 60 cells module will operate at a
higher voltage than the 54 cells module which allows them to overcome the reduction in
output voltage when the modules are operating at high temperatures. Figure 2.3 shows
the different of form I-V curve under different type of cell connections.
Figure 2.3: I-V curve for various types of PV cell connections
Source: (Articles 2013)
There are three main panel types come from the three different forms of
crystalline materials. In 2012, mono-crystalline module and poly-crystalline module are
the most modules sold globally, approximately 93 % of all modules type while
11
Amorphous silicon module is approximately only 4.2 % sold globally (EvoEnergy,
2012).
2.2.3 The I-V Curve and Maximum Power Point
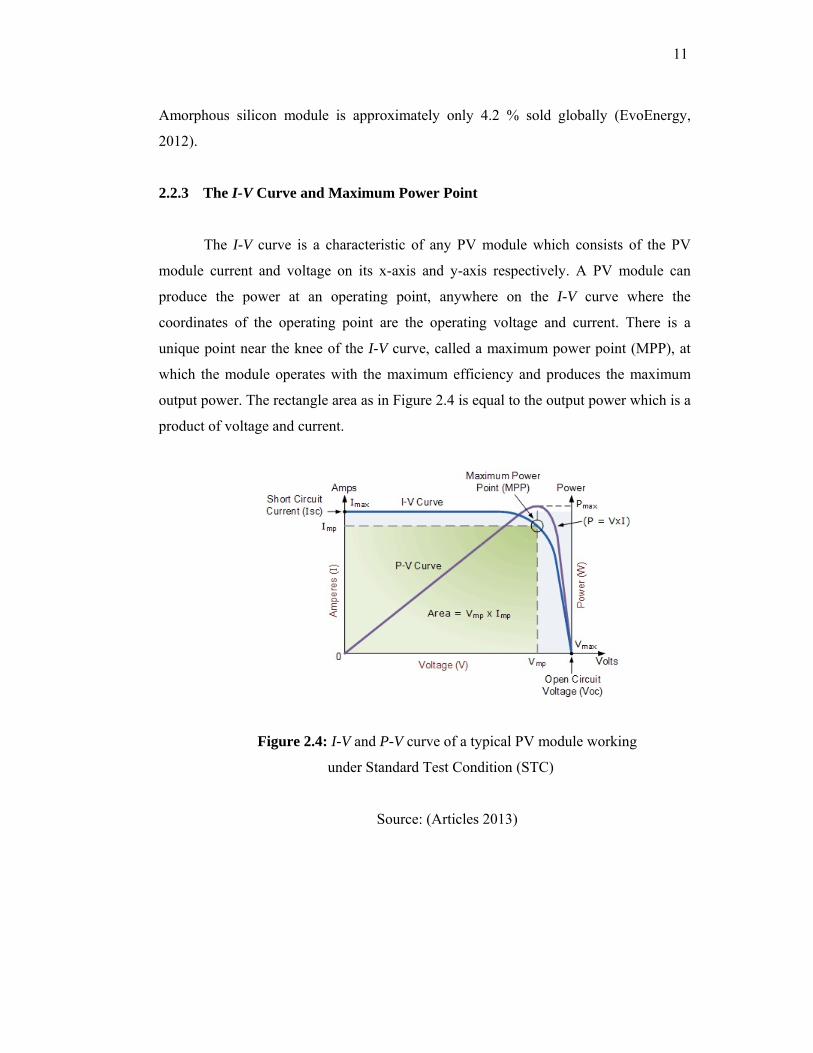
The I-V curve is a characteristic of any PV module which consists of the PV
module current and voltage on its x-axis and y-axis respectively. A PV module can
produce the power at an operating point, anywhere on the I-V curve where the
coordinates of the operating point are the operating voltage and current. There is a
unique point near the knee of the I-V curve, called a maximum power point (MPP), at
which the module operates with the maximum efficiency and produces the maximum
output power. The rectangle area as in Figure 2.4 is equal to the output power which is a
product of voltage and current.
Figure 2.4: I-V and P-V curve of a typical PV module working
under Standard Test Condition (STC)
Source: (Articles 2013)
12
2.3 MAXIMUM POWER POINT TRACKING
Dang (1990), from California Polytechnic State University, Pomona was the
first person that made an attempt to study MPPT on his research. The maximum power
point tracker (MPPT) is now prevalent in grid-tied PV power systems and is becoming
more popular in stand-alone systems. MPPT plays an important role in photovoltaic
(PV) power systems because they maximize the power output from a PV system for a
given set of conditions, and therefore maximize the array efficiency (Abdelmoula,
Moughamir et al., 2014; Durgadevi, Arulselvi et al., 2011). MPPT’s found and maintain
operation at the maximum power point, using an MPPT algorithm. Nowadays, this
algorithm is executed using a microcontroller that used the PV current and voltage data
to control the duty cycle that applied to the DC/DC converter circuit. There are many
researches done on tracking the MPP with the entire algorithm proposed (Burmester,
Rayudu et al., 2013; Muoka, Haque et al., 2012; Hohm and Ropp, 2000) but there is
lack of source on which algorithm is appropriate for a suitable topology of a DC/DC
converter. However, one particular algorithm, the perturb and observe (P&O) method,
claimed by many in the literature to be inferior to others, continues to be by far the most
widely used method in commercial PV MPPT (Charfi and Chaabene, 2014; Byunggyu,
Gwonjong et al., 2011; Kazmi, Goto et al. 2009; Femia, Petrone et al., 2004; Hohm and
Ropp, 2000).
2.3.1 Perturb & Observe Algorithm
The P&O algorithm is a simple method for MPPT. The algorithm is an iteration
based approach to MPPT (Elgendy, Zahawi et al., 2012; Salas, Olías et al., 2006). A
flowchart of the method can be seen in Figure 2.5. The first step in this algorithm is to
sense the current, Ik and voltage, Vk coming out of the PV panel and these values is used
to calculate the output power, Pk of the panel. The algorithm then compares the present
output power with the power from the previous iteration that has been stored in
memory. If the algorithm is just in the first iteration the current power will be compared
against some constant, k placed in the algorithm during programming. The system
compares the difference between the present power and the previous power against a
predefined constant. This constant is placed within the algorithm to ensure that when
13
the method has found the MPP on the PV panel, the duty cycle will remain constant
until any condition changes large enough to change the location of the MPP. If this step
is not included the algorithm would constantly change the duty cycle, causing the
operating point of the panel to move back and forth across the MPP. The movement
across the MPP is an unwanted oscillation that can be disruptive to power flow and
could also cause unwanted loss from not having the operating point right over the MPP
at all times.
The next step in the algorithm is determining whether the current power, Pk is
greater than or less than the previous power, Pk-1. The answer to this tells the algorithm
which branch of the flowchart to take next. No matter which direction the algorithm
takes, the next step is to compare the voltage in the current, Vin(k) and the voltage in the
previous, Vin(k-1) iterations. The voltage comparison tells the algorithm which side of the
MPP the operating point is at thereby allowing the algorithm to adjust the duty cycle in
the right direction, either a positive or a negative addition to the current duty cycle. The
final step of the method is to actually change the duty cycle being output to the
converter, and wait for the converter to stabilize before starting the process all over
again.
The main advantage of choosing the P&O as an algorithm is easier and simple to
implement and its low computational method. However, there are some limitations that
cannot be ignored such like the oscillations around the MPP in steady state operation
and slow response speed. But, these limitations can be reduced by optimizing the
sampling rate depends on the converters’ dynamic (Kollimalla and Mishra, 2014;
Sharma and Purohit, 2012; Femia, Petrone et al., 2004; Liu and Lopes, 2004).