Embed Size (px)
Citation preview
SULFUR DIOXIDE LEVELS – 2013
JAMES BAY, VICTORIA, BRITISH COLUMBIA
PREPARED BY: ELEANOR SETTON, PHD KARLA POPLAWSKI, MSC UNIVERSITY OF VICTORIA – GEOGRAPHY SPATIAL SCIENCES RESEARCH LAB FOR: BRITISH COLUMBIA MINISTRY OF ENVIRONMENT
JANUARY 2014
JAMES BAY NEIGHBOURHOOD
ANALYSIS OF SULFUR DIOXIDE LEVELS – JAMES BAY NEIGHBOURHOOD 2013
i | P a g e
Acknowledgements
The authors would like to acknowledge the significant contributions made by the following individuals, who provided data, or reviewed and commented on preliminary drafts of this report, which greatly improved the overall content and analyses:
Earle Plain British Columbia Ministry of Environment
Rebecca Penz and Al-Nashir Charania Greater Victoria Harbour Authority
Marg Gardiner, Bob Vander Steen, and Tim Van Alstine James Bay Neighbourhood Association
Samantha Rosindell Western Stevedoring Company Inc.
2013 data were collected at the Erie site under a cost sharing agreement between the British Columbia Ministry of the Environment and the Greater Victoria Harbour Authority.
The British Columbia Ministry of the Environment provided funding for the preparation of this report.
ANALYSIS OF SULFUR DIOXIDE LEVELS – JAMES BAY NEIGHBOURHOOD 2013
ii | P a g e
Contents
1. Background and Summary of Results ....................................................................................................... 1
1.1 Objectives............................................................................................................................................ 1
1.2 Summary of Results ............................................................................................................................ 5
2. Methods
3. Ambient SO2 concentrations - 2013 ........................................................................................................ 10
4. Characteristics of SO2 events - 2013 ....................................................................................................... 14
4.1 Diurnal patterns - 2013 ..................................................................................................................... 14
4.2 Maximum events – 2013 ................................................................................................................... 15
4.3 Factors influencing hourly levels - 2013 ........................................................................................... 22
5. Trends and comparisons ......................................................................................................................... 25
5.1 Topaz 2006 to 2013 ........................................................................................................................... 25
5.2 MAML 2009 and Erie 2011 - 2013 .................................................................................................... 35
5.3 Cruise ship visits 2006 - 2013 ............................................................................................................ 39
5.4 Comparison of measured levels pre- and post-ECA sulfur content reduction regulation ................ 41
Appendix A. Vancouver Island Health Authority health guidelines for ambient sulfur dioxide ............... 52
Appendix B. Comparison of wind conditions at alternate sites – Victoria Harbour and James Bay Elementary School .................................................................................................................. 53
ANALYSIS OF SULFUR DIOXIDE LEVELS – JAMES BAY NEIGHBOURHOOD 2013
iii | P a g e
List of Figures Figure 1. Study area ...................................................................................................................................... 3 Figure 2. Diurnal SO2 levels with and without cruise ships– Erie Station 2013 .......................................... 14 Figure 3. Diurnal SO2 levels with and without cruise ships– Topaz Station 2013 ....................................... 15 Figure 4. Hourly SO2 levels by time of day when cruise ships present – Erie 2013 .................................... 23 Figure 5. Hourly SO2 levels by time of day when cruise ships present – Topaz 2013 ................................. 23 Figure 6. Hourly SO2 levels by number of cruise ships present – Erie 2013 ............................................... 24 Figure 7. Hourly SO2 levels by number of cruise ships present – Topaz 2013 ............................................ 24 Figure 8. Percentiles of 10-minute SO2 levels Topaz 2011 to 2013 ........................................................... 26 Figure 9. Percentiles of hourly SO2 levels for hours with cruise ships – Topaz 2006 to 2013 ................... 27 Figure 10. Diurnal SO2 levels on days with cruise ships – Topaz 2006 to 2013 ......................................... 28 Figure 11. Diurnal SO2 levels on days without cruise ships – Topaz 2006 to 2013 .................................... 28 Figure 12. Average hourly temperature for hours with cruise ships – Topaz 2006 to 2013 ..................... 29 Figure 13. Percentiles of average temperature for hours with cruise ships – Topaz 2006 to 2013 .......... 30 Figure 14. Total monthly precipitation for hours with cruise ships – Topaz 2006 to 2013 ....................... 31 Figure 15. Wind speed and direction for hours with cruise ships - Topaz 2008 to 2013 ........................... 32 Figure 16. Percent of time by wind speed for hours with cruise ships - Topaz 2006 to 2013 .................... 33 Figure 17. Percent of time by wind direction for hours with cruise ships - Topaz 2006 to 2013 ............... 34 Figure 18. Percentiles of 10-minute average SO2 levels – Erie 2011 - 2013 ............................................... 36 Figure 19. Percentiles of hourly average SO2 levels for hours with cruise ships – Erie and MAML ........... 37 Figure 20. Diurnal SO2 levels on days with cruise ships – Erie and MAML ................................................ 38 Figure 21. Diurnal SO2 levels on days without cruise ships – Erie and MAML ........................................... 38 Figure 22. Percentiles of 10-minute SO2 levels for hours with cruise ships pre- and post-ECA ................. 43 Figure 24. Percentiles of 24-hour SO2 levels for hours with cruise ships pre- and post-ECA ..................... 45 Figure 25. Topaz station wind speed and direction pre and post ECA – hours with cruise ships .............. 46 Figure 26. Topaz station - percent of time by wind speed for hours with cruise ships .............................. 47 Figure 27. Percentiles of the ratio between 1-hour average NO2 and SO2 during evening hours with
elevated levels at Topaz Station .................................................................................................... 48 Figure 28. Percentiles of hourly average SO2 levels with cruise ships present - Topaz station
(May, June and July only) 2006 - 2013 ........................................................................................... 49 Figure 29. Percent of time by wind direction for hours with cruise ships- Topaz station
(May, June and July only) 2006 - 2013 ........................................................................................... 50 Figure 30. Percent of time by wind speed for hours with cruise ships- Topaz station
(May, June and July only) 2006 - 2013 ........................................................................................... 51 Figure B1. Monitoring locations in the study area ..................................................................................... 53 Figure B2. Wind rose comparisons for hours with cruise ships – May and June 2012 - 2013 ................... 54
ANALYSIS OF SULFUR DIOXIDE LEVELS – JAMES BAY NEIGHBOURHOOD 2013
iv | P a g e
List of Tables
Table 1. Summary of 10-minute, 1-hour, and 24-hour SO2 levels - 2013 ..................................................... 6 Table 2. Seasonal average hourly SO2 levels - 2012 (April – Sept only) ........................................................ 6 Table 3. Summary of 10-minute, 1-hour, and 24-hour SO2 Peak Levels – Pre-and Post-regulation ............ 8 Table 4. Distribution of SO2 levels (10-minute, 1-hour and 24-hour) - 2013 .............................................. 11 Table 5. Seasonal hourly average SO2 levels – 2013 (April – September) .................................................. 11 Table 6. 10-minute average levels at or above guidelines - 2013 ............................................................. 13 Table 7. 1-hour average levels at or above guidelines - 2013 .................................................................... 13 Table 8. 24-hour average levels at or above guidelines - 2013 .................................................................. 13 Table 9. Annual hourly average levels at or above guidelines - 2013 ........................................................ 13 Table 10. 40 highest 10-minute average levels at Erie station - 2013 ........................................................ 17 Table 11. 40 highest 10-minute average levels at Topaz station - 2013 .................................................... 18 Table 12. 20 highest 1-hour average levels at Erie station - 2013 .............................................................. 19 Table 13. 20 highest 1-hour average levels at Topaz station - 2013 .......................................................... 20 Table 14. 10 highest 24-hour average levels at Erie station 2013 .............................................................. 21 Table 15. 10 highest 24-hour average levels at Topaz station 2013........................................................... 22 Table 16. Range of top 40 and top 20 SO2 levels at Topaz station – 2011 - 2013 ...................................... 26 Table 17. Range of top 40 and top 20 SO2 levels at Erie station – 2011 - 2013 .......................................... 35 Table 18. Number of cruise ships visiting and hours with cruise ships present – 2006 to 2013 ................ 39 Table 19. Total ship visits and total associated with top 40 10-minute levels – 2011 - 2013 .................... 39 Table 20. Distribution of 10-minute SO2 levels on Days with Cruise Ships - Pre-ECA and Post-ECA .......... 43 Table 21. Distribution of SO2 levels during hours with cruise ships (1-hour and 24-hour)
Pre-ECA and Post-ECA .................................................................................................................... 44 Table 22. 10-minute average levels at or above guidelines – Pre and Post ECA ....................................... 45 Table 23. 1-hour average levels with cruise ships at or above guidelines – Pre and Post ECA * ............... 45 Table 24. 24-hour average levels on cruise days at or above guidelines – Pre and Post ECA* .................. 46
ANALYSIS OF SULFUR DIOXIDE LEVELS – JAMES BAY NEIGHBOURHOOD 2011
1 | P a g e
1. Background and Summary of Results
1.1 Objectives Since 2006, the British Columbia Ministry of Environment (BC MoE) has been working collaboratively with the Vancouver Island Health Authority (VIHA), the Greater Victoria Harbour Authority (GVHA), the James Bay Neighbourhood Association (JBNA), and researchers at the University of Victoria’s Geography department, to investigate local air quality. In accordance with recommendations made by the VIHA in 20101
, the GVHA partnered with the BC MoE to establish a community monitoring site in the James Bay neighbourhood of Victoria, BC, referred to as the Erie site or station in this report, to measure levels of SO2 from 2011 to 2013. The Erie site was selected after considering the results of previous dispersion modelling work and also taking into account security, power, temperature controlled environment, and communications requirements.
Under the International Maritime Organization (IMO) MARPOL Annex VI2, sulfur content in marine fuel was limited to 1 percent (10,000 ppm) as of August 1st 2012 within the North American Emissions Control Area (ECA), which covers navigable waters within approximately 200 nautical miles of the coast3
Prior to August 1st of 2012, marine fuels could have contained up to 3.5 percent sulfur. In addition to MARPOL Annex VI, emissions from cruise ships to air are also regulated under the Canadian Shipping Act
.
4
. Section 119-2 limits the amount of smoke of density level 2 to no more than 4 minutes (total aggregate time) in any 30 minute period, and otherwise (Section 119-1) must not emit smoke of density greater than 1. The measurement of smoke density is described in Section 118-1 and 118-2. No reported smoke density information for cruise ships approaching the Ogden Point terminal was identified for inclusion in this report.
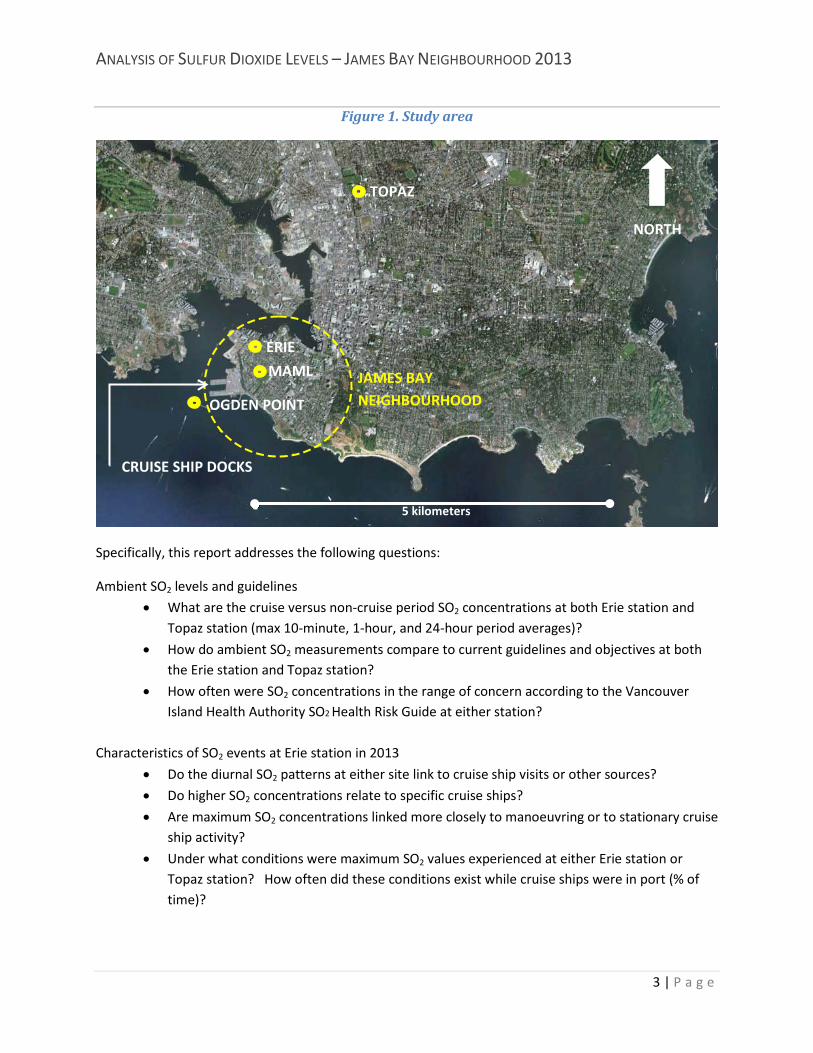
This report provides an analysis of the data collected at the Erie station between May and September, 2013, in comparison to data collected at the same site in 2011 and 2012, the Mobile Air Monitoring Lab (MAML) location in James Bay (2009), and the nearby BC MoE Topaz Station (2006 – 2013) (see Figure 1 for locations). Also included is an analysis of measured SO2 levels before and after August 1st, 2012, when the regulatory change in fuel sulfur content came into effect.
1 Health Review and Response to James Bay Phase III Air Quality Monitoring (June 2010). http://www.viha.ca/mho/air_quality.htm 2 International Maritime Organization. http://www.imo.org/OurWork/Environment/PollutionPrevention/AirPollution/Pages/The-Protocol-of-1997-%28MARPOL-Annex-VI%29.aspx 3 Sulfur content will be further limited to 0.1 percent (1,000 ppm) as of January 1st, 2015. 4 Vessel Pollution and Dangerous Chemicals Regulations (SOR/2012-69). http://laws-lois.justice.gc.ca/eng/regulations/SOR-2012-69/index.html
ANALYSIS OF SULFUR DIOXIDE LEVELS – JAMES BAY NEIGHBOURHOOD 2013
2 | P a g e
ANALYSIS OF SULFUR DIOXIDE LEVELS – JAMES BAY NEIGHBOURHOOD 2013
3 | P a g e
Figure 1. Study area
Specifically, this report addresses the following questions:
Ambient SO2 levels and guidelines
• What are the cruise versus non-cruise period SO2 concentrations at both Erie station and Topaz station (max 10-minute, 1-hour, and 24-hour period averages)?
• How do ambient SO2 measurements compare to current guidelines and objectives at both the Erie station and Topaz station?
• How often were SO2 concentrations in the range of concern according to the Vancouver Island Health Authority SO2 Health Risk Guide at either station?
Characteristics of SO2 events at Erie station in 2013
• Do the diurnal SO2 patterns at either site link to cruise ship visits or other sources?
• Do higher SO2 concentrations relate to specific cruise ships?
• Are maximum SO2 concentrations linked more closely to manoeuvring or to stationary cruise ship activity?
• Under what conditions were maximum SO2 values experienced at either Erie station or Topaz station? How often did these conditions exist while cruise ships were in port (% of time)?
TOPAZ
CRUISE SHIP DOCKS
OGDEN POINT
ERIE
JAMES BAY NEIGHBOURHOOD
NORTH
5 kilometers
MAML
ANALYSIS OF SULFUR DIOXIDE LEVELS – JAMES BAY NEIGHBOURHOOD 2013
4 | P a g e
Comparison of SO2 levels - 2006 to 2013
• How do levels measured at Topaz (2006 – 2013), MAML (2009) and Erie (2011-2013) compare?
• What factors influence the observed differences:
• Were meteorological conditions experienced over the 2013 cruise ship season similar to previous years?
• If anomalous, in what way (temperature, precipitation, wind speed and direction)? Comparison of SO2 levels before and after fuel sulfur content regulation change
• How do levels measured at Topaz and Erie stations before August 1st, 2012 compare to levels measured after the regulated change in fuel sulphur content?
• What factors influence the observed differences:
• Were meteorological conditions experienced before and after the regulatory change similar?
• If anomalous, in what way? NOTE: In previous years, wind speed and direction were available from Topaz station and from Ogden Point (near Erie station). In 2013, wind speed and direction were not recorded after June 30th at Ogden Point, so analysis of wind speed and direction is limited to Topaz station in this report. Previous reports that include analyses of wind speed and direction at Ogden Point for Topaz and Erie stations are available at: http://www.viha.ca/mho/air_quality.htm
ANALYSIS OF SULFUR DIOXIDE LEVELS – JAMES BAY NEIGHBOURHOOD 2013
5 | P a g e
1.2 Summary of Results
Key findings of this report include:
• Elevated levels of SO2 were clearly associated with the presence of cruise ships at both Erie and Topaz stations, but levels during these periods were lower in 2013 than in previous years. Measured levels without cruise ships present suggest other minor sources of SO2 are present in the region, but maximum levels do not reach the same peaks associated with the presence of cruise ships.
• At Topaz station in 2013, no local, provincial, federal, or World Health Organization (WHO) air quality guidelines for 10-minute, 1-hour or 24-hour average levels were exceeded.
• At Erie station in 2013, one 24-hour period exceeded the WHO 24-hour average guideline of 20
µg/m3. No other guidelines were exceeded.
• The maximum 10-minute average level when cruise ships were present was substantially lower
in 2013 than in 2012 at Topaz station (85 µg/m3 versus 269 µg/m3) and at Erie station (258
µg/m3 versus 636 µg/m3).
• 1-hour average levels measured at Topaz and Erie stations in 2013 were lower than those measured in previous years when cruise ships were present, with maximum levels being
approximately 40 to 60 percent lower than those recorded in 2012 (156 µg/m3 versus 266
µg/m3 at Erie and 47 µg/m3 versus 126 µg/m3 at Topaz).
• The diurnal (time of day) patterns of 1-hour average SO2 levels at Topaz station and Erie stations in 2013 showed the influence of cruise ship emissions. At Erie station, average diurnal levels when cruise ships were present were lower in 2013 than in 2011 or 2012. At Topaz station, these levels were among the lowest recorded since 2005.
• In general, measured levels from August 1st 2012 and September 30th 2013 (post-ECA) were lower than those measured between May 1st 2011 and July 31st, 2012 (pre-ECA), although different meteorological conditions and different ships in port make it difficult to attribute the difference solely to the change in fuel sulfur content.
• The impacts of various meteorological conditions on SO2 levels are complex and the magnitude of these effects is not clear. Based on the (limited) analyses presented in this report, it would not be unreasonable, however, to conclude that meteorological characteristics are not the only factors influencing SO2 levels in the study area , but act in combination with ship schedules , fuel sulfur content and operating practices when near and at dock.
Additional details are summarized here, and full data analyses are presented in each report section.
ANALYSIS OF SULFUR DIOXIDE LEVELS – JAMES BAY NEIGHBOURHOOD 2013
6 | P a g e
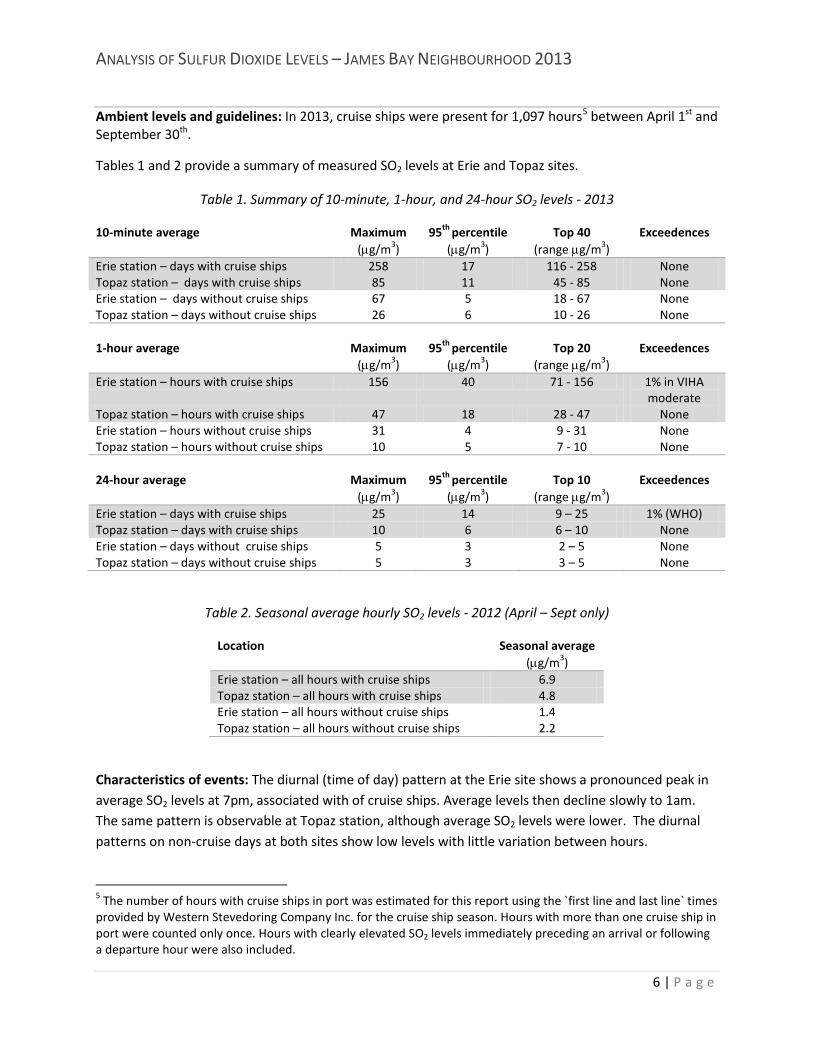
Ambient levels and guidelines: In 2013, cruise ships were present for 1,097 hours5
Tables 1 and 2 provide a summary of measured SO2 levels at Erie and Topaz sites.
between April 1st and September 30th.
Table 1. Summary of 10-minute, 1-hour, and 24-hour SO2 levels - 2013
10-minute average Maximum (µg/m3)
95th percentile (µg/m3)
Top 40 (range µg/m3)
Exceedences
Erie station – days with cruise ships 258 17 116 - 258 None Topaz station – days with cruise ships 85 11 45 - 85 None Erie station – days without cruise ships 67 5 18 - 67 None Topaz station – days without cruise ships 26 6 10 - 26 None 1-hour average Maximum
(µg/m3) 95th percentile
(µg/m3) Top 20
(range µg/m3) Exceedences
Erie station – hours with cruise ships 156 40 71 - 156 1% in VIHA moderate
Topaz station – hours with cruise ships 47 18 28 - 47 None Erie station – hours without cruise ships 31 4 9 - 31 None Topaz station – hours without cruise ships 10 5 7 - 10 None 24-hour average Maximum
(µg/m3) 95th percentile
(µg/m3) Top 10
(range µg/m3) Exceedences
Erie station – days with cruise ships 25 14 9 – 25 1% (WHO) Topaz station – days with cruise ships 10 6 6 – 10 None Erie station – days without cruise ships 5 3 2 – 5 None Topaz station – days without cruise ships 5 3 3 – 5 None
Table 2. Seasonal average hourly SO2 levels - 2012 (April – Sept only)
Location Seasonal average (µg/m3)
Erie station – all hours with cruise ships 6.9 Topaz station – all hours with cruise ships 4.8 Erie station – all hours without cruise ships 1.4 Topaz station – all hours without cruise ships 2.2
Characteristics of events: The diurnal (time of day) pattern at the Erie site shows a pronounced peak in average SO2 levels at 7pm, associated with of cruise ships. Average levels then decline slowly to 1am. The same pattern is observable at Topaz station, although average SO2 levels were lower. The diurnal patterns on non-cruise days at both sites show low levels with little variation between hours.
5 The number of hours with cruise ships in port was estimated for this report using the `first line and last line` times provided by Western Stevedoring Company Inc. for the cruise ship season. Hours with more than one cruise ship in port were counted only once. Hours with clearly elevated SO2 levels immediately preceding an arrival or following a departure hour were also included.
ANALYSIS OF SULFUR DIOXIDE LEVELS – JAMES BAY NEIGHBOURHOOD 2013
7 | P a g e
The highest forty 10-minute average levels, highest twenty 1-hour average levels, and highest ten 24-hour average levels measured at Erie station and Topaz station occurred when cruise ships were present. While it is difficult to attribute elevated SO2 levels to particular ships when more than one is in port, some elevated levels occurred when a single ship was nearby or at dock.
Hourly average levels depend on a complex relationship among numerous factors, including wind speed and wind direction in relation to the cruise ships and the monitoring sites; however, simple analyses suggest the following:
• In 2013, higher levels occurred during in evening hours, sometimes when only one ship was present, but not always when more than one ship was present. Unlike previous years, higher levels were more frequently observed when three ships were in port. This may reflect different ship schedules (i.e., ships with higher emissions more frequently arriving with other ships at the same time).
• Analysis of SO2 levels according to wind speed and direction was conducted for Topaz station only in 2013 as data from Ogden Point were incomplete (May-June only). In previous years, higher hourly average levels were measured at Erie and Topaz most often when winds were from 200o to 250o, which occurred about 50 percent of the time. In addition, elevated levels varied in relation to wind speed recorded at each station, with no clear relationship, but elevated levels at Erie station were more likely when wind speeds were higher at Ogden Point. Conversely, higher levels at Topaz station were more likely when wind speeds were lower at Ogden Point.6,7
Trends and Comparisons in hourly levels 2006 – 2013:
Topaz Site: At the Topaz site, the highest peak hourly average levels of SO2 when cruise ships were present were recorded in 2009, and the lowest peak levels were recorded in 2013. The diurnal pattern for hours with cruise ships present recorded at Topaz in each year (2006 to 2013 inclusive) shows reduced evening levels in 2013. The evening peak average level is lowest in 2013, although average levels after the peak up to 1am were generally slightly higher than those recorded in 2005 and 2007, as well as 2006 (but only at 12 midnight and 1am). The diurnal pattern for hours without cruise ships is
similar in 2013 to all other years, with average levels being typically below 5 µg/m3.
Temperature and wind direction measured at Topaz station were similar in 2013 to previous years (2006 -2012); however, wind speeds at Topaz were markedly lower in 2013 than in previous years, and precipitation in September 2013 was markedly higher. These factors may have influenced measured SO2
levels in 2013, along with other factors such as the number of ships arriving and departing concurrently, the type of ship(s) present, ship operations while nearby and at dock, and the sulfur content of the fuel burned. Data were not available to allow for full evaluation of these factors. 6 Setton E, Poplawski K, Ma C. April 2013. Sulfur Dioxide Levels – 2012 James Bay, Victoria, British Columbia. University of Victoria Spatial Sciences Research Lab. Prepared for the British Columbia Ministry of Environment. 7 Setton E, Poplawski K. August 2012. Sulfur Dioxide Levels – 2012 James Bay, Victoria, British Columbia. University of Victoria Spatial Sciences Research Lab. Prepared for the British Columbia Ministry of Environment.
ANALYSIS OF SULFUR DIOXIDE LEVELS – JAMES BAY NEIGHBOURHOOD 2013
8 | P a g e
Erie Site: Hourly average SO2 levels measured in the James Bay neighbourhood at Erie station in 2013 when cruise ships were present were lower than those measured in 2011 and 2012. The diurnal pattern in 2013 showed lower average levels for each hourly period compared to 2011 or 2012, with the exception of 10pm and 11pm, when average levels were slightly higher than in 2012. The peak occurred
at 7pm, and was much lower than in previous years (8 µg/m3 versus 20 µg/m3). The diurnal pattern for hours without cruise ships at Erie station was similar in 2013 to previous years, with average levels being
below 5 µg/m3.
No analysis of wind speed or direction was possible for Erie station. Instruments at Ogden Point were not functioning properly and provided valid data only for May and June of the 2013 cruise ship season. Data from the Environment Canada weather station in Victoria Harbour and the James Bay Elementary School site operated by the University of Victoria's School-based Weather Station Network were reviewed, but found to be unsuitable for comparison purposes (Appendix B).
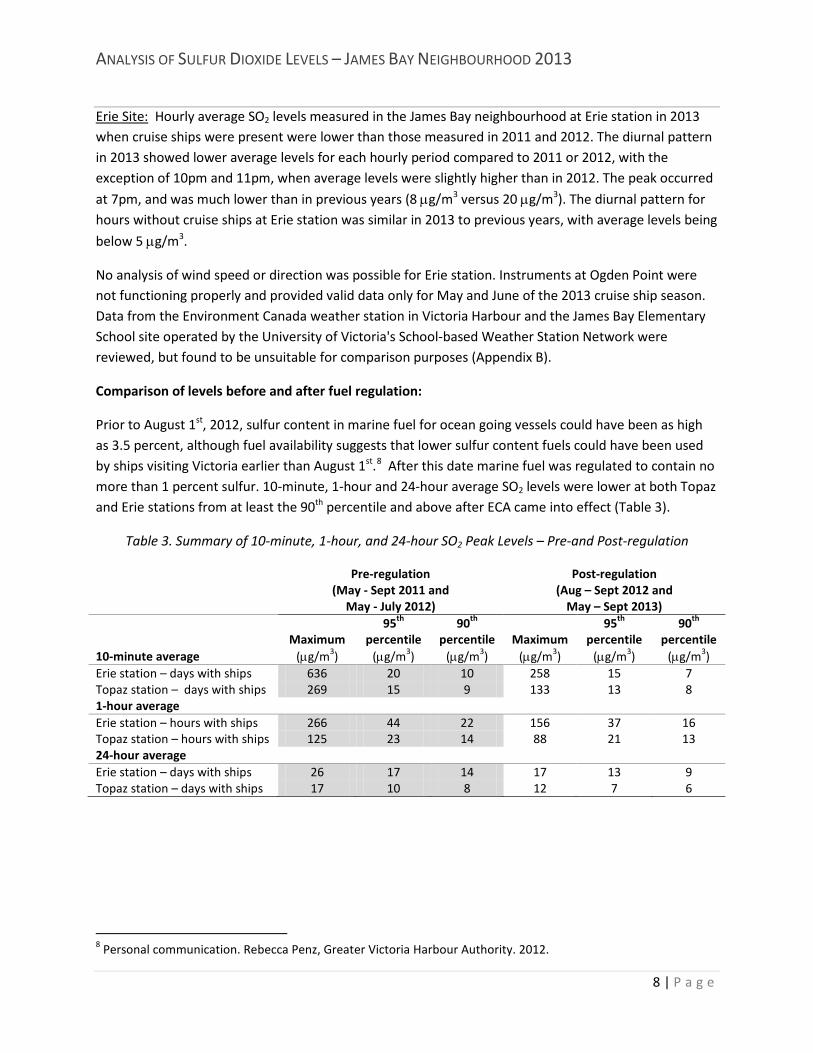
Comparison of levels before and after fuel regulation:
Prior to August 1st, 2012, sulfur content in marine fuel for ocean going vessels could have been as high as 3.5 percent, although fuel availability suggests that lower sulfur content fuels could have been used by ships visiting Victoria earlier than August 1st.8
Table 3. Summary of 10-minute, 1-hour, and 24-hour SO2 Peak Levels – Pre-and Post-regulation
After this date marine fuel was regulated to contain no more than 1 percent sulfur. 10-minute, 1-hour and 24-hour average SO2 levels were lower at both Topaz and Erie stations from at least the 90th percentile and above after ECA came into effect (Table 3).
Pre-regulation (May - Sept 2011 and
May - July 2012)
Post-regulation (Aug – Sept 2012 and
May – Sept 2013)
Maximum (µg/m3)
95th
percentile (µg/m3)
90th
percentile (µg/m3)
Maximum (µg/m3)
95th
percentile (µg/m3)
90th
percentile (µg/m3) 10-minute average
Erie station – days with ships 636 20 10 258 15 7 Topaz station – days with ships 269 15 9 133 13 8 1-hour average Erie station – hours with ships 266 44 22 156 37 16 Topaz station – hours with ships 125 23 14 88 21 13 24-hour average Erie station – days with ships 26 17 14 17 13 9 Topaz station – days with ships 17 10 8 12 7 6
8 Personal communication. Rebecca Penz, Greater Victoria Harbour Authority. 2012.
ANALYSIS OF SULFUR DIOXIDE LEVELS – JAMES BAY NEIGHBOURHOOD 2013
9 | P a g e
2. Methods
All 1-hour and 24-hour SO2 data from Topaz and Erie stations for 2013 were downloaded from the BC MoE website and adjusted from Pacific Standard Time to Pacific Daylight Savings Time9. 10-minute SO2 data from Topaz and Erie stations were provided by BC MoE staff. Data recorded between 11am and 12:20pm on June 13th, 2013 were removed from the 10-minute data set for Erie station as anomalously high levels were included that were associated with instrument calibration10
All SO2 levels were converted from parts per billion (ppb) to micrograms per cubic meter (µg/m3) by multiplying by 2.62, and all negative data were removed and left blank. Prior to conversion, 0.5 ppb was
added to all 10-minute averages; therefore, these may be overestimated by up to 2.6 µg/m3 (for example, if raw data reported 1 ppb, the possible error would be +/- 0.5 ppb, the corrected value would
be between 0.5 to 1.5 ppb, or 1.31 to 3.93 µg/m3. If the actual value was 0.5 ppb (1.31 µg/m3) then
adding the error factor would overestimate the level by 2.62 µg/m3). All instruments were maintained and calibrated by MoE staff. Instrument calibration and audit records for Topaz and Erie stations are available on request to BC MoE.
. These data did not affect the 1-hour and 24-hour averages.
Data for wind direction, wind speed, temperature, and precipitation at Topaz station for 2006 – 2013 were also downloaded from the BC MoE website and adjusted from Pacific Standard Time to Pacific Daylight Savings Time. Instrument descriptions and maintenance/calibration records are available on request to BC MoE.
Cruise ship arrivals and departures (recorded as first line and last line in Pacific Daylight Savings Time) for 2006 to 2012 were provided by Western Stevedoring Company Ltd.
9 Data download at http://envistaweb.env.gov.bc.ca/ 10 Personal communication, June 14, 2013. Earle Plain, BC Ministry of Environment.
ANALYSIS OF SULFUR DIOXIDE LEVELS – JAMES BAY NEIGHBOURHOOD 2013
10 | P a g e
3. Ambient SO2 concentrations - 2013 Distributions of 10-minute average, 1-hour average, 24-hour average and seasonal hourly average levels of SO2 are presented in Tables 4 and 5.
On days with cruise ships present, 10-minute average levels ranged from 1 to 258 µg/m3 at Erie station,
and from 0 to 85 µg/m3 at Topaz station, in comparison to days without cruise ships present when levels
ranged from 1 to 67 µg/m3 and 0 to 26 µg/m3 at Erie station and Topaz station respectively.
Hourly averages when cruise ships were present ranged from <1 to 156 µg/m3 and 0 to 47 µg/m3 at Erie
and Topaz stations respectively, compared to 0 to 31 µg/m3 and 0 to 10 µg/m3 during hours without cruise ships.
Average 24-hour levels ranged from <1 to 25 µg/m3 at Erie station and from <1 to 10 µg/m3 at Topaz station on days with cruise ships present, and were lower on days without cruise ships present: 0 to 5
µg/m3 at Erie station and <1 to 4 µg/m3 at Topaz station.
Measured levels without cruise ships present suggest other sources of SO2 are present in the region, but levels do not reach the same peaks associated with the presence of cruise ships.
In general:
• The distribution of 10-minute average levels was higher at Erie station on days with cruise ships than days without cruise ships from the 75th percentile upward. At Topaz station, the distribution was higher on days with cruise ships than on days without from the 25th percentile upward.
• The distribution of 10-minute average levels was higher at Erie station than at Topaz station from the 95th percentile on days with cruise ships, and from the 97th percentile on days without cruise ships present.
• The distributions of 1-hour average levels at both Erie and Topaz stations were higher during hours with cruise ships than during hours without cruise ships at the 75th percentile and upward.
• The distribution of 1-hour averages was higher at Erie station than at Topaz station during hours with cruise ships in port from the 90th percentile upward, and only above the 99th percentile and upward during hours without cruise ships.
• The distributions of 24-hour average levels at both Erie and Topaz stations were higher during hours with cruise ships than during hours without cruise ships from the 50th and 25th percentiles and upward respectively.
• The distribution of 24-hour average levels was consistently higher at Erie station than at Topaz station on days with cruise ships in port from the 75th percentile.
• 24-hour averages were very similar (+/- 1 µg/m3) at both Erie station and Topaz station on days without cruise ships.
ANALYSIS OF SULFUR DIOXIDE LEVELS – JAMES BAY NEIGHBOURHOOD 2013
11 | P a g e
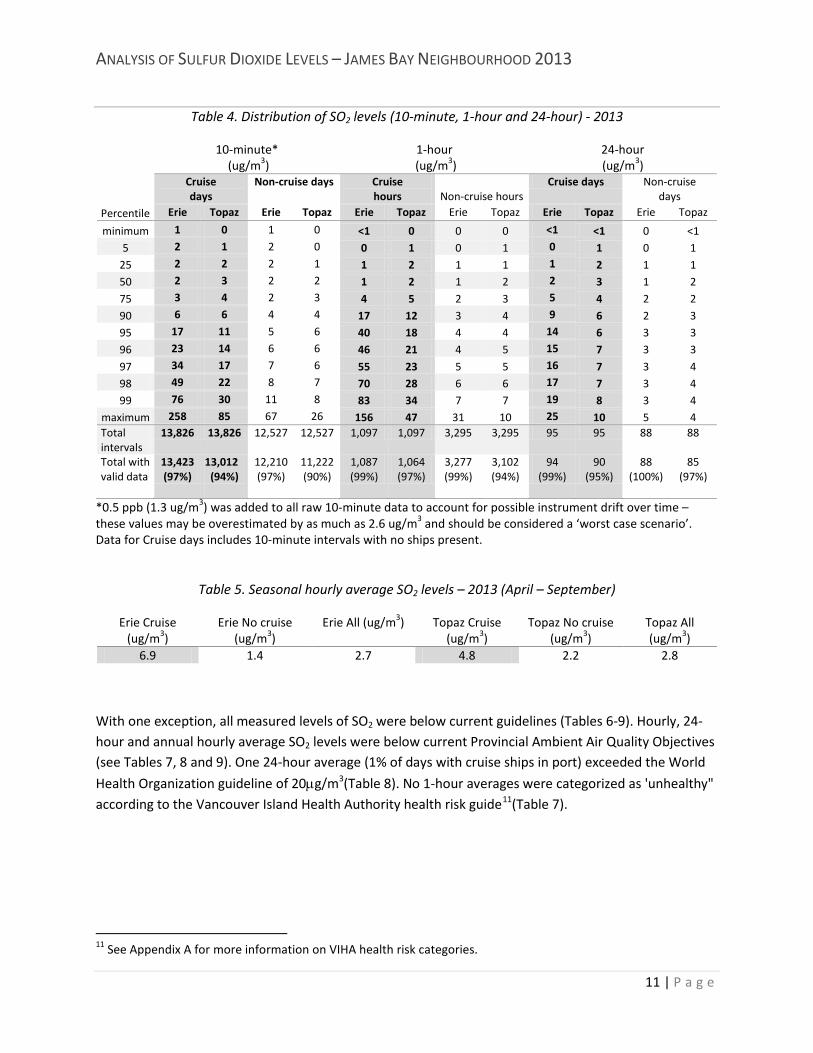
Table 4. Distribution of SO2 levels (10-minute, 1-hour and 24-hour) - 2013
10-minute*
(ug/m3) 1-hour
(ug/m3) 24-hour (ug/m3)
Cruise days
Non-cruise days Cruise hours Non-cruise hours
Cruise days Non-cruise days
Percentile Erie Topaz Erie Topaz Erie Topaz Erie Topaz Erie Topaz Erie Topaz
minimum 1 0 1 0 <1 0 0 0 <1 <1 0 <1 5 2 1 2 0 0 1 0 1 0 1 0 1
25 2 2 2 1 1 2 1 1 1 2 1 1 50 2 3 2 2 1 2 1 2 2 3 1 2 75 3 4 2 3 4 5 2 3 5 4 2 2 90 6 6 4 4 17 12 3 4 9 6 2 3 95 17 11 5 6 40 18 4 4 14 6 3 3 96 23 14 6 6 46 21 4 5 15 7 3 3 97 34 17 7 6 55 23 5 5 16 7 3 4 98 49 22 8 7 70 28 6 6 17 7 3 4 99 76 30 11 8 83 34 7 7 19 8 3 4
maximum 258 85 67 26 156 47 31 10 25 10 5 4 Total intervals
13,826 13,826 12,527 12,527 1,097 1,097 3,295 3,295 95 95 88 88
Total with valid data
13,423 (97%)
13,012 (94%)
12,210 (97%)
11,222 (90%)
1,087 (99%)
1,064 (97%)
3,277 (99%)
3,102 (94%)
94 (99%)
90 (95%)
88 (100%)
85 (97%)
*0.5 ppb (1.3 ug/m3) was added to all raw 10-minute data to account for possible instrument drift over time – these values may be overestimated by as much as 2.6 ug/m3 and should be considered a ‘worst case scenario’. Data for Cruise days includes 10-minute intervals with no ships present.
Table 5. Seasonal hourly average SO2 levels – 2013 (April – September)
Erie Cruise (ug/m3)
Erie No cruise (ug/m3)
Erie All (ug/m3) Topaz Cruise (ug/m3)
Topaz No cruise (ug/m3)
Topaz All (ug/m3)
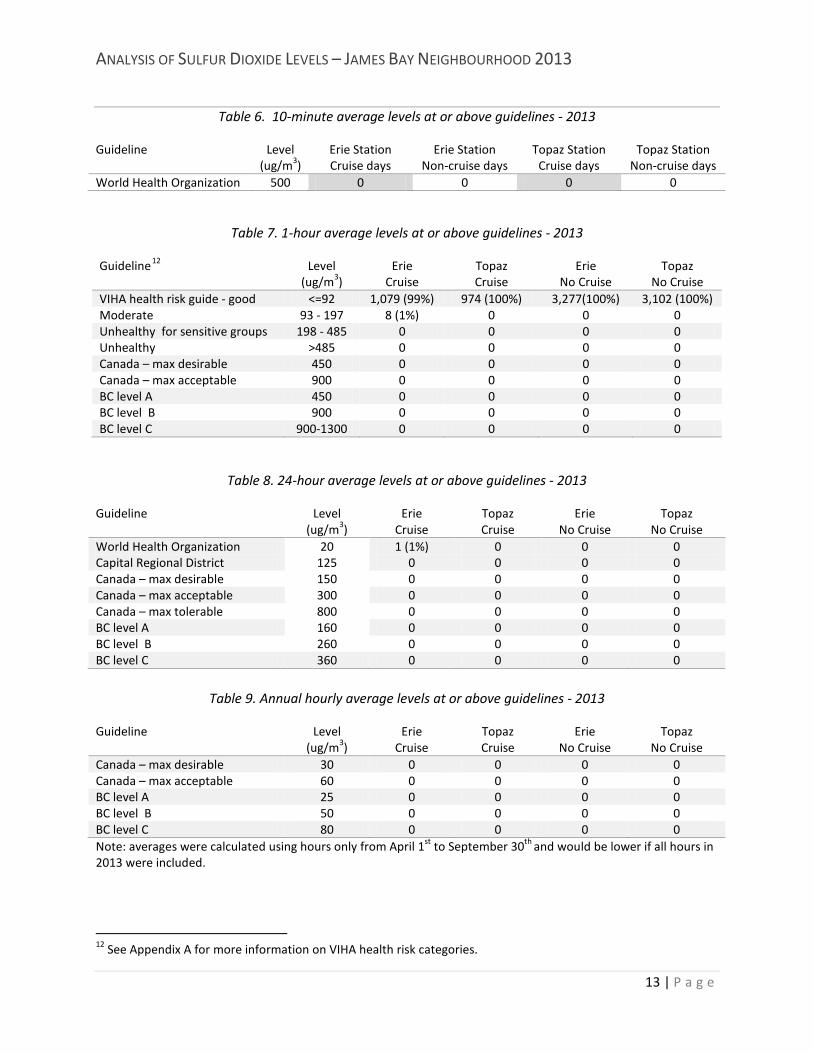
6.9 1.4 2.7 4.8 2.2 2.8 With one exception, all measured levels of SO2 were below current guidelines (Tables 6-9). Hourly, 24-hour and annual hourly average SO2 levels were below current Provincial Ambient Air Quality Objectives (see Tables 7, 8 and 9). One 24-hour average (1% of days with cruise ships in port) exceeded the World
Health Organization guideline of 20µg/m3(Table 8). No 1-hour averages were categorized as 'unhealthy" according to the Vancouver Island Health Authority health risk guide11
(Table 7).
11 See Appendix A for more information on VIHA health risk categories.

ANALYSIS OF SULFUR DIOXIDE LEVELS – JAMES BAY NEIGHBOURHOOD 2013
12 | P a g e
ANALYSIS OF SULFUR DIOXIDE LEVELS – JAMES BAY NEIGHBOURHOOD 2013
13 | P a g e
Table 6. 10-minute average levels at or above guidelines - 2013
Guideline Level (ug/m3)
Erie Station Cruise days
Erie Station Non-cruise days
Topaz Station Cruise days
Topaz Station Non-cruise days
World Health Organization 500 0 0 0 0
Table 7. 1-hour average levels at or above guidelines - 2013
Guideline12 Level (ug/m3)
Erie Cruise
Topaz Cruise
Erie No Cruise
Topaz No Cruise
VIHA health risk guide - good <=92 1,079 (99%) 974 (100%) 3,277(100%) 3,102 (100%) Moderate 93 - 197 8 (1%) 0 0 0 Unhealthy for sensitive groups 198 - 485 0 0 0 0 Unhealthy >485 0 0 0 0 Canada – max desirable 450 0 0 0 0 Canada – max acceptable 900 0 0 0 0 BC level A 450 0 0 0 0 BC level B 900 0 0 0 0 BC level C 900-1300 0 0 0 0
Table 8. 24-hour average levels at or above guidelines - 2013
Guideline Level (ug/m3)
Erie Cruise
Topaz Cruise
Erie No Cruise
Topaz No Cruise
World Health Organization 20 1 (1%) 0 0 0 Capital Regional District 125 0 0 0 0 Canada – max desirable 150 0 0 0 0 Canada – max acceptable 300 0 0 0 0 Canada – max tolerable 800 0 0 0 0 BC level A 160 0 0 0 0 BC level B 260 0 0 0 0 BC level C 360 0 0 0 0
Table 9. Annual hourly average levels at or above guidelines - 2013
Guideline Level (ug/m3)
Erie Cruise
Topaz Cruise
Erie No Cruise
Topaz No Cruise
Canada – max desirable 30 0 0 0 0 Canada – max acceptable 60 0 0 0 0 BC level A 25 0 0 0 0 BC level B 50 0 0 0 0 BC level C 80 0 0 0 0 Note: averages were calculated using hours only from April 1st to September 30th and would be lower if all hours in 2013 were included.
12 See Appendix A for more information on VIHA health risk categories.
ANALYSIS OF SULFUR DIOXIDE LEVELS – JAMES BAY NEIGHBOURHOOD 2013
14 | P a g e
4. Characteristics of SO2 events - 2013
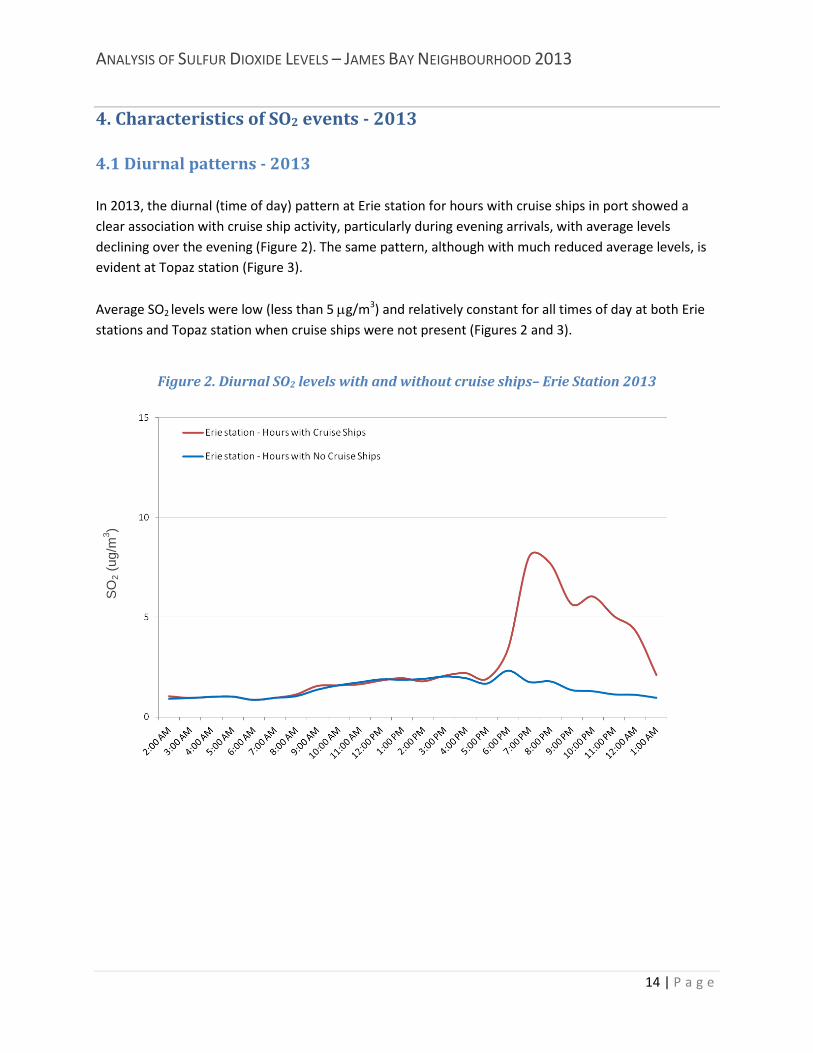
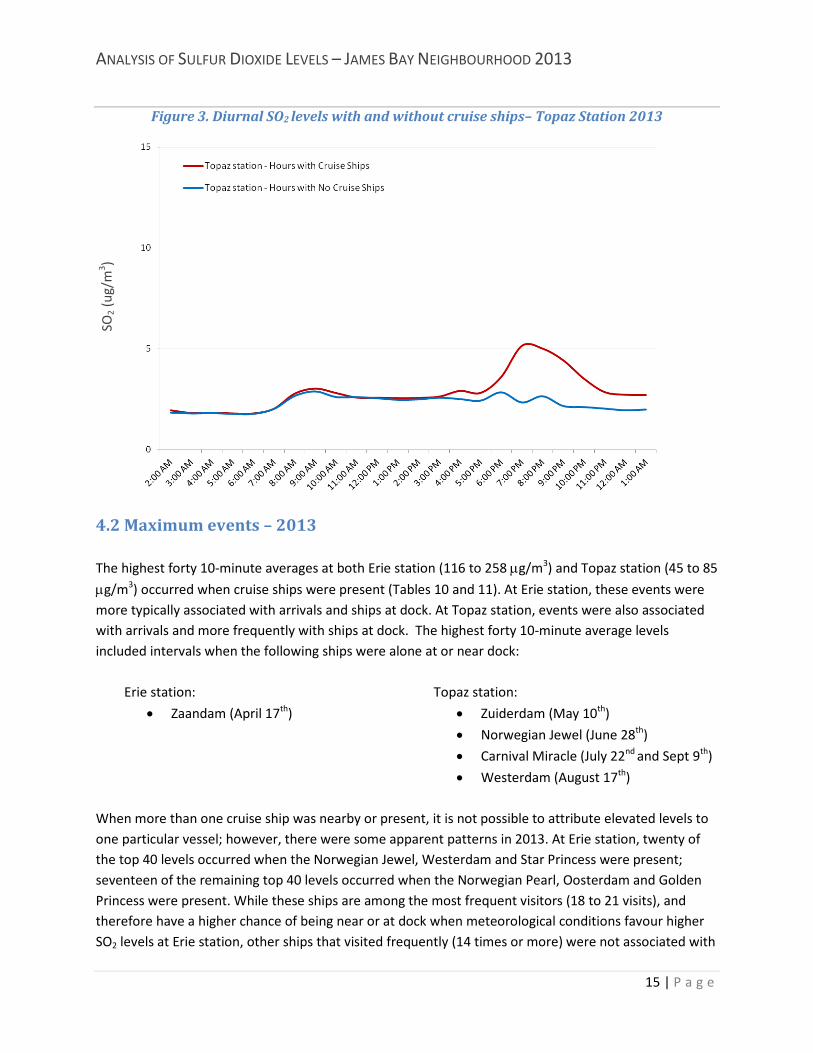
4.1 Diurnal patterns - 2013 In 2013, the diurnal (time of day) pattern at Erie station for hours with cruise ships in port showed a clear association with cruise ship activity, particularly during evening arrivals, with average levels declining over the evening (Figure 2). The same pattern, although with much reduced average levels, is evident at Topaz station (Figure 3).
Average SO2 levels were low (less than 5 µg/m3) and relatively constant for all times of day at both Erie stations and Topaz station when cruise ships were not present (Figures 2 and 3).
Figure 2. Diurnal SO2 levels with and without cruise ships– Erie Station 2013
SO2 (
ug/m
3 )
ANALYSIS OF SULFUR DIOXIDE LEVELS – JAMES BAY NEIGHBOURHOOD 2013
15 | P a g e
Figure 3. Diurnal SO2 levels with and without cruise ships– Topaz Station 2013
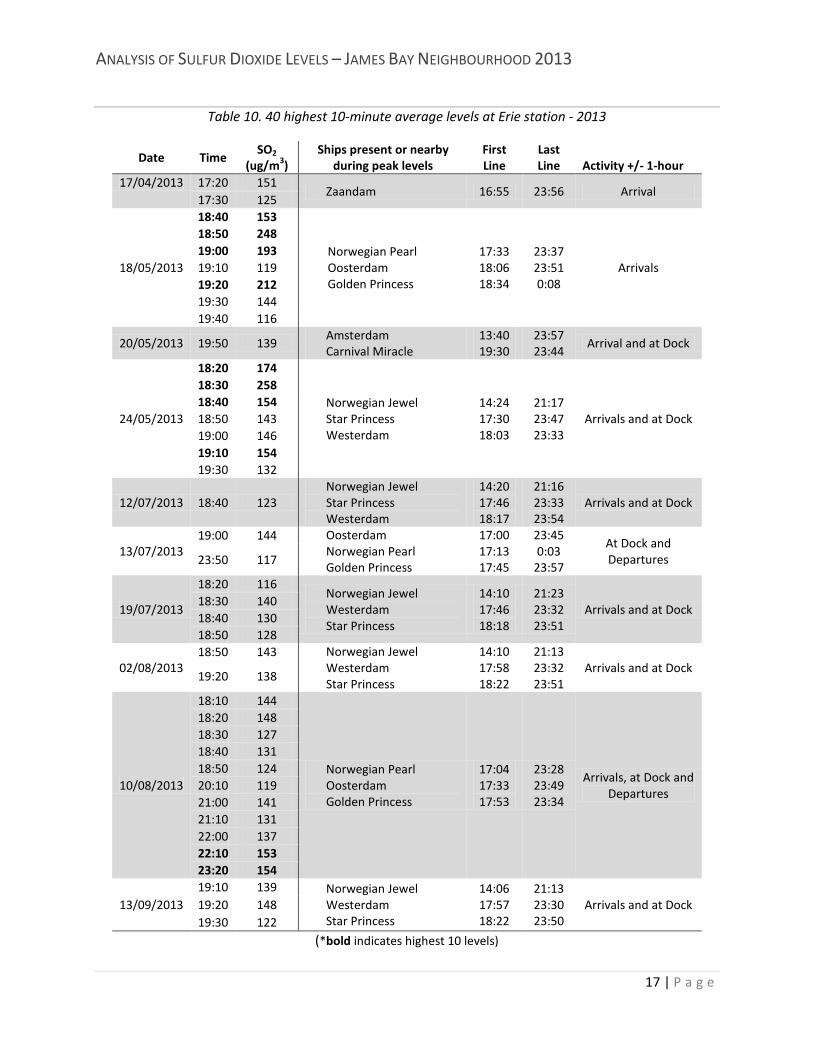
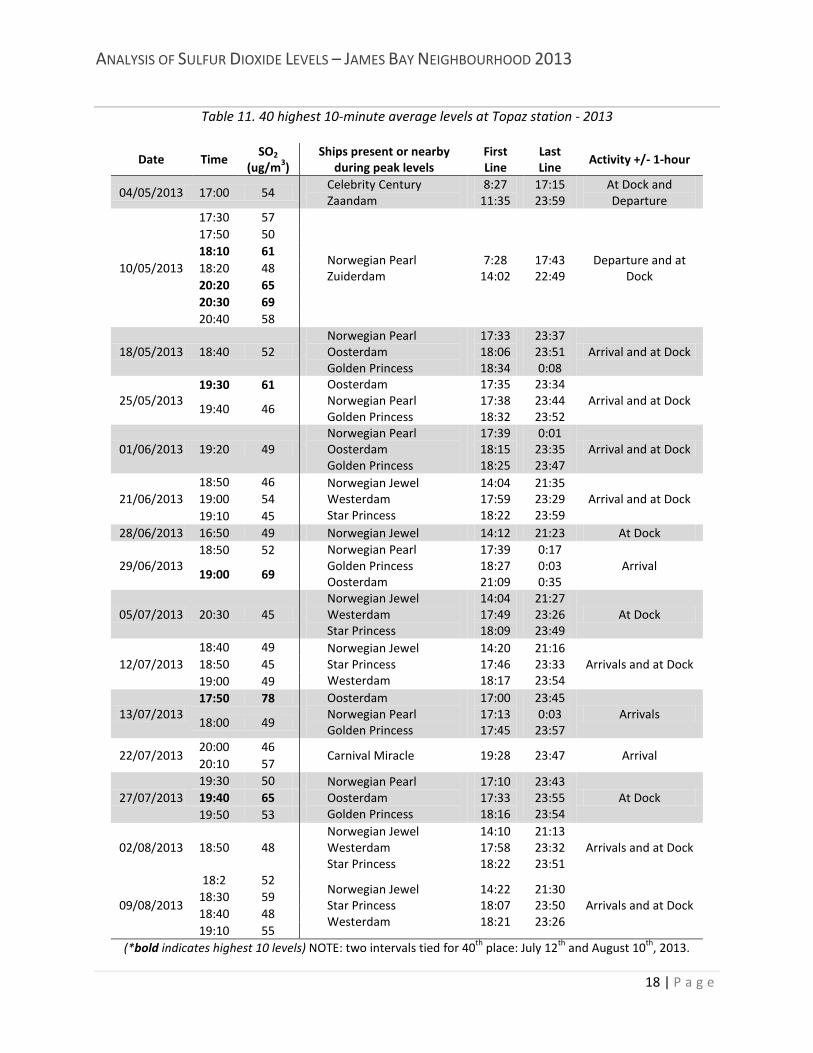
4.2 Maximum events – 2013
The highest forty 10-minute averages at both Erie station (116 to 258 µg/m3) and Topaz station (45 to 85
µg/m3) occurred when cruise ships were present (Tables 10 and 11). At Erie station, these events were more typically associated with arrivals and ships at dock. At Topaz station, events were also associated with arrivals and more frequently with ships at dock. The highest forty 10-minute average levels included intervals when the following ships were alone at or near dock:
Erie station:
• Zaandam (April 17th)
Topaz station:
• Zuiderdam (May 10th)
• Norwegian Jewel (June 28th)
• Carnival Miracle (July 22nd and Sept 9th)
• Westerdam (August 17th) When more than one cruise ship was nearby or present, it is not possible to attribute elevated levels to one particular vessel; however, there were some apparent patterns in 2013. At Erie station, twenty of the top 40 levels occurred when the Norwegian Jewel, Westerdam and Star Princess were present; seventeen of the remaining top 40 levels occurred when the Norwegian Pearl, Oosterdam and Golden Princess were present. While these ships are among the most frequent visitors (18 to 21 visits), and therefore have a higher chance of being near or at dock when meteorological conditions favour higher SO2 levels at Erie station, other ships that visited frequently (14 times or more) were not associated with
SO2 (
ug/m
3 )
ANALYSIS OF SULFUR DIOXIDE LEVELS – JAMES BAY NEIGHBOURHOOD 2013
16 | P a g e
elevated levels (for example, Celebrity Solstice, Grand Princess, and Rhapsody of the Seas). A similar pattern was observed at Topaz station. Although elevated levels did not always occur on the same days and times as at Erie station, the same two groups of ships were associated with just over half of the top 40 levels at Topaz station: the Norwegian Jewel, Westerdam and Star Princess (12 intervals) or the Norwegian Pearl, Oosterdam and Golden Princess (13 intervals).
In addition, the top forty 10-minute average levels occurred over 10 dates at Erie station, but were spread over 20 dates at Topaz station. This indicates that elevated episodes in 2013 were less frequent throughout the cruise ship season at Erie station than at Topaz station, but lasted longer at Erie station when they did occur.
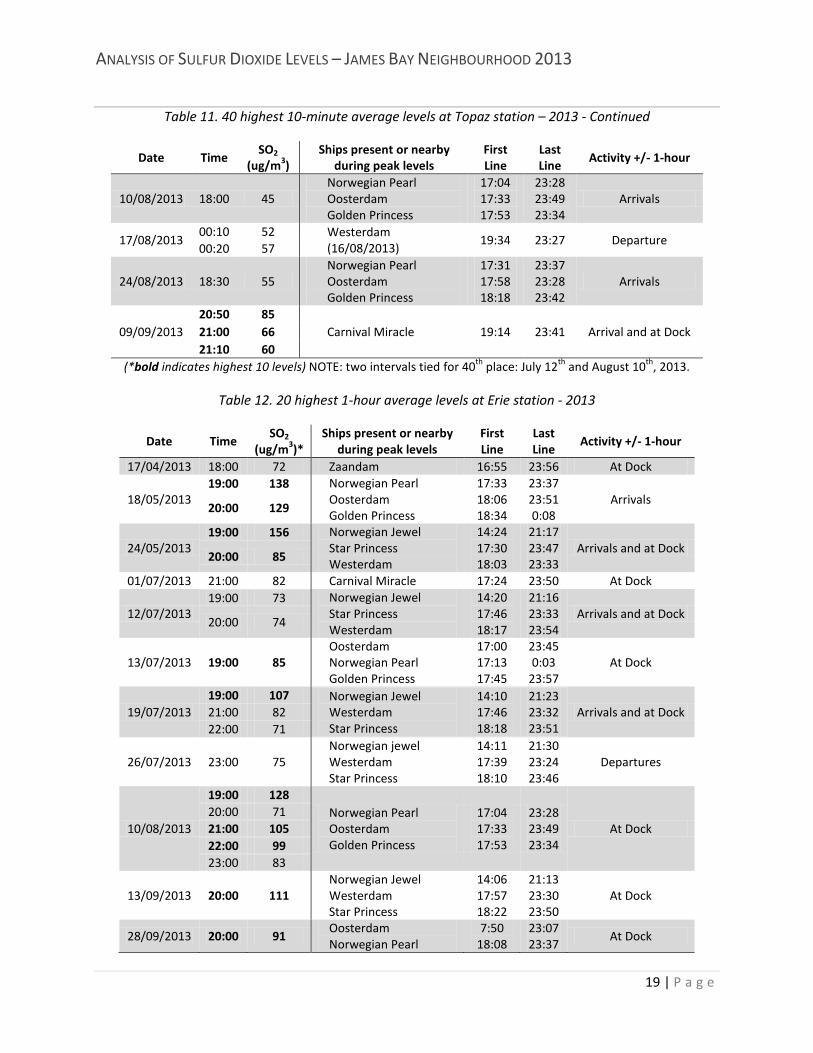
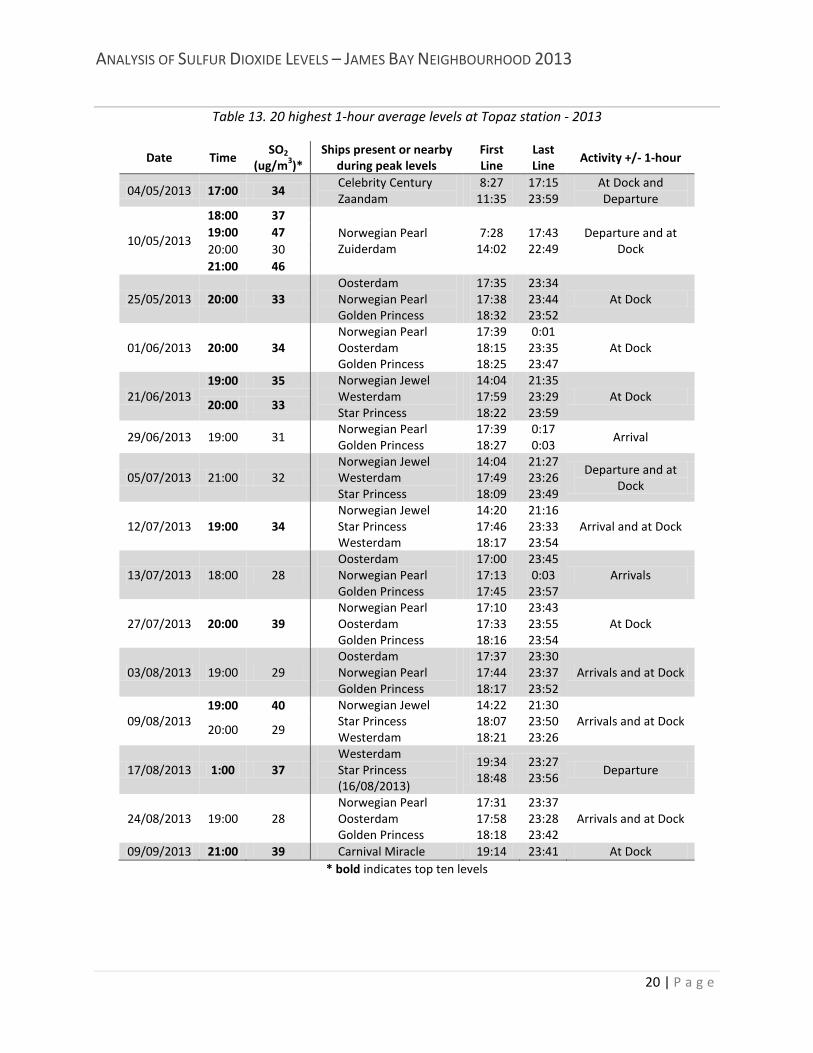
The highest twenty 1-hour averages at both Erie station (71 to 156 µg/m3) and Topaz station (28 to 47
µg/m3) occurred when cruise ships were present (Tables 12 and 13) and were similar in nature to the 10-minute peaks – more often associated with arrivals and with ships at dock, and occasionally some departures. A variety of cruise ships were present during the highest SO2 1-hour events recorded; however, the highest twenty 1-hour average levels included intervals when the following ships were the only ones in or near port:
Erie station:
• Zaandam (April 17th)
• Carnival Miracle (July 1st)
Topaz station:
• Zuiderdam (May 10th)
• Carnival Miracle (September 9th)
The pattern of ship presence during elevated levels seen in the top 40 10-minute data is present in the top 20 1-hour averages as well. At Erie station, 17 of the top 20 1-hour averages occurred when the Norwegian Pearl, Oosterdam and Golden Princes OR the Norwegian Jewel, Westerdam and Star Princess were present. Of the remaining three episodes, one occurred when the Norwegian Pearl and Oosterdam were present (without Golden Princess). At Topaz station, these same groups of ships were associated with 12 of the top 20 1-hour averages.
The highest ten 24-hour averages at Erie station (9 to 25 µg/m3) and Topaz station (6 to 10 µg/m3) occurred on days with cruise ship activity (Tables 14 and 15). In general, the same groups of ships are associated with the 10 highest 24-hour averages recorded at each station. A notable exception is July 21st at Erie station, when the Silver Shadow, Regatta and Grand Princess were present. While none of short term averages recorded on this day were included in the top 40 10-minute or top 20 1-hour levels, there were enough intervals with elevated levels to result in an elevated 24-hour average level.
The dates and times of the highest levels were not the same at Erie and Topaz stations, suggesting different meteorological conditions are responsible, with a few exceptions:
• 10-minute average levels were elevated at both sites for one common interval on May 18th, July 12th, and August 2nd.
• 1-hour average levels were elevated at both sites for one common interval on July 12th.
• July 6th and August 9th were among the top 10 24-hour averages at both Erie and Topaz stations.
ANALYSIS OF SULFUR DIOXIDE LEVELS – JAMES BAY NEIGHBOURHOOD 2013
17 | P a g e
Table 10. 40 highest 10-minute average levels at Erie station - 2013
Date Time SO2
(ug/m3) Ships present or nearby
during peak levels First Line
Last Line Activity +/- 1-hour
17/04/2013 17:20 151 Zaandam 16:55 23:56 Arrival
17:30 125
18/05/2013
18:40 153
Norwegian Pearl Oosterdam Golden Princess
17:33 18:06 18:34
23:37 23:51 0:08
Arrivals
18:50 248 19:00 193 19:10 119 19:20 212 19:30 144 19:40 116
20/05/2013 19:50 139 Amsterdam Carnival Miracle
13:40 19:30
23:57 23:44
Arrival and at Dock
24/05/2013
18:20 174
Norwegian Jewel Star Princess Westerdam
14:24 17:30 18:03
21:17 23:47 23:33
Arrivals and at Dock
18:30 258 18:40 154 18:50 143 19:00 146 19:10 154 19:30 132
12/07/2013 18:40 123 Norwegian Jewel Star Princess Westerdam
14:20 17:46 18:17
21:16 23:33 23:54
Arrivals and at Dock
13/07/2013 19:00 144 Oosterdam
Norwegian Pearl Golden Princess
17:00 17:13 17:45
23:45 0:03
23:57
At Dock and Departures 23:50 117
19/07/2013
18:20 116 Norwegian Jewel Westerdam Star Princess
14:10 17:46 18:18
21:23 23:32 23:51
Arrivals and at Dock 18:30 140 18:40 130 18:50 128
02/08/2013 18:50 143 Norwegian Jewel
Westerdam Star Princess
14:10 17:58 18:22
21:13 23:32 23:51
Arrivals and at Dock 19:20 138
10/08/2013
18:10 144
Norwegian Pearl Oosterdam Golden Princess
17:04 17:33 17:53
23:28 23:49 23:34
Arrivals, at Dock and Departures
18:20 148 18:30 127 18:40 131 18:50 124 20:10 119 21:00 141 21:10 131 22:00 137 22:10 153 23:20 154
13/09/2013 19:10 139 Norwegian Jewel
Westerdam Star Princess
14:06 17:57 18:22
21:13 23:30 23:50
Arrivals and at Dock 19:20 148 19:30 122
(*bold indicates highest 10 levels)
ANALYSIS OF SULFUR DIOXIDE LEVELS – JAMES BAY NEIGHBOURHOOD 2013
18 | P a g e
Table 11. 40 highest 10-minute average levels at Topaz station - 2013
Date Time SO2
(ug/m3) Ships present or nearby
during peak levels First Line
Last Line
Activity +/- 1-hour
04/05/2013 17:00 54 Celebrity Century Zaandam
8:27 11:35
17:15 23:59
At Dock and Departure
10/05/2013
17:30 57
Norwegian Pearl Zuiderdam
7:28 14:02
17:43 22:49
Departure and at Dock
17:50 50 18:10 61 18:20 48 20:20 65 20:30 69 20:40 58
18/05/2013 18:40 52 Norwegian Pearl Oosterdam Golden Princess
17:33 18:06 18:34
23:37 23:51 0:08
Arrival and at Dock
25/05/2013 19:30 61 Oosterdam
Norwegian Pearl Golden Princess
17:35 17:38 18:32
23:34 23:44 23:52
Arrival and at Dock 19:40 46
01/06/2013 19:20 49 Norwegian Pearl Oosterdam Golden Princess
17:39 18:15 18:25
0:01 23:35 23:47
Arrival and at Dock
21/06/2013 18:50 46 Norwegian Jewel
Westerdam Star Princess
14:04 17:59 18:22
21:35 23:29 23:59
Arrival and at Dock 19:00 54 19:10 45
28/06/2013 16:50 49 Norwegian Jewel 14:12 21:23 At Dock
29/06/2013 18:50 52 Norwegian Pearl
Golden Princess Oosterdam
17:39 18:27 21:09
0:17 0:03 0:35
Arrival 19:00 69
05/07/2013 20:30 45 Norwegian Jewel Westerdam Star Princess
14:04 17:49 18:09
21:27 23:26 23:49
At Dock
12/07/2013 18:40 49 Norwegian Jewel
Star Princess Westerdam
14:20 17:46 18:17
21:16 23:33 23:54
Arrivals and at Dock 18:50 45 19:00 49
13/07/2013 17:50 78 Oosterdam
Norwegian Pearl Golden Princess
17:00 17:13 17:45
23:45 0:03
23:57 Arrivals
18:00 49
22/07/2013 20:00 46
Carnival Miracle 19:28 23:47 Arrival 20:10 57
27/07/2013 19:30 50 Norwegian Pearl
Oosterdam Golden Princess
17:10 17:33 18:16
23:43 23:55 23:54
At Dock 19:40 65 19:50 53
02/08/2013 18:50 48 Norwegian Jewel Westerdam Star Princess
14:10 17:58 18:22
21:13 23:32 23:51
Arrivals and at Dock
09/08/2013
18:2 52 Norwegian Jewel Star Princess Westerdam
14:22 18:07 18:21
21:30 23:50 23:26
Arrivals and at Dock 18:30 59 18:40 48 19:10 55
(*bold indicates highest 10 levels) NOTE: two intervals tied for 40th place: July 12th and August 10th, 2013.
ANALYSIS OF SULFUR DIOXIDE LEVELS – JAMES BAY NEIGHBOURHOOD 2013
19 | P a g e
Table 11. 40 highest 10-minute average levels at Topaz station – 2013 - Continued
Date Time SO2
(ug/m3) Ships present or nearby
during peak levels First Line
Last Line
Activity +/- 1-hour
10/08/2013 18:00 45 Norwegian Pearl Oosterdam Golden Princess
17:04 17:33 17:53
23:28 23:49 23:34
Arrivals
17/08/2013 00:10 52 Westerdam
(16/08/2013) 19:34 23:27 Departure
00:20 57
24/08/2013 18:30 55 Norwegian Pearl Oosterdam Golden Princess
17:31 17:58 18:18
23:37 23:28 23:42
Arrivals
09/09/2013 20:50 85
Carnival Miracle 19:14 23:41 Arrival and at Dock 21:00 66 21:10 60
(*bold indicates highest 10 levels) NOTE: two intervals tied for 40th place: July 12th and August 10th, 2013.
Table 12. 20 highest 1-hour average levels at Erie station - 2013
Date Time SO2
(ug/m3)* Ships present or nearby
during peak levels First Line
Last Line
Activity +/- 1-hour
17/04/2013 18:00 72 Zaandam 16:55 23:56 At Dock
18/05/2013 19:00 138 Norwegian Pearl
Oosterdam Golden Princess
17:33 18:06 18:34
23:37 23:51 0:08
Arrivals 20:00 129
24/05/2013 19:00 156 Norwegian Jewel
Star Princess Westerdam
14:24 17:30 18:03
21:17 23:47 23:33
Arrivals and at Dock 20:00 85
01/07/2013 21:00 82 Carnival Miracle 17:24 23:50 At Dock
12/07/2013 19:00 73 Norwegian Jewel
Star Princess Westerdam
14:20 17:46 18:17
21:16 23:33 23:54
Arrivals and at Dock 20:00 74
13/07/2013 19:00 85 Oosterdam Norwegian Pearl Golden Princess
17:00 17:13 17:45
23:45 0:03
23:57 At Dock
19/07/2013 19:00 107 Norwegian Jewel
Westerdam Star Princess
14:10 17:46 18:18
21:23 23:32 23:51
Arrivals and at Dock 21:00 82 22:00 71
26/07/2013 23:00 75 Norwegian jewel Westerdam Star Princess
14:11 17:39 18:10
21:30 23:24 23:46
Departures
10/08/2013
19:00 128 Norwegian Pearl Oosterdam Golden Princess
17:04 17:33 17:53
23:28 23:49 23:34
At Dock 20:00 71 21:00 105 22:00 99 23:00 83
13/09/2013 20:00 111 Norwegian Jewel Westerdam Star Princess
14:06 17:57 18:22
21:13 23:30 23:50
At Dock
28/09/2013 20:00 91 Oosterdam Norwegian Pearl
7:50 18:08
23:07 23:37
At Dock
ANALYSIS OF SULFUR DIOXIDE LEVELS – JAMES BAY NEIGHBOURHOOD 2013
20 | P a g e
Table 13. 20 highest 1-hour average levels at Topaz station - 2013
Date Time SO2
(ug/m3)* Ships present or nearby
during peak levels First Line
Last Line
Activity +/- 1-hour
04/05/2013 17:00 34 Celebrity Century Zaandam
8:27 11:35
17:15 23:59
At Dock and Departure
10/05/2013
18:00 37 Norwegian Pearl Zuiderdam
7:28 14:02
17:43 22:49
Departure and at Dock
19:00 47 20:00 30 21:00 46
25/05/2013 20:00 33 Oosterdam Norwegian Pearl Golden Princess
17:35 17:38 18:32
23:34 23:44 23:52
At Dock
01/06/2013 20:00 34 Norwegian Pearl Oosterdam Golden Princess
17:39 18:15 18:25
0:01 23:35 23:47
At Dock
21/06/2013 19:00 35 Norwegian Jewel
Westerdam Star Princess
14:04 17:59 18:22
21:35 23:29 23:59
At Dock 20:00 33
29/06/2013 19:00 31 Norwegian Pearl Golden Princess
17:39 18:27
0:17 0:03
Arrival
05/07/2013 21:00 32 Norwegian Jewel Westerdam Star Princess
14:04 17:49 18:09
21:27 23:26 23:49
Departure and at Dock
12/07/2013 19:00 34 Norwegian Jewel Star Princess Westerdam
14:20 17:46 18:17
21:16 23:33 23:54
Arrival and at Dock
13/07/2013 18:00 28 Oosterdam Norwegian Pearl Golden Princess
17:00 17:13 17:45
23:45 0:03
23:57 Arrivals
27/07/2013 20:00 39 Norwegian Pearl Oosterdam Golden Princess
17:10 17:33 18:16
23:43 23:55 23:54
At Dock
03/08/2013 19:00 29 Oosterdam Norwegian Pearl Golden Princess
17:37 17:44 18:17
23:30 23:37 23:52
Arrivals and at Dock
09/08/2013 19:00 40 Norwegian Jewel
Star Princess Westerdam
14:22 18:07 18:21
21:30 23:50 23:26
Arrivals and at Dock 20:00 29
17/08/2013 1:00 37 Westerdam Star Princess (16/08/2013)
19:34 18:48
23:27 23:56
Departure
24/08/2013 19:00 28 Norwegian Pearl Oosterdam Golden Princess
17:31 17:58 18:18
23:37 23:28 23:42
Arrivals and at Dock
09/09/2013 21:00 39 Carnival Miracle 19:14 23:41 At Dock * bold indicates top ten levels
ANALYSIS OF SULFUR DIOXIDE LEVELS – JAMES BAY NEIGHBOURHOOD 2013
21 | P a g e
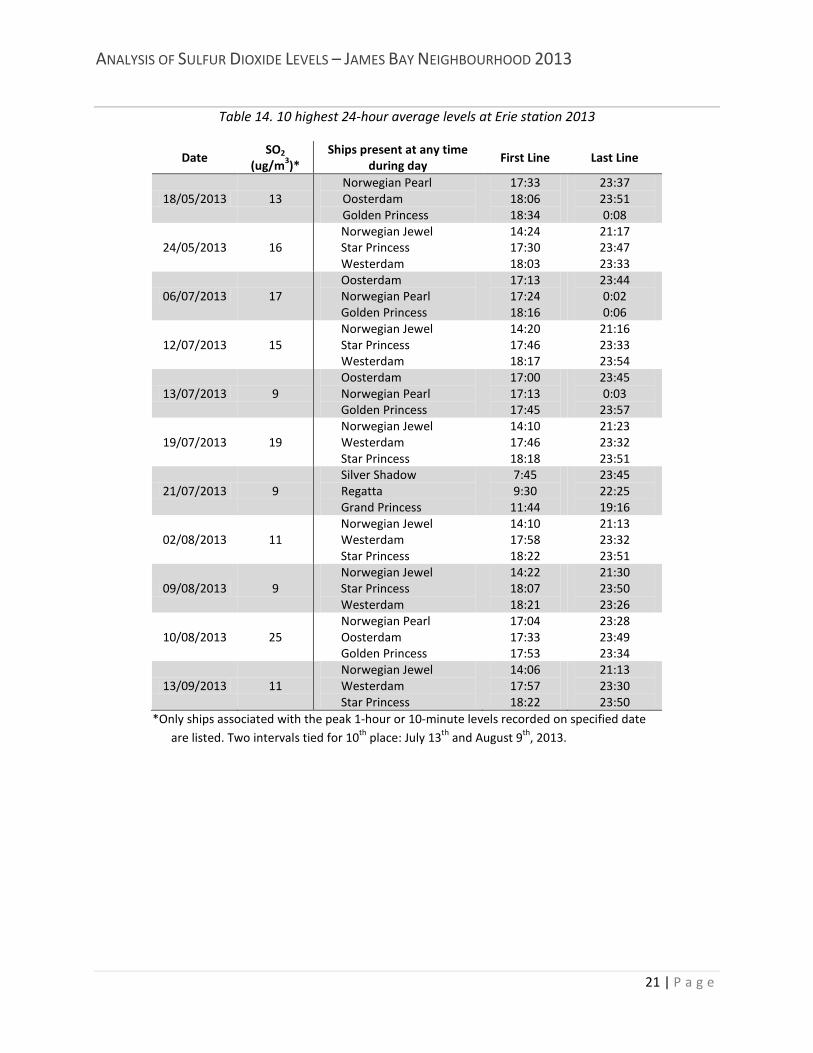
Table 14. 10 highest 24-hour average levels at Erie station 2013
Date SO2
(ug/m3)* Ships present at any time
during day First Line Last Line
18/05/2013 13 Norwegian Pearl Oosterdam Golden Princess
17:33 18:06 18:34
23:37 23:51 0:08
24/05/2013 16 Norwegian Jewel Star Princess Westerdam
14:24 17:30 18:03
21:17 23:47 23:33
06/07/2013 17 Oosterdam Norwegian Pearl Golden Princess
17:13 17:24 18:16
23:44 0:02 0:06
12/07/2013 15 Norwegian Jewel Star Princess Westerdam
14:20 17:46 18:17
21:16 23:33 23:54
13/07/2013 9 Oosterdam Norwegian Pearl Golden Princess
17:00 17:13 17:45
23:45 0:03
23:57
19/07/2013 19 Norwegian Jewel Westerdam Star Princess
14:10 17:46 18:18
21:23 23:32 23:51
21/07/2013 9 Silver Shadow Regatta Grand Princess
7:45 9:30
11:44
23:45 22:25 19:16
02/08/2013 11 Norwegian Jewel Westerdam Star Princess
14:10 17:58 18:22
21:13 23:32 23:51
09/08/2013 9 Norwegian Jewel Star Princess Westerdam
14:22 18:07 18:21
21:30 23:50 23:26
10/08/2013 25 Norwegian Pearl Oosterdam Golden Princess
17:04 17:33 17:53
23:28 23:49 23:34
13/09/2013 11 Norwegian Jewel Westerdam Star Princess
14:06 17:57 18:22
21:13 23:30 23:50
*Only ships associated with the peak 1-hour or 10-minute levels recorded on specified date are listed. Two intervals tied for 10th place: July 13th and August 9th, 2013.
ANALYSIS OF SULFUR DIOXIDE LEVELS – JAMES BAY NEIGHBOURHOOD 2013
22 | P a g e
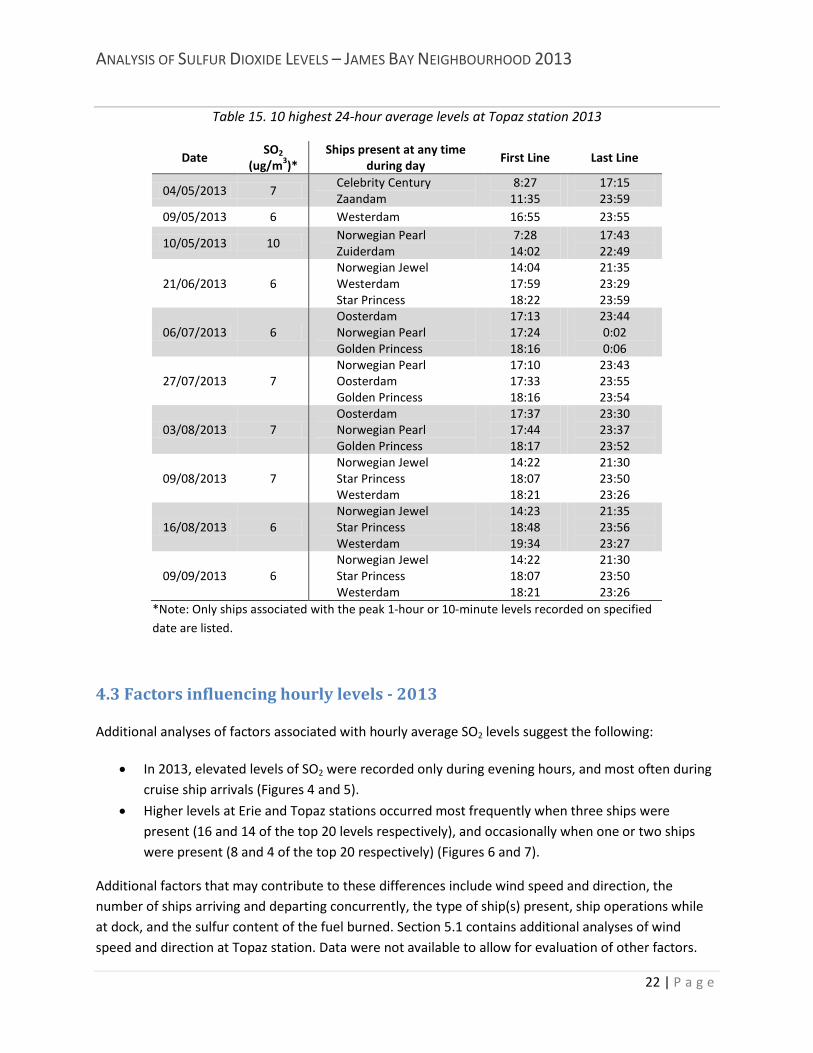
Table 15. 10 highest 24-hour average levels at Topaz station 2013
Date SO2
(ug/m3)* Ships present at any time
during day First Line Last Line
04/05/2013 7 Celebrity Century Zaandam
8:27 11:35
17:15 23:59
09/05/2013 6 Westerdam 16:55 23:55
10/05/2013 10 Norwegian Pearl Zuiderdam
7:28 14:02
17:43 22:49
21/06/2013 6 Norwegian Jewel Westerdam Star Princess
14:04 17:59 18:22
21:35 23:29 23:59
06/07/2013 6 Oosterdam Norwegian Pearl Golden Princess
17:13 17:24 18:16
23:44 0:02 0:06
27/07/2013 7 Norwegian Pearl Oosterdam Golden Princess
17:10 17:33 18:16
23:43 23:55 23:54
03/08/2013 7 Oosterdam Norwegian Pearl Golden Princess
17:37 17:44 18:17
23:30 23:37 23:52
09/08/2013 7 Norwegian Jewel Star Princess Westerdam
14:22 18:07 18:21
21:30 23:50 23:26
16/08/2013 6 Norwegian Jewel Star Princess Westerdam
14:23 18:48 19:34
21:35 23:56 23:27
09/09/2013 6 Norwegian Jewel Star Princess Westerdam
14:22 18:07 18:21
21:30 23:50 23:26
*Note: Only ships associated with the peak 1-hour or 10-minute levels recorded on specified date are listed.
4.3 Factors influencing hourly levels - 2013
Additional analyses of factors associated with hourly average SO2 levels suggest the following:
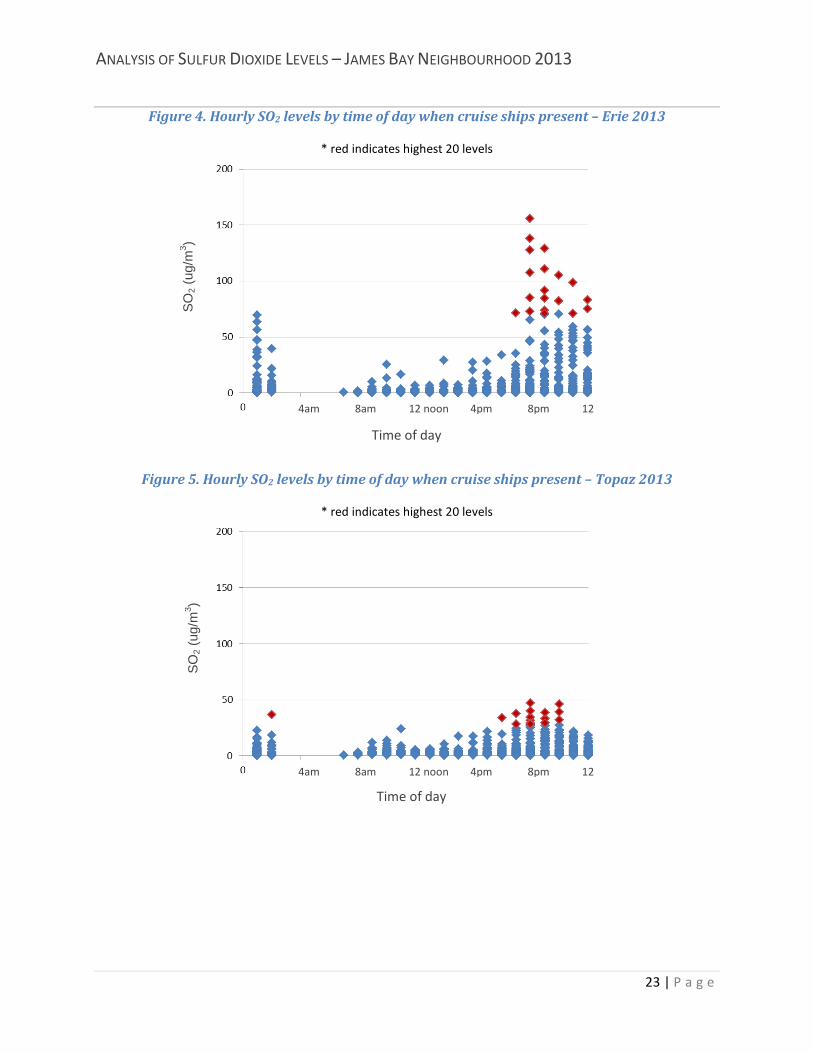
• In 2013, elevated levels of SO2 were recorded only during evening hours, and most often during cruise ship arrivals (Figures 4 and 5).
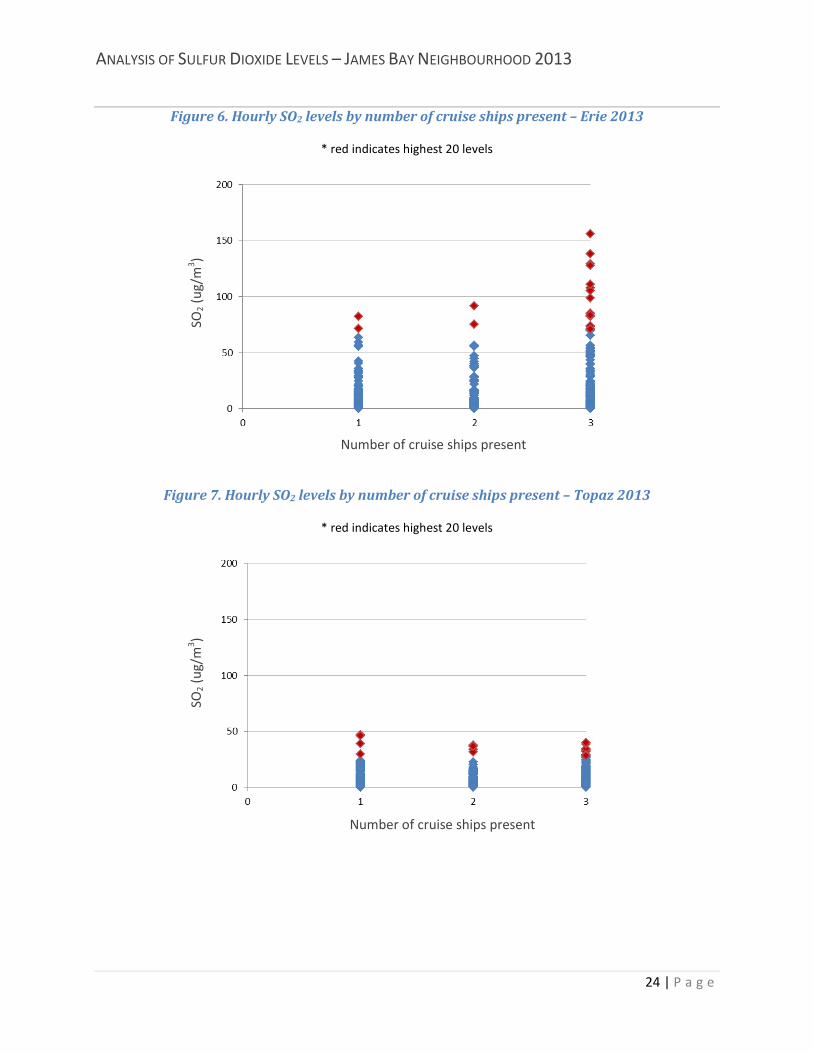
• Higher levels at Erie and Topaz stations occurred most frequently when three ships were present (16 and 14 of the top 20 levels respectively), and occasionally when one or two ships were present (8 and 4 of the top 20 respectively) (Figures 6 and 7).
Additional factors that may contribute to these differences include wind speed and direction, the number of ships arriving and departing concurrently, the type of ship(s) present, ship operations while at dock, and the sulfur content of the fuel burned. Section 5.1 contains additional analyses of wind speed and direction at Topaz station. Data were not available to allow for evaluation of other factors.
ANALYSIS OF SULFUR DIOXIDE LEVELS – JAMES BAY NEIGHBOURHOOD 2013
23 | P a g e
Figure 4. Hourly SO2 levels by time of day when cruise ships present – Erie 2013
* red indicates highest 20 levels
Figure 5. Hourly SO2 levels by time of day when cruise ships present – Topaz 2013
* red indicates highest 20 levels
SO2 (
ug/m
3 )
Time of day
SO2 (
ug/m
3 )
Time of day
4am 8am 12 noon 4pm 8pm 12
4am 8am 12 noon 4pm 8pm 12
ANALYSIS OF SULFUR DIOXIDE LEVELS – JAMES BAY NEIGHBOURHOOD 2013
24 | P a g e
Figure 6. Hourly SO2 levels by number of cruise ships present – Erie 2013
* red indicates highest 20 levels
Figure 7. Hourly SO2 levels by number of cruise ships present – Topaz 2013
* red indicates highest 20 levels
SO2 (
ug/m
3 )
Number of cruise ships present
SO2 (
ug/m
3 )
Number of cruise ships present
ANALYSIS OF SULFUR DIOXIDE LEVELS – JAMES BAY NEIGHBOURHOOD 2013
25 | P a g e
5. Trends and comparisons
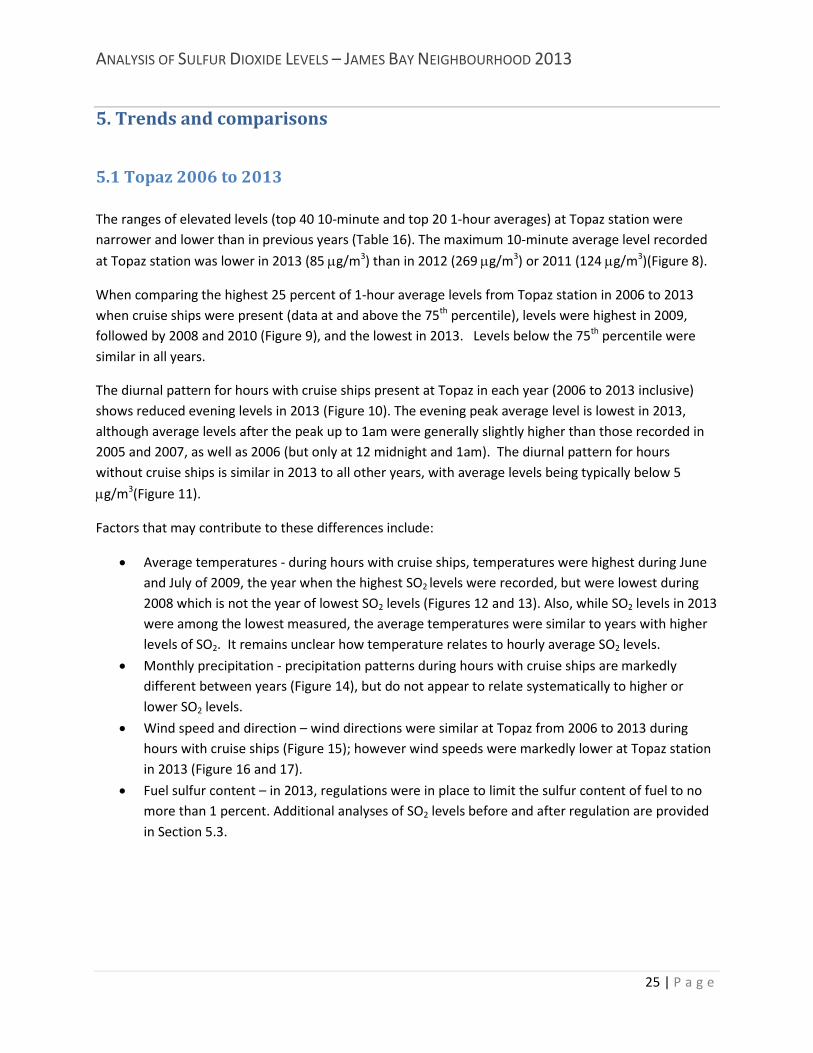
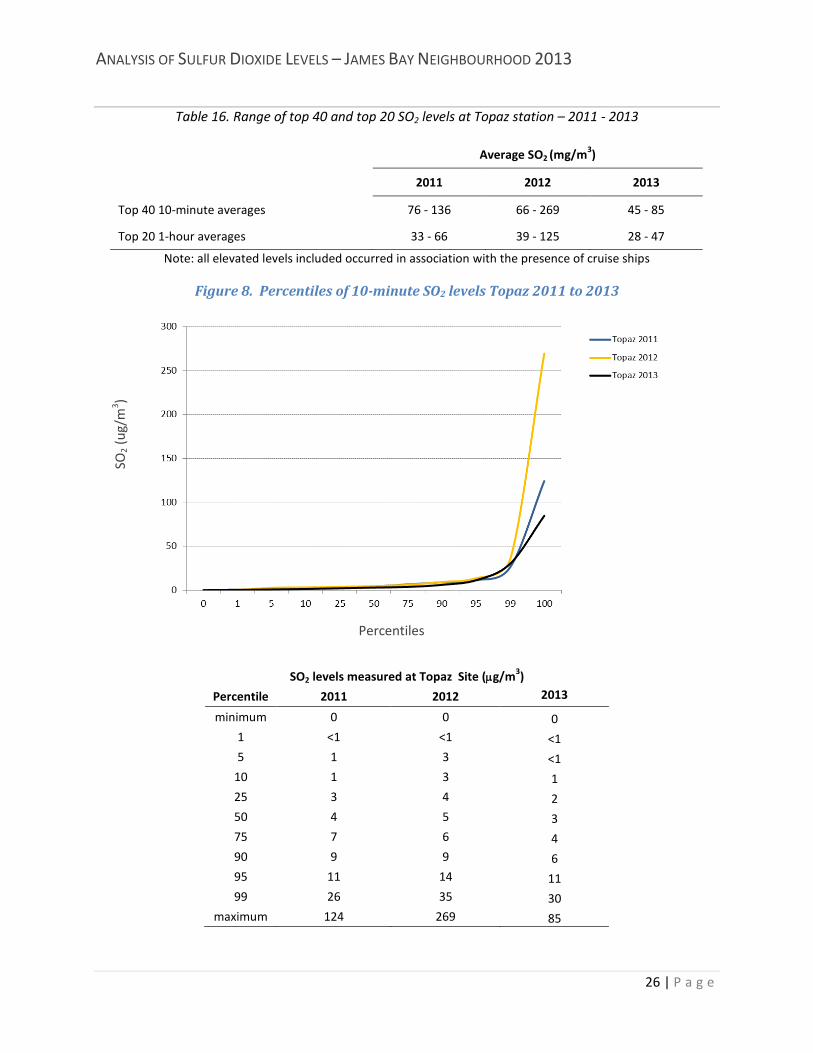
5.1 Topaz 2006 to 2013 The ranges of elevated levels (top 40 10-minute and top 20 1-hour averages) at Topaz station were narrower and lower than in previous years (Table 16). The maximum 10-minute average level recorded
at Topaz station was lower in 2013 (85 µg/m3) than in 2012 (269 µg/m3) or 2011 (124 µg/m3)(Figure 8).
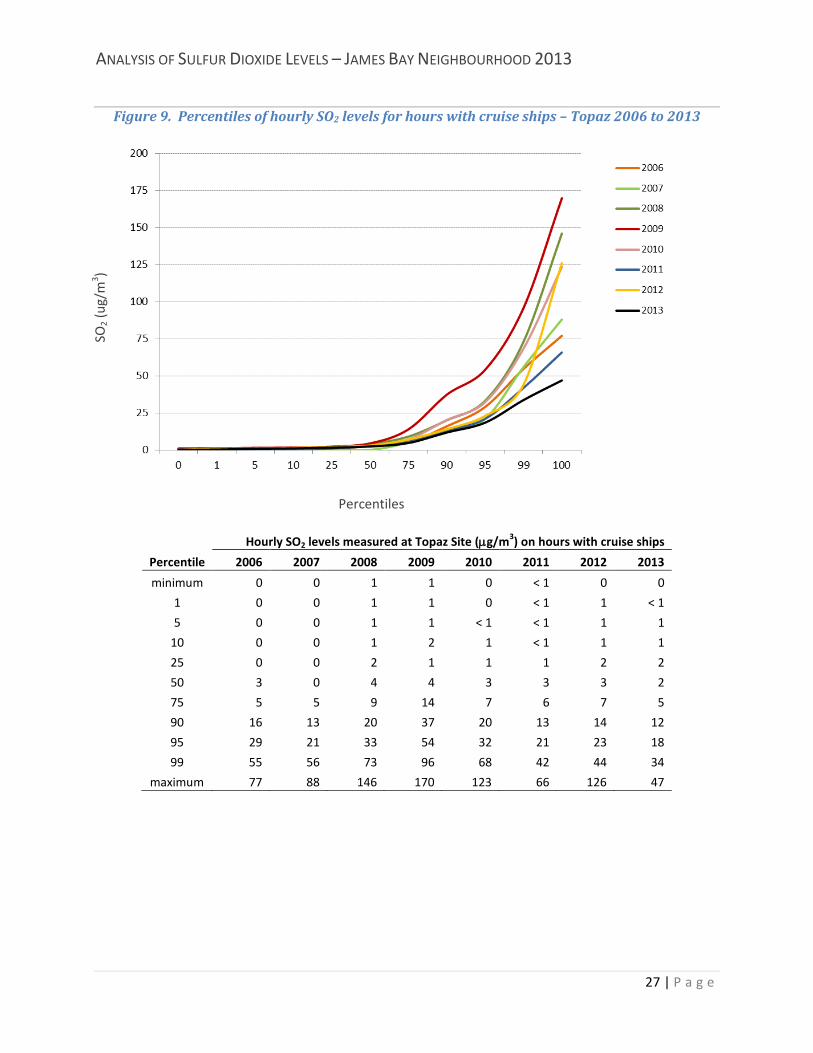
When comparing the highest 25 percent of 1-hour average levels from Topaz station in 2006 to 2013 when cruise ships were present (data at and above the 75th percentile), levels were highest in 2009, followed by 2008 and 2010 (Figure 9), and the lowest in 2013. Levels below the 75th percentile were similar in all years.
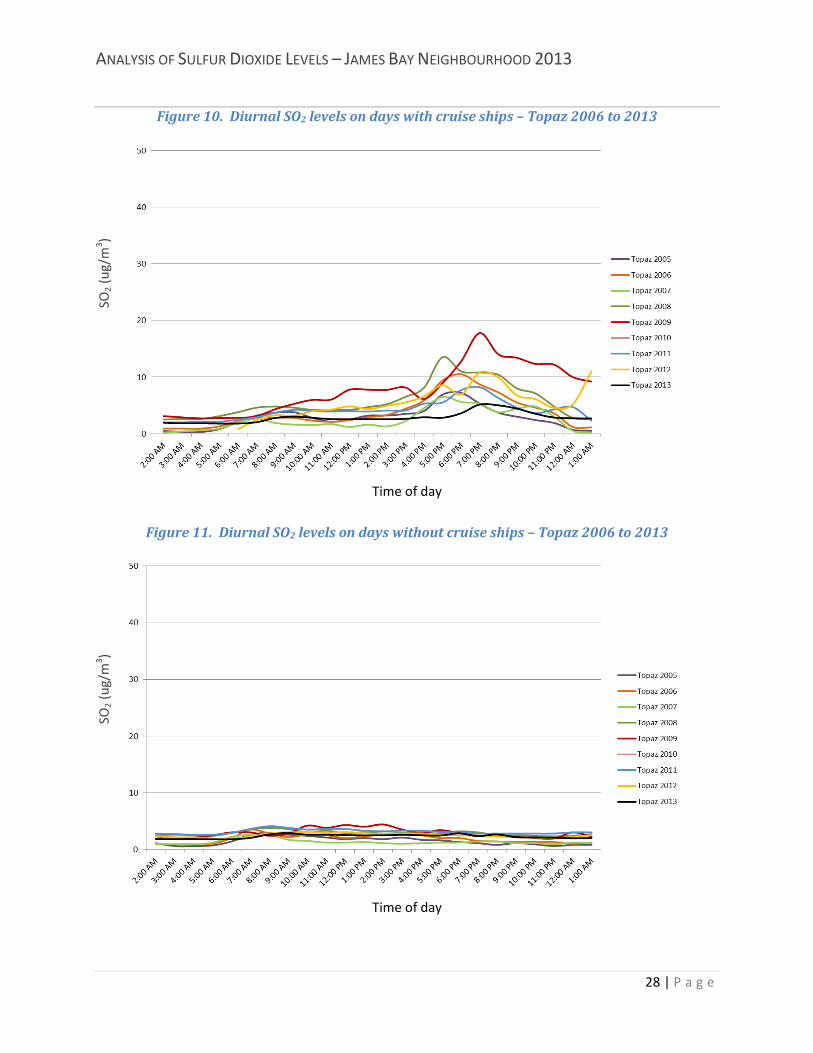
The diurnal pattern for hours with cruise ships present at Topaz in each year (2006 to 2013 inclusive) shows reduced evening levels in 2013 (Figure 10). The evening peak average level is lowest in 2013, although average levels after the peak up to 1am were generally slightly higher than those recorded in 2005 and 2007, as well as 2006 (but only at 12 midnight and 1am). The diurnal pattern for hours without cruise ships is similar in 2013 to all other years, with average levels being typically below 5
µg/m3(Figure 11).
Factors that may contribute to these differences include:
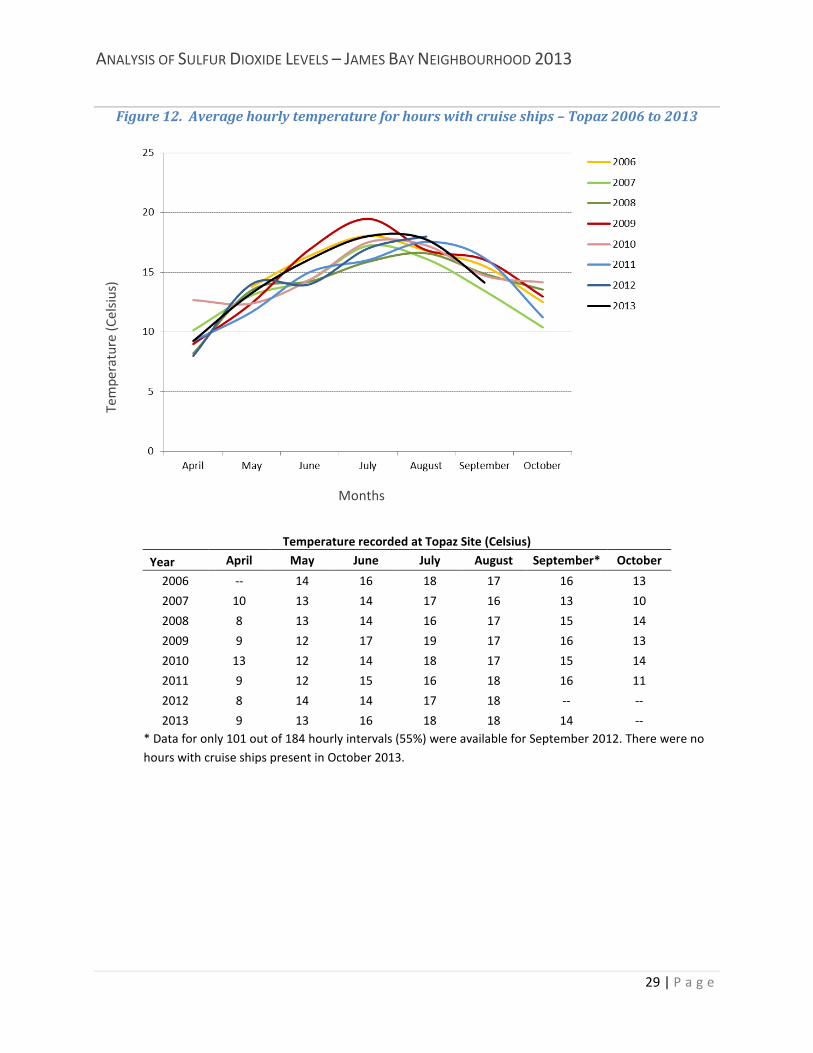
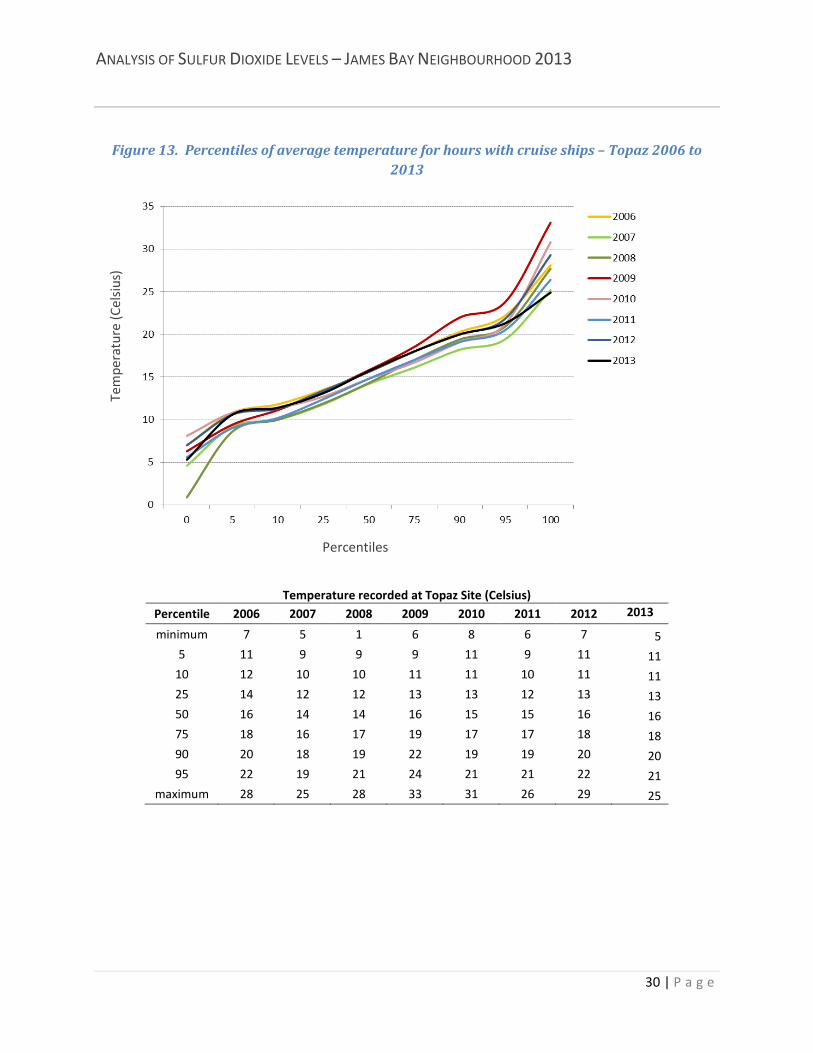
• Average temperatures - during hours with cruise ships, temperatures were highest during June and July of 2009, the year when the highest SO2 levels were recorded, but were lowest during 2008 which is not the year of lowest SO2 levels (Figures 12 and 13). Also, while SO2 levels in 2013 were among the lowest measured, the average temperatures were similar to years with higher levels of SO2. It remains unclear how temperature relates to hourly average SO2 levels.
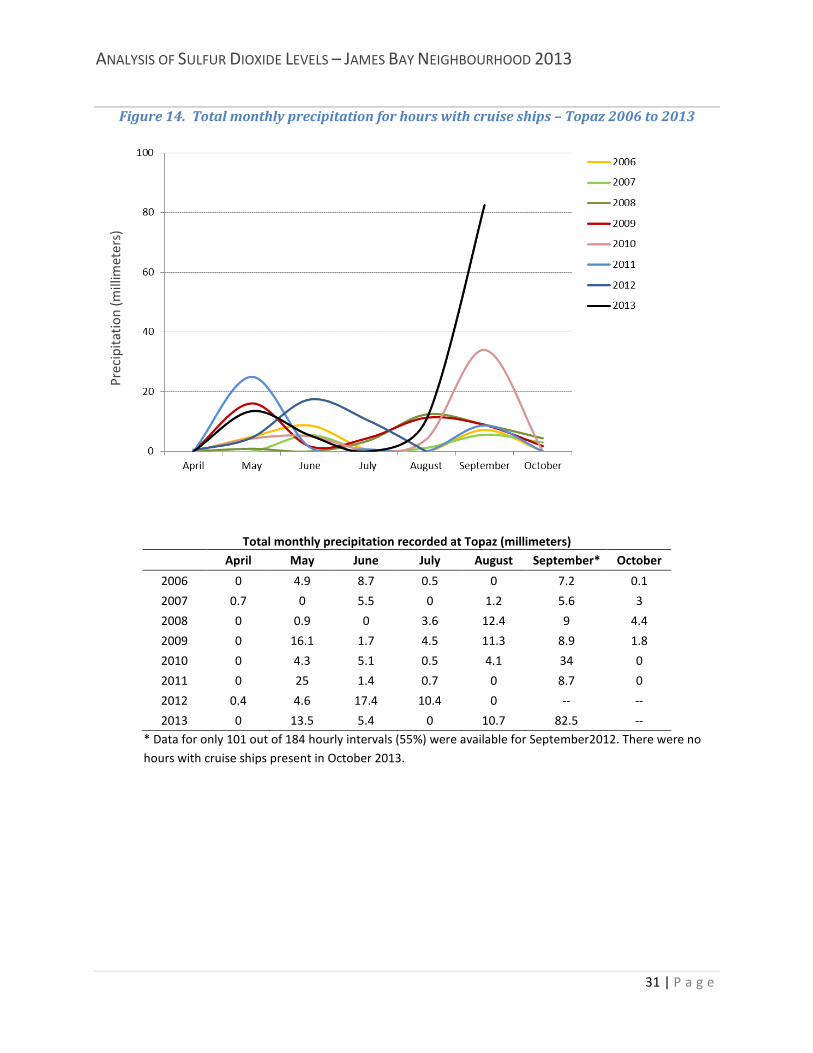
• Monthly precipitation - precipitation patterns during hours with cruise ships are markedly different between years (Figure 14), but do not appear to relate systematically to higher or lower SO2 levels.
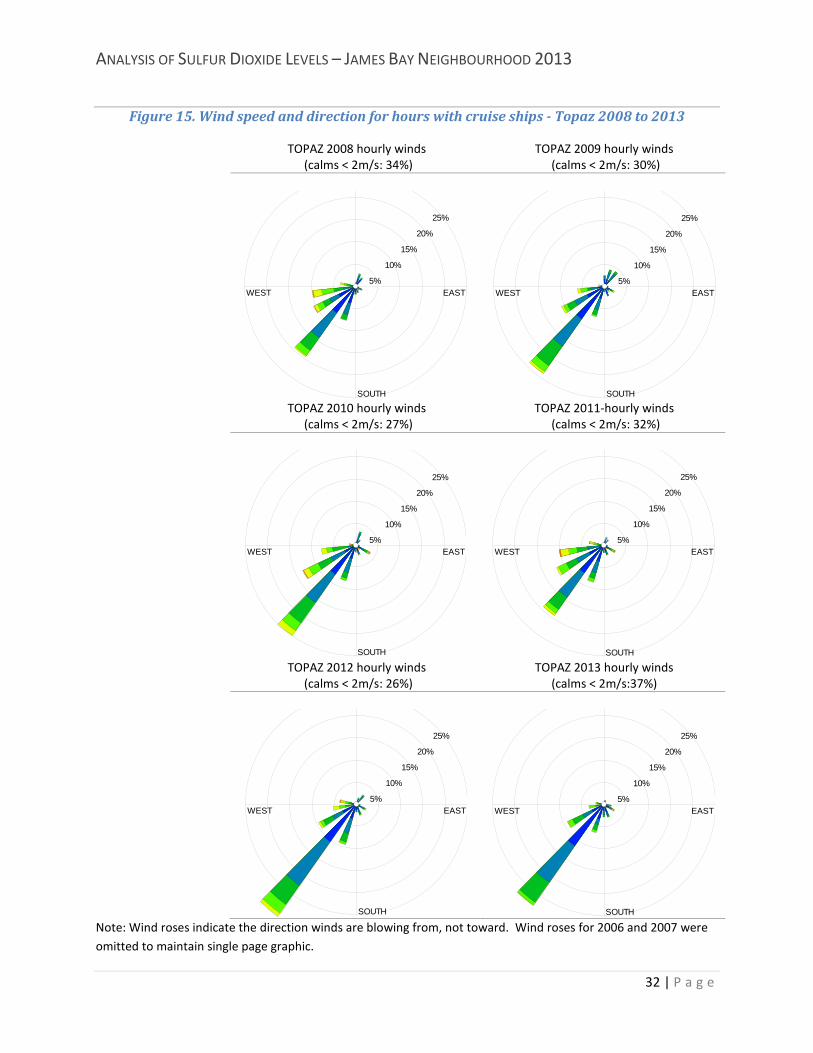
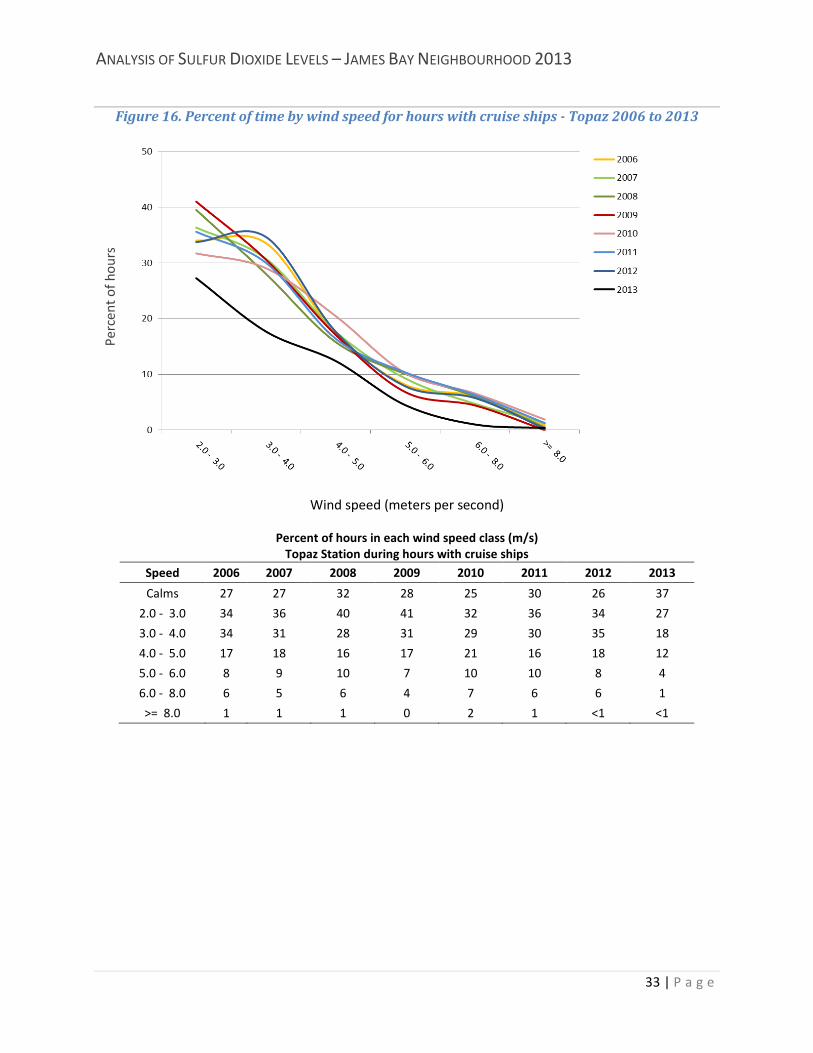
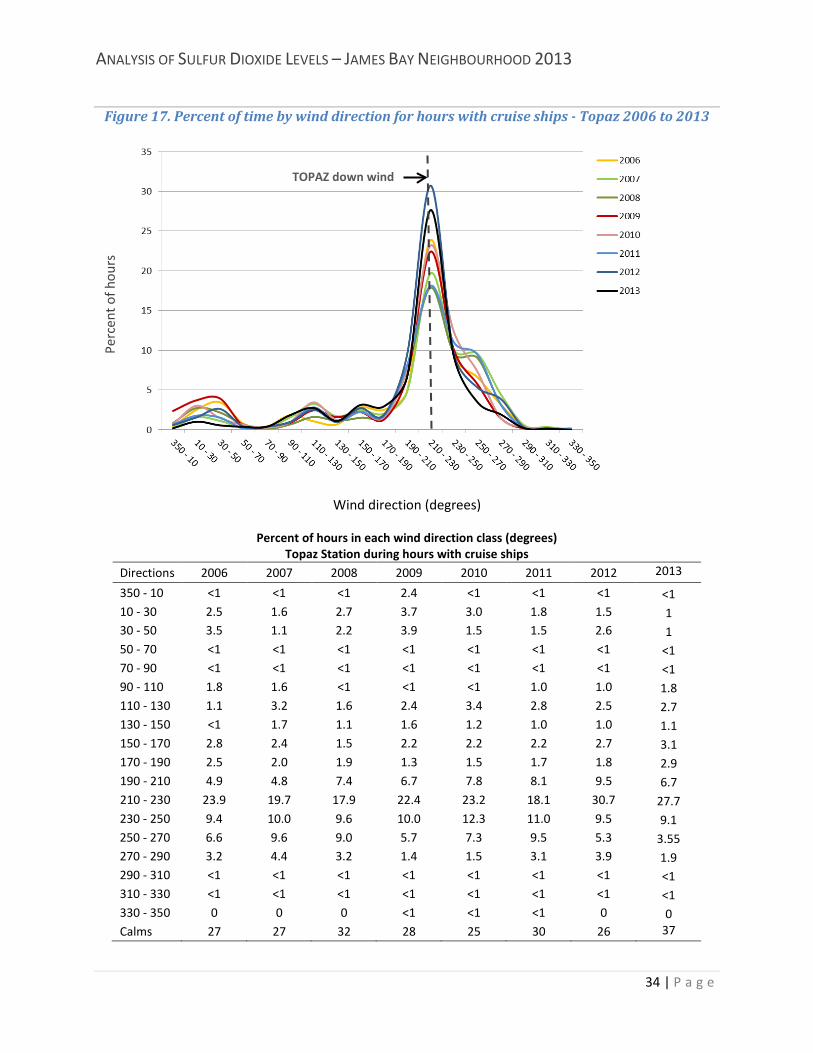
• Wind speed and direction – wind directions were similar at Topaz from 2006 to 2013 during hours with cruise ships (Figure 15); however wind speeds were markedly lower at Topaz station in 2013 (Figure 16 and 17).
• Fuel sulfur content – in 2013, regulations were in place to limit the sulfur content of fuel to no more than 1 percent. Additional analyses of SO2 levels before and after regulation are provided in Section 5.3.
ANALYSIS OF SULFUR DIOXIDE LEVELS – JAMES BAY NEIGHBOURHOOD 2013
26 | P a g e
Table 16. Range of top 40 and top 20 SO2 levels at Topaz station – 2011 - 2013
Average SO2 (mg/m3)
2011 2012 2013
Top 40 10-minute averages 76 - 136 66 - 269 45 - 85
Top 20 1-hour averages 33 - 66 39 - 125 28 - 47
Note: all elevated levels included occurred in association with the presence of cruise ships
Figure 8. Percentiles of 10-minute SO2 levels Topaz 2011 to 2013
SO2 levels measured at Topaz Site (µg/m3)
Percentile 2011 2012 2013
minimum 0 0 0 1 <1 <1 <1 5 1 3 <1
10 1 3 1 25 3 4 2 50 4 5 3 75 7 6 4 90 9 9 6 95 11 14 11 99 26 35 30
maximum 124 269 85
SO2 (
ug/m
3 )
Percentiles
ANALYSIS OF SULFUR DIOXIDE LEVELS – JAMES BAY NEIGHBOURHOOD 2013
27 | P a g e
Figure 9. Percentiles of hourly SO2 levels for hours with cruise ships – Topaz 2006 to 2013
Hourly SO2 levels measured at Topaz Site (µg/m3) on hours with cruise ships
Percentile 2006 2007 2008 2009 2010 2011 2012 2013
minimum 0 0 1 1 0 < 1 0 0
1 0 0 1 1 0 < 1 1 < 1
5 0 0 1 1 < 1 < 1 1 1
10 0 0 1 2 1 < 1 1 1
25 0 0 2 1 1 1 2 2
50 3 0 4 4 3 3 3 2
75 5 5 9 14 7 6 7 5
90 16 13 20 37 20 13 14 12
95 29 21 33 54 32 21 23 18
99 55 56 73 96 68 42 44 34
maximum 77 88 146 170 123 66 126 47
SO2 (
ug/m
3 )
Percentiles
ANALYSIS OF SULFUR DIOXIDE LEVELS – JAMES BAY NEIGHBOURHOOD 2013
28 | P a g e
Figure 10. Diurnal SO2 levels on days with cruise ships – Topaz 2006 to 2013
Time of day
Figure 11. Diurnal SO2 levels on days without cruise ships – Topaz 2006 to 2013
Time of day
SO2 (
ug/m
3 ) SO
2 (ug
/m3 )
ANALYSIS OF SULFUR DIOXIDE LEVELS – JAMES BAY NEIGHBOURHOOD 2013
29 | P a g e
Figure 12. Average hourly temperature for hours with cruise ships – Topaz 2006 to 2013
Temperature recorded at Topaz Site (Celsius)
Year April May June July August September* October
2006 -- 14 16 18 17 16 13
2007 10 13 14 17 16 13 10
2008 8 13 14 16 17 15 14
2009 9 12 17 19 17 16 13
2010 13 12 14 18 17 15 14
2011 9 12 15 16 18 16 11
2012 8 14 14 17 18 -- --
2013 9 13 16 18 18 14 -- * Data for only 101 out of 184 hourly intervals (55%) were available for September 2012. There were no hours with cruise ships present in October 2013.
Tem
pera
ture
(Cel
sius
)
Months
ANALYSIS OF SULFUR DIOXIDE LEVELS – JAMES BAY NEIGHBOURHOOD 2013
30 | P a g e
Figure 13. Percentiles of average temperature for hours with cruise ships – Topaz 2006 to 2013
Temperature recorded at Topaz Site (Celsius) Percentile 2006 2007 2008 2009 2010 2011 2012 2013
minimum 7 5 1 6 8 6 7 5 5 11 9 9 9 11 9 11 11
10 12 10 10 11 11 10 11 11 25 14 12 12 13 13 12 13 13 50 16 14 14 16 15 15 16 16 75 18 16 17 19 17 17 18 18 90 20 18 19 22 19 19 20 20 95 22 19 21 24 21 21 22 21
maximum 28 25 28 33 31 26 29 25
Tem
pera
ture
(Cel
sius
)
Percentiles
ANALYSIS OF SULFUR DIOXIDE LEVELS – JAMES BAY NEIGHBOURHOOD 2013
31 | P a g e
Figure 14. Total monthly precipitation for hours with cruise ships – Topaz 2006 to 2013
Total monthly precipitation recorded at Topaz (millimeters)
April May June July August September* October
2006 0 4.9 8.7 0.5 0 7.2 0.1
2007 0.7 0 5.5 0 1.2 5.6 3
2008 0 0.9 0 3.6 12.4 9 4.4
2009 0 16.1 1.7 4.5 11.3 8.9 1.8
2010 0 4.3 5.1 0.5 4.1 34 0
2011 0 25 1.4 0.7 0 8.7 0
2012 0.4 4.6 17.4 10.4 0 -- --
2013 0 13.5 5.4 0 10.7 82.5 -- * Data for only 101 out of 184 hourly intervals (55%) were available for September2012. There were no hours with cruise ships present in October 2013.
Prec
ipita
tion
(mill
imet
ers)
ANALYSIS OF SULFUR DIOXIDE LEVELS – JAMES BAY NEIGHBOURHOOD 2013
32 | P a g e
Figure 15. Wind speed and direction for hours with cruise ships - Topaz 2008 to 2013
TOPAZ 2008 hourly winds (calms < 2m/s: 34%)
TOPAZ 2009 hourly winds (calms < 2m/s: 30%)
TOPAZ 2010 hourly winds
(calms < 2m/s: 27%) TOPAZ 2011-hourly winds
(calms < 2m/s: 32%)
TOPAZ 2012 hourly winds
(calms < 2m/s: 26%) TOPAZ 2013 hourly winds
(calms < 2m/s:37%)
Note: Wind roses indicate the direction winds are blowing from, not toward. Wind roses for 2006 and 2007 were omitted to maintain single page graphic.
SOUTH
WEST EAST5%
10%
15%
20%
25%
SOUTH
WEST EAST5%
10%
15%
20%
25%
SOUTH
WEST EAST5%
10%
15%
20%
25%
SOUTH
WEST EAST5%
10%
15%
20%
25%
SOUTH
WEST EAST5%
10%
15%
20%
25%
SOUTH
WEST EAST5%
10%
15%
20%
25%
ANALYSIS OF SULFUR DIOXIDE LEVELS – JAMES BAY NEIGHBOURHOOD 2013
33 | P a g e
Figure 16. Percent of time by wind speed for hours with cruise ships - Topaz 2006 to 2013
Wind speed (meters per second)
Percent of hours in each wind speed class (m/s) Topaz Station during hours with cruise ships
Speed 2006 2007 2008 2009 2010 2011 2012 2013
Calms 27 27 32 28 25 30 26 37
2.0 - 3.0 34 36 40 41 32 36 34 27
3.0 - 4.0 34 31 28 31 29 30 35 18
4.0 - 5.0 17 18 16 17 21 16 18 12
5.0 - 6.0 8 9 10 7 10 10 8 4
6.0 - 8.0 6 5 6 4 7 6 6 1
>= 8.0 1 1 1 0 2 1 <1 <1
Perc
ent o
f hou
rs
ANALYSIS OF SULFUR DIOXIDE LEVELS – JAMES BAY NEIGHBOURHOOD 2013
34 | P a g e
Figure 17. Percent of time by wind direction for hours with cruise ships - Topaz 2006 to 2013
Wind direction (degrees)
Percent of hours in each wind direction class (degrees) Topaz Station during hours with cruise ships
Directions 2006 2007 2008 2009 2010 2011 2012 2013
350 - 10 <1 <1 <1 2.4 <1 <1 <1 <1 10 - 30 2.5 1.6 2.7 3.7 3.0 1.8 1.5 1 30 - 50 3.5 1.1 2.2 3.9 1.5 1.5 2.6 1 50 - 70 <1 <1 <1 <1 <1 <1 <1 <1 70 - 90 <1 <1 <1 <1 <1 <1 <1 <1 90 - 110 1.8 1.6 <1 <1 <1 1.0 1.0 1.8 110 - 130 1.1 3.2 1.6 2.4 3.4 2.8 2.5 2.7 130 - 150 <1 1.7 1.1 1.6 1.2 1.0 1.0 1.1 150 - 170 2.8 2.4 1.5 2.2 2.2 2.2 2.7 3.1 170 - 190 2.5 2.0 1.9 1.3 1.5 1.7 1.8 2.9 190 - 210 4.9 4.8 7.4 6.7 7.8 8.1 9.5 6.7 210 - 230 23.9 19.7 17.9 22.4 23.2 18.1 30.7 27.7 230 - 250 9.4 10.0 9.6 10.0 12.3 11.0 9.5 9.1 250 - 270 6.6 9.6 9.0 5.7 7.3 9.5 5.3 3.55 270 - 290 3.2 4.4 3.2 1.4 1.5 3.1 3.9 1.9 290 - 310 <1 <1 <1 <1 <1 <1 <1 <1 310 - 330 <1 <1 <1 <1 <1 <1 <1 <1 330 - 350 0 0 0 <1 <1 <1 0 0 Calms 27 27 32 28 25 30 26 37
TOPAZ down wind
Perc
ent o
f hou
rs
ANALYSIS OF SULFUR DIOXIDE LEVELS – JAMES BAY NEIGHBOURHOOD 2013
35 | P a g e
5.2 MAML 2009 and Erie 2011 - 2013
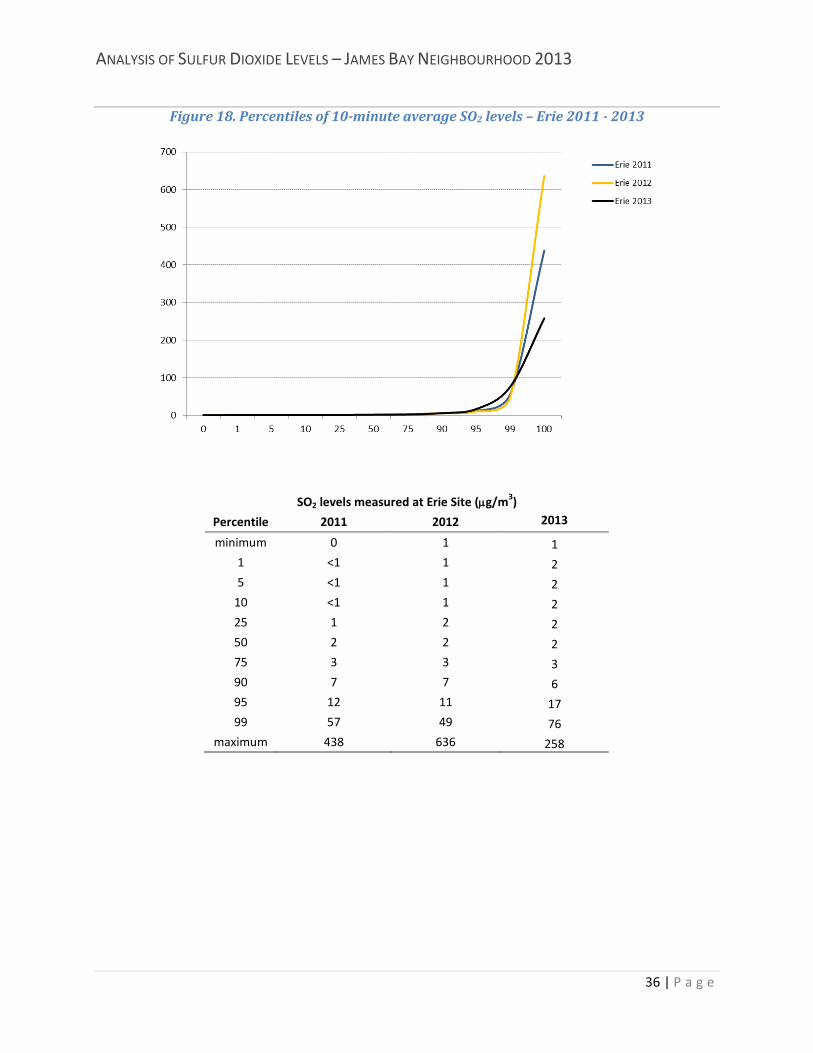
The ranges of elevated SO2 levels (top 40 10-minute and top 20 1-hour averages) in 2013 were narrower and lower than those recorded in 2011 and 2012 (Table 17). The maximum 10-minute average level
recorded at Erie station was lower in 2013 (258 µg/m3) than in 2012 or 2011 (636 µg/m3 and 438 µg/m3 respectively) (Figure 15).
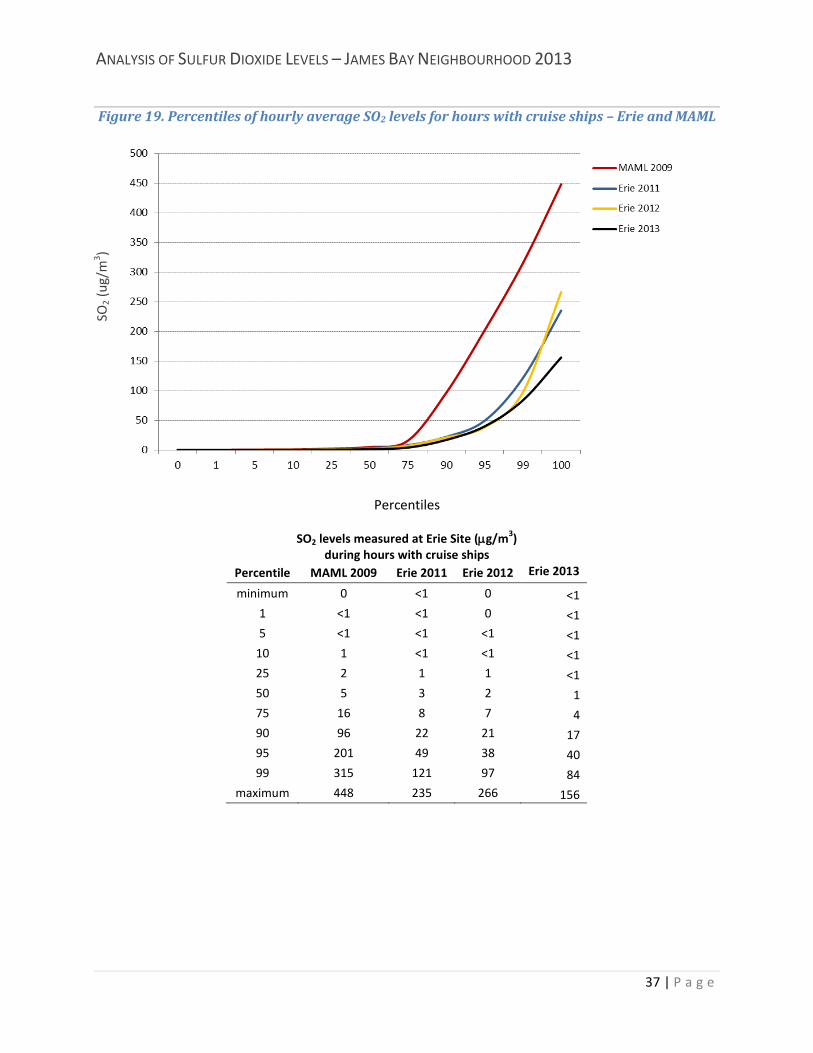
Hourly average SO2 levels at and above the 75th percentile measured at the Erie site in 2013 when cruise ships were present were similar to those in 2011 and 2012, and markedly lower than those measured at the MAML site in 2009 (Figure 19). In 2013, hourly average levels were lower than in 2012 only from the 99th percentile and upward.
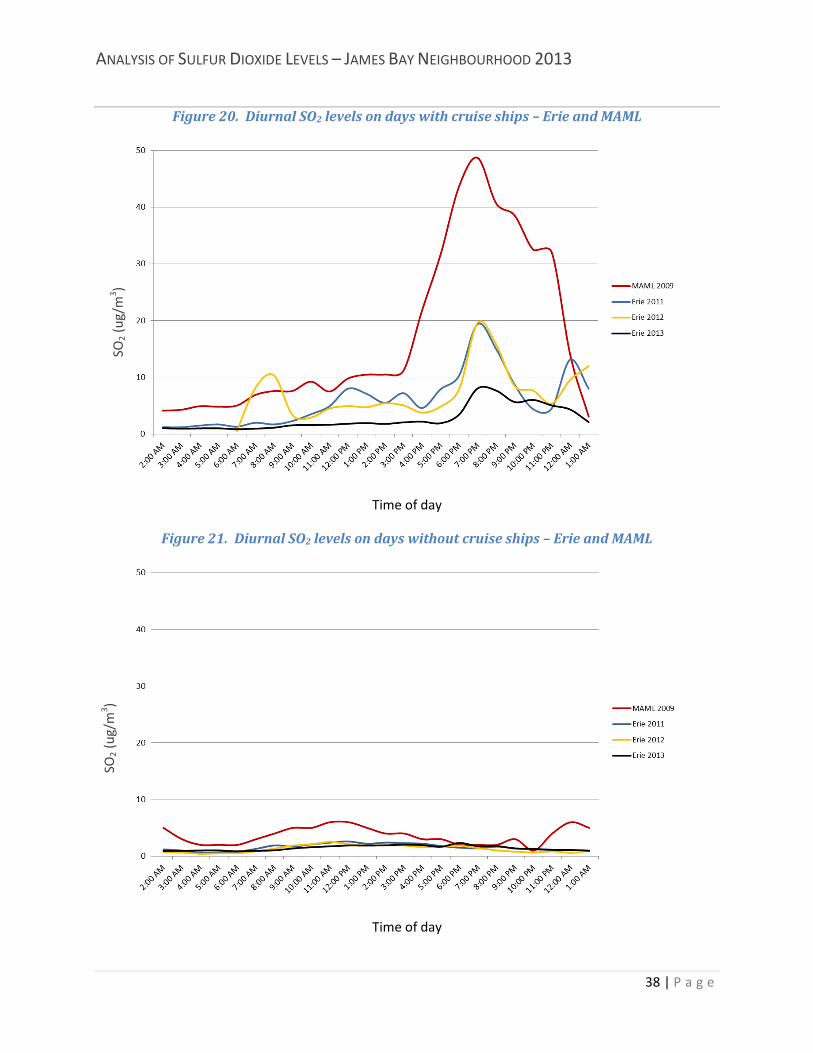
In 2013, the diurnal pattern shows a distinct drop in average levels compared to 2011 and 2012, with the exception of 10pm and 11pm, although levels in all years were relatively low at these times (Figure 20). The pattern is similar to that seen in 2009, when levels peaked during evening arrivals and then declined gradually until departures. When cruise ships were not present, average hourly SO2 levels were
similar in 2011 and 2012 (less than 10 µg/m3), but still lower than in 2009 (Figure 21).
Factors that may contribute to these differences include wind speed and direction; however, these data were not available for the full cruise ship season from Ogden Point, the nearest wind monitoring site. An evaluation of wind speed and direction data from other sites in the region was conducted (Appendix B) and found no suitable alternative for the Ogden Point data. Analyses of the effect of wind speed and direction on SO2 levels at Erie station are available in previous reports.13, 14
Other factors that could influence SO2 levels include the type of ship present, ship operations while near or at dock, and the sulfur content of the fuel burned. Data were not available to allow for evaluation of these factors.
Table 17. Range of top 40 and top 20 SO2 levels at Erie station – 2011 - 2013
Average SO2 (mg/m3)
2011 2012 2013
Top 40 10-minute averages 199 - 438 155 - 636 116 - 258
Top 20 1-hour averages 97 - 235 75 - 266 71 - 156
Note: all elevated levels included occurred in association with the presence of cruise ships
13 Setton E, Poplawski K, Ma C. April 2013. Sulfur Dioxide Levels – 2012 James Bay, Victoria, British Columbia. University of Victoria Spatial Sciences Research Lab. Prepared for the British Columbia Ministry of Environment. 14 Setton E, Poplawski K. August 2012. Sulfur Dioxide Levels – 2012 James Bay, Victoria, British Columbia. University of Victoria Spatial Sciences Research Lab. Prepared for the British Columbia Ministry of Environment.
ANALYSIS OF SULFUR DIOXIDE LEVELS – JAMES BAY NEIGHBOURHOOD 2013
36 | P a g e
Figure 18. Percentiles of 10-minute average SO2 levels – Erie 2011 - 2013
SO2 levels measured at Erie Site (µg/m3)
Percentile 2011 2012 2013
minimum 0 1 1 1 <1 1 2 5 <1 1 2
10 <1 1 2 25 1 2 2 50 2 2 2 75 3 3 3 90 7 7 6 95 12 11 17 99 57 49 76
maximum 438 636 258
ANALYSIS OF SULFUR DIOXIDE LEVELS – JAMES BAY NEIGHBOURHOOD 2013
37 | P a g e
Figure 19. Percentiles of hourly average SO2 levels for hours with cruise ships – Erie and MAML
Percentiles
SO2 levels measured at Erie Site (µg/m3) during hours with cruise ships
Percentile MAML 2009 Erie 2011 Erie 2012 Erie 2013
minimum 0 <1 0 <1 1 <1 <1 0 <1 5 <1 <1 <1 <1
10 1 <1 <1 <1 25 2 1 1 <1 50 5 3 2 1 75 16 8 7 4 90 96 22 21 17 95 201 49 38 40 99 315 121 97 84
maximum 448 235 266 156
SO2 (
ug/m
3 )
ANALYSIS OF SULFUR DIOXIDE LEVELS – JAMES BAY NEIGHBOURHOOD 2013
38 | P a g e
Figure 20. Diurnal SO2 levels on days with cruise ships – Erie and MAML
Time of day
Figure 21. Diurnal SO2 levels on days without cruise ships – Erie and MAML
Time of day
SO2 (
ug/m
3 ) SO
2 (ug
/m3 )
ANALYSIS OF SULFUR DIOXIDE LEVELS – JAMES BAY NEIGHBOURHOOD 2013
39 | P a g e
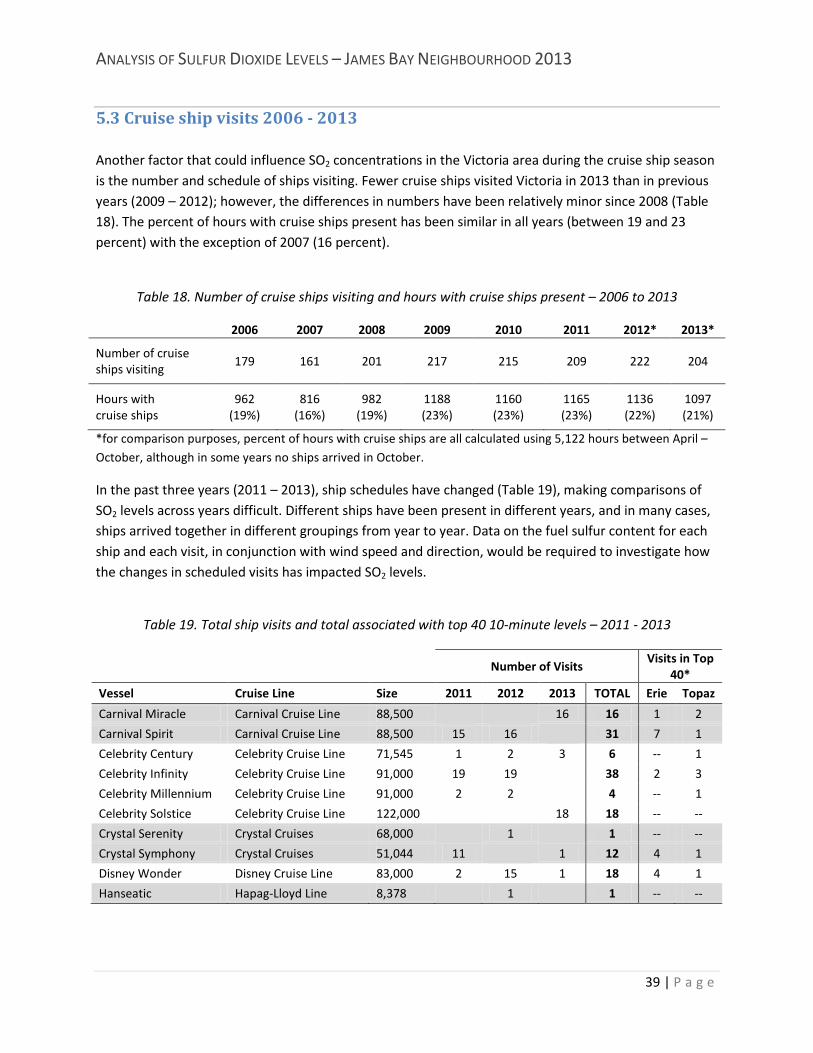
5.3 Cruise ship visits 2006 - 2013 Another factor that could influence SO2 concentrations in the Victoria area during the cruise ship season is the number and schedule of ships visiting. Fewer cruise ships visited Victoria in 2013 than in previous years (2009 – 2012); however, the differences in numbers have been relatively minor since 2008 (Table 18). The percent of hours with cruise ships present has been similar in all years (between 19 and 23 percent) with the exception of 2007 (16 percent).
Table 18. Number of cruise ships visiting and hours with cruise ships present – 2006 to 2013
2006 2007 2008 2009 2010 2011 2012* 2013*
Number of cruise ships visiting
179 161 201 217 215 209 222 204
Hours with cruise ships
962 (19%)
816 (16%)
982 (19%)
1188 (23%)
1160 (23%)
1165 (23%)
1136 (22%)
1097 (21%)
*for comparison purposes, percent of hours with cruise ships are all calculated using 5,122 hours between April – October, although in some years no ships arrived in October.
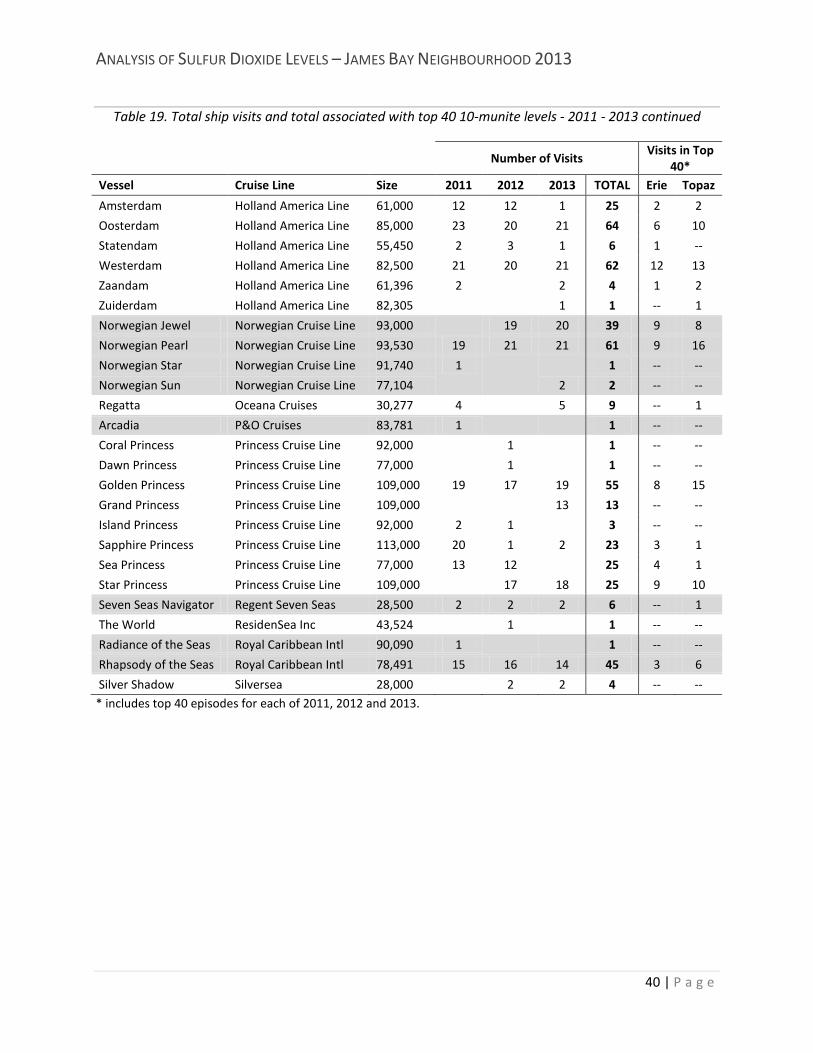
In the past three years (2011 – 2013), ship schedules have changed (Table 19), making comparisons of SO2 levels across years difficult. Different ships have been present in different years, and in many cases, ships arrived together in different groupings from year to year. Data on the fuel sulfur content for each ship and each visit, in conjunction with wind speed and direction, would be required to investigate how the changes in scheduled visits has impacted SO2 levels.
Table 19. Total ship visits and total associated with top 40 10-minute levels – 2011 - 2013
Number of Visits Visits in Top
40* Vessel Cruise Line Size 2011 2012 2013 TOTAL Erie Topaz
Carnival Miracle Carnival Cruise Line 88,500
16 16 1 2
Carnival Spirit Carnival Cruise Line 88,500 15 16
31 7 1
Celebrity Century Celebrity Cruise Line 71,545 1 2 3 6 -- 1
Celebrity Infinity Celebrity Cruise Line 91,000 19 19
38 2 3
Celebrity Millennium Celebrity Cruise Line 91,000 2 2
4 -- 1
Celebrity Solstice Celebrity Cruise Line 122,000
18 18 -- --
Crystal Serenity Crystal Cruises 68,000
1
1 -- --
Crystal Symphony Crystal Cruises 51,044 11
1 12 4 1
Disney Wonder Disney Cruise Line 83,000 2 15 1 18 4 1
Hanseatic Hapag-Lloyd Line 8,378
1
1 -- --
ANALYSIS OF SULFUR DIOXIDE LEVELS – JAMES BAY NEIGHBOURHOOD 2013
40 | P a g e
Table 19. Total ship visits and total associated with top 40 10-munite levels - 2011 - 2013 continued
Number of Visits Visits in Top
40* Vessel Cruise Line Size 2011 2012 2013 TOTAL Erie Topaz
Amsterdam Holland America Line 61,000 12 12 1 25 2 2
Oosterdam Holland America Line 85,000 23 20 21 64 6 10
Statendam Holland America Line 55,450 2 3 1 6 1 --
Westerdam Holland America Line 82,500 21 20 21 62 12 13
Zaandam Holland America Line 61,396 2
2 4 1 2
Zuiderdam Holland America Line 82,305
1 1 -- 1
Norwegian Jewel Norwegian Cruise Line 93,000
19 20 39 9 8
Norwegian Pearl Norwegian Cruise Line 93,530 19 21 21 61 9 16
Norwegian Star Norwegian Cruise Line 91,740 1
1 -- --
Norwegian Sun Norwegian Cruise Line 77,104
2 2 -- --
Regatta Oceana Cruises 30,277 4
5 9 -- 1
Arcadia P&O Cruises 83,781 1
1 -- --
Coral Princess Princess Cruise Line 92,000
1
1 -- --
Dawn Princess Princess Cruise Line 77,000
1
1 -- --
Golden Princess Princess Cruise Line 109,000 19 17 19 55 8 15
Grand Princess Princess Cruise Line 109,000
13 13 -- --
Island Princess Princess Cruise Line 92,000 2 1
3 -- --
Sapphire Princess Princess Cruise Line 113,000 20 1 2 23 3 1
Sea Princess Princess Cruise Line 77,000 13 12
25 4 1
Star Princess Princess Cruise Line 109,000
17 18 25 9 10
Seven Seas Navigator Regent Seven Seas 28,500 2 2 2 6 -- 1
The World ResidenSea Inc 43,524
1
1 -- --
Radiance of the Seas Royal Caribbean Intl 90,090 1
1 -- --
Rhapsody of the Seas Royal Caribbean Intl 78,491 15 16 14 45 3 6
Silver Shadow Silversea 28,000
2 2 4 -- -- * includes top 40 episodes for each of 2011, 2012 and 2013.
ANALYSIS OF SULFUR DIOXIDE LEVELS – JAMES BAY NEIGHBOURHOOD 2013
41 | P a g e
5.4 Comparison of measured levels pre- and post-ECA sulfur content reduction regulation
The regulated reduction in fuel sulfur content from 3.5 percent to 1 percent came into effect August 1st, 2012. The following analysis compares average SO2 levels for 8 months pre-ECA (May – Sept 2011 and May - July 2012) to levels for 7 months post-ECA (Aug – Sept 2012 and May – Sept 2013). In general:
• There were few measured levels exceeding existing air quality guidelines during the period of analysis pre-regulation (days or hours with cruise ships present between May 2011 and July
2012), and only one 24-hour average post-regulation was above the WHO guideline of 20 µg/m3 (Tables 22, 23 and 24).
• The distribution of 10-minute average levels on days with cruise ships was higher before regulation from the 75th percentile upward at Erie station in comparison to after regulation, while at Topaz station, distribution levels were similar up to 95th percentile, then lower post-ECA (Table 20). Post-regulation, the distribution of levels at Erie Station was still higher than at Topaz station from the 95th percentile upward (Figure 22).
• The distribution of 1-hour average levels during hours with cruise ships was higher before regulation from the 75th percentile upward at Erie station in comparison to after regulation. At Topaz station, distribution levels pre- and post-regulation were very similar, being slightly lower or the same up to the 90th percentile before regulation, then higher when compared to the post-regulation distribution levels (Table 21). Post-regulation, the distribution of levels at Erie Station was still higher than at Topaz station from the 90th percentile and upward (Figure 23).
• The distribution of 24-hour average levels at Erie Station was always higher before regulation in comparison to the distribution of levels post-regulation, with the exception of the minimum. At Topaz station, the distribution of levels pre- and post-regulation were essentially the same up to the 90th percentile, then slightly lower post-ECA (Table 21 and Figure 24).
• Wind speeds at Topaz were lower and there were more calm conditions post-regulation (Figures 25 and 26), and the magnitude of its effect is unknown. Changing ship schedules may also be an important factor.
• Previous analyses showed a discernible peak in nitrogen dioxide (NO2) levels at Topaz station associated with the presence of cruise ships during evening hours (6pm onward), indicating that both SO2 and NO2 are present in cruise ship emissions .15
15 James Bay Air Quality Study Team. 2008. James Bay Air Quality Study: Phase 1 Report on the Results of Field Monitoring in 2007. Prepared for the Vancouver Island Health Authority. Available at http://www.viha.ca/NR/rdonlyres/00DDB3AB-5BC6-4FE4-A826-79FB7629AE9A/0/JBAQS_PhaseI_Feb_8_08.pdf
Theoretically, if SO2 levels have
ANALYSIS OF SULFUR DIOXIDE LEVELS – JAMES BAY NEIGHBOURHOOD 2013
42 | P a g e
declined post-ECA while NO2 levels remain unaffected, the ratio between the two gases should change, regardless of meteorological conditions (NO2/SO2 would be larger post-ECA, since SO2 levels would be smaller). An analysis of the ratio NO2/SO2 was conducted using data most likely to represent elevated levels at Topaz station due to the influence of cruise ship emissions: only hours between 6pm and midnight with cruise ships present, and of these, only when SO2 levels were greater than 10
µg/m3 (the maximum recorded on non-cruise ship days in 2013). The results suggest that a decrease in SO2 levels that is not entirely due to different wind conditions has occurred post-ECA, as the ratio of NO2/SO2 is consistently larger post-ECA (Figure 27).
Additional comparisons of 1-hour average SO2 levels at Topaz station during hours with cruise ships for May, June and July of 2006 – 2013 (the longest span of comparable time periods) suggest:
• Other than the maximum, the distribution of 1-hour average levels was lower in 2011 than in 2013 from the 50th percentile upward (Figure 28). This indicates that the change in fuel sulfur content is not the only factor influencing measured levels at Topaz station.
• In 2011, Topaz station was less frequently downwind of the cruise ships compared to all other years (Figure 29); however, in 2008 Topaz station was only slight more frequently downwind but the distribution of -1hour average SO2 levels is among the highest on record from the 90th percentile upward. If amount of time downwind had a large influence on the levels of SO2 recorded, it would be expected that levels in 2008 would have been lower.
• For the period of analysis, wind speeds in 2013 were not dissimilar to other years, although there was a higher percentage of calm winds (< 2 m/s) than in any other year (Figure 30). However, if calms had a substantial influence on SO2 levels, it would be reasonable to expect lower levels in years with more calms – this is not the case. While both 2013 and 2011 had the highest levels of calms (31 and 27 percent respectively) and the lowest levels of SO2 in the upper percentiles, 2012 had the next lowest SO2 levels between the 75th and 99th percentiles, but also by far the lowest percentage of calm winds (14 percent) compared to any other year.
These limited analyses support the conclusion that the impacts of various meteorological conditions are complex and the magnitude of their effects is not clear. It would not be unreasonable, however, to conclude that meteorological factors alone are not the most significant factors influencing SO2 levels in the study area, but rather act in combination with fuel sulfur content, emission intensity while docking and at dock, and ship schedules.
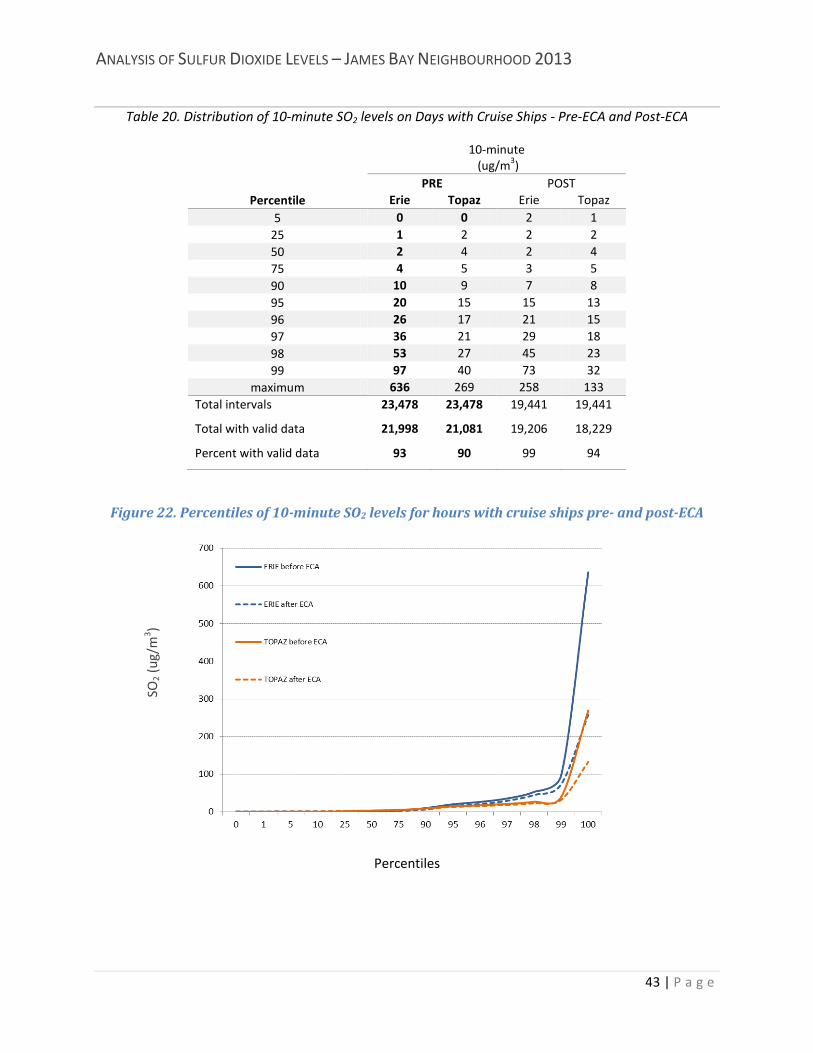
ANALYSIS OF SULFUR DIOXIDE LEVELS – JAMES BAY NEIGHBOURHOOD 2013
43 | P a g e
Table 20. Distribution of 10-minute SO2 levels on Days with Cruise Ships - Pre-ECA and Post-ECA
10-minute (ug/m3)
PRE POST Percentile Erie Topaz Erie Topaz
5 0 0 2 1 25 1 2 2 2 50 2 4 2 4 75 4 5 3 5 90 10 9 7 8 95 20 15 15 13 96 26 17 21 15 97 36 21 29 18 98 53 27 45 23 99 97 40 73 32
maximum 636 269 258 133 Total intervals 23,478 23,478 19,441 19,441
Total with valid data 21,998 21,081 19,206 18,229
Percent with valid data 93 90 99 94
Figure 22. Percentiles of 10-minute SO2 levels for hours with cruise ships pre- and post-ECA
Percentiles
SO2 (
ug/m
3 )
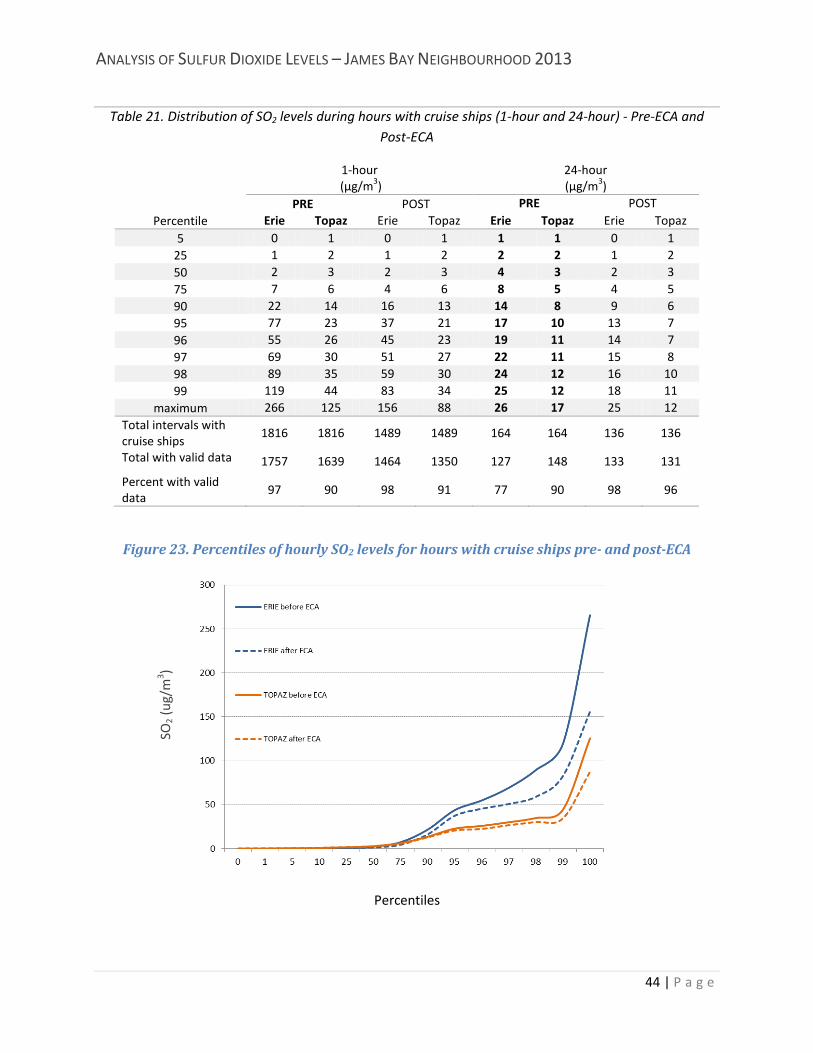
ANALYSIS OF SULFUR DIOXIDE LEVELS – JAMES BAY NEIGHBOURHOOD 2013
44 | P a g e
Table 21. Distribution of SO2 levels during hours with cruise ships (1-hour and 24-hour) - Pre-ECA and Post-ECA
1-hour
(µg/m3) 24-hour (µg/m3)
PRE POST PRE POST Percentile Erie Topaz Erie Topaz Erie Topaz Erie Topaz
5 0 1 0 1 1 1 0 1 25 1 2 1 2 2 2 1 2 50 2 3 2 3 4 3 2 3 75 7 6 4 6 8 5 4 5 90 22 14 16 13 14 8 9 6 95 77 23 37 21 17 10 13 7 96 55 26 45 23 19 11 14 7 97 69 30 51 27 22 11 15 8 98 89 35 59 30 24 12 16 10 99 119 44 83 34 25 12 18 11
maximum 266 125 156 88 26 17 25 12 Total intervals with cruise ships
1816 1816 1489 1489 164 164 136 136
Total with valid data 1757 1639 1464 1350 127 148 133 131
Percent with valid data
97 90 98 91 77 90 98 96
Figure 23. Percentiles of hourly SO2 levels for hours with cruise ships pre- and post-ECA
Percentiles
SO2 (
ug/m
3 )
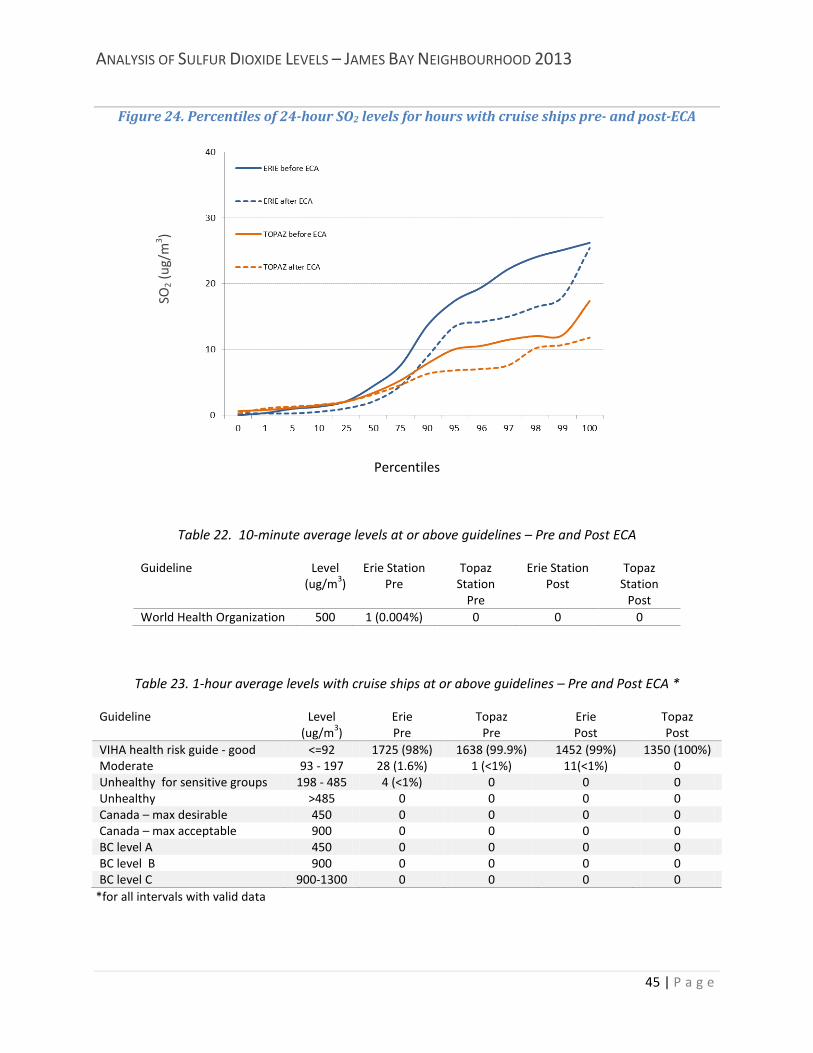
ANALYSIS OF SULFUR DIOXIDE LEVELS – JAMES BAY NEIGHBOURHOOD 2013
45 | P a g e
Figure 24. Percentiles of 24-hour SO2 levels for hours with cruise ships pre- and post-ECA
Percentiles
Table 22. 10-minute average levels at or above guidelines – Pre and Post ECA
Guideline Level (ug/m3)
Erie Station Pre
Topaz Station
Pre
Erie Station Post
Topaz Station
Post World Health Organization 500 1 (0.004%) 0 0 0
Table 23. 1-hour average levels with cruise ships at or above guidelines – Pre and Post ECA *
Guideline Level (ug/m3)
Erie Pre
Topaz Pre
Erie Post
Topaz Post
VIHA health risk guide - good <=92 1725 (98%) 1638 (99.9%) 1452 (99%) 1350 (100%) Moderate 93 - 197 28 (1.6%) 1 (<1%) 11(<1%) 0 Unhealthy for sensitive groups 198 - 485 4 (<1%) 0 0 0 Unhealthy >485 0 0 0 0 Canada – max desirable 450 0 0 0 0 Canada – max acceptable 900 0 0 0 0 BC level A 450 0 0 0 0 BC level B 900 0 0 0 0 BC level C 900-1300 0 0 0 0
*for all intervals with valid data
SO2 (
ug/m
3 )
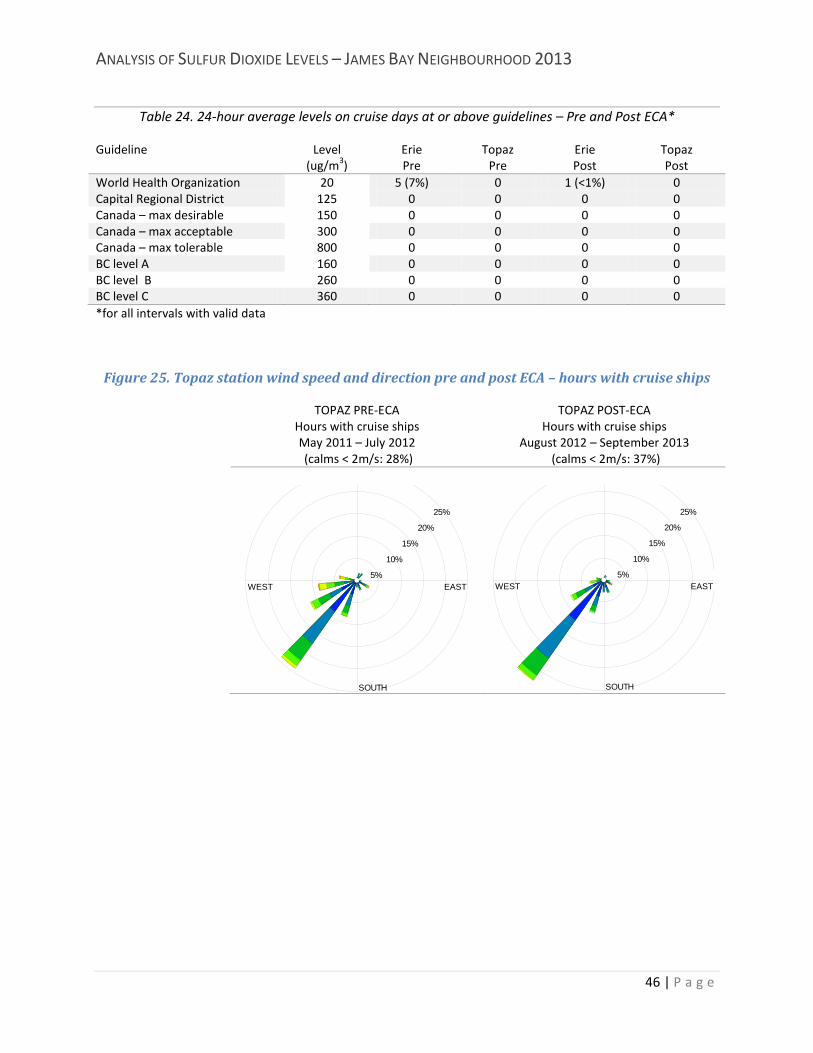
ANALYSIS OF SULFUR DIOXIDE LEVELS – JAMES BAY NEIGHBOURHOOD 2013
46 | P a g e
Table 24. 24-hour average levels on cruise days at or above guidelines – Pre and Post ECA*
Guideline Level (ug/m3)
Erie Pre
Topaz Pre
Erie Post
Topaz Post
World Health Organization 20 5 (7%) 0 1 (<1%) 0 Capital Regional District 125 0 0 0 0 Canada – max desirable 150 0 0 0 0 Canada – max acceptable 300 0 0 0 0 Canada – max tolerable 800 0 0 0 0 BC level A 160 0 0 0 0 BC level B 260 0 0 0 0 BC level C 360 0 0 0 0 *for all intervals with valid data
Figure 25. Topaz station wind speed and direction pre and post ECA – hours with cruise ships
TOPAZ PRE-ECA Hours with cruise ships May 2011 – July 2012 (calms < 2m/s: 28%)
TOPAZ POST-ECA Hours with cruise ships
August 2012 – September 2013 (calms < 2m/s: 37%)
SOUTH
WEST EAST5%
10%
15%
20%
25%
SOUTH
WEST EAST5%
10%
15%
20%
25%
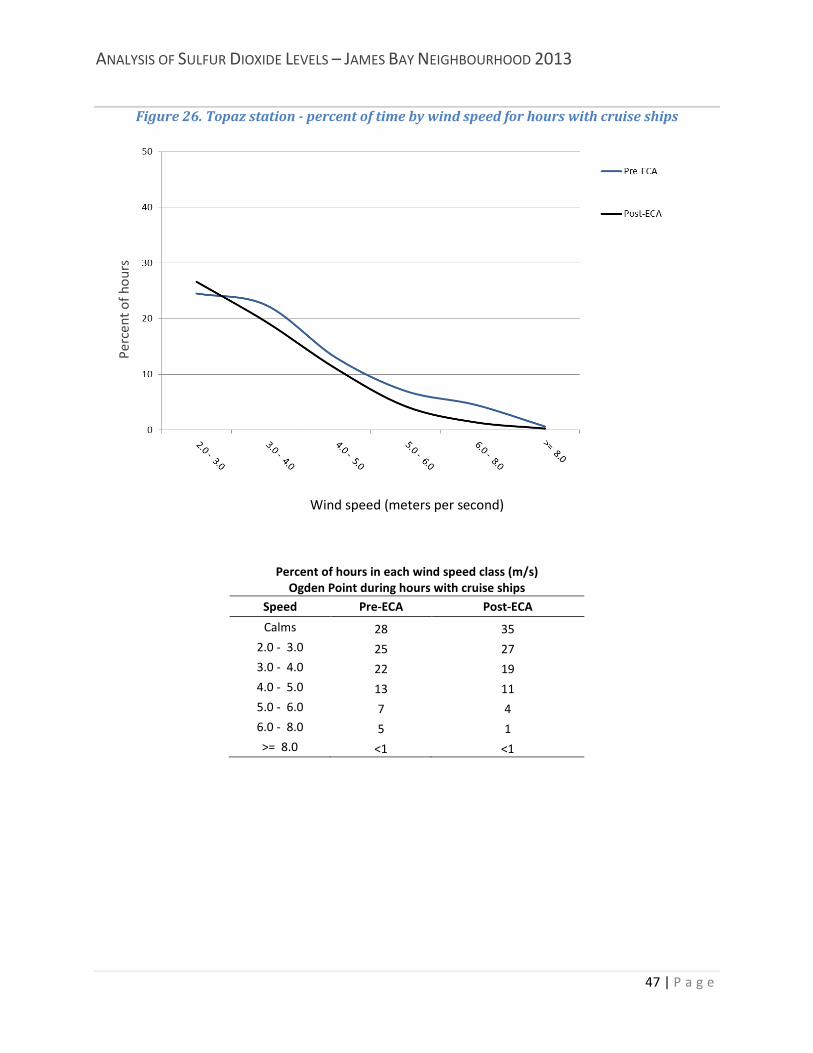
ANALYSIS OF SULFUR DIOXIDE LEVELS – JAMES BAY NEIGHBOURHOOD 2013
47 | P a g e
Figure 26. Topaz station - percent of time by wind speed for hours with cruise ships
Wind speed (meters per second)
Percent of hours in each wind speed class (m/s) Ogden Point during hours with cruise ships
Speed Pre-ECA Post-ECA
Calms 28 35 2.0 - 3.0 25 27 3.0 - 4.0 22 19 4.0 - 5.0 13 11 5.0 - 6.0 7 4 6.0 - 8.0 5 1 >= 8.0 <1 <1
Perc
ent o
f hou
rs
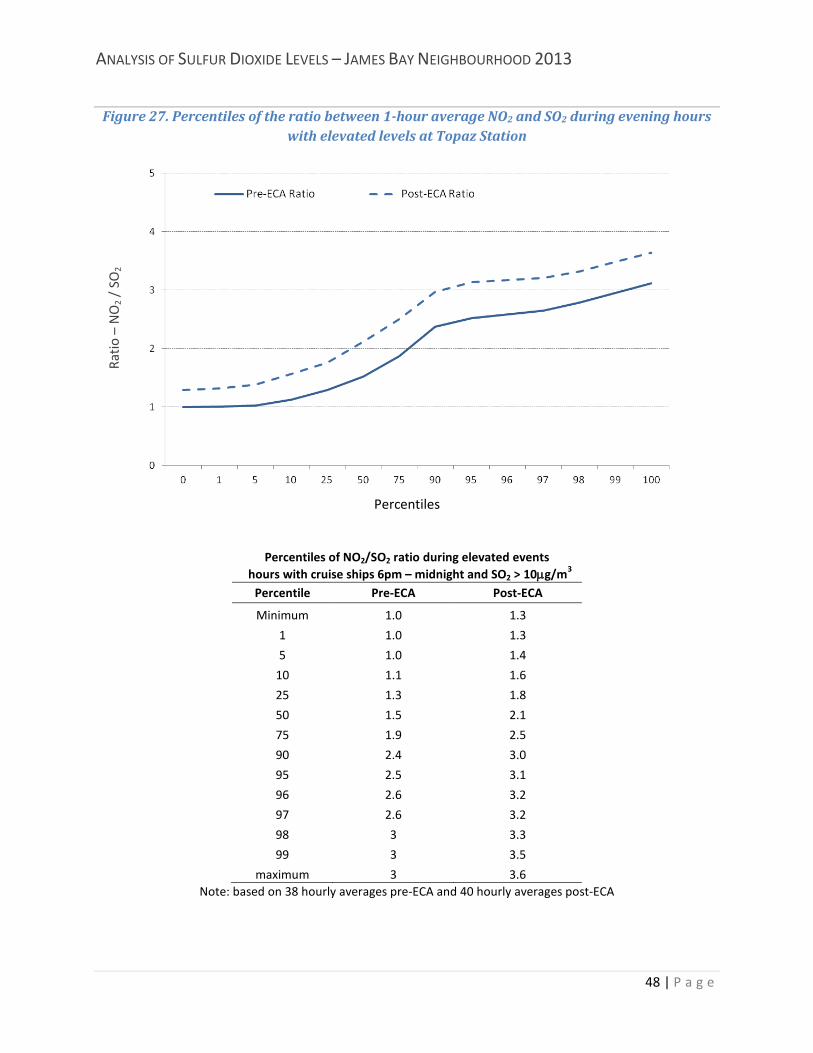
ANALYSIS OF SULFUR DIOXIDE LEVELS – JAMES BAY NEIGHBOURHOOD 2013
48 | P a g e
Figure 27. Percentiles of the ratio between 1-hour average NO2 and SO2 during evening hours with elevated levels at Topaz Station
Percentiles
Percentiles of NO2/SO2 ratio during elevated events hours with cruise ships 6pm – midnight and SO2 > 10µg/m3
Percentile Pre-ECA Post-ECA
Minimum 1.0 1.3
1 1.0 1.3
5 1.0 1.4
10 1.1 1.6
25 1.3 1.8
50 1.5 2.1
75 1.9 2.5
90 2.4 3.0
95 2.5 3.1
96 2.6 3.2
97 2.6 3.2
98 3 3.3
99 3 3.5
maximum 3 3.6 Note: based on 38 hourly averages pre-ECA and 40 hourly averages post-ECA
Ratio
– N
O2 /
SO
2
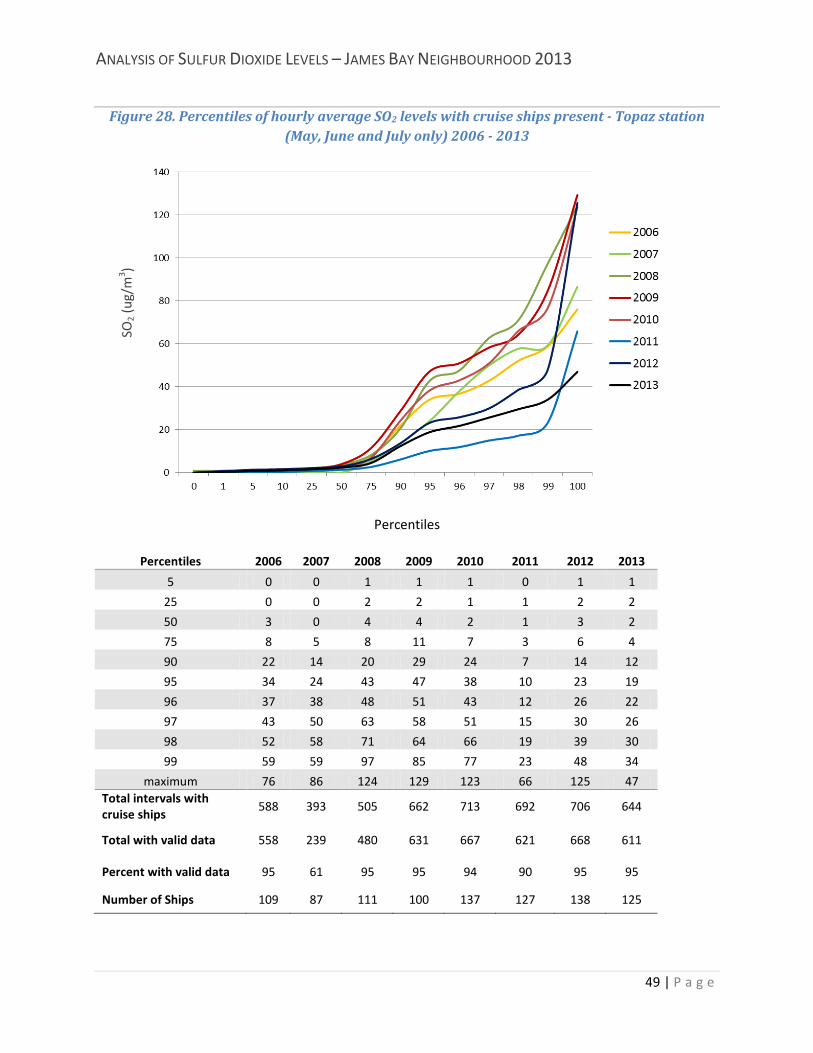
ANALYSIS OF SULFUR DIOXIDE LEVELS – JAMES BAY NEIGHBOURHOOD 2013
49 | P a g e
Figure 28. Percentiles of hourly average SO2 levels with cruise ships present - Topaz station (May, June and July only) 2006 - 2013
Percentiles
Percentiles 2006 2007 2008 2009 2010 2011 2012 2013
5 0 0 1 1 1 0 1 1
25 0 0 2 2 1 1 2 2
50 3 0 4 4 2 1 3 2
75 8 5 8 11 7 3 6 4
90 22 14 20 29 24 7 14 12
95 34 24 43 47 38 10 23 19
96 37 38 48 51 43 12 26 22
97 43 50 63 58 51 15 30 26
98 52 58 71 64 66 19 39 30
99 59 59 97 85 77 23 48 34
maximum 76 86 124 129 123 66 125 47 Total intervals with cruise ships
588 393 505 662 713 692 706 644
Total with valid data 558 239 480 631 667 621 668 611
Percent with valid data 95 61 95 95 94 90 95 95
Number of Ships 109 87 111 100 137 127 138 125
SO2 (
ug/m
3 )
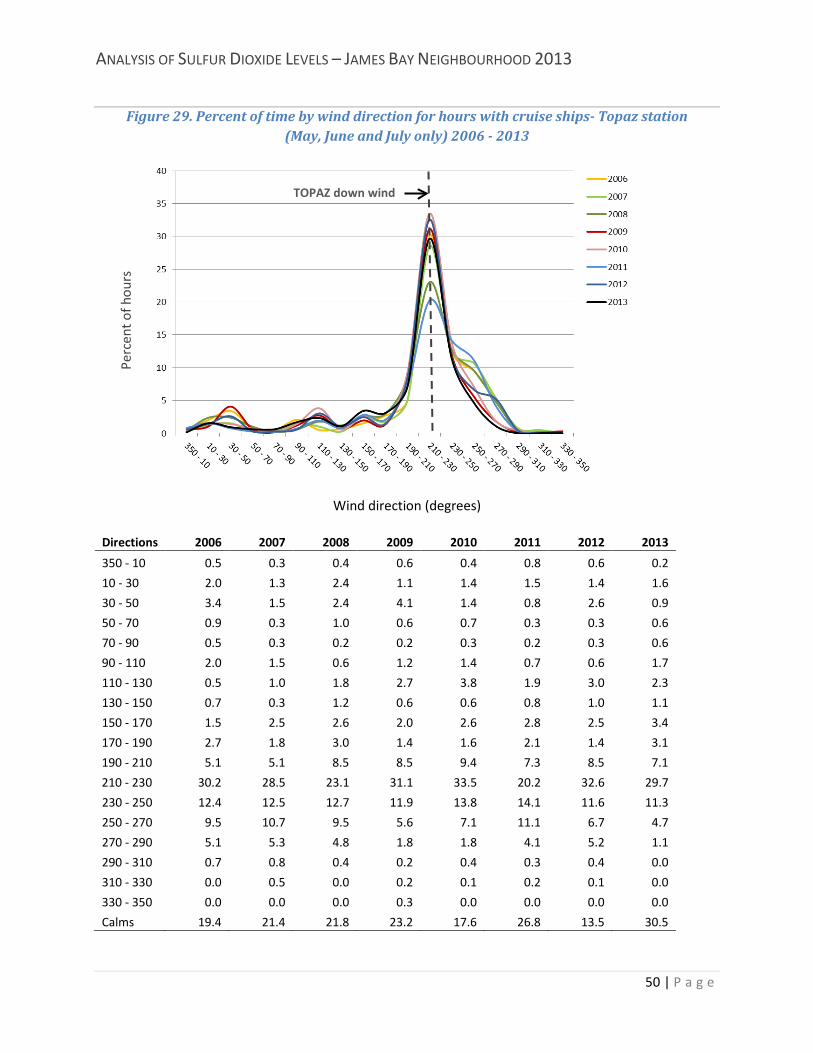
ANALYSIS OF SULFUR DIOXIDE LEVELS – JAMES BAY NEIGHBOURHOOD 2013
50 | P a g e
Figure 29. Percent of time by wind direction for hours with cruise ships- Topaz station (May, June and July only) 2006 - 2013
Wind direction (degrees)
Directions 2006 2007 2008 2009 2010 2011 2012 2013
350 - 10 0.5 0.3 0.4 0.6 0.4 0.8 0.6 0.2
10 - 30 2.0 1.3 2.4 1.1 1.4 1.5 1.4 1.6
30 - 50 3.4 1.5 2.4 4.1 1.4 0.8 2.6 0.9
50 - 70 0.9 0.3 1.0 0.6 0.7 0.3 0.3 0.6
70 - 90 0.5 0.3 0.2 0.2 0.3 0.2 0.3 0.6
90 - 110 2.0 1.5 0.6 1.2 1.4 0.7 0.6 1.7
110 - 130 0.5 1.0 1.8 2.7 3.8 1.9 3.0 2.3
130 - 150 0.7 0.3 1.2 0.6 0.6 0.8 1.0 1.1
150 - 170 1.5 2.5 2.6 2.0 2.6 2.8 2.5 3.4
170 - 190 2.7 1.8 3.0 1.4 1.6 2.1 1.4 3.1
190 - 210 5.1 5.1 8.5 8.5 9.4 7.3 8.5 7.1
210 - 230 30.2 28.5 23.1 31.1 33.5 20.2 32.6 29.7
230 - 250 12.4 12.5 12.7 11.9 13.8 14.1 11.6 11.3
250 - 270 9.5 10.7 9.5 5.6 7.1 11.1 6.7 4.7
270 - 290 5.1 5.3 4.8 1.8 1.8 4.1 5.2 1.1
290 - 310 0.7 0.8 0.4 0.2 0.4 0.3 0.4 0.0
310 - 330 0.0 0.5 0.0 0.2 0.1 0.2 0.1 0.0
330 - 350 0.0 0.0 0.0 0.3 0.0 0.0 0.0 0.0
Calms 19.4 21.4 21.8 23.2 17.6 26.8 13.5 30.5
Perc
ent o
f hou
rs
TOPAZ down wind
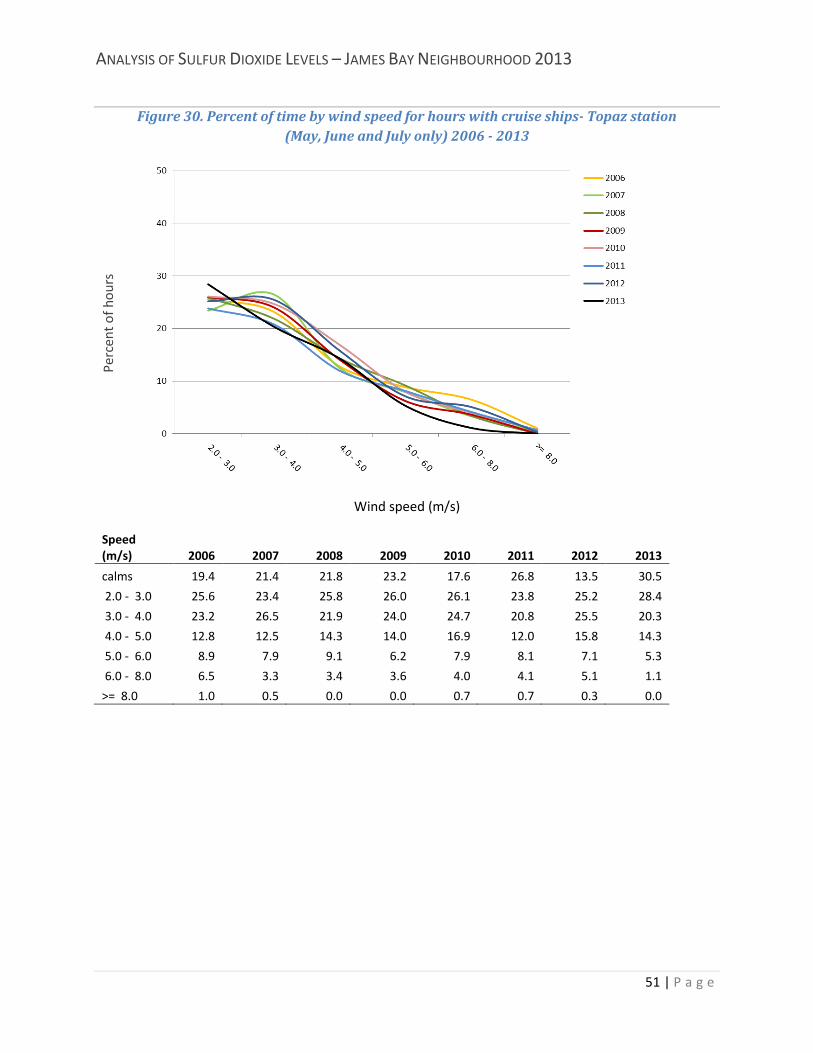
ANALYSIS OF SULFUR DIOXIDE LEVELS – JAMES BAY NEIGHBOURHOOD 2013
51 | P a g e
Figure 30. Percent of time by wind speed for hours with cruise ships- Topaz station (May, June and July only) 2006 - 2013
Wind speed (m/s)
Speed (m/s) 2006 2007 2008 2009 2010 2011 2012 2013
calms 19.4 21.4 21.8 23.2 17.6 26.8 13.5 30.5
2.0 - 3.0 25.6 23.4 25.8 26.0 26.1 23.8 25.2 28.4
3.0 - 4.0 23.2 26.5 21.9 24.0 24.7 20.8 25.5 20.3
4.0 - 5.0 12.8 12.5 14.3 14.0 16.9 12.0 15.8 14.3
5.0 - 6.0 8.9 7.9 9.1 6.2 7.9 8.1 7.1 5.3
6.0 - 8.0 6.5 3.3 3.4 3.6 4.0 4.1 5.1 1.1
>= 8.0 1.0 0.5 0.0 0.0 0.7 0.7 0.3 0.0
Perc
ent o
f hou
rs
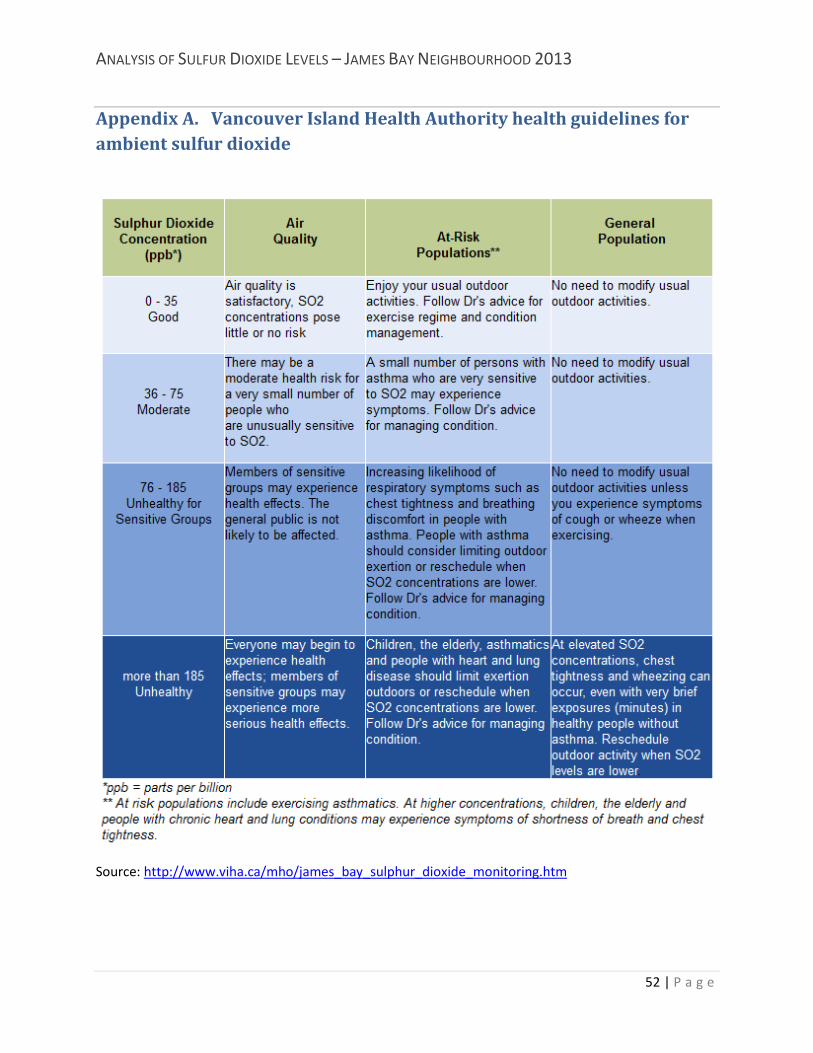
ANALYSIS OF SULFUR DIOXIDE LEVELS – JAMES BAY NEIGHBOURHOOD 2013
52 | P a g e
Appendix A. Vancouver Island Health Authority health guidelines for ambient sulfur dioxide
Source: http://www.viha.ca/mho/james_bay_sulphur_dioxide_monitoring.htm
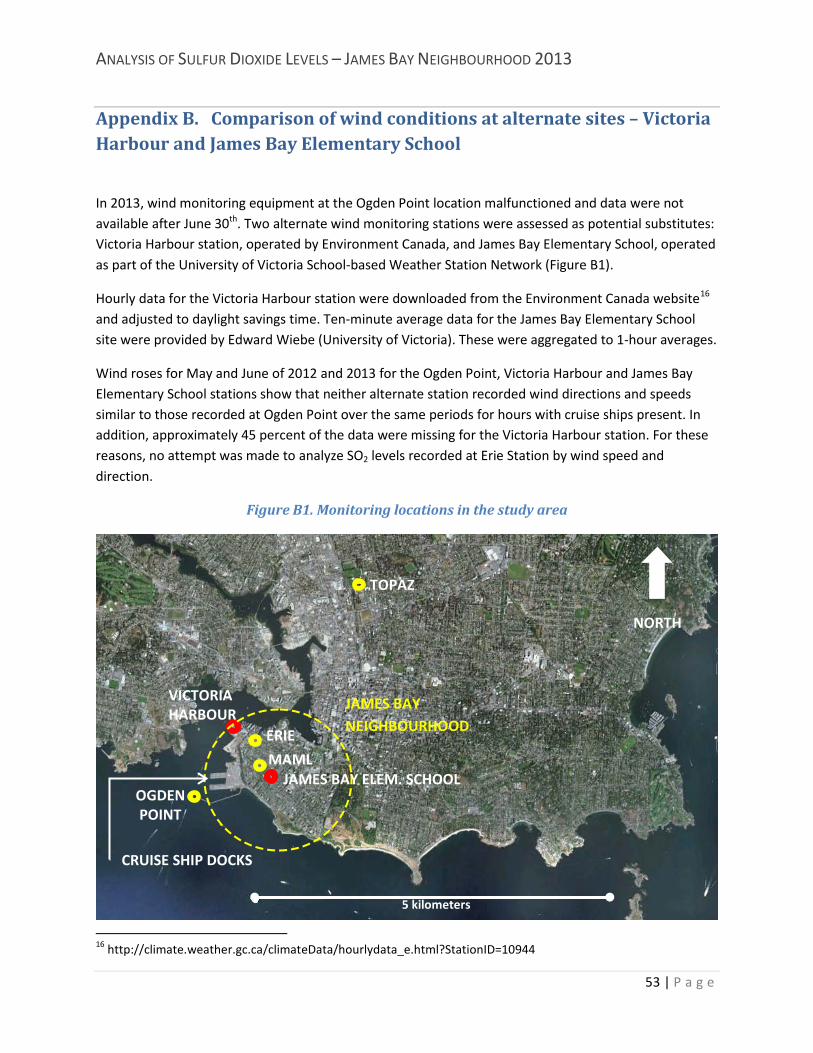
ANALYSIS OF SULFUR DIOXIDE LEVELS – JAMES BAY NEIGHBOURHOOD 2013
53 | P a g e
Appendix B. Comparison of wind conditions at alternate sites – Victoria Harbour and James Bay Elementary School
In 2013, wind monitoring equipment at the Ogden Point location malfunctioned and data were not available after June 30th. Two alternate wind monitoring stations were assessed as potential substitutes: Victoria Harbour station, operated by Environment Canada, and James Bay Elementary School, operated as part of the University of Victoria School-based Weather Station Network (Figure B1).
Hourly data for the Victoria Harbour station were downloaded from the Environment Canada website16
Wind roses for May and June of 2012 and 2013 for the Ogden Point, Victoria Harbour and James Bay Elementary School stations show that neither alternate station recorded wind directions and speeds similar to those recorded at Ogden Point over the same periods for hours with cruise ships present. In addition, approximately 45 percent of the data were missing for the Victoria Harbour station. For these reasons, no attempt was made to analyze SO2 levels recorded at Erie Station by wind speed and direction.
and adjusted to daylight savings time. Ten-minute average data for the James Bay Elementary School site were provided by Edward Wiebe (University of Victoria). These were aggregated to 1-hour averages.
Figure B1. Monitoring locations in the study area
16 http://climate.weather.gc.ca/climateData/hourlydata_e.html?StationID=10944
VICTORIA HARBOUR
JAMES BAY ELEM. SCHOOL
TOPAZ
CRUISE SHIP DOCKS
OGDEN POINT
ERIE
JAMES BAY NEIGHBOURHOOD
NORTH
5 kilometers
MAML
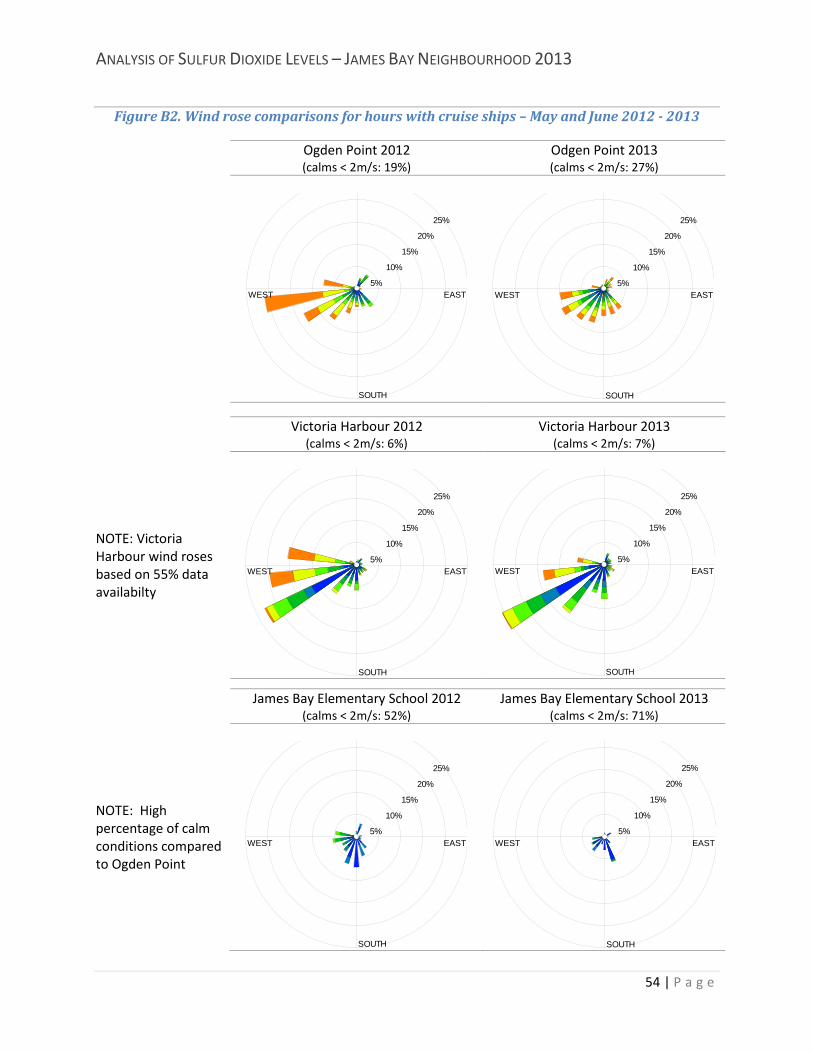
ANALYSIS OF SULFUR DIOXIDE LEVELS – JAMES BAY NEIGHBOURHOOD 2013
54 | P a g e
Figure B2. Wind rose comparisons for hours with cruise ships – May and June 2012 - 2013
Ogden Point 2012 (calms < 2m/s: 19%)
Odgen Point 2013 (calms < 2m/s: 27%)
Victoria Harbour 2012 (calms < 2m/s: 6%)
Victoria Harbour 2013 (calms < 2m/s: 7%)
NOTE: Victoria Harbour wind roses based on 55% data availabilty
James Bay Elementary School 2012 (calms < 2m/s: 52%)
James Bay Elementary School 2013 (calms < 2m/s: 71%)
NOTE: High percentage of calm conditions compared to Ogden Point
SOUTH
WEST EAST5%
10%
15%
20%
25%
SOUTH
WEST EAST5%
10%
15%
20%
25%
SOUTH
WEST EAST5%
10%
15%
20%
25%
SOUTH
WEST EAST5%
10%
15%
20%
25%
SOUTH
WEST EAST5%
10%
15%
20%
25%
SOUTH
WEST EAST5%
10%
15%
20%
25%
ANALYSIS OF SULFUR DIOXIDE LEVELS – JAMES BAY NEIGHBOURHOOD 2013
55 | P a g e


![Chapter_07a[Sulfur Dioxide Removal]](https://img.pdfslide.net/doc/110x75/544ab51ab1af9f7c4f8b4aff/chapter07asulfur-dioxide-removal.jpg)